managing driver fatigue: quantifying real world ... · managing driver fatigue: quantifying real...
TRANSCRIPT
ATSB RESEARCH AND ANALYSIS REPORT
Road Safety Research Grant – 2006/01 Final Report
Managing Driver Fatigue: Quantifying real world performance impairment
\
Dr Stuart D Baulk
Ms Sarah Biggs Dr Cameron van den Heuvel
Dr Kathryn Reid Prof. Drew Dawson
Centre for Sleep Research
University of South Australia
October 2006

ATSB RESEARCH AND ANALYSIS REPORT
ROAD SAFETY RESEARCH GRANT – 2006/01
Managing Driver Fatigue: Quantifying real world performance impairment
Dr Stuart D Baulk
Ms Sarah Biggs Dr Cameron van den Heuvel
Dr Kathryn Reid Prof. Drew Dawson
Centre for Sleep Research
University of South Australia
October 2006


- i -

- ii -
Published by: Australian Transport Safety Bureau Postal address: PO Box 967, Civic Square ACT 2608 Office location: 15 Mort Street, Canberra City, Australian Capital Territory Telephone: 1800 621 372; from overseas + 61 2 6274 6590 Facsimile: 02 6274 6474; from overseas + 61 2 6274 6474 E-mail: [email protected] Internet: www.atsb.gov.au
© University of South Australia 2006
To encourage the dissemination of this publication, it may be copied, downloaded, displayed, printed, reproduced, and distributed in unaltered form (retaining this notice). Subject to the provisions of the Copyright Act 1968, no other use of the material in this publication may be made without the authorisation of the University of South Australia.

- iii -
DOCUMENT RETRIEVAL INFORMATION Report No. GR 2006/01
Publication date October 2006
No. of pages 42
ISBN 0 642 25551 2
Publication title Managing Driver Fatigue: Quantifying real world performance impairment
Author(s) Baulk, S. D., Biggs, S., van den Heuvel, C., Reid, K., Dawson, D.
Organisation that prepared this document Centre for Sleep Research University of South Australia Level 7, Playford Building, University of South Australia, Frome Road Adelaide SA 5000
Sponsor [Available from] Australian Transport Safety Bureau PO Box 967, Civic Square ACT 2608 Australia www.atsb.gov.au
Project Officer John Collis
Abstract Driver fatigue remains a major cause of road accidents worldwide. Research has demonstrated that fatigue is comparable to alcohol in terms of performance impairment and risks to road safety.
It has been well established that increased wakefulness causes driving impairment, both in simulated and on-road driving. Fatigue management systems have used simple performance tests (such as visual reaction time), in an attempt to quantify the risk of impairment to performance in the real world. Little is known however, about the relationship between such measures.
The primary objectives of this study were: (1) To measure the decrements in performance caused by increasing levels of fatigue using a simple test of visual reaction time (PVT) and an interactive driving simulation task; and (2) To provide a link between simple and complex measures of performance. Secondary aims were: (a) examine the effects of fatigue on perception of performance; and (b) examine the effects of gender on fatigue, driving performance and perception thereof.
Fifteen subjects (7 male, 8 female) aged 22-56 years (mean 33.6y), underwent 26 hours of supervised wakefulness (i.e. one night without sleep) before an 8 hour recovery sleep opportunity. During this time, subjects were present in the laboratory, and tested using (a) a 30-minute interactive driving simulation test, bracketed before and after by (b) a 10-minute standard PVT reaction time test. Testing periods were repeated throughout the protocol (at approx. 3, 8, 18 and 24 hours of wakefulness, and after the 8-hour recovery sleep).
Extended wakefulness caused significant decrements in PVT and driving performance, as well as subjective sleepiness and perceptions of performance. While subjective measures normalised following recovery sleep, objective performance measures did not. Results suggest that although objective measures of both simple and complex performance are clearly linked, driving simulation cannot be replaced by a simple reaction time test. Gender differences were found in PVT performance and perceptions of driving ability, with females responding more slowly, and rating their driving as worse than males. Further research is needed to examine links between objective performance measures and to move closer to accurate assessments of fitness to drive. A cognitive-behavioural approach to driver fatigue countermeasures may be beneficial.
Keywords Driving, Fatigue Management, Fitness to Drive, Performance
Notes (1) ATSB grant reports are disseminated in the interest of information exchange. (2) The views expressed are those of the author(s) and do not necessarily represent those of the
Australian Government or the ATSB.
- iv -
CONTENTS
Executive summary ................................................................................................................................1
Acknowledgements .................................................................................................................................3
Abbreviations ..........................................................................................................................................4
1 Introduction.....................................................................................................................................5 1.1 Driver Fatigue......................................................................................................................5 1.2 Measuring and Managing Fatigue......................................................................................6 1.3 Awareness and Perception..................................................................................................6 1.4 Gender..................................................................................................................................7
2 Method..............................................................................................................................................9 2.1 Study Objectives..................................................................................................................9 2.2 Methodology........................................................................................................................9
2.2.1 Changes to methodologies ...............................................................................9 2.2.2 Study Design...................................................................................................10 2.2.3 Participants......................................................................................................10 2.2.4 Measures .........................................................................................................10 2.2.5 Experimental Procedure .................................................................................12 2.2.6 Data Processing ..............................................................................................13 2.2.7 Statistical Analyses.........................................................................................13
3 Results ............................................................................................................................................15 3.1 Driving Simulation Data ...................................................................................................15 3.2 PVT Reaction Time Data..................................................................................................17 3.3 Links between Driving and PVT Measures.....................................................................19 3.4 Subjective Sleepiness ........................................................................................................21 3.5 Likelihood of Falling Asleep............................................................................................21 3.6 Perception of Driving Performance .................................................................................22 3.7 Gender Differences ...........................................................................................................23
4 Discussion.......................................................................................................................................26 4.1 Findings Relative to Study Objectives.............................................................................26
4.1.1 To measure the decrements in performance caused by increasing levels of fatigue using a simple test of visual reaction time (PVT) and an interactive driving simulation task ...........................................................26
4.1.2 To provide a link between simple and complex measures of performance, thus improving the potential success of fatigue management systems......................................................................................26
- v -
4.1.3 To examine the effects of fatigue on perception of performance................27 4.1.4 To examine the effects of gender on fatigue, driving performance and
perception thereof...........................................................................................27 4.1.5 Recovery Following Sleep Deprivation........................................................28
4.2 Study Limitations ..............................................................................................................28
5 Conclusions ....................................................................................................................................29 5.1 Further Work & Recommendations .................................................................................29 5.2 Planned Research Outputs ................................................................................................29
6 References ......................................................................................................................................31
Appendix A General Health Questionnaire (GHQ).......................................................................34
Appendix B: Sleep Diary (including Samn-Perelli Fatigue Scale) ................................................37


- 1 -
EXECUTIVE SUMMARY
Despite extensive research and saturating public education campaigns, driver fatigue remains a major cause of road accidents worldwide. While other road safety issues such as speed and alcohol are increasingly managed with effective and accurate technologies, there are currently no effective comparable on-road measures of driver fatigue. As a result, driver fatigue has become proportionately more of a problem, and the human misery and significant economic costs caused by death and injury continue to increase as a result of these accidents. Research from our group and others has demonstrated that fatigue and alcohol are comparable both in terms of risks to road safety and of performance impairment in general. However, with no effective technologies with which to measure fatigue in the same way, establishing a simple, on-road measure of fatigue, as an additional fitness-to-drive tool, is a worthwhile goal in order to improve public health.
In the last ten years, it has been well established that increased wakefulness leads to increased driving impairment, both in simulated and on-road driving. Similarly, fatigue management systems have used simple performance tests (such as visual reaction time), in an attempt to quantify the risk of impairment to performance in the real world. Little is known however, about the relationship between such measures.
In addition, few studies in this area have directly examined the ability to recognise sleepiness, or appreciate the resulting impairment to performance. These elements are vital to investigate, given that the perception of ability is a primary influence on decisions to stop or continue driving. This is critical knowledge for the success of future educational campaigns in this area. While males are more likely to be involved in fatigue-related accidents, and more likely to underestimate risk and overestimate their driving skill, few studies have directly examined gender differences when considering the effects of fatigue on driving performance, perception of impairment and attitudes to risk-taking.
This report outlines the results of our study, which investigated these issues in a controlled laboratory protocol using extended wakefulness. The study aimed to equate impairment to performance using simple reaction time as well as driving simulation tests, and to explore the issues of drivers' self-perception of performance, and gender differences in order to provide new knowledge in this area. The study was funded by an Australian Transport Safety Bureau Road Safety Research grant in 2004-2005.
Fifteen subjects (7 male, 8 female) aged 22-56 years (mean 33.6 years), underwent 26 hours of supervised wakefulness (i.e. one night without sleep) before an 8 hour recovery sleep opportunity. During this time, subjects were present in the laboratory, and tested using (a) a 30-minute interactive driving simulation test, bracketed before and after by (b) a 10-minute standard PVT reaction time test. These 50-minute testing periods were repeated (in addition to an initial training session) 5 times throughout the protocol (at approximately 3, 8, 18 and 24 hours of wakefulness, as well as after the 8-hour recovery sleep). The primary objectives of the study were: (1) To measure the decrements in performance caused by increasing levels of fatigue using a simple test of visual reaction time (PVT) and an interactive driving simulation task; (2) To provide a link between simple and complex measures of performance, thus improving the potential success of fatigue management systems. In addition, we aimed to: (a) examine the effects of fatigue on perception of performance; and (b) examine the effects of gender on fatigue, driving performance and perception thereof.
As expected, extended wakefulness caused significant decrements in PVT and driving performance, as well as subjective sleepiness and perceptions of performance. While subjective measures normalised following an 8-hour recovery sleep opportunity, objective performance measures did
- 2 -
not. New information provided by our results suggest that although objective measures of both simple and complex performance are clearly linked, and may correlate, driving simulation cannot be replaced by a simple PVT reaction time test. Gender differences were found in PVT performance and perceptions of driving ability, with females responding more slowly, and rating their driving as worse than males. No differences were found in other measures. Perceptions of driving ability in general were affected by asking drivers to think differently about the consequences of driving impairment (i.e. to consider sleepiness externally).
Further research is needed with larger datasets to more closely examine links between objective performance measures and to move closer towards accurate assessments of fitness to drive. It is vitally important to examine the psychological aspects of driving impairment, and to encourage drivers to self-rate themselves in terms of sleepiness as well as impairment. Our data also suggest that a cognitive-behavioural approach to driver fatigue countermeasures may be beneficial.

- 3 -
ACKNOWLEDGEMENTS
The authors wish to thank Alison Bagnall for help with planning and organisation of the study and recruiting subjects. We would also like to thank Ryan Higgins, James Swift, Sophie Walenczykiewicz and Dayna Griffin for help with data collection and the running of the study. We thank Michael Gratton for help with data processing and software programming, and Martin York for assistance with the York Driving Simulation Program ("DriveSim"). We would also like to thank Dr. Jill Dorrian and Katie Kandelaars for advice on data analysis.

- 4 -
ABBREVIATIONS
ANOVA Analysis of Variance
ATSB Australian Transport Safety Bureau
BMI Body Mass Index
EEG Electroencephalography
ESS Epworth Sleepiness Scale
GHQ General Health Questionnaire
Hr Hours
Hz Hertz
KSS Karolinska Sleepiness Scale
M Mean
Min Minutes
Ms Milliseconds
PC Personal Computer
PVT Psychomotor Vigilance Task
RT Reaction Time
1/RT Reciprocal Reaction Time
SD Standard Deviation
Sec Seconds
- 5 -
1 INTRODUCTION
1.1 Driver Fatigue Despite extensive research and saturating public education campaigns, driver fatigue remains a major cause of road accidents worldwide 1,2, accounting for approximately 20% of all accidents1. It is generally accepted that this Figure underestimates the problem due to accident characteristics, methods of investigation, and the potential for fatigue to be masked by other causes such as alcohol intoxication. Most of these accidents are serious or fatal due to the high impact speed, and lack of avoidance manoeuvres taken by the inattentive driver. Australian statistics state that there were 251 fatalities caused explicitly by sleep related accidents (16.6% of total road deaths) in Australia in 1998 alone2. It is also important to note that, while other road safety issues such as speed and alcohol are increasingly managed with effective and accurate technologies, there are currently no effective comparable on-road measures of driver fatigue. As a result, driver fatigue has become proportionately more of a problem2 (from 1990-1998, the proportion of fatal crashes involving driver fatigue fluctuated between 14.9 and 18.0 per cent2). Aside from the human misery caused by death and injury as a result of these accidents, there are significant additional economic costs to be met by governments, industry, health authorities and individuals. Thus, establishing a simple, on-road measure of fatigue, as an additional fitness-to-drive tool, is an important issue for public health, particularly as many fatigue related accidents are preventable.
In the last ten years, it has been well established that increased wakefulness leads to increased driving impairment, as measured by both simulated 3-4 and on-road 5 driving studies. For example, a recent study using the York Driving Simulator (YDS), a PC-based interactive driving simulator, demonstrated that lane drift, tracking variability, speed deviation, and off-road incidents significantly increased with extended wakefulness3. Moreover, research using a high-fidelity, fully interactive driving simulator found that after 60 hours of sleep deprivation, accidents rose from zero to 8 during a 40 minute drive and variance in lane position significantly increased from .05% to 45%4. Similarly, Philip et al.5 found that sleep restriction significantly increased the risk of inappropriate line crossings by 8.1 times in an on-road study conducted on an open French highway.
In regards to risks to road safety, and of impairment of performance in general, research has demonstrated parallels between fatigue, and alcohol intoxication6-8. For example, Dawson and Reid6 demonstrated that 17 hours of sustained wakefulness produced performance impairment on some tasks similar to that experienced with a blood-alcohol concentration (BAC) of 0.05g/dL. A further 7 hours (i.e. 24 hours in total) of sleep deprivation in this study produced a level of impairment equivalent to that observed in subjects with a BAC of 0.1g/dL, twice the legal limit in most western countries6. It is generally accepted that (random) breath testing, the common method of detecting and measuring alcohol intoxication, saves lives; and intuitively, it is likely that a practical fatigue measure would yield the same result. Not only would simple measures of fatigue have practical implications for on-road use, it would also allow for an objective assessment of fitness to drive. Current medical standards for assessing fitness to drive in patients with sleep disorders, such as Obstructive Sleep Apnea (OSA) rely predominately on subjective measures such as sleepiness scales or structured interviews9, 10. The most obvious concern with this method is the self-report bias that may occur among those who do not wish their license to be revoked, irrespective of the danger to themselves and others. However, there is also increased pressure and responsibility on physicians to identify and report individuals who should not be allowed to continue driving.

- 6 -
1.2 Measuring and Managing Fatigue In general, changes to working hours, and the increased value of time in recent years has led to the necessary development of fatigue management systems (FMS) for the Road Transport industry. Strategies for FMS have typically involved the regulation of maximum work hours. In some cases this has been achieved through the mathematical analysis of rosters for fatigue risk11-13. As an extension to this approach, mathematical models have been compared to simple tests of performance in an attempt to quantify the risk of impairment to performance in the real world. However, this performance is typically measured using a standard neurobehavioural test such as simple, visual reaction time14.
One of the most common assays of fatigue used in sleep deprivation and performance research is the Psychomotor Vigilance Task (PVT)15. Developed at the University of Pennsylvania, USA, the PVT requires responses to a visual stimulus by pressing a response button as soon as the stimulus appears. Research consistently shows that extended wakefulness and cumulative sleep restriction results in an increase in reaction time, a decrease in response speed, and an increase in lapses16-18. What makes the PVT a particularly attractive assay of fatigue is that it is simple to perform, and has been shown to have only minor practice effects16-18, which disappear on a 1-3 trial learning curve16. This test has also been shown to have good test retest reliability20. Although studies have attempted to demonstrate the links between PVT performance and accident risk21, performance has not been experimentally compared to more complex tasks such as an interactive driving simulation. One study recently measured both types of performance in locomotive engineers21, but did not directly equate performance impairment on the two measures. This would be of benefit to road safety in that methods of fatigue management currently being used and developed for industry are measured against laboratory measures such as the PVT. If we are able to provide a direct link from such a measure to a more realistic task such as driving, these systems will have a great deal more meaning for the domain of driving and for the assessment of fitness to drive. Therefore, it is the primary aim of this study to attempt to provide this link, by directly comparing performance under conditions of increasing fatigue/sleepiness, using both the PVT and interactive driving simulation. Although if may not be possible to develop a single test to accurately determine fitness-to-drive – if data from the PVT is congruent with that measured using driving simulation, the PVT may have potential for use in supporting FMS as part of a fitness-to-drive test battery.
1.3 Awareness and Perception Few studies in this area have directly examined drivers' ability to recognise their own sleepiness, or appreciate the resulting impairment to driving performance. One study of long distance truck drivers showed a reasonable correlation between subjective sleepiness ratings, and EEG measures of sleepiness22. Horne & Baulk also conducted a study showing similar results, using a database of driving experiments23. However, another study previously showed that although drivers have good insight into their level of sleepiness at the time, they tend to underestimate the likelihood of actually falling asleep24. It is not known how and why drivers decide to continue driving when sleepy, and how aware they are of their own performance deterioration. It is critically important to investigate self-ratings of driving performance and crash risk, since the perception of ability is a primary influence on drivers' decision to stop or continue driving. This is vital information for the success of future educational campaigns in this area, and can be addressed with the simple addition of self-ratings of sleepiness and performance to the extended wakefulness protocol.

- 7 -
1.4 Gender Epidemiological research in this area has shown that males are more likely to be involved in fatigue-related accidents2, 25, 26, although there is no clear method to determine how this data should be adjusted for exposure. Research has also shown that males are more likely to underestimate risk and overestimate driving skill27, 28. For example, a study examining perception of crash risk amongst partially sleep-deprived individuals, with and without low-levels of alcohol, found that whilst sleep deprived, women were 48% more likely than men to accurately anticipate their crashes. This difference was eliminated when alcohol was consumed (BAC<0.05g/dL), with only a 5% difference in accident anticipation between genders29. From a physiological viewpoint, it is clear that there are gender differences in various aspects of human sleep - including sleep disturbance30, 31, circadian rhythms32 and sleep deprivation33.
Figure 1: Subjective sleepiness for men and women as measured by the KSS35 (1=extremely alert, 9=extremely sleepy)
Subjective Sleepiness: MEN vs. WOMEN
(NORMAL and RESTRICTED Sleep, N=30)
1
2
3
4
5
6
7
8
9
0:00
0:10
0:20
0:30
0:40
0:50
1:00
1:10
1:20
1:30
1:40
1:50
2:00
Time (Hr/Min)
Me
an
KS
S
MEN (normal)
WOMEN (normal)
MEN (restricted)
WOMEN (restricted)
Thus, it is crucial to examine for gender differences when considering the effects of fatigue on driving performance, perception of impairment and attitudes to risk.
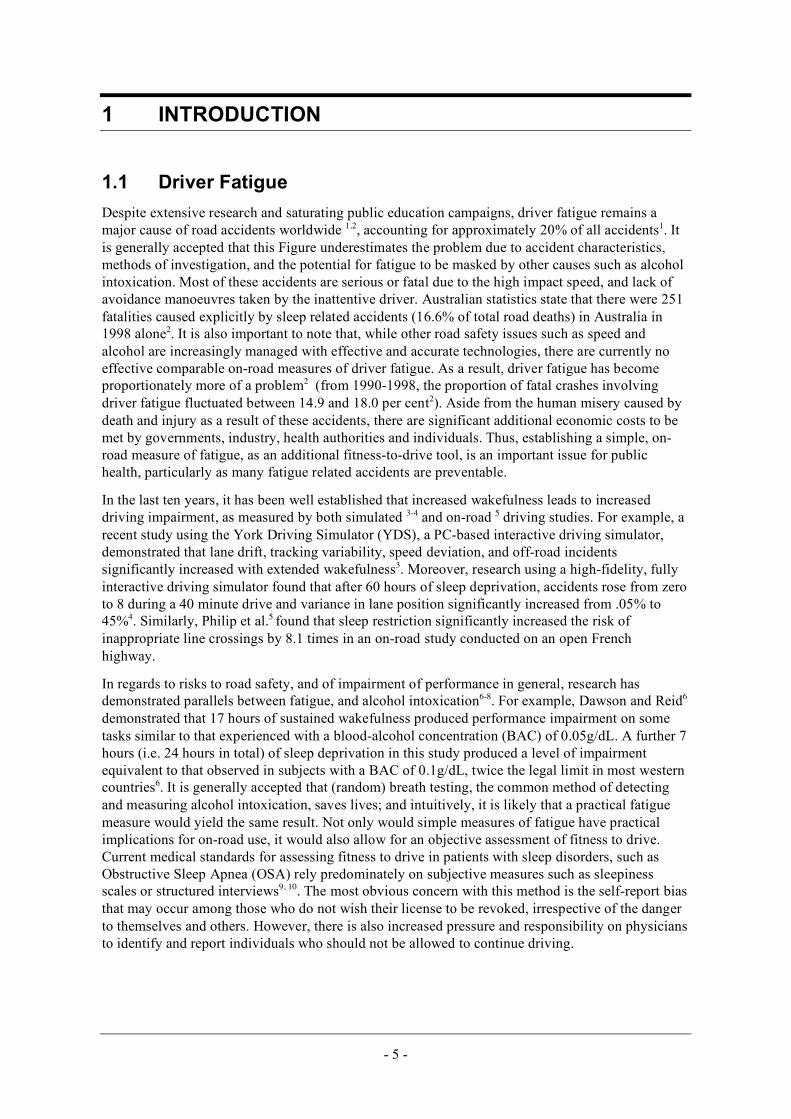
A recent study conducted in the UK, compared male and female drivers for sleepiness and driving simulator performance in the mid-afternoon after normal and restricted sleep34. Greater levels of subjective sleepiness were found in women after sleep was restricted to 5 hours (p<0.0005 – see Figure 1), and women were significantly more impaired by sleepiness as measured by lane drifting incidents (p<0.006 – see Figure 2).
These findings suggest that although females' driving performance is more profoundly affected by sleepiness, they are at least more aware of it, and therefore able to stop driving or use
- 8 -
countermeasures as appropriate. Interestingly, few studies have directly examined males and females driving performance while sleepy, or examined their attitudes to such behaviour. It is possible that female drivers are less likely to be involved in fatigue-related crashes, but it is difficult to know the proportion of male and female drivers on the road at any point.
Figure 2: Lane drifting incidents for men and women
Mean Lane Drifting Incidents: MEN vs. WOMEN
(RESTRICTED Sleep: N=30)
0
1
2
3
4
0-30 30-60 60-90 90-120
Time (Min)
Lan
e D
rift
ing
In
cid
en
ts
MEN
WOMEN
The present study aimed to equate the impairment to performance caused by extended wakefulness, using simple reaction time tests as well as driving simulation.
In addition, we aimed to explore the issues of drivers' self-perception of performance and gender differences in order to provide new knowledge in this area.
- 9 -
2 METHOD
2.1 Study Objectives
Primary Objectives:
● To measure the decrements in performance caused by increasing levels of fatigue using a simple test of visual reaction time (PVT) and an interactive driving simulation task.
● To provide a link between simple and complex measures of performance, thus improving the potential success of fatigue management systems.
Secondary Objectives:
● To examine the effects of fatigue on perception of performance and motivation of drivers to continue.
● To examine the effects of gender on fatigue, driving performance and perception thereof.
2.2 Methodology
2.2.1 Changes to methodologies
There were some necessary changes to the methodologies used, from those stated in the original funding application. These are detailed below:
Although we planned to use Urinalysis to screen for recreational drugs, this proved to be unfeasible primarily because there were ethical questions to consider regarding what to do with the outcome of any positive tests. We therefore ultimately considered urinalysis to be beyond the scope of this pilot project, instead relying on voluntary disclosure of any drug or medication use.
Our laboratory has 4 bedrooms capable of recording EEG data directly from the brain. These bedrooms are conFigured for subjects to sleep in during research protocols, and for performance testing (during sleep deprivation studies). However, technical problems prevented the recording of EEG data during performance testing on the driving simulator. The EEG recording system we currently use introduces significant movement artifact during out-of bed recording. Since the EEG data was not essential to answer any of the main scientific questions in this project, we proceeded without such recordings.
The original proposal stated that performance testing would consist of "10-15 minute tests on both the York Driving Simulator (YDS) and Psychomotor Vigilance Task (PVT)". This was altered for two reasons: firstly, a 15-minute driving simulator test was found to be insufficient in detecting significant performance decrements, particularly in the early stages of sleep deprivation. Our trials, supported by the literature in this area confirmed that at the minimum, a 30-minute driving simulation task should be used. We therefore used a 30-minute task, bracketed by two 10-minute PVTs; one before, and one after the simulated drive. Thus, the performance testing increased in length from 30 to 50 minutes per session. This was thought to be too rigorous for subjects at 2 hour intervals (as originally proposed), and therefore the frequency of testing was reduced. Performance testing was completed at 1000h; 1400h; 0000h and 0600h, following subjects waking up at 0730h. In addition, subjects were tested at 1900h after an 8-hour opportunity for recovery sleep. Thus, we

- 10 -
were able to examine the effects of recovery sleep on sleepiness and performance following sleep deprivation, in addition to the original primary and secondary objectives of the project.
2.2.2 Study Design
The study used a repeated measures design as part of an extended wakefulness protocol to systematically increase the fatigue levels of the participants and directly compare performance on both reaction time and driving simulation tests.
2.2.3 Participants
We aimed to recruit 20 healthy (free of medication, and within normal range for body mass index) volunteer participants, having been driving for at least 2 years and screened for sleep disorders using a general health questionnaire. We also aimed to recruit equal numbers of males and females in order to compare the two groups for gender differences. Sixteen participants (8 male, 8 female) were recruited for participation. However, one subject withdrew due to illness at the start of the period of sleep deprivation. Therefore, fifteen individuals (7 male, 8 female) participated in the study. They were aged 22-56 years (mean=33.6 years; SD=11.1 years), had been driving for at least 2 years and were screened for sleep disorders using a general health questionnaire. Body Mass Index was within normal range (mean BMI=25.7; SD=5.1). Participation was entirely voluntary and subjects were free to withdraw at any stage during the study without giving a reason. The selected participants gave written informed consent and were compensated for their participation. The study had approval from the Human Research Ethics Committees of both the University of South Australia and the Queen Elizabeth Hospital.
2.2.4 Measures
Measures
Sleep Diary. Participants were asked to provide detailed information about their sleep for one week prior to test sessions using a sleep diary. For each sleep period (including naps), they recorded date and time of sleep onset, the final wake time and the number and length of awakenings during the sleep period.
Actigraphy. Objective assessments of sleep/wake prior to test sessions were made using activity monitors and actiware-sleep software. Monitors contain piezo-electric accelerometers with a sensitivity of 0.1g, and are found to be reliable indicators of sleep and wakefulness37. The analogue sensor samples movement every 125ms and the information is stored in 1-minute intervals for analysis. Participants were required to wear the activity monitor on their wrist at all times for one week prior to test sessions, except whilst showering.
KSS. Subjective sleepiness was measured using the KSS35 at regular intervals during testing. This scale has been validated with EEG measured changes in objective sleepiness22. Participants also rated their likelihood of falling asleep24. Both scales were visible adjacent to the driving simulator screen. Responses were prompted by an audible tone every 5 minutes, to which subjects responded verbally, and this was recorded by a video camera.
General Health Questionnaire. Participants completed a general health questionnaire to identify sleep disorders (e.g. self-reported difficulty sleeping or snoring), and medication or recreational drugs which are sedating or arousing. The Pittsburgh Sleep Quality Index (PSQI38), and the Epworth sleepiness scales (ESS39) were used to assess subjects’ suitability for the study. These are known to be sensitive to clinical sleep problems and to have good test-retest reliability40, 41.
Subjective Driving Performance. Participants gave ratings from a 7-point scale, in answer to two
- 11 -
questions on driving performance, both before and after each 30-minute drive: Question A "How safely could you drive a car right now?" (1=Very Unsafely; 7=Very Safely) Question B "If someone else felt the same way as you do now, how confident would you be letting them drive your child or a loved one?" (1=Fully Confident; 7=Fully Unconfident).
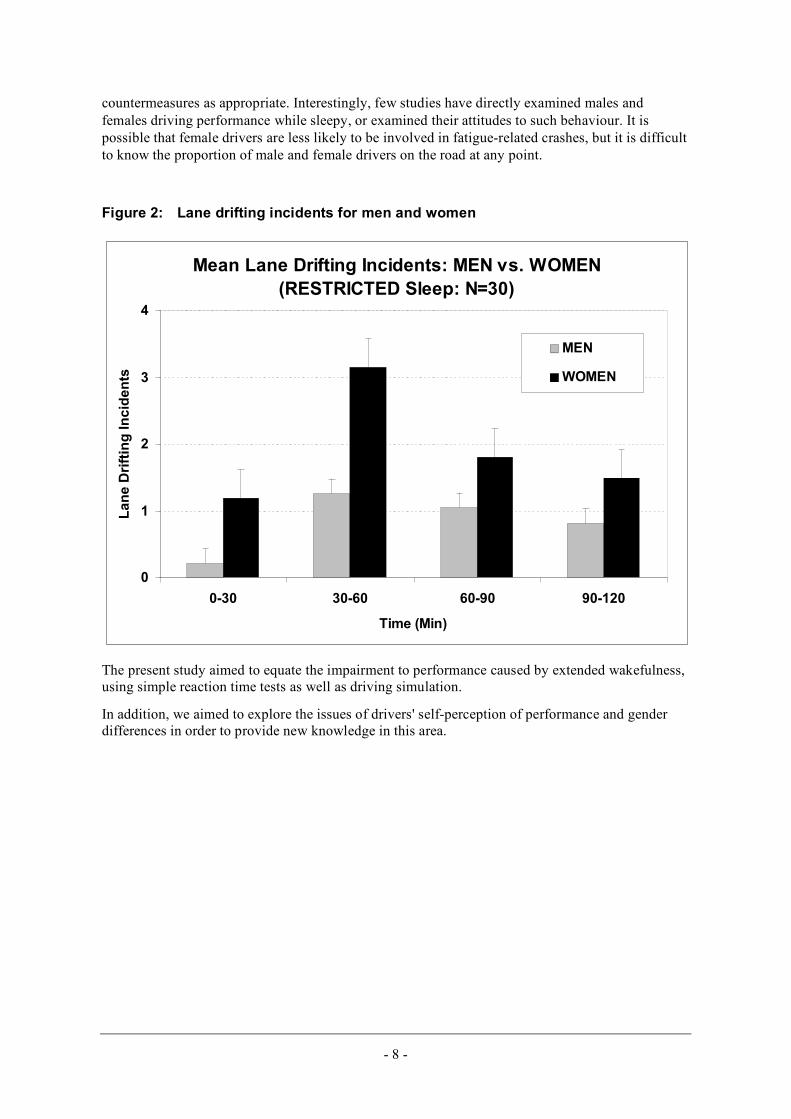
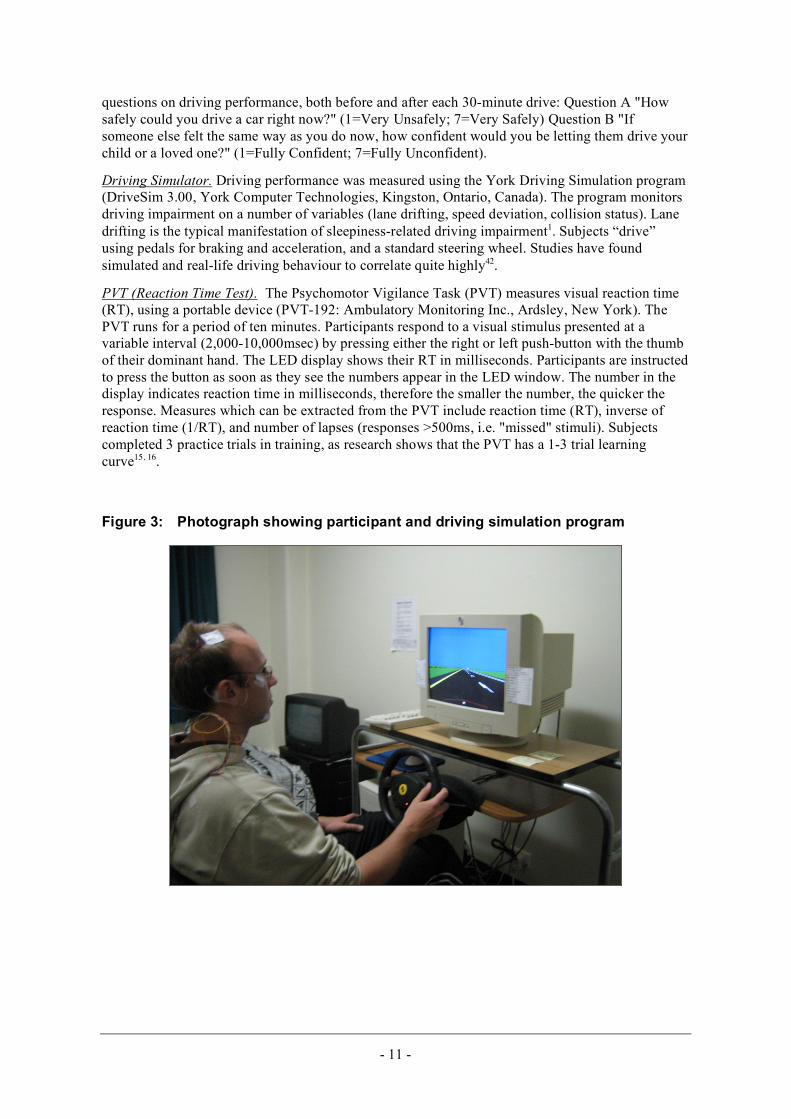
Driving Simulator. Driving performance was measured using the York Driving Simulation program (DriveSim 3.00, York Computer Technologies, Kingston, Ontario, Canada). The program monitors driving impairment on a number of variables (lane drifting, speed deviation, collision status). Lane drifting is the typical manifestation of sleepiness-related driving impairment1. Subjects “drive” using pedals for braking and acceleration, and a standard steering wheel. Studies have found simulated and real-life driving behaviour to correlate quite highly42.
PVT (Reaction Time Test). The Psychomotor Vigilance Task (PVT) measures visual reaction time (RT), using a portable device (PVT-192: Ambulatory Monitoring Inc., Ardsley, New York). The PVT runs for a period of ten minutes. Participants respond to a visual stimulus presented at a variable interval (2,000-10,000msec) by pressing either the right or left push-button with the thumb of their dominant hand. The LED display shows their RT in milliseconds. Participants are instructed to press the button as soon as they see the numbers appear in the LED window. The number in the display indicates reaction time in milliseconds, therefore the smaller the number, the quicker the response. Measures which can be extracted from the PVT include reaction time (RT), inverse of reaction time (1/RT), and number of lapses (responses >500ms, i.e. "missed" stimuli). Subjects completed 3 practice trials in training, as research shows that the PVT has a 1-3 trial learning curve15, 16.
Figure 3: Photograph showing participant and driving simulation program
- 12 -
2.2.5 Experimental Procedure
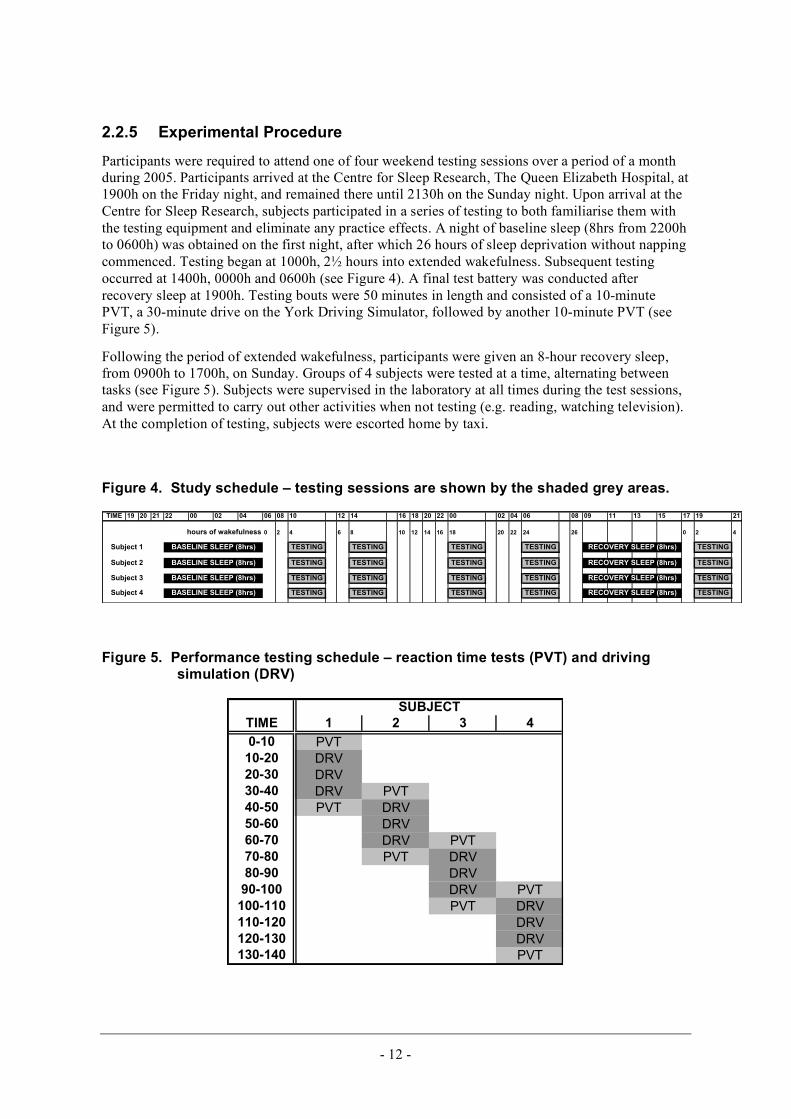
Participants were required to attend one of four weekend testing sessions over a period of a month during 2005. Participants arrived at the Centre for Sleep Research, The Queen Elizabeth Hospital, at 1900h on the Friday night, and remained there until 2130h on the Sunday night. Upon arrival at the Centre for Sleep Research, subjects participated in a series of testing to both familiarise them with the testing equipment and eliminate any practice effects. A night of baseline sleep (8hrs from 2200h to 0600h) was obtained on the first night, after which 26 hours of sleep deprivation without napping commenced. Testing began at 1000h, 2½ hours into extended wakefulness. Subsequent testing occurred at 1400h, 0000h and 0600h (see Figure 4). A final test battery was conducted after recovery sleep at 1900h. Testing bouts were 50 minutes in length and consisted of a 10-minute PVT, a 30-minute drive on the York Driving Simulator, followed by another 10-minute PVT (see Figure 5).
Following the period of extended wakefulness, participants were given an 8-hour recovery sleep, from 0900h to 1700h, on Sunday. Groups of 4 subjects were tested at a time, alternating between tasks (see Figure 5). Subjects were supervised in the laboratory at all times during the test sessions, and were permitted to carry out other activities when not testing (e.g. reading, watching television). At the completion of testing, subjects were escorted home by taxi.
Figure 4. Study schedule – testing sessions are shown by the shaded grey areas.
TIME 19 20 21 22 00 02 04 06 08 10 12 14 16 18 20 22 00 02 04 06 08 09 11 13 15 17 19 21
hours of wakefulness 0 2 4 6 8 10 12 14 16 18 20 22 24 26 0 2 4
TESTING TESTING TESTING TESTING TESTING
TESTING TESTING TESTING TESTING TESTING
TESTING TESTING TESTING TESTING TESTING
TESTING TESTING TESTING TESTING TESTING
Subject 1
Subject 2
Subject 3
Subject 4
RECOVERY SLEEP (8hrs)
RECOVERY SLEEP (8hrs)
RECOVERY SLEEP (8hrs)BASELINE SLEEP (8hrs)
BASELINE SLEEP (8hrs) RECOVERY SLEEP (8hrs)
BASELINE SLEEP (8hrs)
BASELINE SLEEP (8hrs)
Figure 5. Performance testing schedule – reaction time tests (PVT) and driving simulation (DRV)
TIME 1 2 3 4
0-10 PVT
10-20 DRV
20-30 DRV
30-40 DRV PVT
40-50 PVT DRV
50-60 DRV
60-70 DRV PVT
70-80 PVT DRV
80-90 DRV
90-100 DRV PVT
100-110 PVT DRV
110-120 DRV
120-130 DRV
130-140 PVT
SUBJECT

- 13 -
2.2.6 Data Processing
The complex analysis necessary to address the primary objectives of this project required in-depth processing and analysis of the driving simulation data. The York Driving Simulator (YDS) logs data 10 times per second. This data must be processed to facilitate analysis with which to address the aims of the study. We have developed as part of this project, a software tool (“DriverNator”) which enables the rapid processing of this data into user-configurable periods of interest, or epochs. Users are thus able to specify a time interval and quickly calculate statistics for this period (e.g. 10 sec; 30 sec; 1 minute; 5 minutes) in order to achieve the required resolution of data. DriverNator is able to do this quickly and accurately, and calculate relevant statistics (mean, standard deviation, standard error) for each measure (lane position, speed etc.).
2.2.7 Statistical Analyses
All data were checked for normality prior to analysis. One outlier was identified within the driving data and subsequently eliminated43. PVT data showed a moderate positive skew and were adjusted using the standard method of square root data transformations43. Violations of sphericity were corrected using Huynh-Feldt epsilon adjustments; however degrees of freedom reported in the text are based on the study design.
The driving performance parameters of speed (kph; Meankph; SDkph), collision status, and road position (%; Mean%; SD%) for each driving session were automatically detected and logged by the York Driving Simulator in 1sec intervals. Left lane drifting incidents were identified as road position >85%. As posted speed limits varied (30kph and 60 kph) throughout the simulation, the posted speed limit for each 1sec interval was identified through visual logging. Speed deviation was then calculated as kph over or under the posted speed limit. Collisions were identified as both collisions into another vehicle or into an object. Changes in driving performance as a result of extended wakefulness were assessed by repeated measures ANOVA. Planned means comparisons were then conducted where appropriate (p<0.05). Due to technical difficulties, driving data were not obtained for one subject during the last drive of extended wakefulness. These data were treated as missing and assessed accordingly.
Systematic changes in PVT performance metrics (RT, response speed, lapses) after extended wakefulness were analysed by repeated measures ANOVA. Planned means comparisons were conducted where appropriate (significance p<0.05). Independent samples t-tests were used to examine data for gender differences.
As the purpose of this study was to determine whether a simple measure of reaction time could indicate driving impairment, a Bland-Altman plot44, 45 was used to assess the level of agreement between two validated measures of performance impairment (lane drift and lapses). Initially developed to compare medical measurement devices, a Bland-Altman plot is a statistical method to compare two measurement techniques. As suggested by Bland and Altman45, using a correlation coefficient or regression analysis to compare a new method of measurement against an old one will often show a relationship when none exists. The plot however, measures the agreement between the two measures by illustrating the differences between the two measures against the mean of both. The mean difference is the estimated bias or the systematic difference between the measures, and the standard deviation of the differences indicates the random fluctuations around the mean45. A 95% ’limits of agreement’ (the mean difference squared), is established to show the degree of agreement between the measures.
Responses to subjective scales were recorded on video during each of the driving sessions. These responses were later entered manually into a database for analysis. Due to technical difficulties, some responses were not recorded on the video and were subsequently treated as missing data for analysis. No outliers or skewed data were found in this dataset. A repeated measures ANOVA was

- 14 -
conducted to determine the effect of extended wakefulness on subjective sleepiness as measured by the KSS, and on the perceived likelihood of falling asleep as measured by the LHoFA scale. Planned means comparisons were conducted where appropriate (p<0.05). A two-way repeated measures ANOVA was used to determine the effects of extended wakefulness on perceived driving ability, and planned means comparisons conducted where appropriate (p<0.05). Gender differences were tested through a series of independent-samples t-tests for all measures.
- 15 -
3 RESULTS
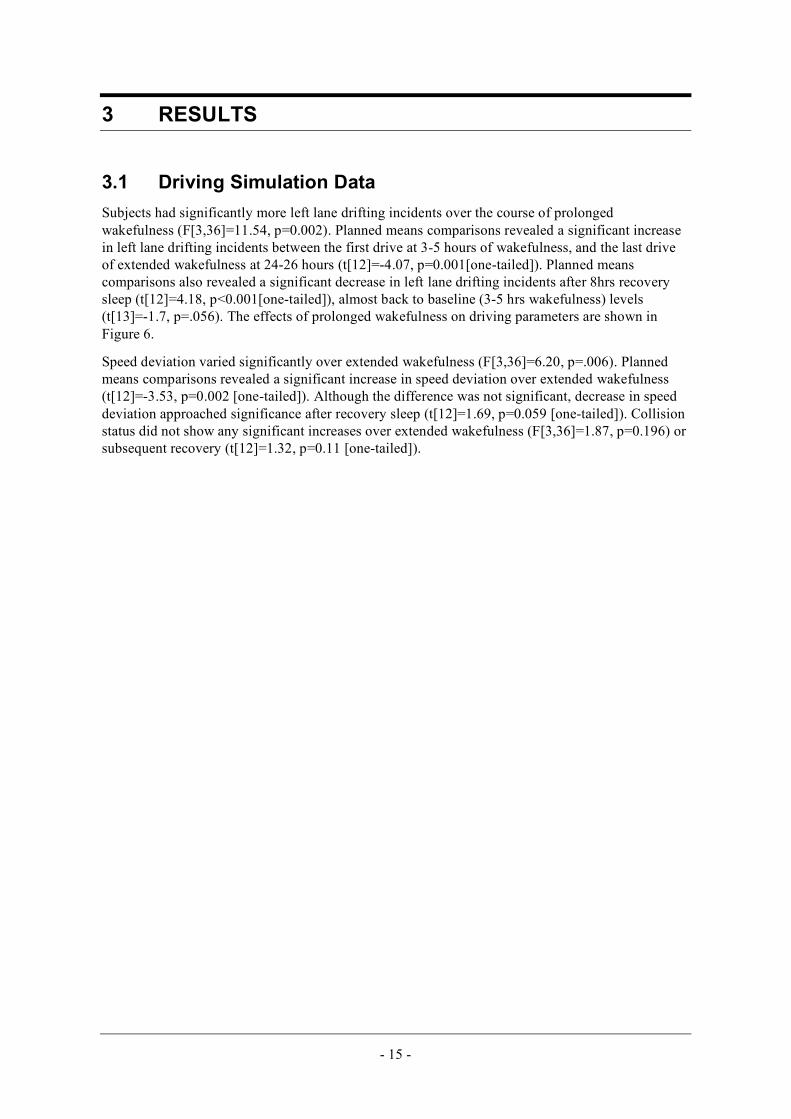
3.1 Driving Simulation Data Subjects had significantly more left lane drifting incidents over the course of prolonged wakefulness (F[3,36]=11.54, p=0.002). Planned means comparisons revealed a significant increase in left lane drifting incidents between the first drive at 3-5 hours of wakefulness, and the last drive of extended wakefulness at 24-26 hours (t[12]=-4.07, p=0.001[one-tailed]). Planned means comparisons also revealed a significant decrease in left lane drifting incidents after 8hrs recovery sleep (t[12]=4.18, p<0.001[one-tailed]), almost back to baseline (3-5 hrs wakefulness) levels (t[13]=-1.7, p=.056). The effects of prolonged wakefulness on driving parameters are shown in Figure 6.
Speed deviation varied significantly over extended wakefulness (F[3,36]=6.20, p=.006). Planned means comparisons revealed a significant increase in speed deviation over extended wakefulness (t[12]=-3.53, p=0.002 [one-tailed]). Although the difference was not significant, decrease in speed deviation approached significance after recovery sleep (t[12]=1.69, p=0.059 [one-tailed]). Collision status did not show any significant increases over extended wakefulness (F[3,36]=1.87, p=0.196) or subsequent recovery (t[12]=1.32, p=0.11 [one-tailed]).

- 16 -
Figure 6. The effects of prolonged wakefulness on (a) lane drifting; (b) speed deviation and (c) collisions.
A.
Mean Left Lane Drift Incidents (N=15)
0
20
40
60
80
100
120
140
3-5 8-10 18-20 24-26 Post
RecoveryHOURS OF WAKEFULNESS
Me
an
No
. o
f L
eft
La
ne
Dri
ftin
g I
nc
ide
nts
B.
Speed Deviation (N=15)
0
5
10
15
3-5 8-10 18-20 24-26 Post
Recovery
HOURS OF WAKEFULNESS
Sp
ee
d D
ev
iati
on
(K
ph
)
C
Collisions (N=15)
0
10
20
30
40
50
3-5 8-10 18-20 24-26 Post
Recovery
HOURS OF WAKEFULNESS
Mean
No
. o
f C
ollis
ion
s

- 17 -
3.2 PVT Reaction Time Data A repeated measures ANOVA revealed significant differences in mean RT over extended wakefulness (F[3,36]=10.52, p=0.006). Planned means comparisons showed a significant increase in RT over extended wakefulness (t[13]=-3.79, p=0.001[one-tailed]), which then significantly decreased again after recovery sleep (t[13]=3.46, p=0.004 [one-tailed]). There was no difference between baseline and recovery (t[14]=-2.06, p=0.059[two-tailed]).
The effects of prolonged wakefulness on PVT parameters are shown in Figure 7. Response speed ({1/mean reaction time} x 1000) also showed significant differences over extended wakefulness (F[3,36]=38.9, p<0.001). Response speed significantly decreased between the first drive at 1000h on Saturday and the last drive at 0600h on Sunday (t[13]=8.9, p<0.001[one-tailed]). After recovery sleep, response speed again significantly increased (t[13]=-7.27, p<0.001 [one-tailed]), although not to baseline levels (t[14]=1.56, p=0.141 [two-tailed]).
The same pattern was found in PVT lapses. Significant differences were found over sleep deprivation (F[3,36]=15.39, p<0.001), with a significant increase in lapses after extended wakefulness (t[13]=-4.38, p<0.001[one-tailed]), and a significant decrease after recovery sleep (t[13]=4.04, p<0.001[one-tailed]). Lapses, however, did not return to baseline levels with significant differences found between baseline and recovery (t[14]=-2.36, p=0.033[two-tailed]).

- 18 -
Figure 7. The effects of prolonged wakefulness on (a) mean reaction time, (b) mean response speed, and (c) mean number of lapses.
A.
Mean RT (N=15)
200
250
300
350
400
450
3-5 8-10 18-20 24-26 Post
Recovery
HOURS OF WAKEFULNESS
Me
an
RT
(m
se
c)
B.
Mean Response Speed (1/RT, N=15)
3.0
3.5
4.0
4.5
3-5 8-10 18-20 24-26 Post
Recovery
HOURS OF WAKEFULNESS
Mean
RS
C.
Mean Lapses (N=15)
0
2
4
6
8
10
12
3-5 8-10 18-20 24-26 Post
Recovery
HOURS OF WAKEFULNESS
Me
an
No
. o
f L
ap
se
s

- 19 -
3.3 Links between Driving and PVT Measures In order to directly compare the simple (PVT) and complex (driving) measures of performance, pairs of variables from the two performance tests were plotted, and R2 values calculated (see Figures 8-9).
Figure 8 Mean reaction Time vs. Left Lane Drift
(R2=0.96)
Mean RT vs. Lane Drift (N=15)
150
200
250
300
350
400
3-5 8-10 18-20 24-26 Post
RecoveryHOURS OF WAKEFULNESS
Me
an
RT
0
20
40
60
80
100
120
140
Me
an
LL
D
Mean RT
LLDrift
Figure 9 Mean PVT Lapses vs. Left Lane Drift (R2=0.96)
Mean PVT Lapses vs. LLD (N=15)
0
2
4
6
8
10
3-5 8-10 18-20 24-26 Post
Recovery
Me
an
La
ps
es
0
20
40
60
80
100
120
140
Me
an
LL
D
Mean Lapses
Mean LLD

- 20 -
A Bland-Altman plot was constructed for paired comparisons between number of lapses and number of left lane drifting incidents. The plot of the difference between lapses and left lane drift showed a bias of 43.79 (95%CI, 14.7-72.9) (Figure 10).
Figure 10. Bland-Altman plot showing paired comparisons between lapses and left lane drift
BLAND-ALTMAN Plot: LLD vs. PVT Lapses
-100
-50
0
50
100
150
200
250
300
350
0 50 100 150 200
MEAN FATIGUE-RELATED INCIDENTS (LLD+Lapses)
DIF
FE
RE
NC
E (
LL
D-L
ap
se
s)
The lower limit of agreement was -61.28 (95%CI, -257.55–134.99). The upper limit of agreement was 148.86 (95% CI, -47.41–345.13). The square of the difference between the two performance scores was tested for association with the mean incident score using regression analysis and was found to be statistically significant (p<0.001), indicating a systematic error within the measures. That is, as hours of wakefulness increase, PVT lapses do not increase to the same magnitude as lane drifting. The results of the Bland-Altman suggest that with increasing wakefulness, the number of left lane drifting incidents will be between 61 and 148 times higher than the number of PVT lapses, 95% of the time. Thus, PVT lapses are not a reliable measure of driving impairment.

- 21 -
3.4 Subjective Sleepiness Subjective Sleepiness data was plotted against time and is shown in Figure 11. Repeated measures ANOVA showed a significant difference in KSS ratings over time (p=0.0001). Planned means comparisons showed that subjective sleepiness significantly increased with extended wakefulness, and significantly decreased after recovery (p=0.0001). Subjective sleepiness was also significantly lower after recovery sleep than at 3-5hrs wakefulness (p=0.004).
Figure 11. Mean subjective sleepiness (KSS) during driving
Mean Subjective Sleepiness (KSS) During Driving:26 hr Sleep Deprivation and Recovery (N=15)
1
2
3
4
5
6
7
8
9
10
0 5 10 15 20 25 30 0 5 10 15 20 25 30 0 5 10 15 20 25 30 0 5 10 15 20 25 30 0 5 10 15 20 25 30
3-5hrs 8-10hrs 18-20hrs 24-26hrs Post Recovery
Time (Hrs, Min)
Me
an
KS
S
3.5 Likelihood of Falling Asleep Likelihood of falling asleep (LHoFA) ratings were plotted against time, and are shown in Figure 12. Repeated measures ANOVA showed a significant difference in LHoFA ratings over time (p=0.0001). Planned means comparisons showed that LHoFA significantly increased with extended wakefulness, and significantly decreased after recovery sleep (p=0.0001). LHoFA was also significantly lower after recovery sleep than at 3-5hours wakefulness (p=0.013).

- 22 -
Figure 12. Mean Subjective Sleepiness (LHoFA) during driving
Mean Likelihood of Falling Asleep (LHoFA):26 hr Sleep Deprivation and Recovery (N=15)
0
1
2
3
4
5
0 5 101520 2530POSTPRE0 5 1015 2025 30POSTPRE 0 5 10 152025 30POSTPRE0 5 101520 2530POSTPRE0 5 1015 2025 30
8-10hrs 18-20hrs 24-26hrs Post Recovery
Time (Hrs, Min)
Mea
n L
Ho
FA
3.6 Perception of Driving Performance Perception of Driving Performance ratings are presented in Figure 13. Data was analysed for question A (“How safely could you drive a car right now?”) and question B (“If someone else felt the same as you do now, how confident would you be letting them drive your child or loved one?”). Two-way ANOVA results showed a significant main effect of time (p=0.0001), a significant main effect of question (p=0.013) and a significant interaction effect of question by time (p=0.009).

- 23 -
Figure 13. Mean perception of driving ability (before and after driving)
Mean Perception of Driving Ability Data:26hr Sleep Deprivation and Recovery (N=15)
GOOD
BAD
0
1
2
3
4
5
6
7
PRE POST PRE POST PRE POST PRE POST PRE POST PRE POST
Practise 3-5 hrs 8-10 hrs 18-20 hrs 24-26 hrs Recovery
QUESTION A
QUESTION B
Planned comparisons showed that prior to sleep deprivation there were already significant differences in the two questions. That is, although subjects felt relatively safe to drive, they would not let someone else drive their loved ones if they felt the same way. Once sleep deprived, differences between the two questions became non-significant. That is, subjects did not feel safe to drive and they wouldn’t let anyone else drive their loved ones either. Differences between the two questions after recovery sleep were still non-significant, however it was in the opposite direction. That is, they felt safe to drive themselves, and would allow someone else to do so.
3.7 Gender Differences All data were also examined for gender differences (7 males, 8 females). No significant differences were found in the driving simulation measures (left lane drift, speed deviation or crash status).
PVT reaction time data showed a significant difference in mean RT (see Figure 14), with females being significantly slower to respond than males (p=0.04) during the 24-26hour wakefulness period. Significant differences were also shown in response speed (1/RT) after extended wakefulness (during the final trial of sleep deprivation). That is, women were significantly slower in their response speed than men (p=0.049 see Figure 15). No significant differences were found in PVT lapses.
No significant differences were found for subjective sleepiness on either the KSS or LHoFA scales.

- 24 -
Figure 14. Mean RT for male vs. female Drivers
Mean RT: MALE vs. FEMALE (N=15)
150
250
350
450
550
3-5 8-10 18-20 24-26 Post
RecoveryHOURS OF WAKEFULNESS
ME
AN
RT
(m
s) FEMALE
MALE
Figure 15 Mean response speed for male vs. female drivers
MEAN 1/RT: MALE vs. FEMALE (N=15)
2.5
3.5
4.5
5.5
3-5 8-10 18-20 24-26 Post
RecoveryHOURS OF WAKEFULNESS
ME
AN
1/R
T
FEMALE
MALE
There were no gender differences in perception of driving ability data, although question A did give a consistent trend for males to rate their ability higher than females, and this was significant at 24-26 hours of wakefulness (p=0.023). This data is shown in Figure 16. At this stage, women felt significantly less safe to drive than men. As shown in Figure 17, question B did not lead to any differences between males and females.

- 25 -
Figure 16. Perception of driving ability (QA) for male and female drivers
Perception of Driving AbilityQA "How safely could you drive a car right now?"
GOOD
BAD
0
1
2
3
4
5
6
7
PRE POST PRE POST PRE POST PRE POST PRE POST PRE POST
Practice 3-5 hrs 8-10 hrs 18-20 hrs 24-26 hrs Recovery
MALE
FEMALE
Figure 17. Perception of driving ability (QB) for male and female drivers
Perception of Driving AbilityQB "If someone else felt the same way as you do now, how confident would
you be letting them drive your child or a loved one?"
BAD
GOOD
0
1
2
3
4
5
6
7
PRE POST PRE POST PRE POST PRE POST PRE POST PRE POST
Practice 3-5 hrs 8-10 hrs 18-20 hrs 24-26 hrs Recovery
MALE
FEMALE

- 26 -
4 DISCUSSION
4.1 Findings Relative to Study Objectives
4.1.1 To measure the decrements in performance caused by increasing levels of fatigue using a simple test of visual reaction time (PVT) and an interactive driving simulation task
Using a laboratory extended wakefulness protocol, we measured increasing levels of fatigue in a number of domains. Consistent with previous studies, extended wakefulness resulted in performance impairment across all measures.
Driving performance measures (lane drifting, speed deviation and collision status) showed some variation with increasing wakefulness. As expected lane drift was the most sensitive measure of fatigue, showing the most significant impairment over extended wakefulness and the least between subject variability. Speed deviation also showed significant impairment with extended wakefulness, but due to between subject variability, especially during the third driving period, this result was not as strong as lane drift. As can be seen from Figure 6B, this time period also shows the greatest impairment within speed deviation. While this seems counter-intuitive, the result is not surprising when circadian factors are taken into account. The third drive occurred between the hours of 12-2am, corresponding with the onset of a circadian dip47. It is likely that at this time, due to the natural decrease in mental functioning, some participants forwent monitoring their speed in favour of attempting to avoid accidents. The fact that collision status remained low during this same time period supports this theory. While it would be opportune to design the experiment to avoid circadian effects, this is almost impossible when studying the exponential effects of extended wakefulness (>20hours). Humans experience two circadian dips each 24 hour period: one between mid-night and 6am, and one between 2 and 4 pm. Attempting to avoid testing during these times would skew the results and provide misleading data. Therefore, although circadian effects do impact on the research outcomes, accounting for them within the data is a more robust than avoiding them.
Collision status did not show any significant increase over hours of wakefulness. Again this is not unusual. As shown in previous studies 46, 48, collision status is the least sensitive of all driving measures. One possible reason for this is that it is also the most tangible impairment measure to the drivers. That is, subjects may be highly sensitive to having an accident thus pay more attention to avoiding it in simulated situations. In addition, collision status showed the greatest between subject variability, with some participants crashing excessively and others not at all. Again, this is not an unrealistic result as not only will subjects vary in their resilience to fatigue, but they will also vary in their experience of computer games. Intuitively, subjects with experience playing computer games will be more comfortable with a computer generated driving simulator. Therefore it is important to ensure that practice effects are addressed within study design, using extensive opportunity for subjects to practice driving.
4.1.2 To provide a link between simple and complex measures of performance, thus improving the potential success of fatigue management systems
Statistical analyses using correlational methods showed a clear agreement between lane drifting and reaction time data. However, as described by Bland & Altman45, a significant correlation between
- 27 -
measures does not always indicate an agreement between them. In this study, the Bland-Altman analysis clearly demonstrated a systematic error within the measures indicating that a simple measure of reaction time is not indicative of impairment of a more complex task such as driving. More specifically, over extended wakefulness, the numerous functions involved in maintaining a stable road position combine to increase driving impairment by a greater magnitude than the increase in simple reaction time. That is, driving becomes more impaired over time than does impairment on PVT. Thus, when used in isolation, PVT impairment is not an accurate measure of driving impairment. It is important to note however, that both measures showed similar patterns of impairment over the period of extended wakefulness. That is, both measures showed that impairment steadily increased for the first 20 hours, after which there was a sharp increase in impairment at 24-26 hours, and a dramatic decrease after recovery sleep. This suggests that, although simple reaction time is not effective at determining driving impairment on its own, it may be important as a component of a battery of tests which could be performed to examine fitness to drive. Further research is required to examine this, and may be of direct benefit for future fatigue management systems.
Our study showed that PVT was not a good predictor of driving performance, as measured by the York Driving Simulator. There is a high agreement in the variation because a plot of difference (e.g. standard correlation) will show a relationship regardless of any association in magnitude. In order to show that PVT is predictive of driving impairment, both measures must increase by the same magnitude over time. In this case, driving became more impaired over time than did PVT.
4.1.3 To examine the effects of fatigue on perception of performance
Subjective sleepiness and likelihood of falling asleep ratings (measured during driving) increased significantly with time. In addition, following a period of recovery sleep, these ratings were significantly reduced. Interestingly, ratings were significantly lower after recovery sleep than at the start of the protocol (i.e. at 3-5 hours wakefulness). However, we would suggest that this may represent an end of test effect, since subjects were only required to complete one post recovery testing session before going home. It is also important to consider the circadian influence here (see discussion in section 4.1.5).
One interesting finding within this study was the difference that was shown between the two perception of driving performance questions, which were: A (“How safely could you drive a car right now?”) and; B (“If someone else felt the same as you do now, how confident would you be letting them drive your child or loved one?”). While research has demonstrated that drivers rate their own ability more positively than others, this has not previously been considered in the case of sleepy drivers. During the early stages of sleep deprivation it was found that although subjects themselves felt safe to drive, they would not let someone else drive their loved ones. What makes this result interesting is the discrepancy between perception of own driving and that of others. It cannot be determined from this data if subjects were in general overestimating their own driving or underestimating the potential driving of another, but it is an area worth further investigation: especially if it can be determined that people are more accurate at predicting others impairments than their own, or if thinking about sleepiness, driving and impairment in a different way increases accuracy and therefore reduces accidents.
4.1.4 To examine the effects of gender on fatigue, driving performance and perception thereof
Results of this study show that there was no difference between genders in regards to driving impairment over the period of extended wakefulness. However, gender differences did appear in the

- 28 -
simple reaction time task, with women becoming significantly slower to react to the stimulus than men.
Again consistent with past research, men rated their driving ability higher than women across all driving periods. Perception of ability however, was not significant until extreme fatigue at the end point of extended wakefulness. This suggests that when sleep deprived, women appear to be more perceptive of impairment caused by fatigue than men. To our knowledge, little research in this area has investigated gender differences (subjective or objective), and education campaigns are yet to focus on these psychological differences.
4.1.5 Recovery Following Sleep Deprivation
As expected, all measures returned to, or near, baseline after an 8 hour recovery sleep. Consistent with recent studies, 8 hours of continuous sleep after 26 hours of extended wakefulness is sufficient for the body and brain to return to normal functioning. Interestingly, some performance and perception measures were better after recovery sleep than at baseline. There are three possible reasons for this. Firstly, as mentioned earlier, subjects could have been experiencing end-of-test effects. It has been shown that anticipation of the end of the experiment can lead subjects to perform better due to the excitement of almost being finished. Secondly, this could also have been the result of a combination of practice effects, for the performance measures, and a better quality of sleep during recovery, for the perception measures. Thirdly, and perhaps most importantly, the baseline and recovery testing sessions were at different times of day, and may have involved different underlying levels of alertness due to the human circadian rhythm.
4.2 Study Limitations Research has shown that driving simulation is a valid tool for assessing driving performance in the laboratory. The York Driving Simulator (YDS) used in this study is able to both simulate and measure driving performance effectively, though it is less advanced than other simulation programs currently available. While much of the difference may be cosmetic (e.g. realism of computer graphics and depth of colours) the YDS uses complex driving scenarios (traffic, road works, speed limit changes etc), but effectively includes only a straight road, and has no sound effects. More sophisticated simulation programs are able to add in weather, bending roads, varied gradients and complex intersections, as well as randomly generated traffic and pedestrian hazards.
For this study, we aimed to recruit 20 subjects, but due to time constraints only 16 could be accommodated. Of these, one withdrew, leaving only 15 subjects to be included in the final dataset. While this sample was sufficiently powerful to show statistically significant differences, larger subject numbers are ultimately required to allow broader application of the findings.
While we have compared data on driving/PVT performance for baseline and recovery, it is important to note that this comparison may be confounded by the circadian (i.e. time of day) element. Although both test sessions occurred within the protocol following an 8 hour sleep opportunity, the baseline session occurred at 1000h, while the recovery session took place at 19-2000h. Clearly, the difference in circadian alertness at this point is not only notable, but also vulnerable to individual differences (e.g. the older subjects may have been less alert than the younger subjects in the recovery session).

- 29 -
5 CONCLUSIONS
Increasing wakefulness caused significant increases in subjective sleepiness and objective performance measures. Although subjective changes were reversed by an 8 hour recovery sleep opportunity, objective measures were not. While driving and reaction time measures correlated, we conclude that there is an error between the variables – driving performance measurement (on the YDS) cannot be replaced by simple reaction time (PVT). Perceptions of driving impairment decreased significantly with increasing wakefulness, and normalised with recovery sleep. However, of key importance was the method of asking subjects to rate this performance. If asked to consider the external consequences of driving while tired, ratings were significantly lower. There were no significant gender differences in subjective sleepiness or driving performance measures. However, PVT performance, and perception of driving ability did show some significant differences. Females responded more slowly to the PVT, and rated their ability to drive as lower than males at 24-26 hrs of wakefulness. While measures of simple (PVT) and complex (simulated driving) performance are clearly linked and may correlate highly, our results show for the first time that there is a systematic error which prevents a true mathematically predictive relationship.
5.1 Further Work & Recommendations We are now able to examine some of these issues further, using a larger dataset of drivers. A recently funded NH&MRC project will be conducted by this group to examine driving impairment in clinical patients suffering from Obstructive Sleep Apnoea. This 3 year study will involve up to 180 subjects, using both driving simulation and PVT reaction time tests, and aims to examine FITNESS TO DRIVE issues further. There is scope to approach data analysis for this project in a similar way to that described here, in order to further examine the links between simple and complex performance measures. In addition, we will examine the perception of driving ability.
Further investigation is required on potential cognitive-behavioural approaches to counteracting driver fatigue. As demonstrated by numerous driving studies of this type, drivers are able to accurately rate their own levels of fatigue/sleepiness while driving, if prompted/trained to do so. In addition, as shown in this study, drivers can be prompted to directly consider the implications of this sleepiness by rating their own levels of driving performance. Most importantly, we have shown that these ratings may be altered by different ways of thinking about driving impairment. If drivers are encouraged to consider the consequences of driving while tired externally (i.e. by thinking about how they would react to another sleepy driver, if asked to be a passenger), they become more aware of their own impairment. In addition, future research should attempt to correlate subjective measures of sleepiness and impairment, with objective measures of performance. This would enable researchers to understand the accuracy of metrics, which could be used to alert and educate drivers further.
Clearly, the psychological elements of driver fatigue are extremely important. Therefore we support further research on the attitudes to driving when tired, and the development of simple and easy to use metrics for sleepiness and driving performance, to be used widely. Driver awareness and education programs should begin to focus on the psychological differences between men and women in terms of self assessments of sleepiness and impairment.
5.2 Planned Research Outputs We are currently preparing an article outlining this project for submission to an international peer-reviewed scientific journal, such as Sleep. This article will concentrate on the primary objectives

- 30 -
and findings of the project, which may allow a shorter article to be prepared for another journal, focusing on the secondary objectives. In addition, we anticipate that findings of this study will be presented at two conferences in 2006. The European Sleep Research Society (ESRS) conference, to be held in Innsbruck, Austria in September 2006, and the Australasian Sleep Association (ASA) conference, to be held in Perth, WA in October 2006. All publications and conference presentations will gratefully acknowledge the financial support of the ATSB, and copies of all publications will be forwarded to the ATSB.

- 31 -
6 REFERENCES
[1] Horne, J.A. & Reyner, L.A. Sleep related vehicle accidents. British Medical Journal, 1995; 310: 565-567.
[2] Dobbie, K. Fatigue related crashes: An analysis of fatigue related crashes on Australian roads using an operational definition of fatigue, Australian Transport Safety Bureau; 2002: 30.
[3] Philip, P, Sagaspe, P, Moore, N, et al. Fatigue, sleep restriction and driving performance. Acc Anal Prev 2005; 37:473-478
[4] Arnedt, J.T, Geddes, A.C. & MacLean, A.W. Comparative sensitivity of a simulated driving task on self-report, physiological, and other performance measures during prolonged wakefulness. J Psych Res 2005; 58:61-71.
[5] Philip, P., Vervialle, F., Le Breton, P., Taillard, T. & Horne, J.A. Fatigue, alcohol, and serious road crashes in France: factorial study of national data. British Medical Journal, 2001; 322: 829-30.
[6] Dawson, D. & Reid, K. Fatigue, alcohol and performance impairment. Nature, 1997; 388(6639): 235.
[7] Williamson, A.M. & Feyer, A-M., Moderate sleep deprivation produces impairments in cognitive and motor performance equivalent to legally prescribed levels of alcohol intoxication. Occupational and Environmental Medicine, 2000; Vol. 57 (10), 649-655.
[8] Fletcher, A., Lamond, N., van den Heuvel, C. & Dawson, D. Prediction of performance during sleep deprivation and alcohol intoxication by a quantitative model of work-related fatigue. Sleep Research Online, 2003; 5(2): 67-75.
[9] Austroads Guidelines. Assessing fitness to drive for commercial and private vehicle drivers. Third Edition, September 2003 ISBN 0 85588 507 6.
[10] George, C.F., Findley, L.J., Hack, M.A. & McEvoy, R.D. Across-country viewpoints on sleepiness during driving. Am J Respir Crit Care Med. 2002; 165(6): 746-9.
[11] McCulloch, K., Sletten, T., Baker, A. & Dawson, D. The management of workplace fatigue. Safety Australia Magazine, 2002; 8-13.
[12] Dawson, D. & Fletcher, A. A quantitative model of work-related fatigue: background and definition. Ergonomics, 2001; 44(2): 144-63.
[13] Fletcher, A. & Dawson, D. A quantitative model of work-related fatigue: empirical evaluations. Ergonomics, 2001; 44(5): 475-88.
[14] Dorrian, J, Rogers, NL, Dinges, DF. Psychomotor vigilance performance: a neurocognitive assay sensitive to sleep loss. In: Kushida C, ed. Sleep Deprivation: Clinical Issues, Pharmacology and Sleep Loss Effects. New York: Marcel Dekker, Inc; 2005:39-70.
[15] Dinges, D.F. & Powell, J.W. Microcomputer analyses of performance on a portable, simple visual RT task during sustained operations. Behavioral Research Methods, Instruments and Computers, 1985; 22(1): 69-78.
[16] Dinges, D.F., Pack, F., Williams, K. et al. Cumulative sleepiness, mood disturbance and psychomotor vigilance performance decrements during a week of sleep restricted to 4-5 hours per night. Sleep, 1997; 20(4): 267-77.
- 32 -
[17] Jewett, M.E., Dijk, D.J., Kronauer, R.E. & Dinges, D.F. Dose-response relationship between sleep duration and human psychomotor vigilance and subjective alertness. Sleep, 1999; 22(2): 171-179.
[18] Rosekind, M.R., Graeber, R.C., Dinges, D.F. et al. Crew factors in flight operations IV: Effects of planned cockpit rest on crew performance and alertness in long-haul operations. NASA technical memorandum 1994; Ames Research Center, California.
[19] Kribbs, N.B. & Dinges, D.F. Vigilance decrement and sleepiness. In: Harsh, J.R. & Ogilvie, R.D. (Eds.) Sleep onset mechanisms. Washington DC: American Psychological Association, 1994: 113-125.
[20] van Dongen, H.P., Maislin, G., Mullington, J.M. & Dinges, D.F. The cumulative cost of additional wakefulness: Dose-response effects on neurobehavioural functions and sleep physiology from chronic sleep restriction and total sleep deprivation. Sleep, 2003; 26(2): 117-26.
[21] Roach, G.D., Dorrian, J., Fletcher, A. & Dawson, D. Comparing the effects of fatigue and alcohol consumption on locomotive engineer's performance in a rail simulator. Journal of Human Ergology, 2001; 30(1-2): 125-30.
[22] Kecklund, G. & Åkerstedt, T. Sleepiness in long distance truck driving: an ambulatory EEG study of night driving. Ergonomics, 1993; 36(9): 1007-17.
[23] Horne, J.A. & Baulk, S.D. Awareness of Sleepiness while driving. Psychophysiology, 2004; 41: 161-65.
[24] Reyner, L.A. & Horne, J.A. Falling asleep at the wheel: are drivers aware of prior sleepiness? Int J Leg Med, 1998; 111: 120-123.
[25] Reyner, L.A., Flatley, D. & Horne, J.A. Sleep-related vehicle accidents on sections of selected trunk roads and motorways in the UK (1995-1998). Road Safety Research Report No. 22, 2001; Department for Transport, Local Government and the Regions: London.
[26] Åkerstedt, T. & Kecklund, G. Age, gender and early morning highway accidents. Journal of Sleep Research, 2001; 10: 105-110.
[27] DeJoy, D.M. An examination of gender differences in traffic accident risk perception. Accid Anal Prev, 1992; 24(3): 237-246.
[28] Glendon, A.I., Dorn, L., et al. Age and Gender differences in perceived accident likelihood and driver competences. Risk Anal, 1996; 16(6): 755-62.
[29] Banks, S., Catcheside, P., Lack, L. Grunstein, R.R. & McEvoy, R.D. Low levels of alcohol impair driving simulator performance and reduce perception of crash risk in partially sleep deprived subjects. Sleep, 2004; 24(4), 1063-1067.
[30] Wilkinson, R.T. Disturbance of sleep by noise: Individual differences. Journal of Sound and Vibration, 1984; 95(1): 55-63.
[31] Pankhurst, F.P. & Horne, J.A. The influence of bed partners on movement during sleep. Sleep, 1994; 17(4): 308-315.
[32] Campbell, S.S., Gillin, J.C., Kripke, D.F. et al. Gender differences in the circadian temperature rhythms of healthy elderly subjects: Relationships to sleep quality. Sleep, 1989; 12(6): 529-536.
[33] Armitage, R., Smith, C., Thompson, S. & Hoffmann, R. Sex differences in slow-wave activity in response to sleep deprivation. Sleep Research Online, 2001; 4(1): 33-41.
- 33 -
[34] Baulk, S.D., Reyner, L.A. & Horne, J.A. Gender differences in afternoon driver sleepiness. Int Med Journal, 34: abstract supplement.
[35] Åkerstedt, T. & Gillberg, M. Subjective and objective sleepiness in the active individual. Int Journal Neuroscience, 1990; 52: 29-37.
[36] Heyward, V.H. & Stolarczyk, L.M. Applied body composition assessment. Leeds: Human Kinetics, 1996.
[37] Horne, J.A., Pankhurst, F.L., Reyner, L.A. et al. A field study of sleep disturbance: effects of aircraft noise and other factors on 5742 nights of actimetrically monitored sleep in a large subject sample. Sleep, 1994; 17: 146-159.
[38] Buysse, D.J., Reynolds, C.F.3rd, Monk, T.H. et al. The Pittsburgh sleep quality index: a new instrument for psychiatric practice and research. Psychiat Res, 1989; 28:193-213.
[39] Johns, M.W. A new method for measuring daytime sleepiness: The Epworth Sleepiness Scale. Sleep, 1991; 14(6): 540-546.
[40] Carpenter, J.S. & Andrykowski, M.A. Psychometric evaluation of the Pittsburgh sleep quality index. J Psychosom Res, 1998; 45: 5-13.
[41] Johns, M.W. Reliability and factor analysis of the Epworth Sleepiness Scale. Sleep, 1992; 15(4): 376-381.
[42] Lee, H.C., Cameron, D. & Lee, A.H. Assessing the driving performance of older adult drivers: on-road versus simulated driving. Accident Analysis and Prevention, 2003; 35:797-803.
[43] Tabachnick, BG, Fidell, LS. Using multivariate statistics. Third Ed. New York: Harper Collins; 1996.
[44] Bland, J.M. & Altman, D.G. Statistical methods for assessing agreement between two methods of clinical measurement. The Lancet, 1986; i. 307-310.
[45] Bland, J.M. & Altman, D.G. Comparing methods of measurement: why plotting difference against standard method is misleading. The Lancet, 1995; 346, 1085-1087.
[46] Philip, P., Taillard, J., Klein, E., Sagaspe, P., Charles, A., Davies, W., Guilleminault, C. & Bioulac, B. Effect of fatigue on performance measured by a driving simulator in automobile drivers. Journal of Psychosomatic Research, 2003; 55, 197-200.
[47] Zee, P.C. & Turek, F.W. Introduction to sleep and circadian rhythms. In F.W. Turek & P.C. Zee (Eds.) Regulation of Sleep and Circadian Rhythms, 1999; 1-17. New York: Marcel Dekker, Inc.
[48] Otmani, S., Pebayle, T., Roge, J. & Muzet, A. Effect of driving duration and partial sleep deprivation on subsequent alertness and performance of car drivers. Physiology and Behavior, 2005; 84(5), 715-724.

- 34 -
APPENDIX A GENERAL HEALTH QUESTIONNAIRE (GHQ)
MANAGING DRIVER FATIGUE: QUANTIFYING REAL WORLD PERFORMANCE IMPAIRMENT
Centre for Sleep Research, Division of Education Arts and Social Sciences, University of South Australia
GENERAL HEALTH & BACKGROUND INFORMATION QUESTIONNAIRE
Section One: GENERAL
Name: ………............................Date: …..........…………… Subject No: ………..........
All of the information you give is completely confidential.
Address: ............................................................................................…………………………
Phone / Mobile: ............................................................................................…………………………
Email: ............................................................................................…………………………
Age: ............................................................................................…………………………
Gender: ............................................................................................…………………………
Weight: ............................................................................................…………………………
Height: ............................................................................................…………………………
Occupation: ............................................................................................…………………………
1. How old are you? ........….yrs
2. What is your body weight and height? .........….kg .......….m
3. Have you travelled through time zones in the last 3 months? YES / NO
Details ……………….……………………………………………………………..
4. Are you, or have you ever been involved in shift work? YES / NO
If so, how long ago? ........….yrs

- 35 -
For how long ? ........….yrs ........….mo
5. Please list the average amount of caffeine you consume per day.
(e.g. cups of tea/coffee, cans of caffeinated soft drink and chocolate bars).
……..………...........................................................................................................
6. Do you smoke ? YES / NO
If so, how much ? .....…./day
Section Two: SLEEP
7. What time do you normally wake up ? .........….(wk) …........(wkend)
8. What time do you normally go to sleep ? .........….(wk) ..…..….(wkend)
9. Do you normally nap during the day ? YES / NO
10. How well do you usually sleep ?
very poorly very well
1 2 3 4 5
Section Three: GENERAL HEALTH
11. Have you had any serious accidents, head injuries, or concussion? YES / NO
12. Are you currently on any medication? YES / NO
If yes please give details ………………………………………….
13. Have you been on any medication in the past week? YES / NO
If so, what medication? .........……………………………………………………...
14. What exercise do you do? ……………………..……………………………………………………………….
15. How much exercise do you do, on average per week? .........….hours
16. How much alcohol, on average, do you drink each week
……..beer/cider …...…spirits

- 36 -
17. Have you ever experienced any of the following medical conditions, and if so, when ?
No = 1 Yes in the past = 2 Yes, sometimes = 3 Yes, at present = 4 Don’t know = 0
(a) Asthma .......… (b) Hay fever ..........
(c) Eczema .......... (d) Allergies ..........
(e) Thyroid Problems .......... (f) Undue anxiety ..........
(g) Sleepwalking .......... (h) Loud snoring ..........
(I) Nightmares .......... (j) Teeth grinding while asleep ..........
(k) Difficulty reading/writing .......... (l) Arthritis/Rheumatism ..........
(m) Depression .......... (n) Heart problems ..........
(o) Stomach problems .......... (p) Waking with a jolt ..........
(q) Waking up excessively early .......... (r) Difficulty falling asleep ..........
(s) Stress/anxiety at home/work .......... (t) Epilepsy ..........
(u) Migraine .......... (v) Colour blindness ..........
18. How many times per night do you wake up on average ?
Never Hardly Ever 1 or 2 < 5 5-10 > 10 Don’t Know
Thank you, that is the end of the questionnaire.
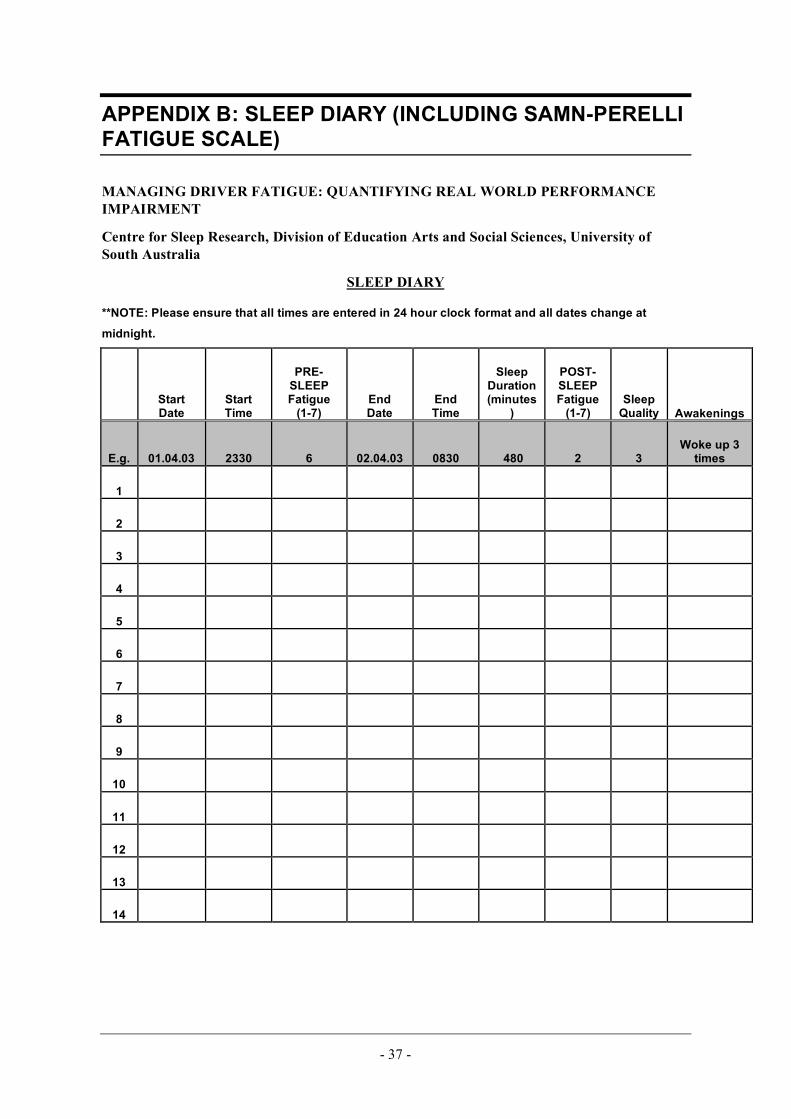
- 37 -
APPENDIX B: SLEEP DIARY (INCLUDING SAMN-PERELLI FATIGUE SCALE)
MANAGING DRIVER FATIGUE: QUANTIFYING REAL WORLD PERFORMANCE IMPAIRMENT
Centre for Sleep Research, Division of Education Arts and Social Sciences, University of South Australia
SLEEP DIARY
**NOTE: Please ensure that all times are entered in 24 hour clock format and all dates change at
midnight.
Start Date
Start Time
PRE-SLEEP Fatigue
(1-7) End Date
End Time
Sleep Duration (minutes
)
POST-SLEEP Fatigue
(1-7) Sleep
Quality Awakenings
E.g. 01.04.03 2330 6 02.04.03 0830 480 2 3 Woke up 3
times
1
2
3
4
5
6
7
8
9
10
11
12
13
14

- 38 -
INSTRUCTIONS
1. Please complete a single line of the diary for each sleep period. 2. Record date and time (be careful to not the correct date) that you go to sleep. 3. Record pre-sleep fatigue level. 4. Record post-sleep fatigue level, and end date nd time for the sleep period. 5. Rate your sleep quality. 6. Record any awakenings.
FATIGUE LEVEL 1. Fully alert, wide awake. 2. Very lively, responsive, but not at peak. 3. Okay, somewhat fresh. 4. A little tired, less than fresh. 5. Moderately tired, let down. 6. Extremely tired, very difficult to concentrate. 7. Completely exhausted, unable to function effectively.
Use the space below if you have any further comments about your sleep.
COMMENTS
…………………………………………………………..…………………………..……………………………
…..…………………………………………………………………………………..……………………………
…..………………………………………………………………………………………………………………..
…..………………………………………………………………………………………………………………..
…..………………………………………………………………………………………………………………..
…..………………………………………………………………………………………………………………..
…..………………………………………………………………………………………………………………..
…..………………………………………………………………………………………………………………..