management’s analysis - otpbank.hu · p/e (trailing, from accounting net earnings) 10.7 9.9 (7)...
TRANSCRIPT

Management’s Analysis

18 OTP Bank Annual Report 2018
1 Structural adjustments made on consolidated IFRS profit and loss statement as well as balance sheet, together with the calculation
methodology of adjusted indicators are detailed in the Supplementary data section of this Report.
* The 2018 consolidated after tax profit less dividend proposal was incorporated into the own funds when calculating the 4Q 2018 consolidated capital adequacy ratios
presented in the management’s analysis.
Main components of the Statement of recognised income 2017 2018 Change
HUF million HUF million %
Consolidated after tax profit 281,339 318,322 13
Adjustments (total) (2,733) (7,013) 157
Consolidated adjusted after tax profit without the effect of adjustments 284,072 325,335 15
Pre-tax profit 321,421 362,734 13
Operating profit 363,159 384,908 6
Total income 804,946 881,726 10
Net interest income 546,654 599,832 10
Net fees and commissions 209,428 220,731 5
Other net non-interest income 48,864 61,163 25
Operating expenses (441,788) (496,818) 12
Total risk costs (45,682) (26,167) (43)
One-off items 3,945 3,993 1
Corporate taxes (37,349) (37,400) 0
Main components of balance sheet closing balances 2017 2018 %
Total assets 13,190,228 14,590,288 11
Total customer loans (net, FX-adjusted) 7,116,207 8,066,592 13
Total customer loans (gross, FX-adjusted) 7,835,162 8,719,342 11
Allowances for possible loan losses (FX-adjusted) (718,955) (652,751) (9)
Total customer deposits (FX-adjusted) 10,436,537 11,285,085 8
Issued securities 250,320 417,966 67
Subordinated loans 76,028 81,429 7
Total shareholders’ equity 1,640,055 1,826,657 11
Indicators based on adjusted earnings 2017 2018 pps
ROE (from accounting net earnings) 18.5% 18.7% 0.2
ROE (from accounting net earnings, on 12.5% CET1 ratio) 22.4% 23.2% 0.8
ROE (from adjusted net earnings) 18.7% 19.1% 0.4
ROA (from adjusted net earnings) 2.4% 2.3% 0.0
Operating profit margin 3.03% 2.76% (0.26)
Total income margin 6.71% 6.33% (0.38)
Net interest margin 4.56% 4.30% (0.25)
Cost-to-asset ratio 3.68% 3.57% (0.12)
Cost/income ratio 54.9% 56.3% 1.5
Provision for impairment on loan and placement losses-to-average gross loans ratio 0.43% 0.23% (0.20)
Total risk cost-to-asset ratio 0.38% 0.19% (0.19)
Effective tax rate 11.6% 10.3% (1.3)
Net loan/(deposit+retail bond) ratio (FX-adjusted) 68% 72% 3
Capital adequacy ratio (consolidated, IFRS) – Basel3 14.6% 18.3% 3.6
Tier1 ratio – Basel3 12.7% 16.5% 3.8
Common Equity Tier1 (’CET1’) ratio – Basel3 12.7% 16.5% 3.8
Share Data 2017 2018 %
EPS diluted (HUF) (from unadjusted net earnings) 1,074 1,215 13
EPS diluted (HUF) (from adjusted net earnings) 1,085 1,242 14
Closing price (HUF) 10,720 11,290 5
Highest closing price (HUF) 10,930 11,850 8
Lowest closing price (HUF) 7,815 9,600 23
Market Capitalization (EUR billion) 9.7 9.8 2
Book Value Per Share (HUF) 5,857 6,524 11
Tangible Book Value Per Share (HUF) 5,219 5,921 13
Price/Book Value 1.8 1.7 (5)
Price/Tangible Book Value 2.1 1.9 (7)
P/E (trailing, from accounting net earnings) 10.7 9.9 (7)
P/E (trailing, from adjusted net earnings) 10.6 9.7 (8)
Average daily turnover (EUR million) 15 18 20
Average daily turnover (million share) 0.5 0.5 0
Management’s analysis of the
2018 results of the OTP Group
C O N S O L I D AT E D F I N A N C I A L H I G H L I G H T S 1
A N D S H A R E D ATA

19
Out of the last few decades in 2018 the Hungarian
economy had its most successful year. Apart
from absolute figures turning to be impressive
– according to the preliminary crude data pub-
lished on 14 February 2019 the full year expan-
sion was 4.8%, the fiscal deficit remained well
below the originally targeted 2% level, public
debt to GDP dropped below 71% –, the whole
economy became structurally healthier with the
growth being shaped mainly by local consump-
tion and dynamically expanding investments.
The average inflation was 2.8% in 2018, however
the core inflation excluding indirect taxes, an
indicator closely watched by the Central Bank
came close to 3% by the end of the year.
In 2018 both the Hungarian Forint and local
government yields demonstrated significant
volatility, however in the second half of the year
the HUF gained strength and yields tightened.
The all-time low unemployment rate (October–
December: 3.6%) coupled with dynamic wage
increase resulted in a robust increase of
household lending activity: as for the local
banking sector newly originated retail volumes
surged by 37.5% y-o-y as a result outstanding
volumes increased by 6.7%, respectively (within
that housing loan volumes grew by 10%, cash
loan portfolio by 37.4%, whereas home equity
exposure dropped by 12.9% y-o-y). Corporate
loan volumes advanced by 14.8% y-o-y.
The Government and the Central Bank assisted
upholding the dynamic lending activity, as
well as containing the interest rate exposure
of clients through targeted measures. Within
the macroprudential policy toolset of NBH
the modification of the so-called debt break
(payment to income ratio) rules effective from
October 2018 encouraged clients to shift to
longer interest rate fixation periods while
underwriting mortgages. As a result, by the end
of 2018 the weight of fixed rate mortgages with
a fixing period of one year and beyond exceeded
90% within the new flow on a sector level. With
a specific objective to raise the proportion of
long-term, fixed-rate lending to SMEs, on
18 September 2018 NBH announced its Funding
for Growth Scheme Fix with a total amount of
HUF 1,000 billion available from January 2019
under preferential rates for the sector.
Amid the supportive macroeconomic
environment the volume of non-performing
exposures, as well as their ratio dropped
significantly.
As a result of the favourable developments in
February 2019 both S&P and Fitch upgraded
the Hungarian sovereign rating (to ’BBB’ in both
cases with stable outlook).
With regard to the Group, all national economies
within OTP universe enjoyed GDP growth
and favourable macroeconomic conditions.
MOODY’S RATINGS
OTP Bank
FX long-term deposits Baa3
OTP Mortgage Bank
Covered mortgage bond Baa1
S&P GLOBAL RATINGS
OTP Bank and OTP Mortgage Bank
FX Long-term credit rating BBB–
DAGONG GLOBAL RATING
OTP Bank
FX long-term credit rating BBB+
FITCH’S RATING
OTP Bank Russia
Long-term credit rating BB
Management’s analysis of the 2018 results of the OTP Group
4,000
5,000
6,000
7,000
8,000
9,000
10,000
11,000
12,000
31.12.2015 30.06.2016 31.12.2016 30.06.2017 31.12.2017 30.06.2018 31.12.2018
CECE Banking Sector Index
(relative to OTP)
(relative to OTP)Bloomberg EMEA Banks Index
OTP
Share price performance
M A N A G E M E N T ’ S A N A LYS I S O F T H E
F U L L-Y E A R 2 0 1 8 R E S U LT S O F O T P G R O U P

20 OTP Bank Annual Report 2018
Positive developments were rewarded by
rating upgrades in several cases (Bulgaria,
Serbia, Croatia, Ukraine, and Russia). At the
same time the Ukrainian and Romanian central
banks had to hike rates during the course of
the year in order to curb inflation and fiscal
overheatedness; the Central Bank of Russia
also tightened monetary conditions in 2H 2018.
The Ukrainian hrivnya and the Russian ruble
suffering from significant volatility during the
last few years on a yearly average weakened by
3.6 and 8.2% y-o-y against HUF in 2018.
Consolidated earnings:
HUF 325.3 billion (above EUR 1 billion)
adjusted after tax profit in 2018,
robust business activity and volume
expansion, moderate erosion of
NIM, further declining risk costs and
steadily improving portfolio quality
OTP Group posted all-time high accounting
and adjusted profit in 2018 shaped by a couple
of factors: on the back of the favourable macro-
economic performance of the region business
activity got further boost, as a result FX-adjusted
performing loan volumes expanded by 15% y-o-y,
an outstanding dynamics even in European
context. Furthermore, credit quality improved
further coupled with lower or in certain cases
even with positive annual risk costs. Higher
core banking revenues realized on increasing
performing portfolio could easily offset the
negative impact of eroding margins induced by
the stubbornly low interest rate environment,
tighter regulatory requirements and intensifying
competition. Also, bottom line earnings got
a meaningful lift from incorporating the full
year profit in case of the Croatian and Serbian
operations. Recall: in the base period only
eight months profit from Splitska banka and
one month profit from Vojvodjanska banka
supported the Group’s earnings.
In 2018 OTP Bank continued its regional
acquisition activity: in August it announced
the purchase of Sociéte Generale’s Bulgarian
and Albanian operations, followed by the
Serbian operation in December. The Bulgarian
transaction was completed on 15 January,
while the Albanian and Serbian transactions are
expected to be settled in 1H 2019. Accordingly,
2018 financial statements include neither the
balance sheet, nor the profit or loss statement
of any of those individual entities.
The full year consolidated accounting profit was
HUF 318.3 billion versus HUF 281.3 billion in the
base period.
The accounting ROE for 2018 stood at 18.7%
(+0.2 pp y-o-y), whereas the adjusted ROA
(2.3%) remained practically unchanged y-o-y.
During the course of the year total adjustment
items comprised –HUF 7 billion (after tax), the
below items should be mentioned:
• +HUF 18.8 billion (after tax) gain was realized
on MIRS (Monetary Policy Interest Rate Swap)
facilities.
Background: according to the decision by the
Monetary Council (MC) of the National Bank
of Hungary on 21 November 2017 the MC
introduced an unconditional interest rate swap
(IRS) facility, with 5 and 10 years maturity, and
set the allocated amount at HUF 300 billion
for the first quarter of 2018. Counterparty
banks could access the IRS facility on regular
tenders from the beginning of January 2018.
In line with the fine-tuning of the unconven-
tional policy instruments affecting long-term
yields, on 18 September 2018 MC decided
on phasing out the monetary policy IRS
facilities by the end of 2018. The Council set
the annual maximum volume of monetary
policy IRS for 2018 at HUF 1,100 billion.
Until November 2018 – in coordination with
the auditor – the initial positive net present
value (NPV) gained on MIRS deals was accrued
for the whole maturity of MIRS transactions
within the net interest income. In December
2018 NBH published guidelines on its website
(https://www.mnb.hu/letoltes/mirs.pdf),
according to which those swap facilities
were unconditional, therefore in NBH’s
opinion there was no such binding criteria
within the conditions that would require the
accrual of NPVs.
Taking into consideration the NBH’s guide-
lines, OTP Bank – with the consent of the
auditor – decided to book the total initial
positive NPVs in one lump sum within its P&L.
As a result, in the adjusted P&L structure
the total HUF 20.7 billion (before tax) gain
realized in 2018 as a whole was presented

21
in 4Q 2018 within adjustment items on
the Initial NPV gain on the monetary policy
interest rate swap (MIRS) deals line.
The reported adjusted net interest income
for the first three quarters of 2018 contained
the accrued gains related to MIRS for that
periods, whereas in 4Q 2018 that cumulated
amount was recognized with a negative sign
within net interest income in the adjusted
income statement. Since the first nine
months accrued gain was not material,
it didn’t have a substantial impact on the
quarterly development in the adjusted net
interest income of OTP Core;
• in 2018 the banking taxes paid by Group
members resulted in an after tax negative
impact of HUF 15.3 billion, including the
Hungarian special tax of financial institutions
and the Slovakian banking levy;
• –HUF 4.7 billion (after tax) tax shield related
partly to the recognition or reversal of
impairment charges booked in relation to
investments in certain subsidiaries; also
there was goodwill write-off;
• –HUF 6.8 billion effect of acquisitions;
• +HUF 0.6 billion related to the revision of the
fine imposed by the Hungarian Competition
Authority (GVH) back in 2013. In 2016 the
Hungarian Supreme Court obliged GVH
to conduct a new process, as a result GVH
set a lower fine for OTP Bank in August 2018
(HUF 1.435 billion). Simultaneously, OTP Bank
released provision set aside earlier for that
purpose.
2018 income statement already incorporated
the full-year profit contribution by both Splitska
banka and Vojvodjanska banka. The integration
of Splitska banka (the legal merge and IT
integration) was completed in December 2018.
In 2018 OTP Group posted HUF 325.3 billion
adjusted after tax profit (+15% y-o-y). The
effective tax rate declined by 1.3 pps to 10.3%.
The before tax profit grew by 13% compared to
the base year.
Within the annual profit – given their individual
weight – profit contribution from OTP Core
(HUF 180 billion), DSK Bank (HUF 47.3 billion),
the Croatian operation (HUF 25 billion), the
Ukrainian (HUF 24.4 billion) and Russian
subsidiaries (HUF 16.4 billion) was the most
meaningful. Out of those banks only the Russian
subsidiary suffered a y-o-y profit decline, while
others enjoyed their profits improving y-o-y, of
which Ukraine was the ultimate winner (+73%
Management’s analysis of the 2018 results of the OTP Group

22 OTP Bank Annual Report 2018
y-o-y, annual ROE: 56%). Regarding the Russian
performance one should note that the loss-
making Touch Bank was shown as a separate
entity in 2017, however, starting from 2018, it
was presented as part of the Russian operation.
So, including Touch Bank’s result in the base
period, too, the Russian operation suffered a
y-o-y 13% profit decline in RUB terms.
As for other subsidiaries, the Leasing segment
posted again a decent profit (HUF 9.9. billion),
whereas the weaker net earnings at OTP Fund
Management were reasoned by the lower
success fee. The Romanian, Serbian and
Montenegrin subsidiaries posted a significant
profit improvement y-o-y, whereas the
Slovakian subsidiary realized a marginal profit
against a loss in 2017.
As a result, the 2018 profit contribution
of foreign subsidiaries increased from 35%
to 38% y-o-y.
Annual total income of OTP Group increased
dynamically (+10% y-o-y, +6% without
acquisition effect2). The annual operating profit
improved by 6% y-o-y, whereas total risk costs
dropped by 43%.
It was positive that despite the continuing
margin erosion and intensifying competition the
annual net interest income advanced by 10%
y-o-y (without acquisitions by 6%) due to the
higher volumes of performing loans. The net fee
and commission income grew by 5% compared
to 2017 (+2% without acquisitions), the pace of
its increase fell short of the business volume
expansion and the reasons were mainly related
to the Hungarian operation: on one hand the
distribution fees on certain household targeted
government bonds were reduced in several
steps by the Government Debt Management
Agency, also, the fee income at OTP Fund
Management dropped a lot y-o-y as a result of
lower success fees.
Other net non-interest income advanced by
HUF 12.3 billion (+25% y-o-y) induced partially
by the consolidation of full year contribution
from Splitska and Vojvodjanska banka.
Also, FX-gains supported this line in a meaning-
ful way.
The consolidated net interest margin was
shaped by several factors: the prevailing low
interest rate environment, intensifying com-
petition, the composition effect through lower
margins at Splitska and Vojvodjanska banka,
as well as the y-o-y 8% devaluation of RUB
against HUF. Still, the margin erosion of the
2018 annual NIM (4.30%) was only 7 pps
compared to the 4Q 2017 level, i.e. lower what
the management guided (”10–15 bps margin
erosion compared to 4Q 2017 NIM of 4.38%”).
Consolidated operating expenses grew by 12%
nominally y-o-y, adjusted for the acquisition
impact of Splitska and Vojvodjanska banka the
increase would be 8.2% y-o-y on an FX-adjusted
basis. Despite all cost elements increased,
personnel expenses grew the most (+17% y-o-y,
without acquisitions +12%) reflecting the 10% or
above wage inflation in most of the countries.
Furthermore, in December 2018 a non-recurring
one-off bonus amounting to one month base
salary was paid to non-managerial employees
at Hungarian Group members. This was
partially offset by the 2.5 pps reduction of
social and health care contributions to be paid
by employers effective from January 2018.
Amortization costs increased at a lower rate
by 4% y-o-y. Administrative expenses grew by
10% y-o-y (without acquisitions +3%) induced
partially by higher general banking expenses
(rental fees, post and telecom expenses), higher
regulatory contributions and also by growing
digital transformation expenses. The annual
FX-adjusted growth of operating expenses
adjusted for acquisition and the one-off
Hungarian bonus payment would be 6.8%.
In 2018 the consolidated FX-adjusted per-
forming loan volumes surged by 15%, more
than HUF 1,000 billion y-o-y. It was positive that
all Group members and all credit segments
posted volume increase. Out of the individual
performances OTP Core (+18%), Serbia (+31%),
Ukraine (+30%), Russia (+30%) and Bulgaria
(+11%) demonstrated excellent y-o-y growth
dynamics, but smaller operations like the
Montenegrin or Romanian ones, as well as
Merkantil Bank also excelled themselves.
As for the major credit segments the biggest
volume increase was posted in the large
corporate segment (+20% y-o-y) followed by
the SME and consumer loan segment (+18%
2 In early December 2018 Splitska banka d.d. merged into OTP banka Hrvatska dd., thus separate financial statements for Splitska
banka d.d. are not available for December. Therefore, profit dynamics without acquisitions are based on estimated numbers.

23
and +14%, respectively), but the performing
mortgage volumes growth of 6% y-o-y was
remarkable, too.
The FX-adjusted deposit portfolio increase was
less robust in 2018 (+8% y-o-y). As a result, the
net loan/(deposit + retail bonds) ratio increased
by 3 pps y-o-y to 72%.
At the end of 2018 the Group’ gross liquidity
reserves comprised EUR 7.8 billion equivalent.
In line with the supportive macroeconomic
environment, as well as the improving efficiency
of collection, the trend of the DPD90+ volume
increase (adjusted for FX and the effect of
sales and write-offs) remained favourable:
accordingly, in 2018 DPD90+ volumes grew only
by HUF 24 billion versus an increase of HUF
51 billion in the base period. The DPD90+ ratio
dropped to 6.3% (–2.9 pps y-o-y), resembling
already pre-crisis levels. The DPD90+ volume
decline was supported by sales and write-offs
reaching HUF 176 billion in 2018. In Hungary the
DPD90+ ratio dropped to 4.5% (–1.9 pps y-o-y).
The consolidated risk cost rate was 0.23%
versus 0.43% in the base period.
According to IFRS 9 the volume of Stage 3
exposure at the end of 2018 comprised 8.6%
of gross loans. Stage 2 exposures represented
6.8% of gross loans.
Consolidated capital adequacy ratio
(in accordance with BASEL III)
By the end of December 2018 the consolidated
Common Equity Tier1 ratio under IFRS was
16.5% including the unaudited interim profit
and deducting the indicated annual dividend
amount.
Credit rating, shareholder structure
The Hungarian sovereign rating remained
unchanged in 2018, as a result there was
practically no change in the existing credit
ratings of OTP Bank and OTP Mortgage Bank.
Accordingly, OTP Bank’s long-term foreign-
currency deposit rating is ’Baa3’ by Moody’s
with stable outlook. OTP Mortgage Bank’s
HUF issuer rating by Moody’s was ’Baa3’ with
stable outlook and their covered bond carried a
rating of ’Baa1’. Since Moody’s introduced a new
rating category, according to its announcement
of 18 June 2018, both OTP Bank Plc. and
OTP Mortgage Bank Ltd. were assigned a ’Baa1’
long-term counterparty risk rating. According
to S&P Global OTP Bank an OTP Mortgage Bank
had a rating of ’BBB–’ the outlook was stable.
S&P Global’s resolution counterparty rating
(RCR) for both entities are ’BBB’. From Dagong
Global OTP Bank has a ’BBB+’ rating, the
outlook is stable. OTP Bank Russia has a ’BB’
rating by Fitch, the outlook is stable.
Regarding the ownership structure of the Bank,
by 31 December 2018 the following investors
had more than 5% influence (voting rights) in
the Company: MOL (the Hungarian Oil and Gas
Company, 8.64%), the Kafijat Ltd. (7.49%), OPUS
Securities SA (5.22%) and Groupama Group
(5.16%).
Management’s analysis of the 2018 results of the OTP Group
P O S T B A L A N C E S H E E T E V E N T S
Hungary
• The National Bank of Hungary announced
on 11 January 2019 that it has revised the
Mortgage Funding Adequacy Ratio (MFAR)
regulation. According to the amendments
– among others –, the required MFAR level
will be raised from 20% to 25% effective from
1 October 2019; additionally, the required
minimum maturity of accepted funds will
be increased to 3 years, and the quality
requirements of eligible mortgage bonds
will be strengthened.
• Mr. Mihály Varga, Minister of Finance,
said on a press conference on 11 January
2019 that in order to boost the economic
activity, the government is open to make
a proposal to abolish the financial trans-
action tax in the case of retail money
transfers.

24 OTP Bank Annual Report 2018
• Mr. Márton Nagy, Deputy Governor of the
National Bank of Hungary stressed on a
conference in Vienna on 16 January 2019
that if the yearly core inflation excluding
indirect tax effects was to reach or exceed
the 3% threshold, that would be taken by the
central bank as an adequate evidence that
the start of the monetary policy tightening is
justified.
• On 5 February 2019 OTP Bank signed an
acquisition agreement on purchasing 87.85%
shareholding of Mobiasbanca – Groupe Societe
Generale S.A., the Moldovan subsidiary of
Societe Generale Group. The financial closure
of the transaction is expected in the coming
months subject to obtaining all the necessary
regulatory approvals.
• In his state-of-the-nation speech held on
10 February 2019, Prime Minister Viktor
Orbán announced a demography programme
to support families and improve birth rates
in Hungary. The seven-point programme
will start on 1 July 2019; its detailed rules
are yet to be seen. The most important
actions of the family protection plan are
as follows, based on the Prime Minister’s
announcement:
• An allowance is being designed to
encourage young married couples to have
children. Every woman under the age of
forty who marries for the first time will
be eligible for a zero interest rate loan of
HUF 10 million to start their new lives.
After the birth of a child the repayment of
the loan will be suspended for three years.
After the arrival of the second child, the
loan will be suspended for another three
years, and one-third of the principal debt
will be written off. When the third child is
born, the remaining part of the loan will be
completely cancelled.
• The subsidized loan provided under the
CSOK (Housing Subsidy for Families)
scheme will be extended. Currently, fami-
lies with two or three children are entitled
for subsidized housing loans amounting to
HUF 10 million and 15 million, respectively,
for purchasing new homes. In the future
families with two or more children will also
be allowed to use the subsidized loan for
the purchase of existing properties.
• So far, the government has assumed
HUF 1 million from the mortgage loans of
large families upon the birth of the third
and every further child thereafter. This
option will be extended: the government
will assume HUF 1 million upon the birth
of the second child already; it will assume
HUF 4 million when the third child is born,
and additional HUF 1 million will be
assumed upon the birth of each further
child.
• Women who have given birth to and raised
at least four children will be exempt from
the payment of personal income tax for the
rest of their lives.
• A car purchase programme was announced
for large families (who raise at least three
children), in form of a non-repayable grant
of HUF 2.5 million for the purchase of new
cars with at least seven seats.
• The Hungarian Statistical Office announced
on 14 February 2019 that Hungary’s GDP
grew by 5% y-o-y in Q4 2018. The seasonally
and calendar-adjusted figure was 4.8%.
The related statement of Mihály Varga,
Minister of Finance, noted: in order to
preserve Hungary’s robust growth rates and
to ensure that it exceeds the EU average
by at least 2% in a persistent manner, the
government supports the improvement of
Hungary’s competitiveness and it will design
an economic policy action plan.
• On 15 February 2019 S&P Global Ratings
upgraded the credit rating of Hungary by one
notch, from ’BBB–’ to ’BBB’. The outlook is
stable.
• On 19 February 2019 S&P Global Ratings
raised its long and short-term resolution
counterparty ratings (RCR) on OTP Bank Plc.
and OTP Mortgage Bank Ltd. to ’BBB/A–2’
from ’BBB–/A–3’; while the ’BBB–/A–3’ long-
and short-term issuer credit ratings (ICRs)
on both banks were affirmed. The outlooks
remained stable at both banks.
• On 22 February 2019 Fitch Ratings upgraded
the credit rating of Hungary by one notch,
from ’BBB–’ to ’BBB’. The outlook is stable.

25Management’s analysis of the 2018 results of the OTP Group
• On 27 February 2019 the Government and
the National Bank of Hungary announced
a comprehensive set of economic policy
measures aiming at improving the
competitiveness and the long-term growth
potential of the Hungarian economy, while
maintaining the sustainable fiscal policy and
debt trajectory.
• On 28 February 2019 OTP Bank announced
that Crnogorska komercijalna banka a.d., the
Montenegrin subsidiary of OTP Bank signed
an acquisition agreement on purchasing
90.56% shareholding of Societe Generale
banka Montenegro a.d., the Montenegrin
subsidiary of Societe Generale Group.
Bulgaria
• On 7 January 2019 OTP Bank announced
that the Bulgarian Court of Registration regis-
tered a capital increase at DSK Bank EAD,
the Bulgarian subsidiary of OTP Bank. Accor-
dingly, the registered capital of DSK Bank
was increased to BGN 1,327,482,000 from
BGN 153,984,000.
• The financial closure of the transaction
based on the acquisition agreement on
purchasing 99.74% shareholding of Societe
Generale Expressbank (SGEB), the Bulgarian
subsidiary of Societe Generale Group
and other local subsidiaries held by SGEB,
between Societe Generale Group and
DSK Bank, the Bulgarian subsidiary of
OTP Bank, has been completed on 15 January
2019.
Russia
• On 8 February 2019 Moody’s rating agency
raised the Russian sovereign rating back into
investment grade, to ’Baa3’. The outlook is
stable.

26 OTP Bank Annual Report 2018
3 Belonging footnotes are in the Supplementary data section of the Report.
2017 2018 Change
HUF million HUF million %
Consolidated after tax profit 281,339 318,322 13
Adjustments (total) (2,733) (7,168) 162
Consolidated adjusted after tax profit without the effect of adjustments 284,072 325,335 15
Banks total1 265,422 308,831 16
OTP Core (Hungary)2 168,576 180,445 7
Corporate Centre3 194 6,190
DSK Bank (Bulgaria)4 47,122 47,293 0
OTP Bank Russia5 27,771 16,420 (41)
Touch Bank (Russia)6 (7,391)
OBH (Croatia)7 17,105 24,961 46
OTP Bank Ukraine8 14,120 24,415 73
OTP Bank Romania9 3,036 3,850 27
OTP banka Srbija (Serbia)10 (2,904) 2,999 (203)
CKB (Montenegro)11 (155) 2,214
OBS (Slovakia)12 (2,051) 44 (102)
Leasing 9,836 9,827 0
Merkantil Bank + Car, adj. (Hungary)13 8,260 7,437 (10)
Foreign leasing companies (Croatia, Bulgaria, Romania, Serbia)14 1,575 2,391 52
Asset Management 8,677 4,159 (52)
OTP Asset Management (Hungary) 8,259 4,122 (50)
Foreign Asset Management Companies (Ukraine, Romania, Bulgaria)15 418 37 (91)
Other Hungarian Subsidiaries (747) 1,601 (314)
Other Foreign Subsidiaries16 295 388 31
Eliminations 590 528 (10)
Total adjusted after tax profit of HUNGARIAN subsidiaries17 185,132 200,323 8
Total adjusted after tax profit of FOREIGN subsidiaries18 98,940 125,012 26
Share of foreign profit contribution 35% 38% 10
C O N S O L I D AT E D A F T E R TA X P R O F I T
B R E A K D O W N B Y S U B S I D I A R I E S ( I F R S ) 3

27Management’s analysis of the 2018 results of the OTP Group
Main components of the Statement of recognised income 2017 2018 Change
HUF million HUF million %
Consolidated after tax profit 281,339 318,322 13
Adjustments (total) (2,733) (7,013) 157
Dividends and net cash transfers (after tax) 680 457 (33)
Goodwill/investment impairment charges (after tax) (6,064) (4,729) (22)
Special tax on financial institutions (after corporate income tax) (15,233) (15,286) 0
Impact of fines imposed by the Hungarian Competition Authority (after tax) 177 565 220
Effect of acquisitions (after tax) 17,708 (6,844) (139)
Initial NPV gain on the monetary policy interest rate swap (MIRS) deals (after tax) 18,823
Consolidated adjusted after tax profit without the effect of adjustments 284,072 325,335 15
Before tax profit 321,421 362,734 13
Operating profit 363,159 384,908 6
Total income 804,946 881,726 10
Net interest income 546,654 599,832 10
Net fees and commissions 209,428 220,731 5
Other net non-interest income 48,864 61,163 25
Foreign exchange result, net 21,622 33,568 55
Gain/loss on securities, net 7,068 2,461 (65)
Net other non-interest result 20,175 25,134 25
Operating expenses (441,788) (496,818) 12
Personnel expenses (213,599) (249,447) 17
Depreciation (46,482) (48,210) 4
Other expenses (181,707) (199,161) 10
Total risk costs (45,682) (26,167) (43)
Provision for impairment on loan and placement losses (31,058) (19,283) (38)
Other provision (14,624) (6,885) (53)
Total one-off items 3,945 3,993 1
Gain on the repurchase of own Upper and Lower Tier2 Capital 0 0
Result of the treasury share swap agreement at OTP Core 3,945 3,993 1
Corporate taxes (37,349) (37,400) 0
Indicators 2017 2018 %/pps
ROE (from accounting net earnings) 18.5% 18.7% 0.2
ROE (from adjusted net earnings) 18.7% 19.1% 0.4
ROA (from adjusted net earnings) 2.4% 2.3% 0.0
Operating profit margin 3.03% 2.76% (0.26)
Total income margin 6.71% 6.33% (0.38)
Net interest margin 4.56% 4.30% (0.25)
Net fee and commission margin 1.75% 1.58% (0.16)
Net other non-interest income margin 0.41% 0.44% 0.03
Cost-to-asset ratio 3.68% 3.57% (0.12)
Cost/income ratio 54.9% 56.3% 1.5
Provision for impairment on loan and placement losses-to-average gross loans 0.43% 0.23% (0.20)
Total risk cost-to-asset ratio 0.38% 0.19% (0.19)
Effective tax rate 11.6% 10.3% (1.3)
Non-interest income/total income 32% 32% 0
EPS base (HUF) (from unadjusted net earnings) 1,074 1,215 13
EPS diluted (HUF) (from unadjusted net earnings) 1,074 1,215 13
EPS base (HUF) (from adjusted net earnings) 1,085 1,243 14
EPS diluted (HUF) (from adjusted net earnings) 1,085 1,242 14
Comprehensive Income Statement 2017 2018 %
Consolidated after tax profit 281,339 318,322 13Fair value changes of financial instruments measured at fair value
through other comprehensive income15,677 (20,323) (230)
Fair value adjustment of derivative financial instruments
designated as cash-flow hedge0 (9)
Net investment hedge in foreign operations 155 (3,253)
Foreign currency translation difference (20,535) 10,007 (149)
Change of actuarial costs (IAS 19) (241) (65) (73)
Net comprehensive income 276,395 304,679 10
o/w Net comprehensive income attributable to equity holders 276,222 304,813 10
Net comprehensive income attributable to non-controlling interest 173 (134) (177)
Average exchange rate* of the HUF 2017 2018 Change
HUF HUF %
HUF/EUR 309 319 3
HUF/CHF 279 276 (1)
HUF/USD 274 270 (1)
C O N S O L I D AT E D S TAT E M E N T
O F P R O F I T O R L O S S
* Exchange rates presented in the tables of this report should be interpreted as follows: the value of a unit of the other currency expressed in Hungarian forint terms, i.e.
HUF/EUR represents the HUF equivalent of one EUR.

28 OTP Bank Annual Report 2018
A S S E T- L I A B I L I T Y M A N A G E M E N T
Similar to previous periods
OTP Group maintained a strong
and safe liquidity position…
The primary objective of OTP Group in terms of
asset-liability management has not changed,
that is to ensure that the Group’s liquidity is
maintained at a safe level.
Refinancing sources of the European Central
Bank are still available for OTP (EUR 163 mil-
lion). As a result of the high level of liquidity
reserves, the Group could safely function
without considerable fund raising (except for
the mortgage bond issuances due to regulatory
requirements).
Total liquidity reserves of OTP Bank remained
steadily and substantially above the safety level.
As of 31 December 2018 the gross liquidity
buffer was around EUR 7.75 billion equivalent.
This buffer is significantly higher than the
maturing debt within one year and the reserves
required to protect against possible liquidity
shocks. Due to governmental FX lending
measures and FX loan conversion FX liquidity
need of the Group has considerably declined.
The maturing long-term FX-swaps were not
refinanced and the ECB refinancing facilities
are currently not utilized and the FX liquidity
reserves are at safe levels (at EUR 709 million
on 31 December 2018).
The volume of issued securities increased by
67% y-o-y, mainly because in order to comply
with the liquidity ratio introduced by the
National Bank of Hungary OTP Group sold
about HUF 220 billion mortgage bonds
(issued by OTP Mortgage Bank) to external
counterparties in 2018, while the amount
of repurchased mortgage bonds amounted
to HUF 52 billion.
On the yearly basis the Hungarian retail bond
portfolio shrank by HUF 2 billion to HUF 5 billion
(–27%).

29Management’s analysis of the 2018 results of the OTP Group
The volume of subordinated debt increased
by 7% y-o-y. On one hand, the HUF value
of the EUR denominated perpetual bond
increased due to the HUF weakening against
the EUR, on the other, the Ukrainian subsidiary
received an USD 17 million subordinated
funding in the second quarter, which matures
in 2025.
…and kept its interest-rate risk
exposures low.
Interest-rate risk exposure of OTP Group is
determined primarily by the positions of OTP
Bank Plc. and OTP Mortgage Bank Ltd. Due
to the forint liabilities on OTP Bank’s balance
sheet, which respond to yield changes only to
a moderate extent, the Bank has an interest-
rate risk exposure resulting from its business
operations. The Bank considers the reduction
and closing of this exposure as a strategic
matter. Consequently, it has been reducing
its interest-rate risk exposure through the
purchase of fixed-rate government securities in
order to offset the negative impact of declining
yields on net interest income.
In 2018 OTP Group concluded monetary policy
interest rate swap deals with NBH in the
amount of HUF 299 billion.
Market Risk Exposure of OTP Group
The consolidated capital requirement of the
trading book positions, the counterparty risk
and the FX risk exposure represented HUF
38.3 billion in total, primarily due to the capital
requirement of the FX risk exposure.
OTP Group is an active participant of the
international FX and derivative market. Open
FX positions of group members are restricted
to individual and global net open position limits
(overnight and intraday), and to stop-loss limits.
The open positions of the group members
outside Hungary except for the Bulgarian DSK
Bank – the EUR/BGN exposure of DSK under
the current exchange rate regime does not
represent real risk – were negligible measured
against either the balance sheet total or the
regulatory capital. Therefore, the group level FX
exposure was concentrated at OTP Bank.
Thus the main part of the FX exposure booked at
OTP Bank – in line with the previous years’ prac-
tice – was the strategic open FX position (EUR
310 million) kept to hedge the currency risk of
the expected FX-denominated net earnings of
the main foreign subsidiaries. The strategic open
position has been kept since 2007, and its size
has been constant at EUR 310 million since 2008.
The revaluation result of the strategic open posi-
tion is accounted for directly against the equity.

30 OTP Bank Annual Report 2018
C O N S O L I D AT E D S TAT E M E N T
O F F I N A N C I A L P O S I T I O N O F O T P G R O U P
Main components of balance sheet 2017 2018 Change
HUF million HUF million %
TOTAL ASSETS 13,190,228 14,590,288 11
Cash, amounts due from Banks and balances with the National Banks 1,198,046 1,547,272 29
Placements with other banks, net of allowance for placement losses 462,180 420,606 (9)
Financial assets at fair value through profit or loss 344,417 181,355 (47)
Securities at fair value through other comprehensive income 2,174,718 1,883,849 (13)
Net customer loans 6,987,834 8,066,592 15
Net customer loans (FX-adjusted*) 7,116,207 8,066,592 13
Gross customer loans 7,690,419 8,719,342 13
Gross customer loans (FX-adjusted*) 7,835,162 8,719,342 11
o/w Retail loans 4,924,781 5,297,735 8
Retail mortgage loans (incl. home equity) 2,496,493 2,568,636 3
Retail consumer loans 1,870,080 2,093,404 12
SME loans 558,209 635,695 14
Corporate loans 2,641,636 3,110,652 18
Loans to medium and large corporates 2,435,223 2,812,763 16
Municipal loans 206,414 297,889 44
Car financing loans 268,586 310,955 16
Bills and accrued interest receivables related to loans 158 0 (100)
Allowances for loan losses (702,585) (652,751) (7)
Associates and other investments 12,269 17,592 43
Securities at amortized costs 1,310,331 1,740,520 33
Tangible and intangible assets, net 413,389 420,484 2
o/w Goodwill, net 100,976 91,766 (9)
Tangible and other intangible assets, net 312,414 328,718 5
Other assets 287,044 312,018 9
TOTAL LIABILITIES AND SHAREHOLDERS’ EQUITY 13,190,228 14,590,288 11
Amounts due to banks, the Hungarian Government,
deposits from the National Banks and other banks472,068 392,706 (17)
Deposits from customers 10,233,471 11,285,085 10
Deposits from customers (FX-adjusted*) 10,436,537 11,285,085 8
o/w Retail deposits 7,414,825 8,244,455 11
Household deposits 6,204,452 6,806,288 10
SME deposits 1,210,372 1,438,168 19
Corporate deposits 3,007,037 3,029,285 1
Deposits to medium and large corporates 2,314,641 2,320,971 0
Municipal deposits 692,397 708,314 2
Accrued interest payable related to customer deposits 14,675 11,344 (23)
Liabilities from issued securities 250,320 417,966 67
o/w Retail bonds 6,500 4,732 (27)
Liabilities from issued securities without retail bonds 243,821 413,235 69
Other liabilities 518,286 586,445 13
Subordinated bonds and loans** 76,028 81,429 7
Total shareholders’ equity 1,640,055 1,826,657 11
Indicators 2017 2018 %/pps
Loan/deposit ratio (FX-adjusted*) 75% 77% 2
Net loan/(deposit + retail bond) ratio (FX-adjusted*) 68% 72% 3
Stage 3 loan volume under IFRS 9 753,033
Stage 3 loans under IFRS 9/gross customer loans 8.6%
Stage 2 loan volume under IFRS 9 591,870
Stage 2 loans under IFRS 9/gross customer loans 6.8%
90+ days past due loan volume 707,211 551,498 (22)
90+ days past due loans/gross customer loans 9.2% 6.3% (2.9)
Total provisions/90+ days past due loans 99.3% 118.4% 19.0
* For the FX adjustment, the closing cross currency rates for the current period were used to calculate the HUF equivalent of loan and deposit volumes in the base periods.
** The ICES bonds are considered as Tier2 debt, but accounting-wise they are treated as part of the shareholders’ equity.

31Management’s analysis of the 2018 results of the OTP Group
Consolidated capital adequacy – Basel3 2017 2018 %/pps
Capital adequacy ratio (consolidated, IFRS) 14.6% 18.3% 3.6
Tier1 ratio 12.7% 16.5% 3.8
Common Equity Tier1 (CET1) capital ratio 12.7% 16.5% 3.8
Regulatory capital (consolidated) 1,228,628 1,731,970 41
o/w Tier1 Capital 1,062,701 1,565,247 47
o/w Common Equity Tier1 capital 1,062,701 1,565,247 47
Tier2 Capital 165,927 166,723 0
o/w Hybrid Tier2 89,935 89,935 0
Consolidated risk weighted assets (RWA) (Credit & Market & Operational risk) 8,389,920 9,488,916 13
o/w RWA (Credit risk) 6,795,559 7,966,050 17
RWA (Market & Operational risk) 1,594,361 1,522,866 (4)
Closing exchange rate of the HUF 2017 2018 Change
HUF HUF %
HUF/EUR 310 322 4
HUF/CHF 265 285 8
HUF/USD 259 281 9

32 OTP Bank Annual Report 2018
O T P B A N K ’ S H U N G A R I A N C O R E B U S I N E S S
OTP Core Statement of profit or loss:
Main components of the Statement of recognised income 2017 2018 Change
HUF million HUF million %
After tax profit without the effect of adjustments 168,576 180,445 7
Corporate income tax (16,986) (14,717) (13)
Pre-tax profit 185,562 195,162 5
Operating profit 150,833 144,577 (4)
Total income 365,591 378,534 4
Net interest income 234,304 245,934 5
Net fees and commissions 109,128 107,010 (2)
Other net non-interest income 22,159 25,590 15
Operating expenses (214,758) (233,956) 9
Total risk costs 30,784 46,591 51
Provision for impairment on loan and placement losses 33,586 48,192 43
Other provisions (2,803) (1,601) (43)
Total one-off items 3,945 3,993 1
Gain on the repurchase of own Upper and Lower Tier2 Capital 0 0
Revaluation result of the treasury share swap agreement 3,945 3,993 1
Indicators 2017 2018 pps
ROE 12.3% 12.2% (0.1)
ROA 2.3% 2.2% (0.1)
Operating profit margin 2.1% 1.8% (0.3)
Total income margin 5.02% 4.64% (0.38)
Net interest margin 3.22% 3.01% (0.20)
Net fee and commission margin 1.50% 1.31% (0.19)
Net other non-interest income margin 0.30% 0.31% 0.01
Operating costs to total assets ratio 2.9% 2.9% (0.1)
Cost/income ratio 58.7% 61.8% 3.1
Provision for impairment on loan and placement losses/average gross loans* (1.23%) (1.60%) (0.37)
Effective tax rate 9.2% 7.5% (1.6)
* Negative Provision for impairment on loan and placement losses/average gross loans ratio implies positive amount on the Provision for impairment on loan and placement
losses line.

33Management’s analysis of the 2018 results of the OTP Group
Main components of OTP Core’s Statement of financial position:
Main components of balance sheet closing balances 2017 2018 Change
HUF million HUF million %
Total Assets 7,704,135 8,563,425 11
Net customer loans 2,634,920 3,096,391 18
Net customer loans (FX-adjusted) 2,651,784 3,096,391 17
Gross customer loans 2,793,871 3,241,345 16
Gross customer loans (FX-adjusted) 2,812,752 3,241,345 15
Retail loans 1,823,513 1,970,879 8
Retail mortgage loans (incl. home equity) 1,275,721 1,329,562 4
Retail consumer loans 372,012 425,786 14
SME loans 175,779 215,531 23
Corporate loans 989,239 1,270,466 28
Loans to medium and large corporates 953,436 1,185,030 24
Municipal loans 35,803 85,436 139
Provisions (158,951) (144,954) (9)
Provisions (FX-adjusted) (160,969) (144,954) (10)
Deposits from customers + retail bonds 5,388,080 5,967,857 11
Deposits from customers + retail bonds (FX-adjusted) 5,431,237 5,967,857 10
Retail deposits + retail bonds 3,504,431 4,050,098 16
Household deposits + retail bonds 2,845,112 3,259,145 15
o/w Retail bonds 6,500 4,732 (27)
SME deposits 659,319 790,953 20
Corporate deposits 1,926,806 1,917,759 0
Deposits to medium and large corporates 1,307,433 1,311,242 0
Municipal deposits 619,373 606,517 (2)
Liabilities to credit institutions 285,539 236,700 (17)
Issued securities without retail bonds 288,799 461,138 60
Total shareholders’ equity 1,430,256 1,561,688 9
Loan Quality 2017 2018 %/pps
Stage 3 loan volume under IFRS 9 (in HUF million) 190,682
Stage 3 loans under IFRS 9/gross customer loans 5.9%
90+ days past due loan volume (in HUF million) 179,618 147,218 (18)
90+ days past due loans/gross customer loans 6.4% 4.5% (1.9)
Total provisions/90+ days past due loans 88.5% 98.5% 10.0
Market Share 2017 2018 pps
Loans 20.6% 20.8% 0.3
Deposits 26.1% 25.7% (0.4)
Total Assets 25.7% 26.2% 0.5
Performance Indicators 2017 2018 pps
Net loans to (deposits + retail bonds) (FX-adjusted) 49% 52% 3
Leverage (closing Shareholder’s Equity/Total Assets) 18.6% 18.2% (0.3)
Leverage (closing Total Assets/Shareholder’s Equity) 5.4x 5.5x 0.1x
Capital adequacy ratio (OTP Bank, non-consolidated, Basel3, IFRS) 31.4% 28.2% (3.2)
Common Equity Tier1 ratio (OTP Bank, non-consolidated, Basel3, IFRS) 29.0% 26.2% (2.8)
• The adjusted profit after tax of OTP Core reached HUF 180.4 billion in 2018, marking
a 7% increase on the back of higher positive risk costs
• The annual net interest margin attrition reached 20 bps (3.01%)
• Favourable credit quality trends remained intact, the DPD90+ ratio sank to 4.5%
• Performing loan volume growth accelerated to 18% in 2018. The corporate segment remained
the engine of growth, but household volumes also gained momentum: consumer loans
expanded by 19%, mortgages by 6%. Within mortgages, housing loan expansion exceeded 10%
• Full-year mortgage loan disbursements soared by 40% y-o-y. Within new loan applications the
share of fixed rate and within that, the proportion of loans with longer interest rate fixation
periods have been rising further

34 OTP Bank Annual Report 2018
P&L developments
Without the effect of adjustment items OTP Core
posted an after tax profit of HUF 180.4 billion
in 2018, marking an improvement of 7% y-o-y,
driven by 51% higher positive risk costs beside
4% decline in operating profit.
The annual total income (without one-off revenue
items) went up by 4% y-o-y, predominantly
driven by the 5% improvement in net interest
income. Gross interest revenues benefited from
dynamic organic loan volume growth, and the
placement of additional liquidity generated
by the deposit inflow. The annual net interest
margin (3.01%) declined by 20 bps compared to
the previous year.
The annual net fee and commission income
decreased by 2% y-o-y. On one hand, growing
volumes and transactional turnover resulted
in stronger card, deposit and transaction-
related fee revenues. However, securities fee
income declined because the distribution fees
on certain household targeted government
bonds were reduced by the Government Debt
Management Agency in many steps.
The annual other net non-interest income
(without one-offs) grew by 15% y-o-y. This was
partially owing to the better FX-result realized
in 2Q 2018, whereas the gain on securities
moderated.
The revaluation result of the treasury share
swap agreement (showed among the one-off
revenue items) remained stable y-o-y.
Annual operating expenses increased by 9%
y-o-y. Within that, the dynamics of personnel
expenses was driven by base salary hikes in
2017 and further hikes effective from April
2018 in the network and July 2018 in the head-
quarters, but the higher number of employees
played a role, too. Furthermore, in December
2018 a non-recurring one-off bonus amounting
to one month base salary was paid to non-
managerial employees at Hungarian Group
members, adding HUF 5.4 billion to personnel
expenses at OTP Core. These were partially
offset by the 2.5 pps reduction of social and
health care contributions to be paid by employ-
ers effective from January 2018. (In 2017 the
Government cut these contributions by 5 pps).
On the total risk costs line a positive amount of
HUF 46.6 billion was recognized in 2018, 51%
more than a year ago.
Benign risk cost developments were aided by
favourable credit quality trends amid supportive
economic environment: the DPD90+ loan
volumes adjusted for FX rate movements and
without problem loan sales and write-offs
declined by HUF 8.5 billion in the course of 2018
(within that HUF 2 billion in 1Q, HUF 3 billion in
2Q, HUF 2 billion in 3Q and HUF 1.5 billion in 4Q
2018), against a decline of HUF 5 billion in 2016
as a whole adjusted for the technical effect of
the AXA portfolio take-over, and HUF 14 billion
in 2017, respectively. In 2018 HUF 24 billion
non-performing exposures were sold or written
off. The trend-like improvement of DPD90+
ratio continued: it moderated by 1.9 pps y-o-y
to 4.5%. The ratio of Stage 3 loans under IFRS
9 to total gross loans stood at 5.9% by the end
of 2018.
Balance sheet trends
The FX-adjusted gross loan portfolio increased
by 15% y-o-y. However, due to the sales and
write-offs of non-performing loans, the
performing (DPD0–90) loan volume develop-
ments are more illustrative: performing loans
advanced by 18% y-o-y, against 11% growth
reported in 2017 (FX-adjusted).
Organic loan expansion was predominantly
driven by outstanding corporate loan growth
in 2018, too, similar to the previous two years.
It is favourable that household loan growth
and within that, mortgage and consumer loan
expansion has been following an accelerating
growth pattern, too.
As for mortgages, their performing stock
volume growth amounted to 6% y-o-y. The stock
of performing mortgage loans consists of three
major sub-categories: housing loans (making
up 77% of the total performing stock), home
equities (or mortgage-backed consumer loans,
21%), and flat lease (1%). These three product
segments have different growth patterns.
Performing housing loan volumes are the main
contributors to growth: their yearly expansion

35Management’s analysis of the 2018 results of the OTP Group
pierced 10% (+11% y-o-y). On the contrary,
home equity loans have been steadily dwindling
(–9% y-o-y) as their amortization exceeds new
disbursements in the wake of waning popularity
compared to the pre-crisis period. Flat lease
volumes making up a small part of total
mortgages grew by 2% y-o-y.
Annual mortgage loan applications at OTP Core
amounted to HUF 355 billion (+21% y-o-y).
Cumulated new disbursements showed a 40%
increase y-o-y.
OTP Bank’s market share in new mortgage loan
contractual amounts reached 29.2% in 2018 as
a whole, up from 27.7% a year ago.
With respect to mortgage lending, one of the
most important and spectacular developments
was the steady and unambiguous rise in the
popularity of fixed rate mortgages. At OTP the
proportion of fixed rate housing loans (with an
interest rate fixation period of at least 5 years)
within non-subsidized housing loan applications
reached 97% in 4Q 2018, up from around 50%
in 2017 as a whole. It was also positive that in
the last several months the applications for
mortgages with a repricing period of 10 years
or more gained further ground: in 4Q 2018 the
aggregated volume of applications for loans
with fixation period of 10 and 20 years was
close to 80% within total fixed rate credits.
The above developments were stimulated by
the deliberate policies taken by the National
Bank of Hungary, through the introduction of
the certified consumer-friendly housing loans
and the amendments to the PTI rules effective
from 1 October 2018. In 4Q 2018 the share of
certified customer-friendly mortgages within
new fixed rate market-based housing loan
applications exceeded 70%.
OTP Bank helps Hungarian families realize their
housing aims through its active participation
in the Housing Subsidy Scheme for Families
(CSOK), too. In 2018 altogether more than
12 thousand applications for the CSOK subsidy
were registered at OTP Bank with a value of
over HUF 40 billion.
Performing consumer loan dynamics
demonstrated an accelerating trend: they went
up by 19% in 2018, versus +14%4 a year ago
(FX-adjusted). Within consumer loans, cash loan
growth was outstanding the yearly increase
reached 38%. OTP’s market share in the cash
loan volumes stood at 33.4% at the end of the
period under review.
FX-adjusted deposit volumes (including retail
bonds) increased by 10% y-o-y. The yearly
expansion was driven by household and SME
deposits (+15% and +20%, respectively),
whereas corporate volumes remained stable.
The net loan to (deposit+retail bonds) ratio
improved by 3 pps y-o-y, edging up to 52%, thus
the balance sheet structure of the Hungarian
base operation became more efficient, though
the absolute level of the ratio can still be
regarded as quite low.
As for the distribution of the liquidity reserves
of the Bank, in the last several years there has
been a gradual shift towards longer duration
Hungarian government securities, and this
trend continued into 2018, too.
The yearly increase in the volume of issued
securities without retail bonds (+HUF 172 bil-
lion) was reasoned on one hand by covered
bond issuances by OTP Mortgage Bank: in 2Q
HUF denominated covered bonds were sold
with 5 year maturity and fixed 1.75% coupon,
in 3Q floating rate
(1M BUBOR + 60 bps) HUF covered bonds
were issued with 2024 maturity, and in 4Q
HUF denominated covered bonds maturing
in 2024 with fixed 2.5% coupon. At the same
time, previously issued covered bonds were
repurchased.
4 In 2017 the yearly performing consumer loan dynamics was +25% on an FX-adjusted basis, fuelled by several large-ticket lombard
loans, too – without these the y-o-y growth would have been 14%.
36 OTP Bank Annual Report 2018
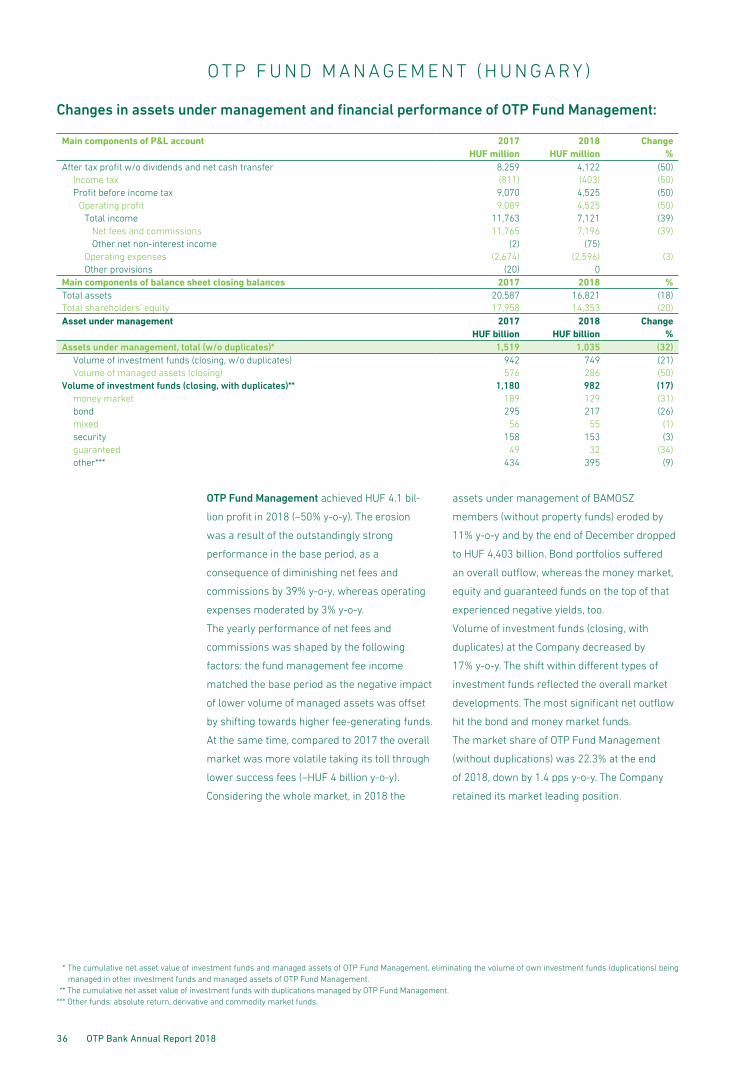
OTP Fund Management achieved HUF 4.1 bil-
lion profit in 2018 (–50% y-o-y). The erosion
was a result of the outstandingly strong
performance in the base period, as a
consequence of diminishing net fees and
commissions by 39% y-o-y, whereas operating
expenses moderated by 3% y-o-y.
The yearly performance of net fees and
commissions was shaped by the following
factors: the fund management fee income
matched the base period as the negative impact
of lower volume of managed assets was offset
by shifting towards higher fee-generating funds.
At the same time, compared to 2017 the overall
market was more volatile taking its toll through
lower success fees (–HUF 4 billion y-o-y).
Considering the whole market, in 2018 the
assets under management of BAMOSZ
members (without property funds) eroded by
11% y-o-y and by the end of December dropped
to HUF 4,403 billion. Bond portfolios suffered
an overall outflow, whereas the money market,
equity and guaranteed funds on the top of that
experienced negative yields, too.
Volume of investment funds (closing, with
duplicates) at the Company decreased by
17% y-o-y. The shift within different types of
investment funds reflected the overall market
developments. The most significant net outflow
hit the bond and money market funds.
The market share of OTP Fund Management
(without duplications) was 22.3% at the end
of 2018, down by 1.4 pps y-o-y. The Company
retained its market leading position.
O T P F U N D M A N A G E M E N T ( H U N G A R Y )
Changes in assets under management and financial performance of OTP Fund Management:
Main components of P&L account 2017 2018 Change
HUF million HUF million %
After tax profit w/o dividends and net cash transfer 8,259 4,122 (50)
Income tax (811) (403) (50)
Profit before income tax 9,070 4,525 (50)
Operating profit 9,089 4,525 (50)
Total income 11,763 7,121 (39)
Net fees and commissions 11,765 7,196 (39)
Other net non-interest income (2) (75)
Operating expenses (2,674) (2,596) (3)
Other provisions (20) 0
Main components of balance sheet closing balances 2017 2018 %
Total assets 20,587 16,821 (18)
Total shareholders’ equity 17,958 14,353 (20)
Asset under management 2017 2018 Change
HUF billion HUF billion %
Assets under management, total (w/o duplicates)* 1,519 1,035 (32)
Volume of investment funds (closing, w/o duplicates) 942 749 (21)
Volume of managed assets (closing) 576 286 (50)
Volume of investment funds (closing, with duplicates)** 1,180 982 (17)
money market 189 129 (31)
bond 295 217 (26)
mixed 56 55 (1)
security 158 153 (3)
guaranteed 49 32 (34)
other*** 434 395 (9)
* The cumulative net asset value of investment funds and managed assets of OTP Fund Management, eliminating the volume of own investment funds (duplications) being
managed in other investment funds and managed assets of OTP Fund Management.
** The cumulative net asset value of investment funds with duplications managed by OTP Fund Management.
*** Other funds: absolute return, derivative and commodity market funds.

37Management’s analysis of the 2018 results of the OTP Group
M E R K A N T I L B A N K A N D C A R ( H U N G A R Y )
Performance of Merkantil Bank and Car:
Main components of P&L account 2017 2018 Change
HUF million HUF million %
After tax profit without the effect of adjustments 8,260 7,437 (10)
Income tax (357) 456
Profit before income tax 8,618 6,981 (19)
Operating profit 6,229 6,599 6
Total income 12,423 12,983 5
Net interest income 12,477 13,131 5
Net fees and commissions (366) (124) (66)
Other net non-interest income 311 (24)
Operating expenses (6,194) (6,384) 3
Total provisions 2,389 382 (84)
Provision for impairment on loan and placement losses 2,049 256 (87)
Other provision 340 126 (63)
Main components of balance sheet closing balances 2017 2018 %
Total assets 369,180 404,750 10
Gross customer loans 292,925 321,353 10
Gross customer loans (FX-adjusted) 293,925 321,353 9
Retail loans 28,985 29,558 2
Corporate loans 90,141 103,541 15
Car financing loans 174,798 188,254 8
Allowances for possible loan losses (21,000) (13,853) (34)
Allowances for possible loan losses (FX-adjusted) (21,048) (13,853) (34)
Deposits from customers 20,799 15,180 (27)
Deposits from customer (FX-adjusted) 20,799 15,180 (27)
Retail deposits 19,250 13,307 (31)
Corporate deposits 1,549 1,873 21
Liabilities to credit institutions 303,371 337,136 11
Total shareholders’ equity 30,268 37,189 23
Loan Quality 2017 2018 %/pps
Stage 3 loan volume under IFRS 9 (in HUF million) 14,133
Stage 3 loans under IFRS 9/gross customer loans 4.4%
Provision for impairment on loan and placement losses/average gross loans (0.71%) (0.08%) 0.63
90+ days past due loan volume (in HUF million) 16,874 10,204 (39.5)
90+ days past due loans/gross customer loans 5.8% 3.2% (2.6)
Total provisions/90+ days past due loans 124.5% 135.8% 11.3
Performance Indicators 2017 2018 pps
ROA 2.3% 1.9% (0.4)
ROE 29.4% 24.4% (4.9)
Total income margin 3.49% 3.38% (0.11)
Net interest margin 3.50% 3.42% (0.08)
Cost/income ratio 49.9% 49.2% (0.7)
On 30 September 2018 Merkantil Car Ltd.
merged into Merkantil Bank Ltd. and ceased to
exist as a separate legal entity.
Merkantil Bank and Car posted HUF 7.4 billion
adjusted after tax profit in 2018 which is 10%
below the base period. The y-o-y lower profit
was mainly attributable to credit risk cost
development: against HUF 2.4 billion positive
total risk cost in the base period, in 2018 risk
costs comprised only +HUF 0.4 billion.
In 2018 net interest income increased by
5% y-o-y, the expansion of performing loan
volumes had a positive NII-effect, while the net
interest margin eroded.
Net fee and commission expenses in 2018
dropped by 66% y-o-y: the distribution of certain
deposit products came to an end, as a result
lower distribution fees were paid compared to
the base period.
Annual operating expenses grew by 3% y-o-y,
within that depreciation, marketing cost and
expert fees increased.
Credit quality trends remained positive.
The ratio of DPD90+ loans decreased by 2.6 pps
y-o-y to 3.2% parallel with HUF 6.4 billion
problem loans being sold or written off in 2018.
The ratio of Stage 3 loans under IFRS 9 to total
gross loans stood at 4.4%.

38 OTP Bank Annual Report 2018
The FX-adjusted performing loan portfolio
expanded by 12% on a yearly basis as a result
of favourable disbursement dynamics.
The volume of performing corporate exposures
and car loans expanded by 16 and 12%,
respectively, on a yearly base. Total new loan
origination surged by 26% y-o-y, within that the
volume of newly disbursed car loans expanded
by 22% y-o-y in 2018.
Merkantil retained its market leading position
both in terms of new disbursements and
outstanding leasing volumes.

39Management’s analysis of the 2018 results of the OTP Group
IFRS reports of the main foreign
subsidiaries of OTP Bank
Main components of P&L account 2017 2018 Change
HUF million HUF million %
After tax profit without the effect of adjustments 47,122 47,293 0
Income tax (4,920) (4,308) (12)
Profit before income tax 52,042 51,601 (1)
Operating profit 61,461 57,096 (7)
Total income 108,290 107,817 0
Net interest income 72,257 69,979 (3)
Net fees and commissions 27,714 30,435 10
Other net non-interest income 8,319 7,403 (11)
Operating expenses (46,830) (50,720) 8
Total provisions (9,419) (5,495) (42)
Provision for impairment on loan and placement losses (3,571) (9,532) 167
Other provision (5,848) 4,038 (169)
Main components of balance sheet closing balances 2017 2018 %
Total assets 1,925,740 2,381,275 24
Gross customer loans 1,184,871 1,343,729 13
Gross customer loans (FX-adjusted) 1,228,363 1,343,729 9
Retail loans 857,693 932,756 9
Corporate loans 370,671 410,973 11
Allowances for possible loan losses (109,137) (111,369) 2
Allowances for possible loan losses (FX-adjusted) (113,141) (111,369) (2)
Deposits from customers 1,626,924 1,890,897 16
Deposits from customer (FX-adjusted) 1,690,207 1,890,897 12
Retail deposits 1,508,881 1,654,613 10
Corporate deposits 181,325 236,283 30
Liabilities to credit institutions 4,802 3,144 (35)
Total shareholders’ equity 250,296 453,891 81
Loan Quality 2017 2018 %/pps
Stage 3 loan volume under IFRS 9 (in HUF million) 141,513
Stage 3 loans under IFRS 9/gross customer loans 10.5%
Provision for impairment on loan and placement losses/average gross loans 0.31% 0.74% 0.44
90+ days past due loan volume (in HUF million) 93,936 89,986 (4)
90+ days past due loans/gross customer loans 7.9% 6.7% (1.2)
Total provisions/90+ days past due loans 116.2% 123.8% 7.6
Performance Indicators 2017 2018 pps
ROA 2.5% 2.3% (0.2)
ROE 20.0% 18.4% (1.6)
Total income margin 5.77% 5.20% (0.58)
Net interest margin 3.85% 3.37% (0.48)
Cost/income ratio 43.2% 47.0% 3.8
Net loans to deposits (FX-adjusted) 66% 65% (1)
FX rates 2017 2018 Change
HUF HUF %
HUF/BGN (closing) 158.6 164.4 4
HUF/BGN (average) 158.1 163.0 3
D S K G R O U P ( B U L G A R I A )
Performance of DSK Group:
• Stable, HUF 47.3 billion profit after tax in 2018 as a result of moderating operating profit
(–7%) and lower risk costs
• The FX-adjusted performing loan portfolio grew by 11% y-o-y
• The annual net interest margin eroded by 48 bps to 3.37%
• The ratio of DPD90+ loans sank to 6.7%. The pace of credit quality deterioration remained
moderate in 2018 as a whole
• The full-year risk cost fell by 42% in 2018

40 OTP Bank Annual Report 2018
Based on the acquisition agreement on
purchasing 99.74% shareholding of Societe
Generale Expressbank (”SGEB”) and other local
subsidiaries held by SGEB, signed by Societe
Generale Group and DSK Bank EAD on 1 August
2018, the financial closure of the transaction
was completed on 15 January 2019. Upon the
request of the seller, OTP Bank doesn’t disclose
the purchase price.
2018 financial statements include neither the
balance sheet, not the profit or loss statement
of SGEB.
Due to the acquisition and in order to comply
with regulatory capital requirements, OTP Bank
raised capital in DSK Bank in December 2018.
As a result, the shareholders’ equity of DSK
Bank increased by EUR 600 million equivalent.
DSK Group posted an after tax profit of
HUF 47.3 billion in 2018 (flat in HUF terms,
–3% in local currency terms), corresponding to
an ROE of 18.4%.
The annual operating profit decreased by 7%
due to the 8% increase of operating expenses,
whereas total income remained stable. Total
income was shaped mainly by the 3% decline in
net interest income and the 10% improvement
in net fee and commission income, while other
income diminished by 11%.
Net interest income declined on the back of
the 48 bps erosion of the annual net interest
margin (3.37%), reflecting mainly the ongoing
repricing of assets. This was partially offset by
the dynamic loan volume expansion.
The full-year net fee and commission income
improved by 10%, mainly as a result of deposits
and transactions related revenue growth. Other
net non-interest income dropped by 11% y-o-y
partly due to moderating gain on securities.
The annual operating expenses grew by
8% y-o-y (+5% in BGN terms). Within that
personnel expenses went up by 14% in HUF
terms and 10% in local currency terms; latter
was reasoned by the 2% higher average total
headcount and the 8% increase in average
personnel expense per employee. At the same
time, in Bulgaria the average gross nominal
wage increase reached 7.4% y-o-y in the course
of 2018. On a yearly basis expenses related
to computer hardware and office equipment,
telecommunication and marketing, as well
as charges paid to supervisory authorities
increased, but expert fees showed a decline.
In 2018 as a whole total risk cost amounted to
–HUF 5.5 billion, implying a 42% y-o-y decline.
Within that provision for impairment on loan
and placement losses were two and a half
times higher than a year earlier, partly as a
result of that in the course of the last quarter
the PD and LGD parameters, as well as the
macroeconomic expectations were revised in
the IFRS 9 provisioning models.
In 2018 the risk cost rate hit 0.7%, up from 0.3%
in the previous year. This was mainly driven by
the higher provisioning levels induced by the
IFRS 9 methodology, and the revision of IFRS 9
model parameters in 4Q 2018. Other provisions
saw a release in 2018 as a whole.
In 2018 HUF 9 billion problem loans were sold
or written off. FX-adjusted DPD90+ volumes
without the impact of loan sales and write-offs
increased by HUF 1.4 billion in 2018. The DPD90+
ratio decreased by 1.2 pps y-o-y to 6.7%.
The ratio of Stage 3 loans to total gross loans
stood at 10.5% at the end of 2018.
Lending activity picked up further in 2018: the
dynamically growing new loan disbursements
resulted in accelerating performing loan
volume expansion, hitting 11% in 2018, up from
7% a year ago (FX-adjusted). As for the main
segments, performing mortgage loans were up
by 14% y-o-y, thanks to the 73% surge in new
disbursements (in local currency terms).
As for cash loans and point-of-sale loans, the
full-year new origination grew by 12% y-o-y
in local currency, thus performing consumer
loans expanded by 7% y-o-y. The performing
corporate loan portfolio increased by 14% in
the last 12 months, DSK’s market share in
outstanding corporate loans improved to 8%
from 7.7% at the end of 2017.
The FX-adjusted deposit base increased by
12% y-o-y, supported by both the retail and
corporate segments. The net loan-to-deposit
ratio stood at 65% at the end of 2018, reflecting
a 1 pp decline y-o-y on an FX-adjusted basis.
The capital adequacy ratio of DSK Bank under
local regulation stood at 16.3%, against 17.2%
a year ago. The capital adequacy ratio and

41Management’s analysis of the 2018 results of the OTP Group
capital requirement of DSK Bank were shaped
by the following factors: on one hand, interim
results less dividend cannot be included into
the regulatory capital due to the lack of audit,
but the steady organic growth in loan volumes
resulted in y-o-y higher risk weighted assets
(RWA). Secondly, the other systemically
important financial institutions buffer (O-SII)
introduced from 2018 will gradually creep up:
from 0.25% in 2018 to 0.75% in 2019 and 1%
in 2020. Thirdly, the SGEB deal was financially
closed on 15 January 2019; as a prelude to
that in December 2018 DSK Bank received a
capital injection from OTP Bank, the registration
of which, thus its inclusion into the regulatory
capital has not yet happened by the end of 2018.

42 OTP Bank Annual Report 2018
O T P B A N K R U S S I A
Performance of OTP Bank Russia:
Main components of P&L account 2017 2018 Change
HUF million HUF million %
After tax profit w/o dividends and net cash transfer 27,771 16,420 (41)
Income tax (7,514) (4,614) (39)
Profit before income tax 35,285 21,034 (40)
Operating profit 72,015 68,878 (4)
Total income 125,290 129,899 4
Net interest income 101,326 102,489 1
Net fees and commissions 22,975 26,766 17
Other net non-interest income 989 644 (35)
Operating expenses (53,276) (61,021) 15
Total provisions (36,730) (47,844) 30
Provision for impairment on loan and placement losses (35,880) (42,204) 18
Other provision (850) (5,640) 564
Main components of balance sheet closing balances 2017 2018 %
Total assets 638,031 707,593 11
Gross customer loans 531,280 610,355 15
Gross customer loans (FX-adjusted) 482,392 610,355 27
Retail loans 430,413 544,519 27
Corporate loans 51,871 65,733 27
Car financing loans 108 103 (5)
Gross DPD0–90 customer loans (FX-adjusted) 405,826 528,360 30
Retail loans 358,138 463,799 30
Allowances for possible loan losses (112,158) (126,655) 13
Allowances for possible loan losses (FX-adjusted) (102,215) (126,655) 24
Deposits from customers 353,306 379,911 8
Deposits from customer (FX-adjusted) 326,031 379,911 17
Retail deposits 261,547 301,887 15
Corporate deposits 64,484 78,025 21
Liabilities to credit institutions 100,404 120,156 20
Issued securities 353 320 (9)
Subordinated debt 22,780 22,522 (1)
Total shareholders’ equity 135,213 147,999 9
Loan Quality 2017 2018 %/pps
Stage 3 loan volume under IFRS 9 (in HUF million) 84,469
Stage 3 loans under IFRS 9/gross customer loans 13.8%
Provision for impairment on loan and placement losses/average gross loans 7.35% 7.39% 0.04
90+ days past due loan volume (in HUF million) 83,742 81,995 (2)
90+ days past due loans/gross customer loans 15.8% 13.4% (2.3)
Total provisions/90+ days past due loans 133.9% 154.5% 20.5
Performance Indicators 2017 2018 pps
ROA 4.6% 2.4% (2.2)
ROE 21.0% 10.9% (10.1)
Total income margin 20.91% 19.28% (1.63)
Net interest margin 16.91% 15.21% (1.70)
Cost/income ratio 42.5% 47.0% 4.5
Net loans to deposits (FX-adjusted) 117% 127% 11
FX rates 2017 2018 Change
HUF HUF %
HUF/RUB (closing) 4.5 4.1 (10)
HUF/RUB (average) 4.7 4.3 (8)
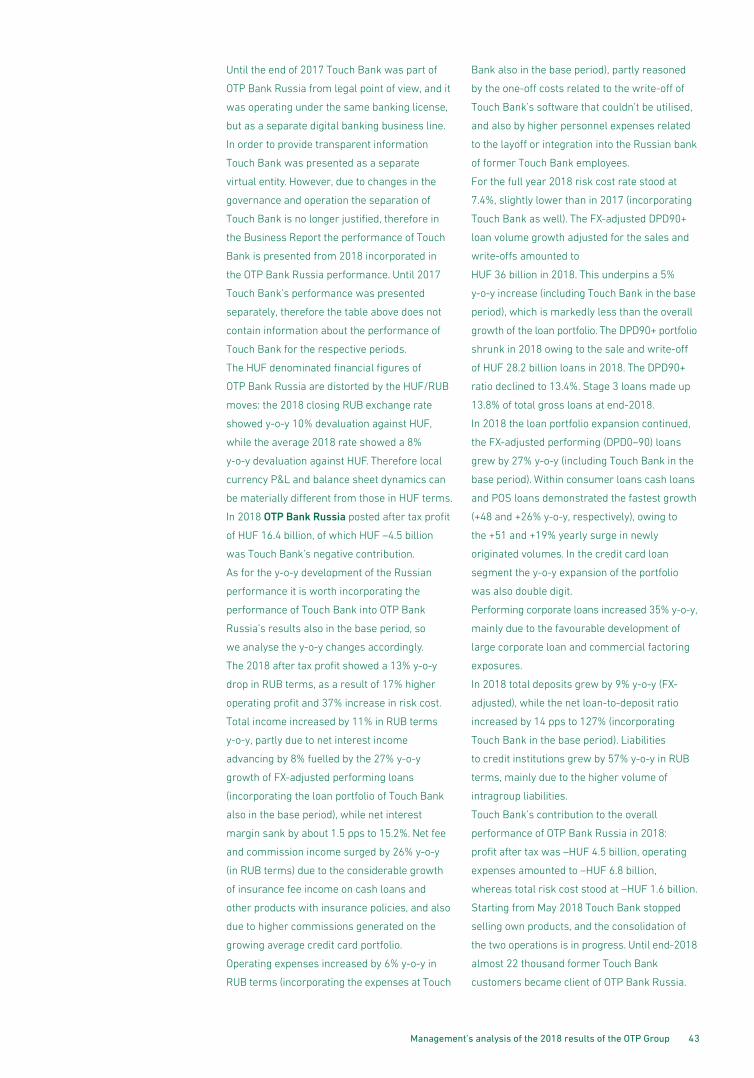
• Starting from 1Q 2018 performance of Touch Bank is presented as part of OTP Bank Russia
• HUF 16.4 billion after tax profit in 2018 (–13% y-o-y in local currency terms incorporating
the net results of Touch Bank in the base period, too) corresponding to an ROE of 11%
• Risk cost rate for 2018 stood at 7.4%. DPD90+ ratio decreased to 13.4%
• The performing loan portfolio grew by 27% y-o-y (FX-adjusted, incorporating the loan portfolio
of Touch Bank in the base period)
• Net loan-to-deposit ratio grew to 127%
43Management’s analysis of the 2018 results of the OTP Group
Until the end of 2017 Touch Bank was part of
OTP Bank Russia from legal point of view, and it
was operating under the same banking license,
but as a separate digital banking business line.
In order to provide transparent information
Touch Bank was presented as a separate
virtual entity. However, due to changes in the
governance and operation the separation of
Touch Bank is no longer justified, therefore in
the Business Report the performance of Touch
Bank is presented from 2018 incorporated in
the OTP Bank Russia performance. Until 2017
Touch Bank’s performance was presented
separately, therefore the table above does not
contain information about the performance of
Touch Bank for the respective periods.
The HUF denominated financial figures of
OTP Bank Russia are distorted by the HUF/RUB
moves: the 2018 closing RUB exchange rate
showed y-o-y 10% devaluation against HUF,
while the average 2018 rate showed a 8%
y-o-y devaluation against HUF. Therefore local
currency P&L and balance sheet dynamics can
be materially different from those in HUF terms.
In 2018 OTP Bank Russia posted after tax profit
of HUF 16.4 billion, of which HUF –4.5 billion
was Touch Bank’s negative contribution.
As for the y-o-y development of the Russian
performance it is worth incorporating the
performance of Touch Bank into OTP Bank
Russia’s results also in the base period, so
we analyse the y-o-y changes accordingly.
The 2018 after tax profit showed a 13% y-o-y
drop in RUB terms, as a result of 17% higher
operating profit and 37% increase in risk cost.
Total income increased by 11% in RUB terms
y-o-y, partly due to net interest income
advancing by 8% fuelled by the 27% y-o-y
growth of FX-adjusted performing loans
(incorporating the loan portfolio of Touch Bank
also in the base period), while net interest
margin sank by about 1.5 pps to 15.2%. Net fee
and commission income surged by 26% y-o-y
(in RUB terms) due to the considerable growth
of insurance fee income on cash loans and
other products with insurance policies, and also
due to higher commissions generated on the
growing average credit card portfolio.
Operating expenses increased by 6% y-o-y in
RUB terms (incorporating the expenses at Touch
Bank also in the base period), partly reasoned
by the one-off costs related to the write-off of
Touch Bank’s software that couldn’t be utilised,
and also by higher personnel expenses related
to the layoff or integration into the Russian bank
of former Touch Bank employees.
For the full year 2018 risk cost rate stood at
7.4%, slightly lower than in 2017 (incorporating
Touch Bank as well). The FX-adjusted DPD90+
loan volume growth adjusted for the sales and
write-offs amounted to
HUF 36 billion in 2018. This underpins a 5%
y-o-y increase (including Touch Bank in the base
period), which is markedly less than the overall
growth of the loan portfolio. The DPD90+ portfolio
shrunk in 2018 owing to the sale and write-off
of HUF 28.2 billion loans in 2018. The DPD90+
ratio declined to 13.4%. Stage 3 loans made up
13.8% of total gross loans at end-2018.
In 2018 the loan portfolio expansion continued,
the FX-adjusted performing (DPD0–90) loans
grew by 27% y-o-y (including Touch Bank in the
base period). Within consumer loans cash loans
and POS loans demonstrated the fastest growth
(+48 and +26% y-o-y, respectively), owing to
the +51 and +19% yearly surge in newly
originated volumes. In the credit card loan
segment the y-o-y expansion of the portfolio
was also double digit.
Performing corporate loans increased 35% y-o-y,
mainly due to the favourable development of
large corporate loan and commercial factoring
exposures.
In 2018 total deposits grew by 9% y-o-y (FX-
adjusted), while the net loan-to-deposit ratio
increased by 14 pps to 127% (incorporating
Touch Bank in the base period). Liabilities
to credit institutions grew by 57% y-o-y in RUB
terms, mainly due to the higher volume of
intragroup liabilities.
Touch Bank’s contribution to the overall
performance of OTP Bank Russia in 2018:
profit after tax was –HUF 4.5 billion, operating
expenses amounted to –HUF 6.8 billion,
whereas total risk cost stood at –HUF 1.6 billion.
Starting from May 2018 Touch Bank stopped
selling own products, and the consolidation of
the two operations is in progress. Until end-2018
almost 22 thousand former Touch Bank
customers became client of OTP Bank Russia.

44 OTP Bank Annual Report 2018
OTP BANKA HRVATSKA (CROATIA)
Performance of OTP banka Hrvatska (including Splitska banka):
Main components of P&L account 2017 2018 Change
HUF million HUF million %
After tax profit without the effect of adjustments 17,105 24,961 46
Income tax (3,742) (5,638) 51
Profit before income tax 20,848 30,599 47
Operating profit 28,779 35,456 23
Total income 63,643 78,295 23
Net interest income 44,313 54,059 22
Net fees and commissions 12,603 16,042 27
Other net non-interest income 6,728 8,194 22
Operating expenses (34,864) (42,840) 23
Total provisions (7,931) (4,857) (39)
Provision for impairment on loan and placement losses (7,498) (3,046) (59)
Other provision (434) (1,811) 318
Main components of balance sheet closing balances 2017 2018 %
Total assets 1,821,613 1,837,158 1
Gross customer loans 1,121,938 1,178,848 5
Gross customer loans (FX-adjusted) 1,166,262 1,178,848 1
Retail loans 648,330 662,747 2
Corporate loans 498,462 498,332 0
Car financing loans 19,470 17,768 (9)
Allowances for possible loan losses (63,752) (71,186) 12
Allowances for possible loan losses (FX-adjusted) (66,389) (71,186) 7
Deposits from customers 1,395,087 1,424,746 2
Deposits from customer (FX-adjusted) 1,454,609 1,424,746 (2)
Retail deposits 1,033,638 1,049,946 2
Corporate deposits 420,971 374,800 (11)
Liabilities to credit institutions 132,765 85,702 (35)
Total shareholders’ equity 238,935 269,126 13
Loan Quality 2017 2018 %/pps
Stage 3 loan volume under IFRS 9 (in HUF million) 89,059
Stage 3 loans under IFRS 9/gross customer loans 7.6%
Provision for impairment on loan and placement losses/average gross loans 0.85% 0.26% (0.59)
90+ days past due loan volume (in HUF million) 74,325 65,011 (13)
90+ days past due loans/gross customer loans 6.6% 5.5% (1.1)
Total provisions/90+ days past due loans 85.8% 109.5% 23.7
Performance Indicators 2017 2018 pps
ROA 1.3% 1.4% 0.1
ROE 9.3% 9.6% 0.3
Total income margin 4.70% 4.27% (0.42)
Net interest margin 3.27% 2.95% (0.32)
Cost/income ratio 54.8% 54.7% (0.1)
Net loans to deposits (FX-adjusted) 76% 78% 2
FX rates 2017 2018 Change
HUF HUF %
HUF/HRK (closing) 41.6 43.4 4
HUF/HRK (average) 41.4 42.3 2
• The integration of Splitska banka was completed in December
• The Croatian operation posted HUF 25 billion in 2018.
• Y-o-y lower net interest margin is explained mainly by the dilution effect of tighter margins
at Splitska banka
• Performing loan volumes expanded by 2% y-o-y, whereas deposits suffered similar drop
in 2018 (on an FX-adjusted basis)

45Management’s analysis of the 2018 results of the OTP Group
Based on the acquisition agreement on
purchasing 100% shareholding of Splitska
banka d.d., member of Société Générale Group
signed on 20 December 2016 between
OTP banka Hrvatska, the Croatian subsidiary
of OTP Bank and Société Générale Group,
on 2 May 2017 the financial closure of the
transaction has been completed and Splitska
banka was consolidated in May 2017.
In December 2018 the integration of Splitska
banka was successfully completed: Splitska
banka d.d. merged into OTP banka Hrvatska dd.,
and the business and technology merger was
completed.
The Croatian P&L account was adjusted for
the one-off items directly related to the
acquisition; these corrections are shown on
consolidated level among the adjustment items.
The balance sheet items were not adjusted
for the acquisition effect.
The Croatian operation (with Splitska banka)
posted HUF 25 billion adjusted profit in 2018.
The annual ROE stood at 9.6%.
The comparability of the financial performance
on a yearly base is limited, as 2017 figures
incorporated only eight months contribution
from Splitska banka, as the consolidation
happened in May 2017.
In 2018 the operating result improved by 23%
y-o-y. Within that net interest income increased
by 22% y-o-y in HUF terms. The decline in
annual net interest margin (–32 bps) was
mainly reasoned by the dilution effect of the
lower margin at Splitska banka.
The annual net fee income surged by 27% y-o-y,
and other net non-interest income increased by
22%, respectively.
In 2018 operating expenses increased by
23% y-o-y. During the whole year 52 branches
were closed down. The number of employees
(based on FTE) decreased by 34 persons.
The cost-to-income ratio at the end of 2018
stood at 54.7%.
2018 total risk cost dropped by 39% against the
base period, as a result the annual credit risk
cost rate declined below 30 bps.
The volume of sold/written off loans volumes
amounted to HUF 7 billion on an FX-adjusted basis.
The DPD90+ ratio of the Croatian operation
decreased to 5.5% (–1.1 pps y-o-y). The Stage 3
ratio under IFRS 9 stood at 7.6% at the end
of 2018.
From a lending point of view, 2018
demonstrated a favourable picture: despite
the ongoing integration process the volume of
performing loans increased by 2% y-o-y.
Total deposit base shrank by 2% y-o-y. On a
yearly base the increase in the volumes of retail
site deposits somewhat offset the decline in
term deposits. The corporate deposit volume
erosion was related to deposit withdrawals by a
couple of large clients.

46 OTP Bank Annual Report 2018
• Highest profitability within the Group (2018 ROE: 56%)
• All-time-high yearly net earnings of HUF 24.4 billion (+78% in UAH terms) mainly as a result
of improving operating profit and halving risk cost due to favourable credit quality trends
• The DPD90+ ratio dropped significantly y-o-y due to write-offs and sales (15.1%)
• Performing loan volumes advanced by 30% y-o-y (FX-adjusted)
OTP BANK UKRAINE
Performance of OTP Bank Ukraine:
Main components of P&L account 2017 2018 Change
HUF million HUF million %
After tax profit without the effect of adjustments 14,120 24,415 73
Income tax (2,954) (4,760) 61
Profit before income tax 17,074 29,175 71
Operating profit 18,876 30,095 59
Total income 34,595 47,145 36
Net interest income 23,060 33,040 43
Net fees and commissions 9,716 11,444 18
Other net non-interest income 1,819 2,661 46
Operating expenses (15,719) (17,050) 8
Total provisions (1,802) (920) (49)
Provision for impairment on loan and placement losses (1,060) (1,680) 59
Other provision (742) 760
Main components of balance sheet closing balances 2017 2018 %
Total assets 312,334 391,240 25
Gross customer loans 287,236 354,258 23
Gross customer loans (FX-adjusted) 314,914 354,258 12
Retail loans 120,845 127,413 5
Corporate loans 173,463 199,493 15
Car financing loans 20,607 27,352 33
Gross DPD0–90 customer loans (FX-adjusted) 231,810 300,724 30
Retail loans 48,545 75,922 56
Corporate loans 166,272 197,693 19
Car financing loans 16,993 27,109 60
Allowances for possible loan losses (90,163) (72,753) (19)
Allowances for possible loan losses (FX-adjusted) (98,746) (72,753) (26)
Deposits from customers 234,943 269,832 15
Deposits from customer (FX-adjusted) 256,762 269,832 5
Retail deposits 106,942 123,833 16
Corporate deposits 149,819 145,999 (3)
Liabilities to credit institutions 33,985 48,197 42
Subordinated debt 0 4,903
Total shareholders’ equity 34,079 57,821 70
Loan Quality 2017 2018 %/pps
Stage 3 loan volume under IFRS 9 (in HUF million) 88,604
Stage 3 loans under IFRS 9/gross customer loans 25.01%
Provision for impairment on loan and placement losses/average gross loans 0.31% 0.51% 0.20
90+ days past due loan volume (in HUF million) 75,922 53,534 (29)
90+ days past due loans/gross customer loans 26.4% 15.1% (11.3)
Total provisions/90+ days past due loans 118.8% 135.9% 17.1
Performance Indicators 2017 2018 pps
ROA 4.6% 6.8% 2.2
ROE 47.1% 55.6% 8.5
Total income margin 11.19% 13.15% 1.95
Net interest margin 7.46% 9.21% 1.75
Cost/income ratio 45.4% 36.2% (9.3)
Net loans to deposits (FX-adjusted) 84% 104% 20
FX rates 2017 2018 Change
HUF HUF %
HUF/UAH (closing) 9.2 10.1 10
HUF/UAH (average) 10.3 9.9 (4)

47
The financial performance and indicators of
OTP Bank Ukraine in HUF terms were affected
by the HUF/UAH exchange rate moves:
in 2018 the closing rate of UAH strengthened by
10% y-o-y. The yearly average rate weakened
by 4% y-o-y. As a result, there are some
differences in local currency P&L and balance
sheets dynamics versus those in HUF terms.
OTP Bank Ukraine posted HUF 24.4 billion
adjusted after tax profit in 2018, marking a
73% increase compared to 2017 (+78% in local
currency terms). The 2018 ROE reached 56%,
the highest among subsidiary banks across the
Group.
Given the significant HUF/UAH cross-currency
moves y-o-y and q-o-q, we rather analyse the
P&L developments in UAH terms.
In 2018 operating result surged by 64% y-o-y in
UAH terms, the key reason was the 48% y-o-y
increase in net interest income and a 21% surge
in net fee and commission income. The y-o-y
NII dynamics were positively influenced by the
growing volume of performing loans (+30% y-o-y,
FX-adjusted) and also by the average interest
paid on deposits being stable in 2018 in spite of
the higher interest rate environment, whereas
interest rates realized on assets developed
favourably. 2018 net interest margin advanced
to 9.21% (+1.75 pps y-o-y).
In 2018 net fee and commission income
surged by 21% y-o-y in local currency terms,
supported by stronger fee income on corporate
transactions and credit cards.
2018 operating expenses in UAH terms
increased by 12% y-o-y mainly on the back of
increasing personnel expenses amid 10.9%
average inflation, whereas the average nominal
wage inflation in Ukraine reached 25% (within
that 29% in the financial sector).
For the whole year risk cost was almost half
of the 2017 figure; provision for impairment
on loan and placement losses to average
gross loans increased by 20 bps to 0.5% y-o-y.
Portfolio quality trends remained positive; the
DPD90+ volumes (FX-adjusted and excluding
the impact of loan sales and write-offs) grew in
2018 by HUF 4 billion.
During the last twelve months around
HUF 40 billion equivalent non-performing loans
were sold or written off. As a result, the DPD90+
ratio dropped to 15.1% (–11.3 pps y-o-y).
The volume of Stage 3 loans within total gross
loans was 25% at the end of 2018.
The FX-adjusted total performing loan book
grew by 30% y-o-y. Within that especially the
volume of retail loans grew dynamically (+56%
y-o-y). The outstanding increase of consumer
exposures (+87% y-o-y) was induced by credit
card and POS volumes. Loan origination in
2018 was outstanding in the POS and cash
loan segments (+80 and +133% in UAH terms
y-o-y, respectively). Mortgage lending has not
been resumed, thus the performing mortgage
book eroded further (–36% y-o-y). Car financing
has been re-started in 1Q 2017 and their
FX-adjusted volumes surged by 60% y-o-y.
Performing corporate exposures that represent
two third of the total loan portfolio grew by
19% y-o-y. Alongside the steady disbursement
activity in the corporate loan segment, the
leasing also demonstrated significant uptick.
Deposits (adjusted for the FX-effect) grew by 5%
y-o-y. As a result, the net loan-to-deposit ratio
still reflects a balanced balance sheet structure
(end-2018: 104%, +20 pps y-o-y, FX-adjusted).
The outstanding net intragroup funding
towards the Ukrainian operation comprised
USD 116 million equivalent at the end of 2018.
Management’s analysis of the 2018 results of the OTP Group

48 OTP Bank Annual Report 2018
OTP BANK ROMANIA
Performance of OTP Bank Romania:
Main components of P&L account 2017 2018 Change
HUF million HUF million %
After tax profit without the effect of adjustments 3,036 3,850 27
Income tax (916) (1,051) 15
Profit before income tax 3,952 4,902 24
Operating profit 9,346 10,585 13
Total income 27,138 30,759 13
Net interest income 19,779 23,410 18
Net fees and commissions 3,064 3,563 16
Other net non-interest income 4,295 3,786 (12)
Operating expenses (17,792) (20,174) 13
Total provisions (5,394) (5,683) 5
Provision for impairment on loan and placement losses (5,062) (4,794) (5)
Other provision (332) (890) 168
Main components of balance sheet closing balances 2017 2018 %
Total assets 624,060 771,968 24
Gross customer loans 535,140 577,565 8
Gross customer loans (FX-adjusted) 557,425 577,565 4
Retail loans 394,082 398,007 1
Corporate loans 163,342 179,558 10
Allowances for possible loan losses (56,909) (35,444) (38)
Allowances for possible loan losses (FX-adjusted) (60,032) (35,444) (41)
Deposits from customers 337,691 434,937 29
Deposits from customer (FX-adjusted) 350,815 434,937 24
Retail deposits 262,980 331,920 26
Corporate deposits 87,835 103,017 17
Liabilities to credit institutions 196,377 232,391 18
Total shareholders’ equity 53,481 60,047 12
Loan Quality 2017 2018 %/pps
Stage 3 loan volume under IFRS 9 (in HUF million) 51,771
Stage 3 loans under IFRS 9/gross customer loans 9.0%
Provision for impairment on loan and placement losses/average gross loans 0.9% 0.9% (0.1)
90+ days past due loan volume (in HUF million) 72,133 29,583 (59.0)
90+ days past due loans/gross customer loans 13.5% 5.1% (8.4)
Total provisions/90+ days past due loans 78.9% 119.8% 40.9
Performance Indicators 2017 2018 pps
ROA 0.5% 0.6% 0.1
ROE 6.8% 7.5% 0.7
Total income margin 4.49% 4.46% (0.03)
Net interest margin 3.27% 3.39% 0.12
Cost/income ratio 65.6% 65.6% 0.0
Net loans to deposits (FX-adjusted) 142% 125% (17)
FX rates 2017 2018 Change
HUF HUF %
HUF/RON (closing) 66.6 69.0 4
HUF/RON (average) 68.9 69.6 1
• The Romanian subsidiary posted HUF 3.9 billion profit in 2018
• The annual operating profit increased by 13% y-o-y as a result of increasing total income
(+13% y-o-y) and higher operating expenses (+13% y-o-y)
• Performing loan volumes (FX-adjusted) increased by 14% y-o-y supported by robust mortgage
and SME lending dynamics

49Management’s analysis of the 2018 results of the OTP Group
OTP Bank Romania posted HUF 3.9 billion net
profit in 2018, by 27% more than in the base
period.
The annual operating profit improved by 13%
y-o-y as a result of higher total income and
higher operating expenses (both items surged
by 13% each).
The annual net interest income improved by
18%y-o-y supported by increasing performing
loan volumes, while annual net interest margin
improved by 12 bps y-o-y in the increasing
interest rate environment.
The annual net fee and commission income
expanded by 16% y-o-y mainly as a result of
higher deposit, transaction and card-related
income. Other net non-interest income dropped
by 12% y-o-y partially due to a loss on securities
and property sales.
The annual operating expenses grew by 13%
y-o-y, within that personnel expenses advanced
even faster partially induced by wage inflation
(in 2018 employers’ average wage costs went
up by more than 8% in the financial sector) and
the average headcount growth (+7% y-o-y)
reasoned by strengthening business activity.
Furthermore, higher marketing, hardware and
office equipment costs also added to the overall
increase of operating expenses,.
The annual amount of total risk cost amounted
to –HUF 5.7 billion, +5% y-o-y.
DPD90+ volumes (FX-adjusted, without sales
and write-offs) declined by HUF 2.6 billion in
2018 (versus an increase of HUF 1.9 billion
in 2017). During 2018 HUF 42 billion problem
loans were sold/written off. The DPD90+ ratio
declined to 5.1% (–8.4 pps y-o-y). The share
of Stage 3 exposures represented 9% of total
gross loans at the end of 2018.
The FX-adjusted performing loan volumes
increased by 14% y-o-y supported both by the
retail and corporate segments. Within the retail
portfolio mortgage volumes demonstrated a 9%
y-o-y growth, whereas SME volumes surged
by 33% y-o-y. The large corporate exposure
advanced by 17% y-o-y. As for annual new loan
disbursements mortgage sales (+56% y-o-y)
and the SME segment (+48% y-o-y) showed
outstanding dynamics.
FX-adjusted deposit volumes increased by 29%
y-o-y. The growth was supported by both retail
and corporate inflows. The net loan-to-deposit
ratio declined to 125%.

50 OTP Bank Annual Report 2018
OTP BANKA SRBIJA (SERBIA)
Performance of OTP banka Srbija (including Vojvodjanska banka):
Main components of P&L account 2017 2018 Change
HUF million HUF million %
After tax profit without the effect of adjustments (2,904) 2,999 (203)
Income tax 109 (138) (226)
Profit before income tax (3,013) 3,137 (204)
Operating profit 1,360 6,227 358
Total income 10,071 30,306 201
Net interest income 7,235 20,514 184
Net fees and commissions 2,275 7,286 220
Other net non-interest income 561 2,507 347
Operating expenses (8,711) (24,079) 176
Total provisions (4,373) (3,090) (29)
Provision for impairment on loan and placement losses (3,133) (3,146) 0
Other provision (1,241) 56 (105)
Main components of balance sheet closing balances 2017 2018 %
Total assets 482,887 590,166 22
Gross customer loans 306,874 395,217 29
Gross customer loans (FX-adjusted) 319,010 395,217 24
Retail loans 162,255 185,641 14
Corporate loans 156,755 209,576 34
Allowances for possible loan losses (19,759) (14,774) (25)
Allowances for possible loan losses (FX-adjusted) (20,534) (14,774) (28)
Deposits from customers 349,553 372,961 7
Deposits from customer (FX-adjusted) 363,123 372,961 3
Retail deposits 248,029 260,623 5
Corporate deposits 115,094 112,338 (2)
Liabilities to credit institutions 38,397 117,169 205
Subordinated debt 2,505 0 (100)
Total shareholders’ equity 80,070 84,848 6
Loan Quality 2017 2018 %/pps
Stage 3 loan volume under IFRS 9 (in HUF million) 18,819
Stage 3 loans under IFRS 9/gross customer loans 4.8%
Provision for impairment on loan and placement losses/average gross loans 2.6% 0.9% (1.7)
90+ days past due loan volume (in HUF million) 28,372 15,322 (46.0%)
90+ days past due loans/gross customer loans 9.2% 3.9% (5.4)
Total provisions/90+ days past due loans 69.6% 96.4% 26.8
Performance Indicators 2017 2018 pps
ROA (2.0%) 0.6% 2.6
ROE (9.5%) 3.7% 13.2
Total income margin 6.84% 5.84% (1.00)
Net interest margin 4.92% 3.95% (0.96)
Cost/income ratio 86.5% 79.5% (7.0)
Net loans to deposits (FX-adjusted) 82% 102% 20
FX rates 2017 2018 Change
HUF HUF %
HUF/RSD (closing) 2.6 2.7 4
HUF/RSD (average) 2.5 2.5 0
• The Serbian operation posted HUF 3 billion profit in 2018, out of which the contribution
of Vojvodjanska banka comprised HUF 2.7 billion
• The annual operating income reached HUF 6.2 billion, 61% of that came from
Vojvodjanska banka
• Performing loan volumes further increased (+31% y-o-y) supported by both the retail
and corporate segments

51Management’s analysis of the 2018 results of the OTP Group
Based on the acquisition agreement signed on
4 August 2017 by OTP banka Srbija a.d. Novi
Sad, the Serbian subsidiary of OTP Bank and
the Group of National Bank of Greece (”NBG”)
on purchasing 100% shareholding held in the
Serbian Vojvodjanska banka a.d. (”VOBAN”) and
NBG Leasing d.o.o. and certain other Serbian
exposures held by the Group of the National
Bank of Greece S.A. the financial closure of
the transaction has been completed on 1st
December 2017 and Vojvodjanska banka was
consolidated.
The comparability of the financial performance
on a yearly base is limited, as the contribution
from Vojvodjanska banka was consolidated
from December 2017.
The transaction on the purchase of Societe
Generale banka Srbija announced on
20 December 2018 has not been completed
yet, as a result 2018 financial statements
incorporated neither the P&L nor the balance
sheet of Societe Generale banka Srbija.
The purchase price has not been made public
on the request of the seller.
The Serbian P&L account was adjusted for
the one-off items directly related to the
acquisitions; these corrections are shown on
consolidated level among the adjustment items.
The balance sheet items were not adjusted for
the acquisition effect.
The Serbian operation (including Vojvodjanska
banka) posted HUF 3 billion profit after tax
in 2018 versus a loss of similar magnitude
in the base period. Out of the annual profit
Vojvodjanska banka added HUF 2.7 billion to
the Serbian after tax profit.
The annual operating profit advanced by
HUF 4.9 billion y-o-y and reached HUF 6.2 billion;
out of the y-o-y improvement the contribution of
Vojvodjanska banka comprised HUF 3.5 billion.
As for the yearly dynamics of income lines
(adjusted by a one months contribution from
Vojvdjanska banka in 2017) net interest income
increased by 16% y-o-y as a result of stronger
interest income on expanding performing loan
volumes; net fees went up by 12% y-o-y due to
improving deposit- and card-related fees.
The annual net interest margin dropped by
96 bps y-o-y and it was partly the result
of the dilution effect through the consolidation
of the lower margin Vojvodjanska banka.
Out of the total volume of operating expenses
around HUF 16.2 billion was related to
Vojvodjanska banka.
Credit quality trends remained favourable. Total
risk costs in 2018 comprised –HUF 3.1 billion.
Bulk of risk costs were booked in 3Q as a result
of the introduction of new collateral appraisal
rules which induced an additional HUF 1.8 billion
lending related provision increase in case of
individually appraised clients.
During 2018 there were HUF 14 billion non-
performing portfolio sales or write-offs,
occurring mainly in 2Q and 4Q. The DPD90+
ratio dropped to 3.9% at the end of 2018.
The volume of Stage 3 exposures amounted to
HUF 18.8 billion at the end of the year, which is
4.8% of total gross loans.
The yearly volume growth of the performing
(DPD0–90) loan portfolio exceeded 31%
demonstrating the most robust increase across
the whole Group. The engine of growth was the
corporate segment (+44% y-o-y, FX-adjsuted) as
a result of strong underwriting dynamics, but
the retail segment also supported the portfolio
increase (+22% y-o-y).
The FX-adjusted deposit base expanded y-o-y
(+3%). The yearly dynamics enjoyed inflows
from the retail and SME segments.
As a result of the fast loan portfolio growth
the net loan-to-deposit ratio of the Serbian
operation surged by 20% y-o-y and closed
around 100% which reflects a well-balanced
balance sheet structure.

52 OTP Bank Annual Report 2018
CRNOGORSKA KOMERCIJALNA BANKA
(MONTENEGRO)
Performance of CKB:
Main components of P&L account 2017 2018 Change
HUF million HUF million %
After tax profit w/o dividends and net cash transfer (155) 2,214
Income tax (11) (326)
Profit before income tax (144) 2,540
Operating profit 1,802 2,605 45
Total income 9,709 10,729 11
Net interest income 6,543 7,529 15
Net fees and commissions 3,319 3,227 (3)
Other net non-interest income (153) (27) (83)
Operating expenses (7,907) (8,125) 3
Total provisions (1,947) (65) (97)
Provision for impairment on loan and placement losses (864) (46) (95)
Other provision (1,083) (19) (98)
Main components of balance sheet closing balances 2017 2018 %
Total assets 197,590 224,892 14
Gross customer loans 138,485 157,043 13
Gross customer loans (FX-adjusted) 143,562 157,043 9
Retail loans 75,662 73,027 (3)
Corporate loans 67,900 83,983 24
Car financing loans 0 33
Allowances for possible loan losses (38,899) (28,265) (27)
Allowances for possible loan losses (FX-adjusted) (40,325) (28,265) (30)
Deposits from customers 152,316 175,740 15
Deposits from customer (FX-adjusted) 158,265 175,740 11
Retail deposits 121,092 131,227 8
Corporate deposits 37,173 44,513 20
Liabilities to credit institutions 17,962 2,364 (87)
Total shareholders’ equity 21,127 38,637 83
Loan Quality 2017 2018 %/pps
Stage 3 loan volume under IFRS 9 (in HUF million) 33,096
Stage 3 loans under IFRS 9/gross customer loans 21.1%
Provision for impairment on loan and placement losses/average gross loans 0.6% 0.0% (0.6)
90+ days past due loan volume (in HUF million) 43,395 27,993 (35.5)
90+ days past due loans/gross customer loans 31.34% 17.82% (13.5)
Total provisions/90+ days past due loans 89.6% 101.0% 11.3
Performance Indicators 2017 2018 pps
ROA (0.1%) 1.1% 1.1
ROE (0.7%) 7.3% 8.0
Total income margin 5.02% 5.09% 0.07
Net interest margin 3.38% 3.57% 0.19
Cost/income ratio 81.4% 75.7% (5.7)
Net loans to deposits (FX-adjusted) 65% 73% 8
FX rates 2017 2018 Change
HUF HUF %
HUF/EUR (closing) 310.1 321.5 4
HUF/EUR (average) 309.2 318.9 3
• In 2018 the Bank posted HUF 2.2 billion profit, which was supported by the substantial
improvement of operating profit and the decline of risk costs
• The annual operating profit increased by 45% y-o-y as a result of the total income increasing
by 11% and the operating expenses by 3%, respectively
• The FX-adjusted performing loan volume grew dynamically, by 31% y-o-y supported mainly
by the corporate segment (+73% y-o-y)
• The DPD90+ ratio (17.8%) declined by 13.5 pps y-o-y

53Management’s analysis of the 2018 results of the OTP Group
The Montenegrin CKB Bank posted HUF 2.2 bil-
lion after tax profit, versus HUF 0.2 billion
loss in the base period. The improvement was
mainly due to operating result increasing by
45% y-o-y and risk cost declining substantially.
The annual operating profit increased by 45%
y-o-y as a result of the total income increasing
by 11% and the operating expenses by 3%,
respectively.
The annual net interest income grew by 15%:
the dynamically increasing performing volumes
had a positive impact. Furthermore, certain
loan-related income previously booked within
net fees and commissions was shifted into
net interest income since January 2018
(HUF 0.3 billion y-o-y impact). The net interest
margin improved by 19 bps y-o-y.
The annual net fee and commission income
declined by 3%, without the above mentioned
reclassification it would have increased by
6.5% y-o-y.
The annual operating expenses increased by
3% mainly due to the depreciation of Hungarian
forint against the euro, the expenses in euro
terms remained stable.
In 2018 total risk cost amounted to –HUF 0.1 bil-
lion. The DPD90+ ratio (17.8%) improved
by 13.5 pps y-o-y. During 2018 HUF 15 billion
non-performing loans were sold/written
off. The share of Stage 3 exposures repre-
sented 21.1% of total gross loans at the end
of 2018.
The FX-adjusted performing loan volume grew
the second fastest in the Group, by 31% y-o-y.
The strong dynamics were mainly related
to the corporate segment. Within that the
wholesale loan volumes increased by 30%
y-o-y, municipality exposures – from a low
base – increased more than four times y-o-y
as a result of a large ticket loan disbursement
towards the state in 2Q. The retail volumes
expanded by 4% y-o-y in 2018, within that the
mortgage loans by 10% y-o-y, respectively.
FX-adjusted deposit volumes increased by 11%
y-o-y. The net loan-to-deposit ratio increased by
8 pps to 73%.

54 OTP Bank Annual Report 2018
* P&L lines and performance indicators are adjusted for the banking tax, Deposit Protection Fund contributions and payments into the Resolution Fund.
OTP BANKA SLOVENSKO (SLOVAKIA)
Performance of OTP Banka Slovensko*:
Main components of P&L account 2017 2018 Change
HUF million HUF million %
After tax profit without the effect of adjustments (2,051) 44 (102)
Income tax (231) (56) (76)
Profit before income tax (1,820) 100 (106)
Operating profit 6,616 2,598 (61)
Total income 17,452 15,014 (14)
Net interest income 13,358 11,148 (17)
Net fees and commissions 3,627 3,536 (3)
Other net non-interest income 467 330 (29)
Operating expenses (10,836) (12,416) 15
Total provisions (8,436) (2,498) (70)
Provision for impairment on loan and placement losses (8,358) (2,579) (69)
Other provision (78) 81 (204)
Main components of balance sheet closing balances 2017 2018 %
Total assets 452,084 454,498 1
Gross customer loans 382,932 393,111 3
Gross customer loans (FX-adjusted) 396,969 393,111 (1)
Retail loans 343,023 340,776 (1)
Corporate loans 53,917 52,320 (3)
Allowances for possible loan losses (28,098) (31,582) 12
Allowances for possible loan losses (FX-adjusted) (29,128) (31,582) 8
Deposits from customers 343,924 360,069 5
Deposits from customer (FX-adjusted) 356,595 360,069 1
Retail deposits 330,742 331,734 0
Corporate deposits 25,853 28,336 10
Liabilities to credit institutions 10,020 22,725 127
Issued securities 51,996 27,328 (47)
Subordinated debt 6,205 8,691 40
Total shareholders’ equity 32,200 29,382 (9)
Loan Quality 2017 2018 %/pps
Stage 3 loan volume under IFRS 9 (in HUF million) 35,916
Stage 3 loans under IFRS 9/gross customer loans 9.1%
Provision for impairment on loan and placement losses/average gross loans 2.17% 0.65% (1.51)
90+ days past due loan volume (in HUF million) 35,968 29,160 (19)
90+ days past due loans/gross customer loans 9.4% 7.4% (2.0)
Total provisions/90+ days past due loans 78.1% 108.3% 30.2
Performance Indicators 2017 2018 pps
ROA (0.5%) 0.0% 0.5
ROE (7.6%) 0.2% 7.7
Total income margin 3.90% 3.32% (0.58)
Net interest margin 2.98% 2.47% (0.52)
Cost/income ratio 62.1% 82.7% 20.6
Net loans to deposits (FX-adjusted) 103% 100% (3)
FX rates 2017 2018 Change
HUF HUF %
HUF/EUR (closing) 310.1 321.5 4
HUF/EUR (average) 309.2 317.5 3
• In 2018 the Bank posted HUF 44 million profit, after HUF 2.1 billion loss in 2017.
Total risk costs dropped by 70%, while the operating profit fell by 61%
• The FX-adjusted performing loan volumes increased by 1% y-o-y
• The DPD90+ ratio (7.4%) decreased by 2 pps y-o-y

55Management’s analysis of the 2018 results of the OTP Group
S TA F F L E V E L A N D O T H E R I N F O R M AT I O N
31/12/2017 31/12/2018
Branches ATM POS Headcount (closing)
Branches ATM POS Headcount (closing)
OTP Core 362 1,945 70,002 9,049 362 1,931 77,599 9,631
DSK Group 367 890 7,005 4,872 345 911 8,464 4,838
OTP Bank Russia* (w/o employed agents) 134 230 1,079 4,956 134 227 905 5,052
Touch Bank* (Russia) 0 0 0 356 – – – –
OTP Bank Ukraine (w/o employed agents) 85 115 382 2,224 87 149 351 2,313
OTP Bank Romania 96 139 4,351 1,163 95 139 4,556 1,273
OTP banka Hrvatska 196 528 10,765 2,430 144 480 10,360 2,397
OTP Banka Slovenko 62 148 276 674 62 151 232 690
OTP banka Srbija 157 254 5,098 2,103 154 248 5,554 1,996
CKB 29 91 4,070 429 28 103 4,572 419
Foreign subsidiaries, total 1,126 2,395 33,026 19,206 1,049 2,408 34,994 18,977
Other Hungarian and foreign subsidiaries* 860 924
OTP Group (w/o employed agents) 29,116 29,532
OTP Bank Russia – employed agents 5,771 5,306
OTP Bank Ukraine – employed agents 747 760
OTP Group (aggregated) 1,488 4,340 103,028 35,633 1,411 4,339 112,593 35,599
* From 2018 OTP Bank Russia includes Touch Bank’s figures, while until 4Q 2017 Touch Bank was showed as a separate entity.
The OTP Banka Slovensko posted HUF 44 mil-
lion after tax profit versus HUF 2.1 billion loss in
the base period.
The annual profit was mainly shaped by
decreasing risk costs (–70% y-o-y), while the
operating profit also suffered a significant
decline (–61% y-o-y): all income lines
decreased, while the operating expenses
increased by 15%. The net interest income
declined by 17% y-o-y, because from 2018
certain items previously booked in net interest
income do not appear on net interest income
line (lower net interest income was coupled
with lower risk costs). Furthermore, the new
disbursements on lower interest rate also had a
negative impact. The annual net interest margin
declined by 52 bps.
The annual net fee and commission income
decreased by 3% due to the lower income on
deposits and loans.
The annual operating expenses increased by
15% y-o-y due to higher personnel expenses
induced by wage inflation and increasing
headcount, but also to higher marketing
expenses.
The FX-adjusted performing loan volumes
increased by 1% y-o-y, the mortgage and
municipality loan volumes registered faster
expansion (both +3% y-o-y). On the other hand
the consumer and SME loans declined by 1%
y-o-y in 2018. The strongest disbursement
activity was realized at the SME and large
corporate loan (+20% y-o-y) segments.
The DPD90+ ratio decreased to 7.4% (–2 pps
y-o-y). In 2018 around HUF 8 billion equivalent
non-performing loans were sold or written
off as part of porfolio cleaning. The share of
Stage 3 exposures represented 9.1% of total
gross loans at the end of 2018. Total risk costs
dropped significantly on a yearly basis (–70%
y-o-y).
FX-adjusted deposit volumes increased by 1%
y-o-y, thus the net loan-to-deposit ratio stood at
100% at the end of 2018.

56 OTP Bank Annual Report 2018
Corporate governance practice
OTP Bank Plc., being registered in Hungary, has
a corporate governance policy that complies
with the provisions on companies of the
act applicable (Civil Code). As the company
conducts banking operations, it also adheres
to the statutory regulations pertaining to credit
institutions.
In accordance with the statutory requirements
and the recommendation concerned, as a listed
company on the Budapest Stock Exchange
(BSE), the company also makes an annual
declaration on its compliance with the BSE’s
Corporate Governance Recommendations.
After being approved by the General Meeting,
this declaration is published on the website of
the BSE (www.bet.hu), the information storage
system operated by National Bank of Hungary
(www.kozzetetelek.hu), and the website of the
Bank (www.otpbank.hu).
The purposes of applying the Corporate
Governance Recommendations of the BSE
is to facilitate the transparent and efficient
market operation, support the enforcement of
the laws as well as harmonise the interests
of the organisation, the investors and the
organisation’s environment.
The Recommendations contain both recom-
mendations that are binding for all organisa-
tions and non-binding proposals. Organisations
may derogate both from binding recommenda-
tions and non-binding proposals. In the event
of derogation from the recommendations,
organisations are required to publish and justify
the derogation in their corporate governance
reports (’comply or explain’). This enables
organisations to take industry and company-
specific requirements into account. Accordingly,
even organisations derogating from the
recommendations can comply with corporate
governance requirements under certain
circumstances. Concerning the proposals,
organisations should indicate whether they
apply a given guideline or not, and they can also
explain any derogation from the proposals.
OTP Bank Plc. provided positive answers to all
recommendations and suggestions.
System of internal controls
The main function of the internal audit system
is to protect customers, the company’s assets
and shareholder’s interests, as well as to
facilitate and monitor operation in compliance
with the statutory provisions.
The internal audit system extends to all of the
company’s organisational units, business lines
and activities, including outsourced activities.
To ensure effective auditing, the internal audit
system consists of several modular control
levels, and is also segmented in line with the
departmental structure of the organisation.
The elements of the internal audit system are
comprised of in-process and management
controls, and an independent internal audit unit
and management information system.
OTP Bank Plc. has developed and applies such
a uniform internal audit system consistently
throughout the Bank Group that is proportionate
to the size of the OTP Group and the market
share of the Company, includes shareholder
audits conducted at the foreign and domestic
group members as well as the professional
oversight of the internal audit organisations
of the financial institutions that are subject to
consolidated supervision as specified in the
Credit Institutions Act. To this end, standardised
internal audit procedures and methodologies
pertaining to the operation and activities of group
members’ internal audit departments are
developed, enhanced and applied on a continu-
ous basis. Internal audit also liaises regularly
and cooperates with external auditing bodies.
The independent internal audit unit assists in
the legally compliant and effective management
of assets and liabilities and the protection of
property; it supports secure business operation,
the effectiveness, cost-efficiency and success
of internal control systems, the minimisation of
risks, and moreover – alongside the compliance
unit – it detects and reports departures from
S TAT E M E N T O N C O R P O R AT E G O V E R N A N C E
P R A CT I C E

57Management’s analysis of the 2018 results of the OTP Group
the provisions of the statutory regulations and
internal policies, makes recommendations for
the elimination of deficiencies, and monitors the
implementation of the measures. It performs
its activities independently, objectively and
professionally. Its independence is ensured
by the fact that it is professionally overseen by
the Supervisory Board, within the framework
set out by the Credit Institutions Act.
The independent internal audit organisation
was set up in a manner that the execution
of ownership controls at the Organisation, in
the network and at the foreign and domestic
group members, as well as the professional
supervision of the foreign and domestic internal
audit organisation is properly ensured.
The independent internal audit organisation has
an annual audit plan which is approved by the
Supervisory Board. The annual plan is prepared
using a risk-based methodology and, in addition
to focusing on the areas that entail regulatory,
business and operational risk, and the other
main risk exposures, it emphasizes especially
the control of reporting and data, further, it also
takes into account the company’s prevailing
strategic priorities.
The independent internal audit organisation
has unrestricted access to information,
documents and data necessary for conducting
investigations, and is kept informed of changes
in group structure, risks, and priorities.
The internal audit organisation makes
independent reports on its auditing activities
for the management bodies at quarterly and
annual intervals. In its quarterly reports it
gives a group-level, summary account of the
audits conducted in the given quarter, the risks
identified in the course of its own audits and
audits conducted by the authorities, and the
success of any action taken to eliminate them.
In exceptional cases that require immediate
intervention, it provides the management with
extraordinary briefings. The audit organisation
reports annually on the performance of the
tasks stipulated in the group-level annual
audit schedule, the audits conducted and other
activities, and on the circumstances of the
organisation’s operation, as well as on any
changes to the internal audit system.
The organisation annually prepares, for the
Supervisory Board, objective and independent
report in respect of the operation of risk
management, internal control mechanisms
and corporate governance functions, and in
accordance with the Credit Institutions Act
annually reports to the Supervisory Board
and the Board of Directors on the regularity of
internal audit tasks, professional requirements
and the conduct of audit, as well as on the
review of compliance with the IT and other
technical requirements for audits.
The basis for effective group-level risk
management is the operation of a standardised,
”OTP-compatible” organisational structure
as well as regulations and procedures at the
subsidiaries concerned. The Company has
detailed risk management rules for each of the
various types of risk (liquidity, market, country,
counterparty, credit, operational, compliance),
and these rules are in harmony with the
statutory regulations pertaining to prudential
banking operations. The annual report
describes the risk management practices, the
limits, and compliance with these limits.
Within the Company, the Credit Approval and
Risk Management Division and the Strategy
and Finance Division exercise functional
control over the guidelines, methodology
and infrastructure of the Bank Group’s risk
management strategy, the purpose of which
is to create a clearly defined, transparent,
standardised credit, country, counterparty,
market and operational risk management
system at group level which complies with
the expectations of the supervisory authority
and local conditions. The Bank Group’s
Risk Strategy, as well and the rules on risk
prescribed by the Credit Institutions Act, are
approved by the Bank’s Board of Directors.
The Risk Strategy determines, with respect to
the entire Bank Group, the framework for risk
management and the principles and guidelines
of risk assumption.
With respect to the cornerstones of the risk
management methodologies, and the main
risk topics for Bank Group members, the final
decision-making competence is held by the
Group members’ risk committees (Credit and
Limit Committee, Workout Committee, Group
Operational Risk Committee).
The Bank’s risk management system encom-
passes the identification of the risks, assess-

58 OTP Bank Annual Report 2018
ment of their impact, elaboration of the neces-
sary action plans, and the monitoring of their
effectiveness and results. The management
make their business decisions in a knowledge
of all the key risks. All significant risks related
to internal and external operations, or to
compliance with financial and legal require-
ments, as well as numerous other risks, are
evaluated and managed using a clearly-defined
and transparent internal mechanism.
In adopting its accounting policy and defining
its accounting order the Bank uses its own
control mechanisms and processes ensuring
properly to reach the following goals: to draw
up reliable financial reports, to carry out various
successful and effective operations for the
company, to comply with the legislation in force
and to fully comply with the provisions related
to the supplying of data to the Regulators. All
competencies of the banking units responsible
for drawing up the report and the accounting
control are set up in an internal regulation
instrument.
The internal regulation shall define the closing
competencies and data supplying necessary
for drawing up the interim (monthly, quarterly
and six-month) and the annual disclosure
reports. It provides a complete guidance for
the interim (monthly, quarterly, six-month) and
the annual closing competencies, tasks and
supplying of data. The internal regulation sets
up deadlines and appoints responsible officers
for the tasks.
The internal regulation also orders the inventory
and conciliation of ledger records containing
provisional registration of items which – for
various reasons – could not be immediately
cleared on a real account of assets/liabilities
or on the general ledger accounts serving for
registration of items outside the balance sheet
at the time when they emerged.
Act no. 100 of 2000 on Accounting (IFRS)
provides that the report shall rest on an
inventory. Internal regulation sets detailed
rules of inventory tasks in order to ensure a
genuine balance sheet rest on proper definition
of stocks of assets and liabilities, to check the
bookkeeping and the accountancies and to
reinforce this way the documentary discipline,
to protect belongings, to explore inventories of
decreased value and the assets out of use.
Furthermore, the Bank draws up and applies a
detailed accounting system and continuously
adapts new accounting measurements related
the actual products and activities. Internal
regulations on accounting are revised annually
and updated if necessary. The legal, the internal
audit and the compliance area are involved in
the drafting and amending of these regulations.
General meeting, Articles
of Association
The General Meeting is the supreme governing
body of OTP Bank Plc. The regulations
pertaining to its operation are set forth in the
Company’s Bylaws, and comply fully with both
general and special statutory requirements.
Information on the General Meeting is available
in the Corporate Governance Report.
Regulations and information to be
presented in the Business Report
concerning securities conferring
voting rights issued by the Company
and senior officials, according to
the effective Articles of Association,
and ownership structure
The Company’s registered capital is
HUF 28,000,001,000 that is twenty-eight
thousand million one thousand Hungarian forint,
divided into 280,000,010 that is Two hundred
and eighty million and ten dematerialised
ordinary shares with a nominal value of
HUF 100 each, and a total nominal value
of HUF 28,000,001,000 that is twenty eight
billion one thousand Hungarian forint.
The ordinary shares of the Company specified
all have the same nominal value and bestow the
same rights in respect of the Company.
There are no restrictions in place concerning
the transfer of issued securities constituting the
registered capital of the Company.
No securities with special control rights have
been issued by the Company.
The Company does not run control systems
prescribed by an employee ownership program,
where control rights are not exercised directly
by the employees.

59Management’s analysis of the 2018 results of the OTP Group
Rules on the restrictions of the voting rights:
The Company’s ordinary shares confer one vote
per share.
An individual shareholder or group of share-
holders may not exercise voting rights in respect
of in an extent exceeding 25%, or – if the voting
rights of another shareholder or group of
shareholders exceed 10% – exceeding 33% of
the total voting rights represented by the shares
conferring voting rights at the Company’s
General Meeting.
The shareholder is obliged to notify the
Company’s Board of Directors without delay
if the shareholder directly or indirectly, or
together with other shareholders in the same
group of shareholders, holds more than 2%
of the voting rights represented by the shares
conferring voting rights at the Company’s
General Meeting. Concurrently with this,
the shareholder is obliged to designate the
shareholders through which the indirect voting
right exists, or the members of the group of
shareholders. In the event of a failure to provide
such notification, or if there are substantive
grounds for assuming that the shareholder has
made a misleading declaration regarding the
composition of the shareholder group, then the
shareholder’s voting right shall be suspended
and may not be exercised until the shareholder
has met the above obligations. The notification
obligation stipulated in this paragraph and the
related legal consequences are also incumbent
upon individuals who are classified or may
be classified as the Company’s shareholders
under Article 61 of the Capital Markets Act.
The Company must also be provided with
proof of the conditions for exemption from
the notification obligation in accordance with
Section 61 (7)–(8) and Section 61 (10)–(11)–(12),
of the Capital Markets Act.
Shareholder group: the shareholder and
another shareholder, in which the former
has either a direct or indirect shareholding
or has an influence without a shareholding
(collectively: a direct and/or indirect influence);
furthermore: the shareholder and another
shareholder who is exercising or is willing
to exercise its voting rights together with the
former shareholder, regardless of what type of
agreement between the participants underlies
such concerted exercising of rights.
For determining the existence and extent of
the indirect holding, the rules of the Credit
Institutions Act relating to the calculation of
indirect ownership shall be applied.
If the voting rights that may be exercised by
a shareholder group exceed the threshold
stipulated in the first paragraph of this section,
the voting rights shall be reduced in such
a way that the voting rights relating to the
shares most recently acquired by the group of
shareholders shall not be exercisable.
If there are substantive grounds to presume
that the exercising of voting rights by any
shareholder or shareholders might result in
a breach of the rules of the Capital Markets
Act relating to the acquisition of a controlling
interest, the Board of Directors’ authorised
representative responsible for the registration
of shareholders at the venue of the General
Meeting, or the Chairman of the General Meeting,
may exclude the affected shareholders from
attending the General Meeting or exercising
voting rights.
The General Meeting has exclusive authority
with respect to the decision regarding the
delisting of the shares (qualified majority).
The Company is not aware of any kind of
agreements among the owners that could give
rise to the restriction of the transfer of issued
securities and/or the voting rights.
Rules on the appointment and removal of
executive officers, and rules on amendment of
the Articles of Association:
The Board of Directors has at least 5, and up to
11 members.
When making the decisions, shares embodying
multiple voting rights shall represent one share.
The members of the Board of Directors are
elected by the General Meeting based on its
decision uniformly either for an indefinite period
or for five years; in the latter case the mandate
ends with the General Meeting concluding
the fifth financial year following the election.
The mandate of a member elected during this
period expires together with the mandate of the
Board of Directors.
The Board of Directors elects a Chairman
and, may elect one or more Deputy Chairmen,
from among its own members, whose period
of office shall be equal to the mandate of the
Board of Directors. The Chairman of the Board
60 OTP Bank Annual Report 2018
of Directors is also the Chief Executive Officer
(Chairman & CEO) of the Company.
The membership of the Board of Directors
ceases to exist by
a) expiry of the mandate,
b) resignation,
c) recall,
d) death,
e) the occurrence of grounds for disqualification
as regulated by law,
f) termination of the employment of internal
(executive) Board members.
The General Meeting has exclusive authority
with respect to the following matters:
• the recall of members of the Board of
Directors, the Supervisory Board and Audit
Committee, and of the auditor; (qualified
majority)
More than one third of the members of the
Board of Directors and the non-executive
members of the Supervisory Board may be
recalled within a 12-month period only if
any shareholder holds more than 33% of the
shares issued by the Company, which have
been obtained by the shareholder by way of a
public purchase offer.
• except in the cases referred by these Articles
of Association to the authority of the Board of
Directors, the establishment and amendment
of the Articles of Association; (qualified
majority); the General Meeting decides on
proposals concerning the amendment of
the Articles of Association – based on a
resolution passed by shareholders with a
simple majority – either individually or en
masse.
The Board of Directors is exclusively authorised
to make decisions regarding any change in the
Company’s name, registered office, permanent
establishments and branches, and in the
Company’s activities – with the exception of its
core activity – and, in relation to this, to modify
the Articles of Association should it become
necessary to do so on the basis of the Civil Code
or the Articles of Association.
The Board of Directors is obliged to
• prepare the Company’s financial statements
in accordance with the Accounting Act, and
make a proposal for the use of the profit after
taxation;
• prepare a report once a year for the General
Meeting, and once every three months for the
Supervisory Board, concerning management,
the status of the Company’s assets and
business policy;
• provide for the proper keeping of the
Company’s business books;
• perform the tasks referred to its authority
under the Credit Institutions Act,
in particular:
• ensuring the integrity of the accounting
and financial reporting system;
• elaborating the appropriate strategy and
determining risk tolerance levels for each
business unit concerned;
• setting risk assumption limits;
• providing the necessary resources for
the management or risk, the valuation of
assets, the use of external credit ratings
and the application of internal models.
The following, in particular, come under the
exclusive authority of the Board of Directors:
• election of the Chairman & Chief Executive
Officer of the Company, and exercising
employer’s right in respect thereof;
• election of one or more Deputy Chairmen of
the Board of Directors;
• determination of the annual plan;
• the analysis and assessment of the
implementation of business-policy guidelines,
on the basis of the Company’s quarterly
balance sheet;
• decisions on transactions referred to the
authority of the Board of Directors by the
Company’s organisational and operational
regulations;
• decision on launching, suspending, or
terminating the performance of certain
banking activities within the scope of the
licensed activities of the Company;
• designation of the employees entitled to sign
on behalf of the Company;
• decision on the increasing of registered
capital at the terms set out in the relevant
resolution of the General Meeting;
• decision to acquire treasury shares at the
terms set out in the relevant resolution of the
General Meeting;

61Management’s analysis of the 2018 results of the OTP Group
• decision on approving internal loans in
accordance with the Credit Institutions Act;
• decision on the approval of regulations that
fundamentally determine banking operations,
or are referred to its authority by the Credit
Institutions Act. The following shall qualify as
such regulations:
• the collateral evaluation regulations,
• the risk-assumption regulations,
• the customer rating regulations,
• the counterparty rating regulations,
• the investment regulations,
• the regulations on asset classification,
impairment and provisioning,
• the organisational and operational
regulations, which contain the regulations
on the procedure for assessing requests
related to large loans,
• the regulations on the transfer of signatory
rights;
• the decision on approving the Rules of
Procedure of the Board of Directors;
• decision on steps to hinder a public takeover
procedure;
• decision on the acceptance of a public
purchase offer received in respect of treasury
shares;
• decision on the commencement of trading in
the shares in a regulated market (flotation);
• decision on the cessation of trading in the
shares in a given regulated market, provided
that the shares are traded in another
regulated market (hereinafter: transfer).
The Board of Directors is exclusively
authorised to:
• decide, in the cases specified in the Civil Code,
on acceptance of the Company’s interim
balance sheet, subject to the prior approval of
the Supervisory Board;
• decide, instead of the General Meeting, to
pay an advance on dividends, subject to the
preliminary approval of the Supervisory
Board;
• make decisions regarding any change in
the Company’s name, registered office,
permanent establishments and branches,
and in the Company’s activities – with the
exception of its core activity – and, in relation
to this, to modify the Articles of Association
should it become necessary to do so on
the basis of the Civil Code or the Articles of
Association;
• make decision on mergers (if, according
to the provisions of the law on the
transformation, merger and demerger of
legal entities, the approval of the General
Meeting is not required in order for the
merger to take place).
The Board of Directors directly exercises
employer’s rights in respect of the Chairman &
CEO. The person affected by a decision may not
participate in the decision making. Employer
rights in respect of the executive directors of
the Company are exercised by the Board of
Directors through the Chairman & CEO, with
the proviso that the Board of Directors must
be notified in advance of the appointment and
dismissal of the Deputy CEOs. With regard to
issues related to the exercising of employer’s
rights in respect of employees, the Company is
represented by the Chief Executive Officer and
by the senior company employees defined in
the Organisational and Operational Regulations
of the Company, in accordance with the
delegation of authority approved by the Board
of Directors.
The Board of Directors may delegate, to
individual members of the Board of Directors, to
executive directors employed by the Company,
and to the heads of the individual service
departments, any task that does not come
under the exclusive authority of the Board of
Directors in accordance with these Articles of
Association or a General Meeting resolution.
The Company may acquire treasury shares in
accordance with the rules of the Civil Code. The
prior authorisation of the General Meeting is not
required for the acquisition of treasury shares
if the acquisition of the shares is necessary
in order to prevent a direct threat of severe
damage to the Company (this provision is not
applicable in the event of a public purchase
offer aimed at buying up the Company’s
shares), as well as if the Company acquires
the treasury shares in the context of a judicial
procedure aimed at the settlement of a claim to
which the Company is entitled, or in the course
of a transformation.
The Company has not made agreements in the
meaning of points (j) and (k) in paragraph 95/A
of Act No. C of 2000 on Accounting.

62 OTP Bank Annual Report 2018
Ownership structure of OTP Bank Plc.:
Shareholders with over/around 5% stake as at 31 December 2018:
Total equity
Description of owner 1 January 2018 31 December 2018
Ownership share
Voting rights
Quantity1
Ownership share
Voting rights
Quantity1
Domestic institution/company 20.04% 20.26% 56,116,209 19.32% 19.47% 54,092,340
Foreign institution/company 63.73% 64.44% 178,445,190 60.01% 60.49% 168,017,080
Domestic individual 3.92% 3.97% 10,988,183 3.53% 3.56% 9,896,546
Foreign individual 0.23% 0.23% 650,713 0.10% 0.10% 278,348
Employees, senior officers 0.80% 0.81% 2,250,991 0.85% 0.86% 2,376,450
Treasury shares2 1.09% 0.00% 3,063,853 0.80% 0.00% 2,242,143
Government held owner 0.08% 0.08% 226,012 0.08% 0.08% 219,072
International Development Institutions 0.03% 0.03% 70,502 0.05% 0.05% 143,308
Other3 10.07% 10.18% 28,188,357 15.26% 15.39% 42,734,723
Total 100.00% 100.00% 280,000,010 100.00% 100.00% 280,000,010
Name Number
of shares
Ownership1 Voting
rights1, 2
MOL (Hungarian Oil and Gas Company Plc.) 24,000,000 8.57% 8.64%
KAFIJAT Ltd. 20,811,325 7.43% 7.49%
OPUS Securities S.A. 14,496,476 5.18% 5.22%
Groupama Group 14,338,498 5.12% 5.16%
Number of treasury shares held in the year under review (2018):
1 January 31 March 30 June 30 September 31 December
OTP Bank 990,293 997,581 633,956 543,770 168,583
Subsidiaries 2,073,560 2,073,560 2,073,560 2,073,560 2,073,560
Total 3,063,853 3,071,141 2,707,516 2,617,330 2,242,143
1 Voting rights in the General Meeting of the Issuer for participation in decision-making. 2 Treasury shares do not include the OTP shares held by ESOP.3 Non-identified shareholders according to the shareholders’ registry.
1 Rounded to two decimals.2 Voting rights in the General Meeting of the Issuer for participation in decision-making.
5 Personal changes can be found in the ”Personal and organizational changes” chapter.
Committees5
Members of the Board of Directors
Dr. Sándor Csányi – Chairman
Mr. Antal György Kovács
Mr. László Wolf
Mr. Mihály Baumstark
Dr. Tibor Bíró
Mr. Tamás Erdei
Dr. István Gresa
Dr. Antal Pongrácz
Dr. László Utassy
Dr. József Vörös
Members of the Supervisory Board
Mr. Tibor Tolnay – Chairman
Dr. Gábor József Horváth – Deputy Chairman
Mr. Dominique Uzel
Mr. Olivier Péqueux
Dr. Márton Gellért Vági
Ms. Ágnes Rudas
Mr. András Michnai
Members of the Audit Committee
Dr. Gábor József Horváth – Chairman
Mr. Tibor Tolnay
Mr. Dominique Uzel
Mr. Olivier Péqueux
Dr. Márton Gellért Vági
The résumés of the committee and board members are available in the Corporate Governance
Report/Annual Report.

63Management’s analysis of the 2018 results of the OTP Group
Personal and organizational changes
Mr. Dominique Uzel resigned his membership
from the Supervisory Board and Audit
Committee with effect from 13 April 2018.
The Annual General Meeting elected Mr. Olivier
Péqueux as members of the Supervisory
Board of the Company until the Annual
General Meeting of the Company closing
the 2019 business year, but not later than
30 April 2020.
The Annual General Meeting elected Olivier
Péqueux as members of the Audit Committee of
the Company until the Annual General Meeting
of the Company closing the 2019 business year
but not later than 30 April 2020.
The Annual General Meeting elected Deloitte
Auditing and Consulting Ltd. (000083, H-1068
Budapest, Dózsa György út 84/C) as the Bank’s
auditor to audit OTP Bank Plc.’s separate and
consolidated annual financial statements
in accordance with International Financial
Reporting Standards for the year 2018, from
1 May 2018 until 30 April 2019.
Based on the decision of the Board of Directors
Dr. Zsolt Barna – possessing the necessary
supervisory permission – was appointed as
General Deputy Chief Executive Officer from
1 September 2018 to run the Group Governance
and Operations Division.
Operation of the executive boards
OTP Bank Plc. has a dual governance structure,
in which the Board of Directors is the Company’s
executive body, while the Supervisory Board
performs oversight tasks. The effective operation
of Supervisory Board is supported by the Audit
Committee.
In order to assist the performance of the
governance functions the Board of Directors
founded and operates, as permanent or special
committees, such as the Management Committee
or the Remuneration Committee, the Nomination
Committee and the Risk Assumption and Risk
Management Committee. To ensure effective
operation OTP Bank Plc. also has a number of
other permanent and special committees.
OTP Bank Plc. gives an account of the activities
of the executive boards and the committees
every year in its Corporate Governance Report.
The Board of Directors held 6, the Supervisory
Board held 7 meetings, while the Audit
Committee gathered
2 times in 2018. In addition, resolutions were
passed by the Board of Directors on 102, by
the Supervisory Board on 48 and by the Audit
Committee on 24 occasions by written vote.
Policy of diversity
OTP Bank Plc. determines and regulates the
criteria for the selection of senior executives in
line with European Union as well as domestic
legal requirements and directives fundamentally
determining the operation of credit institutions.
When designating members of the management
bodies (Board of Directors, Supervisory Board)
as well as appointing members of the Board
of Directors and administrative members
(Management), OTP Bank Plc. considers the
existence of professional preparation, the high-
level human and leadership competence, the
versatile educational background, the wide-
spread business experience and business
reputation of the utmost importance, at the
same time, it is also highly committed to taking
efficient measures in order to ensure diversity
with regard to corporate operation, including
the gradual improvement in women’s participa-
tion rate.
With this in mind, OTP Bank Plc.’s Nomination
Committee continuously keeps tracking the
European Union and domestic legislation
relating to women’s quota on its agenda, in that
when unambiguously worded expectations are
announced, it promptly takes the necessary
measures.
It is important to note, however, that, as a public
limited company, the selection of the members
of the management bodies falls within the
exclusive competence of the General Meeting
upon which – beyond its capacity to designate
enforcing the above aspects to maximum effect –
OTP Bank Plc. has no substantive influence.
For the purposes of OTP Bank Plc.’s Articles of

64 OTP Bank Annual Report 2018
OTP Group reports on its social, environmental
and wider economic impacts and performance
primarily in its Sustainability Report.
Information on these matters is also included
in the Business Report in order to comply
with the relevant provisions in the Accounting
Act, while also adhering to the principle of
keeping the duplication of information to the
minimum. The Sustainability Report for 2018
is a group-level report that meets the GRI
(Global Reporting Initiative) Standard and is
certified by an independent third party.
It is available at the Sustainability section of
OTP Bank’s website.
Commitment to society
Responsible financial services,
credit risk management
Our products and services are aimed at
helping our customers meet their needs and
achieve their financial goals. We are always
on the lookout for new opportunities, and are
continuously working to improve our operations
and services in order to better meet new
challenges and demands. We remain reliable
partners for our customers. Transparent and
prudent operations are the cornerstone of all
our activities, and maintaining the stability
of the Banking Group is one of our most key
priorities.
Security is also a top concern, with IT security
specifically becoming increasingly prominent.
We are focusing on the use of increasingly
advanced security systems, and on raising
awareness among our employees and
customers. Our low number of security
incidents – even by international standards –
speaks for itself, and is proof of the effective
operation of our security systems.
We shape our risk management principles
and practices in accordance with the criteria
of responsible lending. Our loan assessment
system helps avoid over-indebtedness.
We invest and lend the money deposited with
us in a manner that ensures its repayment
and does not serve purposes that are illegal or
contrary to the values of our society.
This delicate balance is maintained by:
• our strict Risk Management Policy,
• our annually revised Lending Policy,
• our continuously updated credit approval
system.
In 2018, we continued to pay special attention
to customers facing payment difficulties.
In addition to the government programmes
available, we also provided credit protection
services, as well as unique solutions tailored
to individual customer needs. We have worked
to simplify and clarify our notifications and
statements in an effort to make it even easier
for our customers to keep themselves informed.
Our website now also includes information on
special payment options available for those
finding themselves facing unexpected life
challenges.
OTP Group’s clear objective is to serve its
customers faultlessly. Our Complaint Manage-
ment Regulation and Complaint Management
Policy are available to view in our branches
and on our website.
E N V I R O N M E N TA L P O L I C Y ,
E N V I R O N M E N TA L P R O J E CT S
Association, a Board of Directors comprising
5–11 members and a Supervisory Board
comprising 5–9 members are set up at the
Bank. The Board of Directors in its current
form operates with 10 members and has no
female member, while the Supervisory Board
comprises 6 members and has one female
member as of 15 April, 2016. The management
of OTP Bank Plc. currently comprises
7 members and has no female member.

65Management’s analysis of the 2018 results of the OTP Group
OTP Bank* 2018
Number of warranted complaints 101,858
Proportion of warranted complaints 65%
Compensation paid (HUF million) 59
* Also includes data for OTP Lakástakarék and OTP Jelzálogbank.
Customer complaint features:
Accessibility
As part of our Accessibility Strategy, we are
continuously working to make both OTP Bank’s
digital services and our physical branches more
accessible. The improvements are implemented
by OTP Bank via a number of dedicated projects
in cooperation with many civil and professional
organisations such as the Hungarian Association
of the Deaf and Hard of Hearing, the IT Founda-
tion for the Visually Impaired, the Speech
Technology and Smart Interaction Laboratory of
the Budapest University of Technology, as well
as Hand in Hand Foundation.
Our homepage redesign also included
integrated accessibility improvements, support
for text-to-speech software, keyboard shortcuts
and closed captioning for our video content.
In 2018, physical accessibility continues to be
provided in all but one of our branches6. In one-
third of our branches, we also have tactile signs
for the convenience of the visually impaired. Our
branch queue management system has offered
the option to request special services for
persons with reduced mobility or persons who
are deaf or hard-of-hearing for several years
now. In addition, we have added physical push-
buttons with touch controls, as well as Braille
signs providing further information. KONTAKT
Interpreter Services are accessible at 43 of our
branches nationwide, allowing a sign language
interpreter to assist with administration tasks
through live video chat. Induction loop amplifier
systems are also available, and 25 of our high-
traffic branches have employees who can serve
customers using sign language.
As of the end of 2018, 250 of our ATMs now
have text-to-speech software installed.
After connecting the earphones, the ATMs
automatically switch to ”speech mode”, and
in addition to the on-screen information, the
software will help customers use the device,
manage the platform and find the keyboard and
the cash slot.
In addition to improving the accessibility
of our own environment, we also consider
raising social awareness to be an important
responsibility. 2018 saw us launching a
nationwide awareness-raising campaign to
draw attention to the importance of the issue,
while also providing the public with useful,
easy-to-implement, practical advice.
Citizenship
OTP Bank is one of the most generous
charitable donors in Hungary. In 2018, we have
given a total of HUF 2,027 million in charitable
donations. Our focus continues to be on:
• developing financial literacy, attitude-shaping;
• sponsoring culture and the arts: creating and
preserving values;
• creating equal opportunities: helping the
disadvantaged and those in need; and
• sports.
We aim to provide actual and effective help by
supporting programmes and causes that serve
the interests of society as a whole. Our founda-
tions play a prominent role in the efficient
allocation of donations, boasting a high level of
professionalism and results-oriented thinking
that fully meets our company’s standards. The
OTP Fáy András Foundation provides financial
and economic education services, with the
management of the OK Educational Centre being
a key element thereof. The Humanitas Social
Foundation provides healthcare and education-
related donations to vulnerable communities
and individuals. In order to use resources
efficiently and productively, we cooperate with
several local non-governmental organizations,
concentrating our donated funds and monitoring
how they are used, and with what results.
6 Accessibility is not feasible at a single branch due to the characteristics of its building and environment.

66 OTP Bank Annual Report 2018
Responsible employment
Our employees play a key role in OTP Bank’s
success. Our aim is to create an inspirational
and supportive environment for our employees,
where they can demonstrate their talent and
competencies.
Ethical and compliant behaviour constitute
the basic principles in our human resource
management. The interests of our employees
are represented by their trade union, with their
Collective Agreement setting out their rights
and obligations. In our Code of Conduct, our Bank
declares its commitment to providing a safe
and healthy working environment and states
its expectation of mutual respect between
executives and employees, including the
prohibition of discrimination and harassment.
We use a number of tools to support the
retention of our highly capable and dedicated
employees. We believe it is vital to have a fair
and uniform assessment system focusing
on core competencies, and to provide career
opportunities based on fully transparent princi-
ples and requirements. We consistently employ
the principle of ”equal pay for equal work”.
We consider the professional development of
our employees to be a top priority. In addition
to professional training and competence
development, we also run a talent programme.
We regularly evaluate our level of employee
satisfaction. We encourage healthy lifestyle
choices, offering a complex health insurance
package and subsidizing recreation and sports.
We provide options for flexible working hours
and part-time employment, within the objective
limitations enforced by the various duties as
outlined in our job descriptions. In addition, an
increasing number of our employees are able to
partially work from home.
Environmental protection
Environmental protection principles
OTP Group is committed to the protection of
the environment and the preservation and low-
impact use of natural resources. OTP Bank’s
environmental activities are regulated in its
Environmental Regulation. The Regulation
both ensures legal compliance, and aims
to consider environmental criteria and integrate
them into the Bank’s business operations in
order to minimize the environmental impacts
of operating and maintaining the Bank’s
organization. The Regulation also sets out
the rules on how to enforce the principles
of sustainable procurement. OTP Group
members operate in full compliance with
environmental legislation and received
no fines in 2018 either.
The Group does not finance transactions that
do not meet environmental requirements.
The availability of the required permits and
authorizations and compliance with their
provisions is always verified by external
consultants; thereafter the Bank’s monitoring
activity provides for compliance. The long-term
sustainability of environmental impacts is taken
into consideration as a subjective factor in the
credit ratings of large corporate clients.
OTP Group’s main environmental protection
aims are to improve its energy efficiency and to
reduce the amount of paper it uses.
Energy consumption and business
travel
OTP Group uses state-of-the-art technology
in new construction and renovation projects.
The refurbishment of heat centres and
* Compared to the end-of-year headcount; includes termination of employment both by employee and employer, as well as retirement.
31 December 2018 Total Men Women
Employees, total (no. of persons) 8,725 2,617 6,108
Distribution by gender: 100% 30% 70%
Fluctuation ratio* 13% 13% 13%
OTP Bank’s employees:

67Management’s analysis of the 2018 results of the OTP Group
OTP Bank 2018
Total energy consumption* (GJ) 250,660
Per-capita energy consumption** (GJ) 28.82
Energy consumption quantities:
* Energy consumption data are derived from readings; the measured consumption quantities are converted to energy at the local
average calorific values.
** The projection basis for the per-capital figure is the average statistical headcount.
related energy efficiency efforts are a key
priority in the ongoing renovation of branches
and bank centres. As part of the renovation
process, we are also replacing air conditioning
units, ensuring that the new units use
environmentally friendly coolants. OTP Bank’s
new head office building will have LEED Gold
certification. In 2018, we made further progress
by refurbishing 13 branches of the parent bank
to use LED lighting. The use of LED lighting
continued to gain ground in our Serbian,
Russian and Ukrainian subsidiaries in 2018.
Our Ukrainian subsidiary also introduced
automatic power saving mode for computers
that had been inactive for a long time.
We are intensifying our reliance on renewable
energy due to financial considerations.
We added a new solar panel to the solar arrays
installed at OTP Bank’s Hungarian branches in
2018. As a result, our systems generated a total
of 1,996 GJ of solar power. The central archives
facility owned by Monicomp Ltd. has been
using geothermal energy for several years. We
are planning to install additional heat pumps
in 2019. The solar panels of the Croatian OTP
banka Hrvatska generated a total of 144 GJ of
solar power in 2018.
The number of business trips and the size of
the vehicle fleet is shaped by the changes in
business activities, and it is our practice to
plan all trips on a rational basis. OTP Bank
introduced CO2 emission limits in its vehicle
policy in 2018. However, last year both our
number of vehicles and the total distance
travelled saw a 10% increase, due to company
cars becoming available to a larger segment
of our workforce. The number of electric cars
owned by OTP Bank remained 2.
It will be possible to cut down on the amount of
business travel by using video conferencing, an
option that we are using more and more each
year. In 2018, the number of videoconferencing
rooms increased in the parent bank, as well
as in the Bulgarian, Romanian and Russian
subsidiaries. We continue adding new bicycle
storage facilities for our customers and
employees; in 2018 we installed storage space
for approximately 100 new bicycles at the
central buildings of OTP Bank, with changing
rooms and showers also available within the
installations. 58% of our branches nationwide
have bicycle storage facilities. Our Ukrainian
subsidiary also expanded its number of bicycle
storage facilities.
We present the energy consumption figures
of OTP Bank. The Bank’s overall energy
consumption did not change compared to the
previous year. However, due to our workforce
expansion, this represents an 8% reduction in
per capita energy consumption. Alongside the
implementation of energy-efficient solutions,
there has been an expansion in functions that
consume energy (e.g. digital processes, more
brightly lit workplaces, air conditioners, water
dispensers), and our vehicle fleet has also been
expanded.
Working to reduce paper use
For several years now, OTP Group has been
working to reduce paper use and printing
both in internal processes and as regards the
documents and account statements delivered to
customers. However, legislative requirements
and the expansion of our business have often
counteracted this aim. In 2018, the extensive
use of digital signature pads at OTP Bank, as
well as a reduction in the amount of paper
forms required by the branch network, helped
reduce our paper consumption by almost 25%
in total. Our Croatian subsidiary reduced their
paper consumption by 50% compared to the
previous year.

68 OTP Bank Annual Report 2018
OTP Bank has used recycled paper for its
account statements and marketing publications
for years, and uses recycled paper for some of
its office paper needs. Our aim is to increase the
proportion of the latter in the near future. Our
Croatian subsidiary has been using recycled
paper almost exclusively for several years.
Sustainable use and waste
management
We follow a principle of using all our equipment,
devices and machines for the longest reasonably
possible time. We explicitly aim to use furniture
up to the end of their lifecycle, using them
multiple times and ensuring compatibility.
OTP Bank, DSK Bank, OTP Bank Romania and
OTP banka Srbija all follow the practice of
making charitable donations of any furniture
no longer used but in good condition, alongside
functioning IT equipment (mostly computers
and laptops) to institutions and organizations in
need. In 2018, OTP Bank donated 450 pieces of
furniture and 150 computers.
The subsidiaries in Montenegro and Slovakia
use toner refills to reduce toner and ink
cartridge waste.
We have made several improvements in
our methods of waste collection in 2018.
All members of OTP Group collect and manage
hazardous waste and paper containing
business secrets selectively, in compliance with
the law. In addition to selective collection of non-
confidential paper waste and PET bottles in the
central office buildings of OTP Bank, we have
also provided selective waste collection facility
for glass in the newly refurbished workplaces,
including most of our central buildings. In 2018,
our Serbian subsidiary has implemented the
* The projection basis is the average statistical headcount.
OTP Bank 2018
Total paper quantities (t) (office, packaging, indirect) 733
Per capita paper use* (kg) 84
Paper usage quantities:
69Management’s analysis of the 2018 results of the OTP Group
selective waste collection of used toner and
paper. As from the end of 2018, our Romanian
subsidiary performs selective waste collection
of paper, metal, glass and plastic not only in
the central building, but also in its branches.
We implemented the conditions for selective
paper waste collection in the central building
of our Ukrainian subsidiary. The Croatian
subsidiary has collected waste selectively for
years, whereas the Slovak subsidiary provides
for selective waste collection wherever locally
facilitated by the municipality. DSK Bank
operates selective waste collection at its sites in
Sofia and Varna.
Attitude shaping
Several members of our Banking Group have a
tradition of raising awareness and joint action to
protect environmental and natural resources.
• In 2018, we continued to help the Hungarian
Hikers’ Association popularize hiking.
• The head office of DSK Bank has been active
for years in the national PET bottle cap
collection scheme; the caps are used for
producing wheelchairs. In 2018, the bank has
made a charitable donation to Budapest for
municipal cleaning purposes.
• In order to partially offset its paper use, our
Slovakian subsidiary continued to plant one
tree for every 50 packs of paper purchased
in 2018. The Bank has also participated in
”Our City”, a volunteer project to improve the
urban environment.
• Our Romanian subsidiary organised an internal
competition in an effort to reduce internal
printing by 20%. The three teams with the best
performance have received prizes. Volunteers
from the bank participated in the ”Let’s Do It,
Romania!” rubbish collection day, as well as
donating unused clothing to people in need.
• In 2018, CKB of Montenegro has once again
taken part in nationwide forestation and
environmental protection campaigns.
• Volunteers from our Croatian subsidiary
participated in forestation efforts in areas
that had suffered fire damage.
• Our subsidiary in Serbia sends regular
e-mails to its employees to advocate
environmental awareness.
Risks
OTP Bank continues to analyse and manage
the risks pertaining to environmental
protection, employment, the respect of
human rights and the fight against corruption
and bribery within its operational risk
management and compliance processes.
Risk management is decentralized; risks are
managed by the organizational units where
the risks emerge. Potential risks are identified
by self-assessment. The Group Operational
Risk Management Committee decides any
risk mitigation measures and orders further
investigations. Risk mitigation measures are
monitored and backtested with quarterly
frequency.
The description of the company’s policy on
environmental protection, social and employ-
ment issues, respect for human rights, anti-
corruption and bribery, as well as certain non-
financial performance indicators can be found
in the Environmental policy, environmental
projects section.
Fight against corruption and against
the practice of bribery
The Code of Ethics of OTP Bank contains
separate chapters on the fight against
corruption and against the practice of bribery,
also on the acceptance of individual differences
N O N - F I N A N C I A L S TAT E M E N T
– O T P B A N K P LC . ( S E PA R AT E )

70 OTP Bank Annual Report 2018
The statutory audit of OTP Bank is carried out by
Deloitte Auditing and Consulting Ltd., in addition
to which the following services were contracted:
• Assurance engagements other than audits
or reviews of historical financial information
(ISAE 3000)
• Non-audit engagements relating to
compliance with statutory regulations
• Engagements to perform agreed-upon
procedures regarding financial information
(AUP according to ISRS 4400)
L I S T O F N O N - A U D I T S E R V I C E S B Y S E R V I C E
C AT E G O R I E S U S E D B Y T H E B A N K
and the denial of discrimination7. As it can be
read in the foreword of the Code, the Bank and
its management have adopted the principle of
zero tolerance towards corruption and bribery,
taking a definite stance against all forms of
corruption and giving full support to the fight
against corruption. In addition, the Code states
that ”As an ethical and compliant institution, the
Bank and its management are fully committed
to ensuring observance of all relevant
legislation, including anti-corruption statutes.”.
The Bank has set up an ethics reporting system
(whistleblowing), which is for the reporting and
the handling of the reports on suspected or
actual violation of the values set forth in the
Code of Ethics, where anonymous reporting
of ethics issues is also possible. The Bank
conducts inquiries for the purpose of detecting,
preventing anomalies in connection with
reports made or anomalies it became aware
of otherwise.
Through the Bank’s ethics reporting system
a total of 7 reports were received in 2018, out
of which one case’s investigation resulted in
declaring ethics offense – though not due to
corruption, bribery or discrimination.
The Bank has created and maintains its
Code of Ethics to keep reputational risk and
financial losses, which may incur in relation
to corruption, bribery and discrimination,
on a minimum level. Both employees and
newcomers receive education on the Code
of Ethics, and in addition, the acceptance
to be bound by it is a prerequisite for their
employment.
Non-financial performance
indicators
• Internal audit: 196 closed investigations,
1,190 proposals, 1,188 accepted proposals;
• Compliance with Budapest Stock Exchange
(BSE) Recommendations (yes/no ratio):
85 yes, 0 no;
• Compliance: 4 audits, 2,908 reports due to
suspicion of money laundering;
• Bank security: expected damages arising from
crimes detected: HUF 995.2 1,103.9 million,
prevented damages: HUF 4,479.2 1,779.2 mil-
lion; reported charges: 2,582; the ratio of
bank card abuses to the turnover is 2.8 times
better than the European average (OTP Bank
0.0146%, European average 0.0450%);
• Ethics issues: 7 ethics reports, establishing
ethics offense in 1 case.
7 www.otpbank.hu/portal/en/EthicalDeclaration, www.otpbank.hu/static/portal/sw/file/OTP_EtikaiKodex_EN.pdf

71Management’s analysis of the 2018 results of the OTP Group
Footnotes to the table
’consolidated net profit breakdown
by subsidiaries (IFRS)’
General note: regarding OTP Core and other
subsidiaries, profit after tax is calculated
without received dividends and net cash
transfers (and other adjustment items).
Dividends and net cash transfers received from
non-group member companies are shown on a
separate line in one sum in the table, regardless
to the particular receiver or payer group
member company.
(1) Aggregated adjusted after tax profit of
OTP Core, Corporate Centre and foreign
banks.
(2) OTP Core is an economic unit for measur-
ing the result of core business activity
of OTP Group in Hungary. Financials of
OTP Core are calculated from the partially
consolidated IFRS financial statements of
certain companies engaged in OTP Group’s
operation in Hungary. These companies
include OTP Bank Hungary Plc., OTP Mort-
gage Bank Ltd., OTP Building Society Ltd.,
OTP Factoring Ltd., OTP Financial Point Ltd.,
and companies providing intragroup
financing; OTP Bank Employee Stock Own-
ership Plan Organization was included from
4Q 2016; OTP Card Factory Ltd., OTP Facility
Management Llc., MONICOMP Ltd. and
OTP Real Estate Lease Ltd. were included
from 1Q 2017. The consolidated accounting
results of these companies are segmented
into OTP Core and Corporate Centre. Latter
is a virtual entity.
(3) Within OTP Group, the Corporate Centre
acts as a virtual entity established by
the equity investment of OTP Core for
managing the wholesale financing activity
for all the subsidiaries within OTP Group
but outside OTP Core. Therefore the
balance sheet of the Corporate Centre
is funded by the equity and intragroup
lending received from OTP Core, the
intragroup lending received from other
subsidiaries, and the subordinated debt
and senior notes arranged by OTP Bank
under its running EMTN program. From
this funding pool, the Corporate Centre is
to provide intragroup lending to, and hold
equity stakes in OTP subsidiaries outside
OTP Core. Main subsidiaries financed
by Corporate Centre are as follows:
Hungarians: Merkantil Bank Ltd., Merkantil
Car Ltd., Merkantil Leasing Ltd., OTP Fund
Management Ltd., OTP Real Estate Fund
Management Ltd., OTP Life Annuity Ltd;
foreigners: banks, leasing companies,
factoring companies.
S U P P L E M E N TA R Y D ATA
2017 2018
HUF million HUF million
Gross customer loans (incl. accrued interest receivables related to loans) 7,726,631 8,751,955
(–) Accrued interest receivables related to DPD90+ loans 36,212 32,613
Gross customer loans (incl. accrued interest receivables related to loans) (adjusted) 7,690,419 8,719,342 Allowances for loan losses (738,797) (685,364)
(–) Allocated provision on accrued interest receivables related to DPD90+ loans (36,212) (32,613)
Allowances for loan losses (adjusted) (702,585) (652,751)
Adjustments of the consolidated
IFRS balance sheet lines
In the adjusted balance sheets presented in the
analytical section of the report, the total amount
of accrued interest receivables related to
DPD90+ loans were netted with the provisions
created in relation to the total exposure
toward those particular clients, in case
of the affected Group members. Therefore,
this adjustment made on the accounting
balance sheet has an impact on the
consolidated gross customer loans and
allowances for loan losses.

72 OTP Bank Annual Report 2018
(4) From 3Q 2010 the result and balance
sheet of OTP Factoring Bulgaria EAD was
included.
(5) From 1Q 2015 to 4Q 2017 the perfor-
mance of OTP Bank Russia does not
contain the volumes and financial
result of Touch Bank. From 1Q 2015 the
statement of recognised income and
balance sheet of LLC MFO ”OTP Finance”
was included in the Russian
performance.
(6) Touch Bank was part of OTP Bank
Russia from legal point of view, and it
was operating under the same banking
license, but as a separate digital banking
business line. In order to provide
transparent information Touch Bank
was presented as a separate virtual entity
from 1Q 2015 to 4Q 2017.
(7) Banco Popolare Croatia was consolidated
into OBH’s results from 2Q 2014. Splitska
banka was consolidated into OBH’s results
from 2Q 2017.
(8) From 4Q 2008 figures are based on the
aggregated financial statements of
OTP Bank JSC and LLC OTP Leasing
Ukraine, from 4Q 2009 the result of
OTP Factoring Ukraine LLC was also
aggregated.
(9) From 2Q 2010 the statement of recognised
income and balance sheet of OTP Faktoring
SRL was included. Banca Millennium was
consolidated into OBR’s results from
1Q 2015.
(10) Including the financial performance of
OTP Factoring Serbia d.o.o from 4Q 2010.
Vojvodjanska banka has been consolidated
from 4Q 2017.
(11) Including the financial performance of
OTP Factoring Montenegro d.o.o. (merged
into CKB Bank in 4Q 2018).
(12) From 2012 on P&L data and related
indices are adjusted for the special banking
tax and the Slovakian Deposit Protection
Fund contributions being introduced
again in 2014, as well as the contribution
into the Resolution Fund. Including the
financial performance of OTP Faktoring
Slovensko s.r.o.
(13) Aggregated after tax profit of Merkantil
Bank and Merkantil Car without dividends,
net cash transfer, other adjustment
items and provisioning for investments in
subsidiaries. Merkantil Car was merged
into Merkantil Bank in 3Q 2018.
(14) OTP Leasing Romania IFN S.A. (Romania),
OTP Leasing d.d. and SB Leasing d.o.o.
(Croatia), DSK Leasing AD (Bulgaria),
OTP Lizing d.o.o, OTP Services d.o. (Serbia).
(15) LLC AMC OTP Capital and OTP Solution
Fund (Ukraine), OTP Asset Management
SAI S.A. (Romania), DSK Asset Manage-
ment EAD (Bulgaria).
(16) OTP Buildings s.r.o. (Slovakia), Velvin
Ventures Ltd. (Belize), R.E. Four d.o.o.,
Novi Sad (Serbia), SC Aloha Buzz SRL,
SC Favo Consultanta SRL, SC Tezaur Cont
SRL (Romania), Cresco d.o.o. (Croatia),
OTP Osiguranje d.d. (Croatia).
(17) Total Hungarian subsidiaries: sum of the
adjusted after tax results of Hungarian
group members, Corporate Centre and
related eliminations.
(18) Total Foreign subsidiaries: sum of the
adjusted after tax profits of foreign
subsidiaries
Calculation of adjusted lines of IFRS
profit or loss statements presented
in the business report
In order to present Group level trends in
a comprehensive way in the Report, the
presented consolidated and separate profit and
loss statements of this report were adjusted in
the following way, and the adjusted P&Ls are
shown and analysed in the Report. Consolidated
accounting figures together with Separate
accounting figures of OTP Bank are still
disclosed in the Financial Data section.
Adjustments:
• The after tax effect of adjustment items
(certain, typically non-recurring items from
banking operations’ point of view) are shown
separately in the Statement of Recognised
Income. The following adjustment items
emerged in the period under review and

73Management’s analysis of the 2018 results of the OTP Group
the previous year: received dividends,
received and paid cash transfers, the effect
of goodwill/investment impairment charges,
special tax on financial institutions, the
impact of fines imposed by the Hungarian
Competition Authority, the effect of
acquisitions, and the initial NPV gain on the
monetary policy interest rate swap (MIRS)
deals.
Beside the Slovakian banking levy, the total
amount of the special banking tax includes
and the Slovakian Deposit Protection Fund
contributions being introduced again in 2014,
and the contribution into the Resolution Fund
in Slovakia, too. The special banking tax,
however, does not include the special tax
levied on the result of investment services
in the year of 2017 in Hungary, this item is
presented among the operating expenses.
• Other non-interest income elements
stemming from provisioning release
in connection with provisions on loans
originated before the acquisitions of the
subsidiaries have been reclassified to
and deducted from the volume of provisions
for possible loan losses in the income
statement.
• Other non-interest income is shown
together with Gains and losses on real
estate transactions, Net insurance result
(appearing in the accounting P&L structure
from 3Q 2017), Gains and losses on derivative
instruments, and Gains and losses on non-
trading loans mandatorily at fair value
through profit or loss lines, but without the
above mentioned income from the release
of pre-acquisition provisions and without
received cash transfers. However other
non-interest expenses stemming from non-
financial activities are added to the adjusted
net other non-interest income line, therefore
the latter incorporates the net amount of
other non-interest income from non-financial
activities.

74 OTP Bank Annual Report 2018
• From 2Q 2014 OTP Bank’s share in the
change in the shareholders’ equity of
companies consolidated with equity method
is reclassified from the After tax dividends
and net cash transfers line to the Net other
non-interest result (adj.) without one-offs line.
Furthermore, received cash transfers within
the framework of the subsidy programme
targeting the expansion of POS network in
Hungary were reclassified from the After tax
dividends and net cash transfers line to the
Net other non-interest result (adj.) without
one-offs line.
• Other provisions are separated from other
expenses and shown on a separate line in the
adjusted profit or loss statement.
• Other administrative expenses have been
adjusted in the following way in order to
create a category comprising administrative
cost items exclusively. Other costs and
expenses and other non-interest expenses
were included into the adjusted Other non-
interest expenses. At the same time, the
following cost items were excluded from
adjusted other non-interest expenses:
paid cash transfers – except for movie
subsidies and cash transfers to public benefit
organisations –,Other other non-interest
expenses stemming from non-financial
activities, and special tax on financial
institutions.
• Tax deductible transfers (offset against
corporate taxes) paid by Hungarian group
members from 3Q 2012 were reclassified
from Other non-interest expenses to
Corporate income tax. As a result, the net P&L
effect of these transfers (i.e. the paid transfer
less the related corporate tax allowances)
is recognised in the corporate income tax
line of the adjusted P&L. The amount of
tax deductible transfers offset against the
special tax on financial institutions is shown
on a net base on the special tax on financial
institutions line.
• The financial transaction tax paid from the
beginning of 2013 in Hungary is reclassified
from other (administrative) expenses to
net fee and commission income, both on
consolidated and OTP Core level.
• OTP Group is hedging the revaluation result
of the FX provisions on its FX loans and
interest claims by keeping hedging open
FX positions. In the accounting statement
of recognized income, the revaluation of FX
provisions is part of the risk costs (within line
”Provision for loan losses”), other provisions
and net interest income lines, whereas the
revaluation result of the hedging open FX
positions is made through other non-interest
income (within line ”Foreign exchange
result, net”). The two items have the same
absolute amount but an opposite sign. As an
adjustment to the accounting statement of
income, these items are eliminated from the
adjusted P&L. By modifying only the structure
of the income statement, this correction does
not have any impact on the bottom line net
profits.
• The Compensation Fund (established in
Hungary in order to indemnify the victims
of Quaestor and Hungarian Securities Ltd.)
contributions booked from 1Q 2017
are recognized on the Other administrative
expenses line of the accounting income
statement, and are presented on the
financial transaction tax and Special tax
on financial institutions line the in the
adjusted P&L structure (due to the tax
deductibility).
• In case of OTP Banka Slovensko and OTP Bank
Romania the total revaluation result of intra-
group swap deals – earlier booked partly
within the net interest income, but also on the
Foreign exchange gains and Net other non-
interest result lines within total Other non-
interest income – is presented on a net base
on the net interest income line starting from
1Q 2016.
• Performance indicators (such as cost/income
ratio, net interest margin, risk cost to average
gross loans as well as ROA and ROE ratios,
etc.) presented in this report are calculated
on the basis of the adjusted profit and loss
statement excluding adjustment items
(unless otherwise indicated). Adjustment
items include received dividends and net
cash transfers, the effect of goodwill/
investment impairment charges, special

75Management’s analysis of the 2018 results of the OTP Group
tax on financial institutions, the impact of
fines imposed by the Hungarian Competition
Authority, the effect of acquisitions, and
the initial NPV gain on the monetary policy
interest rate swap (MIRS) deals.
• Within the report, FX-adjusted statistics for
business volume developments and their
product breakdown are disclosed, too. For
FX adjustment, the closing cross currency
rates for the current period were used to
calculate the HUF equivalent of loan and
deposit volumes in the base periods. Thus the
FX-adjusted volumes will be different from
those published earlier.

76 OTP Bank Annual Report 2018
2018 2017
HUF million HUF million
Net interest income 624,723 553,755
(–) Revaluation result of FX provisions (44) 190
(+) Presentation of the revaluation result of intra-group swaps on the net interest income line
realized at the Romanian and Slovakian operations(116) (103)
(–) Netting of interest revenues on DPD90+ loans with the related provision
(booked on the Provision for loan losses line) at OTP Core and CKB3,340 5,961
(–) Effect of acquisitions 795 847
(–) Initial NPV gain on the monetary policy interest rate swap (MIRS) deals 20,685
Net interest income (adj.) 599,832 546,654 Net fees and commissions 277,675 261,193
(+) Financial Transaction Tax (56,958) (51,770)
(–) Effect of acquisitions (14) (5)
Net fees and commissions (adj.) 220,731 209,428 Foreign exchange result 34,158 16,579
(–) Revaluation result of FX positions hedging the revaluation of FX provisions 3,153 (4,350)
(–) Presentation of the revaluation result of intra-group swaps on the net interest income line
realized at the Romanian and Slovakian operations(2,598) (814)
(–) Effect of acquisitions 34 122
Foreign exchange result (adj.) 33,568 21,622 Gain/loss on securities, net 1,344 7,930
Gain/loss on securities, net (adj.) with one-offs 1,344 7,930
(–) Revaluation result of the treasury share swap agreement (booked as Gain on securities,
net (adj.) at OTP Core)(1,117) 862
Gain/loss on securities, net (adj.) without one-offs 2,461 7,068 Gains and losses on real estate transactions 1,890 2,093
(+) Other non-interest income 36,859 62,968
(+) Gains and losses on derivative instruments 6,458 5,291
(+) Net insurance result 673 410
(+) Losses on loans measured mandatorily at fair value through other comprehensive income
and on securities at amortized cost597
(–) Received cash transfers 575 584
(+) Received cash transfers within the framework of the subsidy programme targeting the expansion of POS
network in Hungary480 560
(–) Non-interest income from the release of pre-acquisition provisions 13,507 9,750
(+) Other other non-interest expenses (6,537) (9,666)
(+) Change in shareholders’ equity of companies consolidated with equity method 246 413
(–) Effect of acquisitions 0 32,271
(–) Presentation of the revaluation result of intra-group swaps on the net interest income line
realized at the Romanian and Slovakian operations2,482 712
(–) One-off impact of regulatory changes related to CHF consumer contracts in Croatia (26) (54)
(–) One-off impact of the CHF mortgage loan conversion programme and regulatory changes related
to mortgage loans in Romania(375) (363)
(–) Impact of fines imposed by the Hungarian Competition Authority 0 194
(–) Netting of refunds related to legal cases (accounted for on the Net other non-interest result line)
with the release of provisions created earlier for these cases (accounted for on the Other provisions line)
from 1Q 2017 at OTP Bank Romania
(630) (1,200)
Net other non-interest result (adj.) with one-offs 25,134 20,175
(–) Gain on the repurchase of own Upper and Lower Tier2 Capital (booked as Net other non-interest result (adj.)
at OTP Core and at the Corporate Centre)0 0
Net other non-interest result (adj.) without one-offs 25,134 20,175 Provision for impairment on loan and placement losses (39,287) (40,848)
(+) Non-interest income from the release of pre-acquisition provisions 13,507 9,750
(–) Revaluation result of FX provisions (3,088) 4,144
(–) One-off impact of the CHF mortgage loan conversion programme and regulatory changes related
to mortgage loans in Romania(37) 1,777
(+) Netting of interest revenues on DPD90+ loans with the related provision
(booked on the Provision for loan losses line) at OTP Core and CKB3,340 5,961
(–) Effect of acquisitions (33)
Provision for impairment on loan and placement losses (adj.) (19,283) (31,058)
Adjustments on the consolidated statement of profit or loss (IFRS):

77
2018 2017
HUF million HUF million
Dividend income 5,736 4,152
(+) Received cash transfers 575 584
(+) Paid cash transfers (9,465) (11,496)
(–) Sponsorships, subsidies and cash transfers to public benefit organisations (9,449) (11,495)
(–) Received cash transfers within the framework of the subsidy programme targeting
the expansion of POS network in Hungary480 560
(–) Dividend income of swap counterparty shares kept under the treasury share swap agreement 5,111 3,082
(–) Change in shareholders’ equity of companies consolidated with equity method 246 413
After tax dividends and net cash transfers 457 680 Depreciation (57,437) (49,493)(–) Goodwill impairment charges (5,962) (504)(–) Effect of acquisitions (3,266) (2,507)Depreciation (adj.) (48,210) (46,482)
Personnel expenses (251,041) (213,886)(–) Effect of acquisitions (1,594) (287)Personnel expenses (adj.) (249,447) (213,599)
Income taxes (33,837) (41,503)
(–) Corporate tax impact of goodwill/investment impairment charges 1,233 (5,561)
(–) Corporate tax impact of the special tax on financial institutions 1,562 1,561
(+) Tax deductible transfers (offset against corporate taxes) (2,057) (2,162)
(–) Corporate tax impact of the effect of fines imposed by the Hungarian Competition Authority 0 (17)
(–) Corporate tax impact of the effect of acquisitions 573 (2,298)
(–) Corporate tax impact of the initial NPV gain on the monetary policy interest rate swap (MIRS) deals (1,862)
Corporate income tax (adj.) (37,400) (37,350)
Other operating expense (25,387) (51,230)
(–) Other costs and expenses (7,152) (5,795)
(–) Other non-interest expenses (16,002) (21,162)
(–) Effect of acquisitions 1,606 (9,504)
(–) Revaluation result of FX provisions (21) 16
(–) One-off impact of regulatory changes related to CHF consumer contracts in Croatia 26 54
(–) One-off impact of the CHF mortgage loan conversion programme and regulatory changes related
to mortgage loans in Romania411 (1,414)
(–) Netting of refunds related to legal cases (accounted for on the Net other non-interest result line)
with the release of provisions created earlier for these cases (accounted for on the Other provisions line)
from 1Q 2017 at OTP Bank Romania
630 1,200
Other provisions (adj.) (6,885) (14,624)
Other administrative expenses (264,804) (236,072)
(+) Other costs and expenses (7,152) (5,795)
(+) Other non-interest expenses (16,002) (21,162)
(–) Paid cash transfers (9,465) (11,496)
(+) Film subsidies and cash transfers to public benefit organisations (9,449) (11,495)
(–) Other other non-interest expenses (6,537) (9,666)
(–) Special tax on financial institutions (recognised as other administrative expenses) (16,848) (16,794)
(–) Tax deductible transfers (offset against corporate taxes) (2,057) (2,162)
(–) Financial Transaction Tax (56,958) (51,770)
(–) Effect of acquisitions (4,945) (931)
Other non-interest expenses (adj.) (199,161) (181,706)
Management’s analysis of the 2018 results of the OTP Group

78 OTP Bank Annual Report 2018
Statement of profit or loss of OTP Bank Plc., according to IFRS standards as adopted
by the European Union (separate, audited)*
2018 2017 Change
HUF million HUF million %
Loans 141,536 120,960 17
Placements with other banks 69,947 47,776 46
Amounts due from banks and balances with the National Banks 280 1,403 (80)
Securities at fair value through other comprehensive income 31,628 30,100 5
Securities at amortized cost 47,342 44,737 6
Interest income 290,733 244,976 19
Interest expense due to banks and on deposits from the National Banks (53,993) (56,893) (5)
Deposits from customers (26,634) (9,244) 188
Liabilities from issued securities (157) (151) 4
Subordinated bonds and loans (2,994) (3,033) (1)
Interest expense (83,778) (69,321) 21
NET INTEREST INCOME 206,955 175,655 18
Provisions for loans (6,927) (7,807) (11)
Provisions on placements (895) 32
Provision for impairment on loan and placement losses (7,822) (7,775) 1
NET INTEREST INCOME AFTER PROVISION FOR IMPAIRMENT ON LOAN
AND PLACEMENT LOSSES199,133 167,880 19
Income from fees and commissions 212,556 206,759 3
Expense from fees and commissions (34,339) (30,355) 13
NET PROFIT FROM FEES AND COMMISSIONS 178,217 176,404 1
Foreign exchange gains and losses 9,510 4,555 109
Losses/Gains on securities, net 1,960 7,946 (74)
Losses on loans measured mandatorily at fair value through other comprehensive
income and on securities at amortized cost625 0
Gains on real estate transactions 219 222 0
Dividend income 68,481 82,638 (17)
Gains and losses on derivative instruments 3,706 2,030 83
Other operating income 4,960 9,768 (49)
Other operating expense (5,023) 71,359 (107)
NET OPERATING GAIN 84,438 178,519 (53)
Personnel expenses (104,819) (90,444) 16
Depreciation (21,232) (20,528) 4
Other administrative expenses (151,104) (141,455) 7
OTHER ADMINISTRATIVE EXPENSES (277,155) (252,427) 10
PROFIT BEFORE INCOME TAX 184,633 270,417 (32)
Income tax expense (11,191) (18,867) (41)
NET PROFIT FOR THE PERIOD 173,442 251,550 (31)
from this: attributable to non-controlling interest 0 0
from this: attributable to owners of the company 173,442 251,550 (31)
* The rows of the table are based on audited numbers, but some rows differ from audited data (merged or different level of aggregation).

79Management’s analysis of the 2018 results of the OTP Group
Statement of financial position of OTP Bank Plc., according to IFRS standards as adopted
by the European Union (separate, audited)*
2018 2017 Change
HUF million HUF million %
Cash, amounts due from Banks and balances with the National Banks 360,855 399,124 (10)
Placements with other banks, net of allowance for placement losses 1,074,840 978,098 10
Financial assets at fair value through profit or loss 155,042 303,927 (49)
Securities at fair value through other comprehensive income 1,451,905 1,735,902 (16)
Loans at amortized cost and fair value 2,618,863 2,145,046 22
Associates and other investments 1,177,573 967,414 22
Securities at amortized costs 1,431,789 1,043,779 37
Tangible and intangible assets 112,658 100,537 12
Other assets 122,663 98,055 25
TOTAL ASSETS 8,506,188 7,771,882 9
Amounts due to banks, the Hungarian Government, deposits
from the National Banks and other banks738,036 694,533 11
Deposits from customers 5,741,498 5,192,869 11
Liabilities from issued securities 46,694 60,304 (23)
Financial liabilities at fair value through profit or loss 32,231 – –
Derivative financial liabilities designated as held for trading 82,838 79,545 4
Other liabilities 243,495 210,539 16
Subordinated bonds and loans 110,454 108,835 1
TOTAL LIABILITIES 6,995,246 6,346,625 10
Share capital 28,000 28,000 0
Retained earnings and other reserves without earnings 1,311,464 1,155,247 14
Profit or loss for the financial year according to the balance sheet 173,442 251,550 (31)
Treasury shares (1,964) (9,540) (79)
Non-controlling interest 0 0
TOTAL SHAREHOLDERS’ EQUITY 1,510,942 1,425,257 6
TOTAL LIABILTITIES AND SHAREHOLDERS’ EQUITY 8,506,188 7,771,882 9
* The rows of the table are based on audited numbers, but some rows differ from audited data (merged or different level of aggregation).

80 OTP Bank Annual Report 2018
Statement of profit or loss of OTP Bank Plc., according to IFRS standards as adopted
by the European Union (consolidated, audited)*
2018 2017 Change
HUF million HUF million %
Loans 576,053 521,121 11
Placements with other banks 72,401 42,686 70
Amounts due from banks and balances with the National Banks 421 1,444 (71)
Securities at fair value through other comprehensive income 37,912 34,442 10
Securities at amortized cost 59,899 56,343 6
Other interest income 11,272 10,479 8
Interest income 757,958 666,515 14
Interest expense due to banks and on deposits from the National Banks (47,979) (46,475) 4
Deposits from customers (69,387) (50,995) 36
Liabilities from issued securities (6,343) (5,727) 11
Subordinated bonds and loans (2,169) (2,259) (4)
Other (7,357) (7,303) 1
Interest expense (133,235) (112,759) 18
NET INTEREST INCOME 624,723 553,756 13
Provisions for loans (39,143) (40,620) (4)
Provisions on placements (144) (228) (37)
Provision for impairment on loan and placement losses (39,287) (40,848) (4)
NET INTEREST INCOME AFTER PROVISION FOR IMPAIRMENT ON LOAN AND
PLACEMENT LOSSES585,436 512,908 14
Income from fees and commissions 338,081 315,606 7
Expense from fees and commissions (60,405) (54,413) 11
NET PROFIT FROM FEES AND COMMISSIONS 277,676 261,193 6
Foreign exchange gains and losses 34,157 16,579 106
Losses/Gains on securities, net 1,345 7,930 (83)
Losses on loans measured mandatorily at fair value through other
comprehensive income and on securities at amortized cost597 0
Gains on real estate transactions 1,890 2,093 (10)
Dividend income 5,736 4,152 38
Net insurance result 673 409 64
Gains and losses on derivative instruments 6,458 5,291 22
Other operating income 36,859 62,968 (41)
Other operating expense (25,387) (51,230) (50)
NET OPERATING GAIN 62,328 48,191 29
Personnel expenses (251,041) (213,886) 17
Depreciation (57,437) (49,492) 16
Other administrative expenses (264,803) (236,072) 12
OTHER ADMINISTRATIVE EXPENSES (573,281) (499,450) 15
PROFIT BEFORE INCOME TAX 352,159 322,842 9
Income tax expense (33,837) (41,503) (18)
NET PROFIT FOR THE PERIOD 318,322 281,339 13
From this: attributable to non-controlling interest 89 197 (55)
From this: attributable to owners of the company 318,233 281,142 13
* The rows of the table are based on audited numbers, but some rows differ from audited data (merged or different level of aggregation).

81
Financial position of OTP Bank Plc., according to IFRS standards as adopted
by the European Union (consolidated, audited)*
2018 2017 Change
HUF million HUF million %
Cash, amounts due from Banks and balances with the National Banks 1,547,272 1,198,045 29
Placements with other banks, net of allowance for placement losses 420,606 462,180 (9)
Financial assets at fair value through profit or loss 181,356 344,417 (47)
Securities at fair value through other comprehensive income 1,883,849 2,174,718 (13)
Loans at amortized cost and fair value 8,066,593 6,987,834 15
Associates and other investments 17,591 12,269 43
Securities at amortized costs 1,740,520 1,310,331 33
Tangible and intangible assets 420,484 413,390 2
Other assets 312,017 287,044 9
TOTAL ASSETS 14,590,288 13,190,228 11
Amounts due to banks, the Hungarian Government, deposits
from the National Banks and other banks360,475 472,068 (17)
Deposits from customers 11,285,085 10,233,471 10
Liabilities from issued securities 417,966 250,320 67
Financial liabilities at fair value through profit or loss 32,231 – –
Derivative financial liabilities designated as held for trading 73,316 69,874 5
Other liabilities 513,129 448,412 14
Subordinated bonds and loans 81,429 76,028 7
TOTAL LIABILITIES 12,763,631 11,550,173 11
Share capital 28,000 28,000 0
Retained earnings and other reserves without earnings 1,545,971 1,390,737 11
Profit or loss for the financial year according to the balance sheet 318,233 281,142 13
Treasury shares (67,999) (63,289) 7
Non-controlling interest 2,452 3,465 (29)
TOTAL SHAREHOLDERS’ EQUITY 1,826,657 1,640,055 11
TOTAL LIABILTITIES AND SHAREHOLDERS’ EQUITY 14,590,288 13,190,228 11
Management’s analysis of the 2018 results of the OTP Group
* The rows of the table are based on audited numbers, but some rows differ from audited data (merged or different level of aggregation).