management values in the selection of a capital budgeting
TRANSCRIPT


mm^mmsm^^^^ ~.^


MASS. IHST. TtCi
'-:\V;^Y iJSRARYj
Management Values in the Selectionof a Capital Budgeting Portfolio
By
E. Eugene Carter
September 1974 734-74


- 1 -
"lanagement Values in the Selection of a Capital Budgeting Portfolio
E. Eugene Carter
Introduction
Studies of managerial decision making have usually focused upon one of
three approaches. Some researchers have examined the behavior of the individual
manager, both descriptively and normatively. Given limited information and posi-
tive costs of search, the conclusions here have emphasized the concept of bounded
rationality, the replacement of inoperable goals with operable ones, the use of
multiple attributes to resolve uncertainty, a concern with risk, and the depart-
mental identification of executives.*
Other studies have focused upon firm pricing behavior where the reactions
of a given manager have reflected the particular activity and values of the corp-
oration. The conclusions have been that executives generally do not have profit
maximization as a single goal, that current management knowledge of cost and rev-
enue functions is not sufficient to maximize profits, and that the organizational
interactions required in the firm limit the manager's ability to pursue a single
goal even if that were desired. Often, firms have been suggested as pricing in
order to realize a targeted return on investment in conjunction with a market share
performance. Pricing was designed to meet or to prevent competition, or to stabil-
ize prices and margins in the long run in some cases. Ultimately, these heuristic
rules may operate to maximize long-run profits. However, in the short run, the
conclusion has been that managements pursue many goals in addition to profits.**
*See Alderfer and Bierman (1970), Conrath (1973), Dearborn and Simon (195S) , tao
(1970), Miller (1956), Simon (1937), and Slovic (1972) for exaimle.
*-^See Baldvjin (1964), Baumol (1954), Chamberlain (1962), Cyert and MacCrimmon (1967),
Gale (1972), Katona (1951), Lanzillotti (1958), National Industrial Conference
Board (1966), Shubik (1961), and Spitaller (1971). The MICB and Spitaller studies
deal with investment abroad.


- 2 -
Coinciding with an analysis of the single manager or of the ri.ana^er
vjthin tlic! orp.mization, a third ^roup of researchers have emphasized the organi^.a-
tion per «e, and have suggested that short-term tenure in a given assignment and
the decision process within the organization often meant that capital budgeting proiec
ani Trices were evaluated and approved on the basis of a variety of seemingly
noneconomic variables. The impact of increased information, group versus individu-
al decisions regarding risk evaluation, and the control process all affected the
forecasts and decisions process surrounding project approval. The Cyert and March
(1963) concepts of conflict resolution, uncertainty avoidance, problemistic search,
and organization adaptation were used as major explanatory variables by these au-
thors to explain the "behavioral" theory of firm behavior. Broadening these con-
cepts to emphasize the capital budgeting and strategy decisions. Carter (1971)
stressed the impact of multiple organizational levels, bilateral bargaining between
a sponsor and a manager, the impact of technology, and ex post uncertainty resolu-
tion by the Pollyanna-Nietzsche effect. Finally, others have seen organizations
as essentially"organized anarchy," with special reference to universities; there
is problemistic references to the given situation; unclear technology; and fluid
participation (Cohen, et al.(1972)).*
From all of these studies, there is evidence that a variety of goals are
pursued even though some may be the operational goals for long-run profit maximiza-
tion. Major interdependencies between projects in the capital budgeting de-
cision as well as a concern with risk, variously defined, are also involved.
Concurrent with these studies has been the improved analysis of the capi-
tal budgeting problem. An increased analytical basis for the capital budgeting
problem, the successful introduction of these analytical techniques in businesses,
*Among the studies in addition to those mentioned are Berg (1963), Bower (1970),
yiarch and Simon (1953), Mintzberg (1973), Rotch (1958), Shaw and Penrod (l')62") ,
Wallich et al.(1952), and Woods (1965).


- 3 -
the devf'lopmcnt of various management science models in the last 25 years
and their successful implementation in some corporations, and the deepening
of the analytical framework for the broader issues of corporate strateey
have all served to emphasize the need for increased av/areness of the values
of the managerial decision maker.*
To learn more about the decision process and the values pursued by
executives in a management setting, an interactive simulation program was
developed which vjas then used with individuals and groups of middle managers
who were participating in a management program at a school of business admin-
istration. Materials were developed to place them in a hypothetical capital
budgeting decision situation and questionnaires were used to obtain their
judgments on the desirability of various projects. Tlie remainder of this
paper is concerned with their decisions and the implications of those decisions
for management.
In this paper we seek evidence on six issues:
First, are there different goals and attitudes toward risk depend-
ing on the professional background of executives?
Second, are there different goals and attitudes toward risk depend-
ing on the regional background of the executives?
Third, if there are multiple goals in the mind of the executive,
how does (s)he filter projects in the capital budgeting setting? Does (s)he
effectively find projects which realize his/her primary goals?
*.\mong appronriate references for the use of capital budgeting techninues and
models in corporations, see Frcmgen (1973), Gershefski (1970), Klammer (1972)
and Schrieber (1970). Analysis of the capital budgeting decisions may be
seen in Ilillier (1969) and Jean (1970), among other sources. An excellent
recent discussion of strategy is Cohen and Cyert (1973).


- 4 -
Fourth, how does (s)he cope with risk? When given the informa-
tion and the tools (e.g., computer assisted analysis), does (s)he attempt
to deal with risk in an explicit form?
Fifth, with different project rankings under rate of return ,
and present value criteria, the evaluation of leases, and the importance
of looking at rate of return or present value in a portfolio context rather
than simply adding pro-jects, does the executive react to these financial
subtleties in a consistent and logical manner?
Sixth, how do groups differ from individuals in the portfolio
selection process?
The Decision Environment
The men and women in this experiment were typically 30 to 45 years
old, with a minimum of eight years of managerial experience. About 40% were
non-United States citizens working in other lands. Some were military career
officers in the United States Navy and Air Force. Many were from small firms,
but the majority were from major corporations. All had been selected by
their companies to attend a fourteen-week executive development program, and
had completed eleven weeks of that program at the time of this study.
The essential Information about the situation was given to the
managers in two separate packages. The first package (or (A) case) consisted
of brief outlines of 20 projects with tables of the expected outcome and
standard deviation of the outcome on ten criteria for each of the projects.
The criteria were net present value, and the impact on cash flow, on earnings
per share, and on sales for each of the next three years. As additional in-
formation each project's rate of return and profitability index were provided


together with the expected cost of the project.* Participants were given
a general budget ceiling, but it was emphasized that this was a flexible
limit
.
The company was described as a family-owned, diversified manu-
facturer of specialty machine equipment for various industries. Tn the most
recent year, sales were $10,500,000 and earnings were $950,000. Earnings per
share had grown from $2.50 three years ago to $4.75 in the most recent year.
The firm was considering an additional issue of stock, and becoming a public
company. This stock issue was expected to dilute current earnings per share
to $3.41. In addition participants were given information relating to pre-
vious years' cash flow, depreciation and capital outlays, as well as income
statements and balance sheets for the preceding three years. For those
participants unfamiliar with simulation, a brief description of the technique
was presented.
*In terms of the mean/variance approach used for the proiect portfolio eval-
uation in SIFT, one can argue that the correct discount rate is the risk-free
rate, which would be less than the 10% rate employed in the raw data. Thus,
the manager discounts the cash flows for time, but should not discount them
for risk. The risk-ad iustment is made when the portfolio is selected using
the appropriate mean-variance trade-off the manager wishes to apply. Hence,
a more appropriate rate would be lower, perhaps 6°'. See, for example, Rierman
and Haas (1973) and Keeley and Westerfield (1972). An opposite approach is
to adjust the discount rate, raising it for the riskier projects. This con-
clusion is consistent with the traditional cost of capital model. It is also
consistent with the capital asset model, for the risk free rate and the ex-
pected covariance of the project with the market combine to produce variable
discount rates for riskier (i.e., higher covariance) projects ex ante. However
since one purpose of this SIFT study was to analyze the manner in which the ex-
ecutives coped with variance as a risk measure, a uniform discount rate was
used throughout.


- 6 -
The second package (or (B) case) included a brief description of
portfolio theory and presented the correlation coefficient matrix for all
of the projects on each of the ten criteria.*
In conjunction with the (B) case, the computer program SIFT was
made available. This program allowed a participant to observe the effects
of his/her decision on the portfolio. For any portfolio, the calculations
presented the expected outcome and the variability of that outcome on any
criterion the participant wished to examine. These results were derived by
combining the means and variances/covariances for the projects the executive
selected. As the participant signed on to the system, (s)he was asked to
state the goals and to select an initial portfolio from among the projects.
Certain illegal project combinations (e.g., one of two new products might be
accepted, but not both) as well as the forced inclusion of the current opera-
tion (Project 1) were imbedded. Should these constraints be violated, error
messages would be returned.
When an executive first connected to the SIFT system, (s)he would
receive a welcoming message and an explanation of the common codes which were
available to him, as shown in Table 1.
In using this SIFT program, the executive had a number of filtering
options available.
1. The program could be used to determine portfolio data. SIFT would
present the capital outlay and the results for any of the criteria for any
legal combination of projects. As noted the program would include costs for
debt as required.
*Early preliminary testing indicated that correlation coefficients were norereadily used by executives than the covariances. Accordingly, this measurewas presented to them for these studies. These factors are discussed in de-tail in Carter (197A) , Chapter 6.


Table 1
SIFT Sign-On Message
WELCOME TO THE COULTER CORPORATIO^J CAPITAL BUDGETING SIMULATION
WHAT IS YOUR iNJAME(S)?G. WELL3*A. MILES
PLEASE EXPLAIN YOUR OBJECTIVES ON THE NEXT THREE LINES?T0 ;<AXIMIZE?EPS IN?YEAR 3
MAXIMUM BUDGET LIMIT =$ 8000
WHEN THE. COMPUTER TYPES -OPTION?- PLEASE ANSWERWITH ONE OF THE RESPONSES SHOWN BELOW
OPTION DESCRIPTION
NP STARTS A NEW PORTFOLIOPC PORTFOLIO CONTENTSEC LIST PROJECT ENTRY COSTSIP LIST ILLEGAL PROJECT COMBINATIONSA ADD A NEW J-ROJECT TO YOUR PORTFOLIOD DELETE A PROJECT FROM YOUR PORTFOLIOP PORTFOLIO STATISTICSSP SHORT PORTFOLIO OUTPUTC COMBINE PROJECTSMR RA.NK PROJECTS BY MEAN VALUESVH RANK PROJECTS BY VARI ABILI TY CSTD. DEV.END STOPS PROGRAM
WHEN THE COMPUTER TYPES -CRITERION?- PLEASE ANSWERWITH ONE RESPONSES SHOWN BELOW
DESCRIPTION
SALES IN YEAR I
SALES IN YEAR 2
SALES IN YEAR 3
CASH FLOW IN YEAR 1
CASH FLOW IN YEAR 9.
CASH FLOW IN YEAR 3EARNINGS PER SHARE IN YEAR 1
EARNINGS PER SHARE IN YEAR 2EARNINGS PER SHARE IN YEAR 3NET PRESENT VALUE
TYPF -HELP- TO RETYPE THE ABOVE INFORMATION
CRITERION


1. Confidence IgvgIs using Normality assumptions were printed for
the portfolios chosen by the executive for whatever criteria. These con-
fidence intervals used the standard deviations of the portfolio to compute
25%/75r{, 10%/907, 5%/95% and l%/99% intervals for the criteria as the ex-
ecutive requested.
3. Compare /Combine options permitted the participant to study the
effectiveness of the proposed portfolio vis-a-vis the current operation in
meeting various goals for future years. For example, the executive could
view the probability that earnings per share in the second year would bo no
loss under his proposed portfolio than expected second-year earnings per
share of the existing firm alone.
4. Portfolio-project comparisons permitted the executive to view how
the proposed portfolio would be altered for each of the ten criteria by add-
ing or deleting a particular project. These results were similar to those
obtained for the existing firm/portfolio comparison indicated above. The
comparison indicated the amount by which the expected values and standard
deviations of the portfolio would be changed by addition or deletion of a
project
.
5. Mean search routines permitted the executive to seek altered values
from the expected outcome of the portfolio for any criterion. When using
this option, the participant indicated the criterion and the number of pro-
posals desired (N) . The program printed the N projects which would have the
greatest effect in increasing or decreasing the expected value under considera-
tion. Depending on what the participant specified, the program would review
all projects, those in the proposed portfolio, or those out of the proposed


- 9 -
portfolio. The participant's specification, of course, depended upon whether
he was attempting to eliminate proiects from his portfolio which had an un-
favorable impact on a criterion (e.g., a binding budget constraint and low
earnings per share in the first year) or to add proiects which would improve
an outcome (e.g., find proiects to boost sales in the second year).=^
6. Variance search routines required the participant to input the
same information as under the mean search routine. The program V70uld return
a list of those projects in and/or out of the current portfolio which would
most increase or decrease the variance on a given criterion.
After reviewing each of the (A) and the (B) cases, the participants
were asked to complete a questionnaire. This questionnaire asked them to
indicate the projects they would like to have in their final portfolio, the
reasons for that portfolio, and their goals. They also were asked to
indicate the time spent on the assignment. For the (B) case, the same questions
were asked together with time spent on the computer in the event they used it.
In addition, they were asked to attach their computer output to the questionnaire.
Evaluation of Data
The participants' responses to the questionnaire were codified into
Goals, Constraints, and Risk considerations. Goals were identified as the
major factor in which there was an implied or stated optimization process.
There could be more than one major goal for a subject. However, often the
multiple attributes of the decision were included as "a reasonable growth in
sales," for example, and such a codification was taken as a Constraint , where
the objective was to meet some minimal level of achievement. Beyond that
level, it was assumed that the criterion was not of paramount importance.
Finally, the aspect of Risk was considered important if the executive
*Since the portfolio model operated on the basis of a Normality assumption,
the mean is an acceptable average. In typical risk analysis models for a
non-Normal outcome, the median is the relevant figure.


- 10 -
(J) lipecii i(;.-iJ Jy noLt:d detailed standard deviation considerations ir. tr.e
questionnaire, (2) mentioned "risk" or a synonym in a response, or Ci) empha-
sized "diversified," "broadly based," or synonyms in describing the portfolio.*
The results described below were evaluated by using a Chi-square
test witn one degree of freedom in a 2 x 2 contingency table, and the calcula-
tions were adjusted for continuity. With both large samples and interval
groupings, this procedure is equivalent to the use of the Z (Normal deviate)
distribution. Tests were for one- or two-tailed analysis as was appropriate
at various significance levels.
Both the Chi-square and the Z tests are approximations. It has been
shown that exact tests for samples of smaller size yield different results.**
Tables used for a small A or B sample (less than 20) or an A or B sample between
20 and 40 observations where the smallest absolute observation was less than 5
are from D. J. Finney, et al. (1963), following the procedure of Snedecor and
Cocnran (1967)
.
An alternative to this approach is specifically to ask each respondent whether
factor X was considered in the decision. This approach seems to stimulate a
respondent either to say that factor was studied or to justify ignoring it.
Furthermore, it may encourage a participant to think about such a factor when
it was not considered. On the other hand, the choice followed here of inter-
preting the responses is also hazardous. There may be a loss of information
(some managers very concerned with a factor may have forgotten to mention it)
as well as a bias of interpretation. Subject to the considerations mentioned
above, it is hoped this bias is minimal. Furthermore, in most cases, the
responses were surprisingly direct and ordered. That is, the explanation for
behavior when included coincided with the originajobjectives noted.
Separating goals and constraints in either setting is not trivial. There
could be multiple responses in each of these categories. There might be
situations in which there was a criterion named simultaneously as a goal and
as a constraint (e.g., maximize third-year earnings per share without having
a loss in any year). As the interpretation of the results below will indicate,
however, tne responses as categorized did tend to make sense given the outcomes
presented.
K. A. Fisher, Statistical Methods for Research Workers , (1941), paragraph
21.02, Oliver and Boyd, Edinburgh, Scotland.


- 11 -
I'rol efJKJ onal background and Project Selection
Dearborn and Simon (1958) and others have presented evidence that
professional identification with a particular area of business specializa-
tion is a factor influencing the manner in which an individual views a
business problem. Accepting these results, one can hypothesize that (Hl^
finance professionals will have a higher interest than other groups in riite
of return and earnings per share. One may also hypothesize (HIA) that market-
ing professionals will have a greater interest in sales than other professionals.
These results are presented in Table 2. For all groups, earnings per
share (.92) were dominant with some concern for rate of return (.38). Ii terms
of goals, sales and cash flow were rarely considered.
The finance group placed more emphasis on rate of return, as hypothe-
sized. This emphasis was significantly higher (at the 10% level) than that
considered by both the marketing and general management executive. Marketing
executives were somewhat lower in rate of return evaluations compared to the
other groups, but were not significantly different from the others in tl eir
appraisal of the importance of sales as a goal. In fact, the marketing group
had a slightly lower proportion (.17) selecting sales as a major goal than any
other subgroup.
The hypothesis for departmental identification being associated with
differential selection of criteria is supported in the area of finance (HI)
.
The expected identification of marketing executives with sales standards was
not found (HIA).
Projects 2, 3, A, 8, and 9 in conjunction are projects which may reveal
the professionals' ability to decompose a financial problem. The first three


- 12
Table 2
PROFESSIONAL BACKGROUND, GOALS, AND PROJECT SELECTION
Goal s
Rate of Return
Sales
Earnings perShare
Cash Flow
Other
Project
2
3
4
8
9
7
11
13
19
Finance
(N=20)
.55*
.20
.85
.15
.10
Marketing
(N=12)
.25*
.17
1.00
.17
,25
,59
Production
(N=22)
.46
.23
.91
.14
.09
.22
.09
.23
.18 1
..1 )
.25
.77
.32
^ 91****
GeneralManagement
(N=48)
.27**
,59
Total
(N=102)
.31*


- 13 -
projects relate to new products with particular sales possibilities. The
latter two projects include major plant realignments which are useful only
if the three new projects are all taken in concert. Projects 8 and 9 have
rates of return over 17%; however, the highest rate of return in these five
proposals belongs to Project 4, with a rate of return of nearly 19%. Given
the nature of the proposals, Projects 8 and 9 are mutually exclusive of
Projects 2, 3, or 4. Hence, a person initially selecting projects on the
basis of rate of return might well include Project 4, and then find neither
Projects 8 or 9 would be permissible. Of course, Projects 8 and 9 involve
greater outlays of cash. On the other hand, for those who find rate of return
a compelling criterion, there is a need to escape the "trap" of taking
Project 4 (with a high rate of return on a relatively small outlay), and
losing Project 8 or 9 (with high return on a larger base).
The slightly higher orientation of finance executives to rate of
return as a goal is reflected in project selection among these five projects,
as shown in Table 2. Consistent with the expectation (and finding) that
finance professionals are more interested in rate of return calculations,
one may also hypothesize to) that they will be more likely to select a high
rate of return project (e.g., Project 4). With this selection, they will
lose the opportunity for a larger investment (e.g.. Project 8 or 9) with a
lower rate of return than Project 4 but a return which is still greater than
almost any other project. The inclusion of Projects 2, 3 or 4 in total (.40)
is higher than these projects' inclusion for the other professional subgroups.*
_ .
The figure .40 is less than the simple sum of the three projects inclusionsince .40 measures the proportion of participants who selected any of thesethree projects. Projects 8 and 9 are mutually exclusive, and the incidenceof inclusion is the sum of the two respective project frequencies.


- 14 -
These results are significant at the 5% level on a one-tailed test in the
case of finance versus general managers. In addition, the specific inclusion
of Project 4 is significantly higher, at the 1% level, for finance profes-
sionals than for general managers. This outcome indicates that the "selective
filtration" of rate of return may entrap those having rate of return as a
major goal losing sight of the importance of combining projects. Such an
interpretation will find support from later evidence as well; those execu-
tives who specifically emphasized rate of return as a goal generally had a
greater orientation toward the selection of Projects 2, 3 and 4 than 8 or 9.
Project 7 was an "intangible" project consisting of new executives'
offices. This project was nominally justified on the basis of "better spirit"
of executives because of the improved working environment. All groups seemed
to accept this premise with equal incidence of approval. No one challenged
directly the assertions relating to its desirability.
Project 11 has a very favorable impact on reported earnings in the
earlier years of its life but has a low rate of return (7%). In contrast,
Project 13 has a higher rate of return (11%) but a less favorable impact on
earnings per share in any of the early years. These are not mutually
exclusive projects. However, the rate of return increment was usually
sacrificed for the favorable early impact on earnings per share. Overall,
there was a two-to-one preference for Project 11 over Project 13. This
reaction is consistent with the goals admitted earlier, and is a pattern
which appears consistently across all groups. The marketing group does
tend to have more interest in Project 13 than the other groups on a two-
tailed test.


15 -
i'rojecL 19 involves "social responsibility" or "enlightened self-
iiiLerc'st" depending on one's view of business leadership. it is a smokestack
precipitator with no rate of return in nominal terms. It has been suggested
to the firm by the mayor of the town as an investment the company should
ccr.sicer. Three groups accepted the project oveirwhelmingly , but a majority
of the marketing executives rejected the claims for social responsibility.
Altnough one might expect production executives (who are largely from engi-
neering backgrounds) to be less sensitive to this issue, in fact they were
markedly more receptive. This acceptance may derive from their awareness of
the technological feasibility coupled with personal experience in confronting
exactly this sort of project. No explanation of the higher rejection by the
marketing executives relative to other groups will be attempted!
Regional Background and Project Selection
Among the studies of comparative management values of managers from
different cultures, England and Lee (1971) used questionnaires to seek differ-
ences in values among American, Japanese and Korean managers. The raw scores
which resulted could be used to assess not only which goals were most relevant
for particular managers, but how the managers from different cultures valued
goals.
In the comparison of American and Japanese managers, for example,
the maximization criteria in the context of Simon (1964) for American managers
were productivity, organizational efficiency and profit maximization. For
Japanese managers, the maximization criteria were productivity and organiza-
tional growth. If this pattern is repeated in relation to the SIFT model here,
one might suggest that some managers stratified by regional background v ould


16
li.ivc .1 j^reatur concern for sales (organizational growth or industry leadcr-
.iliip) thvin otlier managers. Another group might emphasize earnings, which
would have direct impact on profit maximization in the England and Lee terms.
The "Commonwealth" grouping included the United Kingdom to Australia
geographically, on the basis of a common business heritage in practice and in
education. One may hypothesize that (H3) Americans will be more concerned
about earnings per share than other groups, given the "stock market orienta-
tion" of this country. Similarly, (H3A) Europeans and Commonwealth partici-
pants will be more interested in cash flow and sales, standards for the long-
range viability of a business, as opposed to EPS, which, given the three-year
horizon of the SIFT model, may be regarded as less important.
Although one cannot evaluate this issue with finality, it seems
probable that such distinctions are blurring with the internationalization
of business experience. This test group, given their backgrounds and the
educational program in which they were enrolled, is likely to be less distinc-
tive along these culturally determined lines than managers at large. They
are also likely to be representative examples of future executives.
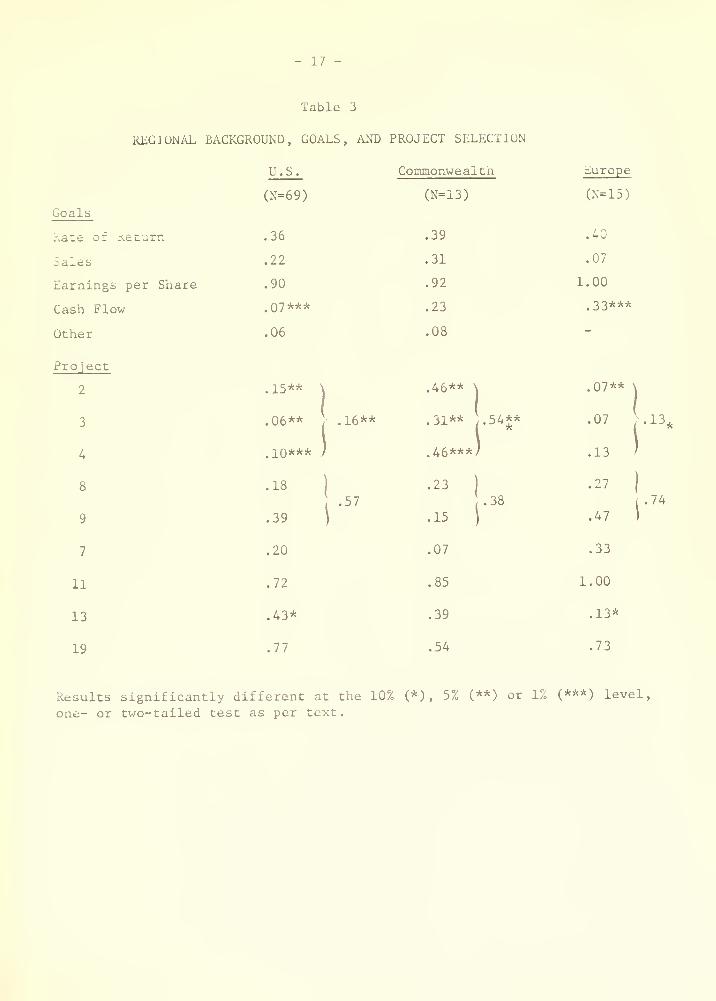
As shown in Table 3, Americans were substantially less interested
in cash flow than the other groups, as hypothesized. Europeans were less
interested in sales as a goal, contrary to the hypothesis.* The results
found in goals (emphasis on rate of return and earnings per share) in the
regional groupings is consistent with that found in the segmentation by
professional background.
-
Separate tabulation indicated that the incidence of professional backgroundswhen cross-tabulated by regional background was not significantly differentfrom that of the total sample.

- 17
Table 3
REGIONAL BACKGROUND, GOALS, AND PROJECT SELECTION
U.S.
Goals
3
A
8
9
7
11
13
19
(N=69)
Race 01 Re


- 18 -
In terms of the five projects which involve a rate of return bias
(i'rojects 2, 3, 4, 8, and 9), the Commonwealth participants had an especially
strong inclination to select one or two of the separate projects and to avoid
the higher rate of return on a large asset base from investing in either
Project 8 or 9. Since there was an a priori assertion of greater interest
in rate of return by regional subgrouping, a two-tailed test is applied and
the difference is significant.
On the other hand, this Commonwealth group rejected the intangible
argument for the new headquarters building (Project 7) more strongly than the
other groups. The pattern indicating preference for earnings in Project 11
over rate of return in Project 13 continued, with the Europeans rejecting the
low earnings of Project 13 more frequently than the Americans at the 10% signif-
icance level, in terms of social responsibility, the Commonwealth partici-
pants were somewhat lower in their interest in the smokestack precipitator
(.54) than either the Americans or the Europeans (.77 and .73, respectively).
Such differentials may suggest characteristics of the capital markets
and educational programs. The heavy emphasis on simple earnings in some envi-
ronments was expected (H3) to cause this factor to be overemphasized by those
respondents (the Americans). This was not observed. Greater interest from
non-U. S. participants in cash flow considerations was found in the case of
the Europeans as hypothesized (H3A) . Since many of the Commonwealth partici-
pants are from nations where the impact of the environmentalist movement has
been less substantial than Western Europe and the United States, one might
conceivably explain the lower interest in the smokestack precipitator (Project
19). On balance, there is minor evidence on the differential standards for
portfolio selection, for risk, and for project selection when the results are


- 19 -
;,l r .il i I icd by myJunnL background. Tliere la uo uvhlc-iicc Lh.il I hi' "lali- '>\
return trap" projects found in the Commonwealth results derived from a bnarp
interest in rate of return as a goal. The differences are not of major
importance in contrast to the England and Lee results.
The previous tables were based on the full sample of usable
responses (102). For the following tables, the results will be based on a
subgroup for which detailed independent responses on both the (A) and (B)
packages were available. As discussed earlier, the (B) package provided
additional information regarding the covariance among projects on various
criteria and permitted optional use of the SIFT computer program to evaluate
interrelationships.
Goal Evaluation
Given the availability to use the computer and data which would
permit evaluation on many more criteria, one can hypothesize (H4) that more
goals will be considered. In contrast, other observers would argue that
the reason a manager has multiple goals is that (s)he has little confidence
in the information or the evaluative procedures on the few goals which are
very important and that multiple goals are a means of eliminating imprecisions
in the system. Accordingly, when a device to handle the important informa-
tion is made available, one would argue under this theory that fewer goals
would be mentioned; the executive now has the means to focus on the goals
of real importance.* Thus, both explanations seem plausible.
The result is inconclusive; there was no significant difference in
the number of goals mentioned in the (A) (142 goals) and (B) (129 goals) cases.
*See, for example, the Cyert and March (1963) concepts of quasi-resolution of
conflict, and the idea of multiple goals which are very imprecisely fulfilled
and traded off against each other.


- 20 -
Tliese results contrast with Harris (1963) , in that the goal to which most
participants turn initially is also the goal selected subsequently: earnings
per share. This goal so clearly dominates others as a major idea of the
participants that the desertion of high rate of return projects for those
projects with high earnings impact is readily apparent.
Goal Achievement - EPS
In Tables 4 to 6, one may consider particular projects which might
indicate significance of goal fulfillment given certain criteria as a major
standard. Calculations based on both the (A) case and the (B) case are shown.
Project 11 has a very favorable EPS impact and Project 13 has a
high rate of return and diversification possibilities. As can be seen in
Table 4, in the (A) case. Project 11 was more frequently selected by both
EPS and non-EPS goal groups. Furthermore, there was a more than proportion-
ate inclination on the part of the EPS group to accept this project with
high EPS, as expected, although the difference is not statistically signifi-
cant. Since there was a large overlap between EPS and rate of return groups
in the sample, the selection of these projects implies that the EPS and ROR
group together selected these projects more than the non-EPS/non-ROR groups
did, which is also consistent.
Project 12, which has a 4.8% rate of return but good earnings per
share impact, shows no difference in frequency of selection in the (A) case.
Project 20 is included much more frequently in the EPS-oriented participants'
portfolios, reflecting favorable reaction to the high EPS contribution of
this low rate of return (4.1%) project.
In the (B) case, the small size of the non-EPS groups makes tests
of significance difficult. The methodology noted earlier allows such


- 21 -
Table A
GOAL ACHIEVEMENT - EARNINGS PER SHARE
Project Number
Cx)
11
13
12
20
(A) CASE (B) C^^E
P(X1-EPS) P (x|ePS) // P(xl-EPS) P (XjEPS)
(N=21) (N=47) (N=4) (N=64)
32


- 22 -
evaluation, however. As far as the acceptance of Project 13 is concerned,
there is little difference among groups. Acceptance of the high EPS-impact
Project 11 is significantly greater for the EPS group (.78) versus the non-
EPS group (.25) on a one-tailed test. Project 12, with a similar high EPS
impact also has higher acceptance at the 10% level among participants favor-
ing EPS (.44) than among those not particularly concerned with EPS (,0).
Project 20 continues its general acceptance with the EPS group favoring it
core than the non-EPS group.
In terms of goal fulfillment and consistency for those selecting
earnings per share, the key project comparisons indicate consistency. With
earnings per share as a goal, there was heavy determination to select projects
which met that goal. This fulfillment was achieved even when there were low
rates of return on those projects, a selection conflicting with the goal
named second most frequently by the same participants.
Goal Achievement - Rate of Return
The exhibits were couched in terms of net present value although
results were also presented for the internal rate of return and profitability
index. The computer output and the tables accompanying the (B) case were
stated exclusively in net present value terms. However, more than 80% of the
participants referred to rate of return rather than net present value when
evaluating projects. Such a reaction indicates the difficulty of accepting
the meaning of net present value. It is consistent with the expectations
of many observers of business, who know the disinclination of a manager to
accept a concept foreign to his sensibilities; rate of return is_ a familiar
concept based on bond yields or debt rates. Accordingly, one can expect (H5)


- 23 -
that rate of return will be used as a criterion more than net present value.
This behavior can be seen again in the comparisons of the frequencies of
inclusion of Projects 5 and 6. These two projects are mutually exclusive
projects with alternate rankings on rate of return and net present value.
Rate of Return Ket Present Value Entry Cost
Project 5 11.9% $ 80 $1,000
Project 6 11.2 109 2,000
In the (A) case, those aaving the rate of return as a criterion had
a slight preference for either Project 5 or Project 6 than other groups.
However, all participants consistently favored Project 5 (with a higher rate
of return) over Project 6 (with a higher net present value) at the 1% level
on a one-tailed test based on data in Table 5. This result is consistent
with their responses being phrased in terms of the rate of return. Because
of the differences in entry costs this selection is likewise consistent with
their favoring a project with a higher rate of return on a small asset base.
In the (B) case, this pattern continues.
In terms of the five projects with a high rate of return on an
initial project causing the rejection of much larger projects because of their
mutual exclusivity, there is mixed evidence to support a hypothesis (H2A) that
those participants favoring rate of return were myopic. Projects 8 or 9 were
actually selected more frequently in (A) by the ROR group and Projects 2, 3,
or 4 selected less often.* Their frequency of selection of one or more of the
smaller projects (2, 3 and 4) is higher at the 10% level only in the (B) case
_
The frequency of Projects 8 or 9 was significantly greater in the ROR port-
folio at the 10% level in (A) on a two-tailed test, contrary to a hypothesisof myopia.


- 24 -
Table 5
GOAL achieve:'.e:;t - rate of return
ProjectNuiiiber
2
3
4
(A) CASE
PCx|-ROR) P (XJ ROR) #
(N=25) (N=43)
'(.40
.37
.33
,65*
P(X
(B) CASE
-ROR P(X ROR),-?
(N=33)(N=35)
,11)
.06
'
z\-14
,27
.34'.61
.27*
,51
5
6
.52
.16
.62
.23
11
13
12
20
63


- 25 -
compared to the non-rate of return group. Furthermore, their selection of
the larger projects (with major impact on present value and an overall rate
of return greater than any other major project) is likewise lower in the (B)
case compared to the non-rate of return group. These results are consistent
with the cyopia of viewing single projects rather than portfolios. Given
their standard, this selection would seem subnormal. Thus, the non-rate of
return group may have resolved this issue in the (B) case. The other groups
apparently did not.
In the (A) case, the projects with high earnings per share impact
but low rates of return (notably Projects 11, 12 and 20) tended to be rejected
by the rate of return group versus the non-rate of return group. The inclusion
of Project 13 with favorable rate of return but rather weak, impact on earnings
in earlier years was accepted by a greater number of rate of return-oriented
subjects, as expected. By the time of the (B) case, the momentum toward earn-
ings per share as a goal by all participants (including those participants also
concerned about rate of return) caused the patterns to merge. Nevertheless,
Project 13 was more heavily accepted by the rate of return group, and Projects
11, 12 and 20 were less frequently accepted by this group than by others.
However, all three low return projects had increased their incidence of
inclusion in the portfolios of the rate of return group as well, indicating
the overlap in earnings per share concern by all participants. Furthermore,
there was evidence of a "satisficing" strategy: rate of return might still be
important, but it was sacrificed in order to generate the required eaimings
impact.


- 26 -
Goal Achievement - Sales
Projects 5, 6, 7, 15, 16, 18, and 19 have no impact on sales. They
are cost reduction projects which have a favorable performance on criteria
such as earnings or rate of return. In the (A) and (B) cases, there seems to
be no significant difference in the level of acceptance of these projects
between the sales and non-sales groups (Table 6). Again, the searching and
quasi-f ulfillment of goals described by Cyert and March (1963) is consistent
with this outcome, for the sales increase standard is achieved by the inclusion
of other projects.
Among the projects which provide substantial sales increase, the
picture is different. Projects 11 and 12 have low rates of return (5% and 7%
respectively), but good sales increases, although Project 12 's increase only
helps the first year's sales. Project 20 has a low rate of return (4%), but
high earnings in the third year, and a very high contribution to sales in
all years.
In the (A) case. Project 11 is accepted more frequently by sales-
oriented groups but Project 12 is accepted slightly less frequently. The
differential is significantly different for Project 20 (.06 for the non-sales
group versus .38 for the sales group). In the (B) case, these three projects
are all included with greater frequency for the sales group vis-a-vis the
non-sales group.
These results weakly support the concept of goal fulfillment in the
area of sales but much less significantly than in the case of earnings per
share or rate of return goal fulfillment. There was no significant avoidance
of project:; which did not fulfill the goal in any way; projects with zero
impact on sales were not significantly different in their inclusion in the


- 27 -
Table 6
GOAL ACHIEVEMENT - SALES INCREASE


- 28 -
portfolios of the sales and non-sales-oriented group. However, in the case
of projects with low rates of return but sharp contributions to sales
increases, there was greater frequency of inclusion of such projects by the
sales group, as hypothesized.
Constraints on Project Selection
Nearly one- third of the participants placed a constraint on cash
flow in both the (A) and (B) trials. This constraint was typically expressed
as part of their goal statement; e.g., "Maximize earnings per share subject
to a minimum of $X in second and third year cash flow," or "... with a 90%
confidence level for a positive cash flow in the third year"^ The table below
indicates the proportions of executives noting various restrictions on their
portfolios in both trials. The rate of return constraint was often expressed
as "a return no less than the firm's cost of capital," although this require-
ment was typically ignored in the case of a particular project when the
project was especially desirable on some goal (e.g., earnings per share).
The low incidence of earnings per share as a constraint was coincident with
the major selection of this factor as a goal; the typical goal was maximum
earnings per share, with no regard for any minimum level of earnings.
CONSTRAINTS ON PROJECT SELECTION


- 29 -
The emphasis upon cash flow as a constraint is a way for the
executive to deal with two major problems: risk and intertemporal portfolio
considerations . A minimum cash flow (perhaps with some confidence level) is
an approach to the danger of bankruptcy. In addition, in the view of some
executives, a positive cash flow was seen as providing cash for dividends,
or as a means to permit additional loans from which to pay dividends. The
cash flow constraint was frequently noted as being a safety factor, or a way
"to handle the risk of the firm."
Aware that some of the projects might be postponed, the executives
noted that there were likely to be other desirable projects which might occur
in future years, and they wanted to have some minimum level of cash flow avail-
able to invest in these unknown projects and/or to convince the debt or equity
markets that funds could be advanced prudently for the firm to accept the new
projects. Thus, this emphasis focused upon the firm as a "cash generator"
over time, in order to enable the manager to accept projects which might sub-
sequently appear. Since the attributes of these projects were unknown, the
executives gambled that reasonable proposals would appear; cash inflow was
needed to have available the option of investing in those future proposals.
Goal Specification and the Concern With Risk
The cross-tabulation in Table 7 attempts to confirm that there is a
positive relationship between time spent on the project evaluation process and
the selection of a risk profile (H6) . Given the capability for an evaluation
of risk among projects in the (B) case, the number of participants who looked
at risk increased dramatically for all criteria. In the (A) case, risk of
projects could be evaluated, but risk of the portfolio, the only risk of
ultimate concern, was not possible.


- 30 -
Table 7
EXPLICIT CONCERN' WITH RISK
(A) Case CB) Case
Ot"=681 (N = 68)
CB)


- 31 -
Another hypothesis is that the computer is associated with greater
risk evaluation (H4A) . To review this question, the sample was segmented
into those participants who did not use the computer and those who were
relatively heavy computer users. Those executives without the computer had
a .36 incidence of concern with risk on earnings per share, while those
using the computer had a .67 incidence of concern with this risk. -Overall,
there was an average incidence of the risk evaluation of .25 for those not
using the computer versus .44 for those using the computer. The small number
of those not using the computer makes the test for significance extremely
restrictive in this case. However, there is a probable relationship at the
80% level.
Given the ability to evaluate risk, the conclusion is that the
computer did help those who employed it. Other studies have previously
indicated managers have concern over risk, and this study tends to indicate
that given the opportunity to evaluate risk, the managers considered the
information from the computer .
Risk Evaluation
One may also stratify the group based on content analysis of their
standards answered in the questionnaires, where the content evaluation is
based on a concern with risk. When participants mentioned "risk" on more than
two of the four categories in either (A) or (B) , they were considered to be
concerned with risk to a high level; the tone of the comments indicated that
they were generally risk avoiders. Where risk was not mentioned on any goal
in either case, the participant was considered to be unconcerned with risk.
This means that the group was divided into three parts. The results shown
here are for those at either extreme of the risk evaluation continuum.


32 -
Project 13 has some risk-reduction qualities suggested in the verbal
description given to the participants. Project 14 is the most signif icar.tly
diversifying of the projects, although the nature of the diversification is
most apparent to those using the computer model. In the (A) case, partici-
pants who evidenced risk as a major concern included both projects to a
greater degree than other participants (Table 8). In the (B) case, again
there was favor in the acceptance of Project 13. Those executives who indi-
cated risk was a major concern also had a significantly greater inclusion of
Project 14. These results are also consistent with the idea of greater
evaluation of risk criteria if the information is available.
Another indicator of the manner in which risk may be evaluated con-
cerns the selection of the confidence intervals for the portfolio results
returned to the users of the SIFT computer program. Participants could require
confidence intervals of 25%/75%, 10%/90%, 5°<;/95% or l%/99%. In reviewing the
output of the executives who used this program, the majority clearly preferred
the middle ranges of confidence intervals. The lower unit (25%/75%) was
specifically mentioned by some participants as being "too low to be real."
The higher unit, in contrast, may seem to have such a remote chance of
happening (and, correspondingly, be such a large distance in value from the
expected outcome produced at their terminals) as to be meaningless. A signif-
icant minority (15%) iterated among two or more confidence intervals, select-
ing certain intervals for some problems and other intervals in alternate
situations. For example, many were severely concerned with cash flow figures
at the lower limit (a constraint) , but were willing to employ a wider confi-
dence range for earnings per share.


- 33 -
Table 8
GOAL ACHIEVEMENT - RISK AVOIDA.\CE
Ca} case cb) case
P(x} -RA) P 0(|rAJ# PCx1-R.\) P (x! RA) //
(N-35} CN=15) CN=17) CN-29)
Project N


- 34 -
CONFIDENCE INTERVAL
251115% 10%/90% 5%/95% l%/99% Multiple
Incidence .04 .39 .38 .04 .15
Some managers look at risk in a "no worse than we are" option;
e.g., "if our firm adds these projects, what is the probability of doing as
well as we probably can do without the projects?" Since SIFT permitted the
manager to view a portfolio versus the ongoing firm (Project 1) in this
light, we can check how many users of the SIFT system requested this output.
In fact, 14% requested such a comparison. The general orientation seemed to
be that the firm was growing, did have the funds, and the task was to find a
good package of projects. It seemed to the participants, then, that almost
any package would be desirable versus doing nothing given that the funds
were going to be raised and the attendant dilution in EPS was assured.
Hence, the nature of the experiment is biased against a subject's frequent
concern with this risk measure.
Leasing Versus Purchasing
This topic is one in which the finance profession is divided. Most
writers agree that leasing should not increase debt capacity for the ongoing
firm; however, many observers feel that the process of adjustment for leasing
made by lenders and the investment community may be such as to allow greater
debt capacity (see, for example, Vancil and Anthony (1959)). Most writers
agree that leases should be discounted at the after-tax cost of debt
(Roenfeldt and Osteryoung (1973)).
Leasing was discussed specifically but briefly in the educational
program for the participants. In the table of projects, a truck fleet was


- 35 -
proposed which could be owned (Project 15) or leased (Project 16). The rate
of return of the leased project was defined using the present value of the
lease payments as the investments. If a lessor has relatively low charges
to the lessee, then the appeal of this debt-like financing via a lease will
provide a high rate of return if the operating cash flow itself provides a
return above the implicit lease rate.* The overall rate of return of the
trucks was 16.7% (Project 15). When the low-cost lease financing was included
in Project 16, the rate of return was 36.6% using this specious calculation.
The differential in earnings per share in the first three years was minimal
for these two approaches, but the initial cash outlay required was SO for the
leasing proposal versus $400,000 for ownership. Thus, the hypothesis is in
evaluating a lease proposal versus a purchase, managers viewing a rate of
return, the low cash outlay, or other figures will choose the lease, other
things constant (H7).
The information was there for the executives to re-evaluate the
lease proposal. However, no one challenged the calculations in writing or
verbally. Large majorities of all groups selected the leasing option.
Project 16. This selection was significant at the 1% level for all groups
except finance. Those participants with backgrounds in finance were somewhat
less enthusiastic about leasing. However this favorable observation is
tempered by noting that, even in this group, a two-thirds majority of those
For example, if one invests $100 to receive a strean of $20 per year
for 10 years, the rate of return is 15%. On the other hand, a lease
proposal v/ith a lessor's cost of funds at Csay) 7% requiring lessee
payment cf $14 for 10 years yields a higher rate of return under this
sort of calculation in which the investment and the financing proposals
are mistakenly nixed. The financing payments are discounted at the
firm's cost of capital C10%) to give an "investment" of only $S6 instead
of $100. Since the inflows are still $20 per year, the "rate of return"
is 19%. This sort of analysis is not unusual vhen people analyze a
lease. It is also frequently seen when people analyze major projects
that have initial financing tied to then, as oil tankers.

- 36 -
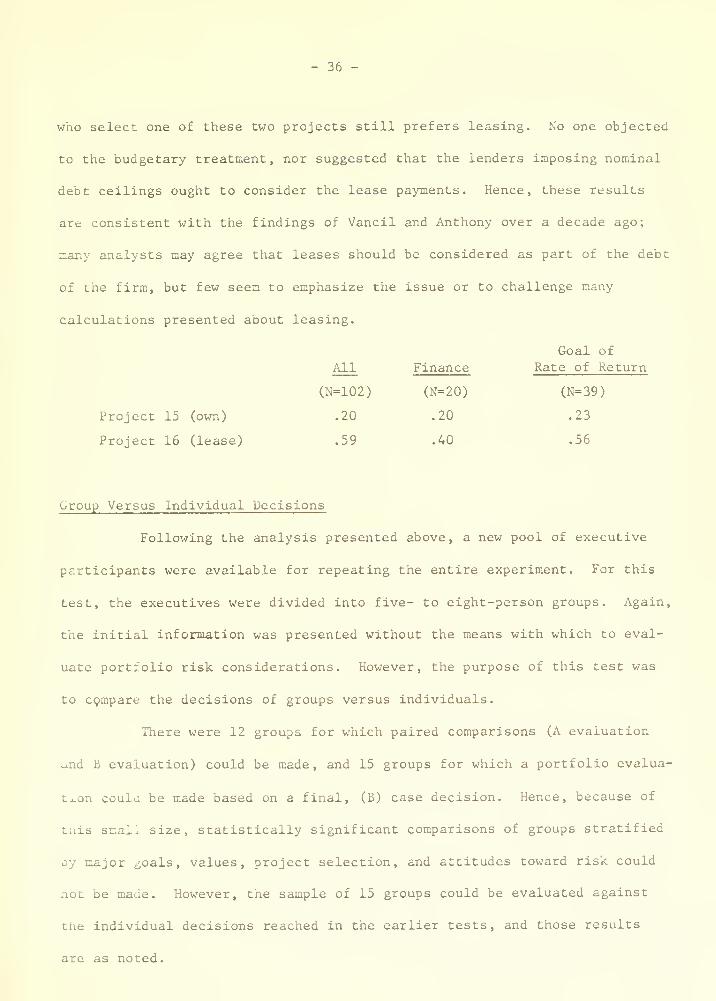
who select one of these two projects still prefers leasing. No one objected
to the budgetary treatment, nor suggested that the lenders imposing nominal
debt ceilings ought to consider the lease payments. Hence, these results
are consistent with the findings of Vancil and Anthony over a decade ago;
many analysts may agree that leases should be considered as part of the debt
of the firm, but few seem to emphasize the issue or to challenge many
calculations presented about leasing.


- 37 -
Project Acceptance . The frequency of projects selected by individuals
was generally repeated in the groups. In a rank correlation test, in which the
rank order of frequency of selection of projects was compared for two groups,
the correlation coefficient for the individual and group decisions was .86 on
the (A) case and .90 on the (B) case, indicating highly similar evaluations
and frequency of selection by the participants.
Goals . Some observers of business have suggested that the organiza-
tion wishes to avoid conflict and operates by a quasi-resolution of conflict.
If that is true, then we would expect groups of individuals to have more goals
as standards for projects. Such a selection is a way of avoiding conflict.
When one person feels sales are important, another is concerned with rate of
return, a third favors a broadly diversified business active in many fields,
and so on, the most obvious compromise is to state all of these views as
"group goals." Hence, we hypothesize (H8) that groups will have more goals
than the individuals.
For the 12 groups on which paired comparisons were possible, the
frequency of goal selection in the (A) and (B) cases paralleled the frequency
found with individuals, as shown in Table 9. However, there were two major
changes. First, the inclusion of the "other" category in goals is much more
frequent in the (A) and (B) trials for groups versus individuals. Second,
the goals per responding unit are increased for groups, averaging 3 goals
per unit versus the 2 goals which the individual typically had. Both of
these differences are statistically significant.
These two changes suggest one conclusion: as a means of avoiding
conflict, groups apparently tended to list as a goal almost any item any
person in the group thought was reasonable whatever the inconsistency with


- 38 -
Table 9
COMPARISON OF GROUP AND INDIVIDUAL GOALS
(A) Case (B) Case
Individuals Groups Individuals Groups(N=68) (N=12) (N=68) (N=12)
Goal
Rate of Return


39 -
the other goals espoused . Hence, one person would like to see a sales
increase, and that would be listed. Another group member favored steady
earnings per share growth, and that would be listed. Thus, as hypothesized,
the organizations (i.e., the groups) lived with plural goals, often incon-
sistent, resolving conflict in effect by saying, "Yes, we think your goal is
important," even if that goal was directly offset by other goals. In this
situation, however, all the nominal goals could be listed, and the conflict
(if it arose) would be apparent only with final portfolio decision.
Lease Versus Buy . Although it was not reasonable to separate a
"group" with a finance background, it was possible to complete a paired
comparison between acceptance of the owned truck fleet (Project 15) versus
the leased fleet (Project 16) for the total sample and for the groups select-
ing rate of return as a goal. The results confirm the emphasis by the
participants on the lease option.
All


- 40 -
Rate of Return Versus Net Present Value . Following the pattern of
the individuals, the groups favored the higher rate of return project (Project
5) over the project with the higher net present value (Project 6). From a
total of 15 groups, 11 chose the higher rate of return project and 1 chose
the higher net present value project.
Conclusion on the Group Choices . The main confirmation from the
group experiments were the similarities in group goal standards, considerations
of risk, general project selections, and specific lease, socially responsible,
and rate of return project selections. However, of greater interest to the
student of organizations is the markedly higher incidence of criteria named
as "Goals" for the group coupled with the preponderance of vaguely defined
"Other" goals.
Conclusions
In reviewing these data, one must be cautious in interpreting
any differences. Where there are significant differences, one must ask
whether there is a spurious relationship or whether there may be meaningful
justification for such differences. This study sought to evaluate a variety
of items which have been hypothesized to affect management decision making.
In adding some evidence to this field, the study is designed only as
evidential and not judgmental. Laboratory experiments suffer from artifi-
ciality; field experiments suffer from noncontrollability of exogenous
factors and other defects. As George Romans once observed, there are neither
good nor bad methods of research, only methods which have certain defects
vis-^-vis others with alternative limitations. Within the confines of one
laboratory method and these executives, we can find the following conclusions
warranted
.


- 41 -
First, there was consistent evidence of multiple goals , and a
trade-off among those goals. This finding is generally consistent with the
findings of Harris (1963) but differs in some respects. Even when the
criteria were not simultaneously mentioned as constraints, however, many of
the goals seemed to be satisficing goals: a reasonable level of goal
fulfillment was achieved and the participant turned to other topics. This
behavior is consistent with the idea of a global objective function. It is
also consistent with quasi-fulfillment of goals and quasi-resolution of
conflict in the terms of Cyert and March (1963). Ignoring risk,. the port-
folios with maximum expected net present value, rate of return, first-year
earnings per share, and third-year earnings per share were determined by
integer programming.* These portfolios were rarely selected by the partici-
pants in any subclassification. One can argue, of course, that the partici-
pants were unable or uninterested in truly maximizing these criteria.
Alternatively, and more reasonably it would seem to this writer, one can say
that the ideas of multiple goals, risk, and satisficing mentioned in eval-
uating their responses to the questionnaires is fully consistent with their
behavior. There was a global objective function, perhaps shifting as their
knowledge of the problem deepened, and requiring a variety of projects in
the portfolios.
Second, a major concern was risk . It was considered when the
information was available and when the means for evaluation was present.
Thus, this study indicates that computers or other devices which allow a
manager to evaluate risk are useful. Nothing in.. the model used by these
_
See Carter (1974) , Appendix 8A.


- 42 -
executives is technologically unfeasible for the corporation; obtaining the
data and training the executives to use it are the major restrictions.* The
data problem is lessened with wider use of computer data bases and retention
of historical information from which simulation models can be constructed.
Risk was most frequently evaluated on the basis of a 5%/95% or 10%/90%
confidence interval. General responses to questionnaires indicated a major
concern with achieving a no-loss portfolio. Finally, the use of cash flow
at some minimum level with a certain lower confidence limit was used by some
executives as a way of achieving a suitable risk position vis-^-vis dividends
and bankruptcy, as well as assuring available financing for unknown projects
which Diigtit occur in future years.
Third, goal fulfillment seemed generally to be successful, given
the idea of multiplicity of goals. Nearly all users of the computer model
specifically indicated at the end of their efforts that they believed they
achieved their goals. There was consistency of goals from one period to the
other. Those participants especially concerned about rate of return or
earnings per share had a predictably larger incidence of inclusion of projects
excelling on these criteria in their portfolios. Likewise, projects especially
weak on these criteria were rejected in higher proportions. In the case of
sales-oriented subjects, the rejections of projects not increasing sales was
no different from the non-sales-oriented group. However, the sales-oriented
group did emphasize those projects significantly boosting sales in all years,
indicating a one-sided view of this goal. Such a solution is consistent with
satisficing, for it may well be that the sales-increasing projects were
selected early to achieve certain growth rates; non-sales-increasing projects
were added later for a variety of other reasons.
*See especially McSweeney (1972) (1973) for a discussion of how a complex
management science model may be successfully employed in a corporation to
aid in project selection at the highest levels.

- 43
Fourth, there was emphasis on earnings per share , and secondly
on rate of return. "Rate of return" was preferred to "net present value."
The filtering of this measure induced the selection of a small project with
a very high rate of return versus a much larger project with a lower return.
The combination of this difficulty with the orientation toward leasing
indicates the difficulty of communicating these subtleties to individuals
in simple terms. Likewise, the orientation toward reported earnings per
share as the main goal reflects a concern with the public marketplace and
the evaluative standards of that marketplace.
Fifth, professional bias in selection of projects was found in the
area of finance. There were no consistent patterns of project selection or
standards which differentiated marketing production and general management
groups from each other. Such lack of differential may be explained by the
"general management" orientation of the program- environment and the career
designs of nearly all executives sent to it, regardless of the professional
backgrounds from which the subjects came.
Sixth, in terms of regional differences , there was evidence that
Europeans tended to be less concerned with sales and Americans less concerned
with cash flow than other groups. The lack of interest of Americans in cash
flow had been hypothesized; the lower interest of Europeans in sales was not
expected. Whether this outcome reflects cultural bias or educational efforts
is uncertain. One hesitates to make judgments about the significantly lower
interest in the "socially responsible" project by the Commonwealth participants,
Seventh, when group comparisons are included, the major difference
seems to be that there are more "complex" goals listed, and groups considered


- 44 -
more goals in total . The data supported the hypothesis that groups will
state more goals as part of their objectives as a means of avoiding conflict
within the organization. Presumably, accepting a goal can be done easily on
the assumption that either a conflict over a project will or will not occur.
If it does not occur, accepting the goal costs nothing. If a conflict later
occurs, a participant may assume that it would occur whether or not the goal
were initially listed by the group; the person holding that goal would still
retain it whether or not the group initially accepted it.
A summary of the particular hypotheses suggested here is presented
in Table 10.
All of these observations are tempered by the nature of the testing
procedure and the data. However, they do tend to provide evidence to accept
or reject behavioral characteristics which have been observed or speculated
upon by other researchers. Further, the evidence of risk evaluation given
the information and means to evaluate it is compelling. Such evidence is
important to management scientists, businessmen, and business educators.
One must note that this form of risk evaluation was in a businesslike setting.
It was not restricted to gambling choices or games within the realm of more
mathematical models. Those experiments are important; the merit of this
approach is to stress the applicability of risk evaluation in^ a business
setting b^ executives.


- 45 -
Table 10
SUMMARY OF ELEVEN HYPOTHESES AND LABOR.-\TORY RESULTS
HI
HIA
H2
H2A
H3
H3A
H4
H4A
H5
H6
H7
H8
Finance professionals will favorEPS and rate of return as goalsand in risk considerations.
Marketing professionals will favorsales in goal selection and riskconsiderations.
Finance professionals will favor rateof return and will be myopic, selectinga small project with a very high rateof return project over a larger blockof projects with high returns.
Given rate of return as a go&l, parti-cipants will favor a small project witha very high rate of return over a largerblock of projects with high returns.
United States participants will favorEPS more than others.
Non-US participants will favor cashflow and sales as goals more than others.
Given a coxputer, participants willevaluate more goals.
Given the computer, participants willhave more complete evaluation of risk.
Rate of return will be niore acceptablethan net present value as a standard for
project acceptance or rejection.
Given time and information, participantswill have more complete evaluation of risk.
Leasing is favored over purchasing givena standard NPV analysis at the cost ofcapital.
Groups will have more goals than
individuals as a form of conflictresolution.
supported
rejected
supported
supported
rejected
supported(cash flow)
rejected
supported
supported
supported
supported
supported


- 46 -
BIBLIOGRAPHY
Alderfer, Clayton, T. and Bierman, Harold, Jr., "Choices with Risk: Beyond
the Mean and Variance," Journal of Business , July 1970, pp. 341-353.
Baldwin, W. , "The Motives of Managers, Environmental Restraints, and the
rneory of Managerial Enterprise," The Quarterly Journal of Economics ,
May 1964, pp. 238-256.
Baumol, W. , Business Behavior, Value, and Growth , Macmillan, Inc., New York,
1954.
Berg, Norman A. , The Allocation of Strategic Funds in a Large, Diversified
Industrial Company , unpublished doctoral dissertation. Graduate School of
Business Administration, Harvard University, Boston, Massachusetts, 1963.
Bierman, Harold and Hass, Jerome E. , "Capital Budgeting Under Uncertainty:
A Reformulation," Journal of Finance , March 1973, pp. 119-129.
Bower, Joseph L. , Managing the Resource Allocation Process , Division of
Research, Harvard Business School, Boston, Massachusetts, 1970.
Carter, E. Eugene, "The Behavioral Theory of the Firm and Top-Level Corporate
Decisions," Administrative Science Quarterly , December 1971, pp. 413-428.
Carter, E. Eugene, Portfolio Aspects of Corporate Capital Budgeting , D. C.
Heath and Company, Lexington, Massachusetts, 1974.
Chamberlain, Neil, The Firm: Micro-Economic Planning and Action , McGraw-Hill,
Inc., New York, 1962.
Chambers, John C. : Mullick, Satinder K. ; and Smith, Donald D. , "The Use of
Simulation Models at Corning Glass Works," in Corporate Simulation Models ,
edited by Albert N. Schrieber, University of Washington Printing Plant,
Seattle, Washington, 1970, pp. 138-162.
Cohen, Kalman J. and Cyert, Richard M. , "Strategy: Formulation, Implementa-
tion, and Monitoring," Journal of Business, July 1973, pp. 349-367.
Cohen, Michael D. , March, James G. , and Olsen, Johan P., "A Garbage Can
Model of Organizational Choice," Administrative Science Quarterly , March
1972, pp. 1-25.
Conrath, David W. , "From Statistical Decision Theory to Practice: Some
Proolems with the Transition," Management Science , April 1973, pp. 873-883.
Cyert, Richard M. , and MacCrimmon, Kenneth R. , "Organizations," in G. Lindzey
and E. Aronson, editors. Handbook of Social Psychology , second edition,
Addison-Wesley , Reading, Massachusetts, 1967.


_ 47 -
Cyert, R. M. and March, J.G., A Behavioral Theory of the Firm , Prentice-Hall,Inc., Englewood Cliffs, New Jersey, 1963.
Dearborn, D. C, and Simon, H. A., "Selective Perception: A Note on the
Departmental Identification of Executives," Sociometry , Volume 21, 1958,
pp. 140-144.
England, George W. and Lee, Raymond, "Organizational Goals and Expected
Behavior Among American, Japanese and Korean Managers - A Comparative Study,"
Academy of Management Journal , December 1971, pp. 425-438.
Finney, D. J. et al. , Tables for Testing Significance in a 2 x 2 Contingency
Table , Cambridge University Press, Cambridge, England, 1963.
Fisher, R. A., Statistical Methods for Research Workers , Oliver and Boyd,
Edinburgh, Scotland, 1941.
Fremgen, James M. , "Capital Budgeting Practices: A Survey," Management
Accounting , May 1973, pp. 19-25.
Gale, Bradley T. , "Market Share and Rate of Return," Review of Economicsand Statistics , December, 1972, Vol. LIV, No. 4, pp. 412-423
Gershefski, George W. , "Corporate Models - The State of the Art," Management
Science , Volume 16, No. 6, February 1970, pp. B303-B312.
Hillier, Frederick S., The Evaluation of Risky Interrelated Investments ,
North Holland Publishing Company, Amsterdam and London, 1969.
Jean, William H. , The Analytical Theory of Finance . Hold, Rinehart and
Winston, New York, 1970.
Katona, G. , Psychological Analysis of Economic Behavior , McGraw-Hill, New
York, 1951.
Keeley, Robert and Westerfield, Randolph, "A Problem in Probability Distribu-
tion Techniques for Capital Budgeting," Journal of Finance , June 1972,
pp. 703-709.
Klammer, Thomas, "Empirical Evidence of the Adoption of SophisticatedCapital Budgeting Techniques," Journal of Business , July 1972, pp. 387-397.
Lanzillotti, R. F., "Pricing Objectives in Large Companies," AmericanEconomic Review , December 1958, pp. 921-940.
Mao, James C. T. and Helliwell, John F., "Investment Decision Under
Uncertainty: Theory and Practice," Journal of Finance , May 1969, pp. 323-
338. (Also see "Comment" by Frank Jen, pp. 342-344.) •
March, J.G., and Simon, H.A. , Organizations , John Wiley and Sons, Inc.,
New York, 1953.


48 -
Harris, Robin, "A Model of the 'Managerial' Enterprise," Quarterly Journalof Economics , May 1963, pp. 185-209.
McSweeney, James J., "A Strategic Management System - An OperationalConcept," Financial Management Association meeting, San Antonio, Texas,October 1972.
McSweeny, James J., Strategic Management Systems , unpublished paper.International Utilities, January 1973.
Miller, George A., "The Magical Number Seven, Plus or Minus Two: Some Limitson Our Capacity for Processing Information," Psychological Review , Volume63, No. 2, 1956, pp. 81-97.
Mintzberg, Henry, Ransinghani, Duru, and Theoret, Andre, The Structure of"Unstructured" Decision Processes , McGill University, Montreal, 1973.
National Industrial Conference Board, U.S. Production Abroad and theBalance of Payments , New York, 1966.
Paine, Neil R. , "Uncertainty and Capital Budgeting," The Accounting Review ,
April 1964, pp. 330-332.
Raiffa, Howard, Decision Analysis; Introductory Lectures on Choices UnderUncertainty , Addison-Wesley , Reading, Massachusetts, 1968.
Roenfeldt, Rodney L. and Osteryoung, Jerome S. , "Analysis of Financial Leases,"Financial Management , Volume II, No. 1, Spring 1973, pp. 74-87.
Rotch, William, Return on Investment as a Measure of Performance , unpublisheddoctoral dissertation, Graduate School of Business Administration, HarvardUniversity, Boston, Massachusetts, 1958.
Salazar, Rodolfo C. , and Sen, Subrata K. , "A Simulation Model of CapitalBudgeting Under Uncertainty," Management Science , December 1938, pp. B161-B179.
Schrieber, Albert N. editor. Corporate Simulation Models , University of
Washington Printing Plant, Seattle, 1970.
Shaw, Marvin E. and Penrod, William T., Jr., "Does More Information Availableto a Group Always Improve Performance?" Sociometry , Volume 25, 1962,
pp. 377-390.
Suubik, Martin, "Approaches to the Study of Decision-Making Relevant to theFirm," Journal of Business , April 1961, 34:101-118.
Simon, Herbert A., Models of Man , John Wiley and Sons, Inc., New York, 1957.


- 49 -
Simon, H. A., "On the Concept of Organizational Goal," Administrative ScienceQuarterly , June 1964, pp. 1-22.
Slovic, Paul, "Psychological Study of Human Judgment: Implications for Invest-ment Decision Making," Journal of Finance , September 1972, pp. 779-799.
Snedecor, George W. and Cochran, William G. , Statistical Methods , sixth edition,Iowa State University Press, Ames, Iowa, 1967.
Spitaller, Erich, "A Survey of Recent Quantitative Studies of Long-TermCapital Movements," International Monetary Fund Staff Papers , March, 1971,
pp. 189-217.
Vancil, Richard F. and Anthony, Robert N. , "The Financial Community Looks at
Leasing," Harvard Business Review , November-December 1959, pp. 2113-140.
Wallich, Michael A., Kogan, Nathan, and Bem, Daryl J., "Group Influence on
Individual Risk Taking," Journal of Abnormal and Social Psychology , 1962,
pp. 75-86.
Woods, Donald H. , "Decision Making Under Uncertainty in Hierarchical Organi-zations," unpublished doctoral dissertation. Graduate School of BusinessAdministration, Harvard University, Boston, Massachusetts, 1965.


DafMue''
^tffH-5=;sao
OoI2&'8
¥a-eN3bY.
APR. 04 '994
JAN 2 ie?5
FEB 2 1 1936
JUL 1 3 1^86
HAY t 9 V
WAS 2 5 •!
i£-jL£m:
^6 IflM
Lib-26-67
crrtcmeBookbinding Co., Inc.
100 Cambridge St.
Charlestcwn, MA 0?129

TDflD D
MIT LIBRARIES
D3 7Tb ET
731-7H
Mn LIBRARIES
TOflO DO 3 fig? 315MIT LIBRARIES
aO DOTD
TDflD OD
3 7Tb EbE
3 fla7 M71M!T LIBRARIES
72^-7'/
73T-7''/
TDflD DD3 7Tb Hflfi
MIT LIBRARIES
73^'7^/1
TOfiO D03 &27 5TTMIT LIBRARIES
TDfiD DD3 &E7 2bS
MIT LIBRARIES
737-7'^
TOfiD DD3 fiS7 331MIT LIBRARIES
TD D 0D3 T7b E37
