management tools and trends 2009 - bain & company
TRANSCRIPT

This information is confidential and was prepared by Bain & Company solely for the use of our client; it is not to be relied on by any 3rd party without Bain's prior written consent.
Management Tools and Trends 2009Author: Darrell RigbyCo-author: Barbara Bilodeau

• In 1993, Bain launched a multi-year research project to get the facts about management tools and trends. Our objective is two-fold:
- To provide managers with information they need to identify and integrate tools that will improve bottom-line results
- To understand how global executives view their strategic challenges and priorities
• Over the past 16 years, we have completed 12 surveys, assembling a database that now includes 9,933 respondents from more than 70 countries in North America, Europe, Asia, Africa, the Middle East and Latin America
• This year, we received 1430 completed surveys from a broad range of international executives. We also conducted personal follow-up interviews to further probe the circumstances under which tools are most likely to produce desired results
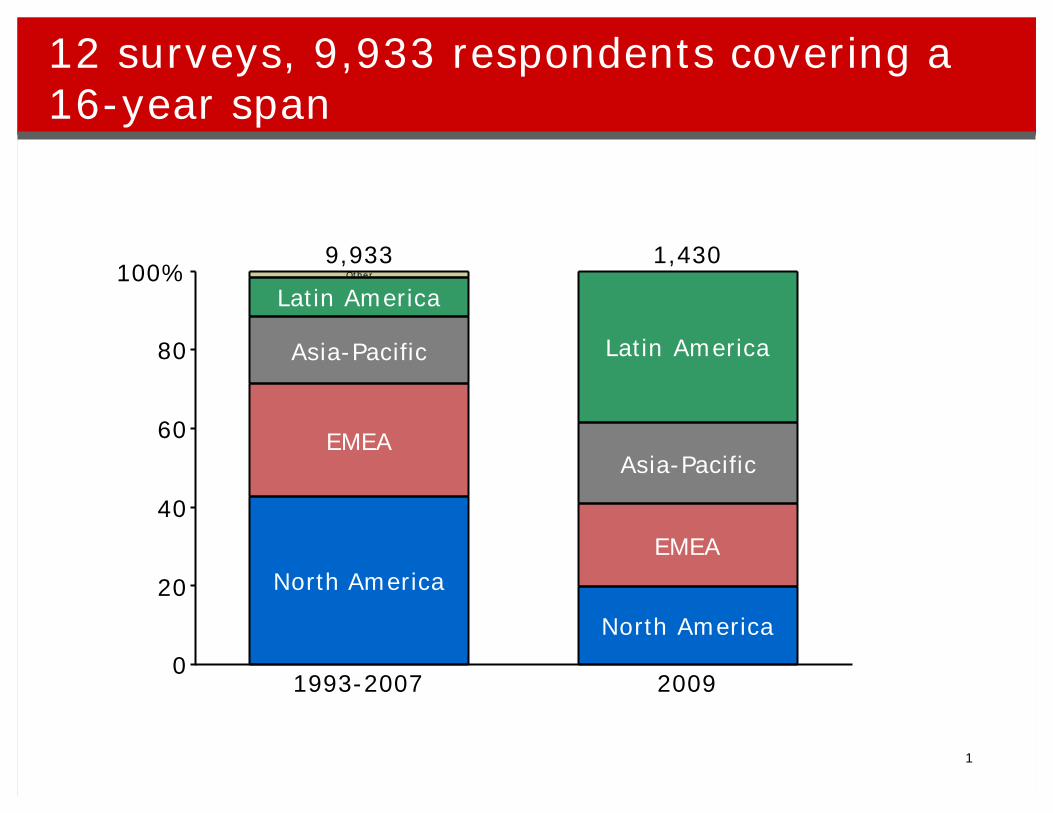
12 surveys, 9,933 respondents covering a 16-year span
0
20
40
60
80
100%
1993-2007
EMEA
North America
Asia-Pacific
Other
Latin America
9,933
2009
EMEA
North America
Latin America
Asia-Pacific
1,430
1

iThis year, we focused on 25 of the most popular tools and techniques, listed on the slide below. To qualify for inclusion, a tool had to be:
- Relevant to senior management- Topical (as evidenced by coverage in the business press)- Measurable
iWe defined these tools in a booklet titled Management Tools 2009, An Executive’s Guide
iSurveys were conducted online in partnership with
iThe survey is reprinted in the appendix at the back of this report

We focused on 25 of the most popular tools
iBalanced Scorecard
iBenchmarking
iBusiness Process Reengineering
iCollaborative Innovation
iCore Competencies
iCustomer Relationship Management
iCustomer Segmentation
iDecision Rights Tools*
iDownsizing*
iGrowth Strategy Tools
iKnowledge Management
iLean Six Sigma
iLoyalty Management Tools
iMergers and Acquisitions
iMission and Vision Statements
iOnline Communities*
iOutsourcing
iPrice Optimization Models*
iScenario & Contingency Planning
iShared Service Centers
iStrategic Alliances
iStrategic Planning
iSupply Chain Management
iTotal Quality Management
iVoice of the Customer Innovation*
* Tool added to the survey in 2009 2

iGlobal respondents represent a full range of industries and company sizes
iWith results of 9,933 surveys and more than 300 personal interviews in our database, we have created the world’s most comprehensive and definitive fact base on management tools and trends

Global respondents represent the full range of industries and company sizes
0
20
40
60
80
100%
Demographics of 2009 global respondents
Industry
Media & EntertainmentRetail
Consumer ProductsConstruction & Real Estate
Financial Services
Tech & Telecomm
Services
Manufacturing
Transport & Tourism
Wholesale, Distribution& LogisticsHealthcare
Don't Know/UnknownOther
Pharma & Biotech
Food & Beverage
Chemicals& MetalUtilities& Energy
100
Corporate sales
<600MM
$600MM - <$2B
$2B+
100
3

iCompany sizes are similar across all regions, with Latin American companies slightly smaller

Company size was similar in each region
0
20
40
60
80
100%
Percent of respondents
NorthAmerica
$2B+
$600mto <$2B
<$600M
100
EMEA
100
Asia-Pacific
100
LatinAmerica
100
4

This year’s trends analysis highlights:
iExecutives are concerned about the short-term, but optimistic about the long-term
- Seven of ten are “very concerned about how they will meet growth targets in 2009” and six of ten are “planning for a downturn that will last at least until early 2010”
- Almost eight of ten executives agree “our company will use this recession to improve our competitive position”
• Despite this long-term optimism, many executives have concerns about how they are currently being operated
- Half of executives believe “unclear decision making is hurting our performance”, and “insufficient customer insight is hurting our performance”
- Four of ten believe “our decisions are being driven by short-term financials, not long-term strategies”
• The short-term pain will include many layoffs- Thirty-six percent of executives say their organization will have significant layoffs. Six of ten
organizations either downsized in 2008 and/or are likely to in 2009. This, despite the fact that half of executives believe “we should focus more on revenue growth and less on cost reduction”
• Long-term success will include the need to adapt as executives believe current conditions will have long-term impact
- Seven of ten executives believe “government regulation of business will increase over the next five years” and that “the current downturn will change consumer behaviors for at least three years”
- Only one quarter of executives believe “today’s market leaders will still be leaders five years from now”
• Innovation continues to be very important – and difficult- Eight of ten executives agree that “Innovation is more important than cost reduction for long-term
success”, six of ten believe they could dramatically boost innovation by collaborating with other companies” and half say “their entire organization is actively engaged in improving innovation”
- Collaborative Innovation and Voice of the Customer Innovation are two of the five tools that show the largest likely increase in usage from 2008 to 2009

The view on management trends
DisagreeAgree
5
Culture is as important as strategy for business success
Innovation is more important than cost reduction for long-term success
Our company will use this recession to improve our competitive position
Government regulation of business will increase over the next five years
The current downturn will change consumer behaviors for at least three years
I am very concerned about how we will meet growth targets in 2009
International growth will be vital to our performance over the next five years
We are planning for a downturn that will last at least until early 2010
We could dramatically boost innovation by collaborating with other companies
We should focus more on revenue growth and less on cost reductions
Our entire organization is actively engaged in improving innovation
Unclear decision making authority is hurting our performance
Insufficient customer insight is hurting our performance
Our decisions are being driven by short-term financials, not long-term strategies
We will pursue sustainability initiatives even if they hurt our profits
Our top executives are comfortable taking higher risks for potentially higher returns
Other emerging markets now offer better opportunities than China and India
Our company will have significant layoffs in 2009
Our company waited too long to respond to this economic downturn
Almost all of today’s market leaders will still be leaders five years from now
88%
76%
75%
71%
71%
70%
66%
64%
58%
53%
52%
50%
46%
44%
44%
40%
38%
36%
25%
24%
4%
13%
9%
11%
17%
15%
19%
20%
16%
30%
25%
33%
34%
43%
31%
41%
26%
44%
59%
58%

iSome of these attitudes vary by region- North American executives are:8More likely to believe that “government regulation of business will increase over the next five years”8Less likely to believe that “innovation is more important than cost reduction for long-term success”8Less concerned with international growth and less likely to believe that other emerging markets offer
better opportunities than China and India8Less likely to pursue sustainability initiatives if they hurt profits
- European executives are:8Less concerned with meeting their growth targets in 20098More critical of many aspects of firm management as they are more likely to agree that “unclear
decision making is hurting our performance”, “insufficient consumer insight is hurting our performance” and “our decisions are driven by short-term financials, not long term strategies.8More likely to feel “international growth will be vital to our performance over the next five years”
- Asian executives are:8More focused on the need for innovation as they agree more with “innovation is more important than
cost reduction for long-term success” and “we could dramatically boost innovation by collaborating with other companies”8Less concerned with meeting growth targets in 2009, perhaps explaining why they are least likely to
have significant layoffs in 20098Most in agreement that their organization waited too long to respond to the downturn8Most in need of international markets for growth over the next five years
- Latin American executives are:8By far most concerned with meeting growth targets in 2009, but most confident that their
organizations will use the downturn to improve their competitive position8More confident about their firm management

• Culture is as important as strategy for business success 86% 86% 90% 89%
• Innovation is more important than cost reduction for long-term success 67% 75% 84% 78%
• Our company will use this recession to improve our competitive position 69% 72% 74% 80%
• Government regulation of business will increase over the next five years 77% 70% 68% 70%
• The current downturn will change consumer behaviors for at least three years 73% 66% 71% 71%
• I am very concerned about how we will meet growth targets in 2009 69% 60% 62% 81%
• International growth will be vital to our performance over the next five years 55% 75% 82% 58%
• We are planning for a downturn that will last at least until early 2010 67% 62% 63% 65%
• We could dramatically boost innovation by collaborating with other companies 57% 55% 66% 57%
• We should focus more on revenue growth and less on cost reductions 54% 50% 55% 53%
• Our entire organization is actively engaged in improving innovation 55% 52% 53% 51%
• Unclear decision making authority is hurting our performance 48% 56% 55% 46%
• Insufficient customer insight is hurting our performance 45% 54% 53% 38%
• Our decisions are driven by short-term financials, not long-term strategies 48% 50% 46% 38%
• We will pursue sustainability initiatives even if they hurt our profits 37% 44% 46% 45%
• Our executives are comfortable taking higher risks for potentially higher returns 40% 32% 36% 45%
• Other emerging markets now offer better opportunities than China and India 28% 38% 26%* 51%
• Our company will have significant layoffs in 2009 38% 36% 31% 38%
• Our company waited too long to respond to this economic downturn 27% 21% 31% 22%
• Almost all of today’s market leaders will still be leaders five years from now 24% 27% 23% 24%
Attitudes vary by region
N.Amer. Europe Asia L. Amer.
6
Significantly higher than executives not in that regionSignificantly lower than executives not in that region
*34% when exclude China and India
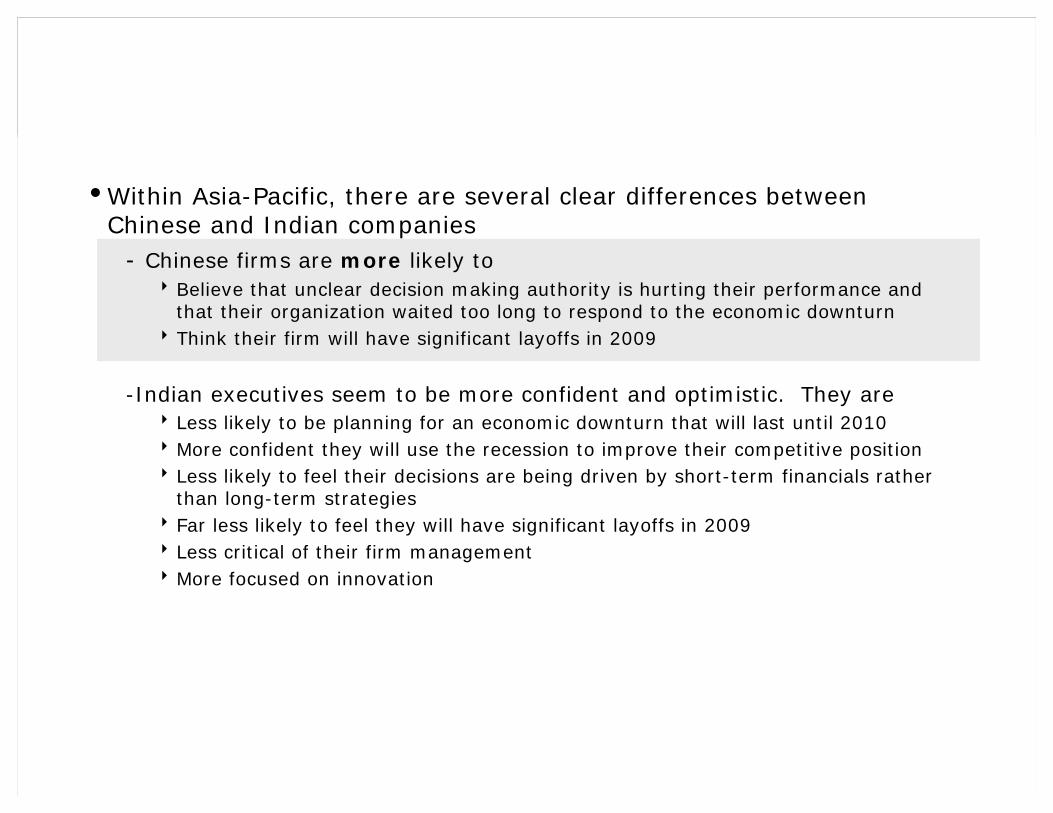
iWithin Asia-Pacific, there are several clear differences between Chinese and Indian companies
- Chinese firms are more likely to8Believe that unclear decision making authority is hurting their performance and
that their organization waited too long to respond to the economic downturn8Think their firm will have significant layoffs in 2009
-Indian executives seem to be more confident and optimistic. They are8Less likely to be planning for an economic downturn that will last until 20108More confident they will use the recession to improve their competitive position8Less likely to feel their decisions are being driven by short-term financials rather
than long-term strategies8Far less likely to feel they will have significant layoffs in 20098Less critical of their firm management8More focused on innovation

• Culture is as important as strategy for business success 86% 95% 88%
• Innovation is more important than cost reduction for long-term success 85% 89% 72%
• Our company will use this recession to improve our competitive position 70% 80% 70%
• Government regulation of business will increase over the next five years 69% 67% 67%
• The current downturn will change consumer behaviors for at least three years 72% 64% 82%
• I am very concerned about how we will meet growth targets in 2009 69% 62% 54%
• International growth will be vital to our performance over the next five years 88% 72% 93%
• We are planning for a downturn that will last at least until early 2010 70% 56% 67%
• We could dramatically boost innovation by collaborating with other companies 62% 72% 58%
• We should focus more on revenue growth and less on cost reductions 54% 53% 61%
• Our entire organization is actively engaged in improving innovation 44% 63% 45%
• Unclear decision making authority is hurting our performance 63% 49% 54%
• Insufficient customer insight is hurting our performance 61% 43% 61%
• Our decisions are driven by short-term financials, not long-term strategies 54% 38% 49%
• We will pursue sustainability initiatives even if they hurt our profits 47% 49% 40%
• Our executives are comfortable taking higher risks for potentially higher returns 34% 40% 31%
• Other emerging markets now offer better opportunities than China and India 24% 22% 34%
• Our company will have significant layoffs in 2009 40% 23% 33%
• Our company waited too long to respond to this economic downturn 40% 22% 34%
• Almost all of today’s market leaders will still be leaders five years from now 27% 23% 18%
Indian executives appear more optimistic than their Asian counterparts
China India Other A-P
7
Significantly higher than executives not in that countrySignificantly lower than executives not in that country
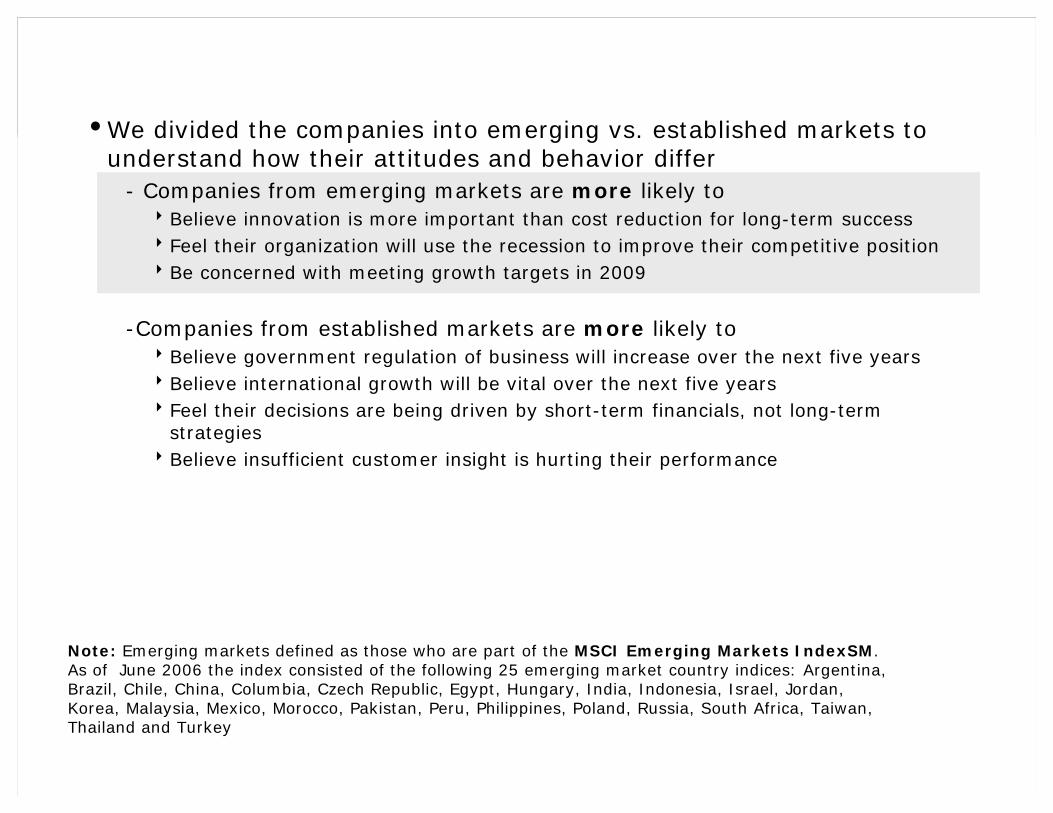
Note: Emerging markets defined as those who are part of the MSCI Emerging Markets IndexSM. As of June 2006 the index consisted of the following 25 emerging market country indices: Argentina, Brazil, Chile, China, Columbia, Czech Republic, Egypt, Hungary, India, Indonesia, Israel, Jordan, Korea, Malaysia, Mexico, Morocco, Pakistan, Peru, Philippines, Poland, Russia, South Africa, Taiwan, Thailand and Turkey
iWe divided the companies into emerging vs. established markets to understand how their attitudes and behavior differ
- Companies from emerging markets are more likely to8Believe innovation is more important than cost reduction for long-term success8Feel their organization will use the recession to improve their competitive position8Be concerned with meeting growth targets in 2009
-Companies from established markets are more likely to8Believe government regulation of business will increase over the next five years8Believe international growth will be vital over the next five years8Feel their decisions are being driven by short-term financials, not long-term
strategies8Believe insufficient customer insight is hurting their performance

• Culture is as important as strategy for business success 87% 89%
• Innovation is more important than cost reduction for long-term success 70% 81%
• Our company will use this recession to improve our competitive position 70% 79%
• Government regulation of business will increase over the next five years 74% 68%
• The current downturn will change consumer behaviors for at least three years 71% 71%
• I am very concerned about how we will meet growth targets in 2009 63% 76%
• International growth will be vital to our performance over the next five years 69% 64%
• We are planning for a downturn that will last at least until early 2010 65% 64%
• We could dramatically boost innovation by collaborating with other companies 57% 59%
• We should focus more on revenue growth and less on cost reductions 53% 53%
• Our entire organization is actively engaged in improving innovation 53% 52%
• Unclear decision making authority is hurting our performance 52% 49%
• Insufficient customer insight is hurting our performance 50% 43%
• Our decisions are being driven by short-term financials, not long-term strategies 49% 40%
• We will pursue sustainability initiatives even if they hour our profits 41% 46%
• Our top executives are comfortable taking higher risks for potentially higher returns 36% 42%
• Other emerging markets now offer better opportunities than China and India 33% 43%
• Our company will have significant layoffs in 2009 36% 36%
• Our company waited too long to respond to this economic downturn 25% 24%
• Almost all of today’s market leaders will still be leaders five years from now 24% 25%
Agreement level varies by market type
8Significantly higher than companies not in that market type
Established Emerging

• Attitudes also vary by company size. Executives at large companies ($2B+ revenue) are more likely to feel
- Government regulation of business will increase over the next five years- The current downturn will change consumer behaviors for at least 3 years- International growth will be vital to their performance over the next 5 years- The downturn will last until at least 2010- Their company will have significant layoffs in 2009
• Large company executives are less likely to feel- Innovation is more important than cost reduction for long-term success- They should focus more on revenue growth and less on cost reduction- Their top executives are comfortable taking higher risks for potentially
higher returns
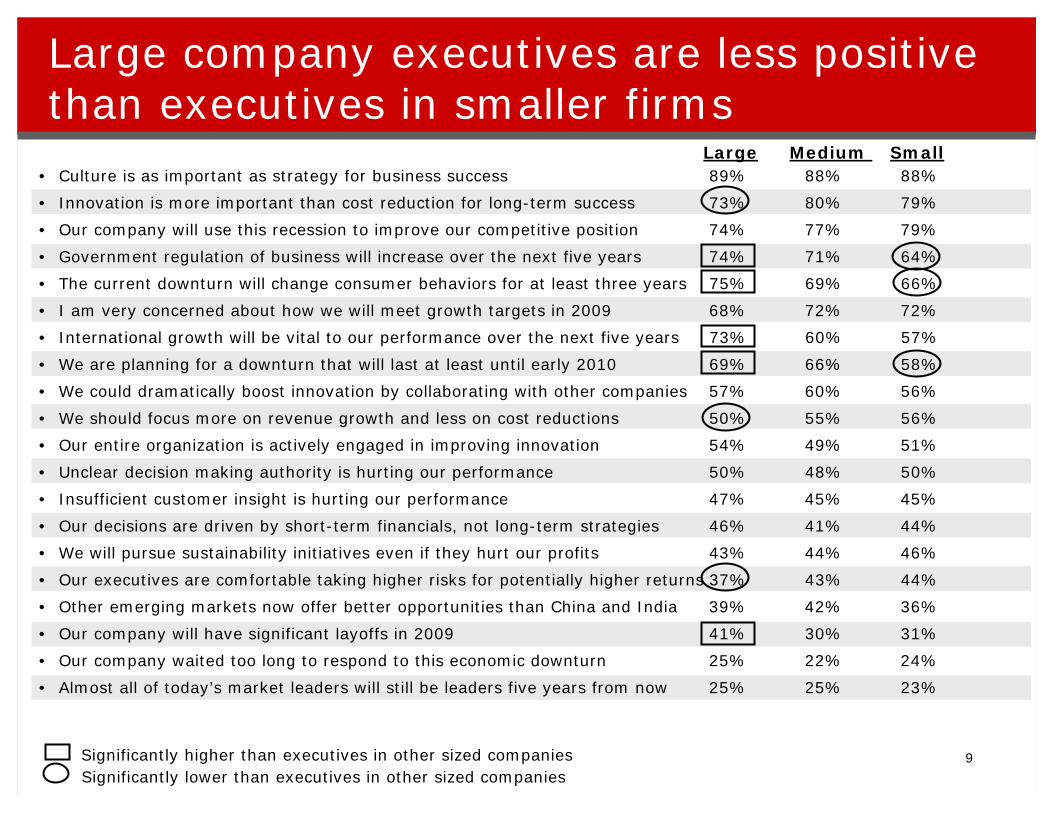
• Culture is as important as strategy for business success 89% 88% 88%
• Innovation is more important than cost reduction for long-term success 73% 80% 79%
• Our company will use this recession to improve our competitive position 74% 77% 79%
• Government regulation of business will increase over the next five years 74% 71% 64%
• The current downturn will change consumer behaviors for at least three years 75% 69% 66%
• I am very concerned about how we will meet growth targets in 2009 68% 72% 72%
• International growth will be vital to our performance over the next five years 73% 60% 57%
• We are planning for a downturn that will last at least until early 2010 69% 66% 58%
• We could dramatically boost innovation by collaborating with other companies 57% 60% 56%
• We should focus more on revenue growth and less on cost reductions 50% 55% 56%
• Our entire organization is actively engaged in improving innovation 54% 49% 51%
• Unclear decision making authority is hurting our performance 50% 48% 50%
• Insufficient customer insight is hurting our performance 47% 45% 45%
• Our decisions are driven by short-term financials, not long-term strategies 46% 41% 44%
• We will pursue sustainability initiatives even if they hurt our profits 43% 44% 46%
• Our executives are comfortable taking higher risks for potentially higher returns 37% 43% 44%
• Other emerging markets now offer better opportunities than China and India 39% 42% 36%
• Our company will have significant layoffs in 2009 41% 30% 31%
• Our company waited too long to respond to this economic downturn 25% 22% 24%
• Almost all of today’s market leaders will still be leaders five years from now 25% 25% 23%
Large company executives are less positive than executives in smaller firms
Large Medium Small
9Significantly higher than executives in other sized companiesSignificantly lower than executives in other sized companies

i We asked executives how satisfied they were with their organization’s financial results. Executives that were not satisfied with their financial resultsdemonstrated differences in three key areas
- They are more concerned with how their organization is currently being operated, as more of their executives believe8 Unclear decision making authority is hurting our performance8 Insufficient customer insight is hurting our performance8 Our decisions are being driven by short-term financials, not long-term strategies8 Our company waited too long to respond to the economic downturn
- They are less focused on innovation and taking risks. Significantly fewer of them agree with:8 Innovation is more important than cost reduction for long-term success8 Our entire organization is engaged in improving innovation8 Our top executives are comfortable taking higher risks for potentially higher
returns
- They are also less likely to feel confident that the situation is going to improve for their firm. Significantly more of them agree with:8 I am very concerned about how we will meet our growth targets in 20098 We are planning for a downturn that will last at least until early 20108 Our company will have significant layoffs in 2009

• Culture is as important as strategy for business success 85% 89%
• Innovation is more important than cost reduction for long-term success 71% 79%
• Our company will use this recession to improve our competitive position 68% 79%
• Government regulation of business will increase over the next five years 69% 72%
• The current downturn will change consumer behaviors for at least three years 72% 70%
• I am very concerned about how we will meet growth targets in 2009 81% 65%
• International growth will be vital to our performance over the next five years 63% 68%
• We are planning for a downturn that will last at least until early 2010 68% 63%
• We could dramatically boost innovation by collaborating with other companies 58% 58%
• We should focus more on revenue growth and less on cost reductions 52% 54%
• Our entire organization is actively engaged in improving innovation 43% 57%
• Unclear decision making authority is hurting our performance 59% 45%
• Insufficient customer insight is hurting our performance 53% 42%
• Our decisions are being driven by short-term financials, not long-term strategies 56% 37%
• We will pursue sustainability initiatives even if they hour our profits 37% 48%
• Our top executives are comfortable taking higher risks for potentially higher returns 33% 43%
• Other emerging markets now offer better opportunities than China and India 35% 40%
• Our company will have significant layoffs in 2009 50% 28%
• Our company waited too long to respond to this economic downturn 36% 18%
• Almost all of today’s market leaders will still be leaders five years from now 20% 27%
Agreement level varies by satisfaction with Financial Results
10
Significantly higher than companies not in that group
Not satisfied Satisfied
“Not Satisfied” – indicated they were “Extremely Dissatisfied”, “Somewhat Dissatisfied” or“Neither” with their firm’s financial results; “Satisfied” – Executives who are “Extremely Satisfied” or “Somewhat Satisfied”

• Tool usage declined worldwide
-An average of 11 tools were used in 2008, down from 15 in 2006
-This number is much closer to what we saw in the pre-crash years of 1999 and 2000

0
5
10
15
20
0
5
10
15
20
Average number of tools used
1993
11.8
1994
12.6
1995
13.2
1996
12.1
1997
11.9
1998
13.3
1999
10.7
2000
10.4
2002
16.1
2004
13.4
2006
15.3
2008
10.6Mean = 12.6
Tool usage declined in 2008
11

iAs we have found every year, larger companies use more tools
iThis year we found that both medium and small companies usage rates went back to their 2000 levels, while large companies decreased usage greatly from past years

Larger firms use more management tools
0
5
10
15
20
2000
14.2
2002
17.4
2004
16.2
2006
16.8
2008
11.6
0
5
10
15
20
2000
11.3
2002
16.1
2004
13.1
2006
15.9
2008
10.6
0
5
10
15
20
2000
9.2
2002
15.2
2004
11.7
2006
14.3
2008
9.2
Large companies ($2b+)*
Medium companies ($600M - <$2B)*
Small companies (<$600M)*
12*Based on annual revenues

iNumber of tools used were similar across regions, with slightly higher usage in North America
iUsage in all regions declined from 2006
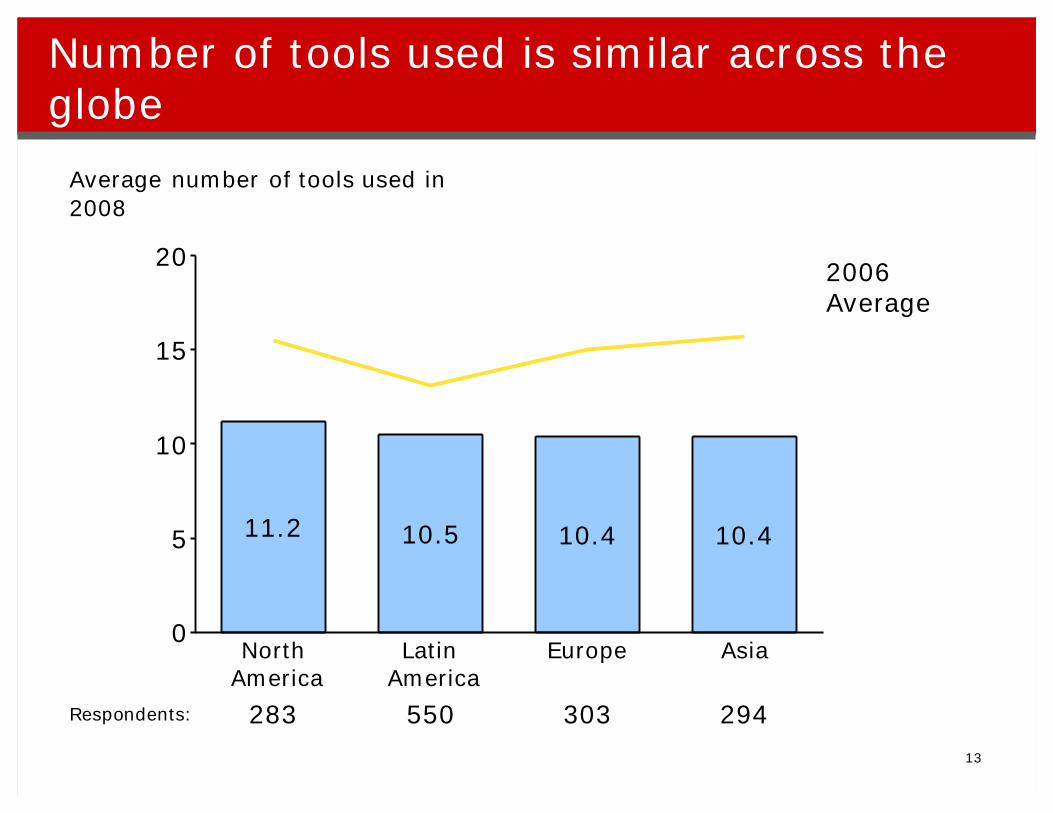
Number of tools used is similar across the globe
0
5
10
15
20
Average number of tools used in2008
NorthAmerica
11.2
LatinAmerica
10.5
Europe
10.4
Asia
10.4
283 303 294550Respondents:
2006Average
13

•The number of tools used varies by industry
-Heaviest users are:- Consumer Products - Pharma and Biotech - Food and Beverage- Chemicals and Metals
- Lightest users are:- Utilities and Energy- Construction and Real Estate- Retail- Financial Services

Tool usage varies by industry
0
5
10
15
Average number of tools used in 2008
Cons
umer
Prod
ucts
12.5
Phar
ma
&Bi
otec
h
12.3
Food
&Be
vera
ge
11.6
Chem
icals
&Met
als
11.6
Tran
spor
t &To
urism
11.3
Tech
&Te
lecom
m
11.2
Manuf
actu
ring
10.8
Healt
hcar
e
10.7
Who
lesa
le, Dist
ribut
ion
&Lo
gist
ics10.7
Serv
ices
9.9Med
ia&
Ente
rtain
men
t
9.9
Finan
cial S
ervi
cces
9.7
Reta
il
9.7
Cons
truct
ion&
Real
Esta
te
9.6
Utilit
ies &
Ener
gy
9.4
23652 43 5739 7045 247 41191 116 4550 6750Respondents
14

• Benchmarking passed Strategic Planning as the most used tool -Strategic Planning had been the most used tool every year since 1997
• Some tools stand out as winners and losers-While no tool is right for everyone, Strategic Planning, Customer Segmentation and Mission and Vision Statements are all above average in both usage and satisfaction
-On the flip side, Online Communities, Downsizing, and Collaborative Innovation are all below average on both usage and satisfaction

Usage and satisfaction rates in 2008
BenchmarkingStrategic PlanningMission and Vision StatementsCustomer Relationship ManagementOutsourcingBalanced ScorecardCustomer SegmentationBusiness Process ReengineeringCore CompetenciesMergers and AcquisitionsStrategic AlliancesSupply Chain ManagementScenario and Contingency PlanningKnowledge ManagementShared Service CentersGrowth Strategy ToolsTotal Quality ManagementDownsizingLean Six SigmaVoice of the Customer InnovationOnline CommunitiesCollaborative InnovationPrice Optimization ModelsLoyalty Management ToolsDecision Rights Tools
76%* 3.8267%* 4.01*65%* 3.91*63%* 3.8363%* 3.7953%* 3.8353%* 3.95*50%* 3.8548%* 3.8246%* 3.8344% 3.8243% 3.8142% 3.8341% 3.66**41% 3.68**38%** 3.8734%** 3.8034%** 3.59**31%** 3.8727%** 3.8826%** 3.69**24%** 3.71**24%** 3.7517%** 3.7910%** 3.68
15*Significantly above the overall mean **Significantly below the overall mean (usage = 42%, satisfaction = 3.82)
Usage Satisfaction

• We identified the top 10 tools globally and by region- The top 10 tools were similar across the regions- Benchmarking is the most used tool in three regions, second most
used in Asia-Pacific- Downsizing and Strategic Alliances are more widely used in North
America- Scenario and Contingency Planning and Growth Strategy Tools are
used more heavily in Latin America
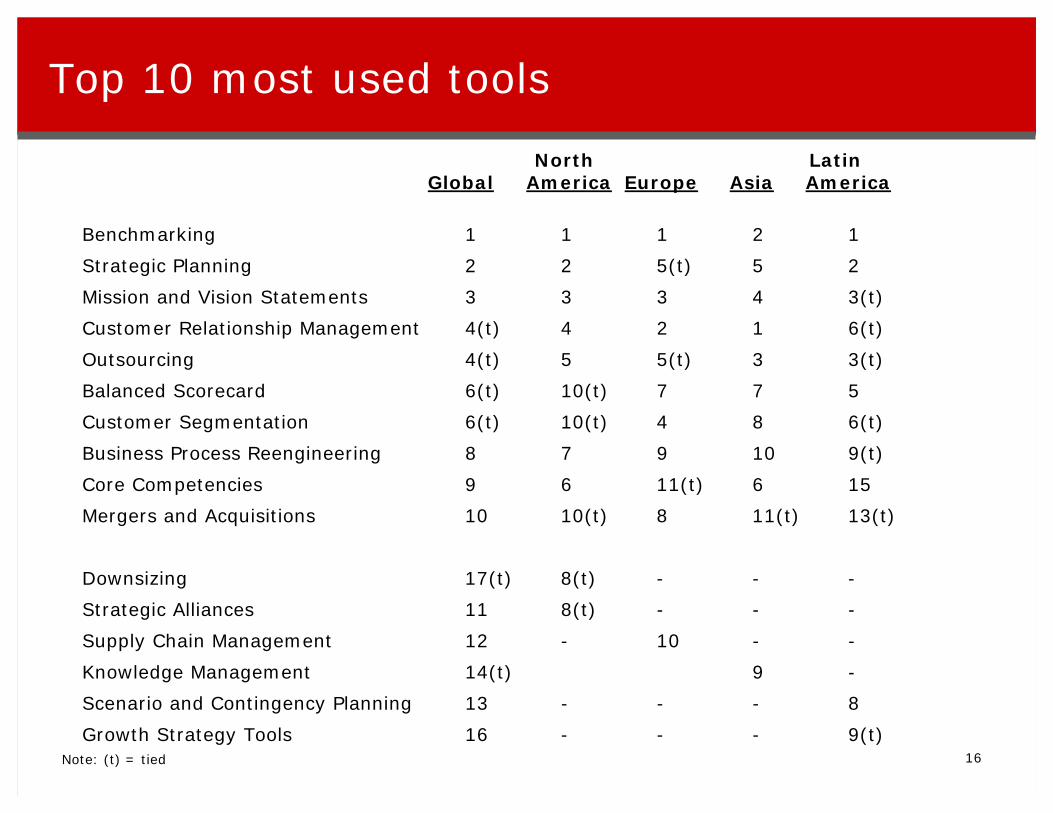
Top 10 most used tools
North LatinGlobal America Europe Asia America
Benchmarking 1 1 1 2 1
Strategic Planning 2 2 5(t) 5 2
Mission and Vision Statements 3 3 3 4 3(t)
Customer Relationship Management 4(t) 4 2 1 6(t)
Outsourcing 4(t) 5 5(t) 3 3(t)
Balanced Scorecard 6(t) 10(t) 7 7 5
Customer Segmentation 6(t) 10(t) 4 8 6(t)
Business Process Reengineering 8 7 9 10 9(t)
Core Competencies 9 6 11(t) 6 15
Mergers and Acquisitions 10 10(t) 8 11(t) 13(t)
Downsizing 17(t) 8(t) - - -
Strategic Alliances 11 8(t) - - -
Supply Chain Management 12 - 10 - -
Knowledge Management 14(t) 9 -
Scenario and Contingency Planning 13 - - - 8
Growth Strategy Tools 16 - - - 9(t)16Note: (t) = tied

iComparing the top 10 tools over time shows several key points about tool usage
-Certain tools such as Outsourcing are used more heavily in tough economic times
-Others such as Benchmarking, Strategic Planning and Mission and Vision Statements are heavily used regardless of the economic cycle
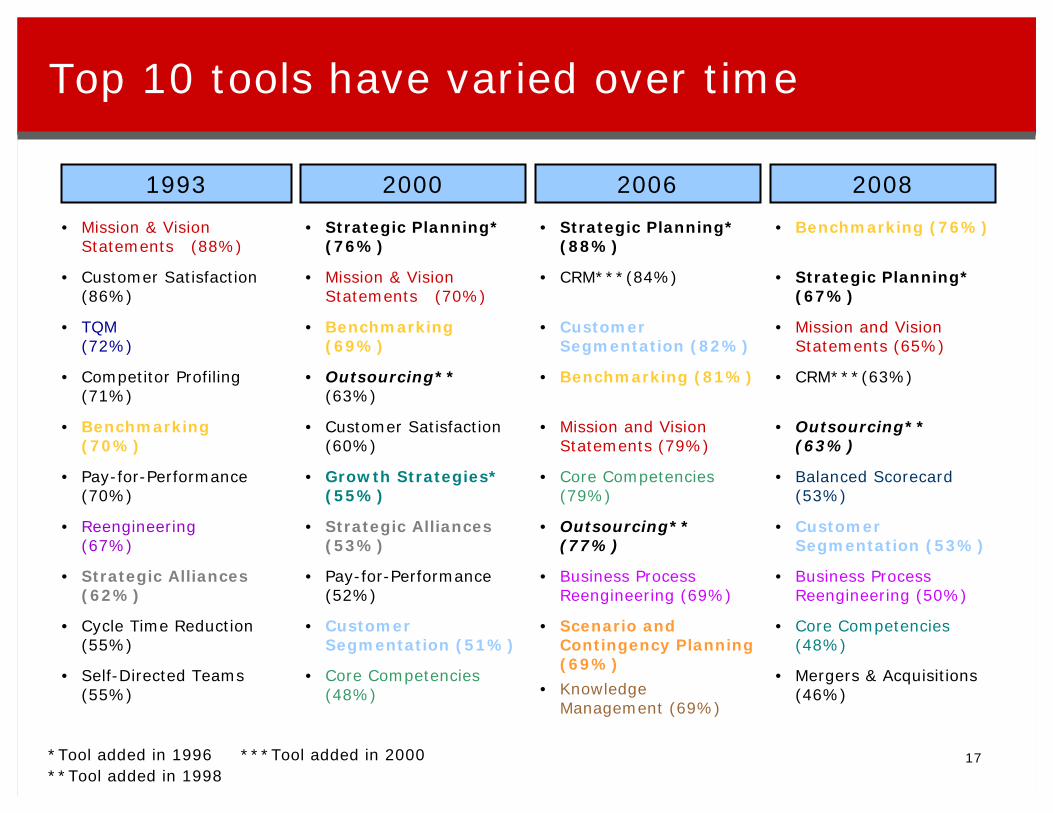
Top 10 tools have varied over time
1993
• Mission & Vision Statements (88%)
• Customer Satisfaction (86%)
• TQM (72%)
• Competitor Profiling (71%)
• Benchmarking (70%)
• Pay-for-Performance (70%)
• Reengineering (67%)
• Strategic Alliances (62%)
• Cycle Time Reduction (55%)
• Self-Directed Teams (55%)
2000
• Strategic Planning* (76%)
• Mission & Vision Statements (70%)
• Benchmarking (69%)
• Outsourcing**(63%)
• Customer Satisfaction (60%)
• Growth Strategies* (55%)
• Strategic Alliances (53%)
• Pay-for-Performance (52%)
• Customer Segmentation (51%)
• Core Competencies (48%)
2006
• Strategic Planning* (88%)
• CRM***(84%)
• Customer Segmentation (82%)
• Benchmarking (81%)
• Mission and Vision Statements (79%)
• Core Competencies (79%)
• Outsourcing** (77%)
• Business Process Reengineering (69%)
• Scenario and Contingency Planning (69%)
• Knowledge Management (69%)
2008
• Benchmarking (76%)
• Strategic Planning* (67%)
• Mission and Vision Statements (65%)
• CRM***(63%)
• Outsourcing** (63%)
• Balanced Scorecard (53%)
• Customer Segmentation (53%)
• Business Process Reengineering (50%)
• Core Competencies (48%)
• Mergers & Acquisitions (46%)
*Tool added in 1996 ***Tool added in 2000**Tool added in 1998
17

• Usage of Strategic Planning is much lower in Europe and Asia-Pacific than in North and Latin America
• North American firms are heavier users of many tools across the spectrum
- Above average usage of long-time tools such as Strategic Planning, Business Process Reengineering, Strategic Alliances
- Also above average usage of newer tools such as Online Communities and Collaborative Innovation
- North American firms are also the heaviest Downsizers
• Other interesting differences- Latin American and European firms are less likely to use
Core Competencies- European firms are least likely to use Strategic Alliances- Latin American firms are most likely to use Scenario and
Contingency Planning and Growth Strategy Tools

Usage rates vary by region
N. America Europe Asia L. America
• Benchmarking 75% 79% 67% 79%• Strategic Planning 73% 56% 58% 74%• Mission and Vision Statements 70% 63% 61% 67%• Customer Relationship Management 69% 68% 70% 53%• Outsourcing 61% 56% 62% 67%• Balanced Scorecard 49% 54% 52% 56%• Customer Segmentation 49% 57% 51% 53%• Business Process Reengineering 58% 49% 46% 50%• Core Competencies 60% 44% 56% 39%• Mergers and Acquisitions 49% 53% 45% 41%• Strategic Alliances 51% 38% 45% 43%• Supply Chain Management 38% 47% 45% 43%• Scenario and Contingency Planning 37% 38% 33% 51%• Knowledge Management 45% 43% 50% 34%• Shared Service Centers 38% 44% 39% 41%• Growth Strategy Tools 31% 26% 33% 50%• Downsizing 51% 34% 35% 25%• Total Quality Management 30% 33% 37% 36%• Lean Six Sigma 33% 34% 31% 28%• Voice of the Customer Innovation 28% 24% 32% 26%• Online Communities 35% 25% 26% 21%• Collaborative Innovation 34% 24% 22% 21%• Price Optimization Models 25% 25% 22% 23%• Loyalty Management Tools 17% 16% 18% 17%• Decision Rights Tools 11% 11% 9% 9%
18Use tool significantly more than those not in regionUse tool significantly less than those not in region

iTool usage is similar across Asia-Pacific, with some key differences
- Chinese firms use Benchmarking, Strategic Planning, Supply ChainManagement and Total Quality Management more than their counterparts elsewhere in Asia
- Fewer Indian firms use Customer Segmentation
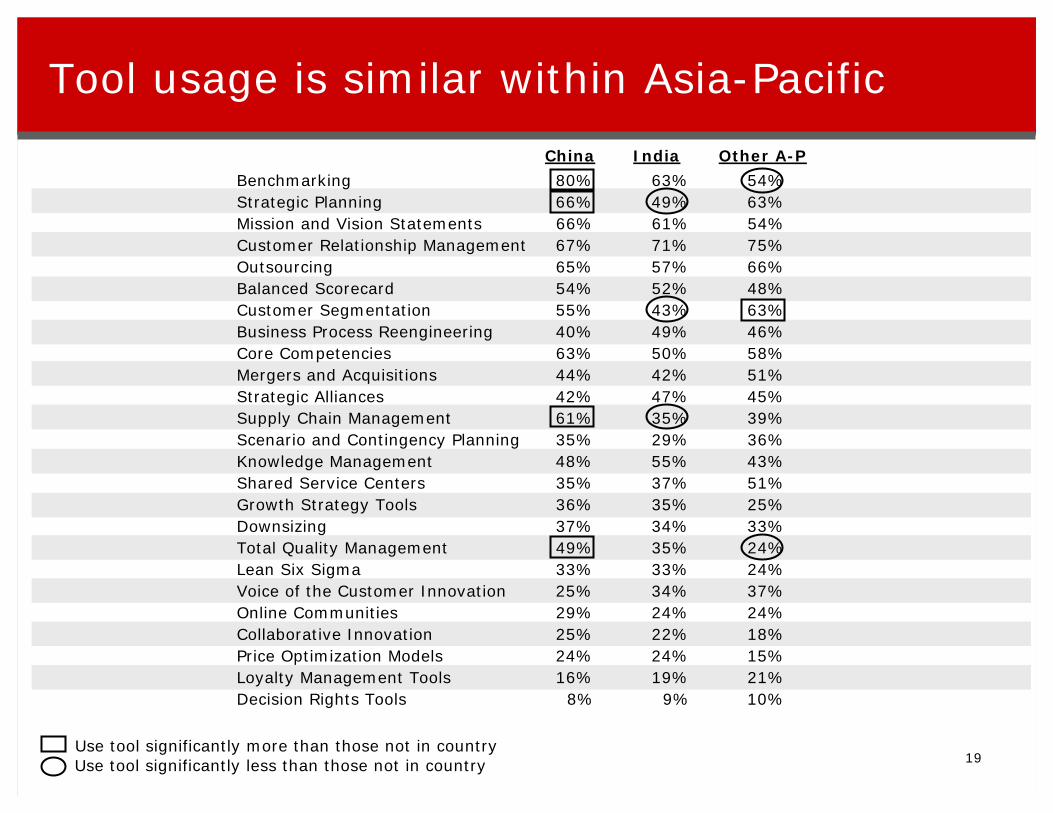
Tool usage is similar within Asia-Pacific
China India Other A-P
Benchmarking 80% 63% 54%Strategic Planning 66% 49% 63%Mission and Vision Statements 66% 61% 54%Customer Relationship Management 67% 71% 75%Outsourcing 65% 57% 66%Balanced Scorecard 54% 52% 48%Customer Segmentation 55% 43% 63%Business Process Reengineering 40% 49% 46%Core Competencies 63% 50% 58%Mergers and Acquisitions 44% 42% 51%Strategic Alliances 42% 47% 45%Supply Chain Management 61% 35% 39%Scenario and Contingency Planning 35% 29% 36%Knowledge Management 48% 55% 43%Shared Service Centers 35% 37% 51%Growth Strategy Tools 36% 35% 25%Downsizing 37% 34% 33%Total Quality Management 49% 35% 24%Lean Six Sigma 33% 33% 24%Voice of the Customer Innovation 25% 34% 37%Online Communities 29% 24% 24%Collaborative Innovation 25% 22% 18%Price Optimization Models 24% 24% 15%Loyalty Management Tools 16% 19% 21%Decision Rights Tools 8% 9% 10%
19Use tool significantly more than those not in countryUse tool significantly less than those not in country
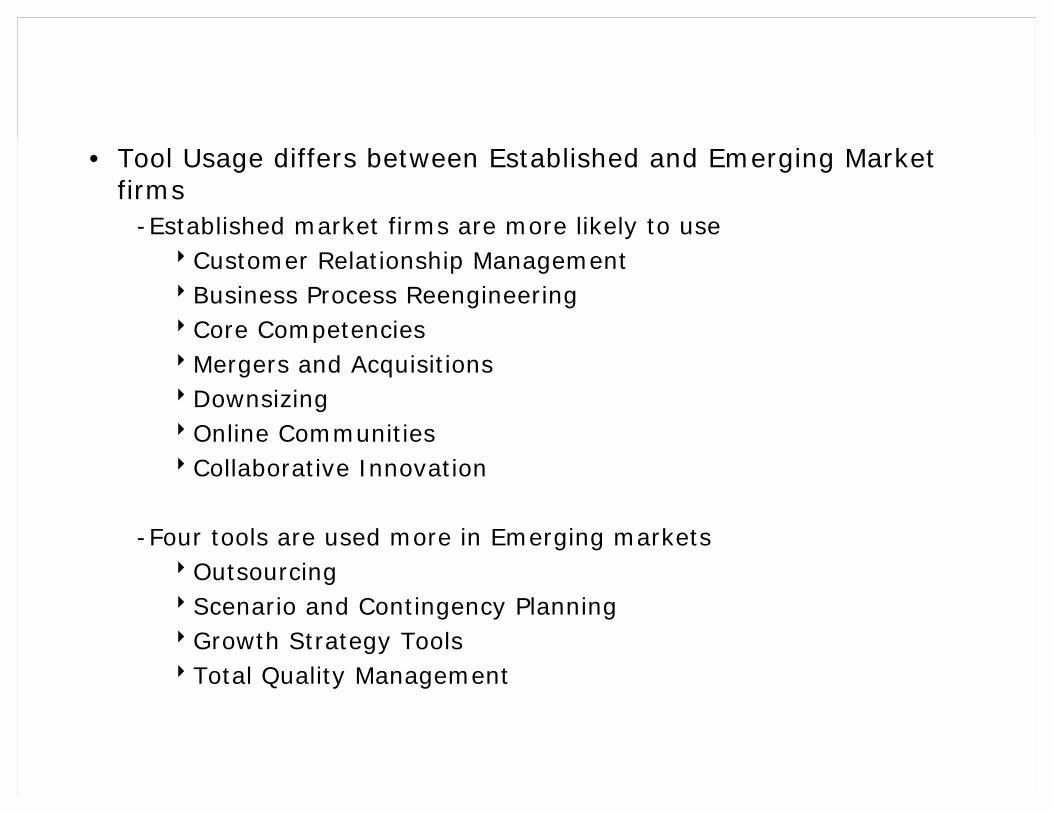
• Tool Usage differs between Established and Emerging Market firms
-Established market firms are more likely to use8Customer Relationship Management8Business Process Reengineering8Core Competencies8Mergers and Acquisitions8Downsizing8Online Communities8Collaborative Innovation
-Four tools are used more in Emerging markets8Outsourcing8Scenario and Contingency Planning8Growth Strategy Tools8Total Quality Management

Tool usage varies by market type
Established Emerging
• Benchmarking 74% 77%• Strategic Planning 65% 68%• Mission and Vision Statements 65% 66%• Customer Relationship Management 69% 58%• Outsourcing 59% 65%• Balanced Scorecard 52% 55%• Customer Segmentation 53% 53%• Business Process Reengineering 54% 48%• Core Competencies 53% 44%• Mergers and Acquisitions 52% 41%• Strategic Alliances 46% 42%• Supply Chain Management 42% 44%• Scenario and Contingency Planning 38% 44%• Knowledge Management 44% 40%• Shared Service Centers 43% 39%• Growth Strategy Tools 29% 44%• Downsizing 41% 28%• Total Quality Management 31% 37%• Lean Six Sigma 33% 29%• Voice of the Customer Innovation 28% 26%• Online Communities 30% 22%• Collaborative Innovation 29% 21%• Price Optimization Models 24% 23%• Loyalty Management Tools 17% 18%• Decision Rights Tools 11% 9%
20Use tool significantly more than those not in market type

iA greater percentage of large firms use the majority of the tools

Large firms use more management tools
BenchmarkingStrategic PlanningMission and Vision StatementsCustomer Relationship ManagementOutsourcingBalanced ScorecardCustomer SegmentationBusiness Process ReengineeringCore CompetenciesMergers and AcquisitionsStrategic AlliancesSupply Chain ManagementScenario and Contingency PlanningKnowledge ManagementShared Service CentersGrowth Strategy ToolsDownsizingTotal Quality ManagementLean Six SigmaVoice of the Customer InnovationOnline CommunitiesCollaborative InnovationPrice Optimization ModelsLoyalty Management ToolsDecision Rights Tools
67%62%59%58%58%41%45%45%40%41%47%33%37%35%29%36%31%32%19%21%24%23%16%12%
7%
77%70%66%65%63%54%50%51%52%42%47%35%44%45%37%42%28%34%30%24%20%26%24%18%10%
Large Medium
21
80%68%69%65%65%61%58%55%52%54%44%52%44%47%48%37%40%35%37%30%30%26%28%21%12%
Small
Significantly higher usage rate than other sized companiesSignificantly lower usage rate than other sized companies
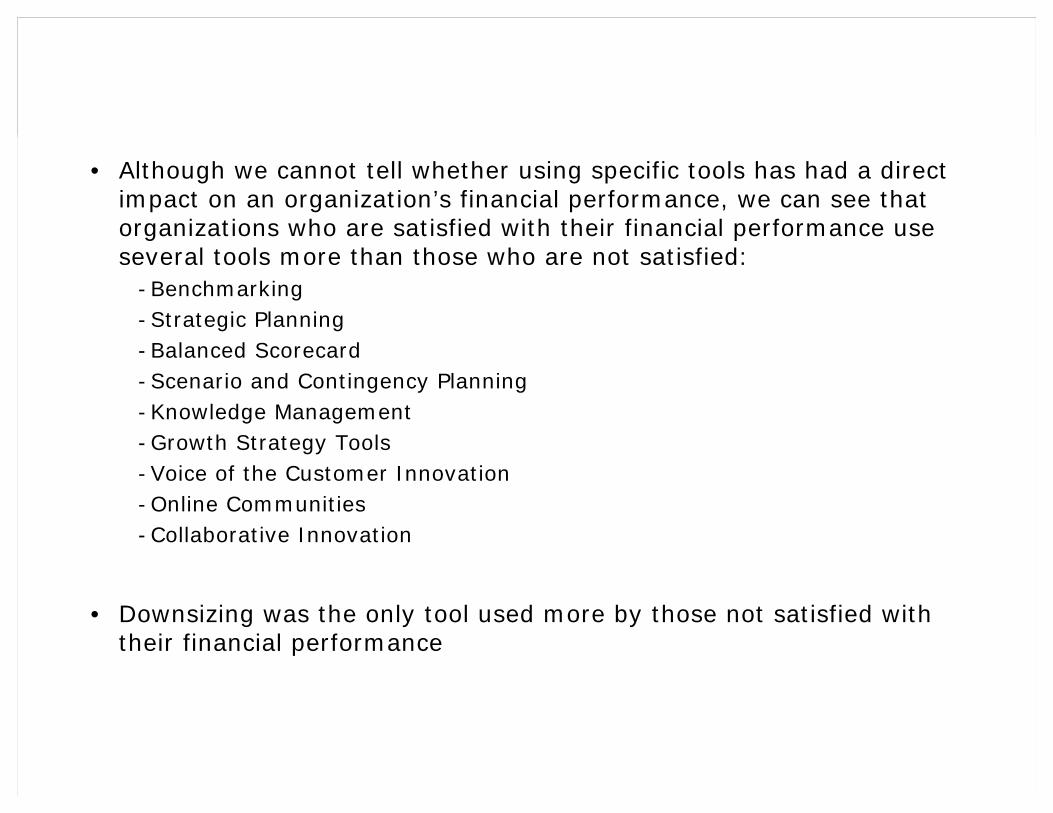
• Although we cannot tell whether using specific tools has had a direct impact on an organization’s financial performance, we can see that organizations who are satisfied with their financial performance use several tools more than those who are not satisfied:
-Benchmarking-Strategic Planning-Balanced Scorecard-Scenario and Contingency Planning-Knowledge Management-Growth Strategy Tools-Voice of the Customer Innovation-Online Communities-Collaborative Innovation
• Downsizing was the only tool used more by those not satisfied with their financial performance

Firms satisfied with Financial Results use several tools more
Not Satisfied Satisfied
• Benchmarking 71% 78%• Strategic Planning 63% 69%• Mission and Vision Statements 61% 68%• Customer Relationship Management 62% 63%• Outsourcing 63% 62%• Balanced Scorecard 51% 55%• Customer Segmentation 48% 55%• Business Process Reengineering 48% 52%• Core Competencies 47% 48%• Mergers and Acquisitions 46% 46%• Strategic Alliances 42% 45%• Supply Chain Management 44% 43%• Scenario and Contingency Planning 37% 44%• Knowledge Management 37% 44%• Shared Service Centers 39% 41%• Growth Strategy Tools 32% 41%• Downsizing 42% 29%• Total Quality Management 32% 36%• Lean Six Sigma 30% 32%• Voice of the Customer Innovation 22% 30%• Online Communities 22% 27%• Collaborative Innovation 21% 26%• Price Optimization Models 22% 24%• Loyalty Management Tools 15% 19%• Decision Rights Tools 8% 11%
22
Use tool significantly more than those not in group
“Not Satisfied” – indicated they were “Extremely Dissatisfied”, “Somewhat Dissatisfied”, or “Neither” with their firm’s financial results; “Satisfied” – Executives who are “Extremely Satisfied” or “Somewhat Satisfied”

• Six of ten firms either downsized in 2008 and/or will downsize in 2009
• Most firms that downsized in 2008 plan to do further downsizing in 2009

Six of ten firms downsized in 2008 and/or expect to in 2009
0
20
40
60
80
100%
Not used at all
Will use on major basis
Will use on limited basis
Will not use
947
LimitedBasis
245
MajorEffort
238
2008 Downsizing Usage
Likely 2009 usage of Downsizing
Total = 1,430
23

• The average overall satisfaction rating is 3.82, slightly higher than the average of 3.75 in 2006
• Satisfaction leaders are-Strategic Planning-Customer Segmentation-Mission and Vision Statements
• Tools with below average satisfaction ratings are-Downsizing-Knowledge Management-Shared Service Centers-Decision Rights Tools-Online Communities-Collaborative Innovation
• There were few differences in satisfaction across regions

Overall satisfaction scores are similar across regions
Strategic PlanningCustomer SegmentationMission and Vision StatementsVoice of the Customer InnovationGrowth Strategy ToolsLean Six SigmaBusiness Process ReengineeringBalanced ScorecardCustomer Relationship ManagementMergers and AcquisitionsScenario and Contingency PlanningBenchmarkingCore CompetenciesStrategic AlliancesSupply Chain ManagementTotal Quality ManagementLoyalty Management ToolsOutsourcingPrice Optimization ModelsCollaborative InnovationOnline CommunitiesDecision Rights ToolsShared Service CentersKnowledge ManagementDownsizing
4.01* 3.91 3.89 3.90 4.173.95* 3.87 3.83 3.92 4.083.91* 3.93 3.72 3.88 4.023.88 3.88 3.89 3.97 3.813.87 3.77 3.75 3.66 4.013.87 3.91 3.68 3.90 3.963.85 3.80 3.76 3.93 3.903.83 3.82 3.74 3.74 3.933.83 3.79 3.77 3.82 3.923.83 3.91 3.77 3.72 3.903.83 3.81 3.69 3.78 3.903.82 3.78 3.85 3.83 3.833.82 3.90 3.71 3.83 3.823.82 3.71 3.77 3.73 3.973.81 3.75 3.77 3.81 3.873.80 3.64 3.71 3.88 3.873.79 3.90 3.56 3.78 3.843.79 3.70 3.71 3.88 3.813.75 3.61 3.62 3.94 3.823.71** 3.90 3.72 3.60 3.603.69** 3.80 3.49 3.64 3.763.68** 3.80 3.76 3.33 3.753.68** 3.64 3.56 3.84 3.693.66** 3.64 3.64 3.65 3.703.59** 3.60 3.53 3.55 3.66
Global Avg= 3.82
24*Significantly above/**below the global mean
Global N. Amer. Europe Asia L. Amer.
Significantly higher than other regions Significantly lower

• Indian firms are more satisfied with four tools than other firms throughout Asia-Pacific
-Core Competences-Benchmarking-Strategic Alliances-Collaborative Innovation

Satisfaction is similar within Asia-Pacific
Strategic PlanningCustomer SegmentationMission and Vision StatementsVoice of the Customer InnovationGrowth Strategy ToolsLean Six SigmaBusiness Process ReengineeringBalanced ScorecardCustomer Relationship ManagementMergers and AcquisitionsScenario and Contingency PlanningBenchmarkingCore CompetenciesStrategic AlliancesSupply Chain ManagementTotal Quality ManagementLoyalty Management ToolsOutsourcingPrice Optimization ModelsCollaborative InnovationOnline CommunitiesDecision Rights ToolsShared Service CentersKnowledge ManagementDownsizing
4.053.913.924.163.784.003.903.783.913.783.954.004.053.924.004.073.834.033.713.973.583.253.873.613.61
China India
25
3.753.833.813.713.543.694.003.753.803.673.653.713.773.443.683.773.693.814.133.173.713.253.593.623.61
Other A-P
3.904.053.893.883.594.063.843.633.663.713.713.723.563.773.773.693.793.734.203.583.633.574.033.833.32
Significantly higher than those not in country Significantly lower than those not in country
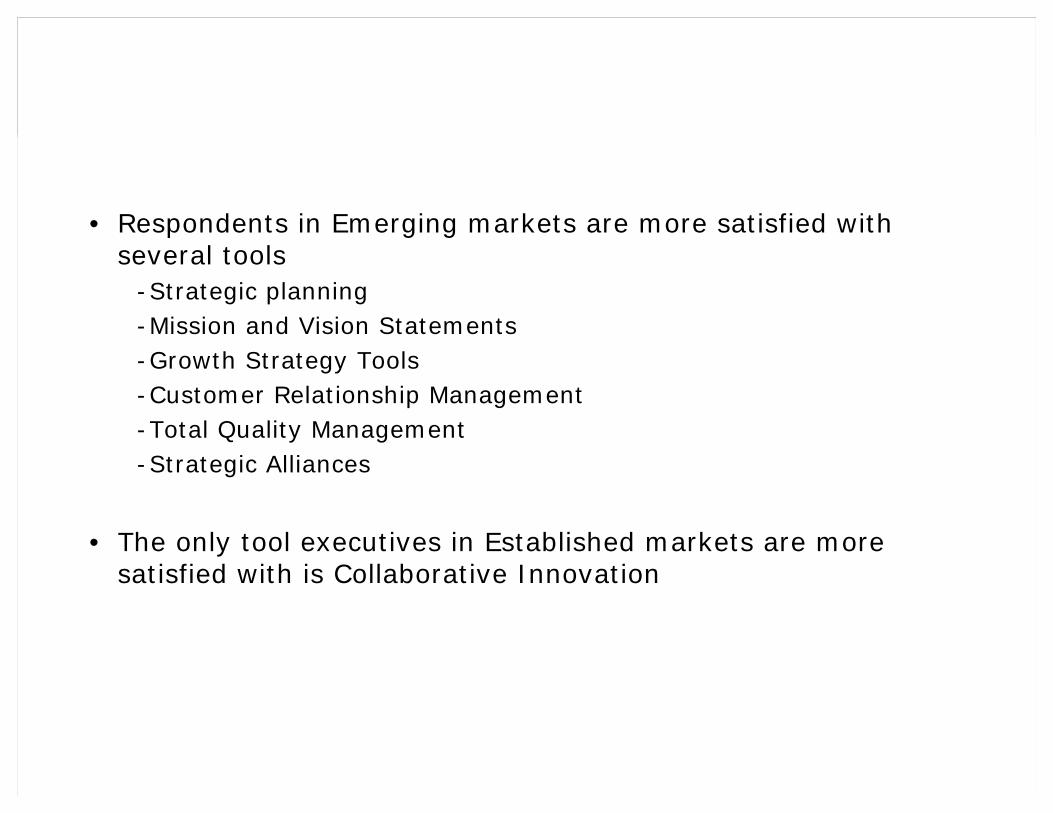
• Respondents in Emerging markets are more satisfied with several tools
-Strategic planning-Mission and Vision Statements-Growth Strategy Tools-Customer Relationship Management-Total Quality Management-Strategic Alliances
• The only tool executives in Established markets are more satisfied with is Collaborative Innovation

Emerging versus Established market satisfaction
Strategic PlanningCustomer SegmentationMission and Vision StatementsVoice of the Customer InnovationGrowth Strategy ToolsLean Six SigmaBusiness Process ReengineeringBalanced ScorecardCustomer Relationship ManagementMergers and AcquisitionsScenario and Contingency PlanningBenchmarkingCore CompetenciesStrategic AlliancesSupply Chain ManagementTotal Quality ManagementLoyalty Management ToolsOutsourcingPrice Optimization ModelsCollaborative InnovationOnline CommunitiesDecision Rights ToolsShared Service CentersKnowledge ManagementDownsizing
4.104.013.973.873.953.923.903.873.903.843.883.833.833.903.843.883.823.833.833.613.663.653.703.653.61
Established Emerging
26
3.903.883.843.893.723.813.803.773.763.823.753.813.813.733.783.683.743.723.663.813.723.723.653.683.58
Significantly higher than those not in market type

iSatisfaction does not significantly differ by company size

Satisfaction rates are similar regardless of company size
Strategic PlanningCustomer SegmentationMission and Vision StatementsVoice of the Customer InnovationGrowth Strategy ToolsLean Six SigmaBusiness Process ReengineeringBalanced ScorecardCustomer Relationship ManagementMergers and AcquisitionsScenario and Contingency PlanningBenchmarkingCore CompetenciesStrategic AlliancesSupply Chain ManagementTotal Quality ManagementLoyalty Management ToolsOutsourcingPrice Optimization ModelsCollaborative InnovationOnline CommunitiesDecision Rights ToolsShared Service CentersKnowledge ManagementDownsizing
4.053.843.883.933.873.703.913.843.863.763.733.803.833.873.793.903.693.803.753.703.723.693.653.793.78
3.993.923.863.673.863.903.823.803.793.743.783.853.803.863.883.733.883.823.803.783.553.703.623.583.54
Large Medium
27
4.034.013.953.923.933.893.873.833.823.903.913.843.803.763.823.843.793.763.733.673.733.643.703.643.60
Small
Significantly higher satisfaction rate than other sized companies Significantly lower satisfaction rate

• Respondents who are satisfied with their organization’s financial performance are also more satisfied with many of the tools
“Not Satisfied” – indicated they were “Extremely Dissatisfied”, “Somewhat Dissatisfied”, or “Neither” with their firm’s financial results; “Satisfied” – Executives who are “Extremely Satisfied” or “Somewhat Satisfied”

Those satisfied with Financial Results are also more satisfied with many management tools
Strategic PlanningCustomer SegmentationMission and Vision StatementsVoice of the Customer InnovationGrowth Strategy ToolsLean Six SigmaBusiness Process ReengineeringBalanced ScorecardCustomer Relationship ManagementMergers and AcquisitionsScenario and Contingency PlanningBenchmarkingCore CompetenciesStrategic AlliancesSupply Chain ManagementTotal Quality ManagementLoyalty Management ToolsOutsourcingPrice Optimization ModelsCollaborative InnovationOnline CommunitiesDecision Rights ToolsShared Service CentersKnowledge ManagementDownsizing
4.123.993.973.953.983.973.923.893.873.923.893.883.863.933.873.873.783.813.773.763.763.653.693.703.60
NotSatisfied
Satisfied
28
3.803.883.803.703.613.693.733.703.763.663.693.713.753.613.723.663.803.753.733.603.533.763.663.583.58
Significantly higher than those not in group

iFive tools saw large increases in satisfaction from 2006
-Balanced Scorecard
-Lean Six Sigma
-Loyalty Management Tools
-Mission and Vision Statements
-Growth Strategy Tools

Largest satisfaction changes since 2006
2006 2008 2006 2008mean mean rank rank
• Balanced Scorecard 3.60 3.83 21 8(t)
• Lean Six Sigma* 3.66 3.87 18 5(t)
• Loyalty Management Tools 3.59 3.79 22(t) 17(t)
• Mission and Vision Statements 3.78 3.91 8(t) 3
• Growth Strategy Tools 3.75 3.87 13 5(t)
29
*Called Six Sigma in 2006
All differences significantly different

• The odds of success vary widely for different tools. For example, 32% of those who use Strategic Planning report that they are extremely satisfied with the tool, while only 8% say they are dissatisfied, creating a positive “satisfaction spread” of 24 points (32–8)
• At the bottom of the page are tools that dissatisfied almost as many users as they pleased

Satisfaction spreads
Strategic PlanningMission and Vision StatementsCustomer SegmentationLean Six SigmaGrowth Strategy ToolsSupply Chain ManagementVoice of the Customer InnovationTotal Quality ManagementMergers and AcquisitionsBusiness Process ReengineeringScenario and Contingency PlanningCore CompetenciesStrategic AlliancesCustomer Relationship ManagementLoyalty Management ToolsDecision Rights ToolsBalanced ScorecardPrice Optimization ModelsOutsourcingBenchmarkingCollaborative InnovationShared Service CentersOnline CommunitiesKnowledge ManagementDownsizing
24212016161414131313131212121110101010887733
Spread
32%29%28%28%24%24%24%23%25%21%19%19%22%22%22%18%20%19%21%15%17%21%17%15%15%
% Extremelysatisfied
-8%-8%-8%
-12%-8%
-10%-10%-10%-12%-8%-6%-7%
-10%-10%-11%-8%
-10%-9%
-11%-7%-9%
-14%-10%-12%-12%
% Dissatisfied
30

iMajor efforts achieve better satisfaction scores than limited efforts do for all tools. Perhaps some tools should not be used on a limited basis at all
iFor some tools, the differences are enormous. Lean Six Sigma is the highest ranked tool when used as part of a major effort, but is 24th when used as part of a limited effort
iIt is important to understand incremental benefits of pursuing amajor versus minor effort with each of these tools before deciding which tools to use and how much effort will be devoted to implementing them
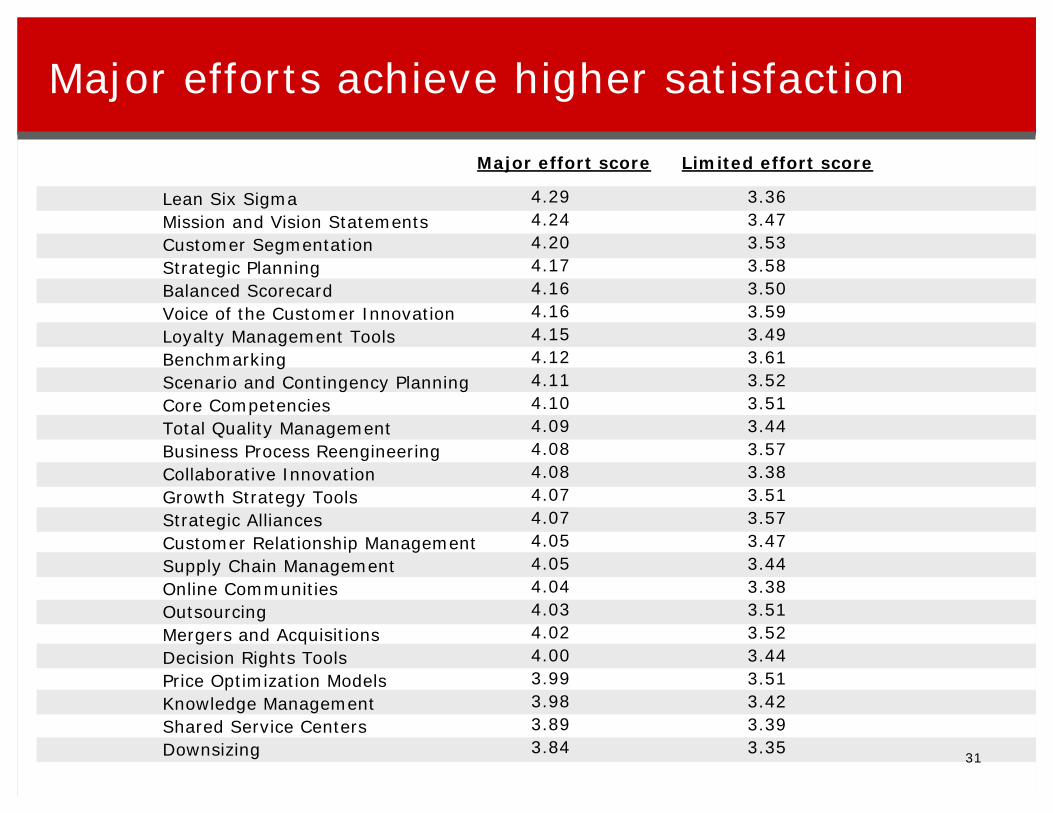
Major efforts achieve higher satisfaction
Lean Six SigmaMission and Vision StatementsCustomer SegmentationStrategic PlanningBalanced ScorecardVoice of the Customer InnovationLoyalty Management ToolsBenchmarkingScenario and Contingency PlanningCore CompetenciesTotal Quality ManagementBusiness Process ReengineeringCollaborative InnovationGrowth Strategy ToolsStrategic AlliancesCustomer Relationship ManagementSupply Chain ManagementOnline CommunitiesOutsourcingMergers and AcquisitionsDecision Rights ToolsPrice Optimization ModelsKnowledge ManagementShared Service CentersDownsizing
3.363.473.533.583.503.593.493.613.523.513.443.573.383.513.573.473.443.383.513.523.443.513.423.393.35
4.294.244.204.174.164.164.154.124.114.104.094.084.084.074.074.054.054.044.034.024.003.993.983.893.84
Limited effort scoreMajor effort score
31

• The tools in the upper right quadrant are both heavily used and have satisfaction scores above the mean
• Lean Six Sigma and Voice of the Customer Innovation are the only tools with below average usage and above average satisfaction
• The tools that performed the worst are in the bottom left quadrant. They include Downsizing, Online Communities and Decision Rights Tools

10
25
40
55
70
80%
3.50 3.60 3.70 3.80 3.90 4.00 4.10
Decision Rights Tools
Loyalty Management Tools
Price Optimization ModelsCollaborative Innovation
Online Communities Voice of the Customer Innovation
Lean Six SigmaTQMDownsizing
Growth Strategy ToolsSupply Chain Management
Mergers and Acquisitions
Customer SegmentationBalanced Scorecard
OutsourcingMission and Vision Statements
Strategic Planning
CRM
Benchmarking
Satisfaction
Usage
Scenario & Contingency Planning
Shared Service CentersKnowledge Management
Strategic Alliances
Core Competencies Business Process Reengineering
2008 Usage and Satisfaction
32

• All tools are projected to have higher usage levels in 2009. Those with the biggest projected gain are:
-Price Optimization Models
-Scenario and Contingency Planning
-Growth Strategy Tools
-Collaborative Innovation
-Voice of the Customer Innovation

Expected change in usage
Price Optimization ModelsScenario and Contingency PlanningGrowth Strategy ToolsCollaborative InnovationVoice of the Customer InnovationDecision Rights ToolsKnowledge ManagementLoyalty Management ToolsStrategic AlliancesTotal Quality ManagementCore CompetenciesBusiness Process ReengineeringDownsizingOnline CommunitiesCustomer SegmentationShared Service CentersStrategic PlanningCustomer Relationship ManagementSupply Chain ManagementBalanced ScorecardMission and Vision StatementsOutsourcingBenchmarkingMergers and AcquisitionsLean Six Sigma
35%33%33%33%31%29%29%29%28%28%27%27%25%25%24%22%22%21%20%16%13%12%11%11%11%
ProjectedIncrease
59%75%71%57%58%39%70%46%72%62%75%77%59%51%77%63%89%84%63%69%78%75%87%57%42%
Projected 2009 Usage
24%42%38%24%27%10%41%17%44%34%48%50%34%26%53%41%67%63%43%53%65%63%76%46%31%
Actual 2008Usage
33

• Few executives are extremely satisfied with their organization’s performance on any of the key metrics
Will look at correlations between this question and
usage in final version

Satisfaction with firm performance
0
20
40
60
80
Percent of respondents(n = 1430)
CompetitivePositioning
Somewhatsatisfied
Extremelysatisfied
69
FinancialResults
65
Long-TermPerformanceCapabilities
64
CustomerEquity
61
OrganizationalIntegration
54
28% 16%19%17% 26%Percent notsatisfied (1/2)
34

1. Get the facts: Every tool carries a set of strengths and weaknesses. Success requires understanding the full effects—and side effects—of each tool and then creatively combining the right ones in the right ways at the right times. Use the research. Talk to other tool users. Don’t naively accept hyperbole and simplistic solutions
2. Champion enduring strategies, not fleeting fads: Line managers and tool gurus don’t always have perfectly aligned agendas. Tool gurus may provoke stimulating discussions, but managers must manage. Managers who promote fleeting fads undermine employees’ confidence that they can create needed change; such managers’programs are greeted with increasing skepticism. Executives would be better served by championing realistic, strategic directions and regarding the specific tools for getting there as ancillary
3. Choose the best tools for the job: Managers need a rational system for selecting, implementing and integrating the tools appropriate for their companies. A management tool will improve results only to the extent that it:
a. Discovers unmet customer needs;b. Builds distinctive capabilities;c. Exploits competitor vulnerabilities;d. Develops breakthrough strategies by effectively integrating these accomplishments.
4. Adapt tools to your business system (not vice versa)
On the basis of our research to date, we offer four suggestions for the usage of tools:

Tool tips
iGet the facts
iChampion enduring strategies, not fleeting fads
iChoose the best tool for the job
iAdapt tools to your business system
35

*This page intentionally left blank

Appendix
36

*This page intentionally left blank
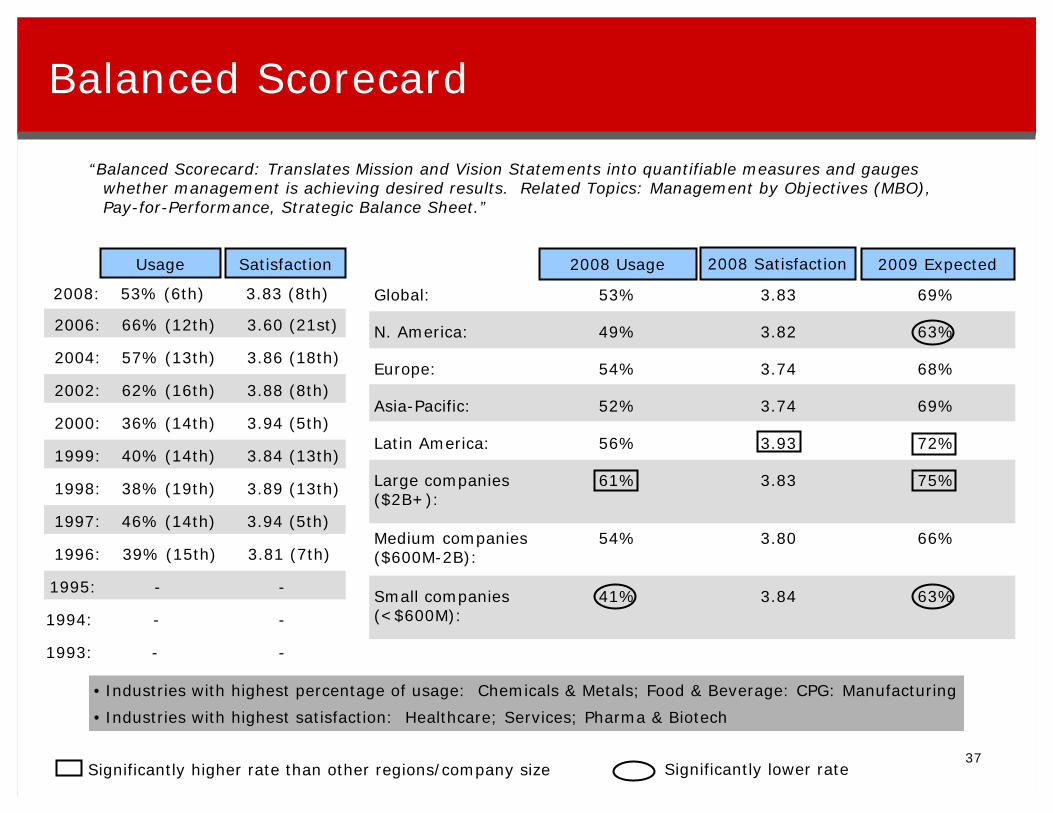
Balanced Scorecard
“Balanced Scorecard: Translates Mission and Vision Statements into quantifiable measures and gauges whether management is achieving desired results. Related Topics: Management by Objectives (MBO), Pay-for-Performance, Strategic Balance Sheet.”
--1993:
--1994:
--1995:
3.81 (7th)39% (15th)1996:
3.94 (5th)46% (14th)1997:
3.89 (13th)38% (19th)1998:
3.84 (13th)40% (14th)1999:
3.94 (5th)36% (14th)2000:
3.88 (8th)62% (16th)2002:
3.86 (18th)57% (13th)2004:
3.60 (21st)66% (12th)2006:
SatisfactionUsage 2009 Expected
63%3.8441%Small companies (<$600M):
66%3.8054%Medium companies ($600M-2B):
75%3.8361%Large companies ($2B+):
72%3.9356%Latin America:
69%3.7452%Asia-Pacific:
68%3.7454%Europe:
63%3.8249%N. America:
69%3.8353%Global:
2008 Satisfaction2008 Usage
• Industries with highest percentage of usage: Chemicals & Metals; Food & Beverage: CPG: Manufacturing
• Industries with highest satisfaction: Healthcare; Services; Pharma & Biotech
Significantly higher rate than other regions/company size Significantly lower rate37
3.83 (8th)53% (6th)2008:

*This page intentionally left blank

Benchmarking
“Benchmarking: Compares processes and performance with internal and external benchmarks. Companies incorporate identified best practices to meet improvement targets. Related topics: Best Demonstrated Practices, Competitor Profiles.”
SatisfactionUsage 2009 Expected
81%3.8067%Small companies (<$600M):
87%3.8577%Medium companies ($600M-2B):
90%3.8480%Large companies ($2B+):
90%3.8379%Latin America:
84%3.8367%Asia-Pacific:
86%3.8579%Europe:
86%3.7875%N. America:
87%3.8276%Global:
2008 Satisfaction2008 Usage
• Industries with highest percentage of usage: Chemicals & Metals; CPG; Construction & Real Estate
• Industries with highest satisfaction: Transport & Tourism; CPG; Pharma & Biotech
Significantly higher rate than other regions/company size Significantly lower rate38
3.70 (13th)70% (6th)1993:
3.76 (6th)77% (3rd)1994:
3.80 (2nd)76% (3rd)1995:
3.93 (2nd)79% (3rd)1996:
3.88 (11th)82% (1st)1997:
3.99 (4th)82% (2nd)1998:
3.89 (11th)77% (3rd)1999:
3.89 (11th)69% (3rd)2000:
3.96 (6th)84% (2nd)2002:
3.98 (3rd)73% (3rd)2004:
3.80 (6th)81% (4th)2006:
3.82 (12th)76% (1st)2008:

*This page intentionally left blank

Business Process Reengineering
“Business Process Reengineering: Radically redesigns core business processes to achieve dramatic improvements in productivity, cycle times and quality. Related Topics: Cycle Time Reduction, Horizontal Organizations, Overhead Value Analysis, Process Redesign.”
3.85 (7th)50% (8th)2008:
SatisfactionUsage 2009 Expected
72%3.9145%Small companies (<$600M):
77%3.8251%Medium companies ($600M-2B):
81%3.8755%Large companies ($2B+):
77%3.9050%Latin America:
79%3.9346%Asia-Pacific:
73%3.7649%Europe:
78%3.8058%N. America:
77%3.8550%Global:
2008 Satisfaction2008 Usage
• Industries with highest percentage of usage: Healthcare; CPG; Financial Services
• Industries with highest satisfaction: Construction; Pharma & Biotech; Financial Services
Significantly higher rate than other regions/company size Significantly lower rate39
3.81 (5th)67% (7th)1993:
3.76 (7th)68% (6th)1994:
3.61 (17th)69% (7th)1995:
3.71 (18th)65% (7th)1996:
3.72 (21st)61% (8th)1997:
3.81 (21st)58% (12th)1998:
3.75 (21st)44% (12th)1999:
3.85 (16th)38% (13th)2000:
3.75 (20th)54% (19th)2002:
3.90 (11th)61% (10th)2004:
3.77 (11th)69% (8th)2006:

*This page intentionally left blank

Collaborative Innovation
“Collaborative Innovation: Applies the principles of free trade to the marketplace for new ideas, enabling the laws of comparative advantage to drive the efficient allocation of R&D resources. Related topics: New Product Development, Open Innovation, Open-Market Innovation.”
--1998:
--1999:
--2000:
--2002:
3.70 (23rd)26% (23rd)2004*:
3.72 (15th)53% (18th)2006:
SatisfactionUsage 2009 Expected
51%3.7023%Small companies (<$600M):
59%3.7826%Medium companies ($600M-2B):
61%3.6726%Large companies ($2B+):
56%3.6021%Latin America:
62%3.6022%Asia-Pacific:
49%3.7224%Europe:
64%3.9034%N. America:
57%3.7124%Global:
2008 Satisfaction2008 Usage
• Industries with highest percentage of usage: CPG; Healthcare; Media & Entertainment; Food & Beverage
• Industries with highest satisfaction: Pharma & Biotech; Construction & Real Estate; Utilities & Energy
Significantly higher rate than other regions/company size Significantly lower rate*Called “Open-Market Innovation”
40
3.71 (20th)24% (22nd)2008:
--1993:
--1994:
--1995:
--1996:
--1997:

*This page intentionally left blank

Core Competencies
“Core Competencies: Identifies and invests in special skills or technologies that create unique customer value. Related Topics: Core Capabilities, Key Success Factors.”
3.82 (12th)48%(9th)2008:
SatisfactionUsage 2009 Expected
69%3.8340%Small companies (<$600M):
77%3.8052%Medium companies ($600M-2B):
79%3.8052%Large companies ($2B+):
70%3.8239%Latin America:
83%3.8356%Asia-Pacific:
73%3.7144%Europe:
80%3.9060%N. America:
75%3.8248%Global:
2008 Satisfaction2008 Usage
• Industries with highest percentage of usage: Pharma & Biotech; Healthcare; Food & Beverages
• Industries with highest satisfaction: Retail; Media & Entertainment: Transport & Tourism
Significantly higher rate than other regions/company size Significantly lower rate41
3.60 (20th)52% (11th)1993:
3.70 (11th)60% (9th)1994:
3.75 (6th)66% (9th)1995:
3.83 (6th)69% (5th)1996:
3.88 (12th)61% (7th)1997:
3.88 (15th)60% (11th)1998:
3.79 (17th)50% (10th)1999:
3.83 (18th)48% (10th)2000:
4.01 (3rd)75% (11th)2002:
3.97 (4th)65% (7th)2004:
3.86 (5th)79% (5th)2006:

*This page intentionally left blank

Customer Relationship Management (CRM)
“Customer Relationship Management: Collects data about customers to optimize marketing, sales and service processes to increase customer value. Related Topics: Collaborative Commerce, Customer Retention, Customer Segmentation, Customer Surveys, Loyalty Management.”
3.83 (8th)63% (4th)2008:
SatisfactionUsage 2009 Expected
81%3.8658%Small companies (<$600M):
83%3.7965%Medium companies ($600M-2B):
86%3.8265%Large companies ($2B+):
79%3.9253%Latin America:
88%3.8270%Asia-Pacific:
85%3.7768%Europe:
84%3.7969%N. America:
84%3.8363%Global:
2006 Satisfaction2008 Usage
• Industries with highest percentage of usage: Media & Entertainment; Transport & Tourism
• Industries with highest satisfaction: Food & Beverage; Pharma & Biotech
Significantly higher rate than other regions/company size Significantly lower rate42
-1995:
--1996:
--1997:
--1998:
--1999:
3.67 (22nd)35% (15th)2000:
3.81 (13th)78% (7th)2002:
3.91 (9th)75% (2nd)2004:
3.87 (4th)84% (2nd)2006:
-

*This page intentionally left blank

Customer Segmentation
“Customer Segmentation: Subdivides markets into discrete customer groups that share similar characteristics in order to develop tailored product offerings or marketing programs. Related Topics: Customer Surveys, Market Segmentation, One-to-One Marketing.”
--1993:
--1994:
--1995:
--1996:
--1997:
3.87 (17th)60% (9th)1998:
3.94 (8th)52% (9th)1999:
3.99 (3rd)51% (9th)2000:
4.01 (4th)79% (4th)2002:
3.97 (4th)72% (5th)2004:
3.93 (1st)82% (3rd)2006:
SatisfactionUsage 2009 Expected
73%3.8445%Small companies (<$600M):
76%3.9250%Medium companies ($600M-2B):
79%4.0158%Large companies ($2B+):
80%4.0853%Latin America:
81%3.9251%Asia-Pacific:
77%3.8357%Europe:
70%3.8749%N. America:
77%3.9553%Global:
2006 Satisfaction2008 Usage
• Industries with highest percentage of usage: Transport & Tourism; Food & Beverage
• Industries with highest satisfaction: Construction & Real Estate; Food & Beverage; Transport & Tourism
Significantly higher rate than other regions/company size Significantly lower rate43
3.95 (2nd)53% (6th)2008:

*This page intentionally left blank

Decision Rights Tools
“Decision Rights Tools: Helps companies to organize their decision making and execution by setting clear roles and accountabilities and by giving all those involved a sense of ownership of decisions: when to provide input, who should follow through and what is beyond their scope.”
--1993:
--1994:
--1995:
--1996:
--1997:
--1998:
--1999:
--2000:
--2002:
--2004:
--2006:
SatisfactionUsage 2009 Expected
31%3.6934%Small companies (<$600M):
38%3.7038%Medium companies ($600M-2B):
43%3.6436%Large companies ($2B+):
38%3.759%Latin America:
46%3.339%Asia-Pacific:
34%3.6011%Europe:
39%3.8011%N. America:
39%3.6810%Global:
2008 Satisfaction2008 Usage
• Industries with highest percentage of usage: CPG; Pharma & Biotech
• Industries with highest satisfaction: Healthcare; Retail
Significantly higher rate than other regions/company size Significantly lower rate44
3.68 (22nd)10% (25th)2008:

*This page intentionally left blank

Downsizing
“Downsizing: In the face of slowing or declining sales, companies often downsize their employee base as a means of cutting costs to boost profitability. Related Topics: Layoffs, Reengineering, Rightsizing.”
--1993:
--1994:
--1995:
--1996:
--1997:
--1998:
--1999:
--2000:
3.49 (24th)59% (17th)2002:
--2004:
--2006:
SatisfactionUsage 2009 Expected
50%3.7831%Small companies (<$600M):
51%3.5428%Medium companies ($600M-2B):
67%3.6040%Large companies ($2B+):
52%3.6625%Latin America:
61%3.5535%Asia-Pacific:
60%3.5334%Europe:
70%3.6051%N. America:
59%3.5934%Global:
2008 Satisfaction2008 Usage
• Industries with highest percentage of usage: Media & Entertainment; Construction & Real Estate
• Industries with highest satisfaction: Transport & Tourism; Food & Beverage
Significantly higher rate than other regions/company size Significantly lower rate45
3.59 (25th)34% (17th)2008:

*This page intentionally left blank

Growth Strategy Tools
“Growth Strategy Tools: Used to identify and direct resources toward opportunities for profitable growth. Related Topics: Adjacency Expansion, Managing Innovation, Market Migration Analysis.”
--1993:
--1994:
--1995:
3.77 (13th)55% (10th)1996:
3.85 (15th)55% (10th)1997:
3.93 (10th)63% (7th)1998:
3.82 (16th)55% (97h)1999:
3.78 (20th)55% (6th)2000:
3.82 (12th)78% (9th)2002:
3.91 (9th)62% (9th)2004:
3.75 (13th)65% (14th)2006:
SatisfactionUsage 2009 Expected
67%3.8736%Small companies (<$600M):
69%3.8642%Medium companies ($600M-2B):
72%3.9337%Large companies ($2B+):
79%4.0150%Latin America:
72%3.6633%Asia-Pacific:
57%3.7526%Europe:
67%3.7731%N. America:
71%3.8738%Global:
2008 Satisfaction2008 Usage
• Industries with highest percentage of usage: Mining, Chemical & Metals; Food & Beverage; CPG
• Industries with highest satisfaction: CPG; Utilities & Energy
Significantly higher rate than other regions/company size Significantly lower rate46
3.87 (5th)38% (16th)2008:

*This page intentionally left blank
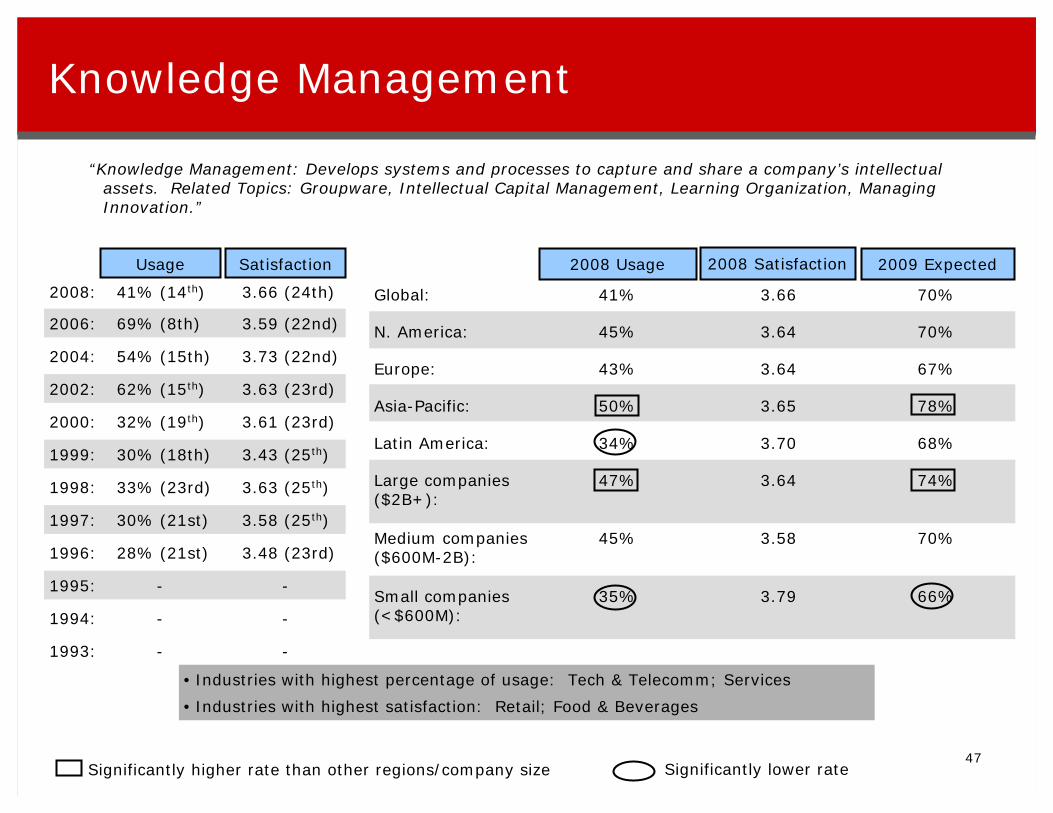
Knowledge Management
“Knowledge Management: Develops systems and processes to capture and share a company’s intellectual assets. Related Topics: Groupware, Intellectual Capital Management, Learning Organization, Managing Innovation.”
--1993:
--1994:
--1995:
3.48 (23rd)28% (21st)1996:
3.58 (25th)30% (21st)1997:
3.63 (25th)33% (23rd)1998:
3.43 (25th)30% (18th)1999:
3.61 (23rd)32% (19th)2000:
3.63 (23rd)62% (15th)2002:
3.73 (22nd)54% (15th)2004:
3.59 (22nd)69% (8th)2006:
SatisfactionUsage 2009 Expected
66%3.7935%Small companies (<$600M):
70%3.5845%Medium companies ($600M-2B):
74%3.6447%Large companies ($2B+):
68%3.7034%Latin America:
78%3.6550%Asia-Pacific:
67%3.6443%Europe:
70%3.6445%N. America:
70%3.6641%Global:
2008 Satisfaction2008 Usage
• Industries with highest percentage of usage: Tech & Telecomm; Services
• Industries with highest satisfaction: Retail; Food & Beverages
Significantly higher rate than other regions/company size Significantly lower rate47
3.66 (24th)41% (14th)2008:

*This page intentionally left blank

Lean Six Sigma
“Lean Six Sigma: Combines elements of Lean Manufacturing and Six Sigma approaches. Goal is to help companies achieve higher quality in a fast and efficient way by creating a culture of responsiveness and accountability. Related Topics: Lean Manufacturing, Six Sigma, Statistical Process Control, TQM
--1993:
--1994:
--1995:
--1996:
--1997:
--1998:
--1999:
--2000:
--2002:
3.89 (14th)34% (21st)2004:
3.66 (18th)40% (21st)2006:
SatisfactionUsage 2009 Expected
29%3.7019%Small companies (<$600M):
40%3.9030%Medium companies ($600M-2B):
51%3.8937%Large companies ($2B+):
39%3.9628%Latin America:
51%3.9031%Asia-Pacific:
40%3.6834%Europe:
42%3.9133%N. America:
42%3.8731%Global:
2008 Satisfaction2008 Usage
• Industries with highest percentage of usage: Chemicals & Metals; Manufacturing; Healthcare
• Industries with highest satisfaction: Utilities & Energy; Chemicals & Metals; Transport & Tourism
Significantly higher rate than other regions/company size Significantly lower rate48
3.87 (5th)31% (19th)2008*:
*Name changed from “Six Sigma” to “Lean Six Sigma”

*This page intentionally left blank

Loyalty Management Tools
“Loyalty Management Tools: Used to grow a business’s revenues and profits by improving retention among its customers, employees and investors. Quantifiably links financial results to changes in retention rates. Related Topics: Customer and employee surveys, Customer Loyalty and Retention, Net Promoter Scores.”
--1993:
--1994:
--1995:
--1996:
--1997:
--1998:
--1999:
--2000:
--2002:
3.67 (25th)40% (19th)2004:
3.59 (22nd)51% (19th)2006:
SatisfactionUsage 2009 Expected
38%3.6912%Small companies (<$600M):
47%3.8818%Medium companies ($600M-2B):
51%3.7921%Large companies ($2B+):
46%3.8417%Latin America:
54%3.7818%Asia-Pacific:
38%3.5616%Europe:
46%3.9017%N. America:
46%3.7917%Global:
2008 Satisfaction2008 Usage
• Industries with highest percentage of usage: Media and Entertainment; Retail; CPG
• Industries with highest satisfaction: Retail; Services
Significantly higher rate than other regions/company size Significantly lower rate49
3.79 (17th)17% (24th)2008:

*This page intentionally left blank

Mergers and Acquisitions
“Mergers and Acquisitions: Acquisitions occur when a larger company takes over a smaller one; a merger typically involves two relative equals joining forces and creating a new company. Related Topics: Merger Integration Teams, Strategic Alliances.”
--1993:
--1994:
--1995:
--1996:
--1997:
--1998:
--1999:
--2000:
--2002:
--2004:
3.88 (3rd)50% (20th)2006:
SatisfactionUsage 2009 Expected
53%3.7641%Small companies (<$600M):
59%3.7442%Medium companies ($600M-2B):
63%3.9054%Large companies ($2B+):
52%3.9041%Latin America:
57%3.7245%Asia-Pacific:
66%3.7753%Europe:
58%3.9149%N. America:
57%3.8346%Global:
2008 Satisfaction2008 Usage
• Industries with highest percentage of usage: Utilities & Energy; Wholesale, Distribution & Logistics
• Industries with highest satisfaction: Construction & Real Estate; Chemicals & Metals
Significantly higher rate than other regions/company size Significantly lower rate50
3.83 (8th)46% (10th)2008:

*This page intentionally left blank

Mission and Vision Statements
“Mission and Vision Statements: Codify definitions of a company’s business, objectives, approach and desired future position. Related Topics: Corporate Value Statements, Culture Transformation, Strategic Planning.”
3.90 (2nd)88% (1st)1993:
3.80 (3rd)86% (1st)1994:
3.79 (4th)84% (1st)1995:
3.81 (8th)82% (2nd)1996:
3.84 (16th)78% (3rd)1997:
3.93 (11th)74% (4th)1998:
3.99 (4th)79% (2nd)1999:
3.94 (6th)70% (2nd)2000:
3.74 (21st)84% (3rd)2002:
3.87 (16th)72% (5th)2004:
3.78 (8th)79% (5th)2006:
SatisfactionUsage 2009 Expected
71%3.8859%Small companies (<$600M):
82%3.8666%Medium companies ($600M-2B):
81%3.9569%Large companies ($2B+):
78%4.0267%Latin America:
79%3.8861%Asia-Pacific:
78%3.7263%Europe:
77%3.9370%N. America:
78%3.9165%Global:
2008 Satisfaction2008 Usage
• Industries with highest percentage of usage: Wholesale, Distribution & Logistics; CPG
• Industries with highest satisfaction: Construction & Real Estate; Healthcare
Significantly higher rate than other regions/company size Significantly lower rate51
3.91 (3rd)65% (3rd)2008:

*This page intentionally left blank

Online Communities
“Online Communities: a form of internet-based social networking that allows organizations to have two-way communication with their employees, customers and partners through computer networks. By tapping into the multimedia capabilities, companies can also display and sell products, solicit and respond to feedback and rapidly correct misinformation. Related Topics: e-communities, Social Networking”
--1993:
--1994:
--1995:
--1996:
--1997:
--1998:
--1999:
--2000:
--2002:
--2004:
--2006:
SatisfactionUsage 2009 Expected
46%3.7224%Small companies (<$600M):
48%3.5520%Medium companies ($600M-2B):
57%3.7330%Large companies ($2B+):
43%3.7421%Latin America:
54%3.6426%Asia-Pacific:
53%3.4925%Europe:
59%3.8035%N. America:
51%3.6926%Global:
2008 Satisfaction2008 Usage
• Industries with highest percentage of usage: Tech and Telecom; Media & Entertainment
• Industries with highest satisfaction: Healthcare; Transport & Tourism
Significantly higher rate than other regions/company size Significantly lower rate52
3.69 (21st)26%(21st)2008:

*This page intentionally left blank

Outsourcing
“Outsourcing: Uses third parties to perform non-core business activities. Related Topics: Core Capabilities, Strategic Alliances, Value Chain Analysis.”
--1993:
--1994:
--1995:
--1996:
--1997:
3.89 (14th)71% (6th)1998:
3.79 (18th)62% (5th)1999:
3.80 (19th)63% (4th)2000:
3.84 (10th)78% (5th)2002:
3.89 (14th)73% (3rd)2004:
3.68 (17th)77% (7th)2006:
SatisfactionUsage 2009 Expected
66%3.8058%Small companies (<$600M):
76%3.8263%Medium companies ($600M-2B):
80%3.7665%Large companies ($2B+):
78%3.8767%Latin America:
78%3.8862%Asia-Pacific:
70%3.7156%Europe:
73%3.7061%N. America:
75%3.7963%Global:
2008 Satisfaction2008 Usage
• Industries with highest percentage of usage: Pharma & Biotech; Transport & Tourism
• Industries with highest satisfaction: Utilities & Energy; Food & Beverage
Significantly higher rate than other regions/company size Significantly lower rate53
3.79 (17th)63% (4th)2008:

*This page intentionally left blank

Price Optimization Models
“Price Optimization Models: Mathematical programs that calculate how demand varies at different price levels, then combines the data with information on costs and inventory levels to recommend prices that will improve profits. Related topics; Demand-Based Management, Pricing Strategy, Revenue Enhancement.”
--1993:
--1994:
--1995:
--1996:
--1997:
--1998:
--1999:
--2000:
--2002:
3.87 (16th)36%(20th)2004:
--2006:
SatisfactionUsage 2009 Expected
45%3.7516%Small companies (<$600M):
58%3.8024%Medium companies ($600M-2B):
65%3.7328%Large companies ($2B+):
59%3.8223%Latin America:
61%3.9422%Asia-Pacific:
60%3.6225%Europe:
54%3.6125%N. America:
59%3.7524%Global:
2008 Satisfaction2008 Usage
• Industries with highest percentage of usage: Food & Beverage; Transport & Tourism
• Industries with highest satisfaction: Utilities & Energy; Food & Beverage
Significantly higher rate than other regions/company size Significantly lower rate54
3.75 (19th)24% (23rd)2008:

*This page intentionally left blank

Scenario and Contingency Planning
“Scenario and Contingency Planning: Involves raising and testing various “what-if” scenarios. Related Topics: Crisis Management, Disaster Recovery, Groupthink, Real Options Analysis, Simulation Models.”
3.68 (15th)38% (16th)1993:
3.59 (19th)44% (15th)1994:
3.53 (21st)39% (17th)1995:
3.69 (19th)35% (18th)1996:
3.78 (18th)35% (19th)1997:
3.78 (22nd)35% (22nd)1998:
3.90 (10th)28% (20th)1999:
3.86 (15th)35% (16th)2000:
3.81 (14th)70% (12th)2002:
3.90 (11th)54% (15th)2004:
3.78 (8th)69% (8th)2006:
SatisfactionUsage 2009 Expected
67%3.7337%Small companies (<$600M):
75%3.7844%Medium companies ($600M-2B):
79%3.9144%Large companies ($2B+):
82%3.9051%Latin America:
75%3.7833%Asia-Pacific:
70%3.6938%Europe:
67%3.8137%N. America:
75%3.8342%Global:
2008 Satisfaction2008 Usage
• Industries with highest percentage of usage: Transport & Tourism; Pharma & Biotech
• Industries with highest satisfaction: Construction & Real Estate; Healthcare
Significantly higher rate than other regions/company size Significantly lower rate55
3.83 (8th)42% (13th)2008:

*This page intentionally left blank

Shared Service Centers
“Shared Service Centers: Method of reducing costs through consolidating one or more back-office operations used by multiple divisions of the same company – such as finance, information technology, customer service and human resources – into a shared operation. Related Topics: Joint Ventures, Offshoring, Outsourcing, Performance Improvement, Strategic Partnerships”
--1993:
--1994:
--1995:
--1996:
--1997:
--1998:
--1999:
--2000:
--2002:
--2004:
3.63 (19th)55% (16th)2006:
SatisfactionUsage 2009 Expected
47%3.6529%Small companies (<$600M):
62%3.6237%Medium companies ($600M-2B):
73%3.7048%Large companies ($2B+):
61%3.6941%Latin America:
68%3.8439%Asia-Pacific:
65%3.5644%Europe:
61%3.6438%N. America:
63%3.6841%Global:
2008 Satisfaction2008 Usage
• Industries with highest percentage of usage: Utilities & Energy; CPG; Wholesale, Distribution & Logistics
• Industries with highest satisfaction: Food & Beverage; Retail
Significantly higher rate than other regions/company size Significantly lower rate56
3.68 (22nd)41% (14th)2008:

*This page intentionally left blank

Strategic Alliances
“Strategic Alliances: Create agreements between firms in which each commits resources to achieve a common set of objectives. Related Topics: Corporate Venturing, Joint Ventures, Value-Managed Relationships, Virtual Organizations.”
3.70 (14th)62% (8th)1993:
3.72 (9th)68% (8th)1994:
3.74 (7th)68% (8th)1995:
3.73 (15th)61% (9th)1996:
3.96 (4th)60% (9th)1997:
3.88 (16th)60% (10th)1998:
3.73 (23rd)53% (8th)1999:
3.74 (21st)53% (7th)2000:
3.80 (18th)69% (13th)2002:
3.95 (6th)63% (8th)2004:
3.78 (8th)68% (11th)2006:
SatisfactionUsage 2009 Expected
73%3.8747%Small companies (<$600M):
72%3.8647%Medium companies ($600M-2B):
72%3.7644%Large companies ($2B+):
72%3.9743%Latin America:
78%3.7345%Asia-Pacific:
66%3.7738%Europe:
73%3.7151%N. America:
72%3.8244%Global:
2008 Satisfaction2008 Usage
• Industries with highest percentage of usage: Tech & Telecomm; Pharma & Biotech
• Industries with highest satisfaction: Utilities & Energy; Construction & Real Estate
Significantly higher rate than other regions/company size Significantly lower rate57
3.82 (12th)44% (11th)2008:

*This page intentionally left blank

Strategic Planning
“Strategic Planning: involves a comprehensive process for determining what a business should become and how to allocate scarce resources to achieve that objective. Related topics: Core Competencies, Mission and Vision Statements, Scenario and Contingency Planning.”
--1993:
--1994:
--1995:
3.99 (1st)83% (1st)1996:
4.04 (1st)80% (2nd)1997:
4.11 (1st)84% (1st)1998:
4.02 (3rd)81% (1st)1999:
4.06 (2nd)76% (1st)2000:
4.04 (2nd)89% (1st)2002:
4.14 (1st)79% (1st)2004:
3.93 (1st)88% (1st)2006:
SatisfactionUsage 2009 Expected
86%4.0562%Small companies (<$600M):
91%3.9970%Medium companies ($600M-2B):
90%4.0368%Large companies ($2B+):
94%4.1774%Latin America:
90%3.9058%Asia-Pacific:
80%3.8956%Europe:
89%3.9173%N. America:
89%4.0167%Global:
2008 Satisfaction2008 Usage
• Industries with highest percentage of usage: CPG; Food & Beverage
• Industries with highest satisfaction: Retail; Utilities & Energy
58
4.01 (1st)67% (2nd)2008:

*This page intentionally left blank
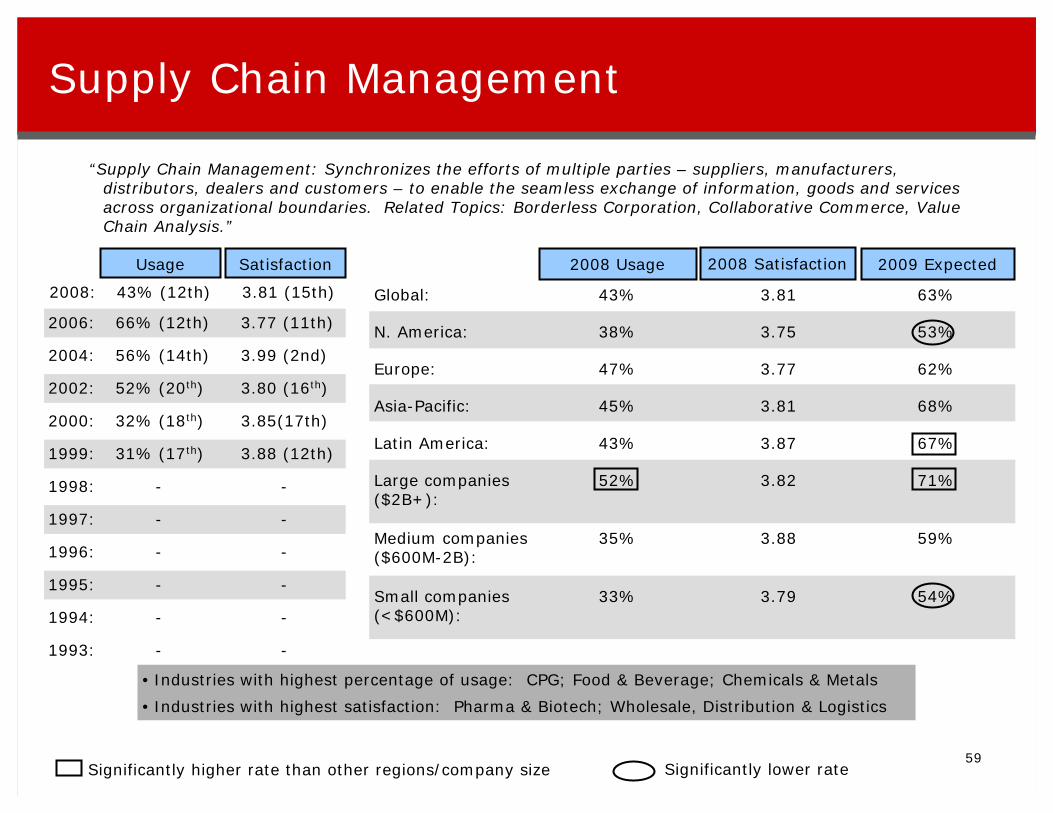
Supply Chain Management
“Supply Chain Management: Synchronizes the efforts of multiple parties – suppliers, manufacturers, distributors, dealers and customers – to enable the seamless exchange of information, goods and services across organizational boundaries. Related Topics: Borderless Corporation, Collaborative Commerce, Value Chain Analysis.”
--1993:
--1994:
--1995:
--1996:
--1997:
--1998:
3.88 (12th)31% (17th)1999:
3.85(17th)32% (18th)2000:
3.80 (16th)52% (20th)2002:
3.99 (2nd)56% (14th)2004:
3.77 (11th)66% (12th)2006:
SatisfactionUsage 2009 Expected
54%3.7933%Small companies (<$600M):
59%3.8835%Medium companies ($600M-2B):
71%3.8252%Large companies ($2B+):
67%3.8743%Latin America:
68%3.8145%Asia-Pacific:
62%3.7747%Europe:
53%3.7538%N. America:
63%3.8143%Global:
2008 Satisfaction2008 Usage
• Industries with highest percentage of usage: CPG; Food & Beverage; Chemicals & Metals
• Industries with highest satisfaction: Pharma & Biotech; Wholesale, Distribution & Logistics
Significantly higher rate than other regions/company size Significantly lower rate59
3.81 (15th)43% (12th)2008:

*This page intentionally left blank

Total Quality Management (TQM)
“Total Quality Management: Marries customer performance requirements to product and service specifications with the goal of producing with zero defects. Related Topics: Continuous Improvement, Malcolm Baldridge National Quality Award, Quality Assurance, Six Sigma.”
3.78 (8th)72% (3rd)1993:
3.71 (10th)72% (4th)1994:
3.69 (9th)73% (4th)1995:
3.73 (16th)66% (6th)1996:
3.78 (19th)62% (6th)1997:
3.94 (9th)61% (8th)1998:
3.95 (7th)49% (11th)1999:
3.89 (13th)41% (11th)2000:
3.80 (17th)57% (18th)2002:
3.93 (7th)61% (10th)2004:
3.80 (6th)64% (15th)2006:
SatisfactionUsage 2009 Expected
58%3.9032%Small companies (<$600M):
60%3.7334%Medium companies ($600M-2B):
64%3.8435%Large companies ($2B+):
62%3.8736%Latin America:
70%3.8837%Asia-Pacific:
62%3.7133%Europe:
54%3.6430%N. America:
62%3.8034%Global:
2008 Satisfaction2008 Usage
• Industries with highest percentage of usage: CPG; Food & Beverage
• Industries with highest satisfaction: Utilities & Energy; Healthcare
Significantly higher rate than other regions/company size Significantly lower rate60
3.80 (16th)34% (17th)2008:

*This page intentionally left blank
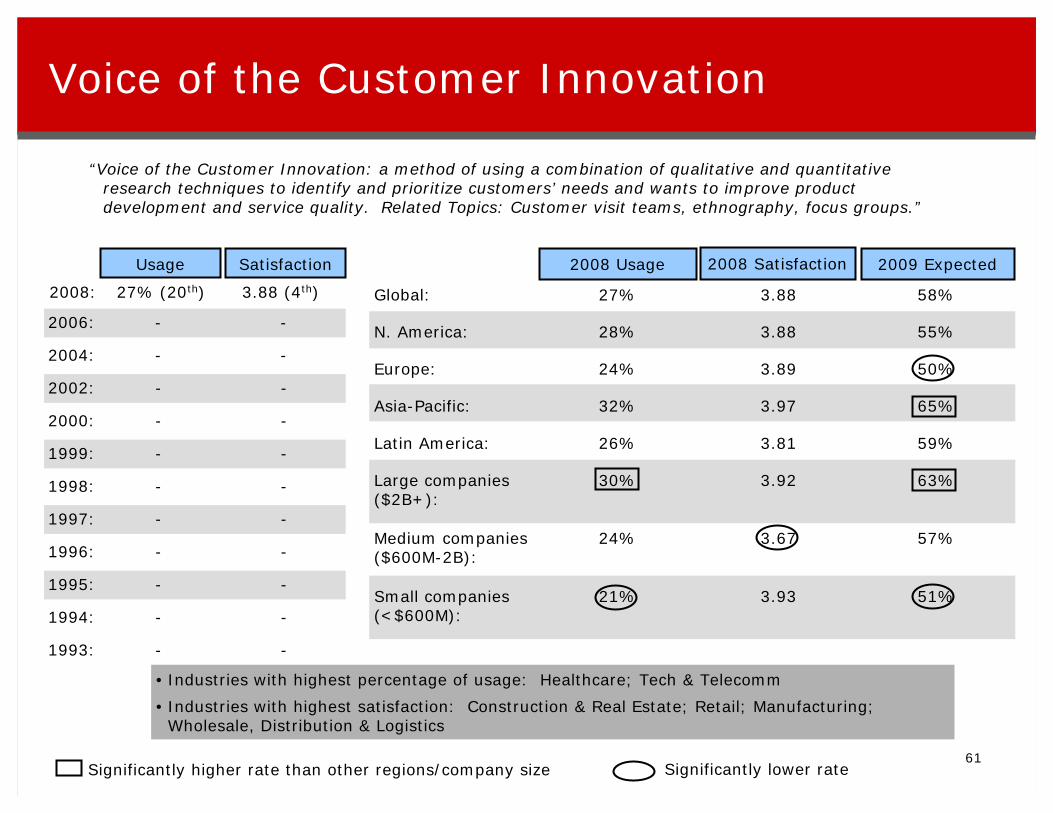
Voice of the Customer Innovation
“Voice of the Customer Innovation: a method of using a combination of qualitative and quantitative research techniques to identify and prioritize customers’ needs and wants to improve product development and service quality. Related Topics: Customer visit teams, ethnography, focus groups.”
--1993:
--1994:
--1995:
--1996:
--1997:
--1998:
--1999:
--2000:
--2002:
--2004:
--2006:
SatisfactionUsage 2009 Expected
51%3.9321%Small companies (<$600M):
57%3.6724%Medium companies ($600M-2B):
63%3.9230%Large companies ($2B+):
59%3.8126%Latin America:
65%3.9732%Asia-Pacific:
50%3.8924%Europe:
55%3.8828%N. America:
58%3.8827%Global:
2008 Satisfaction2008 Usage
• Industries with highest percentage of usage: Healthcare; Tech & Telecomm
• Industries with highest satisfaction: Construction & Real Estate; Retail; Manufacturing; Wholesale, Distribution & Logistics
Significantly higher rate than other regions/company size Significantly lower rate61
3.88 (4th)27% (20th)2008:

*This page intentionally left blank
2009 Survey of Management Tools & Trends
All responses will be kept completely confidential and used only in aggregate.
No company names will be linked to specific responses.
If you are a corporate executive, please check this box and provide survey answers related to your corporation as a whole.
If you are a division head, please check this box and provide survey answers related to your division.

I. Use of tools
For this next section, please answer only for those techniques that your company has used in the past five years. Also, in thinking about your satisfaction, consider both the benefits achieved and all costs associated with using each technique.
2. How satisfied was your organization with the overall results achieved through the usage of each technique? Please use the following scale: extremely satisfied, somewhat satisfied, neither satisfied nor dissatisfied, somewhat dissatisfied, or extremely dissatisfied.
II. Overall satisfaction with tools
The purpose of this section is to understand your organization's use of management tools and techniques. To record your answers, please check the appropriate box(es) in the grid below.
1a. Within the last five years (2004-2008), which of the following techniques have been used by your current employer?
1b. In the past year (2008), which of the 25 techniques listed has your organization used? Please indicate whether the technique was not used at all, was used on a limited or trial basis, or was a major organizational effort.
1c. To what extent do you think your organization will use each technique in 2009? Please indicate whether you think it is not likely to be used at all, it will be used on a limited or trial basis, or it will be a major organizational effort. Please note whether or not you have used each technique in the past.

Tools and techniques
Not u
sed
at all
Lim
ited
basis
Major
effo
rt
Not l
ikely to
use
at a
ll
Lim
ited
basis
Major
effo
rt
Extre
mely sa
tisfie
dSo
mew
hat s
atisf
ied
Neith
er sat
isfied
nor d
issat
isfied
Som
ewha
t diss
atisf
ied
Extre
mely diss
atisf
ied
Used
in p
ast 5
yea
rs
Benchmarking
Collaborative Innovation
Customer Relationship Management
Decision Rights Tools
Downsizing
Knowledge Management
Loyalty Management Tools
Price Optimization Models
Strategic Alliances
Total Quality Management
Online Communities
Mission and Vision Statements
Balanced Scorecard
Business Process Reengineering
Core Competencies
Customer Segmentation
Growth Strategy Tools
Lean Six Sigma
Outsourcing
Scenario and Contingency Planning
Shared Service Centers
Strategic Planning
Voice of the Customer Innovation
Other _______________________
Mergers and Acquisitions
Supply Chain Management

Strongly agree
Somewhat agree
Neither agree
nor disa
gree
Somewhat disa
gree
Strongly disa
gree
The purpose of this section is to understand your organization’s needs and priorities for management tools. There are no right or wrong answers. We are interested in your opinions.
3. How strongly do you agree or disagree with how well each statement describes your organization or yourorganization's beliefs? Please check the appropriate box to indicate whether you strongly agree...strongly disagreewith the statement as a description of your organization.
Our entire organization is actively engaged in improving innovation
Other emerging markets now offer better opportunities than China and India
We will pursue sustainability initiatives even if they hurt our profits
Our decisions are being driven by short-term financials, not long-term strategies
The current downturn will change consumer behaviors for at least 3 years
We are planning for a downturn that will last at least until early 2010
Government regulation of business will increase over the next 5 years
Unclear decision making authority is hurting our performance
International growth will be vital to our performance over the next 5 years
Our top executives are comfortable taking higher risks for potentially higher returns
We should focus more on revenue growth and less on cost reductions
Our company waited too long to respond to this economic downturn
I am very concerned about how we will meet our growth targets in 2009
Our company will use this recession to improve our competitive position
Our company will have significant layoffs in 2009
Insufficient customer insight is hurting our performance
Innovation is more important than cost reduction for long-term success
Culture is as important as strategy for business success
We could dramatically boost innovation by collaborating with other companies
Almost all of today’s market leaders will still be leaders 5 years from now

Thank you very much for your help with this important project.
5c. What is your title?
5b. Describe the industry your organization is in, both at the corporate level and at the division level, if appropriate.
Corporate:
Division:
This section is for classification purposes only. All responses will remain completely confidential and will be used only in aggregate. Please be assured that specific answers will never be attached to individual companies.
IV. Demographics
• 2008 sales:Less than $600MM$600MM to less than $2B$2B or more
• 2008 assets:Less than $1B$1B to less than $20B$20B or more
5a. Please record your company's basic business statistics under the first column. If you are responsible for a division, record the statistics for that division under the second column.
Corporate Statistics Division Statistics
Would you be willing to participate in a follow-up discussion on this topic?
Yes No
5d.
Please record the information below so that we may send you the results from the survey.
Company name: _____________________________________________
Division: _____________________________________________
Name of respondent:_____________________________________________
Mailing address: _____________________________________________
Zip/Postal code: _____________________________________________
Business telephone: _____________________________________________
Country: _____________________________________________
E-mail address: _____________________________________________
4. How satisfied are executives with your organization’s current results on each performance dimension? Please indicate whether they are extremely satisfied (ES), somewhat satisfied (SS), neither satisfied nor dissatisfied (N), somewhat dissatisfied (SD), or extremely dissatisfied (ED).
ES SS N SD EDFinancial Results
Customer EquityLong-Term Performance Capabilities
Competitive Positioning
Organizational Integration
