management report on unilever and procter
TRANSCRIPT
MANAGEMENT REPORT ON UNILEVER AND PROCTER &
GAMBLE CASE STUDY
Dhanushka Ariyawansa (CB002548)
Submitted to the
Business School
In partial fulfilment of the requirements for the degree of
Bachelor’s of Arts in
Business Administration (Hons)
Supervised by:
Mr. Marlon Gunasekara
Batch number: GF0931BA (Level 03)
Subject code: BLB10089-3 STRM
Asia Pacific Institute of Information Technology
October 2009, Colombo

i
Executive Summary
This report was formulated based on a case study about Unilever and its downturn in
2004. In order to identify the critical factors that affect the company performance, a
internal analysis to identify the strengths and weaknesses and also a external
analysis was carried to identify the opportunities and threats. In the third section
reasons for Unilever’s downturn in 2004 was evaluated. This was evaluated using
information about financial and other performance characteristics and also by using
strategic management theories and strategies. The strategic moves of Unilever and
Proctor and Gamble were identified in order to identify the best company which has
the most effective strategic approach. Motives behind Proctor and Gamble’s
acquisition of Gillette were discussed to identify the short-term and long-term
benefits. And also the future of Unilever was evaluated to give several
recommendations about the effectiveness of the courses of action of the company.
Key words: Unilever, P&G

ii
Acknowledgement
I take this opportunity to thank my Lecturer Mr. Marlon Gunasekara for the
guidance given to complete this assignment in time.
Lab Assistants, Librarians and others who have supported me in many ways are also
given gratitude for providing me necessary support.
I also wish to thank my parents and friends for all the support and kind assistance
extended by them.

iii
Table of content
EXECUTIVE SUMMARY .................................................................................... I
ACKNOWLEDGEMENT ................................................................................... II
TABLE OF CONTENT ...................................................................................... III
LIST OF TABLES .............................................................................................. VI
LIST OF FIGURES .......................................................................................... VII
LIST OF ABBREVIATIONS ............................................................................. IX
CHAPTER ONE.................................................................................................... 1
INTRODUCTION ................................................................................................. 1
INTRODUCTION..................................................................................................... 2
CHAPTER TWO .................................................................................................. 3
ANALYSIS OF UNILEVER ................................................................................. 3
2.0 ANALYSIS OF UNILEVER ................................................................................. 4
2.1 CLIMATE ANALYSIS ........................................................................................ 4
2.1.1 PESTN Analysis ..................................................................................... 6
2.2 COMPETITOR ANALYSIS .................................................................................. 9
2.3 CUSTOMER ANALYSIS ................................................................................... 12
2.4 COMPANY ANALYSIS .................................................................................... 13
2.4.1 Product Portfolio Analysis ................................................................... 15
2.5 SWOT ANALYSIS ......................................................................................... 17
2.5.1 SWOT analysis ..................................................................................... 17
2.7 CRITICAL FACTOR ANALYSIS ........................................................................ 21

iv
CHAPTER THREE ............................................................................................ 23
REASONS BEHIND UNILEVER’S DOWNTURN IN 2004 ............................ 23
3.1 FINANCIAL ................................................................................................... 24
3.1.1 Cross Trend Analysis ........................................................................... 26
3.1.2 Analysis on Shares ............................................................................... 29
3.2 NON-FINANCIAL ........................................................................................... 31
CHAPTER FOUR ............................................................................................... 34
STRATEGIC MOVES IN CAPTURING CONSUMER MARKETS ............... 34
4.1UNILEVER ..................................................................................................... 35
4.2 PROCTOR AND GAMBLE ................................................................................ 37
CHAPTER FIVE ................................................................................................. 39
MOTIVES BEHIND ACQUISITION OF GILLETTE ..................................... 39
5.1 MOTIVES OF ACQUISITION OF GILLETTE ........................................................ 40
CHAPTER 06 ...................................................................................................... 42
EVALUATE FUTURE OF UNILEVER ............................................................ 42
6.0 EVALUATE FUTURE OF UNILEVER ...................................................... 43
8.0 REFERENCING AND BIBLIOGRAPHY ................................................... 45
9.0 APPENDICES ............................................................................................. 46
APPENDICES A – PORTER’S FIVE FORCES IN DIFFERENT ANGEL .... 46
APPENDICES B – OTHER SWOT FACTORS OF UNILEVER ...................................... 47
APPENDICES C – RATIO ANALYSIS ...................................................................... 48
APPENDICES D – PROCESS OF TAKING STRATEGIES ............................................. 50
v
APPENDICES E - SWOT FOR P&G ....................................................................... 51

vi
List of Tables
Table 1: PESTN analysis ......................................................................................... 6
Table 2: Climatic Analysis (Weighted Average Factor Rating Method) ................... 8
Table 3: Competitor Analysis ................................................................................ 10
Table 4: Customer Analysis................................................................................... 12
Table 5: Company Analysis................................................................................... 14
Table 6: SWOT ..................................................................................................... 17
Table 7: Critical Unfavorable Factors .................................................................... 21
Table 8: Critical Factor Analysis - Unfavorable factors ......................................... 21
Table 9: Critical Favorable Factors ........................................................................ 22
Table 10: Critical Factor Analysis – Favorable ...................................................... 22
Table 11: Strategies used by Unilever .................................................................... 35
Table 12: Strategies used by P&G ......................................................................... 37
Table 13: Benefits of Acquisition of Gillette ......................................................... 41
vii
List of Figures
Figure 1: Logo of Unilever ...................................................................................... 2
Figure 2: 4C Analysis (Kenichi Ohemae) ................................................................ 4
Figure 3: Business Environment .............................................................................. 5
Figure 4: Analysing the Global Environment ........................................................... 6
Figure 5: Porter's Five Forces .................................................................................. 9
Figure 6: AIDA Model .......................................................................................... 12
Figure 7: Stage of Brands in PLC - Unilever ......................................................... 13
Figure 8: GE Matrix for Unilever .......................................................................... 15
Figure 9: GE Matrix for P&G ................................................................................ 16
Figure 10: SWOT Analysis ................................................................................... 17
Figure 11: Advertising and Promotion Expenditure ............................................... 24
Figure 12: Group Turnover of Unilever ................................................................. 24
Figure 13: Net Profit Growth ................................................................................. 25
Figure 14: Sales Growth & Operating Profit in Unilever - According to Unilever .. 25
Figure 15: Total Assets .......................................................................................... 26
Figure 16: Quick Ratio .......................................................................................... 26
Figure 17: Current Ratio ........................................................................................ 27
Figure 18: Asset to Sales Ratio .............................................................................. 27
Figure 19: ROI and Net Profit Ratios ..................................................................... 28
Figure 20: Profit Margins in Unilever .................................................................... 28
Figure 21: Trend Analysis ..................................................................................... 29
Figure 22: Market Capitalization ........................................................................... 29
Figure 23: Total Shareholder Return ...................................................................... 30
Figure 24: Reduction of Shares in the Market ........................................................ 30

viii
Figure 25: BCG Matrix for Unilever...................................................................... 31
Figure 26: Balance Scorecard Approach ................................................................ 32
Figure 27: Value Chain Analysis ........................................................................... 33
ix
List of abbreviations
FMCG Fast Moving Consumer Goods
SWOT Strengths, weaknesses, opportunities, and threats
MNC Multi National Company
PESTN Political, economical, social, technological and natural
AIDA Attention, Interest, Desire and action
PLC Product Life Cycle
GE General Electric
CFA Critical Factor Analysis
P&G Proctor and Gamble
ASR Asset to sales ratio
ROI Return on Investment
BCG Boston Consulting Group

1
Chapter One
INTRODUCTION
2
Introduction
Unilever was incorporated in late 1930s as a simple merger of soap and margarine.
However as a result of business success today Unilever operates in over hundred
countries with more than 174000 employees under its management. Also the success
has helped the company to have a strong brand portfolio of over 400 brands with
two global divisions namely Foods and Home & Personal which comes under
FMCG industry. The main success factor of the company is that, Unilever’s constant
focus on innovative product developments.
Figure 1: Logo of Unilever
Mission of the company
“Our mission is to add Vitality to life. We meet everyday needs for nutrition;
hygiene and personal care with brands that help people looks good, feel and get
more out of life.”
Corporate purpose of the company
The corporate purpose of Unilever states that “the only way to achieve sustainable
growth and long-term value creation is to adopt the highest standards of corporate
behaviour towards all their stakeholders.”
It further states that to succeed it requires “the highest standards of corporate
behaviour towards everyone they work with, the communities they touch, and the
environment on which they have an impact.”
(Source: www.unilever.com)

3
Chapter Two
ANALYSIS OF UNILEVER
4
2.0 Analysis of Unilever
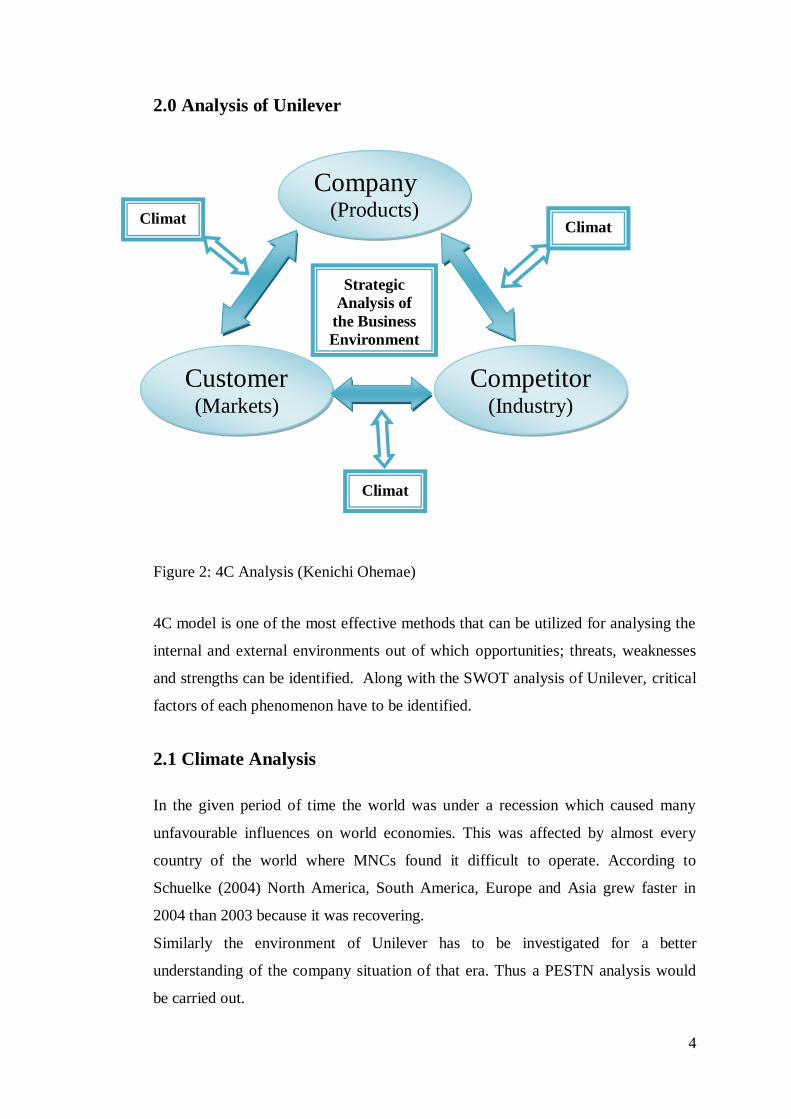
Figure 2: 4C Analysis (Kenichi Ohemae)
4C model is one of the most effective methods that can be utilized for analysing the
internal and external environments out of which opportunities; threats, weaknesses
and strengths can be identified. Along with the SWOT analysis of Unilever, critical
factors of each phenomenon have to be identified.
2.1 Climate Analysis
In the given period of time the world was under a recession which caused many
unfavourable influences on world economies. This was affected by almost every
country of the world where MNCs found it difficult to operate. According to
Schuelke (2004) North America, South America, Europe and Asia grew faster in
2004 than 2003 because it was recovering.
Similarly the environment of Unilever has to be investigated for a better
understanding of the company situation of that era. Thus a PESTN analysis would
be carried out.
Climat
e
Company (Products)
Customer (Markets)
Competitor (Industry)
Strategic
Analysis of
the Business
Environment
Climat
e Climat
e
5
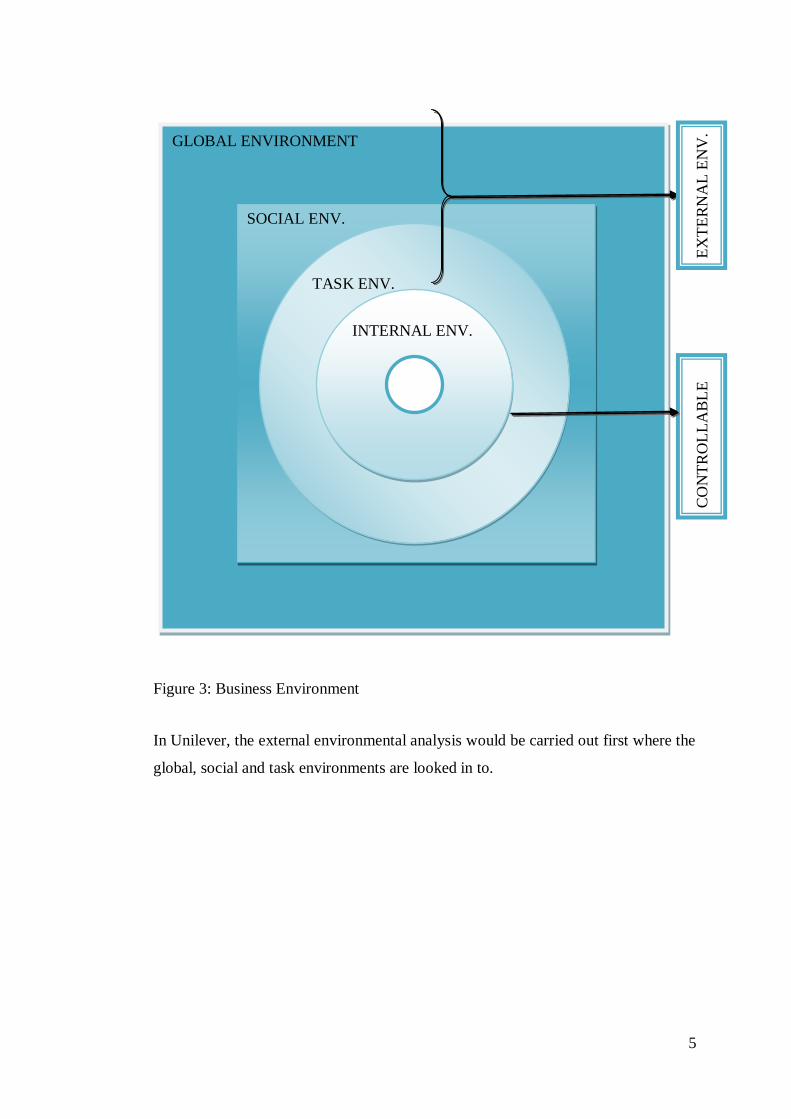
Figure 3: Business Environment
In Unilever, the external environmental analysis would be carried out first where the
global, social and task environments are looked in to.
GLOBAL ENVIRONMENT
SOCIAL ENV.
TASK ENV.
INTERNAL ENV.
EX
TE
RN
AL
EN
V.
CO
NT
RO
LL
AB
LE

6
2.1.1 PESTN Analysis
The global environment explained in the above figure will be discussed here.
Figure 4: Analysing the Global Environment
Table 1: PESTN analysis
POLITICAL global peace situation was not that stable
corporate taxes were high around the glob
Labor related restrictions and tough laws.
consumer protection laws were really strong
there were many trade agreements
further liberalization of economies
ECONOMICAL there was still the effects of world recession even though it was
at the recovery stage
Accelerating Inflation of the world economy ( Prices will
increase)
reduced purchasing power parity ( directly affect to sales)
many countries faced low GDP and less economic growth
since economies trying to recover, it’s a good sign
exchange rate issues
improved globalization and urbanization ( course for high
demand)
P
N
T
E
S
P
E
S T
N

7
increase in woman work force ( course for high demand)
Openness and Liberalization.
country risk trends have been going down
SOCIAL acceptance of fast foods
concern on diet foods & low fat products
concern on environmental friendly products
social awareness of products ( slim products - customers has
decided to not to use them and to exercise instead)
many ethnic groups who have separate wants and Unilever could
targets them separately
TECHNICAL UNILEVER always grasp new technology and improves the
efficiency
safety and design through technology
trustworthy researches done
trusted products could be delivered
technologies always costs
NATURAL environmental friendly products will show natural concern of
Unilever
Based on the understanding of the above PESTN factors, the following Climatic
Analysis is carried out.

8
Table 2: Climatic Analysis (Weighted Average Factor Rating Method)
Factor Weight Likert scale Score Weighted
score Unfavorable Favorable
1 2 3 4 5
1. Political 20% 5 5 1
2. Legal 5% 2 2 0.1
3. Economic 25% 3 3 0.75
4. Financial 5% 4 4 0.2
5. Social 10% 4 4 0.4
6. Cultural 5% 3 3 0.15
7. Demographic 5% 4 4 0.2
8. Technological 10% 5 5 0.5
9. Technical 10% 4 4 0.4
10. Natural 5% 3 3 0.15
Overall score 100% 37 3.85

9
2.2 Competitor Analysis
Figure 5: Porter's Five Forces
(Source:
http://www.businessballs.com/portersfiveforcesdiagram.pdf)
Competitive Rivalry, eg:
number and size of firms
industry size and trends
fixed v variable cost bases
product/service ranges
differentiation, strategy
Supplier Power, eg:
brand reputation
geographical coverage
product/service level quality
relationships with customers
bidding processes/capabilities
Product and Technology
Development, eg:
alternatives price/quality
market distribution changes
fashion and trends
legislative effects
Buyer Power, eg:
buyer choice
buyers size/number
change cost/frequency
product/service importance
volumes, JIT scheduling
New Market Entrants, eg:
entry ease/barriers
geographical factors
incumbents resistance
new entrant strategy
routes to market

10
Table 3: Competitor Analysis
Factor Weight Likert scale Score Weighted
score Unfavorable Favorable
1 2 3 4 5
competition with industry 40%
number of firms in industry 5% 4 4 0.2
strengths of the leading
firms
10% 5 5 0.5
Market size and growth
rate
8% 4 4 0.32
Exit Barriers 5% 5 5 0.25
creativity and innovative
drive
12% 3 3 0.36
Sub total . 21 1.63
Threat of Substitutes 15%
Number of substitutes 2% 1 1 0.02
Closeness of the substitute 5% 2 2 0.1
Strength of the substitute 4% 2 2 0.08
Buyers favorable attitude 2% 3 3 0.06
PLC of the industry
product
2% 5 5 0.1
Sub total 13 0.36
Bargaining Power of
Buyer
25%
Number of buyers / users 5% 5 5 0.25
Switching cost to the buyer 5% 1 1 0.05
Fragmentation of buyers 5% 4 4 0.2
Significance of the product 5% 4 4 0.2
Strength of the buyer 5% 5 5 0.25
Sub total 19 0.95
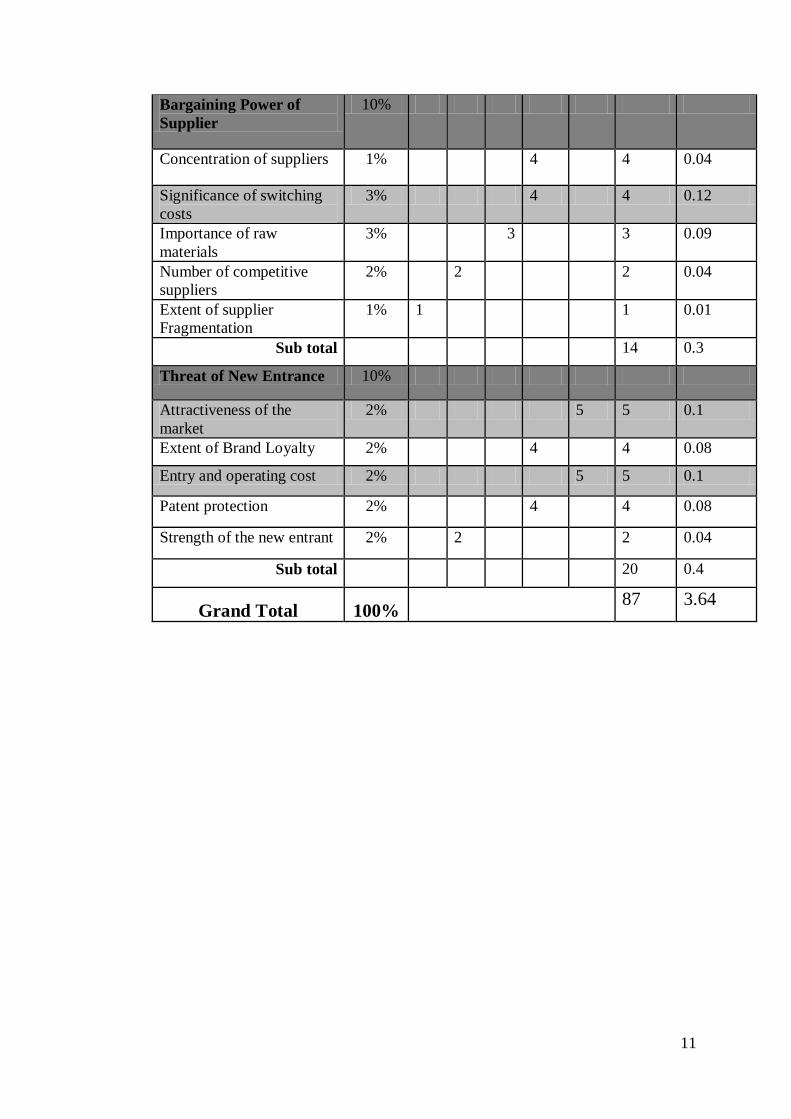
11
Bargaining Power of
Supplier
10%
Concentration of suppliers 1% 4 4 0.04
Significance of switching
costs
3% 4 4 0.12
Importance of raw
materials
3% 3 3 0.09
Number of competitive
suppliers
2% 2 2 0.04
Extent of supplier
Fragmentation
1% 1 1 0.01
Sub total 14 0.3
Threat of New Entrance 10%
Attractiveness of the
market
2% 5 5 0.1
Extent of Brand Loyalty 2% 4 4 0.08
Entry and operating cost 2% 5 5 0.1
Patent protection 2% 4 4 0.08
Strength of the new entrant 2% 2 2 0.04
Sub total 20 0.4
Grand Total 100% 87 3.64

12
2.3 Customer Analysis
Table 4: Customer Analysis
Factor
Wei
gh
t
Likert scale
Sco
re
Wei
gh
ted
score
Unfavorab
le
Favor
able
1 2 3 4 5
Market size 20% 5 5 1
Level of market saturation 10% 2 2 0.2
market growth rate 8% 2 2 0.16
market profitability 6% 3 3 0.18
market trends and
discontinuities
15% 4 4 0.6
customer expectations 15% 4 4 0.6
level of familiarity 5% 5 5 0.25
Level of Favorability 8% 0 0
Level of Satisfaction 8% 4 4 0.32
Loyalty status 5% 5 5 0.25
Overall score 100% 34 3.56
When regarding Customers as a main factor, considering AIDA model is of vital
advantage. According to above facts level of familiarity is 0.25. However getting
attention of customers, make customers interest on products and make desire within
them is also important in keeping and grabbing customers. The ultimate motive is to
have loyal customers which were recognized as high (0.25) in Unilever.
Figure 6: AIDA Model
(Source: http://www.gaumina.lt/tuuletin/index.php?id=7)
13
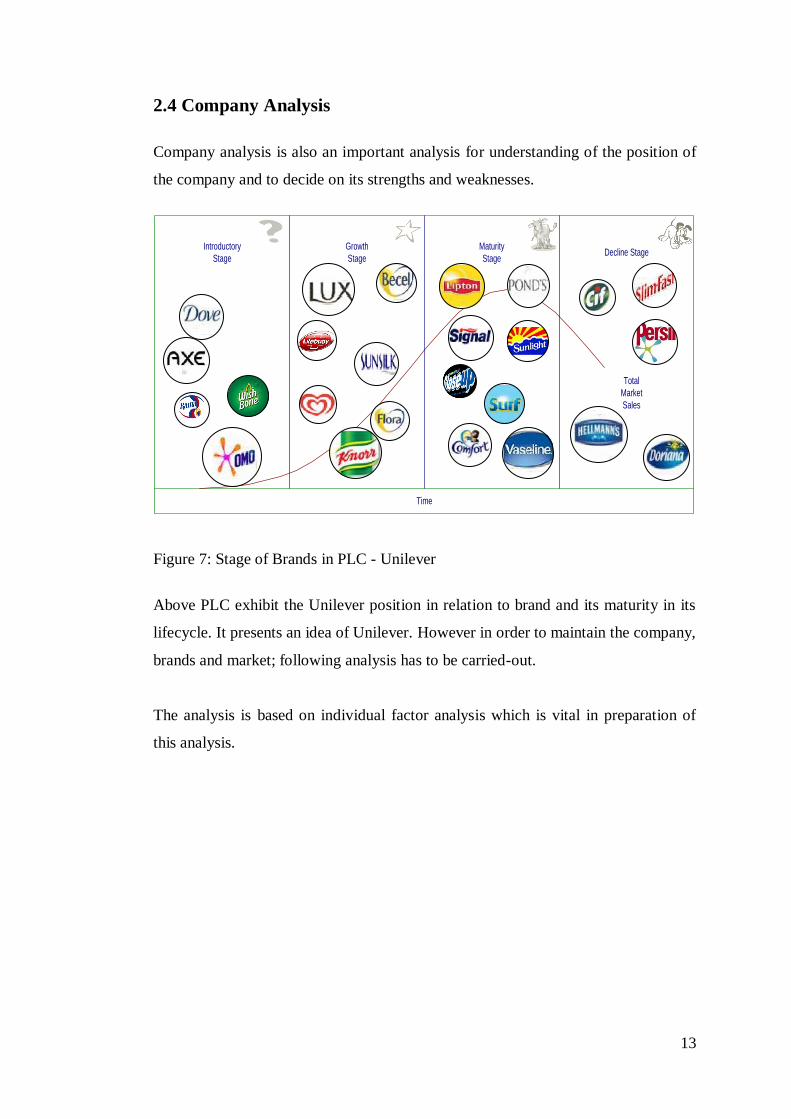
2.4 Company Analysis
Company analysis is also an important analysis for understanding of the position of
the company and to decide on its strengths and weaknesses.
Introductory
Stage
Growth
Stage
Maturity
StageDecline Stage
Total
Market
Sales
Time
Figure 7: Stage of Brands in PLC - Unilever
Above PLC exhibit the Unilever position in relation to brand and its maturity in its
lifecycle. It presents an idea of Unilever. However in order to maintain the company,
brands and market; following analysis has to be carried-out.
The analysis is based on individual factor analysis which is vital in preparation of
this analysis.
14
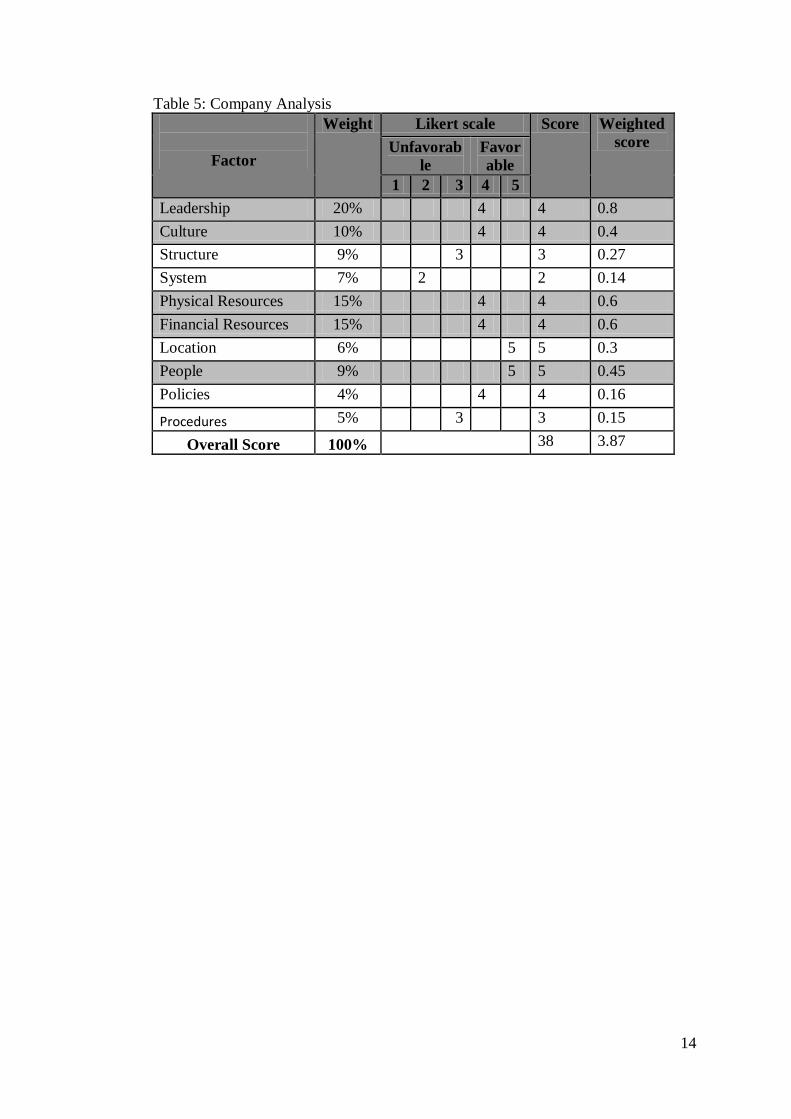
Table 5: Company Analysis
Factor
Weight Likert scale Score Weighted
score Unfavorab
le
Favor
able
1 2 3 4 5
Leadership 20% 4 4 0.8
Culture 10% 4 4 0.4
Structure 9% 3 3 0.27
System 7% 2 2 0.14
Physical Resources 15% 4 4 0.6
Financial Resources 15% 4 4 0.6
Location 6% 5 5 0.3
People 9% 5 5 0.45
Policies 4% 4 4 0.16
Procedures 5% 3 3 0.15
Overall Score 100% 38 3.87

15
2.4.1 Product Portfolio Analysis
Figure 8: GE Matrix for Unilever
Market Attractiveness
Bu
sin
ess
Str
ength
H
i
g
h
M
e
d
I
u
m
L
o
w
High Medium Low

16
Figure 9: GE Matrix for P&G
Market Attractiveness
Bu
sin
ess
Str
ength
H
i
g
h
M
e
d
I
u
m
L
o
w
High Medium Low

17
2.5 SWOT analysis
Figure 10: SWOT Analysis
SWOT analysis of Unilever could be carried out from the results gained by the
previous analysis conducted.
2.5.1 SWOT analysis
Table 6: SWOT
Type Description
Strengths
Market size Unilever posses 40-45% of market share over its operating
countries by 2004 (compared to P&G). This makes it is
one of the leaders in the industry. Only P&G is the
possible competitor to the Unilever. Thus the market share
of Unilever considered being one of its main strengths. It’s
being identified in above analysis as well.
Level of familiarity Familiarity of Unilever products is really high. Sometimes
consumers don’t know it is Unilever, yet it is known as its
sub brand or the brand category. This way the product
familiarity is high and many people in the world uses at
least one product of them daily.
S
O T
W
Strengths
Helpful Harmful
Inte
rnal
Exte
rnal
Strengths Weaknesses
Threats Opportunities

18
Loyalty status, high
brand loyalty
Brand loyalty and loyalty status of Unilever consumers are
also high. Many users of those products do not change
their brand. Especially products like personal care are not
subjected to be switching behaviour. Thus this turns to be
strength.
High Brand Portfolio The Company has more than 400 brands which operate
under two main divisions, Food and Home & personal
care. As mentioned in the case study each division has
separate strengths. According to the case, “Bestfoods” is
capable of offering different tailor made products to
different markets where as Knorr is the widespread brand
in Unilever.
Diversified
management structure
across the globe
Case study reveals that in top 100 managers, there are 33
nationalities. Even there are five nationalities in executive
board. The composition of the top management also
represents 50% out of developing nations and 40% of
women. This is a strength as this diversify staff may have
better understanding on their regions and areas.
Weaknesses
Highly complex
organizational
structure
According to the case, the causes bashing downfall of sales
in 2002 was the structure of the company. The team of top
management and officers count to be 40 with two heads
from parent companies which ultimately resulted in added
cost of maintaining them and non focused goals for the
company.
Poor Performance Although company performance was good, there were
some brands which was not doing that well in the market
which were supposed to perform fine. According to case
study, even though the set target was 10%, some of leading
brands only could attain 4-5%.
19
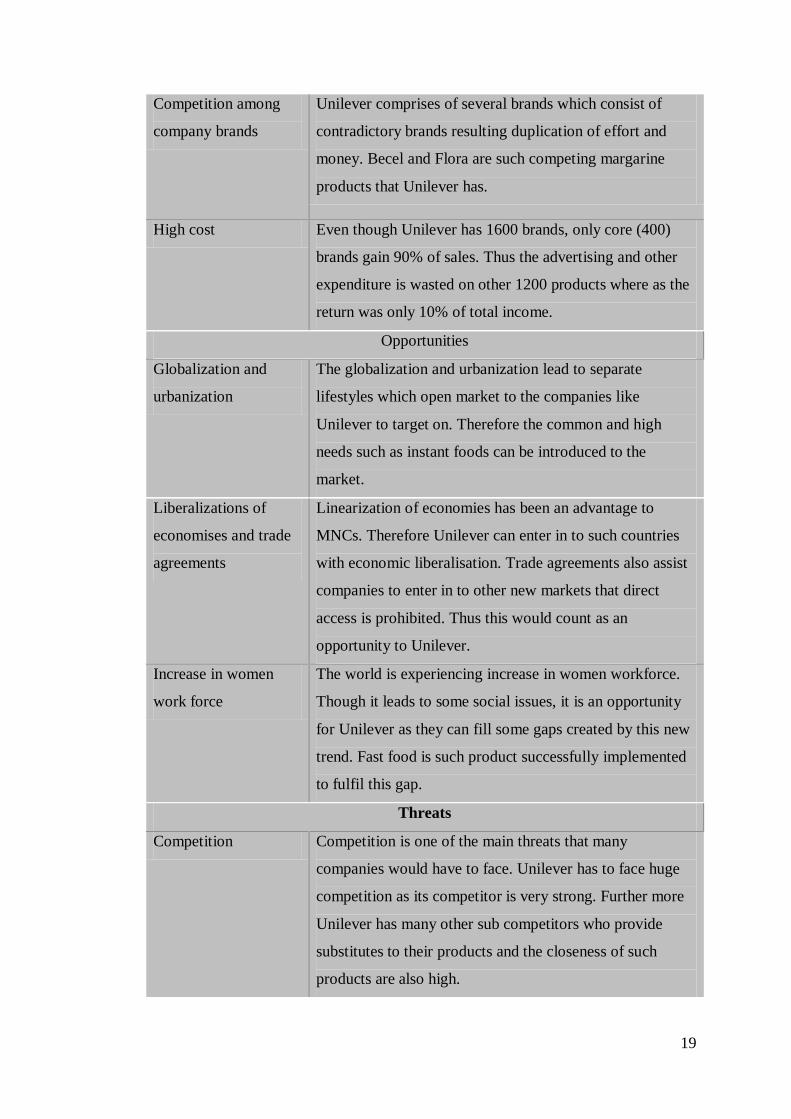
Competition among
company brands
Unilever comprises of several brands which consist of
contradictory brands resulting duplication of effort and
money. Becel and Flora are such competing margarine
products that Unilever has.
High cost Even though Unilever has 1600 brands, only core (400)
brands gain 90% of sales. Thus the advertising and other
expenditure is wasted on other 1200 products where as the
return was only 10% of total income.
Opportunities
Globalization and
urbanization
The globalization and urbanization lead to separate
lifestyles which open market to the companies like
Unilever to target on. Therefore the common and high
needs such as instant foods can be introduced to the
market.
Liberalizations of
economises and trade
agreements
Linearization of economies has been an advantage to
MNCs. Therefore Unilever can enter in to such countries
with economic liberalisation. Trade agreements also assist
companies to enter in to other new markets that direct
access is prohibited. Thus this would count as an
opportunity to Unilever.
Increase in women
work force
The world is experiencing increase in women workforce.
Though it leads to some social issues, it is an opportunity
for Unilever as they can fill some gaps created by this new
trend. Fast food is such product successfully implemented
to fulfil this gap.
Threats
Competition Competition is one of the main threats that many
companies would have to face. Unilever has to face huge
competition as its competitor is very strong. Further more
Unilever has many other sub competitors who provide
substitutes to their products and the closeness of such
products are also high.

20
New entrance The only direct competitor for Unilever is P&G. since both
are giant companies. Entrance to the industry is much
harder. Yet there is a possibility that new entrance may
come as just a product. For instance, Knorr is well
established soup cube. There may be a new entrance with
the same product to the market.
Social awareness of
products
Social awareness of products is being increasing.
Customers are also information seeking. Therefore the
market is well informed about products. Hence customers
know what is really happening. That is the reason that case
explains about customers going away from meal
replacements and embracing exercising and healthy diets.
Economic situation The economy was under recession in the given time
period. The inflation was rising and Purchasing Power of
customers has been decreasing. Thus the sales of the
products will be affected. Household items will not be
affected as those are daily consumed produces. However
personal care products would be affected by this recession.
Thus the company has to prepare for facing this challenge
and to overcome it.
Refer appendices C for more factors.
21
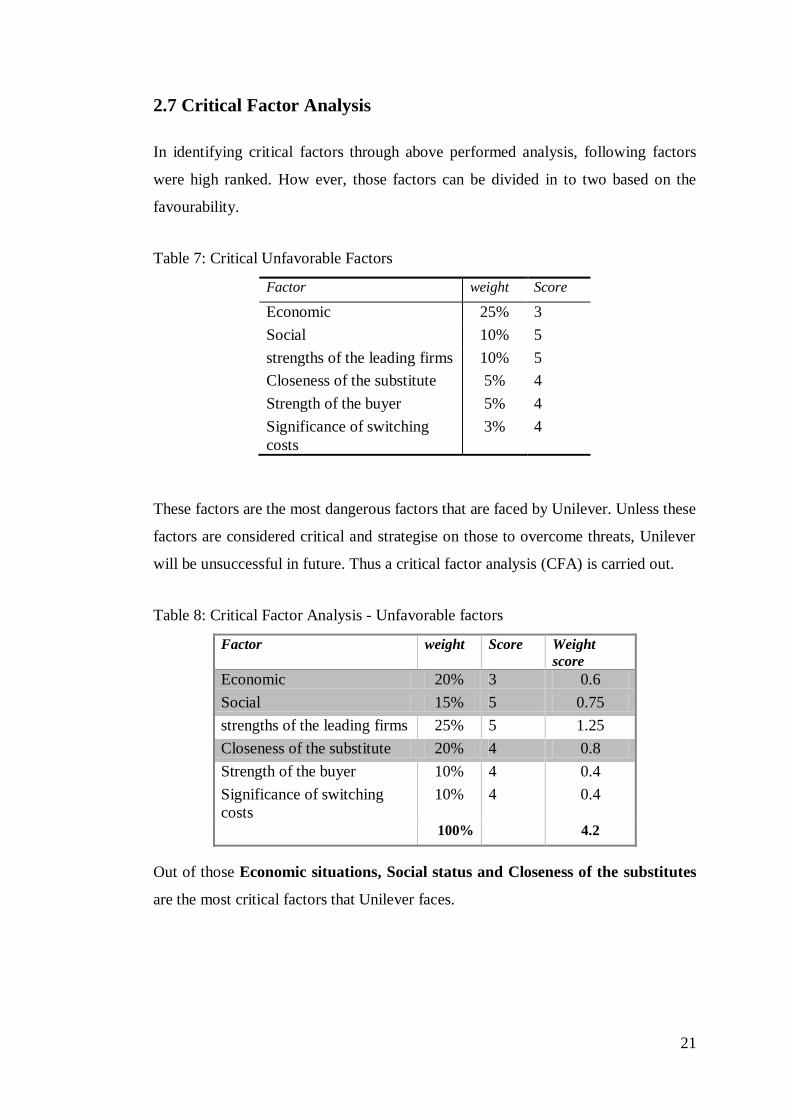
2.7 Critical Factor Analysis
In identifying critical factors through above performed analysis, following factors
were high ranked. How ever, those factors can be divided in to two based on the
favourability.
Table 7: Critical Unfavorable Factors
Factor weight Score
Economic 25% 3
Social 10% 5
strengths of the leading firms 10% 5
Closeness of the substitute 5% 4
Strength of the buyer 5% 4
Significance of switching
costs
3% 4
These factors are the most dangerous factors that are faced by Unilever. Unless these
factors are considered critical and strategise on those to overcome threats, Unilever
will be unsuccessful in future. Thus a critical factor analysis (CFA) is carried out.
Table 8: Critical Factor Analysis - Unfavorable factors
Factor weight Score Weight
score
Economic 20% 3 0.6
Social 15% 5 0.75
strengths of the leading firms 25% 5 1.25
Closeness of the substitute 20% 4 0.8
Strength of the buyer 10% 4 0.4
Significance of switching
costs
10% 4 0.4
100% 4.2
Out of those Economic situations, Social status and Closeness of the substitutes
are the most critical factors that Unilever faces.

22
However there are factors upon which Unilever must capitalize and to gain more
success.
Table 9: Critical Favorable Factors
Factor weight Score
Leadership 20% 4
market trends and discontinuities 15% 5
Physical Resources 15% 5
customer expectations 15% 4
Financial Resources 15% 3
creativity and innovative drive 12% 2
Technical 10% 5
Culture 10% 4
People 9% 4
Entry and operating cost 2% 5
Attractiveness of the market 2% 4
As it is mentioned these must be capitalize in gaining the market, thus a CFA is
carried out.
Table 10: Critical Factor Analysis – Favorable
Factor weight Score Weight
score
Leadership 10% 4 0.4
market trends and
discontinuities
7% 5 0.35
Physical Resources 5% 5 0.25
customer expectations 12% 4 0.48
Financial Resources 9% 3 0.27
creativity and innovative
drive
8% 2 0.16
Technical 7% 5 0.35
Culture 8% 4 0.32
People 12% 4 0.48
Entry and operating cost 10% 5 0.5
Attractiveness of the market 12% 4 0.48
100% 4.04
As a result Leadership, Customer expectations, People and Attractiveness of the
market has been identified as Critical factors. Thus strategies must be laid on
enhancing those strengths and minimizing the threats identified in Table 8.

23
Chapter Three
Reasons Behind Unilever’s Downturn in 2004
24
3.1 Financial
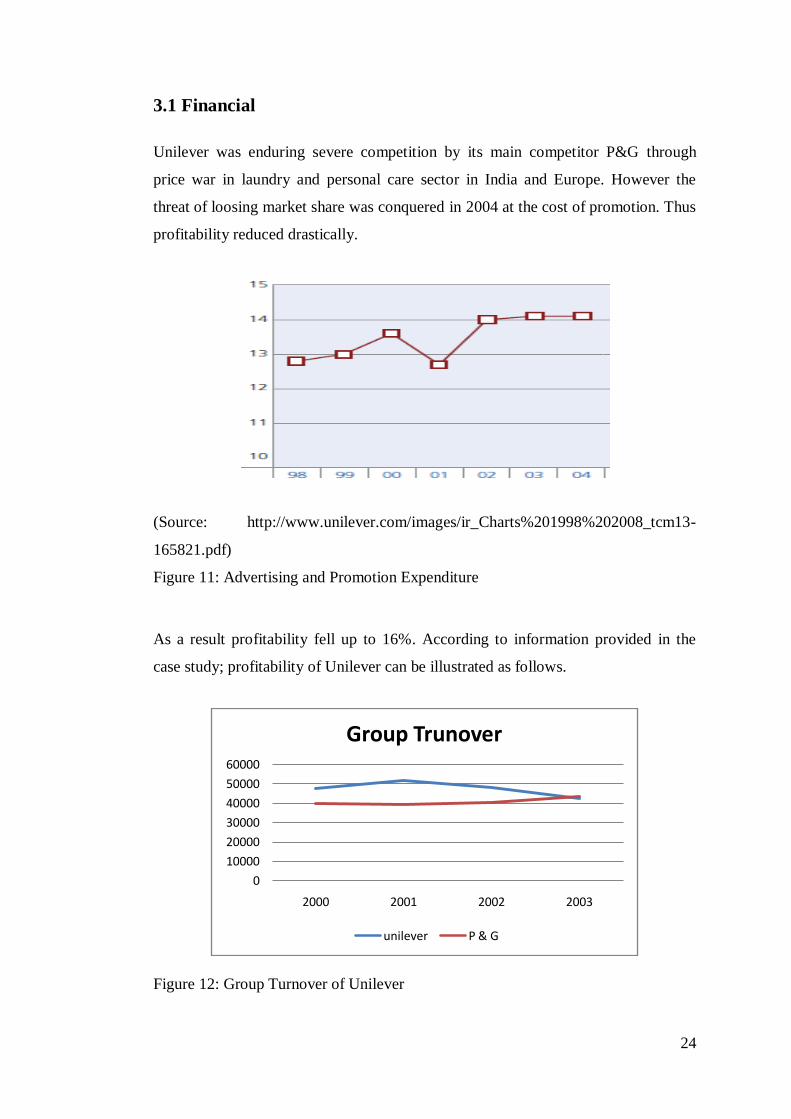
Unilever was enduring severe competition by its main competitor P&G through
price war in laundry and personal care sector in India and Europe. However the
threat of loosing market share was conquered in 2004 at the cost of promotion. Thus
profitability reduced drastically.
(Source: http://www.unilever.com/images/ir_Charts%201998%202008_tcm13-
165821.pdf)
Figure 11: Advertising and Promotion Expenditure
As a result profitability fell up to 16%. According to information provided in the
case study; profitability of Unilever can be illustrated as follows.
Figure 12: Group Turnover of Unilever
0
10000
20000
30000
40000
50000
60000
2000 2001 2002 2003
Group Trunover
unilever P & G

25
Figure 13: Net Profit Growth
Above graphs explains that the Unilever has been performing well, yet the trend
exhibit a reduction of sales. Thus it can be predicted that the sales of 2004 will be
reduced (figures are not given in case study). Following is the real sales drop in
2004.
(Source: http://www.unilever.com/images/ir_Charts%201998%202008_tcm13-
165821.pdf)
Figure 14: Sales Growth & Operating Profit in Unilever - According to Unilever
unilever
P & G0
2000
4000
6000
20002001
20022003
Net Profit Growth
unilever P & G
Sales Growth Operating Profit

26
3.1.1 Cross Trend Analysis
When compared to Unilever with P&G, Unilever is lagging in many areas during
2004. For instance Unilever has experience reduction of total assets, quick ratio,
Current ratio and Asset to sales ratios. Those will be demonstrated in following
graphs.
Figure 15: Total Assets
Figure 16: Quick Ratio
2000 2001 2002 2003
5747252766
4459837968
34366 3438740776 43706
Total Assests
unilever P & G
0.00%
10.00%
20.00%
30.00%
40.00%
50.00%
60.00%
70.00%
80.00%
2000 2001 2002 2003
Quick Ratio
Unilever P&G
27
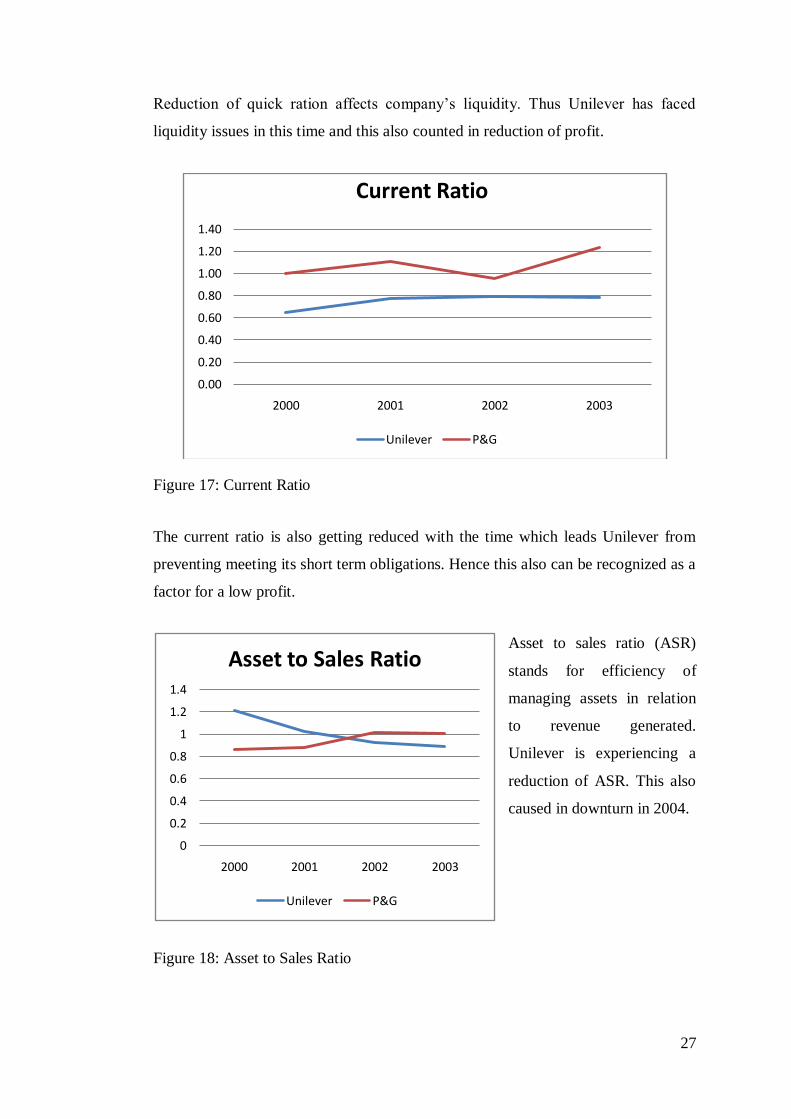
Reduction of quick ration affects company’s liquidity. Thus Unilever has faced
liquidity issues in this time and this also counted in reduction of profit.
Figure 17: Current Ratio
The current ratio is also getting reduced with the time which leads Unilever from
preventing meeting its short term obligations. Hence this also can be recognized as a
factor for a low profit.
Asset to sales ratio (ASR)
stands for efficiency of
managing assets in relation
to revenue generated.
Unilever is experiencing a
reduction of ASR. This also
caused in downturn in 2004.
Figure 18: Asset to Sales Ratio
0.00
0.20
0.40
0.60
0.80
1.00
1.20
1.40
2000 2001 2002 2003
Current Ratio
Unilever P&G
0
0.2
0.4
0.6
0.8
1
1.2
1.4
2000 2001 2002 2003
Asset to Sales Ratio
Unilever P&G

28
Figure 19: ROI and Net Profit Ratios
According to facts provided in the case ROI and Net profit ratio seems to be
mounting, yet when comparing to 2004 figures, the trend is deviating to
unfavourable area.
With the downturn exhibit in Figure 19 and 13;
ROI and Net Profit Ratio gets reduced.
(Source: http://www.unilever.com/images/ir_Charts%201998%202008_tcm13-
165821.pdf)
Figure 20: Profit Margins in Unilever
0
0.02
0.04
0.06
0.08
0.1
0.12
0.14
2000 2001 2002 2003
ROI
Unilever P&G
0.00%
2.00%
4.00%
6.00%
8.00%
10.00%
12.00%
14.00%
2000 2001 2002 2003
Net Profit Ratio
Unilever P&G

29
The following Trend analysis exhibit the increment of ratios in 2003. However all
these figures present unfavorable figures in 2004 with the downturn of Unilever.
Figure 21: Trend Analysis
3.1.2 Analysis on Shares
Unilever was experiencing dramatic reduction in
market capitalization. This was mainly because of
the reduction of the return on shares in the
market.
All ratios are available in the Appendix C.
(Source: http://www.unilever.com/images/ir_Charts%201998%202008_tcm13-
165821.pdf)
Figure 22: Market Capitalization
0.00%10.00%20.00%30.00%40.00%50.00%60.00%70.00%80.00%
Equity Ratio Acid Test Ratio
Debt Ratio Return on Common
Equity
Return on Equity
Trend Analysis(2002 & 2003)
2002 2003

30
(Source: http://www.unilever.com/images/ir_Charts%201998%202008_tcm13-
165821.pdf)
Figure 23: Total Shareholder Return
The downturn of returns from 2003 to 2003 caused the reduction of shares in the
market
(Source: http://www.unilever.com/investorrelations/share_price/default.aspx)
Figure 24: Reduction of Shares in the Market
Thus the share base of Unilever affected in 2004, this could be considered as one of
the main factors that geared the downturn in Unilever in 2004.
31
3.2 Non-Financial
The portfolio of Unilever comprise with 1600 brands which couldn’t be handled
efficiently. This itself adds cost to company. However in identifying this
inefficiency, Unilever reduced its brand portfolio to 400. This conversation cost and
customer attitude on this reduction may affect its sales. This was backed by the case
as it mentions that the “Unilever is boxed itself with too many targets” which cold
cause 0% growth instead of anticipated 3%. Thus an initial change was needed.
Another factor that caused inefficiency and losses is the structure inherited. Mr.
FitzGerald also accepts that the strategy was not delivered due to unwieldy structure.
Simultaneously, the cost of structure was also a burden. Dual chairmanship and high
number of senior managers also a burden to Unilever.
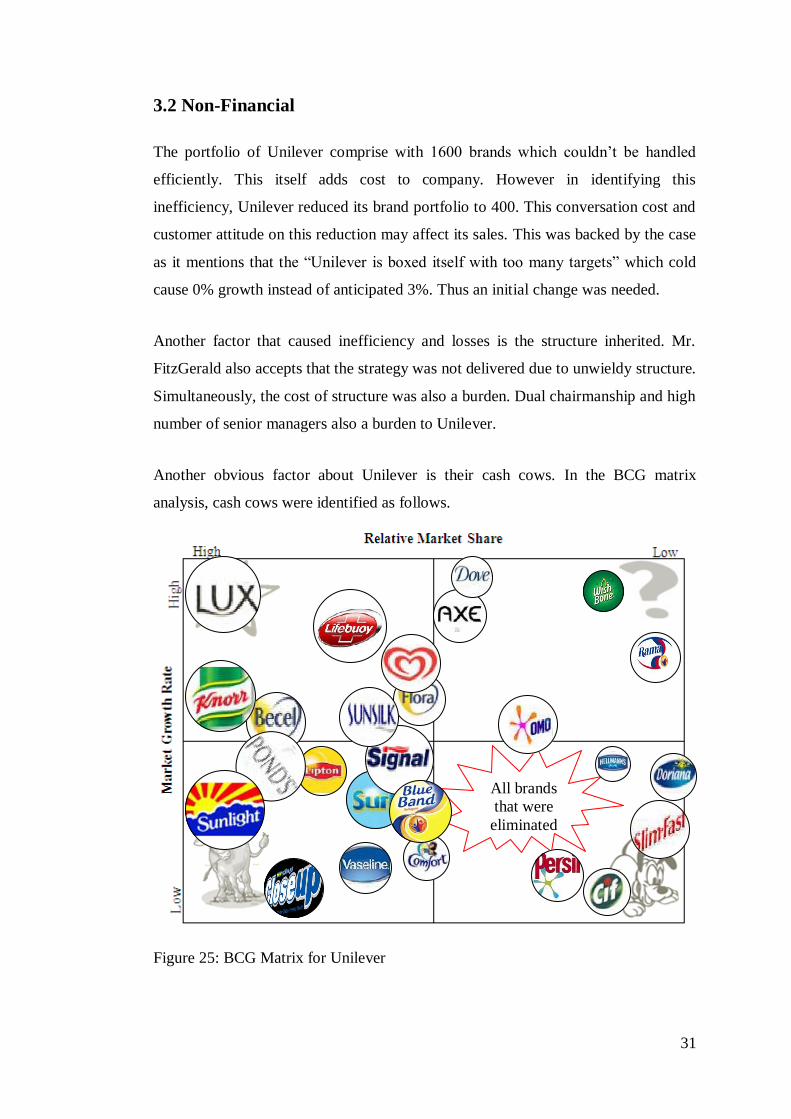
Another obvious factor about Unilever is their cash cows. In the BCG matrix
analysis, cash cows were identified as follows.
Figure 25: BCG Matrix for Unilever
All brands
that were
eliminated
32
Those brands are of importance for the identification of the brand by customers and
it makes money too. However cash-cows consume some additional cost and
reducing profit margins due to not-expanding. This was one of the main causes for
the downturn in 2004. Moreover, by that time Unilever possessed about 1200 dogs.
Those were also a burden to company which counted in 2004 downturn.
In GE matrix (Figure 8) there were some brands which have less attractiveness and
less business strengths. Continuing those brands with less return is completely
burden to Unilever. (e.g.: Cif)
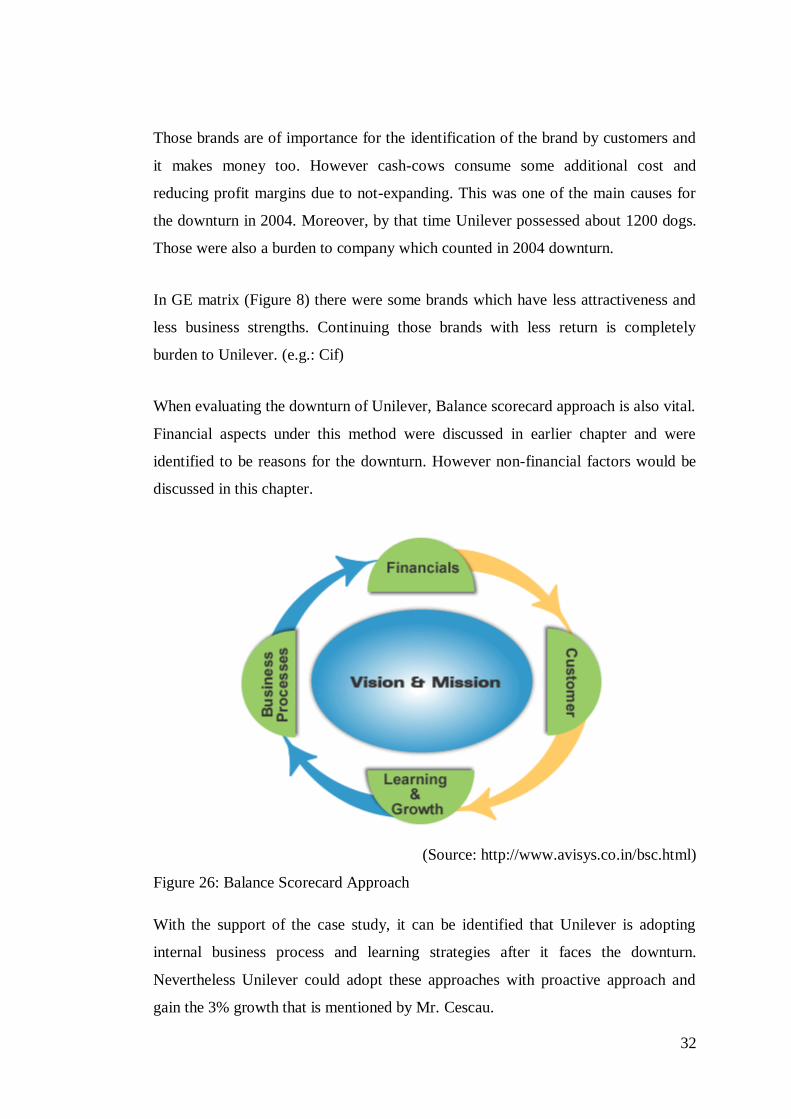
When evaluating the downturn of Unilever, Balance scorecard approach is also vital.
Financial aspects under this method were discussed in earlier chapter and were
identified to be reasons for the downturn. However non-financial factors would be
discussed in this chapter.
(Source: http://www.avisys.co.in/bsc.html)
Figure 26: Balance Scorecard Approach
With the support of the case study, it can be identified that Unilever is adopting
internal business process and learning strategies after it faces the downturn.
Nevertheless Unilever could adopt these approaches with proactive approach and
gain the 3% growth that is mentioned by Mr. Cescau.

33
Unilever is a worldwide organization that integrates the functions to one value added
process. In meeting customer needs, Unilever tends to follow both international and
local operations that would lead to better progress. This way Unilever could achieve
both local and international values. Creation of value is the path to growth where all
Unilever brands were treated in terms of productivity and operations. However the
application of this was not present prior to 2004. And also the supply chain can be
narrowed down in order to achieve more growth.
(Source: http://www.provenmodels.com/26/value-chain-analysis/michael-e.-porter)
Figure 27: Value Chain Analysis

34
Chapter Four
Strategic Moves in Capturing Consumer Markets

35
4.1Unilever
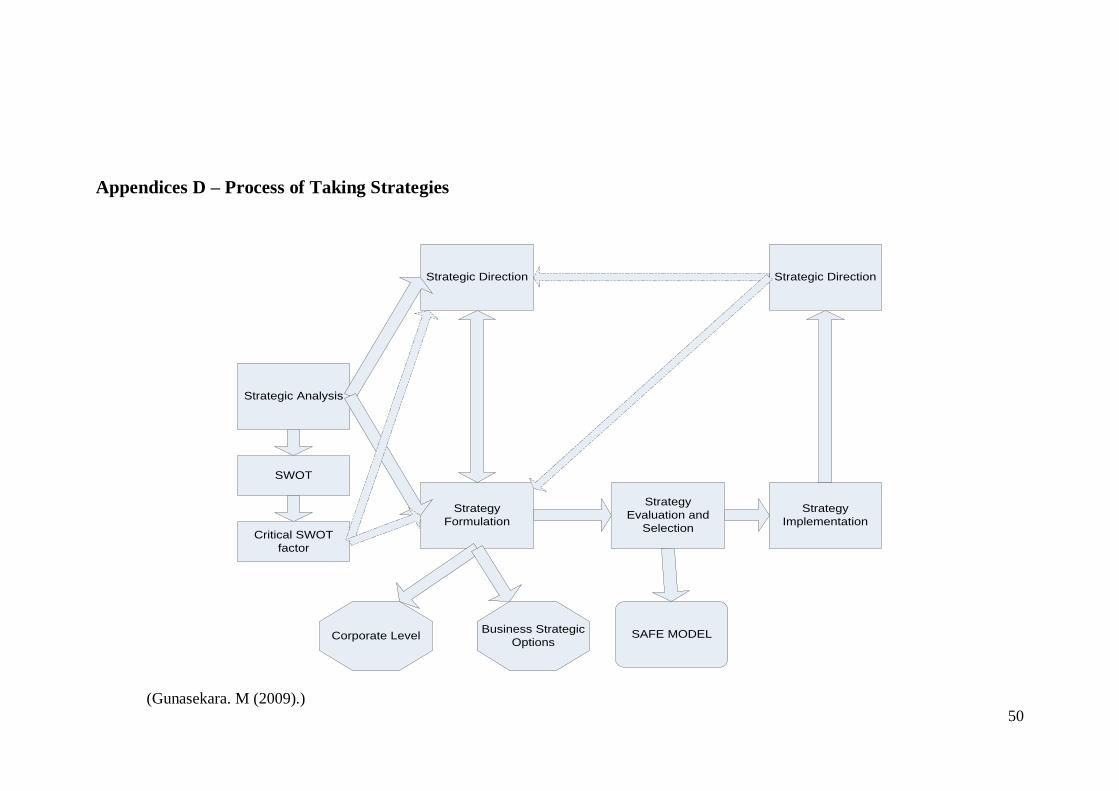
Since Unilever experienced downturn in 2004, company took measures for gaining
its position back. After going through evaluation process (appendix D) Unilever has
revolutionized many of its strategies.
Table 11: Strategies used by Unilever
UNILEVER
Strategy Description
Refocusing on Main
200 Brands
When realized that being too broad is costly, Unilever
decides to focus on the core brands which accounted for
90% of its sales. This is wise as the expenditure on other
1000 brands is a waste due to fewer returns. However due
to this change more advertising could be done on main
brands and could be gain high profits and margins
Dropping 1000 poor
performing brands
This is a decision of vast importance that a company would
rarely take. The decision leads to save a lot of money that
were spent on gaining 10% of total revenue. However this
may bring in some black point to Unilever.
Acquisition of
BestFood
Unilever's Main focus was to narrow down its brands, at a
glance, the acquisition of Bestfoods seems like expanding.
However motive behind this actuation is not to expand but
to welcome some well-known brands such as Hellmann’s
and Ragu. The acquisition maintains the narrow focus of
Unilever and strengthen brand portfolio. This merger did
not open markets to Unilever as these markets were the
markets that were Unilever operating in. but many tax
advantages could be gained through this.

36
Closing down North
American factory
Using the money gained from closing down these factories,
plant facilities of Asia and Lathing America could be
increased where sales are maximum. This was very
effective as it is identified earlier Unilever had less assets
and reduced liquidity at this time.
Merger of two parent
companies
Even though both parent companies act alike, those were
two different companies. Thus issues arise. Strategies were
also hampered in delivering as the structure was improper.
Thus this merger would reduce structural issues.
Replacement of dual
chairmanship
Dual chairmanship is also an issue as decision makings is
some wt difficult. Moreover it’s costly to Unilever. Thus it
will be replaced by a chief chairman and a non-executive
chairman who would be more convenient for decision
making.
While these strategies were adopted by Unilever, P&G is also adhering for some
strategies.
The strategies of P&G were adopted by carrying out its SWOT analysis (Appendix
E). Those strategies are shown below.
37
4.2 Proctor and Gamble
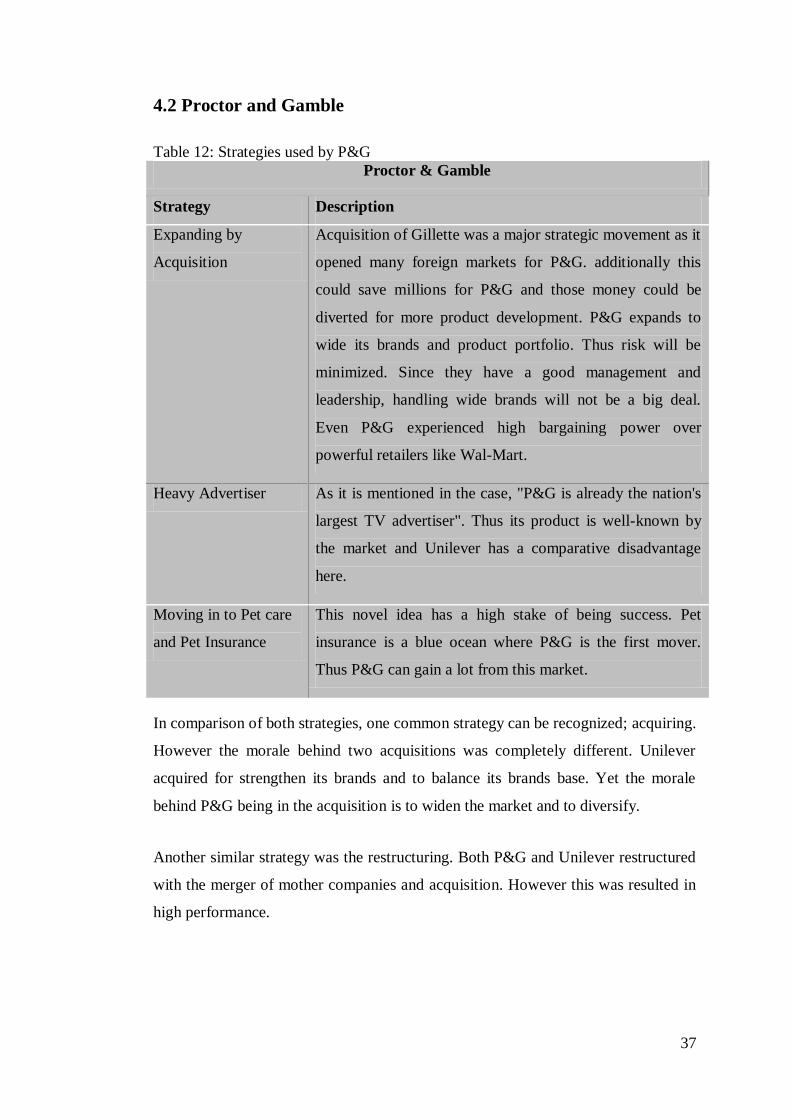
Table 12: Strategies used by P&G
Proctor & Gamble
Strategy Description
Expanding by
Acquisition
Acquisition of Gillette was a major strategic movement as it
opened many foreign markets for P&G. additionally this
could save millions for P&G and those money could be
diverted for more product development. P&G expands to
wide its brands and product portfolio. Thus risk will be
minimized. Since they have a good management and
leadership, handling wide brands will not be a big deal.
Even P&G experienced high bargaining power over
powerful retailers like Wal-Mart.
Heavy Advertiser As it is mentioned in the case, "P&G is already the nation's
largest TV advertiser". Thus its product is well-known by
the market and Unilever has a comparative disadvantage
here.
Moving in to Pet care
and Pet Insurance
This novel idea has a high stake of being success. Pet
insurance is a blue ocean where P&G is the first mover.
Thus P&G can gain a lot from this market.
In comparison of both strategies, one common strategy can be recognized; acquiring.
However the morale behind two acquisitions was completely different. Unilever
acquired for strengthen its brands and to balance its brands base. Yet the morale
behind P&G being in the acquisition is to widen the market and to diversify.
Another similar strategy was the restructuring. Both P&G and Unilever restructured
with the merger of mother companies and acquisition. However this was resulted in
high performance.

38
One of the other factors used by Unilever is to reduce brands where as P&G tends to
increase its day by day. Although these strategies are contradictory, it works well in
both organizations, basically due to strong leadership.

39
Chapter Five
Motives Behind Acquisition of Gillette
40
5.1 Motives of Acquisition of Gillette
The historical acquisition was announced in 2005 which is worth of US$ 57 Billion
to P&G. Since both companies operate in similar cultures, the acquisition was called
a perfect fit, which will create the world’s greatest consumer product company and
the greatest acquisition.
According to Mr. Egan-Joans, the main advantage over the acquisition was the
better bargaining power with retailers for shelves and gets competitive prices for
those. However the rise of the competitiveness is also a primary motive as it adds
competitive advantage that can hardly be copied. However merge of world’s largest
products would instantly brings in negotiating power with its retailers.
Another motive was to be cost effective which could be ultimately directed to the
growth of the brands of P&G. Through reduction of jobs, eliminating management
overlaps and all other modifications $14-$16 billion saving is expected which would
be redirected to advertising and all other necessary expense.
The power of P&G would be increased due to the acquisition that results in
elimination of competitors in the market. Upon the acquisition, Unilever was heavily
attacked by P&G. However P&G out beat Unilever by recording $7 billion profit.
This is one of the motives that P&G enclosed in acquisition. Similarly P&G had
access to worldwide distribution system with the new acquisition. This can be
identified as the major implication of the acquisition.
Further gaining supreme corporate image and less broadcasting cost are considered
as secondary motives of the acquisition. Moreover the integrated product lines could
attain higher number of customers that resulted in higher profits. However many
benefits of the acquisition can be identified those affect positively in both short and
long term.
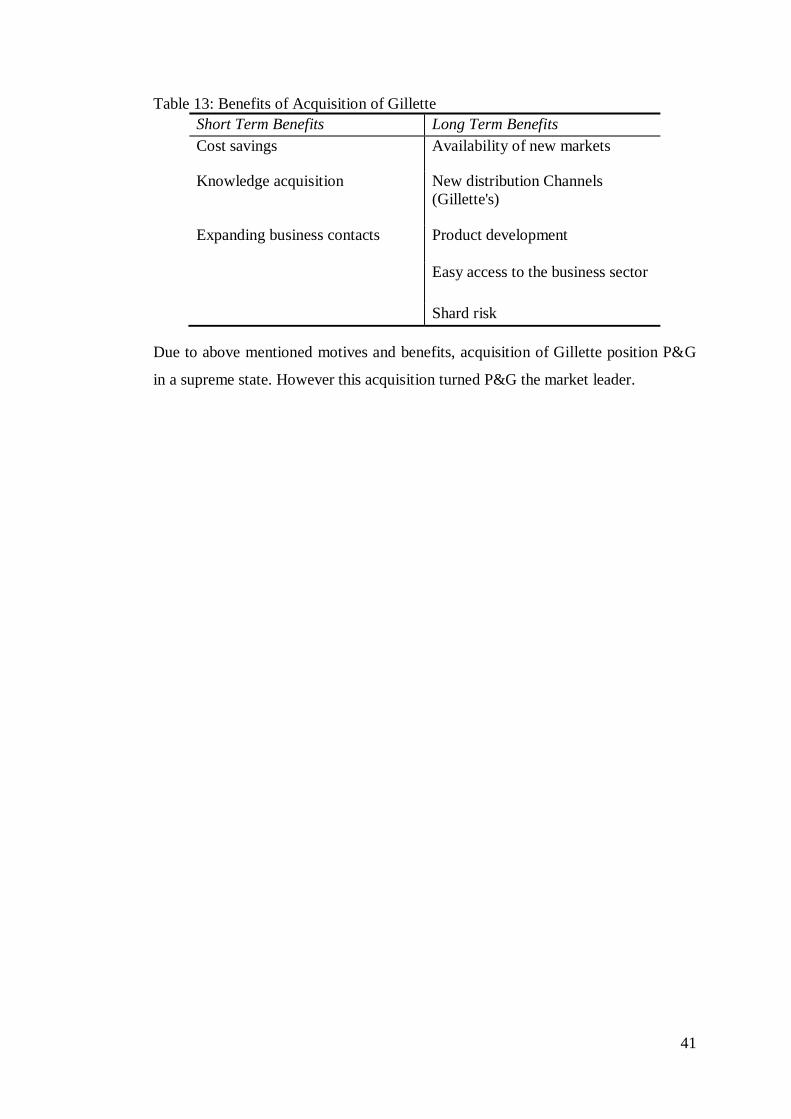
41
Table 13: Benefits of Acquisition of Gillette
Short Term Benefits Long Term Benefits
Cost savings Availability of new markets
Knowledge acquisition New distribution Channels
(Gillette's)
Expanding business contacts Product development
Easy access to the business sector
Shard risk
Due to above mentioned motives and benefits, acquisition of Gillette position P&G
in a supreme state. However this acquisition turned P&G the market leader.
42
Chapter 06
Evaluate Future of Unilever

43
6.0 Evaluate Future of Unilever
The future vision of the Unilever is based on corporate purpose that includes desire
for sustainable, profitable growth and long term value creation for stake holders.
However Unilever expects to achieve its corporate strategy through “Path to growth
programme” which focuses on natural flexibility, allocating resources and increase
margins through restructuring.
As a result of the new strategy, Unilever make huge changes on its product portfolio
by reducing it to 200 from 1000. Meanwhile Unilever goes for an Acquisition with
Bestfoods introducing new attractive brands such as Hellmann’s and Ragu. Thus the
new product portfolio is made of lot of cash cows and stars.
Thus shrank product portfolio would provide spare resources to exploit opportunities
and further creation of value. However the shrank product portfolio has cut down
huge unnecessary advertising cost which could be used for narrowing down the
supply chain. However Unilever experienced dramatic reduction of share prices in
2004. Though Unilever couldn’t out beat P&G, it could be in its track again with the
Path to Growth Programme.
The conversion of slim-fast to low-fat meals was a failure at the beginning. However
it could be converted in to success with the shifting meal side of slim-fast to slim-
fast-ice-cream. This strategic decision based on successful identification of the
market would ensure the survival and growth of Unilever in future.
In developing Unilever, the main attention was given to set clear business principles,
simplify organization, to reduce the number of targets and to be competitive in the
market. To be inline with this strategy, Unilever has taken actions such as merging
the parent companies and reduce the repetition of management and operational level
employees which increase the efficiency, reduction of cost and lead to success.
Unilever will face several risks and issues which are similar to the risks faced in the
past. Therefore the strategic management strategies of Unilever should be strong
enough to fight against the risks. However as the conclusion it can be stated that the
44
current strategy of Unilever can be implemented in a way that the company can
achieve more profits.

45
8.0 Referencing and Bibliography
Anon (2004). World Economic Situation and Prospects 2004.: United Nations.
Available from:< http://www.un.org/esa/policy/wess/wesp2004.pdf>[Accessed
10/10/2009].
Avisys solutions [online]. (2006). Available from:
<http://www.avisys.co.in/bsc.html>[Accessed 12/10/2009]
Businessballs [online]. (2009). Available from:
<http://www.businessballs.com/portersfiveforcesdiagram.pdf>. [Accessed
19/10/2009]
Gunasekara. M (2009). "Strategic Management", lecture notes distributed in the
topic BLB10089-3 STRM. APIIT, Colombo, Srilanka on 11/09/2009.
Gunasekara. M (2009). "Strategic Management", lecture notes distributed in the
topic BLB10089-3 STRM. APIIT, Colombo, Srilanka on 13/10/2009.
Luther K.R (2004). Political Parties in the World in 2004; Australia. KEPRU
[online]. 21, , Available from:
<http://www.keele.ac.uk/depts/spire/research/KEPRU/Working_Papers/KEPRUPap
er21.pdf>[Accessed 12/10/2009 ]
provenmodels [online]. (2009). Available from:
<http://www.provenmodels.com/26/value-chain-analysis/michael-e.-
porter>[Accessed 13/10/2009]
Schuelke R.W (2004). World Economic News [online Available from:
<http://www.sonic.net/~schuelke/The_Global_Economy_2004.html>]. [Accessed
18/10/2009]
tuuletin (2005). Marketing opportunities in digital media [online].. Available from:
<http://www.gaumina.lt/tuuletin/index.php?id=7>[Accessed 20/10/2009]
Unilever (2008). Adding Vitality to Life. Unilever [online], ,Available from:
<http://www.unilever.com/images/ir_Charts 1998 2008_tcm13-
165821.pdf>[Accessed 15/10/2009 ]
Unilever [online]. (2009). Available from:
<http://www.unilever.com/investorrelations/share_price/default.aspx>[Accessed
25/10/2009]
Wheelen. T.L, Hunger J.D, Rangarajan K (eds). (2008). Strategic management and
business policy. DeIhi, India: Dorling Kindersly (India) Pvt. Ltd.

46
9.0 Appendices
Appendices A – Porter’s Five Forces in Different Angel
(Gunasekara. M (2009).)

47
Appendices B – Other SWOT factors of Unilever
Strengths Weaknesses Opportunities Threats
Goodwill of the
company
structural weakness need for healthy
products
Legal constrains
expanded product
lines
product expunction new entrance
operating around
the world
reduction in R&D Competitive prices
introduction of
innovative products
less control over
market
several threats
from external
environment

48
Appendices C – Ratio Analysis
€1 = 1.5$ Unilever P&G
2003 2002 2001 2000 2003 2002 2001 2000
ROI 0.132191 0.089015 0.056845 0.03621 0.118656 0.106729 0.084974 0.103157
Net Profit Ratio 6.47% 4.43% 3.26% 2.22% 12.61% 11.96% 10.82% 7.45%
Quick Ratio 0.522783 0.572711 0.531406 0.458292 0.748503 0.528652 0.553423 0.444729
Current Ratio 0.784878 0.791137 0.774642 0.649415 1.231591 0.957651 1.106493 1.000493
Total Assets to Sales 0.889326 0.923928 1.024498 1.207852 1.007585 1.01337 0.876236 0.860204

49
Ratio Analysis Continued
Unilever
2002 2003
Equity Ratio 14.45% 16.75%
Acid Test Ratio 0.56 0.54
Days Sales Uncollected 62.24 50.27
Debt Ratio 0.72 0.69
Return on Common
Equity 20.86% 26.24%
Return on Equity 0.36 0.466
0
20
40
60
80
2002 2003
Days Sales Uncollected
Days Sales Uncollected
50
Appendices D – Process of Taking Strategies
Strategic Analysis
SWOT
Critical SWOT
factor
Strategic Direction
Strategy
Formulation
Strategic Direction
Strategy
Evaluation and
Selection
Strategy
Implementation
Corporate LevelBusiness Strategic
OptionsSAFE MODEL
(Gunasekara. M (2009).)

51
Appendices E - SWOT for P&G
Strengths Weaknesses Opportunities Threats
Large Scale of
operation
Less customer
focus
Developing
markets
Uncertainty in
Pharmaceuticals
Strong Branding Lack in
performance in
Clairol business.
Acquisition of
Gillette
Increase in the
price of Raw
material
Product Innovation Novel Products High competition
Developing market
infrastructure