management report of fund performance - covington … · this annual management report of fund...
TRANSCRIPT

For The Year Ended July 31, 2009
Management Report of Fund Performance
Covington Venture Fund Inc.Series IV

M RFP for th e Year En ded July 31, 2009
Table of Contents ...................................................................................................................................................................................................................... 1Investment Objective and Strategies ..................................................................................................................................................................................... 2Risk Factors ................................................................................................................................................................................................................................. 2Results of Operations................................................................................................................................................................................................................ 2Recent Developments .......................................................................................................................................................................................................... 3 - 4Financial Highlights ............................................................................................................................................................................................................. 5 - 7Past Performance ................................................................................................................................................................................................................ 7 - 8Summary of Investment Portfolio .......................................................................................................................................................................................... 8Notes ..........................................................................................................................................................................................................................................................................9 - 10Corporate Information ............................................................................................................................................................................................. Back Cover
This annual management report of fund performance contains financial highlights but does not contain the complete annual financial statements of the Covington Venture Fund Inc., Series IV (the “Fund”). You can get a copy of the annual financial statements at your request, and at no cost, by calling 1-866-244-4714, by writing to us at Covington Capital Corporation, 200 Front St. West, Suite 3003, Toronto, Ontario M5V 3K2 or by visiting our website at www.covingtonfunds.com or on SEDAR www.sedar.com.
Shareholders may also contact us using one of these methods to request a copy of the Fund’s proxy voting polices and procedures or proxy voting disclosure record.
1
Table of ConTenTs
Covi ngton Venture Fun d Inc.
M RFP for th e Year En ded July 31, 2009
Covi ngton Venture Fun d Inc.
2
Class a sHaRes, seRI es IV
[in $000’s except for per share amounts, number of shares and percentages]
INVESTMENT OBJECTIVE AND STRATEGIES
The Fund combines the tax benefits of a Labour Sponsored Investment Fund (“LSIF”) while giving investors access to the venture capital market.
The investment objectives of the Fund are to realize long-term capital appreciation by investing in securities of community small business investment fund corporations (“CSBIFs”), which in turn will make eligible investments in start-up and early stage businesses whose focus is internet and e-commerce related; and to provide 100% capital protection by returning to investors an amount equal to the subscription price paid on or about February 28, 2010.
The Fund is now in its ninth year of operations (including its predecessor fund). Some of the portfolio investments including the CSBIFs have matured from start up to the mature stages of their growth cycle. As such, the CSBIFs have been wound up into the Fund.
RISK FACTORS
The private equity nature and longer-term hold periods required by LSIF investing means the Fund remains a suitable option for investors with long-term investment focus and high tolerance for risk.
The process of valuing venture investments for which no published market exists is subject to inherent uncertainties and the resulting values may differ from values which would have been ascribed had a ready market existed for those investments. This is valuation risk as described in the Fund’s financial statements. Other risks associated with the Fund are market risk (which includes currency risk and interest rate risk), liquidity risk, and credit risk.
A significant component of the Fund is held in a zero-coupon bond issue. Bond valuations are subject to credit and interest rate risks relating to both the issuer and overall market conditions. In these uncertain credit markets, valuation of these bonds may become more volatile.
Investors who purchase LSIFs are required to hold their investment for eight years in order to retain the tax credit offered by the provincial and federal governments. The Fund was launched in 2000 and therefore, the eight year hold period for the initial investors expired in 2008. If all shareholders were to redeem their shares at the same time, the Fund may need to liquidate investments at lower values than currently ascribed and shareholders may not receive the posted Net Asset Value (“NAV”). In any financial year the Fund is not obligated to redeem greater than 20% of the net asset value of the Fund.
The Fund was closed to new capital after the 2000 RSP season, as such; the Fund is dependent upon internal growth of its portfolio in order to meet its investment objectives. Liquidity for investors in the Fund is also limited to redemption of the Class A shares through brokers and planners.
RESULTS OF OPERATIONS
The Fund’s one year return as at July 31, 2009 was 2.55% which is well head of the Retail Venture Capital Index of -15.1%. The Fund’s NAV per share as at July 31, 2009 was $15.69 placing the Fund well on track to meet its February 2010 capital protection objective. Net assets as of July 31, 2009 were $10,164 representing a decline of $4,182 from last year’s closing net assets of $14,346. The predecessor fund to this Series was launched in 2000 and was closed to new subscriptions after February 2000. The eight-year hold period on the original units expired during the 2008 RSP season. There have been $4,485 in redemptions during the 2009 fiscal year compared to $16,512 in the prior year. Marketable securities declined to $4,964 which is down from last year’s balance of $11,335 by $6,371. The cash was used to fund operations, redemptions and a new investment.
In July 2009, the Fund invested $2,774 in WireIE Holdings International Inc. WireIE is a leader in providing professional services and innovative solutions for the wireless network operator. On the venture portfolio side, another notable event was the completion of the CSBIF windup. This wind up was accomplished through a series of capital returns and dividends to the Fund from each of the CSBIFs. In addition, this windup along with new investing has increased the Fund’s portfolio turnover rate from zero in the prior year to 85.7% in 2009. A portfolio turnover rate of 100% is equivalent to the Fund buying and selling all of the securities in its portfolio once in the course of the period.

M RFP for th e Year En ded July 31, 2009
Covi ngton Venture Fun d Inc.
3
Class a sHaRes, seRI es IV
[in $000’s except for per share amounts, number of shares and percentages]
RESULTS OF OPERATIONS Continued
On the operations side, income from investments has declined due to sale of marketable securities in order to fund redemptions. Overall, expenses have declined substantially from the same period in 2008 by approximately $3,207 relating entirely to a contingent incentive participation amount payable (“IPA”) to the Manager based on realized gains and cumulative performance of the Fund which was accrued in 2008 but has not materialized to the same magnitude in 2009. The IPA is based on the cumulative performance of the Fund since inception of the predecessor Fund which was launched in 2000. The Manager, having met the criteria as described in the initial prospectus dated 2000 has recognized expenses of $2,677 for contingent IPA in 2008 based on the success of the underlying CSBIF’s investment in PlateSpin Limited. The Fund invested in three CSBIFs which in turn were invested in a number of portfolio companies. During the prior year, these CSBIFs have exited from their entire portfolio. Most notably, Parteq Internet Ventures Fund Inc. (“Parteq”) and The University of Western Ontario Internet Ventures Fund Inc. (“UWO”) held investments in PlateSpin Ltd. In March 2008, all of the shares of PlateSpin were purchased by Novell, Inc. in an all cash deal worth $205Million USD. By July 31, 2009, all but $169 has been paid in accordance with the IPA terms. The remaining funds are subject to the Fund meeting the requirements which are expected to be met within the 2010 fiscal year.
The Fund’s MER is 6.42%, which has decreased from the prior year. This decline is again due to the decrease in contingent IPA expense booked in the current year.
RECENT DEVELOPMENTS
CSBIF Wind Up
The Fund has completed the wind-up of its three CSBIF investments : UWO, Parteq and Innovations Foundation Internet Ventures Fund Inc. (“Innovations”). The culmination of investing activities in fiscal 2008 has seen all of the CSBIF requirements for these holdings met. Each CSBIF was wholly-owned by the Fund and as such, the remaining cash added to the liquid assets of the Fund as of December 31, 2008.
Adoption of New Accounting Standards
The Canadian Institute of Chartered Accountants (“CICA”) issued Section 3862 “Financial Instruments – Disclosures” and Section 3863 “Financial Instruments – Presentation” in place of Section 3861 “Financial Instruments – Disclosure and Presentation”, Sections 3862 and 3863 became effective for interim and annual financial statements relating to fiscal years beginning on or after October 1, 2007 and hence, have been adopted by the Fund beginning this current reporting period. These sections establish standards for disclosure of financial instruments and the nature and extent of risks arising from financial instruments to which the Fund is exposed to during the reporting period. Adoption of the new accounting standards had no impact on valuation polices, nor the way the Fund’s Net Assets were calculated.
The Fund has adopted CICA Section 1535 “Capital Disclosures”, which requires an entity to disclose its objectives, policies, and processes for managing capital, as well as quantitative data about capital. This section requires additional disclosure but does not impact financial results.
Effective January 20, 2009, the Fund adopted EIC 173 “Credit Risk and Fair Value of Financial Assets and Financial Liabilities”. The abstract clarifies how the Fund’s own credit risk and the credit risk of the counterparty should be taken into account in determining the fair value of the financial assets and financial liabilities. The new guidance did not have a material impact on the financial position or results of operations of the Fund.

M RFP for th e Year En ded July 31, 2009
Covi ngton Venture Fun d Inc.
Class a sHaRes, seRI es IV
[in $000’s except for per share amounts, number of shares and percentages]
4
RECENT DEVELOPMENTS Continued
Future Accounting Standards
The Canadian Accounting Standards Board confirmed that effective January 1, 2011, International Financial Reporting Standards (“IFRS”) will replace Canadian GAAP for publicly accountable enterprises, which includes investment funds. IFRS will apply to fiscal years beginning on or after January 1, 2011.
The Manager has commenced the development of a changeover plan in order to report under IFRS for the Fund’s year ended July 31, 2012. The key elements of the plan include:
• Timing – the Fund will adopt IFRS beginning August 1, 2011 with the first financial statements under IFRS to be released for the semi-annual period ending January 31, 2012.
• Accounting policies- the Manager is currently reviewing differences between the current accounting policies of the Fund and IFRS standards. IFRS allows for accounting policy choices upon first time implementation. The Manager is reviewing these options to determine the appropriate choices, implementation decisions and related impacts, if any to the Fund.
• Disclosure – the Manager is reviewing disclosure requirements under IFRS and expects the implementation of IFRS to result in additional disclosures in the notes to the financial statements and potentially different presentation of certain financial statement items.
• Operations – Management is assessing which operations of the Fund will be affected by the adoption of IFRS including current reporting and back office systems.
• Impact on net asset value – the Manager has determined that there is no expected impact on net asset value for pricing of purchases and redemptions anticipated as a result of transition to IFRS. This determination may change if new standards are issued or of interpretations of existing standards are revised.
Progress on the changeover plan will be reported in subsequent interim and annual financial statements until the adoption of IFRS is complete.
Change of Control of the Manager
On July 2, 2009, Covington Capital Corporation (“Covington”) the Manager of the Fund, was acquired by RC Capital Management Inc. (“RC Capital”). RC Capital purchased all of the issued and outstanding securities of the Manager, which was previously wholly owned by AMG Canada Corp. The transaction constituted a change of control of Covington which is the manager and/or investment advisor of Covington Fund II Inc., Covington Strategic Capital Fund Inc., Covington Venture Fund Inc., and New Generation Biotech (Equity) Fund Inc.
RC Capital does not anticipate any changes to the day-to-day operations of the Funds. The investment style, objectives and strategy used by the investment advisor to approve the investments made on behalf of the Funds will remain unaffected, as will the investment professionals responsible for managing the investments held by Funds once they are made.
RC Capital is owned 50% by a trust of which Philip R. Reddon is the sole trustee, and 50% by a trust of which Scott D. Clark is the sole trustee. Philip R. Reddon and Scott D. Clark each have extensive experience providing management and investment management services to the Funds and have been officers and/or directors of both Covington and the Funds for a number of years.
Ontario Sales Tax Harmonization
In June 2009, the Ontario Government proposed a comprehensive package of tax changes involving most significantly, a single value-added sales tax. If approved, this tax would come into effect July 1, 2010. Ontario’s 8% Retail Sales Tax (RST) would be replaced by a single value-added sales tax combined with the 5% federal Goods and Services Tax (GST). The tax would be federally administered and would use the same tax base and structure as the GST.
This harmonized tax will be applied at the rate of 13% and will impact the management and operating services used by the Fund. Currently, the Fund pays 5% GST in services it consumes. Post harmonization, the management expense ratio (“MER”) of the fund will increase by 8% as the Fund becomes subject to the combined tax rate of 13%. For example, if a Fund’s MER was 10% under the current taxation rules, it would be 10.8% after harmonization takes affect July 1, 2010.

M RFP for th e Year En ded July 31, 2009
Covi ngton Venture Fun d Inc.
5
Class a sHaRes, seRI es IV
[in $000’s except for per share amounts, number of shares and percentages]
FINANCIAL HIGHLIGHTS
The following tables show selected key financial information about the Fund and are intended to help you understand the Fund’s financial performance. This information is derived from the Funds’ audited annual financial statements.
All references to “net assets” or “net assets per share” are determined in accordance with Canadian GAAP as presented in the audited financial statements of the Fund. All references to “net asset value” or “ net asset value per shares” are determined in accordance with the net asset value calculated for pricing purposes.
FUND’S NET ASSETS PER SHARE
Ten- Year Year Year Period month ended ended ended ended period July 31, July 31, July 31, July 31, ended 2009 2008 2007 2006 (3) July 31, 2005
Net assets, beginning of year (1) (2) $ 15.30 $ 11.54 $ 9.78 $ 9.92 $ 9.62Increase (decrease) from operations: Total revenue 4.11 10.85 0.52 0.30 0.38Total expenses (0.99) (2.35) (0.57) (0.27) (0.35)Realized and unrealized gain (loss) on investments (2.74) (5.09) 1.82 (0.17) 0.10Total increase (decrease) from operations (2) 0.38 3.41 1.77 (0.14) 0.13Net assets, end of year (1) (2) $ 15.69 $ 15.30 $ 11.55 $ 9.78 $ 9.75
(1) This information is derived from the Fund’s audited annual financial statements. The net assets per security presented in the financial statements differs from the asset value calculated for fund pricing purposes. On August 1, 2007, the Fund adopted CICA section 3855 on a retrospective basis without restatement of prior periods. As such, the beginning balance of net assets per share for the year ended July 31, 2008 may not equal the closing balance on July 31, 2007.
(2) Net assets are based on the actual number of shares outstanding as at the stated year-end. The increase/(decrease) from operations is based on the weighted average number of shares outstanding over the fiscal period.
(3) For the period from January 6 to July 31, 2006.
M RFP for th e Year En ded July 31, 2009
Covi ngton Venture Fun d Inc.
Class a sHaRes, seRI es IV
[in $000’s except for per share amounts, number of shares and percentages]
6
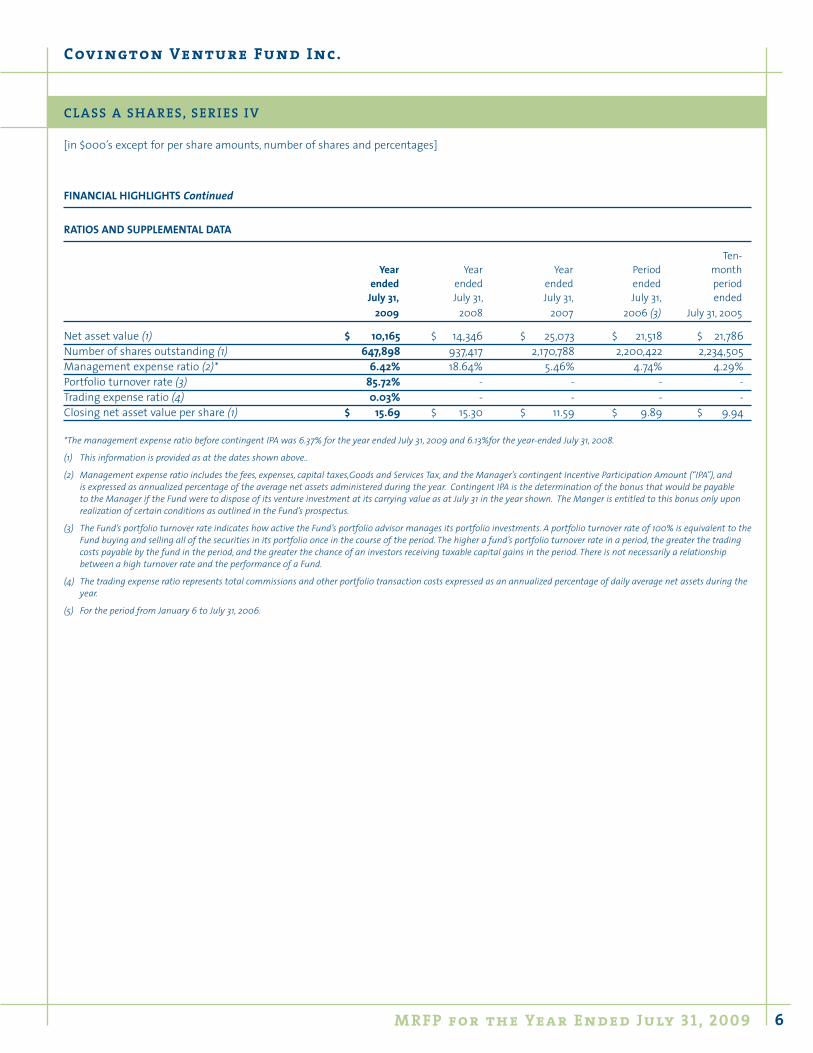
FINANCIAL HIGHLIGHTS Continued
RATIOS AND SUPPLEMENTAL DATA
Ten- Year Year Year Period month ended ended ended ended period July 31, July 31, July 31, July 31, ended 2009 2008 2007 2006 (3) July 31, 2005
Net asset value (1) $ 10,165 $ 14,346 $ 25,073 $ 21,518 $ 21,786Number of shares outstanding (1) 647,898 937,417 2,170,788 2,200,422 2,234,505Management expense ratio (2)* 6.42% 18.64% 5.46% 4.74% 4.29%Portfolio turnover rate (3) 85.72% - - - -Trading expense ratio (4) 0.03% - - - -Closing net asset value per share (1) $ 15.69 $ 15.30 $ 11.59 $ 9.89 $ 9.94 *The management expense ratio before contingent IPA was 6.37% for the year ended July 31, 2009 and 6.13%for the year-ended July 31, 2008.
(1) This information is provided as at the dates shown above..
(2) Management expense ratio includes the fees, expenses, capital taxes,Goods and Services Tax, and the Manager’s contingent Incentive Participation Amount (“IPA”), and is expressed as annualized percentage of the average net assets administered during the year. Contingent IPA is the determination of the bonus that would be payable to the Manager if the Fund were to dispose of its venture investment at its carrying value as at July 31 in the year shown. The Manger is entitled to this bonus only upon realization of certain conditions as outlined in the Fund’s prospectus.
(3) The Fund’s portfolio turnover rate indicates how active the Fund’s portfolio advisor manages its portfolio investments. A portfolio turnover rate of 100% is equivalent to the Fund buying and selling all of the securities in its portfolio once in the course of the period. The higher a fund’s portfolio turnover rate in a period, the greater the trading costs payable by the fund in the period, and the greater the chance of an investors receiving taxable capital gains in the period. There is not necessarily a relationship between a high turnover rate and the performance of a Fund.
(4) The trading expense ratio represents total commissions and other portfolio transaction costs expressed as an annualized percentage of daily average net assets during the year.
(5) For the period from January 6 to July 31, 2006.

M RFP for th e Year En ded July 31, 2009
Covi ngton Venture Fun d Inc.
Class a sHaRes, seRI es IV
[in $000’s except for per share amounts, number of shares and percentages]
7
FINANCIAL HIGHLIGHTS Continued
Management Fees
The Fund’s management expense ratio (“MER”) consists of all of its operating expenses, including sales commissions, certain ongoing marketing costs of the Fund, audit and legal expenses, fees paid to any independent valuator, IPA (if any), and certain consultancy costs. The largest component of the MER are fees that are calculated as a percentage of the NAV of the Fund and these fees are the Management fees, the Dealer Service fees, the Sponsor’s fees and the Transfer Agent’s fees.
Highlights of the key components of the Fund’s MER are listed in the table below:
Year ended Year endedDescription - % of NAV July 31, 2009 July 31, 2008 $ $
Management fee - annual rate of 1.75% 213 291Advisor fee- annual rate of 1.0% 122 215Dealer service fee - annual rate of 0.5% 62 151Transfer agent fee - annual rate of 0.6% 71 136Sponsor fee - annual rate of 0.25% 29 54
The Manager is responsible for directing the business, operations and affairs of the Fund and also responsible for implementing the investment strategy, monitoring the Fund’s investments and providing management assistance to portfolio companies. Because the portfolio companies of the Fund are generally small in size and in an earlier stage of development relative to conventional mutual funds, the Fund requires a greater level of management involvement in the analysis, monitoring support and development activities. The Manager uses its management fees to finance its operations as follows: 87% for general administration over the affairs of the Fund including implementation of the Fund’s investment strategy, portfolio management and monitoring, retaining and supervising service providers and managing the overall business affairs of the Fund and the Manager; and 13% for the implementation of communications, sales, marketing, and distribution strategies of the Fund and the Manager.
PAST PERFORMANCE
The performance information shown does not take into account sales, redemption, distribution or other optional charges that would have reduced returns on performance. The Fund’s past performance is no guarantee of how it will perform in the future.
Year by Year Non-Cumulative Returns
The following chart shows how the performance of the Fund has varied year to year. It also shows, in percentage terms, how an investment made in the Fund would have increased or decreased over the Fund’s reporting period.
40%
30%
20%
10%
0%
-10%20082007200620052004200320022001
32.01%17.19%
2009
2.55%
-0.50%
0.61%
-1.30%
0.50%
-0.30%
0.30%
(1) For the six months ended January 31, 2009.

M RFP for th e Year En ded July 31, 2009
Covi ngton Venture Fun d Inc.
Class a sHaRes, seRI es IV
[in $000’s except for per share amounts, number of shares and percentages]
8
PAST PERFORMANCE Continued
Annual Compound Returns
The table below summarizes the Fund’s past performance for the five, three and one year periods ended July 31 of the periods indicated. As a basis of comparison, we have provided the Retail Venture Capital Index as posted on www.globefund.com as of July 31, 2009.
The Retail Venture Capital Peer Index is the most representative broad-based securities market index as it accumulates all the Ontario based LSIFs.
Retail Venture BMO Nesbitt Burns CdnCompound Returns Series IV Capital Index* Small Cap Index**
1 Year 2.55% -15.11% -21.37%
3 Years 16.61% -6.17% -8.42%
5 Years 10.04% -4.26% 2.92%
Since Inception 4.83% *** ***
*Source: globefund.com
**The inclusion of the BMO Nexbitt Burns Cdn Small Cap Index is only intended to give perspective to general market activity.
***This has not been included because there is no comparable index quotation for the same period.
SUMMARY OF INVESTMENT PORTFOLIO
Below is a summary of the Fund’s portfolio as at July 31, 2009. This is a summary only and may change due to on-going portfolio activity in the Fund. An update is available quarterly on Covington’s website at www.covingtonfunds.com.
Fair Value of Investments % of Net Asset ValueComposition of net assets $ %
Martketable securities 4,964 48.8Venture investments 3,024 29.8Other assets, net of liabilities 2,176 21.4Net assets 10,164 100.0
TOP HOLDINGS (1) Debt at cost Equity at cost Total at cost $ $ $
Venture investments*WireIE Holdings International Inc. 2,774 - 2,774
(1) Excluding cash and short-term investments
* Series IV has invested solely in the technology industry. The company is in the early stage of development.

M RFP for th e Year En ded July 31, 2009
Covi ngton Venture Fun d Inc.
noTes
9
M RFP for th e Year En ded July 31, 2009
Covi ngton Venture Fun d Inc.
noTes
10

200 Front Street WestSuite 3003Toronto, ON M5V 3K2Telephone: 416 365 0060Facsimile: 416 365 9822Email: [email protected]: www.covingtonfunds.com
Fund Symbols
Series IV CIG459
Fund Manager and Advisor
Covington Capital200 Front Street West, Suite 3003, Toronto, ON M5V 3K2
Sponsor
Canadian Federal Pilots Association350 Sparks Street, Suite 400, Ottawa, ON K1R 7S8
Auditor
Ernst & Young LLPErnst & Young Tower, P.O. Box 251, Toronto-Dominion Centre Toronto, ON M5K 1J7
Transfer Agent and Registrar
CI Investments Inc.151 Yonge Street, 8th Floor, Toronto, ON M5C 2W7Customer Service: 1 888 746 4751
Legal Counsel
Gowling Lafleur Henderson LLPSuite 1600, 1 First Canadian Place, 100 King Street West, Toronto, ON M5X 1G5
SKU CGOF 1060B 09/09