management report jbs 2018 - jbss.infoinvest.com.br e df 2018 - cvm - ing.pdf · pÁg. 2 “to be...
TRANSCRIPT

1PÁG.
JBS 2018MANAGEMENT REPORT

2PÁG.
“To be the best in all that we do, completely focused on our
business, ensuring the best products and services to our
customers, a relationship of trust with our suppliers, profitability
for our shareholders and the opportunity of a better future for all
of our team members.” – JBS Mission
A MESSAGE FROM
THE PRESIDENT
Gilberto TomazoniJBS GLOBAL CEO
I’m very pleased to announce the results and the important steps taken by JBS in 2018. With a mission of being the best in all that we do, completely focused on our business, we were able to deliver outstanding results, which enable us to continue creating opportunities to our team members and value to all our stakeholders.
For 65 years, JBS has meant very hard work, innovation, growth and operational excellence. The passion and the commitment of over 230 thousand team members throughout the globe have transformed a Brazilian beef company into a leading global food company present in practically all of the world’s consumption markets.
With a widely diversified operational footprint - Brazil, USA, Canada, Mexico, Australia and Europe -, JBS is able to seize global opportunities. This strategy, coupled with an unique and diversified portfolio of proteins, solutions, value added products and widely recognized brands, expands the Company’s competitive advantages globally and reduces eventual impacts caused by natural market volatility.
For that, operational excellence is at the center of our strategy. In 2018, we advanced significantly in capturing opportunities and maximizing JBS’ potential around the globe by strengthening our global leadership team and investing in our local talents. We have improved our internal processes and made important progress in our Compliance and Ethics program, while also accelerating our global sustainability strategy, an area for which we are recognized by different representative entities around the world.
From a financial perspective, we have delivered record results: Net revenue of R$ 181.7 billion, EBITDA of R$ 14.8 billion and Free Cash Flow of R$ 5.7 billion, or US$ 1.5 billion. This free cash flow generation was used to reduce the Company’s net debt and decrease financial leverage to 3.01 times in terms of Net Debt/EBITDA in dollars.
At the same time that we delivered excellent results, we also created new opportunities for our cattle ranchers and integrated partners, suppliers, customers, consumers, out team members and their families.
We are building a history of valuable and widely recognized brands thanks to the quality of the products we offer and to our determination to innovate with absolute respect to the needs of our customers and consumers. With this objective, we created a global innovation structure dedicated to understanding and anticipating consumer demands in the different markets we operate, which allows us to develop and improve sales channels and solutions that favor access to our products and add value to all our stakeholders.
I feel honored to lead JBS into a new growth cycle and contribute to the daily quality of life of millions of people worldwide. Our responsibility is to produce sustainable, safe, high quality products, something which we passionately embrace.
In essence, we are a food company passionate about being part of many families’ daily meals, offering sustainable food solutions that our customers and consumers are proud to share and serve.
Through team work, commitment and humility, we believe that the best is yet to come for JBS and for our stakeholders. Considering the extraordinary efforts of our team members, the Company is ready to exceed and responsibly seize the challenges of the future and contribute to a much better world for all of us.
On behalf of our global team, I would like to thank you for your continued support. We are confident in all that we are yet to achieve together.

3PÁG.
ABOUT JBS &
HIGHLIGHTS
FROM 2018

4PÁG.Nota 1. A receita por região considera as vendas domésticas e as importações.
COMPANY PROFILEJBS S.A. is a food company with more than 60
years of tradition and a global leader in the
processing of animal protein. Present in more than
15 countries, the Company serves more than
275,000 customers in more than 190 countries
through a widely diversified portfolio of products
and brands.
Headquartered in Brazil, JBS employs around
230,000 people throughout its production platforms
and sales offices. The operational structure
includes beef, pork, lamb, poultry and
hides/leather processing facilities, in addition to
bovine and ovine feedlots.
Besides the Food Sector, JBS is present in the
segments of Hygiene & Personal Care Products,
Collagen, Can Making, Sausage Casings, Biodiesel,
Transportation, Waste Management and
Recycling.
JBS operates through five business units throughout
the world, as follows:
JBS Brazil: beef and leather production in Brazil;
related businesses operations in Brazil.
Seara: poultry and pork processing and
production of prepared products in Brazil.
JBS USA Beef: beef processing and prepared
foods production in the United States, Australia
and Canada.
JBS USA Pork: pork processing and prepared
foods production in the United States.
Pilgrim’s Pride: poultry processing and prepared
foods production in the United States, Europe
and Mexico.
More than 400 production units and sales
offices in more than 15 countriesGLOBAL PRODUCTION AND
SALES PLATFORM
CANADA3%
USA
51%
MEXICO
4%
BRAZIL
13%
SOUTH
AMERICA
1%
EUROPE
6%
AFRICA &
MIDDLE EAST
3%
4%
AUSTRALIA AND
NEW ZELAND
15%
ASIA
Percentage of Total Revenue ¹

5PÁG.
On February 15, 2018, JBS announced the closing of US$900 million aggregate principal amount of 6.75% senior notes due 2028
On February 16, 2018, JBS announced that its Board of Directors has authorized JBS Management to hire Grant Thornton Auditores Independentes to provide independent auditing services for the fiscal years between 2018 and 2022, replacing BDO RCS Auditores Independentes SS (“BDO”), in accordance with article 31 of CVM Instruction No. 308/99, which determines the rotation of independent auditors every five years.
On March 16, 2018, JBS announced, in the context of its Divestment Program, that it closed the sale of the totality of Five Rivers Cattle Feeding’s feedlot operations in the U.S. (“Five Rivers U.S.”) to affiliates of Pinnacle Asset Management, L.P. (“Pinnacle-Arcadia”), for approximately US$200 million, including the market value of silage and grain inventories.
On May 14, 2018, JBS announced, as a consequence of its global deleveraging process, solid economic and operational performance, as well as a favorable cash flow generation outlook, that it entered into a Normalization Agreement, together with its Brazilian operating subsidiaries and global leather division (together, “JBS Brazil”), related to credit lines with certain financial institutions representing 78% (seventy-eight percent) of the principal amount of the indebtedness that JBS Brazil currently holds with financial institutions in Brazil and abroad.
On October 18, 2018, JBS announced the pricing of unsecured Senior Notes issued through its wholly-owned subsidiary JBS Investments II GmBH and guaranteed by the Company. The Notes, in a total aggregate principal amount of US$500 million and due in January 2026, carry a coupon of 7.0% and yield of 7.125%.
On October 29, 2018, JBS announced the conclusion of a tender offer and redemption of the totality of US$1.0 billion aggregate principal amount of its 7.750% Senior Notes due 2020, using the proceeds from the 2026 Senior Notes, as announced on October 18th, 2018, plus cash on hand.
On October 29, 2018, JBS also announced that JBS USA Lux S.A. concluded a tender offer, using cash on hand, of approximately US$488 million in aggregate principal amount of its 7.250% Senior Notes due 2021, resulting in an outstanding principal amount of approximately US$662 million.
99% 100% 100% 100% 100% 100%JBS
Embalagens
Metálicas
JBS Asset
Management
JBS
Investments II
GmbH
JBS
Confinamento
JBS
MilestoneBrazservice Rigamonti
Seara
Alimentos
100% 100%
100% 100% 100% 100% 100% 100%
Conceria
Priante
JBS HU
Liquidity Mg.
Beef Snacks
do Brasil
Midtown
Participações
JBS Leather
International
JBS Holding
GMBHEnersea
JBS Global
Luxembourg
100% 100%
JBS
Mendoza
Meat Snack
Partners
Controladas
Joint Venture
99,93%
50%
Midup Part.
Ltda.
100%
INVESTMENTS AND
CORPORATE EVENTS
INVESTMENTS IN SUBSIDIARIES AND
JOINT VENTURES

6PÁG.
JBS continuously improves its corporate
governance practices aiming to create value and
establish relationships of trust between the
Company, its shareholders and investors and other
stakeholders, in order to create sustainable results
for all involved in the value chain.
The governance structure established by JBS has
been developed and improved to ensure
transparency in all its actions. It is formed by the
Board of Directors, the Global Compliance Board,
a permanent Fiscal Council and advisory
committees that work on specific topics
considered strategic by the company:
Sustainability; Audit; Financial and Risk
Management; Governance; and Related Parties
(more information about the committees is
available on the JBS Investor Relations website).
There are also three strategic areas under the
Global Presidency: Food Quality and Safety,
Center of Excellence and Innovation and Global
Sourcing.
The Board of Directors is the highest governance
body of the Company and closed 2018 with eight
members, three of which are independent, as
defined in its Bylaws. Board members, elected at a
shareholders' meeting for unified two-year terms,
are responsible for, among other things, defining
business policies and guidelines as well as
economic, social and environmental goals.
The presidency of the Board of Directors and of the
Company are held by different professionals. In
December 2018, the Board of Directors elected
Gilberto Tomazoni as Global CEO of JBS, a position
previously held by José Batista Sobrinho. Founder
and first president of the company, Sobrinho
remains as vice-president of the Board of Directors.
Prior to his appointment, Tomazoni held the
position of Chief Operating Officer (COO) of the
Company, during which time he was directly
involved in his global business strategy.
The fixed monthly remuneration of the members of
the Board of Directors as well as of the members of
the Fiscal Council and of all committees is based
on the performance of their duties. There is no
payment of direct and indirect benefits or
participation in the Company's results. The
compensation of other JBS leaders is based on
performance indicators, in order to encourage
sustainable growth of the organization in the
medium and long terms and the achievement of
short-term goals. Values are compared
periodically with those practiced by the market,
through surveys, and aligned with the interests of
JBS and its shareholders.
JBS BOARD OF DIRECTORS
Jeremiah O’Callaghan Chairman
José Batista Sobrinho Vice President
Aguinaldo G. Ramos Filho Member
Gilberto M. Xandó Baptista Member
Wesley Mendonça Batista Filho Member
Sérgio Roberto Waldrich* Member
Cledorvino Belini* Member
Roberto P. de Camargo Ticoulat* Member
*Independent Member
CORPORATE
GOVERNANCE

7PÁG.
ETHICS AND
COMPLIANCEJBS's global strategy is based on the principles of
ethics, integrity and compliance, issues of extreme
relevance to the business sustainability. The
Company constantly seeks to improve its actions
and control mechanisms and to develop policies
and procedures in accordance with the best
global practices. All these initiatives, as well as the
Code of Conduct and Ethics and the JBS Ethics
Hotline, are brought together in the organization's
global compliance program, called "Always Do It
Right."
In 2017, JBS strengthened its compliance structure
by appointing José Marcelo Proença as global
compliance officer, who is responsible for
implementing the program's initiatives. In order to
guarantee the independence of its activities, this
position reports directly to the Board of Directors.
The Company also maintains an Institutional Ethics
Committee, to which ethics committees of the
different business areas in Brazil are currently
reporting. Ethics committees are also responsible
for deliberating on investigations of complaints
received by the JBS Ethics Line.
In 2018, the revised Code of Conduct and Ethics
and the Code of Conduct for Business Partners
were launched - both documents are global,
meaning they have a single version that is used by
all Company units worldwide.
Special attention was also given to the
dissemination of the themes in the Code of
Conduct and Ethics, the functioning of the Ethics
Line and the new policies and procedures
implemented in 2017 for the entire JBS team.
Additionally, more than 20 internal communication
campaigns, 25 thousand hours of face-to-face
and distance training were carried out throughout
the year, reaching almost all team members: more
than 99% in Brazil. As part of the program
expansion process, 100% of the leaders from JBS’
international operations were trained in
compliance. The objective is to reach 100% of all
team members in 2019. Furthermore, about 2,000
team members, from specific groups, have
received face-to-face training for matters that go
beyond the Code of Conduct and Ethics - for
example, the cartel theme for the public sales
team and moral and sexual harassment for plant
leaders.
For the company’s international operations, in 2018
the company hired a compliance director - Lance
Kotschwar - who’s responsible to implement
initiatives to ensure transparency at all JBS’
businesses.
The JBS Ethics Line, for example, was implemented
in international operations in the second half of the
year and is already operating in all parts of the
world where JBS operates and is available in more
than 11 languages.
Another initiative completed in 2018 was the
development of a third-party automated tool for
reputational analysis (due diligence) as part of the
improvement of the process begun in the previous
year. Although currently used only at higher risk
entities, the objective is to have it implemented for
all third parties that have a business relationship
with JBS. In regions of greater risk and less
transparent information, the company will rely on
international partners to assist in the due diligence
process of third parties.
Various policies were also created on specific
themes and developments were made in existing
ones, such as entertainment policies. While the
Code of Conduct and Ethics applies to all
operations, policies may vary by country where
the units operate.
In addition, JBS joined the Ethos Institute and
signed the Business Pact for Integrity and Against
Corruption, developed by the NGO aiming to
spread good business practices and promoting a
more ethical and integrated market.
Thanks to these efforts, JBS was recognized by the
non-governmental organization Transparency
International as one of the most transparent
Brazilian companies in its most recent report.

8PÁG.
People are the key to JBS's success around the
world. Therefore, the organization constantly seeks
to play a responsible role as an employer and act
so that team members are proud to work in the
organization. With that objective, it strives to hire,
retain and train professionals who are engaged to
operational excellence and identify themselves
with the JBS Mission, Vision and Values. JBS also
commits itself to promote the well-being, health
and safety of all staff in the workplace, providing
equal opportunities to all people and investing
continuously in the development of talents and
leadership.
This represents a major challenge in a company
that has more than 230,000 team members around
the world, with different cultures, languages and
knowledge.
This allows us to make the necessary adjustments
and ensure that team members' health, safety and
work conditions are met and implemented in
accordance with the high standards adopted at
all company facilities.
In 2018, JBS Brazil invested in artificial intelligence
tools to support HR practices. One of the most
successful cases was identifying opportunities to
decrease absenteeism at JBS Leather.
JBS managers are always available to staff
members to discuss any issue and reinforce the
culture of respect on which the Company relies. By
enhancing dialogue and relationships of trust, the
organization provides opportunities for all team
members to present their ideas and point of views
to leaders and colleagues.
At JBS USA, for example, this happens by attending
periodic meetings, called Roundtable, Town Hall
and Safety and Production Meetings. For each
issue identified as critical to the company, an
action plan is prepared and team members who
raised it keep informed of their development.
Furthermore, JBS USA upholds an Open Doors
Policy, which encourages team members to
present to their supervisors or to human resources
any issues that affect the overall work
environment. Through discussions and debates
generated by this policy, the Company can
identify how team members see various work-
related topics, such as compensation and
benefits, scheduling, security and satisfaction with
leadership. In Brazil, this mapping is done through
an Ombudsman.
Another way of evaluating team members'
perceptions regarding satisfaction with the work
environment is through regular engagement
surveys. Managers also hold regular conversations
with team members in order to promote constant
alignment of expectations. In the second half of
2018, in Brazil, a culture diagnosis survey was
carried out to verify team members' engagement
with organizational values. Results will guide the
development of training and communication
efforts for upcoming years.
HUMAN
RESOURCES
What enables JBS to succeed in its efforts is to
engage everyone in its corporate culture.
Therefore, the Human Resources areas of JBS are
the guardians of this Culture. All strategies focus on
the dissemination of corporate values, from the
hiring of new professionals, through training, to
employees’ performance evaluation. However,
due to the particularities of the legislation and the
labor market of the different regions in which the
company operates, each business develops
specific efforts according to local needs. All
management policies and programs are reviewed
annually, as well as the main health and safety
indicators, turnover, absenteeism, and overtime.
Brazil
52.7%
USA
28.8%
Europe
6.0%
Mexico
5.4%
Australia
5.2%
Others
1.9%
~230kTeam Members

9PÁG.
JBS, in all its operations, also follows the
commitment to hire professionals regardless of
race, religion, color, national origin, sex, sexual
orientation, gender identity or age, including
people with special needs. The same principle
applies to talent training and career development
of team members. Diversity is one of the strengths
of the Company, which believes that its success is
based on collective skills, backgrounds and
experiences of its unique and diverse workforce.
Therefore, it promotes diversity and inclusion in all
its facilities and offices, seeking to create a reliable
and productive work environment.
Due to the variety of locations of its operations and
of people who make up its workforce, JBS USA
faces a communication challenge. Up to 60
different languages are spoken at their facilities. To
ensure that all team members can express
themselves and understand key messages from
team members and leadership, the Company
provides materials in multiple languages and
dialects on a wide range of topics such as
benefits, safety instructions and training. In
addition, each facility offers unlimited access to
Language Lines, available in over 200 languages
and provides immediate access to clear
communication across our facilities.
In some production units, leaders from diverse
ethnic groups are identified and requested to help
other team members accommodate to company
facilities and the community. In addition, as
contracted by the U.S. Federal Government, JBS
USA maintains affirmative action programs to
implement its Equal Work Opportunity Policy.
Corporate Leadership Forum – This program’s
objective is to develop the leadership in relation
to key people management topics. Started in
the second half of 2018, a total of 106
coordinators of the business and administrative
areas participated in this initiative.
JBS Without Borders - The program is intended
to provide in-house opportunities to work in
Canada in cutter and de-boner positions. In
2018, 200 team members registered for 20
available positions. JBS supports approved
candidates during the immigration process and
offers a benefit package that includes housing
and local support with English classes. Beginning
in 2019, the program will be extended to Seara.
Seara University – E-learning platform (EAD) that
gathers different paths of career development,
addressing topics related to operational and
administrative activities. It is available to
approximately 7,000 team members, including
administrative, technical and leadership
personnel.
Labor Attorney - Program focused on selecting
and developing attorney to work in the JBS
labor area, attracting people adhering to the
Company's values. Lawyers with up to two
years' training may apply. The training, held at
JBS headquarters in São Paulo, lasts 90 days,
covers a theoretical and a practical part, and
addresses behavioral, technical and legal
issues. In 2018, eight lawyers were hired.
Currently, the program is developed in 11
business units.
JBS USA Trainee Program – Program aimed at
identifying and developing future leaders
through a 12-month rotation of recent
graduates from the United States, Canada and
Mexico. The goal is to contribute to develop
their knowledge and skills in the areas of
leadership, process management and people
management.
JBS Internship Program – Internship program at
JBS USA that offers college students an
opportunity to gain hands-on experience in the
industry and develop leadership skills. It is held
for 10 weeks in the summer with approximately
150 participants through hands-on learning and
projects that provide relevant workplace
experience and help identify future JBS leaders.
DIVERSITY
TRAINING AND CAPACITY BUILDING
PROGRAMS
In 2018, JBS continued its intensive investments in
training, including initiatives such as:
Leadership Academy - It aims to develop
leadership in people management topics
focused on JBS’ challenges. Program modules
are carried out by a team of internal multipliers,
using synergies from local human resource
departments . In 2018, all supervisors of the
Leather Business Unit were trained, reaching
1,034 leaders in 17 facilities.
Internal Talents - Provides opportunities for
development and professional growth for team
members working in all JBS businesses in the
areas of production, maintenance, logistics and
transportation. During the year, program
formed 312 team members.

10PÁG.
SUSTAINABILITYSustainability at JBS is a cross-sectional value to all
operations and is implemented in all businesses
and countries, based on ethical and transparent
performance, respectful relationship with its
stakeholders and responsibility in dealing with
people, animals, and the environment.
There is a specific department responsible to
disseminate the theme and engage the areas and
value chain in sustainability management, with
headquarters in Brazil and the United States. The
Brazilian team tracks operations in the country and
the entire leather business, while the US-based
team focuses on Canada, Australia, New Zealand,
Mexico, Puerto Rico and Europe.
Sustainability objectives include acting as an
interface between the market, customers,
suppliers and consumers, among others, and the
company's business areas, enabling the
company's constant dialogue with its stakeholders.
Another important entity is the Sustainability
Committee, which is responsible for discussing
strategic and global issues, and reports directly to
the Board of Directors. Since 2019, the Chairman of
the Board of Directors, Jeremiah O'Callaghan, also
became a member of the Sustainability
Committee.
In 2018, JBS‘ leading global sustainability leaders
met in the city of Greeley, JBS USA's headquarters,
to discuss best practices and identify global
strategic guidelines for the Company.
PURPOSES
In Brazil, JBS leads its sustainability management
based on four well-defined objectives: improve risk
management, reduce its environmental footprint,
improve its relationship with society, and
encourage innovation.
At JBS’ operations in the United States, Australia
and Canada, the focus is on eco-efficiency and
on making JBS a leader in the sustainable use of
natural resources, while minimizing their demand
and reducing waste generation to achieve higher
quality production. With this objective, a series of
challenging sustainability goals were established
with a deadline for 2020.
Due to the diversity of its business lines, JBS assigns
its areas the freedom to set their own targets and
procedures for more sustainable production,
including the development of environmental and
safety policies that are in accordance with country
and sector standards.
The same happens in the processes for definition,
dialogue and engagement with stakeholders,
which are built locally, based on legitimate
relationships and guided by the sustainable
development of the company's activities.
These multiple realities and approaches are unified
by company values, under a precautionary
principle, through an evaluation of potential
impacts and outcomes in any operation before
execution, and by use of a materiality matrix,
which includes five main themes for the company
and its stakeholders:
Team Member Health and Safety: the well-
being and integrity of its direct and indirect
team members are a priority for JBS. Globally,
the Company believes that it is necessary to
act both preventively and correctively in order
to eliminate accidents and provide safe
working conditions, including individual and
collective protection equipment, improved
conditions for task performance, and
ergonomics and quality of life programs. As in
other issues, health and safety management
follows global principles determined by the
company, as well as regional programs and
local action plans.
Animal Welfare: ensuring animal welfare is a key
commitment for JBS and, therefore, the issue is
treated as one of the strategic and global
priorities for the Company’s sustainability. The
quality of JBS products is deeply related to the
welfare of the animals under its responsibility.
Thus, the Company is dedicated to always
ensure proper treatment, handling and
slaughter of animals at all times. Moreover, the
issue is inserted in JBS’ culture, and the
Company makes continuous efforts to improve
animal welfare efforts by use of new
technology and through the implementation of
standards that meet and exceed regulations
sector guidelines.

11PÁG.
This represents a great challenge due to the large
number of animal suppliers to JBS all over the
globe.
JBS maintains animal welfare programs in all its
business units to promote accountability and
transparency and ensure that careful handling of
animals is a priority at all stages of life, from
breeding to slaughter, including transportation.
These programs involve implementing adequate
practices, controls, training, and documentation at
all stages of this extensive value chain.
Product Integrity: for JBS, upstanding products
are those that meet the highest standards of
food safety, quality and sustainability. Therefore,
JBS constantly invests in improving its
operations, manufacturing and supply routines
to guarantee the integrity of its products. This
includes adopting responsible social and
environmental practices, such as responsible
raw material procurement and certifications
issued by third parties related to best practices,
processes and routines. Furthermore, JBS has
become a market reference in value chain
management, acting in a differentiated
manner in regards to responsible raw material
procurement. For example, in Brazil, to ensure
the purchase of animals only from suppliers that
are not involved in slave labor, deforestation of
native forests, invasion of indigenous lands or
environmental conservation areas, JBS monitors
producing farms on a daily basis, through a
satellite system developed by the Company
especially for this purpose. Since adopting
adequate sustainability practices by raw
material suppliers may have a direct impact on
the quality of its products, JBS seeks to act as a
transformation and innovation agent in the
productive chains in which it participates. In this
regard, it develops actions that improve
management processes and develop good
social-environmental practices among its
suppliers.
Water: water resources are not only a critical
item for the sustainability of the food sector and
of JBS companies: they are the basis of the
productive chain and enable the development
of both animals and vegetables, in addition to
ensuring high production standards, as well as
the hygiene of areas, equipment and
utensils. The efficient use of this resource is,
therefore, a challenge for all company facilities,
as well as the development of strategies and
techniques that ensure maximum reuse and
reduction of new water intake.
The concern is even larger in regions where there is
water scarcity and where there may be
"competition" between the application in breeding
and in the industry with other uses , especially
human consumption. This condition implies the
commitment to establish partnerships with
governments, communities and other stakeholders
in territories where there are JBS operations and
development of programs and mechanisms to
increase the effectiveness involving monitoring,
use and reuse of water.
In Brazil, JBS made a full diagnosis of the water risk
of its operations in every state, with the objective
of identifying facilities with the greatest water risk,
to mitigate the risk of shortages and to increase
the efficiency of water use.
At JBS USA operations, in addition to the corporate
goal of reducing water consumption by 10% until
2020, there are other individual goals per facility.
Each one of them has the objective to pursue all
presented challenges challenge through
management of critical issues, resources and other
variables. This entails adopting monitoring by the
Environmental Management System (EMS), with
continuous auditing and mapping of opportunities
for best practices and monitoring the evolution of
total water use and water intensity (use of water
per ton of product or use of water per animal).
Climate Changes: in order to reduce its carbon
footprint and ensure delivery of products with
the lowest possible environmental impact, JBS
has made important efforts to reduce its
emissions. The first step was adhering to
initiatives and practices to measure, improve
and reduce the use of GHG in its production
process, energy matrix and logistics. Since 2009,
JBS publishes its annual emissions inventory
according to the GHG Protocol methodology in
Brazil. Since 2012, this inventory began to cover
global operations. Annual emissions of direct
greenhouse gases (scope 1), indirect energy
(scope 2) and indirect emissions (scope 3) are
measured. The company also participates in
other global and local platforms, such as CDP,
B3 (ICO2) of B3 (São Paulo Stock Exchange and
the climate protocols of the Brazilian states of
Paraná and São Paulo. All these initiatives
receive JBS emissions inventory on an annual
basis. Reported data is critical for
understanding the negative goodwill of JBS's
carbon chain, for strategy definition, as well as
for establishing actions that should be
implemented throughout the value chain.

12PÁG.
FINANCIAL
PERFORMANCE
2018

13PÁG.
ECONOMIC
OUTLOOKAccording to the World Economic Situation and
Prospects 2018 report from the United Nations, The
last decade has been punctuated by a series of
broad-based economic crises and negative
shocks, starting with the global financial crisis of
2008–2009, followed by the European sovereign
debt crisis of 2010–2012 and the global commodity
price realignments of 2014–2016. As these crises
and the persistent headwinds that accompanied
them subside, the world economy has
strengthened, offering greater scope to reorient
policy towards longer-term issues that hold back
progress along the economic, social and
environmental dimensions of sustainable
development. The same report also estimates that
in 2017, global economic growth is estimated to
have reached 3.0 per cent, with the same level of
growth forecasted for 2018 and 2019.
In Brazil, according to data published by IBGE
(Brazilian Institute of Geography and Statistics) on
February 28, 2019, GDP grew by 1.1% in 2018, in line
with the growth rate posted for 2017. Also
according to IBGE, the highlight of the year was
the services sector, which grew by 1.3%,
responding for 75.8% of total GDP. On the other
hand, the external sector negatively pressured
GDP results, with exports of goods and services
increasing by 4.1% while imports advanced by
8.5%.
With regards to proteins, according to the United
States Department of Agriculture (USDA), in 2018
beef production grew by 3.7%, while consumption
increased by 2.5%. In spite of the truckers strike that
occurred between april and may, beef exports
grew by 13.1% in comparison to 2017, placing Brazil
in a global leading position. Considering data from
SECEX (Secretary of Export Trade), Brazilian fresh
beef exports increased by 11.8% in volume and
10.0% in US$ revenue.
For poultry, production was 0.5% lower, while
consumption grew by 1.0% in comparison to 2017.
Although Brazilian poultry exports decreased by
4.2%, in 2018 Brazil was able to maintain its global
leading export position. Considering just fresh
chicken, SECEX data show a 3.3% decrease in
export volumes and 8.7% lower revenues in US$.
For 2019, the USDA projects a 3.0% growth in
production and a 4.8% increase in beef exports. In
poultry, production is expected to growth by 1.8%
and exports by 2.4%. However, African Swine Fever
cases that have been reported in Asian countries,
namely in China, may significantly impact yearly
projections.
In the United States, JBS’ main operational
platform, GDP grew by 2.9% in 2018, according to
the U.S. Bureau of Economic Analysis report. This
mainly reflects positive contributions from personal
consumption, non-residential fixed investments,
exports and government expenditures.
With a strong economy and higher availability of
raw materials, protein domestic consumption and
U.S. exports continued to grown in 2018, fully
offsetting higher local production.
In 2018, U.S. beef production grew by 2.9%, being
compensated by a 1.3% growth in domestic
consumption and a 10.6% in exports when
compared to 2017.
Poultry production increased by 2.2%, while
domestic consumption and exports grew by 2.6%
and 0.6%, respectively.
Lastly, production of pork was 3.3% higher than the
prior year, mainly driven by the opening of new
facilities. Pork domestic consumption grew by 2.3%,
while exports were 6.3% higher, in spite of the
import tariffs imposed by Mexico, one of the main
destinations for U.S. pork, and the trade war with
China.
For 2019, the USDA forecasts a 3.6% growth in beef
production, while domestic consumption and
exports are expected to increase by 3.7% and
2.6%, respectively. In poultry, production is
expected to be 1.9% higher, consumption is
estimated to increase by 1.8% and exports by 2.8%.
Lastly, projections for pork indicate a growth of
5.2% in production, 5.3% in domestic consumption
and 3.5% in exports.
It is important to note that, as it happens for Brazil,
projections may be significantly impacted as a
result of African Swine Fever cases that have been
reported in Asia.
* Source: JBS, IBGE, BEA, ONU, SECEX.

14PÁG.
Net RevenueIn 2018, JBS posted consolidated net revenue of R$181,680.2 million, an increase of 11.3% compared to
2017, and the highest revenue ever recorded by the Company.
In 4Q18, consolidated net revenue was R$47,318.7 million, which represents an increase of 10.7%
compared to 4Q17. For the quarter, approximately 75% of JBS global sales came from markets in which
the Company operates and 25% came from exports.
EBITDAIn 2018, adjusted EBITDA was R$14,849.8 million, a 10.7% increase over the previous year. EBITDA margin
remained stable at 8.2%.
In 4Q18, adjusted EBITDA was R$3,391.9 million, an increase of 6.1% in comparison with 4Q17. EBITDA
margin for the quarter was 7.2%.
Net Financial ResultsIn 2018, JBS recorded a financial expense of R$8,282.2 million of which R$4,337.6 million refers to net results
from FX variances.
In 4Q18, net financial expense totaled R$564.7 million. Net results from FX variances and the fair value of
adjustments of derivatives was an income of R$477.8 million. Interest expense was R$847.0 million, while
interest income was R$64.2 million. Taxes, contributions, tariffs and others totaled an expense of R$259.7
million.
Net Income
In 2018, excluding the impact of the adherence to Rural Tax Regularization Program (RRP Funrural) net of
tax effects, JBS posted net income of R$1,606.3 million. Reported net income was R$25.2 million with an
EPS of R$0.01.
In 4Q18, JBS reported net income of R$563.2 million, reversing the loss reported in 4Q17, representing an
EPS of R$0.22.
Cash Flow from Operating Activities and Free Cash FloIn 2018, JBS generated R$11,466.6 million in cash from operating activities, an 31.8% increase over the
previous year. Free cash flow (after investments) was R$5,699.8 million, 105.2% higher than 2017.
In 4Q18, the Company generated R$3,410.6 million in cash from operating activities, which represents a
growth of 19.4% over 4Q17. Free cash flow (after investments) was R$1,584.4 million, a decrease of 21.4%
in relation to 4Q17, when JBS received the amount of R$893.9 million as proceedings from the Divestment
Plan.
Net cash provided by Investing ActivitiesIn 2018, total cash used by JBS in investing activities totaled R$1,742.7 million, while CAPEX was R$2,896.8
million.
In 4Q18, total cash used by JBS in investing activities totaled R$814.5 million, while CAPEX was R$1,088.1
million.
2018 AND 4Q18 CONSOLIDATED RESULTS
R$ Million 4Q18 3Q18 ∆% 4Q17 ∆% 2018 2017 ∆%
Net income for the period (including minority interest) 550.6 (101.7) - (345.1) - 210.1 1,025.5 -79.5%
Financial income (expense), net 564.7 1,891.2 -70.1% 2,075.3 -72.8% 8,282.2 5,595.3 48.0%
Current and deferred income taxes 783.1 (1,012.5) - 82.1 853.4% (1,308.5) 126.3 -
Depreciation and amortization 1,239.0 1,263.4 -1.9% 1,154.3 7.3% 4,805.0 4,471.7 7.5%
Equity in subsidiaries (4.6) (5.7) -19.2% (1.4) 220.5% (26.5) (18.6) 42.0%
Results from divestment program 0.0 6.7 - (272.3) - 6.7 (162.8) -
Tax payable in installments 58.1 2,395.6 -97.6% 388.6 -85.1% 2,475.3 2,228.4 11.1%
Impairment of taxes 77.8 0.0 - 0.0 - 77.8 0.0 -
Goodwill on the acquisition of tax credits 0.0 (54.6) - 0.0 - (54.6) (76.0) -28.1%
Other income / expenses 73.6 38.7 90.2% 116.9 -37.1% 188.8 191.6 -1.5%
Truckers strike impact 0.0 0.0 - 0.0 - 112.9 0.0 -
Investigation impacts due to the leniency agreement 49.7 10.7 363.1% 0.0 - 80.5 34.6 133.0%
(=) Adjusted EBITDA 3,391.9 4,431.8 -23.5% 3,198.3 6.1% 14,849.8 13,415.9 10.7%

15PÁG.
R$
4.8%
US$
95.2%
Commercial
Banks 24.9%
Capital
Markets
75.1%
IndebtednessJBS ended 2018 with R$8,935.8 million in cash. Additionally, JBS USA has a US$1,913.7 million fully-available
unencumbered line under revolving credit facilities, equivalent to R$7,415.2 million at the year-end
exchange rate, providing JBS with total liquidity of R$16,351.0 million, more than five times higher than
short-term debt. Net debt in BRL increased from R$45,283.3 million in 2017 to R$47,217.7 million in 2018,
while leverage reduced to 3.18x from 3.38x in the same period. In US$, net debt reduced from
US$13,689.0 million to US$12,185.9 million in 2018 and leverage decreased to 3.01x, compared to 3.26x in
2017.
Debt profile Short-term/Long-term
ST
5.0%
LT
95.0%
Short-term debt in relation to total
debt reduced from 24% in 4Q17
to 5% in 4Q18. Out of total short-
term debt, 65% was from trade
finance credit lines related to
exports from JBS Brazilian
businesses.
Currency & Cost
Breakdown Entity BreakdownSource Breakdown
8.64% p.a.
5.89% p.a.
JBS S.A.
27.7%
Seara
6.4%
JBS USA
65.9%
2018 AND 4Q18 CONSOLIDATED RESULTS
12/31/18 31/12/17 Var.% 12/31/18 31/12/17 Var.%
Gross Debt 56,153.5 57,024.7 -1.5% 14,492.0 17,238.4 -15.9%
(+) Short Term Debt 2,922.6 13,526.1 -78.4% 754.3 4,088.9 -81.6%
(+) Long Term Debt 53,230.9 43,498.6 22.4% 13,737.7 13,149.5 4.5%
(-) Cash and Equivalents 8,935.8 11,741.3 -23.9% 2,306.1 3,549.4 -35.0%
Net Debt 47,217.7 45,283.3 4.3% 12,185.9 13,689.0 -11.0%
Leverage 3.18x 3.38x 3.01x 3.26x
R$ Million US$ Million

16PÁG.
2018 AND 4Q18 BUSINESS UNITS
Million 4Q18 3Q18 ∆% 4Q17 ∆% 2018 2017 ∆%
Net Revenue
Seara R$ 4,615.4 4,991.5 -7.5% 4,474.6 3.1% 17,670.1 17,473.1 1.1%
JBS Brazil R$ 7,459.0 7,582.9 -1.6% 6,241.9 19.5% 27,578.9 23,560.0 17.1%
JBS USA Beef US$ 5,405.8 5,419.3 -0.2% 5,684.6 -4.9% 21,482.8 21,663.6 -0.8%
JBS USA Pork US$ 1,403.2 1,394.1 0.7% 1,598.0 -12.2% 5,693.0 6,210.6 -8.3%
Pilgrim's Pride US$ 2,656.8 2,697.6 -1.5% 2,742.4 -3.1% 10,937.8 10,767.9 1.6%
EBITDA
Seara R$ 474.2 512.1 -7.4% 488.4 -2.9% 1,543.2 1,568.7 -1.6%
JBS Brazil R$ 293.1 706.5 -58.5% -301.9 - 1,248.8 38.7 3128.9%
JBS USA Beef US$ 393.7 446.7 -11.9% 395.9 -0.6% 1,718.7 1,308.6 31.3%
JBS USA Pork US$ 117.3 138.4 -15.2% 186.9 -37.2% 536.8 779.9 -31.2%
Pilgrim's Pride US$ 111.0 156.0 -28.8% 241.0 -53.9% 798.2 1,388.0 -42.5%
EBITDA Margin
Seara % 10.3% 10.3% 0.0 p.p. 10.9% -0.6 p.p. 8.7% 9.0% -0.2 p.p.
JBS Brazil % 3.9% 9.3% -5.4 p.p. -4.8% 8.8 p.p. 4.5% 0.2% 4.4 p.p.
JBS USA Beef % 7.3% 8.2% -1.0 p.p. 7.0% 0.3 p.p. 8.0% 6.0% 2.0 p.p.
JBS USA Pork % 8.4% 9.9% -1.6 p.p. 11.7% -3.3 p.p. 9.4% 12.6% -3.1 p.p.
Pilgrim's Pride % 4.2% 5.8% -1.6 p.p. 8.8% -4.6 p.p. 7.3% 12.9% -5.6 p.p.
Business Units – IFRS R$
Business Units – local GAAP and currency
Million 4Q18 3Q18 ∆% 4Q17 ∆% 2018 2017 ∆%
Net Revenue
Seara R$ 4,615.4 4,991.5 -7.5% 4,474.6 3.1% 17,670.1 17,473.1 1.1%
JBS Brazil R$ 7,459.0 7,582.9 -1.6% 6,241.9 19.5% 27,578.9 23,560.0 17.1%
JBS USA Beef R$ 20,596.4 21,451.6 -4.0% 18,460.9 11.6% 78,644.1 69,188.9 13.7%
JBS USA Pork R$ 5,345.9 5,518.4 -3.1% 5,189.5 3.0% 20,774.7 19,830.1 4.8%
Pilgrim's Pride R$ 10,108.3 10,662.9 -5.2% 8,891.0 13.7% 39,881.0 34,333.2 16.2%
Others R$ 605.0 637.5 -5.1% 641.0 -5.6% 2,423.7 3,757.3 -35.5%
Eliminations R$ -1,411.3 -1,442.1 -2.1% -1,164.4 21.2% -5,292.3 -4,972.6 6.4%
Total R$ 47,318.7 49,402.8 -4.2% 42,734.5 10.7% 181,680.2 163,170.0 11.3%
EBITDA
Seara R$ 474.2 512.1 -7.4% 488.4 -2.9% 1,543.2 1,568.7 -1.6%
JBS Brazil R$ 293.1 706.5 -58.5% -301.9 - 1,248.8 38.7 3128.9%
JBS USA Beef R$ 1,601.9 1,605.4 -0.2% 1,336.6 19.9% 6,311.9 4,109.6 53.6%
JBS USA Pork R$ 408.7 721.7 -43.4% 675.7 -39.5% 2,001.6 2,533.3 -21.0%
Pilgrim's Pride R$ 640.7 873.2 -26.6% 1,018.9 -37.1% 3,738.8 5,196.2 -28.0%
Others R$ -26.8 12.8 - -19.3 38.3% 5.5 -30.6 -
Total R$ 3,391.9 4,431.8 -23.5% 3,198.3 6.1% 14,849.8 13,415.9 10.7%
EBITDA Margin
Seara % 10.3% 10.3% 0.0 p.p. 10.9% -0.6 p.p. 8.7% 9.0% -0.2 p.p.
JBS Brazil % 3.9% 9.3% -5.4 p.p. -4.8% 8.8 p.p. 4.5% 0.2% 4.4 p.p.
JBS USA Beef % 7.8% 7.5% 0.3 p.p. 7.2% 0.5 p.p. 8.0% 5.9% 2.1 p.p.
JBS USA Pork % 7.6% 13.1% -5.4 p.p. 13.0% -5.4 p.p. 9.6% 12.8% -3.1 p.p.
Pilgrim's Pride % 6.3% 8.2% -1.9 p.p. 11.5% -5.1 p.p. 9.4% 15.1% -5.8 p.p.
Others % -4.4% 2.0% -6.4 p.p. -3.0% -1.4 p.p. 0.2% -0.8% 1.0 p.p.
Total % 7.2% 9.0% -1.8 p.p. 7.5% -0.3 p.p. 8.2% 8.2% 0.0 p.p.

17PÁG.
For 4Q18, net revenue from Seara totaled R$4,6 billion, 3.1% higher than 4Q17, mainly due tohigher sales prices, both domestically and in the export markets. Total volume decreased incomparison to the same quarter of last year, as a result of lower fresh chicken sales in bothmarkets. For the year, Seara posted net revenue of R$17.7 billion, a 1.1% growth in relation to2017.
In the domestic market, net revenue grew by 6.9%, totaling R$2.7 billion, driven by a 12.5%increase in average sales prices when compared to 4Q17. Average fresh chicken sales pricesgrew by 19.9%, while prepared foods prices also performed well, with sales prices 4.1% higherthan the same period last year. Domestic volumes decreased by 4.9%, primarily in fresh chicken.In the export market, net revenue totaled R$1.9 billion, 1.6% lower than 4Q17, essentially as aresult of lower volumes in some international markets, such as the Middle East.
EBITDA for the quarter totaled R$474.2 million, a 2.9% decrease in comparison to the samequarter of last year, impacted by higher raw material costs (22% over the 4Q17), but partiallycompensated by higher average sales prices, which have been recovering since the secondhalf of the year. EBITDA margin was 10.3%, compared to 10.9% in 4Q17. For the year, EBITDAreached R$1.5 billion, with an EBITDA margin of 8.7%, compared to 9.0% in 2017, which wasimpacted by higher corn and soybean costs, as well as by non-recurring events such as thetruckers strike, which temporarily reduced the number of animals available for processing.
International market demand, particularly in Asia, has been contributing to a better pricing ofSeara’s exports products in a moment when grain prices have been showing a downtrendgiven the better balance between supply and demand.
Main Highlights
Seara
2018 AND 4Q18 BUSINESS UNITS
∆% ∆% ∆%
R$ % NR R$ % NR QoQ R$ % NR YoY R$ % NR R$ % NR YoY
Net Revenue 4,615.4 100.0% 4,991.5 100.0% -7.5% 4,474.6 100.0% 3.1% 17,670.1 100.0% 17,473.1 100.0% 1.1%
Cost of Goods Sold (3,774.2) -81.8% (4,028.2) -80.7% -6.3% (3,541.8) -79.2% 6.6% (14,753.1) -83.5% (14,201.0) -81.3% 3.9%
Gross Profit 841.2 18.2% 963.3 19.3% -12.7% 932.7 20.8% -9.8% 2,917.0 16.5% 3,272.0 18.7% -10.9%
EBITDA 474.2 10.3% 512.1 10.3% -7.4% 488.4 10.9% -2.9% 1,543.2 8.7% 1,568.7 9.0% -1.6%
2018 20174Q18 3Q18 4Q17R$ Million

18PÁG.
In 2018, JBS Brazil net revenue was R$27.6 billion, an increase of 17.1% in relation to 2017.
In 4Q18, net revenue was R$7.5 billion, which corresponds to an increase of 19.5% over 4Q17. Inthe domestic market, revenue grew 12.5% in the period, thanks to a 13.3% growth in volumesold. Export revenues increased 29.2%, boosted by an increase of 16.7% in volume sold and10.8% in prices.
2018 EBITDA was R$1.2 billion, representing an important recovery of 3128.9% in relation to 2017,with EBITDA margin of 4.5%. In 4Q18, EBITDA was R$293.1 million, reversing the negative resultfrom the same period in the previous year. EBITDA margin in the quarter was 3.9%
The Company remains focused on improving its channels and product mix to maximizeprofitability, and strengthening partnerships with key customers to fulfill their needs in a moreefficient and customized way. Additionally, JBS has developed a series of special programs,together with its cattle suppliers, to ensure carcass standardization and superior quality in order
to offer even better products to its customers.
Main Highlights
2018 AND 4Q18 BUSINESS UNITS
JBS Brazil (including Leather and Related Businesses)
∆% ∆% ∆%
R$ % NR R$ % NR QoQ R$ % NR YoY R$ % NR R$ % NR YoY
Net Revenue 7,459.0 100.0% 7,582.9 100.0% -1.6% 6,241.9 100.0% 19.5% 27,578.9 100.0% 23,560.0 100.0% 17.1%
Cost of Goods Sold (6,167.7) -82.7% (5,935.2) -78.3% 3.9% (5,322.3) -85.3% 15.9% (22,626.5) -82.0% (19,820.4) -84.1% 14.2%
Gross Profit 1,291.3 17.3% 1,647.7 21.7% -21.6% 919.7 14.7% 40.4% 4,952.4 18.0% 3,739.6 15.9% 32.4%
Adjusted EBITDA 293.1 3.9% 706.5 9.3% -58.5% (301.9) -4.8% - 1,248.8 4.5% 38.7 0.2% 3128.9%
4Q18 2018 20173Q18 4Q17R$ Million

19PÁG.
Considering results in IFRS and BRL, JBS USA Beef posted net revenue of R$78.6 billion in 2018,which represents an increase of 13.7% in relation to 2017 and an EBITDA of R$6.3 billion, 53.6%higher than 2017, with an EBITDA margin of 8.0%. These results include the 12.7% impact ofaverage FX (BRL vs USD), that was R$3.19 in 2017 and R$3.65 in 2018. In 4Q18, net revenue wasR$20.6 billion, 11.6% higher than 4Q17, while EBITDA in the quarter was R$1.6 billion, an 19.9%increase in relation to 4Q17, with a 7.8% margin. In the period, the BRL decreased 14.8%, fromR$3.25 in 4Q17 to R$3.81 in 4Q18.
In USGAAP and US$, JBS USA Beef net revenue was U$21.5 billion in 2018, a 0.8% decrease inrelation to 2017. In the quarter, net revenue was US$5.4 billion, compared to US$5.7 billion in4Q17, a 4.9% decrease. Net revenue reduction was primarily driven by two events: Q4 and FY2018 had one week less compared to 2017 and the sale of Five Rivers, the cattle feedingoperations in the US, in March 2018. EBITDA in 2018 was US$1.7 billion, with an EBITDA margin of8.0%, compared to 6.0% in 2017. In the quarter, the business unit posted US$393.7 million inEBITDA, with a 7.3% margin, compared to US$395.9 million and 7.0% margin in 4Q17. These resultsare a record performance for the JBS USA Beef business.
The difference in JBS USA Beef EBITDA in IFRS and USGAAP, in addition to the FX, is due todifferent accounting criteria in relation to inventories: in IFRS they are measured through theaverage cost while in USGAAP they are marked-to-market.
In North America, notably in the US, the fundamentals of the beef industry continue to be solidand favorable to cattle producers and processors, as cattle supply continues to grow andprocessing capacity remains the same. The strong US economy, coupled with the lowunemployment rate, are promoting beef consumption and growing demand, resulting in highermargins for the US beef industry.
Also, exports exceeded volumes reported in 2017, bringing a new record volume sale for theCountry. JBS USA Beef leveraged its global sales offices to increase its market share in exportsand elevate profitability with a better sales product mix to its main markets. On top of that, therelentless pursuit of operational excellence and key customer strategy continue to boost JBSUSA Beef business performance versus the competition.
JBS Australia also improved performance compared to the prior year as cattle supply increasedand exports to China and other Asian countries grew. Primo Foods, our packaged food businessin Australia and New Zealand, continues to lead the market, driving consumer behavior throughinnovation and promoting strong results consistent with the Company’s expectations.
Main Highlights (IFRS - R$)
2018 AND 4Q18 BUSINESS UNITS
JBS USA Beef (including Australia and Canada)
Main Highlights (US GAAP - US$)
∆% ∆% ∆%
R$ % NR R$ % NR QoQ R$ % NR YoY R$ % NR R$ % NR YoY
Net Revenue 20,596.4 100.0% 21,451.6 100.0% -4.0% 18,460.9 100.0% 11.6% 78,644.1 100.0% 69,188.9 100.0% 13.7%
Cost of Goods Sold (17,984.5) -87.3% (18,827.5) -87.8% -4.5% (16,338.5) -88.5% 10.1% (68,838.3) -87.5% (62,415.7) -90.2% 10.3%
Gross Profit 2,611.8 12.7% 2,624.1 12.2% -0.5% 2,122.4 11.5% 23.1% 9,805.9 12.5% 6,773.2 9.8% 44.8%
EBITDA 1,601.9 7.8% 1,605.4 7.5% -0.2% 1,336.6 7.2% 19.9% 6,311.9 8.0% 4,109.6 5.9% 53.6%
R$ Million4Q18 3Q18 2018 20174Q17
∆% ∆% ∆%
US$ % NR US$ % NR QoQ US$ % NR YoY US$ % NR US$ % NR YoY
Net Revenue 5,405.8 100.0% 5,419.3 100.0% -0.2% 5,684.6 100.0% -4.9% 21,482.8 100.0% 21,663.6 100.0% -0.8%
Cost of Goods Sold (4,964.3) -91.8% (4,937.7) -91.1% 0.5% (5,262.8) -92.6% -5.7% (19,649.3) -91.5% (20,281.9) -93.6% -3.1%
Gross Profit 441.5 8.2% 481.6 8.9% -8.3% 421.8 7.4% 4.7% 1,833.5 8.5% 1,381.7 6.4% 32.7%
EBITDA 393.7 7.3% 446.7 8.2% -11.9% 395.9 7.0% -0.6% 1,718.7 8.0% 1,308.6 6.0% 31.3%
2017US$ Million
4Q18 3Q18 4Q17 2018

20PÁG.
Considering results in IFRS and BRL, JBS USA Pork posted net revenue of R$20.8 billion in 2018,which represents an increase of 4.8% in relation to 2017 and an EBITDA of R$2.0 billion, with anEBITDA margin of 9.6%. These results include the 12.7% impact of average FX (BRL vs USD), thatwas R$3.19 in 2017 and R$3.65 in 2018. In 4Q18, net revenue was R$5.3 billion, 3.0% higher than4Q17, while EBITDA in the quarter was R$408.7 million, with a 7.6% margin. In the period, the BRLdecreased 14.8%, from R$3.25 in 4Q17 to R$3.81 in 4Q18.
In US GAAP and US$, JBS USA Pork reported net revenue of US$5.7 billion in 2018 and US$1.4billion in 4Q18, which corresponds to decreases of 8.3% and 12.2%, respectively, whencompared with 2017. EBITDA in 2018 was US$536.8 million, with a 9.4% margin, and US$117.3million in 4Q18, with a 8.4% margin.
The difference in JBS USA Pork EBITDA in IFRS and USGAAP, in addition to the FX, is due todifferent accounting criteria in relation to inventories: in IFRS they are measured through theaverage cost while in USGAAP they are marked-to-market.
In the last year, Pork processing capacity in the US grew materially, affecting sales prices of porkmeat in the domestic market. On the other hand, live hogs prices also declined, partiallyoffsetting the impact of margin reduction.
Despite sales pressure in the domestic market, the US Pork industry’s export volumes performed4% better than 2017. This was a remarkable achievement given that U.S. pork faced retaliatorytariffs in Mexico and China/Hong Kong from June through December. JBS US Pork maintainedits market share in pork meat exports from the US.
Through a relentless focus on operational performance, JBS USA Pork continues to differentiateitself from the competition, enhancing comparative results. Its investments in value added andprepared foods capacity continues to strengthen its strategic relationships with key customers,
promoting better margins.
Plumrose finished the year with record performance as it continues to execute its strategic planto increase production capabilities, grow sales and develop branded products.
JBS consistently monitors the ASF events in Asia. The Company’s management believes thecontinue spread of the disease in that region, notably in China, could bring significant changesto the current global pork trade environment.
2018 AND 4Q18 BUSINESS UNITS
JBS USA Pork
Main Highlights (IFRS - R$)
Main Highlights (US GAAP - US$)
∆% ∆% ∆%
R$ % NR R$ % NR QoQ R$ % NR YoY R$ % NR R$ % NR YoY
Net Revenue 5,345.9 100.0% 5,518.4 100.0% -3.1% 5,189.5 100.0% 3.0% 20,774.7 100.0% 19,830.1 100.0% 4.8%
Cost of Goods Sold (4,522.5) -84.6% (4,414.4) -80.0% 2.5% (4,194.5) -80.8% 7.8% (17,353.9) -83.5% (16,308.2) -82.2% 6.4%
Gross Profit 823.4 15.4% 1,104.1 20.0% -25.4% 995.0 19.2% -17.2% 3,420.8 16.5% 3,521.9 17.8% -2.9%
EBITDA 408.7 7.6% 721.7 13.1% -43.4% 675.7 13.0% -39.5% 2,001.6 9.6% 2,533.3 12.8% -21.0%
20174Q18 3Q18 4Q17 2018R$ Million
∆% ∆% ∆%
US$ % NR US$ % NR QoQ US$ % NR YoY US$ % NR US$ % NR YoY
Net Revenue 1,403.2 100.0% 1,394.1 100.0% 0.7% 1,598.0 100.0% -12.2% 5,693.0 100.0% 6,210.6 100.0% -8.3%
Cost of Goods Sold (1,279.3) -91.2% (1,258.8) -90.3% 1.6% (1,407.2) -88.1% -9.1% (5,149.1) -90.4% (5,421.9) -87.3% -5.0%
Gross Profit 123.9 8.8% 135.3 9.7% -8.4% 190.8 11.9% -35.1% 543.9 9.6% 788.7 12.7% -31.0%
EBITDA 117.3 8.4% 138.4 9.9% -15.2% 186.9 11.7% -37.2% 536.8 9.4% 779.9 12.6% -31.2%
US$ Million4Q18 3Q18 4Q17 2018 2017

21PÁG.
Considering results in IFRS and BRL, PPC posted net revenue of R$39.9 billion in 2018, whichrepresents an increase of 16.2% in relation to 2017 and an EBITDA of R$3.7 billion, with an EBITDAmargin of 9.4%. These results include the 12.7% impact of average FX (BRL vs USD), that wasR$3.19 in 2017 and R$3.65 in 2018. In 4Q18, net revenue was R$10.1 billion, 13.7% higher than4Q17, while EBITDA in the quarter was R$640.7 million, with a 6.3% margin. In the period, the BRLdecreased 14.8%, from R$3.25 in 4Q17 to R$3.81 in 4Q18.
In US GAAP and US$, PPC net revenue in 2018 was US$10.9 billion, an increase of 1.6% in relationto 2017. In 4Q18, net revenue was US$2.7 billion, a reduction of 3.1% in relation to 4Q17. EBITDAin 2018 was US$798.2 million, with a 7.3% margin and in 4Q18, EBITDA was US$111 million, with amargin of 4.2%.
The difference in PPC EBITDA in IFRS and USGAAP, in addition to the FX, is due to differentaccounting criteria in relation to livestock (birds) amortization: in IFRS, the amortization of thelivestock is considered as an expense that can be adjusted in EBITDA while in USGAAP theamortization of the livestock is accounted as Cost of Goods Sold and not adjustable in EBITDA.
In the U.S., PPC endured a very challenging environment in commodity chicken, resulting fromslower than expected recovery from weather disruptions at some complexes, partially offset byan improvement in operating results from Prepared Foods, which recorded a 15% increase involume sold.
In Europe, PPC improved its performance through expected synergies but were impacted byhigher feed costs as a result of a drought that will be reflected in Moy Park prices in comingquarters.
PPC’s Mexican operations produced a very strong first half, a weaker than seasonal Q3,followed by a rebound in Q4. Throughout the year, the Prepared Foods segment in Mexico
recorded a significant increase of 33% in volume sold in the domestic market, as a result of theinvestments that were made over the past few years to grow capacity, develop PPC brandsand focus on key customers.
2018 AND 4Q18 BUSINESS UNITS
Pilgrim’s Pride Corporation - “PPC”
Main Highlights (IFRS - R$)
Main Highlights (US GAAP - US$)
∆% ∆% ∆%
R$ % NR R$ % NR QoQ R$ % NR YoY R$ % NR R$ % NR YoY
Net Revenue 10,108.3 100.0% 10,662.9 100.0% -5.2% 8,891.0 100.0% 13.7% 39,881.0 100.0% 34,333.2 100.0% 16.2%
Cost of Goods Sold (9,125.1) -90.3% (9,455.7) -88.7% -3.5% (7,621.9) -85.7% 19.7% (34,882.4) -87.5% (28,284.6) -82.4% 23.3%
Gross Profit 983.2 9.7% 1,207.2 11.3% -18.6% 1,269.1 14.3% -22.5% 4,998.6 12.5% 6,048.6 17.6% -17.4%
EBITDA 640.7 6.3% 873.2 8.2% -26.6% 1,018.9 11.5% -37.1% 3,738.8 9.4% 5,196.2 15.1% -28.0%
2017R$ Million
4Q18 3Q18 4Q17 2018
∆% ∆% ∆%
US$ % NR US$ % NR QoQ US$ % NR YoY US$ % NR US$ % NR YoY
Net Revenue 2,656.8 100.0% 2,697.6 100.0% -1.5% 2,742.4 100.0% -3.1% 10,937.8 100.0% 10,767.9 100.0% 1.6%
Cost of Goods Sold (2,544.9) -95.8% (2,527.9) -93.7% 0.7% (2,480.5) -90.5% 2.6% (10,094.3) -92.3% (9,296.2) -86.3% 8.6%
Gross Profit 111.8 4.2% 169.7 6.3% -34.1% 261.8 9.5% -57.3% 843.5 7.7% 1,471.6 13.7% -42.7%
Adjusted EBITDA 111.0 4.2% 156.0 5.8% -28.8% 241.0 8.8% -53.9% 798.2 7.3% 1,388.0 12.9% -42.5%
2017US$ Million
4Q18 3Q18 4Q17 2018

22PÁG.
Greater China
20.9%
Africa & Middle East
14.2%
Japan
12.4%
USA
9.0%
South Korea
7.7%
E.U.
7.2%
Mexico
6.5%
Russia
3.6%
South America
3.6%
Canada
2.9%
Others
12.0%
2017US$13,849.1
million
Greater China
24.1%
Japan
12.7%
Africa & Middle East
12.4%
USA
9.6%
South Korea
9.2%
E.U.
6.8%
Mexico
6.2%
South America
3.4%
Canada
3.2%
Taiwan
2.4%
Others
10.0%
2018US$12,890.8
million
4Q18 Breakdown of Production Costs by Business Unit (%)
Note 1. Considers China and Hong Kong
JBS Consolidated Exports Breakdown 2018 and 2017
4Q18 (%) Consolidated JBS Brazil Seara USA Beef USA Pork PPC
Raw material (livestock) 76.3% 85.9% 65.9% 84.2% 73.5% 54.5%
Processing (including
ingredients and packaging)12.3% 8.1% 21.5% 6.8% 13.3% 25.9%
Labor Cost 11.4% 6.1% 12.6% 9.1% 13.2% 19.6%
TABLES AND CHARTS

23PÁG.
TABLES AND CHARTS
Business Units – local GAAP and currency
488.4330.2
226.7
512.1 474.2
10.9% 8.3% 5.5%10.3% 10.3%
4Q17 1Q18 2Q18 3Q18 4Q18
4.5
4.0 4.1
5.04.6
4Q17 1Q18 2Q18 3Q18 4Q18
241.0 271.8 282.5156.0 111.0
8.8% 9.9% 10.0%5.8% 4.2%
4Q17 1Q18 2Q18 3Q18 4Q18
2.7 2.72.8
2.7 2.7
4Q17 1Q18 2Q18 3Q18 4Q18
5.7
5.15.6 5.4 5.4
4Q17 1Q18 2Q18 3Q18 4Q18
395.9308.2
570.1446.7 393.7
7.0% 6.1%10.2% 8.2% 7.3%
4Q17 1Q18 2Q18 3Q18 4Q18
-301.9 -100.9
350.0
706.5
293.1
-4.8%-1.6%
5.6%9.3%
3.9%
4Q17 1Q18 2Q18 3Q18 4Q18
6.2 6.3 6.2
7.6 7.5
4Q17 1Q18 2Q18 3Q18 4Q18
Net Revenue (billion) EBITDA (million) and % EBITDA
Seara (R$)
Net Revenue (billion) EBITDA (million) and % EBITDA
JBS Brazil (R$)
Net Revenue (billion) EBITDA (million) and % EBITDA
JBS USA Beef (US$)
Net Revenue (billion) EBITDA (million) and % EBITDA
JBS USA Pork (US$)
Net Revenue (billion) EBITDA (million) and % EBITDA
Pilgrim's Pride (US$)
1.6 1.5 1.4 1.4 1.4
4Q17 1Q18 2Q18 3Q18 4Q18
186.9 177.7103.4 138.4 117.3
11.7% 12.1%7.2% 9.9% 8.4%
4Q17 1Q18 2Q18 3Q18 4Q18

24PÁG.
DIVIDEND POLICY
The declaration of annual dividends, including
dividends in excess of the minimum mandatory
dividend, requires approval at the Annual General
Shareholders Meeting by a majority vote of the
shareholders of JBS and will depend on various
factors.
These factors include operational results, financial
conditions, cash requirements and future
prospects of the Company among other factors
that the board of directors and shareholders of JBS
deem relevant.
The minimum mandatory dividend of JBS is 25% of
net income as provided for in the Corporations Act
and by the Company’s bylaws, based upon the
non consolidated financial statements.
There were no dividend payments for 2010 and
2011, since the Company recorded losses for these
periods.
The company has accrued dividends in December 31, 2018 of R$5.984 thousand to be submitted at the
General Meeting of Shareholders, calculated as follows (in R$ thousands):
Reference
year
Total amount
(R$ million)
Amount per
share(R$)
12/31/2016 89.4 0.0329777380
12/31/2015 1,102.0 0.4054588810
12/31/2014 483.5 0.1673795780
12/31/2013 220.1 0.0767453370
12/31/2012 170.7 0.0595100000
12/31/2009 61.5 0.0243617747
12/31/2008 12.3 0.0087950000
December 31, 2018
Net income 25,199
Legal reserves – (5%) (1,260)
Adjusted base for dividend calculation 23,939
Mandatory dividends (25%) 5,984
Declared dividends 5,984
DIVIDEND DISTRIBUTION
EVOLUTION
12/31/2017 126.9 0.0467762540

25PÁG.
50
100
150
Dec-17 Jan-18 Feb-18 Mar-18 Apr-18 May-18 Jun-18 Jul-18 Aug-18 Sep-18 Oct-18 Nov-18
JBSS3 IBOV
OTHER RELEVANTINFORMATION
JBS share price ended 2018 quoted at R$11.59 in the São Paul Stock Exchange (B3). The Company’s
market value totaled R$31,626.2 million at the end of the year.
SHARE PERFORMANCE
ADHERENCE TO THE ARBITRATION CHAMBER
The Company, its shareholders, directors and
members of the Fiscal Council undertake to resolve
through arbitration any dispute or controversy that
may arise between them related to or resulting from
in particular the application, validity, effectiveness,
interpretation, violation and effects of the provisions
contained in the Contract of the Novo Mercado,
the Listing Rules of the Novo Mercado, the Bylaws,
the shareholders‘ agreements filed at the
Company’s headquarters under Corporate Law,
the regulations issued by the National Monetary
Council, by the Central Bank of Brazil, by the CVM,
by BOVESPA and any other rules applicable to the
operation of the capital market in general to the
market Arbitration Chamber in accordance with
Commitment Clauses and Arbitration Rules,
conducted in accordance with the Chamber
Regulation.
RELATIONSHIP WITH EXTERNAL AUDIT
Grant Thornton Auditores was hired by JBS S.A. for
the provision of external audit services related to
audits of financial statements of JBS S.A., individual
and consolidated. JBS’ policy to hire eventual
services not related to external audit from the
independent auditor is based on principles that
preserve the independency of the auditor, such
as: (a) the auditor should not audit its own work,
(b) the auditor should not exercise managerial
functions in its client and (c) the auditor should not
promote the interests of its client.
The auditor’s payment refers to professional
services related to the audit process of
consolidated financial statements, quarterly
revisions of the Company’s financial statements,
corporate audits and some temporary revisions of
certain subsidiaries, as per request by the
appropriate legislation.
Payments related to the audit process refer to
services of due diligence traditionally performed
by an external auditor in acquisitions and advisory
regarding accountancy standards and
transactions.
Payments not related to audit process corresponds
to, mainly, services provided of compliance with
the tax requirements to the Company’s subsidiaries
outside of Brazil.
Aiming to be in compliance with CVM Instruction
381/2003, JBS S.A. informs that Grant Thornton
Auditores did not provide any other services
unrelated to the audit that represented more than
5% of its total payment regarding audit process
during 2018.

JBS S.A.Financial statements and Independent auditors' reportAs of December 31, 2018 and 2017

Index Page
Independent Auditor's Report on the Financial Information 3
Statement of financial position - Assets 11
Statement of financial position - Liabilities and Equity 12
Statements of income for the years ended December 31, 2018 and 2017 13
Statement of comprehensive income for the years ended December 31, 2018 and 2017 14
Statements of changes in equity for the years ended December 31, 2018 and 2017 15
Statements of cash flows for the years ended December 31, 2018 and 2017 16
Economic value added for the years ended December 31, 2018 and 2017 18
Note 1 - Operating activities 19
Note 2 - Plea bargain agreement, Leniency agreement and the impacts in the financial statements 20
Note 3 - Elaboration and presentation of financial statements 20
Note 4 - Business Combination 23
Note 5 - Cash and cash equivalents 25
Note 6 - Trade accounts receivable, net 25
Note 7 - Inventories 25
Note 8 - Biological assets 26
Note 9 - Recoverable taxes 27
Note 10 - Related parties transactions 28
Note 11 - Investments in subsidiaries and joint ventures 30
Note 12 - Property, plant and equipment 33
Note 13 - Intangible assets 34
Note 14 - Goodwill 36
Note 15 - Trade accounts payable 38
Note 16 - Loans and financing 39
Note 17 - Operating and finance leases 44
Note 18 - Accrued income and other taxes 45
Note 19 - Accrued payroll and social charges 46
Note 20 - Dividends payable 46
Note 21 - Other financial liabilities 47
Note 22 - Income taxes - Nominal and effective tax rate reconciliation 47
Note 23 - Provisions 51
Note 24 - Equity 53
Note 25 - Net revenue 56
Note 26 - Financial income (expense), net 56
Note 27 - Earnings per share 56
Note 28 - Operating segments and geographic reporting 57
Note 29 - Expenses by nature 59
Note 30 - Insurance coverage 59
Note 31 - Risk management and financial instruments 60
Signatures 69

© 2019 Grant Thornton Auditores Independentes. All rights reserved. │ JBS S.A.
(Free translation from the original issued in Portuguese. In the event of any discrepancies, the Portuguese language version shall prevail.)
To the Management, Directors and Shareholders of JBS S.A. São Paulo – SP
Opinion We have audited the individual and consolidated financial statements of JBS S.A. (“Company”), identified as Company and Consolidated, respectively, which comprise the balance sheet as at December 31, 2018, and the statement of income, statement of comprehensive income, statement of changes in equity, and statement of cash flows for the year then ended, and the corresponding explanatory notes, including a summary of significant accounting policies.
In our opinion, the financial statements present fairly, in all material respects, the individual and consolidated financial position of JBS S.A. as at December 31, 2018, and its individual and consolidated financial performance and individual and consolidated cash flows for the year then ended, in accordance with accounting practices adopted in Brazil and the International Financial Reporting Standards (IFRS) issued by the International Accounting Standards Board (IASB).
Basis for opinion We conducted our audit in accordance with Brazilian and International Standards on Auditing (ISAs). Our responsibilities under those standards are described in the “Auditor’s responsibilities for the audit of the individual and consolidated financial statements” section of our report. We are independent of the Company and its subsidiaries in accordance with the relevant ethical requirements set forth in the Code of Ethics for Professional Accountants and the professional standards issued by the Federal Accounting Council and we have fulfilled our other ethical responsibilities in accordance with these requirements. We believe that the audit evidence we have obtained is sufficient and appropriate to provide a basis for our audit opinion.
3

© 2019 Grant Thornton Auditores Independentes. All rights reserved. │ JBS S.A.
Key audit matters Key audit matters (KAM) are those matters that, in our judgment, were of most significance in our audit of the financial statements for the current year. These matters were addressed in the context of our audit of the individual and consolidated financial statements taken as a whole and in forming our opinion on such individual and consolidated financial statements, and, therefore, we do not provide a separate opinion on these matters. We determined that the matters below are the key audit matters that should be communicated in our report:
1. Plea bargain agreements, leniency agreement and investigations in progress(Notes 2 and 23)Why the matter was determined to be a KAM
As described in Note 2 to the individual and consolidated interim financial statements, during 2017, certain executives and former executives of J&F Investimentos S.A. Group (“J&F”) entered into Plea Bargain Agreements (“Plea Bargain”) with the Attorney General´s Office (“PGR”), which were subsequently ratified by the Superior Court of Justice (“STF”). Among other provisions, such agreements require the defendants to cooperate with the Federal Prosecution Office (“MPF”) regarding all facts reported to that authority, which were ratified by the MPF at the 5th Court. In September 2017, the Company and its subsidiaries executed an instrument of adherence to the Leniency Agreement, to protect them against the financial impacts arising from such Agreement, which will be fully assumed by J&F. Therefore, as determined by the Agreement, in September 2017, an internal investigation led by the Independent Oversight Committee (“Committee” or “CSI”) was initiated, with the assistance of specialized external and independent professionals, of the facts related to the Company, both in Brazil and abroad, as reported under the Plea Bargain, which included in its scope, together with the operations mentioned in the above-mentioned Agreement, the operations “Cui Bono”, “Carne Fraca”, “Sepsis”, “Greenfield, “Bullish”, “Tendão de Aquiles”, “Lama Asfáltica”, and “Porteira Aberta”. In this context, the Company calculated and included in its accounting records and in its financial statements for the year ended December 31, 2017 certain estimates on the related accounting impacts of provisions, including respective tax aspects, known through that date and, for the year ended December 31, 2018, the Company’s and its subsidiaries’ Management have represented the non-existence, and nothing has come to our attention, of new facts and/or new significant impacts in relation to those already known and described in the respective Notes.
Due to the risks and uncertainty involved in processes of this nature, and also considering that there is an investigation in progress on the processes already initiated, and other processes still in the evidence-gathering stage, that may ultimately impact the financial statements, including disclosure aspects, this matter required a substantial amount of our attention and our efforts and, therefore, was considered a key audit matter, since it requires us to keep track of all developments and findings relating to the investigations under way, which may eventually change the assumptions adopted in recognizing the above mentioned provision relating to payments without services provided and their respective tax effects and the tax deductibility of such expenses, including interest and fine.
How the matter was addressed in the audit of the financial statements
Our audit procedures included, among others:
• We identified and gained an understanding of the Company’s new compliance policies in order toverify, among other aspects relating to governance, if they are operating effectively and, also, if theyare in accordance and consistent with what the company had committed itself and agreed upon withgovernment oversight bodies and entities;
• We met and evaluated the main Company’s investigation actions being conducted by an independentlaw office and respective forensic specialist;
• We reviewed the prior auditor´s working papers for the conclusions obtained on the forensicprocedures applied at the beginning of the external investigation process in 2017 as well as on theanalysis of the impacts of the provisions arising from the plea bargain agreements then made;
4

© 2019 Grant Thornton Auditores Independentes. All rights reserved. │ JBS S.A.
• We reviewed the working papers of the significant consolidated components for the conclusionsobtained on the forensic procedures applied at the beginning of the external investigation process in2017 and on the year ended December 31, 2018;
• We obtained and read the reports issued by the significant consolidated components to identify newfacts and/or processes and evidence-gathering procedures not identified by the Company and/or notpresented in these financial statements;
• We held meetings and discussions with the Company’s internal and external legal counsel tounderstand which would be the impacts and risks involved in all ongoing lawsuits and evidence-gathering procedures;
• We evaluated if the Company’s position on the estimates and assumptions adopted in calculating theprovision remains appropriate and up-to-date;
• We evaluated the information and disclosures presented in the individual and consolidated financialstatements as to the current status of the investigation process the Company is under;
• During the year, we performed focused procedures over the Company and its significant consolidatedcomponents to check the existence of a new fact and/or a fact that has not been considered in theongoing processes and investigations;
• We obtained representations from the Company’s Management and access to representations from itssignificant consolidated components regarding the existence of new facts on the investigations thatare under way;
• We involved specialists in forensic practices to assist us in evaluating the scope and extent of theinvestigation, performing a critical evaluation of the procedures and methodologies used by theindependent investigators to the present date of such investigations, including as to procedures togather and analyze critical documents and/or information and an evaluation of the need to performadditional procedures and keep track of relevant information through the media;
• We obtained access to the representation of J&F’s Management and the declaration issued by theFederal Prosecution Office (“MPF”) as to J&F’s compliance with all obligations defined in theAgreement.
Based on the evidence obtained through the procedures described above, we considered that the assumptions used in recognizing the provision, as well as their respective disclosures relating to the processes and evidence-gathering procedures involving the investigations on certain transactions, are appropriate in the context of the financial statements for the year ended December 31, 2018 taken as a whole.
2. Provision for contingencies (Note 23)Why the matter was determined to be a KAM
The Company and its subsidiaries are defendants to tax, civil, labor and social security lawsuits, administrative proceedings, and processes started by the Brazilian Securities and Exchange Commission (CVM), arising in the normal course of businesses and resulting from the ongoing investigation processes. This area requires Management to make judgments and critical evaluations, supported by the opinion of the Company’s legal counsel, in determining the estimates related to the recognition of liabilities, measuring the involved amounts, assessing the likelihood of loss on lawsuits and properly disclosing the existing proceedings and pending litigation.
The total provision amount recorded in the financial statements amounts to R$1,946,122 thousand and R$2,696,645 thousand, Company and Consolidated, respectively, as at December 31, 2018. Additionally, certain laws and regulations in Brazil are highly complex and, therefore, the measurement, recognition and disclosure of the provision for risks related to lawsuits and administrative proceedings, processes and/or, in certain cases, adherence to laws and regulations, require a certain degree of judgment by the Company and its subsidiaries in recording estimates of losses and making disclosures in the individual and consolidated financial statements.
5

© 2019 Grant Thornton Auditores Independentes. All rights reserved. │ JBS S.A.
Due to the significance, complexity and judgment involved in the evaluation, measurement and definition of the timing to recognize and disclose lawsuits and litigation at the various levels of discussion, as well as any impacts that such processes and estimates may cause on the individual and consolidated financial statements taken as a whole (including when lawsuits are assessed as possible and probable loss, since a change in the likelihood of loss or in the assessment criteria may have impacts on the financial statements in terms of provision and/or recognition of assets). This matter required a large amount of our attention and our efforts; therefore, we considered it a key audit matter for the year ended December 31, 2018.
How the matter was addressed in the audit of the financial statements
Our audit procedures included, among others:
• Evaluate, on a testing basis, the sufficiency of the provisions recognized and the amounts ofcontingencies disclosed by evaluating the criteria and assumptions used in their measurementmethodology, considering data and historical information;
• We mailed confirmation letters and, subsequently, evaluated the replies to our confirmation letters andthe legal opinion received from the Company’s legal advisors;
• For tax and labor lawsuits, our approach included the involvement of our specialists in assessing thegrounds and information on likelihood of success provided by the respective legal advisors (to theextent we deemed necessary), in addition to the documentation and information relating to the maintax and labor matters involving the Company;
• Discuss with the Company´s internal and external legal advisors;
• Review the work performed and discuss with Management and the auditors of significant componentsin the consolidation process;
• Evaluate the disclosures made in the individual and consolidated financial statements to determinethat they are in accordance with the rules applicable and provide information on the nature, exposureand amounts accrued or disclosed relating to the main tax, labor and civil matters in which theCompany is involved.
Based on the evidence obtained by performing the procedures above, we understand that the criteria and assumptions adopted by the Company to record and disclose estimates and risks relating to the ongoing lawsuits and proceedings at the different levels, as well as the respective disclosures made, are appropriate in the context of the financial statements for the year ended December 31, 2018 taken as a whole.
3. Evaluation of impairment (Notes 12 and 14)Why the matter was determined to be a KAM
As at December 31, 2018, the Company has assets, including goodwill based on expected future profitability, whose recoverable value should be appraised on an annual basis, as required by Technical Pronouncement CPC 01(R-1)/ IAS36 – Impairment of Assets. As mentioned in said Notes, the Company performs impairment tests, which involves a high degree of subjectivity and judgment by Management, based on the discounted cash flow method, which considers several assumptions, such as discount rate, inflation projection, economic growth, among others. Accordingly, this matter was considered an area of risk due to the uncertainty inherent in the process of determining the estimates and judgments involved in preparing future cash flows discounted to present value, such as projections of market demand, operating margins and discount rates that may significantly change the realization of the assets.
How the matter was addressed in the audit of the financial statements
Our audit procedures included, among others:
• Evaluation of internal or external evidence that may indicate that assets are impaired;
• Involvement of our internal specialists to assist in the revision of the impairment tests; evaluation ofthe assumptions and methodologies used by the Company’s Management in conjunction with itsexternal specialists engaged to prepare analysis reports;
6

© 2019 Grant Thornton Auditores Independentes. All rights reserved. │ JBS S.A.
• Ongoing challenge of the assumptions used by Management in order to corroborate if there areassumptions not consistent and/or that might be revised;
• Analysis of the disclosures required in the individual and consolidated financial statements.
Based on the procedures performed, we considered that the assumptions and methodologies used by the Company to evaluate the recoverable value of such assets are reasonable, and the information presented in the individual and consolidated financial statements is appropriate in the context of the financial statements for the year ended December 31, 2018 taken as a whole.
4.Recoverable federal and state taxes (Note 9)Why the matter was determined to be a KAM
As mentioned in Note 9 to the individual and consolidated financial statements, the Company has significant balances of recoverable taxes relating to ICMS, PIS, Cofins and income tax on profits abroad paid by foreign subsidiaries. Tax credits are taken on sales and purchases that benefit from tax incentive granted under the tax legislation to exporting companies and income tax on foreign subsidiaries’ profits. The Company’s Management evaluates the recoverability of these tax credits since most of these credits may only be used in the following situations prescribed by law: (i) offset against other federal and state taxes, (ii) payments to suppliers of inputs and equipment, when these fall under this program, and (iii) request for approval and refund, in kind, of said tax credits from the relevant tax authorities; (iv) future taxable income is expected to be recorded. The realization of recoverable taxes is based on a technical study, a projection of purchases and sales in future years and the expectation that future taxable income will be recorded. The Company uses accounting and business assumptions to calculate the projections, which include, among others, assumptions as to estimated purchases and sales, rate of growth in operations, exchange rate changes, and expected profit margins. Due to the degree of significant judgment involved to determine such projections, we consider this issue as a key audit matter.
How the matter was addressed in the audit of the financial statements
Our audit procedures included, among others:
• Involvement of our tax specialists to analyze the alternatives presented by the Company’sManagement to use these recoverable taxes to pay federal and state taxes in the future by means ofrefund and/offset requests;
• Evaluation, supported by our internal tax specialists, whether the credits arising from the income taxpaid by foreign subsidiaries are appropriate;
• Obtaining the legal opinion of internal and external legal advisors on certain tax matters related to theCompany’s activities;
• Analysis of the estimates made by the Company’s Management regarding the terms for actualrealization of such tax credits as well as their proper classification between current and noncurrent;
• Review of the disclosure made in the financial statements for adequacy.
Based on the evidence obtained by performing the procedures described above, we understand that the carrying amount of the taxes classified as current and noncurrent assets relating to federal and state tax credits are appropriate in the context of the financial statements for the year ended December 31, 2018 taken as a whole.
7

© 2019 Grant Thornton Auditores Independentes. All rights reserved. │ JBS S.A.
5. Significant consolidated components (Note 11)Why the matter was determined to be a KAM
The consolidated financial statements are prepared in accordance with accounting practices adopted in Brazil and the International Financial Reporting Standards (IFRS) issued by the International Accounting Standards Board (IASB). In this context, some of the Company’s significant subsidiaries are audited by other independent auditors. We considered this matter significant for our audit due to the materiality of these investments for the Company´s individual and consolidated financial statements, considering the various auditing procedures we are subject to perform, as prescribed in the standard on auditing applicable to audits of group financial statements (NBC TA 600 R1/ ISA600).
How the matter was addressed in the audit of the financial statements
Our audit procedures included, among others:
• The auditing procedures performed included communicating with the component auditors of significantsubsidiaries in order to discuss the audit risks identified, the approach, extent and timing of the work;
• We applied the concepts in and according to NBC TA 600 (R1)/ ISA 600 – Special considerations –Audits of group financial statements, besides performing other procedures, we issued auditinstructions requesting the required analyses and declarations and reviewed the components’ workingpapers and discussed the auditing procedures performed and findings reached to conclude whetherthey had been properly planned in a manner to address the risks of material misstatements and/orrequired additional testing procedures;
• Regarding the key audit matters identified, we discussed with the components’ auditors and evaluatedany impacts on the individual and consolidated financial statements, including as to any effects on thedisclosure of the consolidated financial statements.
Based on the evidence obtained by performing the procedures described above, we consider that the accounting records relating to the accounting information of significant components and their effects on the individual and consolidated financial statements as well as on their respective disclosures are appropriate in the context of the financial statements for the year ended December 31, 2018 taken as a whole
Other matters Audit of the corresponding comparative figures
The Company’s individual and consolidated financial statements for the year ended December 31, 2017, presented for purposes of comparison, were audited by another independent auditor who issued a qualified report thereon dated March 28, 2018 regarding the “Plea bargain agreements, leniency agreements and independent investigation” and emphasis of matters regarding the “Restatement of the financial statements for the prior year”, ”Significant investigation and judicial procedures” and “Credit line preservation agreements”.
Statements of value added
The individual and consolidated statements of value added (DVA) for the year ended December 31, 2018, prepared under the responsibility of the Company’s Management, the presentation of which is required by Brazilian Corporation Law for public companies and considered supplemental information by IFRS have been submitted to auditing procedures performed in conjunction with our audit of the Company’s financial statements. In forming our opinion, we evaluated if these statements are reconciled to the financial statements and accounting records, as applicable, and if their form and content are in accordance with the criteria defined in Technical Pronouncement CPC 09 – Statement of Value Added. In our opinion, these statements of value added were appropriately prepared, in all material respects, according to the criteria defined in said Technical Pronouncement and are consistent in relation to the individual and consolidated financial statements taken as a whole.
8

© 2019 Grant Thornton Auditores Independentes. All rights reserved. │ JBS S.A.
Information other than the individual and consolidated financial statements and auditor’s report thereon The Company’s Management is responsible for this other information that is included in the Management Report.
Our opinion on the individual and consolidated financial statements does not cover the Management Report and we do not, and will not, express any form of assurance conclusion thereon.
In connection with our audit of the individual and consolidated financial statements, our responsibility is to read the Management Report and, in doing so, consider whether this report is materially inconsistent with the financial statements or our knowledge obtained in the audit, or otherwise appears to be materially misstated. If, based on the work we have performed, we conclude that there is a material misstatement in Management Report, we are required to report this fact. We have nothing to report in this regard.
Responsibility of management and those charged with governance for the individual and consolidated financial statements The Company’s Management is responsible for the preparation and fair presentation of the individual and consolidated financial statements in accordance with accounting practices adopted in Brazil and the International Financial Reporting Standards (IFRS), issued by the International Accounting Standards Board (IASB), and for such internal control as Management determines is necessary to enable the preparation of financial statements that are free from material misstatement, whether due to fraud or error.
In preparing the individual and consolidated financial statements, Management is responsible for assessing the Company’s ability to continue as a going concern, disclosing, as applicable, matters related to going concern and using the going concern basis of accounting in preparing the financial statements, unless Management either intends to liquidate the Company and its subsidiaries or to cease operations, or has no realistic alternative to avoid doing so.
Those charged with the Company’s and its subsidiaries’ governance are those responsible for overseeing the financial reporting process.
Auditor’s responsibility for the audit of the individual and consolidated financial statements Our objectives are to obtain reasonable assurance about whether the individual and consolidated financial statements, taken as a whole, are free from material misstatement, whether due to fraud or error, and to issue an auditor’s report that includes our opinion. Reasonable assurance is a high level of assurance but is not a guarantee that an audit conducted in accordance with Brazilian and International Standards on Auditing will always detect a material misstatement when it exists. Misstatements can arise from fraud or error and are considered material if, individually or in the aggregate, they could reasonably be expected to influence the economic decisions of users taken on the basis of these financial statements.
As part of an audit in accordance with Brazilian and International Standards on Auditing, we exercise professional judgment and maintain professional skepticism throughout the audit. In addition, we:
• Identify and assess the risks of material misstatement of the individual and consolidated financialstatements, whether due to fraud or error, design and perform audit procedures responsive to thoserisks, and obtain audit evidence that is sufficient and appropriate to provide a basis for our opinion.The risk of not detecting a material misstatement resulting from fraud is higher than for one resultingfrom error, as fraud may involve override of internal control, collusion, forgery, intentional omissions ormisrepresentations;
• Obtain an understanding of internal control relevant to the audit in order to design audit proceduresthat are appropriate in the circumstances, but not for the purpose of expressing an opinion on theeffectiveness of the Company’s and its subsidiaries’ internal control;
• Evaluate the appropriateness of accounting policies used and the reasonableness of accountingestimates and related disclosures made by Management;
9

© 2019 Grant Thornton Auditores Independentes. All rights reserved. │ JBS S.A.
• Conclude on the appropriateness of Management’s use of the going concern basis of accounting and,based on the audit evidence obtained, whether a material uncertainty exists related to events orconditions that may cast significant doubt on the Company’s and its subsidiaries’ ability to continue asa going concern. If we conclude that a material uncertainty exists, we are required to draw attention inour auditor’s report to the related disclosures in the individual and consolidated financial statementsor, if such disclosures are inadequate, to modify our opinion. Our conclusions are based on the auditevidence obtained up to the date of our auditor’s report. However, future events or conditions maycause the Company and its subsidiaries to cease to continue as a going concern;
• Evaluate the overall presentation, structure and content of the financial statements, including thedisclosures, and whether the individual and consolidated financial statements represent the underlyingtransactions and events in a manner that achieves fair presentation;
• Obtain sufficient and appropriate audit evidence regarding the financial information of the entities orbusiness activities within the Group to express an opinion on the consolidated financial statements.We are responsible for the direction, supervision and performance of the Group audit and,consequently, for the audit opinion.
We communicate with those charged with governance regarding, among other matters, the planned scope and timing of the audit and significant audit findings, including any significant deficiencies in internal control that we identify during our audit.
We also provide those charged with governance with a statement that we have complied with relevant ethical requirements, including those regarding independence, and communicate to them all relationships and other matters that may reasonably be thought to bear on our independence and, where applicable, related safeguards.
From the matters communicated with those charged with governance, we determined those matters that were of most significance in the audit of the financial statements for the current year and are, therefore, the key audit matters (KAM). We describe these matters in our audit report, unless laws or regulations preclude public disclosure of the matter or when, in extremely rare circumstances, we determine that a matter should not be communicated in our report because the adverse consequences of doing so would reasonably be expected to outweigh the public interest benefits of such communication.
São Paulo, March 28, 2019
Alcides Afonso Louro Neto Assurance Partner
Grant Thornton Auditores Independentes
10

JBS S.A.
Statements of financial positionIn thousands of Brazilian Reais - R$
Company Consolidated
Note December 31, 2018 December 31, 2017 December 31, 2018 December 31, 2017
ASSETS
CURRENT ASSETS
Cash and cash equivalents 5 1,764,193 2,138,802 8,935,779 11,741,308
Trade accounts receivable 6 2,729,066 2,302,913 9,657,010 9,333,291
Inventories 7 2,005,010 1,823,640 11,311,734 9,684,878
Biological assets 8 — — 3,190,953 2,767,250
Recoverable taxes 9 1,146,685 182,885 2,210,038 974,404
Derivative assets 31 6,303 — 52,797 30,760
Related party receivables 10 — — 701,281 —
Assets held for sale — — — 817,705
Other current assets 163,505 264,807 839,957 755,948
TOTAL CURRENT ASSETS 7,814,762 6,713,047 36,899,549 36,105,544
NON-CURRENT ASSETS
Biological assets 8 — — 1,168,454 967,761
Recoverable taxes 9 6,737,234 5,453,216 9,073,340 7,521,141
Related party receivables 10 828,802 5,059,258 — 897,535
Investments in associates, subsidiaries and joint ventures 11 24,989,925 18,562,666 84,967 64,006
Property, plant and equipment 12 11,186,287 11,544,181 35,109,179 33,563,104
Deferred income taxes 22 — — 1,159,445 434,861
Intangible assets 13 89,806 94,739 5,819,296 5,512,070
Goodwill 14 9,085,970 9,085,970 23,775,575 22,488,247
Other non-current assets 550,639 512,486 1,056,026 1,141,682
TOTAL NON-CURRENT ASSETS 53,468,663 50,312,516 77,246,282 72,590,407
TOTAL ASSETS 61,283,425 57,025,563 114,145,831 108,695,951
The accompanying notes are an integral part of the financial statements.
11

JBS S.A.
Statements of financial positionIn thousands of Brazilian Reais - R$
Company Consolidated
Note December 31, 2018 December 31, 2017 December 31, 2018 December 31, 2017
LIABILITIES AND EQUITY
CURRENT LIABILITIES
Trade accounts payable 15 2,333,255 2,029,104 13,075,615 9,992,778
Loans and financing 16 1,868,061 8,223,197 2,922,635 13,526,051
Income taxes 18 — — 202,665 905,484
Accrued income taxes and other taxes 18 299,480 233,566 525,521 461,034
Accrued payroll and social charges 19 771,936 598,303 3,508,585 3,034,053
Dividends payable 20 6,566 127,463 6,566 127,463
Other financial liabilities 21 24,017 7,659 45,537 73,156
Derivative liabilities 31 23,602 10 210,015 118,684
Liabilities held for sale — — — 23,305
Other current liabilities 897,419 699,211 1,104,577 917,333
TOTAL CURRENT LIABILITIES 6,224,336 11,918,513 21,601,716 29,179,341
NON-CURRENT LIABILITIES
Loans and financing 16 13,674,207 11,834,158 53,230,893 43,498,600
Accrued income taxes and other taxes 18 704,382 667,388 842,268 787,223
Accrued payroll and social charges 19 3,167,443 1,434,838 3,740,541 1,848,200
Other financial liabilities 21 18,227 24,827 23,676 39,868
Deferred income taxes 22 1,853,179 1,965,792 3,483,539 3,697,195
Provisions 23 1,946,122 1,820,007 2,696,645 2,888,150
Related party payables 10 8,033,436 3,018,787 — —
Other non-current liabilities 15,097 53,641 580,344 616,706
TOTAL NON-CURRENT LIABILITIES 29,412,093 20,819,438 64,597,906 53,375,942
EQUITY 24
Share capital - common shares 23,576,206 23,576,206 23,576,206 23,576,206
Capital reserve (255,699) (289,295) (255,699) (289,295)
Other reserves 62,480 67,906 62,480 67,906
Profit reserves 1,869,306 2,277,205 1,869,306 2,277,205
Accumulated other comprehensive income (loss) 394,703 (1,344,410) 394,703 (1,344,410)
Attributable to company shareholders 25,646,996 24,287,612 25,646,996 24,287,612
Attributable to non-controlling interest — — 2,299,213 1,853,056
TOTAL EQUITY 25,646,996 24,287,612 27,946,209 26,140,668
TOTAL LIABILITIES AND EQUITY 61,283,425 57,025,563 114,145,831 108,695,951
The accompanying notes are an integral part of the financial statements.
12

JBS S.A.
Statements of income (loss) for the years ended December 31, 2018 and 2017 In thousands of Brazilian Reais - R$
Company ConsolidatedNote 2018 2017 2018 2017
NET REVENUE 25 27,374,926 23,373,308 181,680,244 163,169,981
Cost of sales (22,424,025) (19,616,009) (155,340,054) (139,397,749)
GROSS PROFIT 4,950,901 3,757,299 26,340,190 23,772,232
General and administrative expenses (4,983,159) (4,707,600) (8,587,555) (8,216,252)
Selling expenses (2,050,350) (1,932,182) (10,421,995) (8,861,996)
Other expense (17,603) (157,979) (388,096) (525,234)
Other income 54,966 311,212 214,863 559,702
OPERATING EXPENSE (6,996,146) (6,486,549) (19,182,783) (17,043,780)
OPERATING PROFIT (LOSS) (2,045,245) (2,729,250) 7,157,407 6,728,452
Finance income 26 1,332,305 2,223,849 1,404,446 1,986,856
Finance expense 26 (5,688,807) (4,555,613) (9,686,666) (7,582,182)
(4,356,502) (2,331,764) (8,282,220) (5,595,326)
Share of profit of equity-accounted investees, net of tax 11 4,631,240 4,979,341 26,455 18,630
PROFIT (LOSS) BEFORE TAXES 22 (1,770,507) (81,673) (1,098,358) 1,151,756
Current income taxes 22 1,685,889 649,610 247,388 (1,274,652)
Deferred income taxes 22 109,817 (33,735) 1,061,086 1,148,365
1,795,706 615,875 1,308,474 (126,287)
NET INCOME 25,199 534,202 210,116 1,025,469
ATTRIBUTABLE TO:
Company shareholders 25,199 534,202
Non-controlling interest 184,917 491,267
210,116 1,025,469
Basic earnings per share - common shares (R$) 27 0.01 0.19 0.01 0.19
Diluted earnings per share - common shares (R$) 27 0.01 0.19 0.01 0.19
The accompanying notes are an integral part of the financial statements.
13

JBS S.A.
Statements of comprehensive income for the years ended December 31, 2018 and 2017 In thousands of Brazilian Reais - R$
Company Consolidated
Reference 2018 2017 2018 2017
Net income IS 25,199 534,202 210,116 1,025,469
Other comprehensive income
Items that may be subsequently reclassified to profit or loss:
Foreign currency translation adjustments SCSE 1,739,113 1,836,031 1,983,142 1,880,106
Total comprehensive income 1,739,113 1,836,031 1,983,142 1,880,106
Other comprehensive income 1,764,312 2,370,233 2,193,258 2,905,575
Total comprehensive income attributable to:
Company shareholders SCSE 1,764,312 2,370,233 1,764,312 2,370,233
Non-controlling interest SCSE — — 428,946 535,342
1,764,312 2,370,233 2,193,258 2,905,575
The accompanying notes are an integral part of the financial statements.
14
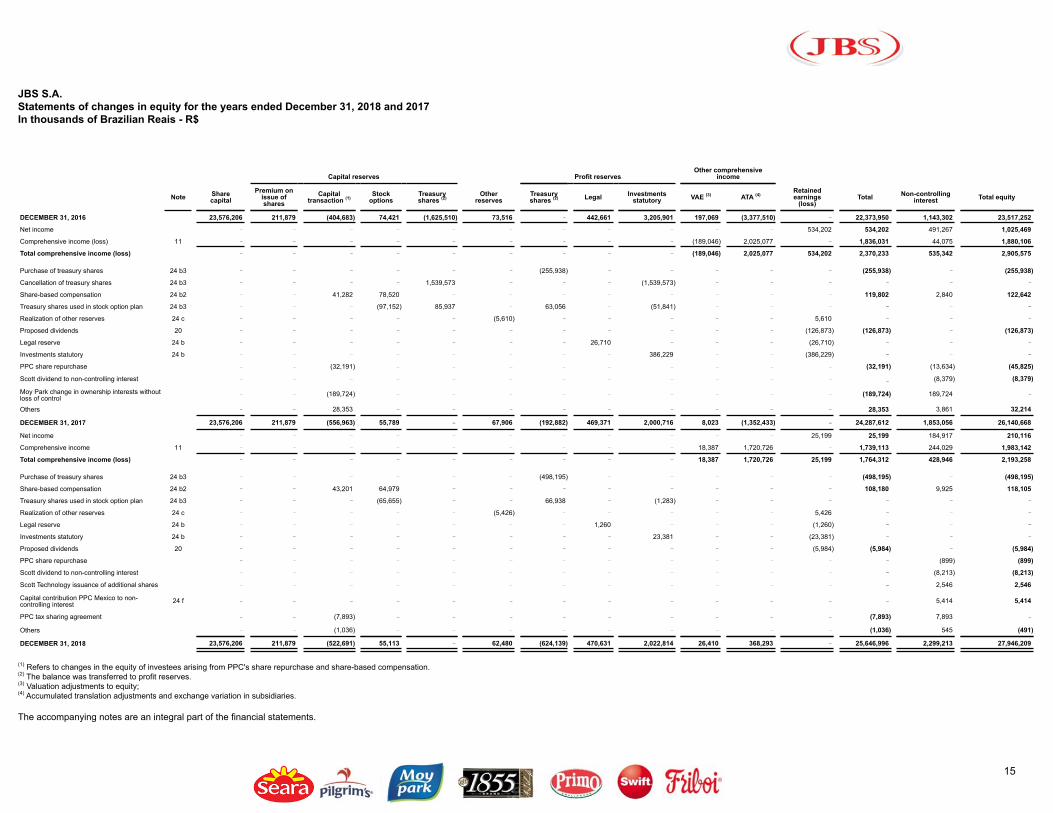
JBS S.A.Statements of changes in equity for the years ended December 31, 2018 and 2017 In thousands of Brazilian Reais - R$
Capital reserves Profit reservesOther comprehensive
income
Note Sharecapital
Premium onissue ofshares
Capitaltransaction (1)
Stockoptions
Treasuryshares (2)
Otherreserves
Treasuryshares (2) Legal Investments
statutory VAE (3) ATA (4)Retainedearnings
(loss)Total Non-controlling
interest Total equity
DECEMBER 31, 2016 23,576,206 211,879 (404,683) 74,421 (1,625,510) 73,516 — 442,661 3,205,901 197,069 (3,377,510) — 22,373,950 1,143,302 23,517,252
Net income — — — — — — — — — — — 534,202 534,202 491,267 1,025,469
Comprehensive income (loss) 11 — — — — — — — — — (189,046) 2,025,077 — 1,836,031 44,075 1,880,106
Total comprehensive income (loss) — — — — — — — — — (189,046) 2,025,077 534,202 2,370,233 535,342 2,905,575
Purchase of treasury shares 24 b3 — — — — — — (255,938) — — — — — (255,938) — (255,938)
Cancellation of treasury shares 24 b3 — — — — 1,539,573 — — — (1,539,573) — — — — — —
Share-based compensation 24 b2 — — 41,282 78,520 — — — — — — — — 119,802 2,840 122,642
Treasury shares used in stock option plan 24 b3 — — — (97,152) 85,937 — 63,056 — (51,841) — — — — — —
Realization of other reserves 24 c — — — — — (5,610) — — — — — 5,610 — — —
Proposed dividends 20 — — — — — — — — — — — (126,873) (126,873) — (126,873)
Legal reserve 24 b — — — — — — — 26,710 — — — (26,710) — — —
Investments statutory 24 b — — — — — — — — 386,229 — — (386,229) — — —
PPC share repurchase — — (32,191) — — — — — — — — — (32,191) (13,634) (45,825)
Scott dividend to non-controlling interest — — — — — — — — — — — —— (8,379) (8,379)
Moy Park change in ownership interests withoutloss of control
— — (189,724) — — — — — — — — — (189,724) 189,724 —
Others — — 28,353 — — — — — — — — — 28,353 3,861 32,214
DECEMBER 31, 2017 23,576,206 211,879 (556,963) 55,789 — 67,906 (192,882) 469,371 2,000,716 8,023 (1,352,433) — 24,287,612 1,853,056 26,140,668
Net income — — — — — — — — — — — 25,199 25,199 184,917 210,116
Comprehensive income 11 — — — — — — — — — 18,387 1,720,726 — 1,739,113 244,029 1,983,142
Total comprehensive income (loss) — — — — — — — — — 18,387 1,720,726 25,199 1,764,312 428,946 2,193,258
Purchase of treasury shares 24 b3 — — — — — — (498,195) — — — — — (498,195) — (498,195)
Share-based compensation 24 b2 — — 43,201 64,979 — — — — — — — — 108,180 9,925 118,105
Treasury shares used in stock option plan 24 b3 — — — (65,655) — — 66,938 — (1,283) — — — — — —
Realization of other reserves 24 c — — — — — (5,426) — — — — — 5,426 — — —
Legal reserve 24 b — — — — — — — 1,260 — — — (1,260) — — —
Investments statutory 24 b — — — — — — — — 23,381 — — (23,381) — — —
Proposed dividends 20 — — — — — — — — — — — (5,984) (5,984) — (5,984)
PPC share repurchase — — — — — — — — — — — — — (899) (899)
Scott dividend to non-controlling interest — — — — — — — — — — — — — (8,213) (8,213)
Scott Technology issuance of additional shares — — — — — — — — — — — — — 2,546 2,546
Capital contribution PPC Mexico to non-controlling interest 24 f — — — — — — — — — — — — — 5,414 5,414
PPC tax sharing agreement — — (7,893) — — — — — — — — — (7,893) 7,893 —
Others — — (1,036) — — — — — — — — — (1,036) 545 (491)
DECEMBER 31, 2018 23,576,206 211,879 (522,691) 55,113 — 62,480 (624,139) 470,631 2,022,814 26,410 368,293 — 25,646,996 2,299,213 27,946,209
(1) Refers to changes in the equity of investees arising from PPC's share repurchase and share-based compensation.(2) The balance was transferred to profit reserves.(3) Valuation adjustments to equity;(4) Accumulated translation adjustments and exchange variation in subsidiaries.
The accompanying notes are an integral part of the financial statements.
15

JBS S.A.Statements of cash flows for the years ended December 31, 2018 and 2017In thousands of Brazilian Reais - R$
Company Consolidated
Notes 2018 2017 2018 2017
Cash flows from operating activities
Net income 25,199 534,202 210,116 1,025,469
Adjustments for:
Depreciation and amortization 7, 12 and 13 773,504 776,207 4,804,977 4,471,669Allowance for doubtful accounts 6 211,680 88,210 239,778 90,359Share of profit of equity-accounted investees 11 (4,631,240) (4,979,341) (26,455) (18,630)(Gain) loss on assets sales 11,196 11,797 15,669 36,177Tax expense 22 (1,795,706) (615,875) (1,308,474) 126,287Finance expense (income), net 26 4,356,502 2,331,764 8,282,220 5,595,326Share-based compensation 24 64,979 78,520 118,105 122,642Provisions 23 250,507 100,640 84,584 233,421Impairment 12 71,695 (53,200) 156,465 (34,680)(Gain) loss with the divestment program 11 6,684 (161,914) 68,658 (162,762)Obsolete inventory accrual 7 — — 59,367 —
Tax payable in installments 2,421,631 2,228,397 2,475,290 2,228,397Impacts from the leniency agreement 23 80,520 34,552 80,520 34,552
1,847,151 373,959 15,260,820 13,748,227Changes in assets and liabilities:
Trade accounts receivable (405,520) 145,610 673,185 (234,035)Inventories (185,738) (150,138) (632,125) 46,827Recoverable taxes (442,004) 264,000 (693,266) 31,372Other current and non-current assets 25,735 123,381 (333,265) (103,720)Biological assets — — (1,502,660) (1,103,837)Trade accounts payable 278,896 (56,852) 1,870,181 (948,219)Tax payable in installments (436,458) (1,200,838) (440,910) (1,220,797)Other current and non-current liabilities (66,186) (143,156) (227,585) (479,956)Income taxes paid — — (2,507,727) (1,037,432)
Changes in operating assets and liabilities (1,231,275) (1,017,993) (3,794,172) (5,049,797)
Cash provided by (used in) operating activities 615,876 (644,034) 11,466,648 8,698,430
Interest paid (1,558,265) (1,518,337) (4,395,033) (3,910,731)Interest received 377,725 428,317 370,874 416,275
Net cash of interest provided by (used in) operating activities (564,664) (1,734,054) 7,442,489 5,203,974
Cash flow from investing activitiesPurchases of property, plant and equipment 12 (454,815) (858,278) (2,896,846) (3,111,969)Purchases of intangible assets 13 (17,466) (14,344) (25,565) (20,389)Proceeds from sale of property, plant and equipment 12 207,279 89,100 327,001 232,824Proceeds from sale of intangible assets 13 638 — 9,265 3,448Additional investments in joint-ventures and subsidiaries 11 (1,051) (136,906) — —
Incorporation of subsidiaries, net of incorporation cash 11 2,838 — — —
Acquisitions, net of cash acquired 4 — — (45,066) (1,848,390)Assets held for sale, net of cash — — 622,235 (52,898)Dividends and liquidation funds received 11 9,327 100,214 5,500 10,000Proceeds from the divestment program 6,616 1,750,194 6,616 1,858,253Proceeds from Moy Park transference to PPC — 3,318,312 — —
Related party transactions 10 7,654,049 (178,618) 254,125 492,837Other — 255 — 9,860
Cash provided by (used in) investing activities 7,407,415 4,069,929 (1,742,735) (2,426,424)
Cash flow from financing activitiesProceeds from loans and financings 16 149,143 3,541,694 10,925,327 26,348,158Payments of loans and financings 16 (7,023,786) (8,139,891) (20,424,607) (26,676,790)Derivatives instruments received/settled 31 128,142 11,370 132,083 95,304Dividends paid (126,883) (89,339) (126,883) (93,354)Dividends paid to non-controlling interest — — (8,213) (8,389)Capital contribution PPC Mexico to non-controlling interest 24 — — 5,414 —
PPC share repurchase — — (899) (61,186)Purchase of treasury shares 24 (498,195) (255,938) (498,195) (255,938)
Others — 4 6,906 17,822
Cash used in financing activities (7,371,579) (4,932,100) (9,989,067) (634,373)
Effect of exchange rate changes on cash and cash equivalents 154,219 22,231 1,483,784 242,509Net change in cash and cash equivalents (374,609) (2,573,994) (2,805,529) 2,385,686
Cash and cash equivalents beginning of period 2,138,802 4,712,796 11,741,308 9,355,622
Cash and cash equivalents at the end of period 1,764,193 2,138,802 8,935,779 11,741,308
16

Non-cash transactions:
Company Consolidated
Notes 2018 2017 2018 2017
Increase in share capital in subsidiaries' through assumption of credit 11 — 100,649 — —
Negative investment transference 11 216,442 66,308 — —
Deferred tax write off offsetting investments 22 — (72,467) — (72,467)
Dividends received through settlement of related parties 11 — (2,936) — —
Investments transference to assets held for sale 11 — (597,684) — —
Treasury shares cancellation 24 b3 — 1,539,573 — 1,539,573
Payments of loans through settlement of related parties 10 (375,751) 1,800,240 — —
Tax credit assignment with Flora 10 23,783 25,108 23,783 25,108
Treasury shares used in stock option plan 24 b2 66,938 — 66,938 —
Related parties compensation through deferred tax credits acquisition 10 — 754,783 — —
PERT compensation of debts with tax credits 19 369,759 1,312,564 372,554 1,460,932
Compensation reversal of recoverable taxes with accrued payroll and social charges 19 169,258 1,659,460 169,258 1,659,460
Moy Park loss of ownership 11 — (189,724) — —
Capital contribution in subsidiaries' through property assignment 11 and 12 78,281 — — —
Assets addition through capital reduction in subsidiaries 11 — (68,336) — —
Payment for PPE acquisition 13 — — 74,218 —
Incorporation of subsidiaries 11 246,563 — — —
BR Frango PP&E acquisition through assumption of debt 12 — — — (224,143)
Liquidation of subsidiaries 11 (15) — — —
Dividends declared but not paid 20 (5,984) (126,873) (5,984) (126,873)
The accompanying notes are an integral part of the financial statements.
17

JBS S.A.
Economic value added the years ended December 31, 2018 and 2017In thousands of Brazilian Reais - R$
Company Consolidated2018 2017 2018 2017
RevenueSales of goods and services 28,053,468 23,974,633 183,378,719 165,176,474Other income (expense) (6,595) 119,273 (39,900) 194,964Allowance for doubtful accounts (211,680) (88,210) (239,778) (90,359)
27,835,193 24,005,696 183,099,041 165,281,079GoodsCost of services and goods sold (19,822,951) (17,110,505) (113,285,156) (102,846,695)Materials, energy, services from third parties and others (3,683,433) (3,386,689) (30,097,954) (25,909,139)
(23,506,384) (20,497,194) (143,383,110) (128,755,834)
Gross added value 4,328,809 3,508,502 39,715,931 36,525,245
Depreciation and Amortization (773,504) (776,207) (4,804,977) (4,471,669)
Net added value generated 3,555,305 2,732,295 34,910,954 32,053,576
Net added value by transferShare of profit of equity-accounted investees, net of tax 4,631,240 4,979,341 26,455 18,630Financial income 1,332,305 2,223,849 1,404,446 1,986,856Others 78,138 61,887 (58,683) (38,345)NET ADDED VALUE TOTAL TO DISTRIBUTION 9,596,988 9,997,372 36,283,172 34,020,717
DISTRIBUTION OF ADDED VALUELaborSalaries 2,033,329 1,982,381 18,396,302 16,311,770Benefits 252,129 240,694 3,246,969 2,850,481FGTS (Brazilian Labor Social Charge) 131,185 119,600 280,629 263,693
2,416,643 2,342,675 21,923,900 19,425,944Taxes and contributionFederal 619,409 1,459,921 1,772,723 2,786,468State 735,900 992,178 1,419,239 1,760,570Municipal 16,722 17,892 17,822 27,671
1,372,031 2,469,991 3,209,784 4,574,709Capital Remuneration from third partiesInterests and exchange variation 5,534,933 4,491,225 9,331,121 7,423,950Rents 95,076 149,793 948,907 753,916Others 153,106 9,486 659,344 816,729
5,783,115 4,650,504 10,939,372 8,994,595Owned capital remunerationDividends (5,984) (126,873) (5,984) (126,873)Net income (loss) attributable to company shareholders 31,183 661,075 31,183 661,075Non-controlling interest — — 184,917 491,267
25,199 534,202 210,116 1,025,469ADDED VALUE TOTAL DISTRIBUTED 9,596,988 9,997,372 36,283,172 34,020,717
The accompanying notes are an integral part of the financial statements.
18

JBS S.A.Notes to the financial statements for the years ended December 31, 2018 and 2017(Expressed in thousands of Brazilian reais)
1 Operating activities
JBS S.A ("JBS" or the "Company"), is a company listed on the "Novo Mercado" segment of the São Paulo Stock Exchange (B3 - Bolsa de Valores, Mercadorias & Futuros) underthe ticker symbol "JBSS3". JBS also trades it’s American Depository Receipts over-the-counter under the symbol "JBSAY". The Company’s registered office is Avenida MarginalDireita do Tietê, 500, Vila Jaguara, São Paulo, Brazil.
The Company along with its subsidiaries ("Company" or "Consolidated") is the world's largest company in processing animal protein as measured by total revenue.
The issuance of these consolidated financial statements was authorized by the Board of Directors on March 28, 2019.
The financial statements presented herein include the Company’s individual operations in Brazil as well as the activities of its subsidiaries. Below is a summary of the Company’smain operating activities by entity and geographic location, as well as ownership percentage as of December 31, 2018 and December 31, 2017.
Company
Description Activities Units State
JBS S.A.(JBS, Company)
- Beef processing: slaughter, cold storage and production of canned and beef by-products.
76AC, BA, CE, ES, GO, MG,MS, MT, PA, PE, PR, RJ,RO, RS, SC, SP, TO
- Leather production, processing and commercialization.
- Production and commercialization of steel cans, plastic resin, soap base for production, soap bar,biodiesel, glycerin, fatty acid, collagen and wrapper derived from cattle tripe; management of industrialresidue; soybeans purchase and sale, tallow, palm oil, caustic soda, stearin, transportation services,dog biscuits, direct sales to customers of beef and related items by stores named "Mercado da Carne";production, cogeneration and commercialization of electric power.- Distribution centers and harbors.
Consolidated: Main activities in Brazil
Description Activities Units State ParticipationDecember31, 2018
December31, 2017
Seara Alimentos Ltda. (SearaAlimentos)
- Chicken and pork processing: raising, slaughtering and processingof broiler chickens and hogs; production and commercialization ofbeef and food products; and production of pet food and concentrates.- Distribution centers and harbors.
52
BA, CE, DF,MG, MS, MT,PE, PR, RJ,RN, RS, SC
and SP
Direct 100% 100%
Meat Snacks Partners doBrasil Ltda (Meat Snacks) - Beef Jerky production. 2 SP Indirect 50% 50%
Enersea Comercializadora deEnergia Ltda. (Enersea) - Commercialization of eletric power. 2 SC and SP Direct 99.99% 99.99%
JBS Confinamento Ltda. (JBSConfinamento) - Cattle fattening services. 6 SP, GO, MS
and MT Direct 100% 100%
Brazservice Wet Leather S.A(Brazservice) - Production, processing and commercialization of wet blue leather. 1 MT Direct 100% 100%
Consolidated: Main activities outside of Brazil
Description Activities Units Country ParticipationDecember31, 2018
December31, 2017
JBS USA Holding Lux, S.à.r.l.(JBS USA)
- Beef, pork and lamb processing : slaughter, cold storage,production of by-products;- Chicken processing: raising, slaughtering and processing of broilerchickens, production and commercialization of products derivedfrom processing operations;- Cattle fattening services;- Transportation services.
237
Australia,Canada,
Luxembourg,Mexico,
Netherlands,United
Kingdom andUnited States
of America
Indirect 100% 100%
JBS Global UK, Friboi (JBSGlobal UK)
- Trading fresh and processed beef, pork, lamb and chicken productsfor the European market. 1 United
Kingdom Indirect 100% 100%
JBS Toledo NV (Toledo)- Trading operations for the European market; cooked frozen meatcommercialization; logistic operations; warehousing; customizationand new products development.
1 Belgium Indirect 100% 100%
Rigamonti Salumificio SpA(Rigamonti) - Bresaola production and commercialization. 3 Italy Direct 100% 100%
Conceria Priante (Priante) - Semi-finished and finished leather production. 1 Italy Direct 100% 100%
JBS Leather International(Leather International) - Wet blue, semi-finished and finished leather production. 17
Argentina,Germany,
Hong Kong,Netherlands,
Paraguay andUruguay
Direct 100% 100%
Seara Holding Europe B.V.(Seara Holding) - Animal protein products trading. 1 Netherlands Indirect 100% 100%
19

2 Plea bargain agreement, Leniency agreement and the impacts in the financial statements
As is public knowledge, in May 2017 certain executives and former executives of J&F Investimentos S.A. (“J&F”), the holder of a group of companies that belong to the “J&F Group,”took over certain obligations in the Plea Bargain Agreement with the District Attorney General's Office ("PGR"), focusing on meeting the public interest, specially the furtherdevelopment of investigations around illegal events.
In June 2017, J&F entered in a Leniency Agreement (“Agreement”) with the Federal Public Prosecutor’s Office (“MPF”) which was approved by the MPF's 5ª Chamber in August24, 2017.
In the Agreement, J&F commits on behalf of itself and its subsidiaries to cooperate voluntarily with the Government carrying out internal investigations and providing proof to ensurethe materiality and origin of the actions committed and confessed. J&F has also agreed to reimburse damages and losses from the events related to the Plea bargain Agreementin the amount of R$10.3 billion over the next 25 years, with due dates starting on December 2017. The Company and its Brazilian subsidiaries entered the Agreement in September6, 2017.
J&F, as a result of its adherence to the Agreement in a national territory (Brazil) scope, and due to the Company keeping market transactions and having investments in companiesbased in other countries, is maintaining contact and providing information to the United States Department of Justice (DoJ). Regarding the other foreign authorities in other countries,the Company and its subsidiaries do not maintain any negotiation. According to JBS USA's financial statements for the years ended December 31, 2018, which have an auditedreport dated February 14, 2019 updated with subsequent events until the date of the issuance of this financial statement, there is no mention of other facts or events about theongoing independent investigations held besides those already described above.
The Company and its subsidiaries are in compliance with the Agreement's guidelines and are implementing a compliance program, consisting of internal policies and proceduresrelated to anticorruption, as well the improvement of the ethical code, implementation of a complaints channel, training staff, investigative procedures, and other disciplinary measures.Such actions and the timeline thereof are aligned with the Agreements.
2.1 Independent Internal investigations
Conducting an internal investigation related to the facts presented in the plea bargain agreement involving the Company is one of the obligations set in the Agreement. Therefore,J&F hired for the Company and its subsidiaries an independent law firm and forensic specialists (“Legal Advisors”), which during the third quarter of 2017, initiated an independentinternal investigation related to the events described above.
Also, according to one of the obligations imposed by the Agreement, an Independent Supervision Committee ("CSI") was created and one its main responsibility was to approvethe hiring of the Legal Advisors, who report directly to the CSI, including the scope and plans of the work done.
The independent Internal investigations follow international best practices and are still ongoing and until the approval of these financial statements, no new events were identified.The Company's Management has concluded, based on internal analytical procedures adopted, the impacts on its financial statements which were disclosed and recognized in itsfinancial statements of the year ended December 31, 2017 and the accrual is reviewed and updated quarterly.
2.2 Compliance Program
The Company structured a compliance program named "Always Do It Right", created to prevent conducts of employees and third parties that might disagree with the Company'sCode of Conduct and Ethics, laws, regulations and/or internal procedures. This structure reports directly to the Board of Directors and acts independently. Their are also responsiblefor monitoring and implementing trainings related to compliance matters, management of the complaints channel, periodical risk assessments, internal control implementationincluding anti-corrupting matters, reputation analysis of third parties (due diligence), among other activities related to this department.
JBS S.A.Notes to the financial statements for the years ended December 31, 2018 and 2017(Expressed in thousands of Brazilian reais)
3 Basis of preparation
The consolidated financial statements were prepared in accordance with accounting practices adopted in Brazil (BRGAAP), in compliance with the law of joint stock companies(Lei das sociedades por ações - Leis das SA's), pronouncements, interpretations and orientations issued by the Brazilian Accounting Pronouncements Committee (Comitê dePronunciamentos Contábeis) - CPC and requirements of the Brazilian Securities Commission - CVM and with the International Financial Reporting Standards (IFRS) issued byInternational Accounting Standards Board (IASB). The accounting practices adopted in Brazil require the disclosure of the Economic Value Added (Demonstração do Valor Adicionado- DVA), individual and consolidated, while the IFRS rules do not require its disclosure. As a consequence, due to IFRS rules, DVA is disclosed as supplementary information withoutany loss to these consolidated financial statements. The Company individual financial statements are identified as "Company" and the consolidated financial statements are identifiedas "Consolidated".
The presentation of our financial condition and results of operation requires that certain judgments and estimates be made regarding the effects of matters that are inherentlyuncertain and that impact the carrying value of assets and liabilities. Significant assets and liabilities that are subject to these estimates include the useful life of the property, plantand equipment, estimated fair value and value in-use of long-lived assets, allowance for doubtful accounts, inventories, deferred income taxes, provisions for tax, civil, and laborliabilities, determining the fair value of financial instruments (assets and liabilities) and other similar estimates. The settlement of a transaction involving these estimates may resultin values that are different from those estimated. Certain of our accounting policies require higher degrees of judgment than others in their application. Actual results may differ fromthose estimated depending upon the variables, assumptions or conditions used by Management.
Significant accounting policies related to property plant and equipment, inventory, revenue recognition, reportable segments, loans and financings and other items are describedwithin the primary footnotes of the consolidated financial statements.
In order to provide an understanding regarding how Management forms its judgments about future events, including the variables and assumptions underlying the estimates andthe sensitivity of those judgments to different variables and conditions, below are demonstrated the most significant policies:
a. Accounting for business combinations and impairment of goodwill and intangible assets
The Company made several acquisitions in previous periods which generated goodwill and intangible assets with both indefinite and finite lives, as described in notes 13 - Intangibleassets and 14 - Goodwill.
According to International Financial Reporting Standards (IFRS) 3 “Business Combinations”, the excess of the acquisition price, the amount of any non-controlling interest in theacquiree (when applicable), and the fair value, at the acquisition date, of any previous equity interest in the acquiree over the fair value of the net identifiable asset acquired at thatdate is recorded as goodwill. The acquisition price consists of cash paid, the fair value of equity issued and the fair value of contingent consideration. IFRS 3 does not permit thatgoodwill and intangible assets with indefinite useful lives be amortized however they should be tested at least annually for impairment at December 31.
Management uses judgment to identify tangible and intangible assets and liabilities, valuing such assets and liabilities, and in determining their remaining useful lives. The valuationof these assets and liabilities is based on the assumptions and criteria which include in some cases estimates of future cash flows discounted at the appropriate rates. The use ofdifferent assumptions used for valuation purposes, including estimates of future cash flows or discount rates, may result in differences in the estimates of the value of assetsacquired and liabilities assumed.
Assets and liabilities are initially recognized at the best estimate of fair value. Third party valuation firms are usually engaged to assist in valuing the acquired assets and liabilities.
20

When third parties are involved in developing these estimates, Management evaluates the appropriateness of the significant inputs and assumptions used in the valuation estimates,which often involves an iterative process with the third party appraisers. The qualifications and reputation of the third party appraisers are also evaluated and assess the reasonablenessof the overall fair value measurements through comparison to other acquisitions. Through this process, sufficient information are obtained to ascertain that the valuation methodologiesused comply with IFRS 13 “Fair Value Measurement”.
The estimates of the fair value of assets acquired and liabilities assumed are adjusted during the measurement period (which shall not exceed one year, from the date of acquisition),or additional assets and liabilities are recognized to reflect new information relating to the facts and circumstances existing at the acquisition date which, if known, would haveaffected the amounts recognized on that date. These adjustments are infrequent and have historically not been material.
For impairment testing, assets are grouped together into the group of assets that generates cash inflows from continuing use that are largely independent of the cash inflows ofother assets or cash generating units (CGUs). Goodwill arising from a business combination is allocated to CGUs or groups of CGUs that are expected to benefit from the synergiesof the combination.
CGUs are tested for impairment annually or whenever events and circumstances indicate that the recoverable amount of the CGU is less than its carrying amount. CGU groupscontaining goodwill are tested for impairment annually and whenever events and circumstances indicate that the recoverable amount may be less than the carrying amount. Therecoverable amount is the higher of fair value less cost to sell or value in-use. The Company first estimates the value in-use of the CGUs and if it is lower than the carrying amount,the Company will estimate the fair value less cost to sell. During the years ended December 31, 2018 and 2017, our estimates of the CGU groups’ value in-use exceeded theircarrying amounts and therefore estimates of fair value less cost to sell were not determined. Our estimates of value in-use contain uncertainties due to judgment in assumptions,including revenue growth, costs and expenses, capital expenditures, working capital and discount rates as described in Note 14. The assumptions are based on Management'sestimatives as well as comparable data from the available market and economic conditions which generate the cash flows.
b. Biological Assets
Management uses estimates and judgments in determining the fair value of live assets, poultry, hogs and cattle that include to market prices, average lifecycle growth, as well asthe laying and reproduction profile. Biological assets are generally carried at cost unless an active market exists. Market prices for cattle and hogs are based on the Company’sknowledge of a limited market for transactions at various points of the consumable and bearer assets’ lifecycle. The fair value from assets already includes all losses related to thebreeding process.
c. Deferred and Current Income Taxes
The Company recognizes deferred tax effects of tax loss carry forwards and cumulative temporary differences between the financial statement carrying amounts and the tax basisof our assets and liabilities. Income taxes are estimated based on regulations in the various jurisdictions where we conduct business. This requires us to estimate our actual currenttax exposure and to assess temporary differences that result from different treatment of certain items for tax and accounting purposes.
A portion of the tax benefit corresponding to the tax losses carried forward may not be recorded as an asset, as Management cannot determine whether realization is probable.Deferred tax assets are regularly reviewed for recoverability and will only be recognized if it is probable that there will be sufficient taxable profit based on historical taxable income,projected future taxable income, and the expected timing of the reversals of existing temporary differences.
Tax losses and negative bases of social contribution in Brazil have no expiration date, however, the annual offset in Brazil is limited to 30% of pretax income. The carryforwardperiods for other jurisdictions are limited to 10 to 20 years.
The carrying amount of a deferred tax asset is reviewed at the end of each reporting period. The carrying amount of a deferred tax asset is reduced to the extent that it is no longerprobable that sufficient taxable profit will be available to allow the benefit of part or all of that deferred tax asset to be utilized. Any such reduction is reversed to the extent that itbecomes probable that sufficient taxable profit will be available. Deferred and Current Income taxes are described in note 22.
d. Provisions
The preparation of consolidated financial statements requires Management to make estimates and assumptions regarding civil, labor and tax matters which affect the valuation ofassets and liabilities at the date of the financial statements, as well as the revenues and expenses during the reported period. In particular, given the uncertain nature of Braziliantax legislation, the assessment of potential tax liabilities requires significant Management judgment.
The Company is subject to lawsuits, investigations and other claims related to employment, environmental, product, taxes and other matters. Management is required to assessthe likelihood of any adverse judgments or outcomes, as well as the amount of probable losses, for these matters.
Provisions are recorded when losses are considered to be probable and the amount can be reliably measured. No provision is recorded if the risk of loss is assessed to be reasonablypossible but not probable. Reasonably possible losses are disclosed in the notes to these financial statements. If the risk of loss is assessed as remote, no provision or disclosureis necessary. The significant provisions are described in Note 23.
e. Financial Instruments
The Company and its subsidiaries recognize their financial assets and liabilities at fair value at the initial recognition, except for trade accounts receivable that measures thetransaction price and subsequently at amortized cost or at fair value through profit or loss based on the business model for asset management s and the contractual cash flowcharacteristics of the financial asset.
Classification
The Company and its subsidiaries classify their financial assets according to the business model adopted for the management of their financial assets, as amended by CPC 48 /IFRS 9, measured at fair value through profit or loss and at amortized cost, as follows:
i. Financial assets at fair value through profit or loss
Financial assets at fair value through profit or loss include financial assets held for trading and financial assets designated at initial recognition at fair value through profit or loss. Inthis category the Company classifies mainly "CDBs and treasury bills" and "Derivative financial instruments".
ii. Amortized cost
They represent financial assets and liabilities whose Company's business model is to maintain financial assets in order to receive contractual cash flows and that exclusivelyconstitute principal and interest payments on the principal amount outstanding. Financial assets at amortized cost are subsequently measured using the effective interest methodand are subject to impairment. Gains and losses are recognized when the asset is written off, modified or has a reduction in the recoverable value. In this category the Companyclassifies mainly "Trade accounts receivable", "Cash and cash equivalents", "Trade accounts payable" and "Loans and financing".
Financial assets and liabilities are compensated and the net amount is presented in the balance sheet when there is a legal right to offset the amounts recognized and there is theintention to liquidate them on a net basis or to realize the asset and settle the liability simultaneously. The legal right should not be contingent on future events and should beapplicable in the normal course of business and in the event of default, insolvency or bankruptcy of the company or the counterparty.
JBS S.A.Notes to the financial statements for the years ended December 31, 2018 and 2017(Expressed in thousands of Brazilian reais)
21

f. Foreign currency translation
Functional and representation currency
The functional currency of a company is the local currency within the primary economic environment in which it operates. These consolidated financial statements are presentedin Brazilian Reais (R$), which is the Company’s presentation and functional currency. All financial information is presented in thousands of reais, except when otherwise indicated.
Transactions in foreign currencies other than a Company’s functional currency are initially measured in the respective functional currencies of each entity using the exchange ratesprevailing at the dates of the transactions. Monetary assets and liabilities denominated in foreign currencies at the reporting date are remeasured at the closing exchange rate onthe statement of financial position. Foreign exchange gains and losses resulting from the settlement of such transactions and from the remeasurement at period end exchangerates of monetary assets and liabilities denominated in foreign currencies are recognized in the statement of income, under the caption “Finance income” or “Finance expense”.
Group companies with a different functional currency
The consolidated financial statements of the subsidiaries located abroad are prepared using each subsidiary’s respective functional currency. The results and financial position ofall entities with a functional currency different from its immediate parent's functional currency and the Group’s presentation currency (R$) are translated into the parent's functionaland Group's presentation currency as follows:
i. assets and liabilities are translated at the current rate at the date of each closing period;ii. income and expenses are translated at the average rate at the date of each closing period; andiii. all resulting exchange differences are recognized in accumulated other comprehensive income (loss), and are presented in the statement of comprehensive income (loss) asforeign currency translation adjustments with in equity.
g. Individual financial statements
The individual financial statements presents the evaluation of investments in associates, subsidiaries and joint ventures by the equity method. In order to reach the same incomestatement and equity attributable to the Company shareholders in the individual and consolidated financial statements, the same adjustments of accounting practice upon theadoption of IFRS and CPCs, were done on both financial statements. The carrying value of these investments includes the breakdown of acquisition costs and goodwill.
h. Consolidated financial statements and investments in associates and joint ventures
The Company consolidates all majority-owned subsidiaries. The Company controls a non-majority owned entity when it is exposed or has the right to variable return resulting withits involvement with the entity and it has the ability to affect those through its power to direct the activities of the entity. Subsidiaries are fully consolidated from the date at whichcontrol is transferred to the Group. Consolidation is discontinued from the date that control ceases.
Investments in associates and joint ventures are recorded by the equity method. An associate is an entity over which the Company has significant influence but does not exercisecontrol. Joint ventures are all entities over which the Company shares control with one or more parties.
Accounting policies of subsidiaries have been changed where necessary to ensure consistency with policies adopted by the Group. Intercompany transactions, balances, incomeand expenses transactions between group companies are eliminated in consolidation.
The non-controlling interest represents the portion of consolidated subsidiaries not owned by the Group and is presented in the consolidated financial statements as a part ofshareholder’s equity, and the net income (loss) attributable to non-controlling interest is presented in the statement of income.
When the Company acquires or disposes of shares of an entity that it already controls, any gains or losses resulting from the difference between the amount paid or received andthe carrying amount of the non-controlling interest on a per share basis is kept at shareholder's equity in the caption of "Capital transactions".
i. Present value adjustment in assets and liabilities
When relevant assets and liabilities are adjusted to present value, considering the following assumptions for the calculation: i) the amount to be discounted; ii) the dates of realizationand settlement; and iii) the discount rate.
j. Standards, amendments and interpretations that are effective
j1. IFRS 9/CPC 48 - Financial instruments
As from January 1, 2018, the Company and its subsidiaries adopted IFRS 9 / CPC 48 - Financial Instruments as a basis for recognition, classification and measurement of financialinstruments. There were also changes in the measuring method for the expectation of loss on financial assets, which is no longer based on historical loss and is carried out basedon the analysis of historical data and expectations of future loss.
The Company and its subsidiaries reviewed the methodology of impairment estimative in accordance with IFRS and did not identify significant impacts with the adoption of thisstandard in relation to the expected loss.
The Company and its subsidiaries apply the simplified approach of IFRS 9 / CPC 48 - Financial Instruments to measure expected credit losses, which uses an allowance for expectedlosses for all accounts receivable. The changes in the methodology did not represent changes in the net balance of accounts receivable from prior years.
Risks of losses on other financial assets are monitored periodically by the Company and its subsidiaries which have not identified credit risks of these assets as of December 31,2018.
In addition, the accounting classification nomenclature of the financial instruments was adapted, without any changes in the way these instruments are subsequently remeasured.
JBS S.A.Notes to the financial statements for the years ended December 31, 2018 and 2017(Expressed in thousands of Brazilian reais)
22

As of January 1, 2018, the Company and its subsidiaries adopted IFRS 9 / CPC 48, for comparative purposes, the balances of financial instruments for the year ended December31, 2017 are shown below with the new classifications:
December 31, 2017 Category
Financial instruments Company Consolidated IAS 39 / CPC 38 IFRS 9 / CPC 48
Cash and cash equivalents 1,074,718 5,884,806 Loans and receivables Amortized cost
Trade accounts receivable 2,302,913 9,333,291 Loans and receivables Amortized cost
Related party receivables 5,059,259 897,535 Loans and receivables Amortized cost
j2. IFRS 15/CPC 47 - Revenue from Contracts with Customers
As from January 1, 2018, the Company and its subsidiaries adopted IFRS 15 / CPC 47 - Revenue from contracts with customers. The standard sets the criteria which an entity willneed to apply to determine revenue measurement and how and when it is recognized, based on five steps: i) identification of contracts with customers; ii) identification of theperformance obligations predicted in the contracts; iii) determination of the price of the transaction; iv) price allocation of the transaction to the performance obligation predicted inthe contracts and v) revenue recognition when the performance obligation is met. The changes establish the criteria for the measurement and recording of sales, in a way that waseffectively carried out with due presentation, as well as the registration for the amounts that the Company and its subsidiaries are entitled to in the operation, considering eventualestimates of loss.
The Company and its subsidiaries have assessed the new standard, from the form of measurement and revenues recognition, bonuses, discounts and returns, as well as significantpolicies, processes and individual contracts; and considering the nature of its sales transactions, in which the performance obligations are clear and the transference of control ofassets is not complex, the accounting policy used by the Company has not changed significantly.
In addition, the Company and its subsidiaries already adopted the standard to recognize bonuses so that net revenue represents the effective value generated in the operation,based on the conditions established with the customers.
k. New standards, amendments and interpretations that are not yet effective
k1. IFRS 16/CPC 6 - Leases
The Company and its subsidiaries will adopt this standard as of January 1, 2019. IFRS 16 replaces existing lease standards.
The Company and its subsidiaries are applying IFRS 16 / CPC 06 (R2) since January 1, 2019, using the modified retrospective approach, on which the effects of the new standardare being recognized on the contracts in force on January 1, 2019, without any changes for comparison purposes of the balances of 2018. The Company and its subsidiaries willrecognize new assets and liabilities for their contracts with the right to use identifiable assets (operating leases).
The contracts identified by the Company refer substantially to leases of real estate, machinery and equipment, operating units, computer equipment, vehicles, among others. Thenature of the expenses related to these leases will be changed and will be recorded as cost of depreciation of lease use right assets in addition to the recognition of interest expenseon lease obligations.
Until December 31, 2018, these expenses were recorded monthly in expense accounts with rental characteristics (operating leases) during the contractual term and the liabilitieswere recognized monthly in accordance with the use of the identifiable asset and / or services rendered, as well as the respective effective payments of the leases.
Due to the need for interpretation and analysis of the volume of contracts from the referred standard, as well as implementation of a control system, the calculated and estimatedimpacts from its adoption may vary. It should also be noted that these new accounting policies are subject to change until the Company presents its first individual and consolidatedfinancial statements that include the initial adoption. Therefore, the Company presents the estimated impacts in minimum and maximum limits expected. The estimated impact onthe financial statements as of January 1, 2019 is an increase from R$200,000 up to R$225,000 in the Company, and from R$3.800.000 to R$4,600,000 in the Consolidated inintangible assets named as "Right of use", offset to a leasing obligation in the same amount in current and non-current liabilities as "Leasing Provision". In the statements of cashflow, the leases previously classified as operating activities,will be considered as financing activities.
The Company and its subsidiaries believe that the liabilities arising from the adoption of this standard are not part of the calculation of the covenants of maximum leverage on loansand financings, described in note 16 - Loans and financing.
k2. IFRIC 23/ICPC 22 - Uncertainty over income tax treatments
The interpretation, effective as of January 1, 2019, clarifies how to apply the recognition and measurement requirements when there is uncertainty about the treatment of taxes onprofit, that is, there are doubts about the acceptance of the treatments adopted by the tax authority applying the requirements of CPC 32. The Company is in the process of evaluatinguncertainties and expects no material impacts on its financial statements.
There are no other standards, changes in standards and interpretations that are not in force that the Company expects to have a material impact arising from its application in itsfinancial statements.
JBS S.A.Notes to the financial statements for the years ended December 31, 2018 and 2017(Expressed in thousands of Brazilian reais)
4 Business Combination
The Company applies the acquisition method to account for business combinations with entities not under common control. The consideration transferred for the acquisition of asubsidiary is the fair value of the assets transferred, the liabilities incurred to the former owners of the acquiree and the cash or equity interests issued by the group. The considerationtransferred includes the fair value of any asset or liability resulting from contingent consideration. Generally all identifiable assets acquired and liabilities and contingent liabilitiesassumed in a business combination are measured initially at their fair values as of the acquisition date. The Company recognizes any non-controlling interest in the acquiree on anacquisition, either at fair value or at the non-controlling interest’s proportionate share of the recognized amounts of the acquiree’s identifiable net assets. Acquisition costs areexpensed as incurred.
Goodwill is initially measured as the excess of the consideration transferred and the fair value of any non-controlling interest in the acquiree (when applicable), and the fair valueat the acquisition date of any previous equity interest in the acquisition, over the fair value of net assets acquired. When the consideration is less than the fair value of the net assetsacquired, the gain is recognized directly in the statement of income of the period as "Bargain gain".
There were no significant business combinations for the year ended December 31, 2018 and during the year ended December 31, 2017, GNP and Plumrose business combinationswere made, which were disclosed in the financial statements from that period.
In January, 2017, the Company's indirect subsidiary PPC, acquired 100% of the membership interest of JFC, LLC and its subsidiaries (together, “GNP”) for a cash purchase ofR$1.1 billion (US$357 million), subject to customary working capital adjustments. GNP is a vertically integrated poultry business based in the state of Minnesota, United States of
23

America. The acquired business has a production capacity of 2.1 million birds per five-day work week in its three plants and further strengthens the Company’s strategic positionin the U.S chicken market.The goodwill generated in this business acquisition is eligible to be deducted for tax purposes in the United States of America.
In March, 2017, the Company’s indirect subsidiary, JBS USA Lux S.A entered into an agreement to acquire Plumrose USA (“Plumrose”) from Danish Crown A/S for a cash purchaseprice of R$731 million (US$230 million) subject to customary working capital adjustments. Plumrose is a US-based bacon, ham and deli meat business that provides branded,cooked and prepared foods. Plumrose operates five prepared foods facilities and two distribution centers offering branded, prepared foods directly to consumers. The acquisitionexpands the Company’s presence in the prepared foods and branded product categories and it was closed in May 1, 2017. The goodwill generated in this business acquisition isnot eligible to be deducted for tax purposes in the United States of America.
The assets acquired and liabilities assumed in the business combinations noted above were have been measured at their fair values at as set forth below:
Acquisition in 2017FAIR VALUE Plumrose GNPCash and cash equivalents 22 31Trade accounts receivable 88,081 57,703Inventories 143,848 96,906Biological assets — 79,643Other assets 449 13,268Property, plant and equipment 416,467 450,720Intangible assets 136,252 410,012ASSETS 785,119 1,108,283
Trade accounts payable 96,339 80,186Other liabilities 15,381 42,102Deferred income taxes 83,283 —
LIABILITIES 195,003 122,288
Net assets and liabilities 590,116 985,995Acquisition price 731,263 1,117,127Goodwill 141,147 131,132
The individual net revenue and net income from the acquisition date through each period end for all business combinations are presented below:
2017
Company Net revenue Net income (loss)GNP 1,405,093 99,146
Plumrose 1,042,353 42,198
Pro-forma information:
Net sales and net income for the Company is presented below on a pro-forma basis assuming the acquisitions occurred at the beginning of the year of each acquisition:
2017Pro-forma net revenue 163,678,852Pro-forma net income (loss) 1,034,684
This pro-forma financial information is presented for informational purposes only and does not purport to represent what the Company's results of operations would have beenhad it completed the acquisition on the date assumed, nor is it necessarily indicative of the results that may be expected in future periods.
The non-material acquisitions for the year ended December 31, 2018 are demonstrated below:
CompanyDate of
acquisition
% of votinginterestsacquired
Acquisitionprice (1) Goodwill
Goodwilldeductible for
taxAlvey Group April 2018 100% 47,837 41,372 NoTransbotics Corporation June 2018 100% 12,872 18,759 Yes
The excess of the acquisition cost over the fair value of the net tangible assets and identifiable intangible assets was regconized as goodwill and the acquisition price was settledwith cash and cash equivalents.
JBS S.A.Notes to the financial statements for the years ended December 31, 2018 and 2017(Expressed in thousands of Brazilian reais)
24

5 Cash and cash equivalents
Cash and cash equivalents include cash on hand and at banks as well as financial investments with original maturities of three months or less. Cash equivalents are short-term,highly liquid investments that are readily convertible to known amounts of cash and which are subject to an immaterial risk of changes in fair value. Cash and cash equivalents iscomprised of the following:
Company Consolidated
December 31, 2018 December 31, 2017 December 31, 2018 December 31, 2017Cash on hand and at banks 1,356,338 1,074,718 3,998,922 5,884,806CDB (bank certificates of deposit) and National Treasury Bill (Tesouro Selic) 407,855 1,064,084 4,936,857 5,856,502
1,764,193 2,138,802 8,935,779 11,741,308
The Brazilian bank certificates of deposit – CDB are held at high quality financial institutions and earn interest based on floating rates that approximate the overnight interbanklending rate (Certificado de Depósito Interbancário). In the Consolidated are included investments similar to CDB's with fixed income.
Brazilian national treasury bills, also known as Tesouro Selic, are bonds purchased from financial institutions having conditions and characteristics that are similar to CDB's.
JBS S.A.Notes to the financial statements for the years ended December 31, 2018 and 2017(Expressed in thousands of Brazilian reais)
6 Trade accounts receivable, net
Trade accounts receivable correspond to amounts owed by customers in the ordinary course of business. If the receivable is due within one year or less the account receivable isclassified as a current asset, otherwise the receivable is classified as a non-current asset. Accounts receivable are presented at amortized cost less any impairment. Accountsreceivable denominated in currencies other than the entities’ functional currency are remeasured using the exchange rate in effect at the end of the reporting period. The age ofaccounts receivable along with the allowance for doubtful accounts and present value adjustment are as follows at December 31, 2018 and 2017:
Company Consolidated
December 31, 2018 December 31, 2017 December 31, 2018 December 31, 2017Current receivables 2,381,712 2,030,682 8,016,837 7,705,162Overdue receivables:From 1 to 30 days 211,356 166,265 1,136,777 1,185,345From 31 to 60 days 85,805 22,685 235,038 172,242From 61 to 90 days 29,740 57,566 93,626 121,615Above 90 days 228,280 219,569 495,945 477,294Allowance for doubtful accounts (204,719) (191,163) (316,987) (324,570)Present value adjustment (3,108) (2,691) (4,226) (3,797)
347,354 272,231 1,640,173 1,628,1292,729,066 2,302,913 9,657,010 9,333,291
The diversity of the trade accounts receivable portfolio significantly reduces our exposure to credit risk. To further mitigate our risk, parameters have been put in place when creditis provided to customers such as requiring minimum financial ratios, analyzing the operational health of customers, and reviewing references from credit monitoring entities.
The allowance for doubtful accounts is estimated based on an analysis of the age of the receivable balances. An allowance is recorded for long standing and overdue receivables,considering the probability of loss based on expected losses estimatives. The resulting bad debt expense is recognized in the statement of income within “Selling Expenses”. Beloware the changes in the allowance for doubtful accounts:
Company Consolidated
December 31, 2018 December 31, 2017 December 31, 2018 December 31, 2017Initial balance (191,163) (119,859) (324,570) (238,084)Additions (211,680) (88,210) (239,778) (126,900)Exchange variation — — (8,053) (3,183)Write-offs 198,124 16,906 255,414 41,880Assets held for sale — — — 1,717Final balance (204,719) (191,163) (316,987) (324,570)
7 Inventories
Inventories are stated at the lower of the average cost of acquisition or production and the net realizable value. In the case of finished products and work in progress, cost includesan appropriate share of production overheads based on normal operating capacity. Biological assets are transferred into inventory at the point of slaughter based on their carryingamounts, which is either historical cost or market value depending on the Company’s accounting policies described in Note 8.
Company Consolidated
December 31, 2018 December 31, 2017 December 31, 2018 December 31, 2017Finished products 1,284,178 1,080,588 7,251,776 5,974,007Work in process 344,205 422,025 1,078,630 938,354Raw materials 214,284 171,436 1,206,510 1,136,595Warehouse spare parts 162,343 149,591 1,774,818 1,635,922
2,005,010 1,823,640 11,311,734 9,684,878
The inventory balance is presented net of the provision for inventories realization and in the year ended December 31, 2018, the Company recognized in its Consolidated a lossfor realization and obsolescence of R$59,367.
25

8 Biological assets
The Company's live animals consist of cattle, chickens and hogs and segregated into consumables and bearer assets. Animals for slaughter are designated for "in natura" meatproduction and/or processed and by-products, and until they reach the appropriate weight for slaughter they are classified as immature. The slaughtering and production processesoccur in a very short period of time and, as a consequence, only live animals transferred to slaughter are classified as mature. The animals designated for production (breederchickens and hogs), are those which are intended to produce other biological assets. Until they reach the age of reproduction they are classified as immature and when they areable to start the reproductive cycle are classified as mature.
Chicken and eggs:
Current (consumable) - are broiler chickens that will be slaughtered upon maturity. Broiler chickens remain in development for a period of 30 to 48 days to produce fresh meatand/or commercialized products. Due to the broilers short development period, it is not possible to measure fair value reliably and therefore broilers are accounted for at acquisitioncost plus the costs incurred during development, which generally consists of feed and grower costs.
Non-current (bearer assets) - are breeder chickens that are set aside for breeding and have an estimated useful life of 68 weeks. The animals in this category are segregatedbetween mature, when they are in the breeding stage and immature when they are under development. The costs associated breeder chickens are accumulated up to the productionstage (immature) and amortized over their productive lives based on an estimate of their capacity to produce eggs (mature). There is no active market for breeder chickens.Amortization of the mature hen is included in cost of sales in the statement of income.
Cattle:
Current (consumable) - are owned cattle in feedlots and grass-fed cattle which remains under development for 90 to 120 days. Cattle are carried at market value due to theexistence of active markets. The gain or loss in fair value of cattle is recognized in the statement of income in the period in which it occurs as a reduction of (or increase in) grossrevenue.
Hogs and lambs:
Current (consumable) - are hogs and lambs that will be slaughtered upon maturity. Hogs and lambs remain in development for a period of 170 to 175 days to produce fresh meatand/or industrialized products. The carrying value of these hog biological assets in Brazil is approximated by its acquisition cost plus costs incurred during the maturing period. Inthe U.S., an active market for live hogs exists and therefore these hog biological assets are carried at market value less costs to finish.
Non-current (bearer assets) - Refers to hogs that are intended for breeding which have an estimated useful life of 28 months. The costs associated with breeder hogs areaccumulated up to the production stage and amortized over their productive lives based on an estimate of their capacity to produce new assets (hogs). There is no active marketfor breeder hogs. Amortization of breeder hogs is included in cost of sales in the statement of income.
The fair value measurement of biological assets are categorized as ‘Level 2’ within the fair value hierarchy. Refer to Note 31 for information on fair value hierarchy.
ConsolidatedCurrent biological assets (consumable): December 31, 2018 December 31, 2017
AmountQuantity
(thousands) AmountQuantity
(thousands)Carried at cost: Chicken 1,776,107 531,532 1,476,403 539,900 Hogs 617,264 2,623 566,968 2,787
2,393,371 534,155 2,043,371 542,687
Carried at market value: Hogs 753,226 2,052 689,830 2,010 Cattle 44,356 16 34,049 14
797,582 2,068 723,879 2,024
Total current: Chicken 1,776,107 531,532 1,476,403 539,900 Hogs 1,370,490 4,675 1,256,798 4,797 Cattle 44,356 16 34,049 14
3,190,953 536,223 2,767,250 544,711
ConsolidatedNon-current biological assets (bearer assets): December 31, 2018 December 31, 2017
AmountQuantity
(thousands) AmountQuantity
(thousands)
Carried at cost: Mature chickens (breeding stage), net of amortization 499,010 21,600 418,212 21,919 Immature chickens (in development) 495,819 16,154 399,398 15,712 Hogs 173,625 398 150,151 388Total non-current: 1,168,454 38,152 967,761 38,019
Total of biological assets: 4,359,407 574,375 3,735,011 582,730
JBS S.A.Notes to the financial statements for the years ended December 31, 2018 and 2017(Expressed in thousands of Brazilian reais)
26

Changes in biological assets: Current Non-current
Balance at December 31, 2017 2,767,250 967,761Increase by reproduction (born) and cost to reach maturity 26,977,883 1,788,697Reduction for slaughter, sale or consumption (28,298,423) (186,534)Increase by purchase 620,228 563,956Decrease by death (24,776) (18,046)Fair value adjustments, net 79,675 —
Changes from non-current to current 799,666 (799,666)Exchange rate variation 269,450 110,677Amortization — (1,258,391)
Balance at December 31, 2018 3,190,953 1,168,454
Changes in biological assets: Current Non-current
Balance at December 31, 2016 2,673,113 977,040Increase by reproduction (born) and cost to reach maturity 21,077,761 1,571,372Reduction for slaughter, sale or consumption (24,723,331) (164,357)Increase by purchase 2,641,547 480,256Decrease by death (7,251) (23,457)Fair value adjustments, net 251,294 —
Changes from non-current to current 759,371 (759,371)Exchange rate variation 48,424 23,273Amortization — (1,170,316)Effect from acquired companies 46,322 33,321
Balance at December 31, 2017 2,767,250 967,761
JBS S.A.Notes to the financial statements for the years ended December 31, 2018 and 2017(Expressed in thousands of Brazilian reais)
9 Recoverable taxes
Company Consolidated
December 31, 2018 December 31, 2017 December 31, 2018 December 31, 2017Value-added tax on sales and services - ICMS 937,058 971,234 2,591,890 2,456,714Excise tax - IPI 78,369 12,713 152,120 89,832Social contribution on billings - PIS and COFINS 3,133,522 2,633,753 4,087,794 3,546,549Withholding income tax - IRRF/IRPJ 3,659,620 1,952,864 4,326,317 2,283,289Reintegra 57,138 48,053 91,306 79,829Other 18,212 17,484 33,951 39,332
7,883,919 5,636,101 11,283,378 8,495,545
Current 1,146,685 182,885 2,210,038 974,404Non-current 6,737,234 5,453,216 9,073,340 7,521,141
7,883,919 5,636,101 11,283,378 8,495,545
Value-added tax on sales and services - ICMS: Refers to excess credits derived from purchases of raw materials, packaging and other materials over tax charges due on domesticsales, since exports are not subject to it. The Company expects to recover the total amount of the tax credit, including Brazilian ICMS credits from other states (based on thedifference between the statutory rate of tax and the effective rate for ICMS collection in the state of origin) either through the use of the credits to offset tax charges on domesticsales or the credits can be used to pay purchases of fixed assets, packaging, electricity, and other vendors. These excess credits do not expire.
Excise tax – IPI: Refers to value added taxes incurred upon the production of foreign and domestic goods in Brazil. The rates may differ according to the type of product, volumeor selling price. These credits do not expire and can be used to pay other federal taxes or reimbursed in cash.
Social contribution on billings - PIS and COFINS: Refers to Brazilian federal value added taxes (non-cumulative PIS and COFINS credits) arising from purchases of raw materials,packaging and other materials used in products sold in markets outside of Brazil. Such credits do not expire and can be offset against other federal taxes, such as income taxes,or in cash, administrative or judicial.
Through Law 13.670, the Company started to offset the PIS and COFINS credits generated, starting in August 2018 with social security debts.
Withholding income tax - IRRF/IRPJ: Refers mainly to Brazilian withholding income tax levied on short-term investments, remaining foreign tax credits and prepayments of incometax and social contribution paid by estimate. The amount of R$831,846 relates to withholding income taxes and R$3,494,471 relates to prepayment of income taxes in foreignjurisdictions, which do not expire.
Reintegration of the Special Tax Values - Reintegra: Refers to tax incentives for exports which can be reimbursed fully or partially. Tax credit amounts are calculated by multiplyingthe statutory rate by gross revenue from the export of certain commercial products. These credits do not expire and can be offset against other federal taxes, such as income taxes,or in cash.
27

10 Related parties transactions
The main balances of assets and liabilities, as well as the transactions resulting in income (loss) for any period, that relate to transactions between related parties or arose fromtransactions at prices and conditions established between the related parties. Transference of costs includes borrowing costs, interest and management fee, when applicable. Thefollowing table includes balances and net effect on income of intercompany financing transactions between the Company and its subsidiaries:
Statement of financialposition accounts Effect on net income
COMPANY CurrencyCosts transfer
(administrative and funding)December31, 2018
December31, 2017 Q3 2018 Q3 2017
Direct subsidiariesJBS Embalagens Metálicas (2) R$ CDI + 1% p.m. 163,052 141,011 22,088 26,842Conceria Priante (1) EUR 5,11% to 8,375% p.y. 138,681 117,136 7,494 1,712Brazservice (2) R$ CDI + 1% p.m. 130,449 90,622 16,472 15,671JBS Confinamento (2) R$ CDI + 1% p.m. 32,916 (5,516) 4,866 7,601Enersea (1) R$ CDI + 1% p.m. 734 (361) (1,048) (1,044)Midtown Participações (3) R$ — — 2,092 — —
Beef Snacks do Brasil (3) R$ — — (25,348) — —
JBS HU US$ 2,25% p.y. — — — (64)JBS Mendoza (1) US$ — (802) (723) — —
JBS Holding GmbH (1) EUR/US$ — (694,158) (581,481) (18,181) (6,952)JBS Investments II GmbH (4) US$ 7% p.y. (1,926,333) — (24,785) —
Seara Alimentos (1) (2) R$ CDI + 1% p.m. (2,815,874) 3,433,716 259,489 315,749Indirect subsidiariesTrump Asia (1) US$ 5,11% to 8,375% p.y. 256,883 211,070 13,022 3,283Zendaleather México (1) US$ 2,5% to 5,11% p.y. 106,086 22,479 3,373 534JBS USA Holding Lux (1) US$ 5,11% p.y. (2,596,268) (2,405,358) (120,362) (63,792)JBS Aves R$ CDI + 1% p.m. — 950,199 28,288 268,986JBS Leather Uruguai US$ 8,375% p.y. — 67,150 1,657 1,931Frigorífico Canelones US$ 3,5% p.y. — — — (274)Other related partyFlora Higiene e Produtos R$ Selic — 23,783 531 1,163Total, net (7,204,634) 2,040,471 192,904 571,346
December 31, 2018 December 31, 2017
Related party receivables 828,802 5,059,258Related party payables (8,033,436) (3,018,787)
(7,204,634) 2,040,471
(1) Refers to working capital funding. Settlement in the future shall be through a capital contribution, reduction and/or dividends distribution.
(2) In May 2017, was implemented the Tax Regularization Special Program ("PERT") which rules allow the use of own credits of direct or indirect subsidiaries, or parent companiesand their direct or indirect subsidiaries. In September 2017, the Company received the assignment of the credits from its related parties. These transactions were approvedunanimously by the Related Party Committee.
(3) In April 2018, the subsidiaries Midtown Participações e Beef Snacks do Brasil were incorporated in the Company.
(4) In October 2018, the Company's direct subsidiary raised US$500,000 (R$1.9 billion) related to the pricing of senior notes due in 2026, with the Company as guarantor. JBS usedthe funds raised, together with funds available in cash, to repurchase the Company's notes due in 2020 and remuneration of 7.00%, in the amount of US$1.0 billion (R$3.8 billion).
The disclosure of significant related parties transactions is in accordance with the criteria established by the Management of presenting individually transactions amounts equal orhigher than 2% of the total of these transactions (Sale of products, purchases, accounts receivable and accounts payable). This analysis is performed for each related party. If anyrelated party has not meet this criteria in the past and in the current period they do, the comparative balance will be disclosed.
Additional information among the transactions between related parties are pointed such as the purchase of cattle for slaughter between JBS and the related party JBJ Agropecuária,the purchase of eletric power from the subsidiary Enersea, the purchase and sale of supplies for the industrialization of products from the subsidiary Seara, the sale of finishedproducts to "trading companies" JBS Toledo, JBS Global UK and Sampco, and the sale of cattle tallow and industrialization services to Flora. Such transactions are made at regularprice and market conditions in their region because it takes the market prices applied with third parties clients.
JBS S.A.Notes to the financial statements for the years ended December 31, 2018 and 2017(Expressed in thousands of Brazilian reais)
28

Following, are demonstrated all commercial transactions between related parties recognized in the individual financial statement:
Accounts receivable Accounts payablePurchases/Services
renderedSale of products/Services
rendered
COMPANYDecember31, 2018
December31, 2017
December31, 2018
December31, 2017 2018 2017 2018 2017
Direct subsidiaries JBS Confinamento 241 153 4,361 8,513 34,143 90,221 4,267 1,178 Brazservice 10,544 6,852 854 1,945 50,669 75,795 136,930 65,968 Seara Alimentos 32,300 29,336 37,748 18,968 59,965 98,052 627,420 465,654 Conceria Priante 34,555 22,964 — — — — 158,438 46,157 Enersea — 763 — — 145,272 135,261 117,975 102,276Indirect subsidiaries JBS Global UK 85,017 59,192 — — — — 282,897 171,144 Toledo 22,715 16,821 — — — — 273,461 221,098 JBS Aves 1,844 941 20,983 21,516 9,416 32,428 11,334 13,010 Weddel 12,792 7,642 — — — — 78,398 31,051 Sampco 80,156 30,071 — — — — 500,904 277,273 Meat Snacks Partners 5,745 5,970 — 101 642 797 195,844 222,969 Trump Asia 15,745 22,180 — 475 — 320 37,407 220,271 JBS Paraguay — — — — — 50,479 — 976 JBS Leather Argentina — 7,865 — 513 — 1,381 1,066 30,572 Braslo Produtos de Carnes — — — — — — — 121,465 JBS USA — 39 — — 635 351 — 52,762 Agrícola Jandelle — 1,341 — 23,190 11,860 31,883 7,794 4,063Other related parties Vigor — — — — — 25,812 — 22 J&F Floresta Agropecuária Araguaia — 25 — — 9,239 60,493 131 30 JBJ Agropecuária 615 279 — 26,288 369,657 370,403 6,360 4,589 Flora Produtos 14,572 6,627 9 3 61 28 133,334 101,636 Dan Vigor Industria e Com. — — — — — 4,525 — 74,526
316,841 219,061 63,955 101,512 691,559 978,229 2,573,960 2,228,690
Financial transactions
The Company and a few of its subsidiaries entered into an agreement in which Banco Original (Related party) acquires trade accounts receivables held against certain of theCompany's customers in the domestic and foreign markets. The assignments are done at market value through a permanent transfer to Banco Original of the risks and benefits ofall trade accounts receivable. At December 31, 2018 and 2017, the unpaid balance of transferred receivables was R$678,647 and R$848,273 in the Company, and R$1,500,560and R$1,490,395 in the Consolidated, respectively. During the years ended December 31, 2018 and 2017, JBS incurred financial costs related to this operation in the amount ofR$69,084 and R$64,772 in the Company, and R$126,739 and R$119,263 in the Consolidated, respectively, recognized in the consolidated financial statements as financial expenses.
Additionally at December 31, 2018 and 2017, the Company holds investments with Banco Original, in the amount of R$71,431 and R$68,760 in the Company and R$167,796 andR$157,862 in the Consolidated, recognized under the caption "Cash and cash equivalents", respectively. These cash investments, bank certificates of deposit - CDB and equivalents,have similar earnings to CDI (Depósito Interbancário). For the years ended December 31, 2018 and 2017, the Company earned interest from these investments in the amount ofR$3,286 and R$6,039 in the Company, and R$7,591 and R$11,628 in the Consolidated, recognized in the consolidated financial statements under the caption "Finance income",respectively.
Included in loans and financings in the amount of R$19,317 and R$22,003 at December 31, 2018 and 2017, referring to the Company's indirect subsidiary BR Frango are banknotes issued by BNDES (Brazilian Development Bank). Outstanding borrowings under these notes bear interest at an average rate of 8.98% at December 31, 2018, which is payableon a monthly basis. The notes are due in 2020 to 2024 and may be pre-paid at any time without penalty.
JBS is the main sponsor of Instituto Germinare, a business school youth-directed, whose goal is to educate future leaders by offering free, high-quality education. During the yearsended December 31, 2018 and 2017, JBS made donations in the amounts of R$16,356 and R$20,397, respectively, recognized in the financial statements as administrativeexpenses.
Credit with related parties - Consolidated
December 31, 2018 December 31, 2017
J&F Oklahoma (1) 701,281 873,752
Flora — 23,783
701,281 897,535
(1) This amount represents the result of the use of a credit facility between the indirect subsidiary Moyer Distribution (subsidiary of JBS USA) and J&F Oklahoma (subsidiary of J&FInvestimentos S.A., which is not consolidated in the Company). The credit facility provides J&F Oklahoma with the ability to borrow up to R$2.6 billion (US$675,000). Outstandingborrowings under this credit facility bear interest at 3.4% p.y, which is payable on a quarterly basis, or at the time of any repayment of principal and the credit facility maturesDecember 31, 2019. J&F Oklahoma uses this credit facility to purchase cattle.
Further, Moyer Distribution, a JBS USA subsidiary, was the guarantor of a J&F Oklahoma revolving credit facility with financial institutions, such revolving credit facility were terminatedwith financial institutions on August, 2018.
JBS S.A.Notes to the financial statements for the years ended December 31, 2018 and 2017(Expressed in thousands of Brazilian reais)
29

Commercial transactions - Consolidated
Until August, 2018 JBS Australia was part of two commercial agreements with J&F Australia being a cattle supply and feeding agreement, and a sale and purchase cattle agreement.Both agreements were terminated in August 22, 2018.
Prior to the sale of JBS Five Rivers and JBS Canada's cattle hotelling assets in the divestment program, each was party to a cattle supply and feeding agreement with J&F Oklahomaand J&F Canada similar to the aforementioned. These agreements were terminated on the respective sale dates, in March 2018 and October 2017, respectively.
No expense for doubtful accounts or bad debts relating to related-party transactions were recorded during the years ended December 31, 2018 and 2017.
Remuneration of key management
The Company's key management is comprised of its Executive Officers. The aggregate amount of compensation received by the Company’s key management during the yearsended December 31, 2018 and 2017 is the following:
2018 2017Salaries and wages 19,245 11,382Variable cash compensation 8,500 8,500Share-based compensation (*) 1,533 2,500
29,278 22,382
(*) Refers to shares granted during the year of 2018 and 2017, respectively.
The Chief Executive Officer, the Administrative and Control Officer, the Investor Relations Officer and the Executive Officers are parties to the Brazilian employment contract regimereferred to as CLT (which is the Consolidation of Labor Laws), which follows all the legal prerogatives of payments and benefits.
Except for those described above, the other members of the Executive or Management Board are not party to any employment contract or any other contracts for additional businessbenefits such as post-employment benefits or other long-term benefits, termination of work that does not conform to those requested by the CLT.
As disclosed through material fact, in December 5, 2018, it was announced that Guilherme Cavalcanti was hired as Financial and Investor Relations Officer of the Company, whichwas approved unanimously by the Board of Directors in a meeting held in December 4, 2018.
JBS S.A.Notes to the financial statements for the years ended December 31, 2018 and 2017(Expressed in thousands of Brazilian reais)
11 Investments in subsidiaries and joint ventures
Relevant information for investments in the year ended December 31, 2018:
Participation Total assets Share capitalEquity +Goodwill Net revenue
Net income(loss)
i. In subsidiaries:JBS Embalagens Metálicas 99.00% 85,184 2 (83,027) — (28,443)JBS Confinamento 100.00% 621,793 711,388 512,233 84,088 (59,927)Conceria Priante 100.00% 338,403 12,429 10,026 282,251 2,829JBS Holding GMBH 100.00% 737,919 155 695,580 — 42,957JBS Global Luxembourg 100.00% 69,087,826 4,287,221 19,716,731 137,555,527 5,786,561JBS Leather International 100.00% 739,054 79,749 (354,264) 765,339 (126,312)Brazservice 100.00% 92,164 23,063 (72,070) 165,429 (23,036)Seara Alimentos 100.00% 23,044,148 4,259,089 3,728,133 17,670,081 (998,553)Rigamonti 100.00% 241,133 10,122 139,236 490,569 10,395Enersea 100.00% 994 1,275 (481) 406,034 (394)JBS Mendoza 99.93% 758 83 759 — 458JBS HU Liquidity Management 100.00% — — — — (84)Midtown Participações 100.00% — — — — (2,041)Midup Participações Ltda. 100.00% 17,966 18,969 17,966 — (669)Beef Snacks do Brasil 100.00% — — — — 313
JBS Milestone 100.00% 11 — 11 — (273)
JBS Asset Management 100.00% 84,453 83,419 84,170 5,237 761
JBS Investments II GmbH 100.00% 1,926,482 155 114 — (41)
ii. In joint ventures:Meat Snack Partners 50.00% 200,351 23,762 169,933 483,558 52,910
30

i. In the Company:
Equity
December 31,2017
Addition(disposal)
Exchange ratevariation
Changes in theEquity ofinvestees
Proportionateshare of income
(loss)December 31,
2018JBS Embalagens Metálicas (54,038) — — — (28,159) (82,197)JBS Confinamento 572,160 — — — (59,927) 512,233JBS Slovakia Holdings (1) 15 (15) — — — —
Conceria Priante 6,490 — 707 — 2,829 10,026JBS Holding GmbH 583,594 — 69,029 — 42,957 695,580JBS Global Luxembourg (2) 12,472,336 887 2,486,590 (1,029,643) 5,786,561 19,716,731JBS Leather International (189,411) — (38,560) 19 (126,312) (354,264)Brazservice (49,034) — — — (23,036) (72,070)Seara Alimentos 4,477,051 — — 249,635 (998,553) 3,728,133Meat Snack Partners (3) 64,006 (5,500) 12,820 (12,814) 26,455 84,967Rigamonti 115,107 — 13,734 — 10,395 139,236Enersea (87) — — — (394) (481)JBS Mendoza 747 — (447) — 458 758JBS HU Liquidity Management (4) 3,957 (3,827) (46) — (84) —
Midtown Participações (5) 180,965 (178,924) — — (2,041) —
Midup Participações 18,635 — — — (669) 17,966Beef Snacks Brasil (5) 67,327 (67,640) — — 313 —
JBS Milestone 276 — 8 — (273) 11JBS Asset Management (6)
— 78,281 5,128 — 761 84,170JBS Investments II GmbH (7)
— 164 (9) — (41) 114Subtotal 18,270,096 (176,574) 2,548,954 (792,803) 4,631,240 24,480,913Accrual for loss on investments (*) 292,570 509,012
Total 18,562,666 24,989,925
(*) Transfer of the negative investments for other current liabilities.
(1) JBS Slovakia: In June 2018, the direct subsidiary JBS Slovakia was liquidated for corporate structure simplification purposes.(2) JBS Global Luxembourg: In December 2018, the Company increased the subsidiary's share capital.(3) Meat Snack Partners: In June and November 2018, the indirect subsidiary Meat Snack Partners do Brasil distributed dividends to the Company.(4) JBS HU: In June 2018, the direct subsidiary JBS HU distributed dividends to the Company, and it was liquidated in September 2018.(5) Midtown and Beef Snacks: In April 2018, these companies were incorporated in the Company for corporate structure simplification purposes.(6) JBS Asset Management: In June 2018, the Company assigned properties to the subsidiary through a capital increase.(7) JBS Investments II: In October 2018, the Company increased the subsidiary's share capital.
• In the Consolidated:
Equity
December 31,2017
Distribution ofdividends
Changes in theEquity ofinvestees
Proportionateshare of income
December 31,2018
Meat Snack Partners 64,006 (5,500) 6 26,455 84,967Total 64,006 (5,500) 6 26,455 84,967
a. Divestment program
In 2017, the Company announced its Disinvestment program where the demobilization of certain assets was made to strengthen the financial position. The sale of most assetswwas completed in 2017 leaving only the conclusion of the sale of Five Rivers assets that occurred on March 16, 2018, resulting in a loss of R$57,036, included under the caption"Other expenses" in the consolidated statement of income for the current year.
Also in 2018 a loss of R$6,684 was recognized, also included under the caption "Other expenses" in the income statement, related to the price adjustment related to the sale ofVigor.
JBS S.A.Notes to the financial statements for the years ended December 31, 2018 and 2017(Expressed in thousands of Brazilian reais)
31

Relevant information for investments in the year ended December 31, 2017:
Participation Total assets Share capitalEquity +Goodwill Net revenue
Net income(loss)
In subsidiaries:JBS Embalagens Metálicas 99.00% 91,279 2 (54,584) — 4,215JBS Global Investments 100.00% — — — — (6,515)JBS Confinamento 100.00% 590,984 711,388 572,160 35,532 (9,188)JBS Slovakia Holdings 100.00% 14 — 15 — 1Conceria Priante 100.00% 302,160 11,114 6,490 125,108 (16,012)JBS Holding GMBH 100.00% 621,254 139 583,594 815,144 (24,232)JBS Global Luxembourg 100.00% 57,164,445 3,660,092 12,472,336 118,462,647 5,522,103JBS Leather International 100.00% 741,087 68,084 (189,411) 899,981 (93,319)Brazservice 100.00% 73,404 23,063 (49,034) 139,953 (16,863)Seara Alimentos 100.00% 20,056,660 4,259,089 4,477,051 17,473,068 (371,185)Rigamonti 100.00% 194,461 9,051 115,107 393,916 3,786Enersea 100.00% 1,274 1,275 (87) 374,197 (302)JBS Mendoza 99.93% 750 141 747 — 607JBS HU Liquidity Management 100.00% 4,183 53 3,957 — (518)Midtown Participações 100.00% 199,415 207,687 180,965 — (16,793)Midup Participações 100.00% 18,636 18,969 18,635 — (334)Beef Snacks Brasil 100.00% 67,505 40,993 67,327 — 25,301JBS Foods International 100.00% 349 — 276 — (69,493)In joint ventures:Meat Snack Partners 50.00% 156,690 23,762 128,012 420,832 36,891
• In the Company:
Equity
December 31,2016
Addition(disposal)
Exchange ratevariation
Changes in theEquity ofinvestees
Proportionateshare of income
(loss)December 31,
2017JBS Embalagens Metálicas (58,211) — — — 4,173 (54,038)JBS Global Investments 28,443 (21,228) (700) — (6,515) —
JBS Confinamento 469,362 111,986 — — (9,188) 572,160JBS Slovakia Holdings 21,173 (20,829) (295) (35) 1 15Conceria Priante 9,453 12,826 223 — (16,012) 6,490JBS Holding GMBH 593,381 — 86,496 (72,051) (24,232) 583,594JBS Global Luxembourg 5,564,272 863,955 205,541 316,465 5,522,103 12,472,336Vigor Alimentos 307,065 (307,249) — — 184 —
JBS Leather International (86,426) — (4,467) (5,199) (93,319) (189,411)Brazservice (32,171) — — — (16,863) (49,034)Seara Alimentos 4,620,972 — — 227,264 (371,185) 4,477,051Meat Snack Partners 55,562 (10,000) 1,726 (1,728) 18,446 64,006Granite Holdings 3,912,517 (4,232,309) 258,561 4,895 56,336 —
Rigamonti 95,731 — 15,590 — 3,786 115,107Enersea 215 — — — (302) (87)JBS Argentina 309,083 (273,006) (9,234) — (26,843) —
JBS Mendoza 253 — (113) — 607 747JBS HU Liquidity Management 17,460 (12,659) (326) — (518) 3,957Midtown Participações 285,063 (87,305) — — (16,793) 180,965Midup Participações — 18,969 — — (334) 18,635Beef Snacks Brasil 44,226 (2,200) — — 25,301 67,327JBS Foods International (49,450) 119,790 (572) — (69,492) 276Subtotal 16,107,973 (3,839,259) 552,430 469,611 4,979,341 18,270,096Accrual for loss on investments (*) 226,258 292,570
Total 16,334,231 18,562,666
(*) Transfer of the negative investments for other current liabilities.
• In the Consolidated:
Equity
December 31,2016
Dividenddistribution Disposal
Changes in theEquity ofinvestees
Proportionateshare of income
December 31,2017
Vigor Alimentos 307,065 — (307,249) — 184 —
Meat Snack Partners 55,562 (10,000) — (2) 18,446 64,006Total 362,627 (10,000) (307,249) (2) 18,630 64,006
JBS S.A.Notes to the financial statements for the years ended December 31, 2018 and 2017(Expressed in thousands of Brazilian reais)
32

12 Property, plant and equipment
Property, plant and equipment are stated at historical cost less accumulated depreciation and losses due to impairment. Historical cost includes expenditures that are directlyattributable to the purchase price of the items and the costs attributable to bringing the asset to its working condition for its intended use. When parts of an item of property, plantand equipment have different useful lives, those components are accounted for as separate items of property, plant and equipment.
Subsequent costs are included in the asset’s carrying amount or recognized as a separate asset, as appropriate, only when it is probable that future economic benefits associatedwith these costs will flow to the Group and they can be measured reliably. The carrying amount of the replaced items or parts are deducted. All other repairs and maintenance arecharged to the statement of income during the financial period in which they are incurred.
Depreciation is recorded using the straight-line method over the estimated useful lives of the assets, such that the value of cost less its residual value after the useful life is fullydepreciated (except for land and construction in progress).
The assets’ residual values and useful lives are reviewed, and adjusted if appropriate, at the end of each reporting period.
When an asset’s or CGU's carrying amount is written down immediately to the recoverable amount when it is higher than its estimated recoverable amount. The recoverable amountis the higher of the estimate of the assets’ net selling price and value in use.
Gains and losses on disposals are determined by comparing the proceeds with the carrying amount and are recognized within the statement of income.
The Company’s construction in progress relates to investments for expansion, modernization and adaptation of plants for the purposes of increasing productivity and obtaining newcertifications required by the market. When these assets are completed and placed in service, they are transferred to property, plant and equipment and depreciation commences.
Net amount
Company Useful life CostAccumulateddepreciation December 31, 2018 December 31, 2017
Buildings 10 to 50 years 4,530,497 (1,064,116) 3,466,381 3,161,541Land — 1,642,442 — 1,642,442 1,526,572Machinery and equipment 10 to 25 years 6,622,089 (3,020,675) 3,601,414 3,766,569Facilities 10 to 20 years 2,202,519 (706,993) 1,495,526 1,465,693Computer equipment 3 to 5 years 281,482 (219,474) 62,008 69,962Vehicles 5 to 10 years 514,558 (218,963) 295,595 319,342Construction in progress — 558,871 — 558,871 1,181,445Others 5 to 10 years 163,399 (99,349) 64,050 53,057
16,515,857 (5,329,570) 11,186,287 11,544,181
Net amount
Consolidated Useful life CostAccumulateddepreciation December 31, 2018 December 31, 2017
Buildings 5 to 50 years 18,148,751 (5,462,980) 12,685,771 11,877,234Land — 4,339,056 — 4,339,056 4,009,654Machinery and equipment 5 to 25 years 26,076,870 (14,089,908) 11,986,962 11,589,239Facilities 5 to 20 years 3,228,536 (1,163,485) 2,065,051 2,081,688Computer equipment 2 to 7 years 964,526 (620,867) 343,659 302,449Vehicles 2 to 10 years 907,100 (427,169) 479,931 406,823Construction in progress — 2,520,674 — 2,520,674 2,636,047Others 5 to 15 years 1,623,054 (934,979) 688,075 659,970
57,808,567 (22,699,388) 35,109,179 33,563,104
Changes in property, plant and equipment:
CompanyDecember 31,
2017Additions net oftransferences (1) Incorporations (2) Disposals Depreciation
December 31,2018
Buildings 3,161,541 303,748 135,586 (4,733) (129,761) 3,466,381Land 1,526,572 50,557 65,422 (109) — 1,642,442Machinery and equipment 3,766,569 229,902 16,123 (15,345) (395,835) 3,601,414Facilities 1,465,693 132,057 18,192 (8,894) (111,522) 1,495,526Computer equipment 69,962 21,488 — (4) (29,438) 62,008Vehicles 319,342 131,024 — (89,362) (65,409) 295,595Construction in progress 1,181,445 (444,533) — (178,041) — 558,871Other 53,057 30,572 — (268) (19,311) 64,050
11,544,181 454,815 235,323 (296,756) (751,276) 11,186,287
JBS S.A.Notes to the financial statements for the years ended December 31, 2018 and 2017(Expressed in thousands of Brazilian reais)
33

ConsolidatedDecember 31,
2017 Acquisitions (3)Additions net oftransferences (1) Disposals Depreciation
Exchange ratevariation
December 31,2018
Buildings 11,877,234 1,560 707,995 (40,591) (714,593) 854,166 12,685,771Land 4,009,654 7 167,595 (40,231) — 202,031 4,339,056Machinery and equipment 11,589,239 1,383 1,532,176 (58,621) (1,907,573) 830,358 11,986,962Facilities 2,081,688 — 182,601 (10,524) (190,751) 2,037 2,065,051Computer equipment 302,449 4,680 147,665 (1,374) (134,278) 24,517 343,659Vehicles 406,823 821 180,290 (24,520) (99,808) 16,325 479,931Construction in progress 2,636,047 — (98,040) (188,734) — 171,401 2,520,674Other 659,970 — 76,564 (2,356) (125,891) 79,788 688,075
33,563,104 8,451 2,896,846 (366,951) (3,172,894) 2,180,623 35,109,179
(1) Additions for each category includes transfer from construction in progress during the period.(2) In April 2018, the direct subsidiaries Beef Snacks do Brasil and Midtown Participações were incorporated in the Company.(3) Refers to balances arising from Alvey and Transbotics's acquisitions from second quarter of 2018.
Company December 31, 2016Additions net oftransferences Disposals Depreciation December 31, 2017
Buildings 3,088,757 192,048 (85) (119,179) 3,161,541Land 1,384,826 158,097 (16,351) — 1,526,572Machinery and equipment 3,814,323 363,683 (12,324) (399,113) 3,766,569Facilities 1,353,973 225,168 (5,649) (107,799) 1,465,693Computer equipment 66,333 31,402 (550) (27,223) 69,962Vehicles 404,214 61,388 (64,257) (82,003) 319,342Construction in progress 1,305,863 (123,011) (1,407) — 1,181,445Other 57,339 17,839 (274) (21,847) 53,057
11,475,628 926,614 (100,897) (757,164) 11,544,181
Consolidated December 31, 2016
Acquired inbusiness
combination)
Additions net of
transferences DisposalsAssets held for
sale DepreciationExchange rate
variation December 31, 2017
Buildings 11,104,201 273,942 1,280,800 (71,399) (302,141) (621,264) 213,095 11,877,234
Land 3,943,307 27,621 217,373 (61,855) (164,536) — 47,744 4,009,654
Machinery and equipment 10,915,981 508,488 2,173,205 (43,979) (341,239) (1,827,605) 204,388 11,589,239
Facilities 1,925,053 — 341,266 (5,661) (121) (179,603) 754 2,081,688
Computer equipment 253,499 3,012 154,313 (3,315) (3,384) (107,738) 6,062 302,449
Vehicles 490,393 10,082 96,631 (65,912) (11,497) (115,547) 2,673 406,823
Construction in progress 3,754,943 24,158 (1,132,252) (14,977) (26,996) — 31,171 2,636,047
Other 723,514 19,884 204,776 (7,712) (170,470) (118,590) 8,568 659,970
33,110,891 867,187 3,336,112 (274,810) (1,020,384) (2,970,347) 514,455 33,563,104
For the years ended December 31, 2018 and 2017, the amount of capitalized interest added to construction in progress and included in additions was R$28,696 and R$52,231 inthe Company, respectively, and in the Consolidated was R$80,892 and R$140,099, respectively.
On December 31, 2018, the Company tested the recoverability of its assets that were identified as having an indicator of impairment using the concept of value in use throughdiscounted cash flow models. The Company's indirect subsidiary JBS USA Lux recognized an impairment expense in the amount of R$26,488 (US$7,257) under the caption "Otherexpenses".
JBS S.A.Notes to the financial statements for the years ended December 31, 2018 and 2017(Expressed in thousands of Brazilian reais)
13 Intangible assets
Intangible assets are carried at acquisition cost, net of accumulated amortization and impairment, if applicable. Intangible assets are recognized when it is expected that the assetswill derive future economic benefits, taking into consideration the intangible assets’ economic and technological viability. Intangible assets are primarily comprised of trademarks,customer relationships, water and mineral rights, software and others.
Intangible assets with finite useful lives are amortized over the period of effective use using the straight-line method or based on a method that reflects the consumption of itseconomic benefits. Intangible assets that are subject to amortization are reviewed for impairment whenever events or changes in circumstances indicate that the carrying amountmay not be recoverable. An impairment loss is recognized when the asset’s carrying amount exceeds its recoverable amount. The recoverable amount is the higher of an asset’sfair value less costs to sell and its value in use.
The carrying value of indefinite-lived intangible assets, which relate to trademarks, are reviewed at least annually for impairment or more frequently if events or changes incircumstances indicate that the assets may be impaired. If impairment exists, a loss would be recorded to write down the indefinite-lived assets to their recoverable amount.
Management deemed that certain trademarks are indefinite lived intangible assets due to verifiable history and expected use of the asset by the Company. The trademarks acquiredhave no legal, regulatory or contractual limits linked, and do not depend on the useful life of any asset or group of assets as they existed independently for a substantial time priorto the acquisitions, and they are not related to sectors subject to technological obsolescence or other forms of deterioration in value.
Intangible assets acquired in a business combination are recognized at fair value based on valuation methodologies and techniques and often involve the use of third party valuationfirm’s expertise in the calculation of discounted estimates of cash flows. Intangible assets at December 31, 2018 and 2017 were composed as follows:
34

Company ConsolidatedNet amount Net amount
Useful lifeDecember 31,
2018December 31,
2017 Useful lifeDecember 31,
2018December 31,
2017Trademarks Indefinite 24,800 42,560 Indefinite 3,302,654 3,059,717Trademarks Up to 5 years 31,921 24,800 2 to 20 years 254,742 239,093Software Up to 5 years 33,085 27,379 2 to 15 years 75,115 75,646Water rights — — — Indefinite 39,964 34,906Customer relationships — — — 4 to 20 years 2,050,258 2,082,710Supplier contract (2)
— — — Up to 10 years 82,007 —
Other — — — 2 to 15 years 14,556 19,99889,806 94,739 5,819,296 5,512,070
Changes in intangible assets:
CompanyDecember 31,
2017 Additions Disposals AmortizationDecember 31,
2018Amortizing:Trademarks 42,560 1 — (10,640) 31,921Software 27,379 17,465 (171) (11,588) 33,085Non-amortizing:Trademarks 24,800 — — — 24,800
94,739 17,466 (171) (22,228) 89,806
ConsolidatedDecember 31,
2017 Acquisitions (1) Additions Disposal Amortization
Exchange ratevariation and
othersDecember 31,
2018Amortizing:Trademark 239,093 11,428 1 (40) (27,189) 31,449 254,742Software 75,646 — 25,564 (201) (27,942) 2,048 75,115Customer relationships 2,082,710 — — — (303,709) 271,257 2,050,258Supplier contract (2)
— — 74,218 — (6,506) 14,295 82,007Others 19,998 — — — (8,346) 2,904 14,556Non-amortizing:Trademarks 3,059,717 364 — — — 242,573 3,302,654Water rights 34,906 — — — — 5,058 39,964
5,512,070 11,792 99,783 (241) (373,692) 569,584 5,819,296
(1) Refers to balances arising from Alvey and Transbotics's acquisitions from second quarter of 2018.(2) Supplier contract: In conjunction with the sale of JBS Five Rivers, JBS USA entered into a longterm cattle supply agreement with the purchaser of JBS Five Rivers , which wasrecorded at fair value and is included in intangible assets in the Consolidated Balance Sheet.
CompanyDecember 31,
2016 Additions Disposals AmortizationDecember 31,
2017Amortizing:Trademarks — 53,200 — (10,640) 42,560Software 23,494 12,541 (253) (8,403) 27,379Non-amortizing:Trademarks 23,000 1,803 (3) — 24,800
46,494 67,544 (256) (19,043) 94,739
ConsolidatedDecember31, 2016
Acquired inbusiness
combination Additions
Businesscombinationadjustment
Assets heldfor sale Disposal Amortization
Exchange ratevariation and
othersDecember31, 2017
Amortizing:
Trademark 55,937 119,451 53,250 25,081 (2,858) — (23,481) 11,713 239,093
Software 83,915 — 18,536 — (626) (1,142) (25,219) 182 75,646
Customer relationships 1,947,753 353,187 — — — — (276,956) 58,726 2,082,710
Others 6,782 21,172 — — — (83) (5,350) (2,523) 19,998
Non-amortizing:
Trademarks 2,809,178 52,454 1,803 8,524 — (259) — 188,017 3,059,717
Water rights 108,530 — — — (73,735) — — 111 34,906
5,012,095 546,264 73,589 33,605 (77,219) (1,484) (331,006) 256,226 5,512,070
Impairment test:
At December 31, 2018, the Company tested the recoverability of its assets using the concept of value in use through cash flow models and did not recognize expenses in the currentperiod and there were no indications of impairment.
JBS S.A.Notes to the financial statements for the years ended December 31, 2018 and 2017(Expressed in thousands of Brazilian reais)
35

14 Goodwill
Goodwill is recognized under the caption 'Investments in subsidiaries and joint ventures' because for the investor it is part of its investment in the subsidiary's acquisition; and asgoodwill, in the Consolidated because it refers to expectation of future earnings from the acquired subsidiary, which assets and liabilities are consolidated with the Company's.Therefore, in the Company there is only goodwill from incorporations in the amount of R$9,085,970 and in the Consolidated all goodwill are recognized as intangible.
Goodwill is an indefinite lived asset and is required to be tested for impairment annually or whenever there is evidence of a decline in fair value. Assets and liabilities are groupedinto CGU’s (Cash generating units) for impairment testing purposes. Any impairment loss is recognized immediately in the consolidated statement of income (loss) and cannot bereversed.
Upon the sale of a business, the goodwill or corresponding portion of goodwill is included in the calculation of profit or loss on disposal.
Useful life December 31, 2018 December 31, 2017
Goodwill Indefinite 23,775,575 22,488,247
Changes in goodwill:
Balance at December 31, 2017 22,488,247Acquisitions (1) 60,121
Disposals (9,011)
Exchange rate variation and others 1,236,218
Balance at December 31, 2018 23,775,575
(1) Refers to balances arising from Alvey and Transbotics's acquisitions from second quarter of 2018.
Balance at December 31, 2016 21,916,694Acquired in business combination 272,279
Disposal (11,852)
Business combination adjustments (95,410)
Assets held for sale (153,567)
Exchange rate variation and others 560,103
Balance at December 31, 2017 22,488,247
Impairment test of goodwill
At December 31, 2018, the Company tested the recoverability of ts goodwill of each CGU group using the concept of value in use through discounted cash flow models based onthe figures from September 30, 2018. The determination of the value in use involves using assumptions about cash flows, such as rates of revenue growth, costs and expenses,capital expenditures, working capital requirements and discount rates.
Management projects cash flows for a maximum period of 5 years for the CGU groups of Brazil Beef and USA Pork, to better reflect the long cycle of each group when it refers tothe useful life of the animals used in production. The terminal value was assigned based on an expected growth rate of perpetuity for the CGU groups. The weighted average rateof the cost of capital (WACC), used as discount rate, was estimated on a post-tax basis based on the historical industry performance relative to each CGU group and externalsources of information regarding market risks.
For the purposes of impairment testing CGUs have been aggregated into the following groups representing the lowest level within the Company at which the goodwill is monitoredfor internal management purposes and that have significant goodwill:
CGU Groups December 31, 2018 December 31, 2017Brazil Beef 9,069,926 9,069,926
Seara 3,533,294 3,533,294
Moy Park 3,030,896 2,760,016
USA Pork 2,691,181 2,297,518
Australia Meat 1,125,428 1,064,375
Australia Smallgoods 1,062,769 1,005,113
Others CGUs without significant goodwill 3,262,081 2,758,005
Total 23,775,575 22,488,247
For the years ended December 31, 2018 and 2017 there were no indications that goodwill within any CGU group was impaired.
i. Brazil Beef
The key assumptions used in the estimation of the value in-use are set out below. The values assigned to the key assumptions represent management’s assessment of futuretrends in the relevant industries and have been based on historical data from external and internal sources.
2018 2017Discount rate 10.9% 10.8%Terminal value growth rate 4.9% 5.1%Estimated EBITDA growth rate (average for the next 5 years) 25.2% 46.4%
JBS S.A.Notes to the financial statements for the years ended December 31, 2018 and 2017(Expressed in thousands of Brazilian reais)
36

Estimated EBITDA was projected considering past experiences and forecasts as follows:
• Revenue of this CGU group includes sales from beef operations in Brazil. Revenues growth was projected considering the availability of livestock, total slaughtering capacityand utilization of facilities related to production, and price increases/decreases based on estimatives of inflation for the domestic market and exchange rate variation for exports.• Operating costs and expenses were projected considering the historical performance of the CGU group and prices trends of the primary raw materials, especially cattle. Inaddition, it was considered efficiency improvements related to the integration of acquisitions.• Capital expenditures were estimated assuming the maintenance of existing infrastructure in order to continue to be operated for an indefinite period.
For the years ended December 31, 2018 and 2017, estimated value in-use exceeded the carrying amount of the CGU group.
ii. Seara
The key assumptions used in the estimation of the value in-use are set out below.
2018 2017Discount rate 11.3% 10.9%Terminal value growth rate 3.9% 4.0%Estimated EBITDA growth rate (average for the next 5 years) 18.4% 17.3%
Estimated EBITDA was projected considering past experiences and forecasts as follows:
• Revenue includes sales from pork, chicken and other products in Brazil. Revenue growth was projected considering the availability of livestock, total slaughtering capacityand utilization of facilities related to production, and price increases/decreases based on estimated inflation for the domestic market and exchange rate variation for exports.• Operating costs and expenses were projected considering the historical performance of the CGU group and prices trends of primary raw materials. In addition, it was consideredefficiency improvements related to the integration of acquisitions.• Capital expenditures were estimated assuming the maintenance of existing infrastructure in order to continue to be operated for an indefinite period.
For the years ended December 31, 2018 and 2017, estimated value in use exceeded the carrying amount of the CGU group.
Management has identified that a reasonably possible change in discount rate could cause the carrying amount to exceed the value in-use amount. An increase in the discountrate of 1.0% and a decrease in the terminal growth rate of 0.5% in the years ended in December 31, 2018 would cause the recoverable amount of the CGU to be 1,71% below itscarrying value.
iii. Moy Park
The key assumptions used in the estimation of the value in-use are set out below.
2018 2017Discount rate 8.0% 8.5%Terminal value growth rate 2.0% 3.0%Estimated EBITDA growth rate (average for the next 5 years) 8.9% 7.1%
Estimated EBITDA was projected considering past experiences and forecasts as follows:
• Revenue of this CGU group includes sales from chicken operations in Europe, which consists of Moy Park's operations. Revenue growth was projected considering theavailability of livestock, total slaughtering capacity and utilization of facilities related to production, and price increases/decreases based on estimated inflation for the domesticmarket and exchange rate variation for exports.• Operating costs and expenses were projected considering the historical performance of the CGU group and prices trends of primary raw materials. In addition, it was consideredefficiency improvements related to the integration of acquisitions.• Capital expenditures were estimated assuming the maintenance of existing infrastructure in order to continue to be operated for an indefinite period.
For the years ended December 31, 2018 and 2017, estimated value in-use exceeded the carrying amount of the CGU group.
iv. USA Pork
The key assumptions used in the estimation of the value in-use are set out below.
2018 2017Discount rate 12.0% 12%Terminal value growth rate 0.5% 0.5%Estimated EBITDA growth rate (average for the next 5 years) 0.3% 9.7%
Estimated EBITDA was projected considering past experiences and forecasts as follows:
• Revenue of this CGU group includes sales from pork operations in the U.S. Revenue growth was projected considering the availability of livestock, total slaughtering capacityand utilization of facilities related to production, and price increases/decreases based on estimated inflation for the domestic market and exchange rate variation for exports.• Operating costs and expenses were projected considering the historical performance of the CGU group and prices trends of primary raw materials.• Capital expenditures were estimated assuming the maintenance of existing infrastructure in order to continue to be operated for an indefinite period.
For the years ended December 31, 2018 and 2017, estimated value in-use exceeded the carrying amount of the CGU group.
JBS S.A.Notes to the financial statements for the years ended December 31, 2018 and 2017(Expressed in thousands of Brazilian reais)
37

v. Australia Meat
The key assumptions used in the estimation of the value in-use are set out below.
In percent 2018 2017Discount rate 7.7% 8.3%Terminal value growth rate 2.0% 2.5%Estimated EBITDA growth rate (average for the next 5 years) 2.2% 32.0%
Estimated EBITDA was projected considering past experiences and forecasts as follows:
• Revenue of this CGU group includes sales from beef operations in Australia. Revenue growth was projected considering the availability of livestock, total slaughtering capacityand utilization of facilities related to production, and price increases/decreases based on estimated inflation for the domestic market and exchange rate variation for exports.• Operating costs and expenses were projected considering the historical performance of the CGU group and prices trends of the primary raw materials. In addition, weconsidered efficiency improvements related to the integration of the acquisition.• Capital expenditures were estimated assuming the maintenance of existing infrastructure in order to continue operating for an indefinite period.
For the years ended December 31, 2018 and 2017, estimated value in-use exceeded the carrying amount of the CGU group.
vi. Australia Smallgoods
The key assumptions used in the estimation of the value in-use are set out below.
In percent 2018 2017
Discount rate 7.7% 8.3%
Terminal value growth rate 2.0% 2.5%
Estimated EBITDA growth rate (average for the next 5 years) 7.5% 1.0%
Estimated EBITDA was projected considering past experiences and forecasts as follows:
• Revenue of this CGU group includes sales from the Smallgoods operations in Australia, consisting of Primo's operations. Revenue growth was projected considering theavailability of livestock, total slaughtering capacity and utilization of facilities related to production, and price increases/decreases based on estimated inflation for the domesticmarket and exchange rate variation for exports.• Operating costs and expenses were projected considering the historical performance of the CGU group and prices trends of the primary raw materials, primarily hogs. Inaddition, we considered efficiency improvements related to the integration of the acquisition.• Capital expenditures were estimated assuming the maintenance of existing infrastructure in order to continue operating for an indefinite period.
For the years ended December 31, 2018 and 2017, estimated value in-use exceeded the carrying amount of the CGU group.
JBS S.A.Notes to the financial statements for the years ended December 31, 2018 and 2017(Expressed in thousands of Brazilian reais)
15 Trade accounts payable
Trade accounts payable correspond to the amounts owed to suppliers in the ordinary course of business. If the payment period is equivalent to one year or less, the amount isclassified as current liabilities, otherwise the corresponding amount is classified as non-current liabilities. Accounts payable are recognized initially at their fair value and aresubsequently measured at amortized cost using the effective interest method. Accounts payable by major type of supplier is as follows at December 31, 2018 and 2017:
Company Consolidated
December 31, 2018 December 31, 2017 (*) December 31, 2018 December 31, 2017 (*)Commodities 1,505,879 1,287,063 4,735,832 3,943,995
Materials and services 612,873 545,605 7,341,008 5,520,079
Finished products 174,078 170,345 125,508 224,579
Supply chain finance (1) 50,885 35,303 910,228 321,987
Present value adjustment (10,460) (9,212) (36,961) (17,862)
2,333,255 2,029,104 13,075,615 9,992,778
(*) Due to the low representativeness in 2017 and because it is an operation in development and effectiveness analysis for the Company, the supply chain finance balance waspresented under the caption of finished products. For the year 2018, due to the growth of the operation and future prospects, the balance was segregated and for comparabilitypurposes, the 2017 balance was segregated as well.
(1) The Company and its direct subsidiary Seara Alimentos carry out risk transactions with financial institutions with suppliers in the domestic market. At December 31, 2018, theaverage discount rates of supply chain finance transactions disbursed by our suppliers to financial institutions were 0.70% per month in the Company and 0.69% per month in theConsolidated. Operationally and commercially there was no change in the process and that the referred transaction does not generate changes in the prices applied by suppliers,maintaining the same price composition practiced prior to the risk operation drawn by these same suppliers. In addition, this operation did not bring any other cost to the Companyand its subsidiaries and all financial costs of the operation are the responsibility of the suppliers.
38

16 Loans and financing
Loans and financing are initially recognized at fair value upon receipt of the proceeds, net of transaction costs, when applicable. Subsequent to the initial recording of loans andfinancing, charges, interest and monetary and exchange rate variation incurred that become contractually due are included in the balance, until the end of each period. Below is achart showing the Company’s loans and financing instruments by foreign and local currency. Local currency indicates loans denominated in the functional currency of the borrower.All borrowings denominated in currencies other than our presentation currency of the Brazilian Reais are remeasured each period. Current amounts include accrued but unpaidinterest at period-end. Premiums, discounts and transaction costs are amortized to finance expense using the effective interest method.
Company
Averageannual
interest rate CurrencyIndex on variable
rate loans
Paymentterms / non-current debt
Current Non-current
Type Dec 31, 2018 Dec 31, 2017 Dec 31, 2018 Dec 31, 2017
Foreign currencyPrepayment 5.58% USD Libor 2020 - 23 1,011,421 3,406,881 4,322,038 2,776,910
ACC - Advances on exchange contracts 5.81% USD — 2,021 623,400 3,687,101 2,087,092 —
Notes 7,75% JBS S.A 2020 — — — — — 44,591 — 3,303,961
Notes 6,25% JBS S.A 2023 6.25% USD — 2,023 75,602 64,161 2,993,874 2,551,732
Notes 7,25% JBS S.A 2024 7.25% USD — 2,024 53,376 44,680 2,901,727 2,475,617
Working capital - Euro 2.67% EUR Euribor 2,023 19,039 18,362 49,458 58,643
FINIMP — — — — — 600 — —
1,782,838 7,266,376 12,354,189 11,166,863Local currencyCredit note - export 9.11% BRL CDI 2021 7,547 763,412 963,332 467,358
Working capital - Brazilian Reais 7.66% BRL CDI and TJLP 2020 - 21 37 116,167 129,095 14,205
FINAME 8.60% BRL TJLP 2020 - 25 26,720 45,178 40,867 73,130
FINEP 6.29% BRL — 2021 - 25 22,960 22,005 59,532 81,922
CDC - Direct credit to consumers 14.14% BRL — 2020 - 23 27,959 10,059 127,192 30,680
85,223 956,821 1,320,018 667,295
1,868,061 8,223,197 13,674,207 11,834,158
JBS S.A.Notes to the financial statements for the years ended December 31, 2018 and 2017(Expressed in thousands of Brazilian reais)
39

Consolidated
Averageannual
interest rate Currency Indexer
Paymentterms / non-current debt
Current Non-current
Type Dec 31, 2018 Dec 31, 2017 Dec 31, 2018 Dec 31, 2017
Foreign currencyACC - Advances on exchange contracts 5.89% USD — 2020 - 21 634,900 5,055,776 3,094,983 —
Prepayment 6.09% USD Libor 2020 - 23 1,275,206 5,048,964 5,694,441 3,084,877
Notes 7,75% JBS S.A 2020 — — — — — 44,591 — 3,303,961
Notes 6,25% JBS S.A 2023 6.25% USD — 2023 75,602 64,161 2,993,874 2,551,732
Notes 7,25% JBS S.A 2024 7.25% USD — 2024 53,376 44,680 2,901,727 2,475,617
Notes 7,00% JBS S.A 2026 7.00% USD — 2026 29,761 — 1,896,572 —
Credit note – import 5.48% USD Libor 2021 2,868 98,641 114,832 —
FINIMP 6.02% USD and EUR Libor and Euribor * 5,440 15,682 — 4,658
Scott credit facilities 4.72% USD — 2023 1,298 — 7,250 —
Working capital - Euro/US dollars/Pound 2.63%USD, EURand GBP
Libor, Euribor andGBP Libor 2023 22,537 29,957 49,458 58,643
2,100,988 10,402,452 16,753,137 11,479,488Local currencyFINAME 7.89% BRL TJLP 2020 - 25 35,013 53,599 55,823 96,183
FINEP 6.17% BRL — 2020 - 25 26,919 25,971 60,190 86,531
JBS Mortgage 5.80% USD — 2020 775 622 6,393 6,123
Senior Secured Credit Facility JBS Lux 5.75% USD Libor 2023 415 13,808 (17,921) 1,933,926
Term loan Five Rivers 2019 — — — — — 276,456 — —
Term loan JBS Lux 2022 5.24% USD Libor 2022 172,525 107,278 12,418,631 9,056,728
Notes 6,25% Moy Park 2021 — — — — — 8,022 — 1,317,011
Notes 8,25% JBS Lux 2020 — — — — — 79,600 — 2,298,881
Notes 7,25% JBS Lux 2021 7.25% USD — 2021 14,980 22,984 2,548,073 3,768,904
Notes 5,875% JBS Lux 2024 5.88% USD — 2024 78,728 67,212 2,891,764 2,466,501
Notes 5,75% JBS Lux 2025 5.75% USD — 2025 8,912 7,608 3,465,889 2,956,088
Notes 5,75% PPC 2025 5.75% USD — 2025 65,604 42,005 3,856,151 2,477,272
Notes 5,875% PPC 2027 5.88% USD — 2027 48,912 29,798 3,236,853 1,962,329
Notes 6,75% JBS Lux 2028 6.75% USD — 2028 88,927 — 3,455,849 —
PPC term loan 3.63% USD Libor 2023 110,610 147,285 1,799,364 2,447,920
PPC revolving credit facility — — — — - 324 — 216,208
Working capital - Brazilian Reais 7.82% BRL CDI and TJLP 2020 - 21 4,603 121,667 135,665 22,531
Working capital - US Dollars 2.91% USD Libor 2021 — 112,472 174,095 —
Working capital - Euros 1.37% EUR Euribor 2023 56,153 90,706 4,985 10,648
Credit note – export 9.02% BRL CDI 2020 - 22 28,735 1,603,518 1,811,421 528,520
Credit note – import — - — — — 187,462 — —
CDC - Direct credit to consumers 14.14% BRL — 2020 - 23 27,959 10,059 127,192 30,680
CCB 8.98% BRL UM BNDES 2020 - 24 3,012 3,009 16,305 18,994
ACC - Advances on exchange contracts 2.91% USD Libor 2021 — 126 1,087 —
Rural - Credit note 7.42% BRL — 2020 - 21 10,198 100,630 315,526 —
Mexico credit facility — — — — — 1,813 — 252,424
Moy Park revolving credit facility 2.00% GBP Libor 2023 163 — (2,786) —
Scott credit facilities 5.48%USD, EURand NZD US Prime rate 2020 16,945 — 3,832 —
JBS Australia Feedlot Agreement 7.00% AUD — 2023 — — 73,664 —
Other 1.61%BRL, EUR,
GBP and AUD Euribor and BBSY 2020 - 25 21,559 9,565 39,711 64,710
821,647 3,123,599 36,477,756 32,019,112
2,922,635 13,526,051 53,230,893 43,498,600
* Balances classified as current which have their maturities between January 1, 2019 and December 31, 2019.
Average annual interest rate: Refers to the weighted average nominal cost of interest at the reporting date. The loans and financings are fixed by a fixed rate or indexed to rates:CDI, TJLP, UMBNDES, LIBOR and EURIBOR, among others.
As of December 31, 2018 and 2017, the availability under JBS USA revolving credit facilities was R$7.4 billions (US$1.9 billions) and R$3.3 billion (US$1.0 billion), respectively.
JBS S.A.Notes to the financial statements for the years ended December 31, 2018 and 2017(Expressed in thousands of Brazilian reais)
40

The non-current portion of the principal payment schedule of loans and financing is as follows:
December 31, 2018Maturity Company Consolidated
2020 175,319 483,6972021 6,540,725 13,119,9682022 1,020,340 13,294,7032023 3,031,728 4,535,4072024 2,903,342 5,809,389Maturities thereafter 2,753 15,987,729
13,674,207 53,230,893
a. Normalization agreement with financial institutions in Brazil
According to the debt Normalization Agreement, signed on May 14, 2018, an extension for the maturity of all outstanding debts Principals was determined bilaterally in the date ofthe agreement with the signatory banks to July 2021, in the amount of R$12.2 billion. The interest arising from the amount agreed with the banks will be updated and paid accordingto the interest rate and terms established in the original agreements for each debt line. The agreement also establishes the amortization of approximately 25% of the debt principalstarting from January 2019 until the end of the agreement which occurs in July 2021. At the year ended December 31, 2018, all the debt included in the Normalization Agreementis classified as non-current, except the principal installments which will be settled up to twelve months.
The Normalization Agreement provides certain conditions for the replacement and/or extension of any type of debt, ensuring that the reduction of the debt's principal occurs in July2021 indeed, including the debts related to foreign exchange contracts. Although the ACC (Advances on exchange contracts) and the Rural credit note are debts with a short-termprofile (current liabilities), the amount of these debts, which are included in the Normalization Agreement, will also be settled at the end of the agreement. Therefore, these debtswill be presented in non-current liabilities in these financial statements.
In September 2018 JBS and Seara anticipated the payment of approximately R$2 billion of the Normalization agreement which would expire in 2019 and 2020, of the prepaymentlines (PPE), export credit note (NCE) and advance payment of the exchange contract (ACC).
The Company presents sufficient operating cash flow to meet its short-term obligations and declares that was in compliance with all of the restrictions of the Normalization Agreementas of December 31, 2018 and until the date of approval of these financial statements.
16.1 Guarantees and contractual restrictions ("covenants")
Type Issuer and guarantors Covenants / Guarantees Events of defaultDecember 31,
2018
144 - A:Notes 6,25%JBS S.A 2023
- JBS S.A.
Customary negative covenants that may limit the Company's ability and theability of certain subsidiaries to, among other things:- incur additional indebtedness unless the net debt/EBITDA ratio is lower than4.75/1.0.- create liens;- sell or dispose of certain assets;- enter into certain transactions with affiliates;- dissolve, consolidate, merge or acquire the business or assets of other entities;- enter into sale/leaseback transactions;- undergo changes of control without making an offer to purchase the Notes;and- declare or pay any dividends or make any distributions related to securitiesissued by the Company (except for debt instruments convertible or exchangeablefor such amounts), if i) it is not in default in relation to the Notes; ii) the Companycan incur at least US$1.00 of debt under the terms of the net debt/EBITDA ratiotest established in the indenture of the Notes; and iii) the total value to be paiddoes not exceed US$30 million or a. 50% of the amount of the net incomeaccrued on a cumulative basis during a certain period, taken as one accountingperiod, (as defined in the indenture), or if the aggregate net income is a loss,minus 100% of the amount of the loss, plus b. 100% of the net cash proceedsreceived from the issue or sale of its equity interests or other capital contributionssubsequent to the issue date of the Notes, plus c. 100% of the fair market valueof property other than cash received from the issue or sale of its equity interestsor other capital contributions subsequent to the issue date of the Notes.
The indentures of Notescontain customaryevents of default (1). Incase any event of defaultoccurs, the trustee or theholders of at least 25% ofthe notes principalamount at the time maystate to pay immediatelythe principal andaccrued interest on thenotes.The notes are unsecureddebts.
3,069,476
144 - A:Notes 7,25%JBS S.A 2024
2,955,103
144 - A:Notes 7,00%JBS S.A 2026
1,926,333
Senior SecuredCredit Facility
JBS Lux
- JBS S.A.;- JBS Global Luxembourg S.àr.l.;- JBS Global Meat HoldingsPty. Limited (formerly BurcherPty. Limited);- JBS USA Food CompanyHoldings;- JBS USA Food Company;- JBS Ansembourg Holding S.àr.l.;- JBS Luxembourg S.à r.l.;- JBS USA Holding Lux;- All US subsidiaries of JBS Luxexcept JBS WisconsinProperties LLC and certainother immaterial subsidiaries- JBS Australia Pty Ltd.- JBS Food Canada ULC.
- The borrowings are collateralized by a first priority perfected lien and interestin accounts receivable, finished goods and supply inventories.- The facility contains customary representations, warranties and a springingfinancial covenant that requires a minimum fixed charge coverage ratio of notless than 1.00 to 1.00. This ratio is applicable if borrowing availability causes acovenant trigger period, which only occurs when borrowing availability falls belowthe greater of 10% of the maximum borrowing amount and US$70 millions.
The facility also contains negative covenants that may limit JBS Lux ability andcertain of our subsidiaries ability to, among other things:- incur certain additional indebtedness;- create certain liens on property, revenue or assets;- make certain loans or investments;- sell or dispose of certain assets;- pay certain dividends and other restricted payments;- prepay or cancel certain indebtedness;- dissolve, consolidate, merge or acquire the business or assets of other entities;- enter into joint ventures other than certain permitted joint ventures or createcertain other subsidiaries;- enter into new lines of business;- enter into certain transactions with affiliates;- agree to restrictions on the ability of the subsidiaries to make dividends;- agree to enter into negative pledges in favor of any other creditor; and- enter into certain sale/leaseback transactions.
The facility also containscustomary events ofdefault (1) and it includesfailure of any collateraldocument to create ormaintain a priority lienmatters. If an event ofdefault happens, theborrowers may, withinother options, cease theagreement, state theentire balance to be paid,with accrued interest.
(availability upto R$3.5 billion
(US$900million))
JBS S.A.Notes to the financial statements for the years ended December 31, 2018 and 2017(Expressed in thousands of Brazilian reais)
41

Term loan JBSLux 2022
- JBS S.A.;- JBS Global Luxembourg S.àr.l.;- JBS Global Meat HoldingsPty. Limited (formerly BurcherPTY Limited);- JBS USA Food CompanyHoldings; - JBS USA Holding Lux;- JBS USA Food Company;- JBS Ansembourg HoldingS.à r.l;- JBS Luxembourg S.à r.l.;and - Each of the U.S. restrictedsubsidiaries that guaranteethe senior secured creditfacility (subject to certainexceptions).
- Secured by a perfected first priority security interest in all of JBS Lux and certainof its subsidiaries’ fixed assets.
The facility also contains negative covenants that may limit JBS Lux ability andcertain of our subsidiaries ability to, among other things:- incur certain additional indebtedness;- create certain liens on property, revenue or assets;- make certain loans or investments;- sell or dispose of certain assets;- pay certain dividends and other restricted payments;- prepay or cancel certain indebtedness;- dissolve, consolidate, merge or acquire the business or assets of other entities;- enter into joint ventures other than certain permitted joint ventures or createcertain other subsidiaries;- enter into new lines of business;- enter into certain transactions with affiliates;- agree to restrictions on the ability of the subsidiaries to make dividends;- agree to enter into negative pledges in favor of any other creditor; and- enter into certain sale/leaseback transactions.
The facility also containscustomary events ofdefault (1), listed under theAmended and RestatedRevolving Facility.
12,591,154
Notes 7,25% JBSLux 2021
- JBS S.A.;- JBS Global Lux;- JBS Global Meat HoldingsPty.Limited (formerly BurcherPTY Limited);- JBS USA Holding Lux;- JBS USA Food Company;- JBS Ansembourg Holding;S.à r.l- JBS Luxembourg S.à r.l.; and- Each of the U.S. restrictedsubsidiaries that guarantee thesenior secured credit facility(subject to certain exceptions).
The Notes contain negative covenants that may limit JBS Lux ability and certainof our subsidiaries ability to, among other things:- incur certain additional indebtedness;- create certain liens;- sell or dispose of certain assets;- pay certain dividends and other restricted payments;- permit restrictions on dividends and other restricted payments to restrictedsubsidiaries- prepay or cancel certain indebtedness;- enter into certain transactions with affiliates;- enter into certain sale/leaseback transactions; and- undergo changes of control without making an offer to purchase the Notes.The indenture governing the Notes also restricts JBS S.A. from incurring anydebt (subject to certain permitted exceptions), unless on the date of suchincurrence and the application of the proceeds therefrom, its net debt to EBITDAratio is less than 4.75 to 1.00. In addition, the indenture restricts JBS S.A.’s abilityto make restricted payments and other distributions.
The indenture alsocontains customaryevents of default (1) . Incase any event of defaultoccurs, the trustee or theholders of at least 25% ofthe notes principalamount at the time maystate to pay immediatelythe principal and accruedinterest on the notes.The notes are unsecureddebts.
2,563,052
Notes 5,875%JBS Lux 2024 2,970,491
Notes 5,75% JBSLux 2025 3,474,800
Notes 6,75% JBSLux 2028 3,544,776
Notes 5,75% PPC2025
- PPC;- One of PPC’s subsidiaries.
The Notes contain negative covenants that may limit PPC's ability and certainof its subsidiaries ability to, among other things:- incur certain additional indebtedness;- create certain liens;- pay certain dividends and other restricted payments;- sell or dispose of certain assets;- enter into certain transactions with affiliates;- consolidate, merge or dissolve substantially all the assets of PPC.
The facility also containscustomary events ofdefault (1). In case anyevent of default occurs,the trustee or the holdersof at least 25% of the notesprincipal amount at thetime may state to payimmediately the principaland accrued interest onthe notes.The notes are unsecureddebts.
3,921,755
Notes 5,875%PPC 2027 3,285,775
PPC term loan
- PPC;- Certain of PPC’ssubsidiaries.
- Secured by a first priority lien on i) the accounts receivable and inventories ofPPC and its non-Mexico subsidiaries, ii) 100% of the equity interests in PPC’sdomestic subsidiaries, To-Ricos, Ltd. and To-Ricos Distribution Ltd., and 65% ofthe equity interests in PPC’s direct foreign subsidiaries, iii) substantially all of thepersonal property and intangibles of the borrowers and guarantors under theU.S. Credit Facility and iv) substantially all of the real estate and fixed assets ofPPC and the guarantors.
The facility also contains negative covenants that may limit PPC's ability andcertain of its subsidiaries ability to, among other things:- incur certain additional indebtedness;- create certain liens;- pay certain dividends and other restricted payments;- sell or dispose of certain assets;- enter into certain transactions with affiliates; and- consolidate, merge or dissolve substantially all the assets of PPC.
Covenants in the facility also require PPC to use the proceeds it receives fromcertain asset sales and specified debt or equity issuances and upon theoccurrence of other events to repay outstanding borrowings under the facility.The PPC Credit Facility also provides that PPC may not incur capital expendituresin excess of US$500 million in any fiscal year.
The facility also containscustomary events ofdefault (1).
1,909,974
PPC revolvingcredit facility
(availability upto R$2.9 billion
(US$750million))
Moy ParkRevolving
Credit Facility
- Moy Park Limited- Moy Park (NewCo) Limited- Moy Park (Bondco) plc- Kitchen Range FoodsLimited- Moy Park Holdings (Europe)Limited.
The facility also contains negative covenants that may limit Moy Park's abilityand certain of its subsidiaries ability to, among other things:- incur certain additional indebtedness;- create certain liens;- pay certain dividends and other restricted;- sell or dispose of certain assets;- enter into certain transactions with affiliates; and- consolidate, merge or dissolve substantially all the assets of Moy Park.
The facility also containscustomary events ofdefault (1).
(availability upto R$500million
(GBP100million))
JBS S.A.Notes to the financial statements for the years ended December 31, 2018 and 2017(Expressed in thousands of Brazilian reais)
42

(1) Customary events of default includes failure to perform or observe terms, covenants or other agreements in the facility, defaults on other indebtedness if the effect is to permitacceleration, failure to make a payment on other indebtedness unless waived or extended within the applicable grace period, entry of unsatisfied judgments or orders against theissuer or its subsidiaries and certain events related to bankruptcy and insolvency matters.
The Company was in compliance with all of its debt covenant restrictions at December 31, 2018 and until the date that these financial statements were approved.
16.2 Financing activities rollforward
Company
31.12.18
Liabilities Assets Equity
Note
Loans andfinancings -
short and longterm
Derivativesliabilities
Related partiespayables Other liabilities
Derivativesassets
Profit reserve:Treasuryshares
Balance at December 31, 2017 (20,057,355) (10) (3,018,787) (826,674) — 192,882
Changes in financing cash flows:
Proceeds from loans and financings 16 (149,143) — — — — —
Payments of loans and financings 16 7,023,786 — — — — —
Derivatives instruments received/settled 31 — 107,250 — — (235,392) —
Dividends paid 20 — — — 126,883 — —
Purchase of treasury shares 24 b3 — — — — — 498,195
Total of changes in financing cash flows 6,874,643 107,250 — 126,883 (235,392) 498,195
Exchange rate variation changes (2,873,392) — — (808) — —
Other changes:
Derivatives fair value adjustment 26 — 15,680 — — 95,173 —
Interest expenses 26 (1,265,398) — — (3,477) — —
Interest paid 26 1,372,680 — — — — —
Changes in operating activities — — — 29,313 — —
Adjustments in net income for cash flows — — — (6,684) — —
Non-cash transactions 406,554 (146,522) — (222,538) 146,522 (66,938)
Total of other liabilities changes 513,836 (130,842) — (203,386) 241,695 —
Total of other equity changes — — — — — (66,938)
Balance at December 31, 2018 (15,542,268) (23,602) (3,018,787) (903,985) 6,303 624,139
Primo ANZcredit facility
- P&M Quality Small GoodsPty. Ltd.- Australian ConsolidatedFood Holdings Pty Limited- Australian ConsolidatedFood Investments Pty Limited- Primo Group Holdings PtyLimited- Primo Meats Pty. Ltd.- Certain subsidiaries of PrimoMeats Pty Ltd.
Customary negative covenants that may limit Primo’s ability and the ability ofcertain subsidiaries to, among other things:- sell or dispose of certain assets;- change the general nature of the core business of the company;- incur certain additional indebtedness; - declare certain dividends, share premiums, or repurchases of equity.
The facility also containscustomary events ofdefault (1). At theoccurrence of an event ofdefault, the lenders may,within other options,cancel the facilitycommitments, declare allloans and accruedinterest immediatelypayable, or changeconditions on the facility.
(availability upto R$547million
(AUD200million))
JBS S.A.Notes to the financial statements for the years ended December 31, 2018 and 2017(Expressed in thousands of Brazilian reais)
43
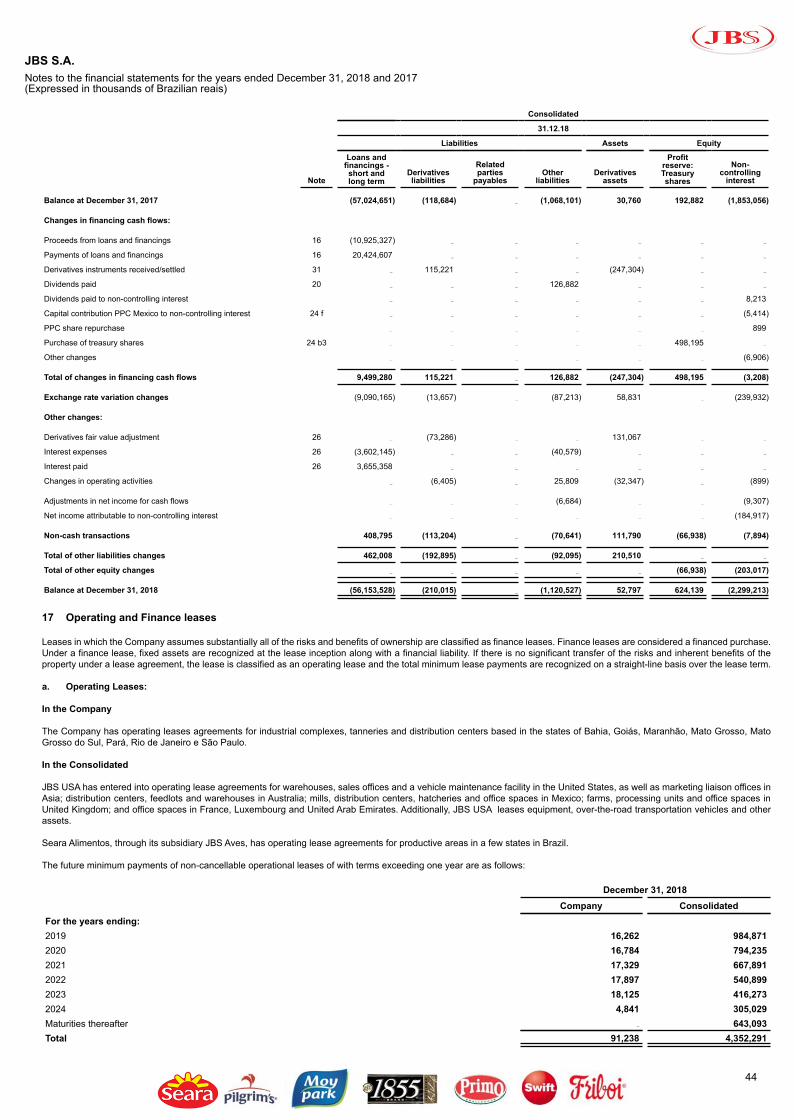
Consolidated
31.12.18
Liabilities Assets Equity
Note
Loans andfinancings -short andlong term
Derivativesliabilities
Relatedparties
payablesOther
liabilitiesDerivatives
assets
Profitreserve:Treasuryshares
Non-controlling
interest
Balance at December 31, 2017 (57,024,651) (118,684) — (1,068,101) 30,760 192,882 (1,853,056)
Changes in financing cash flows:
Proceeds from loans and financings 16 (10,925,327) — — — — — —
Payments of loans and financings 16 20,424,607 — — — — — —
Derivatives instruments received/settled 31 — 115,221 — — (247,304) — —
Dividends paid 20 — — — 126,882 — — —
Dividends paid to non-controlling interest — — — — — — 8,213
Capital contribution PPC Mexico to non-controlling interest 24 f — — — — — — (5,414)
PPC share repurchase — — — — — — 899
Purchase of treasury shares 24 b3 — — — — — 498,195 —
Other changes — — — — — — (6,906)
Total of changes in financing cash flows 9,499,280 115,221 — 126,882 (247,304) 498,195 (3,208)
Exchange rate variation changes (9,090,165) (13,657) — (87,213) 58,831 — (239,932)
Other changes:
Derivatives fair value adjustment 26 — (73,286) — — 131,067 — —
Interest expenses 26 (3,602,145) — — (40,579) — — —
Interest paid 26 3,655,358 — — — — — —
Changes in operating activities — (6,405) — 25,809 (32,347) — (899)
Adjustments in net income for cash flows — — — (6,684) — — (9,307)
Net income attributable to non-controlling interest — — — — — — (184,917)
Non-cash transactions 408,795 (113,204) — (70,641) 111,790 (66,938) (7,894)
Total of other liabilities changes 462,008 (192,895) — (92,095) 210,510 — —
Total of other equity changes — — — — — (66,938) (203,017)
Balance at December 31, 2018 (56,153,528) (210,015) — (1,120,527) 52,797 624,139 (2,299,213)
JBS S.A.Notes to the financial statements for the years ended December 31, 2018 and 2017(Expressed in thousands of Brazilian reais)
17 Operating and Finance leases
Leases in which the Company assumes substantially all of the risks and benefits of ownership are classified as finance leases. Finance leases are considered a financed purchase.Under a finance lease, fixed assets are recognized at the lease inception along with a financial liability. If there is no significant transfer of the risks and inherent benefits of theproperty under a lease agreement, the lease is classified as an operating lease and the total minimum lease payments are recognized on a straight-line basis over the lease term.
a. Operating Leases:
In the Company
The Company has operating leases agreements for industrial complexes, tanneries and distribution centers based in the states of Bahia, Goiás, Maranhão, Mato Grosso, MatoGrosso do Sul, Pará, Rio de Janeiro e São Paulo.
In the Consolidated
JBS USA has entered into operating lease agreements for warehouses, sales offices and a vehicle maintenance facility in the United States, as well as marketing liaison offices inAsia; distribution centers, feedlots and warehouses in Australia; mills, distribution centers, hatcheries and office spaces in Mexico; farms, processing units and office spaces inUnited Kingdom; and office spaces in France, Luxembourg and United Arab Emirates. Additionally, JBS USA leases equipment, over-the-road transportation vehicles and otherassets.
Seara Alimentos, through its subsidiary JBS Aves, has operating lease agreements for productive areas in a few states in Brazil.
The future minimum payments of non-cancellable operational leases of with terms exceeding one year are as follows:
December 31, 2018Company Consolidated
For the years ending:2019 16,262 984,8712020 16,784 794,2352021 17,329 667,8912022 17,897 540,8992023 18,125 416,2732024 4,841 305,029Maturities thereafter — 643,093Total 91,238 4,352,291
44

In December 31, 2018, operating lease payments recognized as expense in the period totaled R$20,345 in the Company and in the Consolidated R$831,685 (R$10,754 andR$614,249 in the Company and Consolidated in December 31, 2017, respectively).
b. Finance Leases:
In the consolidated
JBS USA has lease agreements for its commercial vehicles and machinery and equipment, and Seara has a lease agreement of an building in the state of Minas Gerais, for whichthe book value recognized on property, plant and equipment is detailed below:
Usefullife Cost Accumulated
DepreciationDecember 31,
2018December 31,
2017
Lease agreements 10 years 205,106 (78,103) 127,003 145,952
The future minimum payments of non-cancellable finance leases with terms exceeding one year are as follows:
Consolidated
Carrying Value Future financecharges
Future minimumlease payments
For the years ending:2019 18,613 2,558 21,1712020 11,110 2,284 13,3942021 7,101 2,283 9,3842022 6,650 2,567 9,2172023 6,443 2,825 9,2682024 5,939 3,050 8,989Maturities thereafter 34,952 8,176 43,128Total 90,808 23,743 114,551
JBS S.A.Notes to the financial statements for the years ended December 31, 2018 and 2017(Expressed in thousands of Brazilian reais)
18 Accrued income taxes and other taxes
Accrued income and other taxes are comprised of the following:
Company Consolidated
December 31, 2018 December 31, 2017 December 31, 2018 December 31, 2017Accrued income taxes — — 202,665 905,484Withholding income taxes 25,809 21,752 26,496 22,390ICMS / VAT / GST tax payable 26,434 21,460 64,844 61,504PIS / COFINS tax payable 72,417 58,074 92,440 72,973Taxes payable in installments 876,588 798,350 932,523 853,988Others 2,614 1,318 251,486 237,402
1,003,862 900,954 1,570,454 2,153,741Breakdown:Current liabilities 299,480 233,566 728,186 1,366,518Non-current liabilities 704,382 667,388 842,268 787,223
1,003,862 900,954 1,570,454 2,153,741
Decree 8,426/2015 - PIS/COFINS over financial income: In July 2015, the Company and its subsidiaries filed an injunction to suspend the enforceability of PIS and COFINSdebts over financial income. The Decree 8,426/2015 reestablished the levy of PIS and COFINS on financial revenues obtained by companies subject to the PIS and COFINSnoncumulative regime, at the rates of 4.65%. As of December 31, 2018 and December 31, 2017, the Company has recorded under Income taxes, payroll, social charges and taxobligation the amount of R$67,215 and R$54,154 in the Company, respectively, and in the Consolidated R$85,062 and R$67,539, respectively, regarding to PIS/COFINS overfinancial income.
45

19 Accrued payroll and social charges
Accrued payroll and social charges are comprised of the following:
Company Consolidated
December 31, 2018 December 31, 2017 December 31, 2018 December 31, 2017Salaries and related social charges 280,635 260,932 1,263,693 1,101,615Bonus and vacation along with related social charges 214,801 186,092 2,276,391 2,051,375Taxes payable in installments 3,439,543 1,580,836 3,502,778 1,593,079Others 4,400 5,281 206,264 136,184
3,939,379 2,033,141 7,249,126 4,882,253Breakdown:Current liabilities 771,936 598,303 3,508,585 3,034,053Non-current liabilities 3,167,443 1,434,838 3,740,541 1,848,200
3,939,379 2,033,141 7,249,126 4,882,253
Tax payable in installments: Upon adherence to the PRR (Funrural tax payable in installments) in September 2018, as described in note 23 - Provisions item a4, the caption"Accrued income taxes and other taxes" had an increase in the Taxes payable in installments line, in the Company, of R$203,765 in the current liabilities and R$2,138,126 in thenon-current liabilities, totaling R$2,341,891, and R$207,686 in the Consolidated in the current liabilities and R$2,187,865 in the non-current liabilities, totaling R$2,395,551, due tothe impact of the installment provision.
JBS S.A.Notes to the financial statements for the years ended December 31, 2018 and 2017(Expressed in thousands of Brazilian reais)
20 Dividends payable
The Company’s bylaws require the payment of dividends equal to at least 25% of the annual net income attributable to company shareholders; and as such the Company recordsa liability at year-end for the minimum unpaid yearly dividend amount. Dividends payable are recognized as a liability at December 31 of each year.
December 31, 2018 December 31, 2017Declared dividends on 2014 - Residual 447 447Declared dividends on 2015 - Residual 109 131Declared dividends on 2016 - Residual 11 12Declared dividends on 2017 - Residual 15 126,873Declared dividends on 2018 5,984 —
6,566 127,463
The residual amount of dividends corresponds to the unpaid dividends due to a lack of updated payment information. This pending information related to some minority shareholdersprecludes the Company from fully paying the dividends declared. The Company has sent notification to such shareholders to update their payment information so the amount canbe paid.
A liability for unpaid dividends will be maintained during the statutory period and classified as short term, since once the shareholder’s information is updated, the payment will bemade.
The Company has accrued dividends in December 31, 2018 of R$5,984 (R$126,873 in December 31, 2017) according to the calculation presented below:
December 31, 2018 December 31, 2017Net income attributable to company shareholders for the year 25,199 534,202Legal reserve – (5%) (1,260) (26,710)
Adjusted base for dividends calculation 23,939 507,492Mandatory dividends (25%) 5,984 126,873Declared dividends 5,984 126,873
46
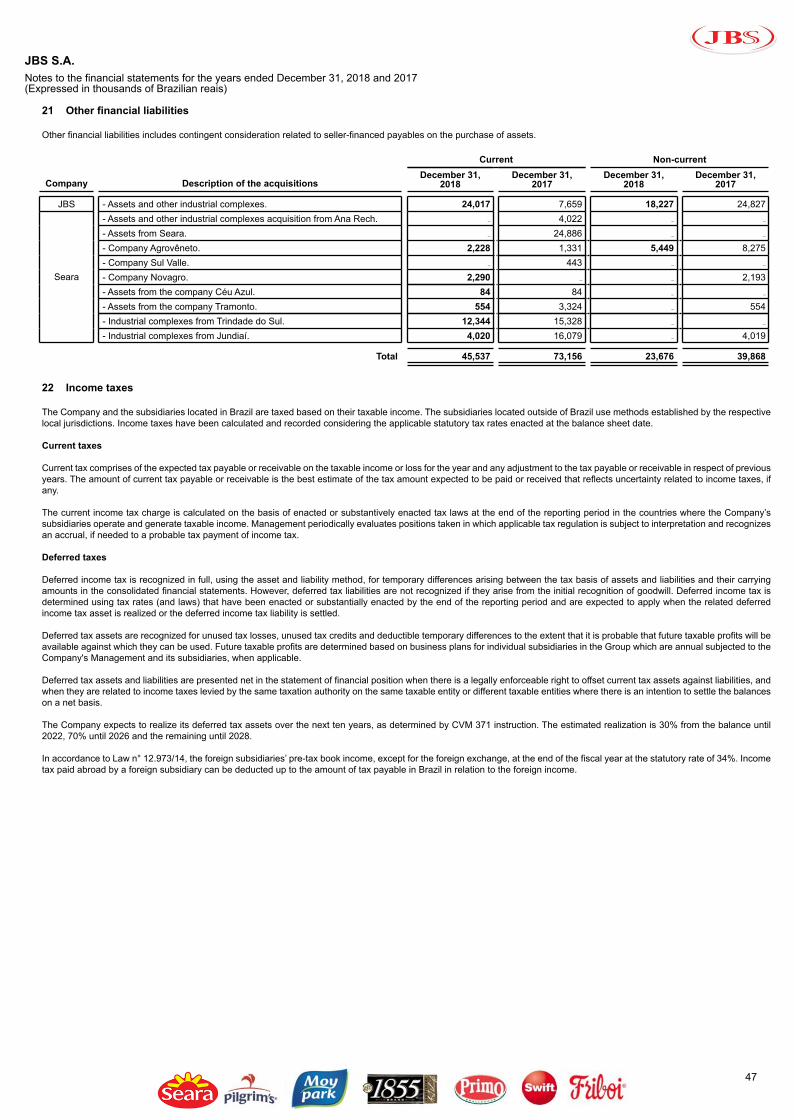
21 Other financial liabilities
Other financial liabilities includes contingent consideration related to seller-financed payables on the purchase of assets.
Current Non-current
Company Description of the acquisitionsDecember 31,
2018December 31,
2017December 31,
2018December 31,
2017
JBS - Assets and other industrial complexes. 24,017 7,659 18,227 24,827
Seara
- Assets and other industrial complexes acquisition from Ana Rech. — 4,022 — —
- Assets from Seara. — 24,886 — —
- Company Agrovêneto. 2,228 1,331 5,449 8,275- Company Sul Valle. — 443 — —
- Company Novagro. 2,290 — — 2,193- Assets from the company Céu Azul. 84 84 — —
- Assets from the company Tramonto. 554 3,324 — 554- Industrial complexes from Trindade do Sul. 12,344 15,328 — —
- Industrial complexes from Jundiaí. 4,020 16,079 — 4,019
Total 45,537 73,156 23,676 39,868
JBS S.A.Notes to the financial statements for the years ended December 31, 2018 and 2017(Expressed in thousands of Brazilian reais)
22 Income taxes
The Company and the subsidiaries located in Brazil are taxed based on their taxable income. The subsidiaries located outside of Brazil use methods established by the respectivelocal jurisdictions. Income taxes have been calculated and recorded considering the applicable statutory tax rates enacted at the balance sheet date.
Current taxes
Current tax comprises of the expected tax payable or receivable on the taxable income or loss for the year and any adjustment to the tax payable or receivable in respect of previousyears. The amount of current tax payable or receivable is the best estimate of the tax amount expected to be paid or received that reflects uncertainty related to income taxes, ifany.
The current income tax charge is calculated on the basis of enacted or substantively enacted tax laws at the end of the reporting period in the countries where the Company’ssubsidiaries operate and generate taxable income. Management periodically evaluates positions taken in which applicable tax regulation is subject to interpretation and recognizesan accrual, if needed to a probable tax payment of income tax.
Deferred taxes
Deferred income tax is recognized in full, using the asset and liability method, for temporary differences arising between the tax basis of assets and liabilities and their carryingamounts in the consolidated financial statements. However, deferred tax liabilities are not recognized if they arise from the initial recognition of goodwill. Deferred income tax isdetermined using tax rates (and laws) that have been enacted or substantially enacted by the end of the reporting period and are expected to apply when the related deferredincome tax asset is realized or the deferred income tax liability is settled.
Deferred tax assets are recognized for unused tax losses, unused tax credits and deductible temporary differences to the extent that it is probable that future taxable profits will beavailable against which they can be used. Future taxable profits are determined based on business plans for individual subsidiaries in the Group which are annual subjected to theCompany's Management and its subsidiaries, when applicable.
Deferred tax assets and liabilities are presented net in the statement of financial position when there is a legally enforceable right to offset current tax assets against liabilities, andwhen they are related to income taxes levied by the same taxation authority on the same taxable entity or different taxable entities where there is an intention to settle the balanceson a net basis.
The Company expects to realize its deferred tax assets over the next ten years, as determined by CVM 371 instruction. The estimated realization is 30% from the balance until2022, 70% until 2026 and the remaining until 2028.
In accordance to Law n° 12.973/14, the foreign subsidiaries’ pre-tax book income, except for the foreign exchange, at the end of the fiscal year at the statutory rate of 34%. Incometax paid abroad by a foreign subsidiary can be deducted up to the amount of tax payable in Brazil in relation to the foreign income.
47

a. Reconciliation of income tax and social contribution expense:
Company Consolidated2018 2017 2018 2017
Profit (loss) before income taxes (PBT) (1,770,507) (81,673) (1,098,358) 1,151,756Nominal rate (34)% (34)% (34)% (34)%
Expected tax expense 601,972 27,769 373,442 (391,597)
Adjustments to reconcile taxable income:
Earnings and losses due to equity method 1,574,622 1,692,976 8,995 6,334Domestic production activities deduction — — 62,810 156,264Difference on tax rates for foreign subsidiaries — — 678,084 423,774Gain arising from foreign subsidiaries (376,365) (534,000) (376,365) (534,000)Transfer price adjustment (8,343) (9,548) (8,343) (9,548)Unrecognized tax benefit 79,071 (11,539) 112,074 (104,998)Withholding income tax - Foreign subsidiaries — — (145,388) (11,317)Stock option plan — (26,697) (1,599) (38,670)Non-taxable interest - Foreign subsidiaries — — 124,828 178,353Deferred tax prior year booking (2)
— — 4,265 435,963Dual jurisdiction taxation - Foreign subsidiaries — — 378,608 330,110Realization of other comprehensive income (5,859) (225,215) (5,859) (225,215)Penalties for infringements and/or tax payable in installments (36,389) (182,694) (39,097) (182,704)Deferred tax write-off - Moy Park business combination — (72,467) — (72,467)Gain with negative goodwill on credit acquisition 18,567 — 18,567 —
Other permanent differences (51,570) (42,710) 123,452 (86,569)
Current and deferred income tax (expense) benefit 1,795,706 615,875 1,308,474 (126,287)
Current income tax 1,685,889 649,610 247,388 (1,274,652)Deferred income tax 109,817 (33,735) 1,061,086 1,148,365
1,795,706 615,875 1,308,474 (126,287)
% IT/PBT 101.42 % 754.07 % 119.13 % (10.96)%
Company Consolidated2018 2017 2018 2017
Adjustments to reconcile taxable income (1)
Goodwill amortization - deferred (6,913) — (6,913) 10,972Prior years loss carryfowards - deferred — — (635,383) (553,126)Unrecognized tax losses (79,071) (11,539) (112,074) (104,998)Withholding income tax - Luxembourg restructure — — — 11,317Deferred tax prior year booking (2)
— — (4,265) (435,963)Deferred tax write-off - Moy Park business combination — 72,467 — 72,467Income tax on realization of other reserves (2,795) (2,890) (31,209) (62,476)
Current and deferred income tax (expense) benefit - ADJUSTED 1,706,927 673,913 518,630 (1,188,094)
Effective income tax rate 96.41% 825.14% 47.22% (103.16)%
(1) The Company believes that due to the origin and non-recurrence of specific events certain items should be excluded from the effective tax rate disclosure such as: i) Deferredtax expense arising from goodwill amortization; ii) Recognition of deferred tax from the current year; iii) Deferred tax assets on arising from prior years losses carryforwards (recognizedonly now that entities reach necessary criteria not observed in the past since on prior periods where such losses were generated, there were no expectation of profitable futureprofits); iv) Withholding income tax arising from foreign subsidiaries; v) Deferred tax write off regarding Moy Park's business combination;and vi) Income tax on realization of theother reserves (since it is not relate to the net operating income).
(2) Due to PRR's adhesion, with the possibility of using tax credits, its subsidiaries recognized positive deferred tax of tax loss and negative basis not constituted in previous yearsin the amount of R$4,265 in December 31, 2018 (R$435,963 in December 31, 2017).
JBS S.A.Notes to the financial statements for the years ended December 31, 2018 and 2017(Expressed in thousands of Brazilian reais)
48

b. Composition of deferred income tax and social contribution
Consolidated
December 31,2017
Income statement
Other adjustments
December 31,2018
Allowance for doubtful accounts 61,111 11,778 — 72,889Provisions for contingencies 175,077 29,443 — 204,520Present value adjustment - Trade accounts receivable 915 142 — 1,057Share-based payment — 9,604 — 9,604Other temporary differences assets 13,073 37,255 — 50,328Goodwill amortization (1,916,521) 6,913 — (1,909,608)Present value adjustment - Trade accounts payable (3,132) (418) — (3,550)Realization of other reserves / deemed cost (272,982) — 2,796 (270,186)Other temporary differences liabilities (23,333) 15,100 — (8,233)
Deferred taxes, net (1,965,792) 109,817 2,796 (1,853,179)
Consolidated
December 31,2017
Income statement
Exchangevariation
Other adjustments
December 31,2018
Tax losses and negative basis of social contribution 871,991 635,383 49,077 5,277 1,561,728Allowance for doubtful accounts 72,559 10,353 347 — 83,259Provision for contingencies 335,993 54,660 1,607 865 393,125Present value adjustment - Trade accounts receivable 1,292 2,891 — — 4,183Tax credits - Foreign subsidiaries 92,433 (59,242) 15,625 — 48,816Biological assets - Foreign subsidiaries 45,939 (51,331) 5,392 — —
Labor accidents accruals - Foreign subsidiaries 106,879 2,463 19,370 — 128,712Employee benefit plan - Foreign subsidiaries 75,489 12,083 13,306 — 100,878Accounts payable accrual - Foreign subsidiaries 300,228 27,436 56,967 — 384,631Moy Park business restructure 13,114 (15,130) 2,016 — —
Share-based payment — 9,604 — — 9,604Other temporary differences assets 219,650 469,527 6,187 202 695,566Goodwill amortization (2,033,318) 6,913 — — (2,026,405)Present value adjustment - Trade accounts payable (6,073) (6,487) — — (12,560)Business combination (2,310,175) 25,917 (236,562) (8,593) (2,529,413)Insurance claims accruals - Foreign subsidiaries (96,769) (2,389) (16,946) — (116,104)Inventory valuation - Foreign subsidiaries (112,978) (85,585) (10,827) — (209,390)Realization of other reserves / deemed cost (683,930) 29,838 — 2,795 (651,297)Other temporary differences liabilities (154,658) (5,818) (6,340) (22,611) (189,427)
Deferred taxes, net (3,262,334) 1,061,086 (100,781) (22,065) (2,324,094)
JBS S.A.Notes to the financial statements for the years ended December 31, 2018 and 2017(Expressed in thousands of Brazilian reais)
49

Company
December 31,2016
Income statement
Other adjustments (3)
December 31,2017
Tax losses and negative basis of social contribution 136,935 20 (136,955) —
Allowance for doubtful accounts 36,804 24,307 — 61,111Provisions for contingencies 140,650 34,427 — 175,077Present value adjustment - Clients 1,727 (812) — 915Other temporary differences assets 11,083 1,990 — 13,073Goodwill amortization (1,916,521) — — (1,916,521)Present value adjustment - Suppliers (5,266) 2,134 — (3,132)Realization of other reserves / deemed cost (275,873) — 2,891 (272,982)Deferred tax write-off - Moy Park business combination — (72,468) 72,468 —
Other temporary differences liabilities — (23,333) — (23,333)
Deferred taxes, net (1,870,461) (33,735) (61,596) (1,965,792)
Consolidated
December 31,2016
Income statement
Exchangevariation
Other adjustments (3)
December 31,2017
Tax losses and negative basis of social contribution 1,357,959 553,125 (190) (1,038,903) 871,991Allowance for doubtful accounts 47,937 24,420 202 — 72,559Provision for contingencies 244,140 91,379 474 — 335,993Present value adjustment - Clients 5,053 (3,761) — — 1,292Inventory valuation - Foreign subsidiaries 179,682 (50,310) 971 — 130,343Tax credits - Foreign subsidiaries 93,743 (2,856) 1,546 — 92,433Biological assets - Foreign subsidiaries 73,459 (27,847) 327 — 45,939Insurance accruals - Foreign subsidiaries 65,257 (65,023) (234) — —
Labor accidents accruals - Foreign subsidiaries 122,877 (17,188) 1,190 — 106,879Employee benefit plan - Foreign subsidiaries 128,548 (53,421) 362 — 75,489Accounts payable accruals - Foreign subsidiaries 351,818 (54,145) 2,555 — 300,228Moy Park business restructure — 12,874 240 — 13,114Other temporary differences assets 279,095 (27,650) 2,548 (34,343) 219,650Goodwill amortization (2,022,347) (10,971) — — (2,033,318)Present value adjustment - Suppliers (14,433) 8,360 — — (6,073)Business combination (2,888,659) 661,884 (64,112) (19,288) (2,310,175)Insurance claims accruals - Foreign subsidiaries (137,487) 42,258 (1,540) — (96,769)Inventory valuation - Foreign subsidiaries (335,716) 96,397 (4,002) — (243,321)Realization of other reserves / deemed cost (751,719) 64,899 — 2,890 (683,930)
Deferred tax write-off - Moy Park business combination — (72,468) — 72,468 —
Other temporary differences liabilities (108,138) (21,592) (8,446) (16,482) (154,658)
Deferred taxes, net (3,308,931) 1,148,364 (68,109) (1,033,658) (3,262,334)
Company ConsolidatedDecember 31, 2018 December 31, 2017 December 31, 2018 December 31, 2017
Deferred income taxes assets — — 1,159,445 434,861Deferred income taxes liabilities (1,853,179) (1,965,792) (3,483,539) (3,697,195)
(1,853,179) (1,965,792) (2,324,094) (3,262,334)
Unrecognized tax benefit
The Company’s unrecognized tax benefits as of December 31, 2018 and 2017 was R$336,960 and R$301,448, respectively. These net operating losses were generated primarilyin Brazil and do not expire under Brazilian tax regulations.
Deferred tax assets will be recognized in relation to the net operating losses in periods when the availability of future taxable profits are probable to realize the deferred tax asset.Provisions for probable losses related to income tax exposures are described in note 23.
Government subventions
The Company and its subsidiaries have subventions to investments granted by the state government which are mainly presumed and/or granted ICMS (Value-added tax on salesand services) credits that are granted as a encouragement to implement or expand economic enterprises. In other jurisdictions, the Company receives subventions of energy andtraining. When the income tax expense reduces and reflects the deductibility of these incentives, all conditions related to the government subventions were in compliance in theyear ended in December 31, 2018.
JBS S.A.Notes to the financial statements for the years ended December 31, 2018 and 2017(Expressed in thousands of Brazilian reais)
50

23 Provisions
The Company and its subsidiaries are party to several lawsuits arising in the ordinary course of business for which provisions are recognized based on estimated costs determinedby management as follows:
Company ConsolidatedDecember 31, 2018 December 31, 2017 December 31, 2018 December 31, 2017
Labor 221,826 143,954 453,227 406,434Civil 16,535 22,017 197,840 362,904Tax and Social Security 1,707,761 1,654,036 2,045,578 2,118,812Total 1,946,122 1,820,007 2,696,645 2,888,150
Changes in provisions
Company
December 31, 2017
Additions, disposalsand changes in
estimates Payments December 31, 2018Labor 143,954 269,531 (191,659) 221,826Civil 22,017 6,407 (11,889) 16,535Tax and Social Security 1,654,036 55,089 (1,364) 1,707,761Total 1,820,007 331,027 (204,912) 1,946,122
Consolidated
December 31, 2017
Additions, disposalsand changes in
estimates PaymentsExchange rate
variationDecember 31,
2018Labor 406,434 355,745 (308,849) (103) 453,227Civil 362,904 (140,245) (24,819) — 197,840Tax and Social Security 2,118,812 (50,396) (22,647) (191) 2,045,578Total 2,888,150 165,104 (356,315) (294) 2,696,645
Company
December 31, 2016
Additions, disposalsand changes in
estimates Payments December 31, 2017Labor 92,485 276,896 (225,427) 143,954Civil 9,945 100,023 (87,951) 22,017Tax and Social Security 1,582,384 87,480 (15,828) 1,654,036Total 1,684,814 464,399 (329,206) 1,820,007
Consolidated
December 31,2016
Additions, disposalsand changes in
estimates PaymentsAssets held for
saleExchange rate
variationDecember 31,
2017Labor 346,546 379,547 (315,299) (4,993) 633 406,434Civil 275,947 187,133 (100,176) — — 362,904Tax and Social Security 2,085,153 48,585 (15,827) — 901 2,118,812Total 2,707,646 615,265 (431,302) (4,993) 1,534 2,888,150
In the Company:
a. Tax and Social Security Proceedings
a1. ICMS - Value Added Tax (Imposto sobre Operações Relativas à Circulação de Mercadorias e sobre a Prestação de Serviços de Transporte Interestadual eIntermunicipal e de Comunicação): The Tax Authority of the State of São Paulo (Secretaria da Fazenda do Estado de São Paulo) filed 260 administrative proceedings (259administrative proceedings in December 31, 2017) against JBS, under which the Tax Authority challenges the amount of the Company’s ICMS tax credits arising from the purchaseof cattle and meat transfer by the Company in other Brazilian states. The Tax Authority of the State of São Paulo claims that the tax incentives should be approved by Confaz , andare known as a "Tax War". The Tax Authority of the State of São Paulo does not recognize the Company’s ICMS tax credits up to the amount of the ICMS tax guaranteed in suchother states. JBS estimates that the claims under these administrative proceedings amount to R$2,310,065 on December 31, 2018 (R$2,144,333 in December 31, 2017). In additionto presenting its defense in such administrative proceedings, the Company has filed legal proceedings seeking the payment of damages from such other states if the Tax Authorityof the State of São Paulo prevails in these administrative proceedings. The subject awaits judgment by the Federal Supreme Court (Theme 490 - general repercussion). There isa relevant extra-procedural element: Complementary Law n. 160/2017 which provided for the possibility of ratifying the credits that were not considered with the consequent remissionof debts. Currently, administrative procedures are outstanding by the States that transfer the benefits, which will result in the cancellation of debts. Management believes, basedon the advice of its legal counsel, that its arguments will prevail in these procedures, which is the reason why no provision has been made, considering as a remote loss.
a2. Other tax and social security procedures: JBS is part in additional 1,092 tax and social security proceedings (952 proceedings in December 31, 2017), which individuallyare not material. We highlight that the ones with probable loss risk have a provision of an aggregate amount of R$130,281 (R$157,076 In December 31, 2017).
a3. Plea bargain agreement impacts: The Company received in December 2017 an infraction fine referring to the year 2012, based in information provided in the appendixesof the plea bargain agreements, as described in footnote 2 - Plea bargain agreement, Leniency agreement and the impacts in the financial statements.
With the Leniency agreement adherence, the Company decided to implement the integrity program and internal independent investigations, also elaborating internal assessments
JBS S.A.Notes to the financial statements for the years ended December 31, 2018 and 2017(Expressed in thousands of Brazilian reais)
51

about the reported events and their impacts in the financial statements, which include the matters from the 2012 infraction fines. The assessments were elaborated to all yearsimpacted which is based on expenses paid without service rendering and supplies purchase, their impacts in withholding taxes and the deductibility of these expenses, plus interestand fines.
The adjustment recognized in the year ended December 31, 2017 is updated quarterly and in the year ended December 31, 2018 the impact totaled R$80,520, which was recognizedunder the caption "General and administrative expenses. The total amount of the accrual was R$1,577,480 at December 31, 2018.
In December 31, 2018, the Company assessed the provisions related to the plea bargain agreement considering the status of the ongoing fiscalizations and other grants to measurethe accrual and did not identified the need to make adjustments.
Subsequent event: In January 2019, a payment was done, using tax credits, related to a infraction fine referring to the year 2013 which its balance was already accrued as describedabove.
a4. Rural Tax Regularization Program (RRP): The Company adhered to the Rural Tax Regularization Program (RRP) in the amount of R$2.4 billion, and no accrual wasrecognized for this contingency, since the probability of loss was considered as possible.
There was no change in the Company's estimate of risk loss related to these lawsuits, however even if such debts were under discussion and with technical arguments of success,the Company decided to join the RRP in view of the benefits of the program, such as the use of tax credits, discounts and reductions, term for payment, and the cost of the lawsuit(both financial and procedural time).
The debts referring to the SENAR (Serviço Nacional de Aprendizagem Rural) contribution in the approximate amount of R$371,476 were not included in the RRP, as there is noprediction in the law, and, for this reason, it is still under discussion with possible loss expectation.
b. Labor Proceedings
As of December 31, 2018 JBS was party to 12,890 labor proceedings, (16,692 labor proceedings in December 31, 2017) involving total claims of R$1.6 billion (R$1.3 billion inDecember 31, 2017). Based on the opinion of the Company’s legal counsel, JBS has provisioned an aggregate amount of R$221,826 (R$143,954 on December 31, 2017) for lossesarising from these proceedings, which includes payroll taxes. Most of these lawsuits were filed by former employees of JBS seeking overtime payments and payments relating totheir exposure to health hazards, commuting time, alleged work accidents and recovery time. Among other labor proceedings, there are ongoing proceedings filed by the LaborMinistry (Ministério do Trabalho) related to labor issues.
c. Civil Proceedings
As of December 31, 2018, JBS was party to 1,266 civil proceedings (1,004 civil proceedings in December 31, 2017). In the opinion of the Management and its legal advisors, theexpected loss of R$16,535 (R$22,017 in December 31, 2017), has been accrued.
d. Other proceedings with possible outcome
As of December 31, 2018, JBS had other ongoing proceedings in the amount of R$5.3 billion (R$5.6 billion in December 31, 2017) which refer mainly to civil and labor proceedingsin the Company, and in the Consolidated in the amount of R$9.8 billion (R$8.6 billion in December 31, 2017) whose loss potential, according to the evaluation of its legal advisors,is possible, but not probable, for which the Company's Management has not set an accrual for possible loss.
e. Other investigative and judicial related procedures
The Company and its subsidiaries are part of several proceedings or relevant repercussions related to the facts described in note 2 - Plea bargain agreement, Leniency agreementand the impacts in the financial statements, as demonstrated below:
e1. Criminal procedures:
In criminal investigations and proceedings, legal entities do not suffer any criminal penalties arising from the events committed by its executives and/or representatives, who aresubjected to law penalties (including deprivation of liberty), in case of any proof of effective participation in illegal facts involving the Company and/or its subsidiaries.
- Bullish operation (police inquiry) and Criminal Investigative Procedure/RJ: Investigation to determine alledged irregularities in the investments made in JBS by BNDESPar,due to the "findings" mentioned in the TCU's (Tribunal de Contas da União) decision in 2015; from this operation, a series of precautionary actions were originated, among others,the search and seizure of documents from the Company or that could have sensitive information to the Company, as well as blocking the assets of the Company's controllers andtheir relatives, later than following a judicial decision to release all assets that were blocked. Finally, the investigative procedure has already been completed by the Federal Police(final report presented) and the report is under analysis by the MPF.
- Carne Fraca operation (police inquiry): Investigation due to suspicions of improper payments made to federal agents from SIF (Serviço de Inspeção Federal); the criminalinvestigations and prosecutions examine corruption in several companies which are part of the agricultural/farming segment (cold storage). Specifically regarding the Company,the conduct of employees and former employees are being investigated who are related to one unit in the State of Paraná. This investigative procedure is covered by the LeniencyAgreement signed by J&F and the MPF (with JBS adherence), based on the reports brought by employees (individuals) under the plea bargain agreements, given that the investigationhas not yet had its conclusion by the Federal Police.
- Porteira Aberta operation (police inquiry): Investigation of alleged crimes of corruption within JBS's cold storage unit in Barra do Garças, Mato Grosso, due to suspicions ofimproper payments made by employees to federal public servants of the Federal Inspection Service (SIF). The facts related to this investigative procedure are related the CarneFraca operation and are being dealt under the Leniency agreement signed by J&F, of which the Company is a member and has been collaborating and fulfilling its obligations tothe competent authorities. The investigative procedure is still ongoing and the company is cooperating with the investigation.
- Lama Asfáltica operation (police inquiry): Investigation due to suspicions of improper payments made to get tax incentives in the state of Mato Grosso do Sul; this inquiryinvestigates companies cartelisation who are part of the construction segment, which committed fraud in bidding processes and corruption of public servers. Specifically regardingthe Company, the Federal Police declares to have found evidence of improper payments to public servers from the state of Mato Grosso do Sul in exchange of tax incentives grantedto the Company in that place. That investigative procedure and the established facts were brought in specific Annexes on the state of Mato Grosso do Sul in the individuals' pleabargain agreements. The investigations involving the facts related to JBS S.A in the inquiry no. 525/17 have already been the subject of a final report and have already initiated twocriminal proceedings (one complaint received and ongoing and the other one which was rejected is awaiting judgment). None of the employees were charged, having been registeredas prosecution witnesses in the Criminal Actions, due to the specific annexes on the State of Mato Grosso do Sul.
- Tendão de Aquiles operation (criminal proceeding) in the 6ª Federal Criminal Court of São Paulo: Investigation due to suspicion of insider trading actions and marketmanipulation from the former executives at the time of the events (who are in the condition of defendants in the process) due to transactions carried out to purchase dollars andtreasury shares, using privileged information (plea bargain agreements and information leakage). This case is in the stage of criminal investigation with the witnesses testimonies(prosecution and defense) and production of evidence, without a sentence until the date of the first instance.
JBS S.A.Notes to the financial statements for the years ended December 31, 2018 and 2017(Expressed in thousands of Brazilian reais)
52

e2. Class actions:
- Class action - 1001502-51.2017.4.01.3700: Alleged irregularities in financings through loans acquired with the Banco Nacional do Desenvolvimento Econômico e Social - BNDES.3ª Vara Cível Federal de São Luis do MaranhãoPlaintiff: Aristoteles Duarte RibeiroOn September 25, 2018, the judge's decision was rendered by the Court of the 9th Federal Court of the Judiciary Section of São Paulo, determining the return of the case to the3rd Federal Court of the Judiciary Section of São Luis do Maranhão, since the pre-trial proceedings had been sentenced before connection recognition. A decision of the court isawaited.
- Class action - 820215-58.2017.8.12.0001: Aims the declaration of nullity of the Special Regime Agreement Agreement (TARES) n. 1028/2014 and 1103/2016, as well as theunavailability of assets of the defendants up to the amount equivalent to the losses suffered by the State.1ª Vara de Direitos Difusos, Coletivos e Individuais da Comarca de Campo GrandePlaintiff: Danny Fabricio Cabral Gomes e Soraya ThronickeIn November 17, 2017, a suspensive effect was granted to the Instrument of Appeal to determine the suspension of the blocks carried out. In April 25, 2018, the Court of Justice ofthe State of Mato Grosso do Sul confirmed the effects of the injunction, determining the release of assets with the consequent revocation of the injunction that had been grantedby the first degree court. It is awaited judgment of the action in first degree.
The class actions n° 5007526-48.2017.4.03.6100 (5ª Vara Cível Federal de São Paulo); n° 5007521-26.2017.4.03.6100 (9ª Vara Cível Federal de São Paulo); n°5203744-56.2017.8.09.0051 (3ª Vara da Fazenda Pública Estadual de Goiânia/GO); n° 1019930-11.2017.4.01.3400 (14ª Vara Cível Federal do Distrito Federal) had favorableoutcomes for the Company, therefore they were classified as remote loss.
e3. Corporate lawsuits:
- CVM - Administrative Sanction Proceeding 19957.005388/2017-11 (5388/2017): Determine the possible liability of i) the Company, for allegedly being a beneficiary of purchasesof US dollar derivative contracts using unfair practices, in violation of CVM Instruction No. 8/1979, II, d, between May 5 and 17, 2017; and, ii) subsidiary Seara Alimentos Ltda., forallegedly being a beneficiary of purchases of US dollar derivative contracts using unfair practices, in violation of CVM Instruction 8/1979, II, d, on May 10, 2017 .Defendants: JBS S / A, Seara Alimentos Ltda., Wesley Mendonça Batista and Eldorado Brasil Celulose S.A.
- The precautionary court action n° 5013681-67.2017.4.03.6100 (8ª Vara Cível Federal de São Paulo) was extinct, without any resolution and there was no appeal against thisdecision, therefore the proceeding was classified as a remote loss.
- The Company is no longer the defendant in the arbitration proceedings n° 93/17 and 110/18 (Lawsuit for loss and damaged suffered by the Company) and 94/17 which was thepetitioner right to vote in the Shareholder's Meeting of JBS S.A., scheduled for September 1, 2017, which is suspended by court order. These proceedings are classified as a remoteloss.
From the are four Administrative Sanctioning Procedures underway in the CVM, in which members and former members of the Company's management are accused of allegedinfractions of the capital market regulation regarding the disclosure of information, two already had outcomes (trial by the Collegiate and adherence to the Agreement Terms).
The Company also informs non-sanctioning administrative proceedings in process at the CVM, in which issues related to the Company are analyzed.
In subsidiary Seara Alimentos:
a. Labor Proceedings
As of December 31, 2018, Seara Alimentos subsidiaries were party to 16,608 labor proceedings (19,710 labor proceedings on December 31, 2017) labor proceedings, involvingthe total amount of R$2,081,588 (R$1,907,986 on December 31, 2017). Based on the opinion of the Company's legal counsel, an accrual has been made in the amount ofR$231,297 (R$262,252 on December 31, 2017) for losses arising from such proceedings, already including payable social charges by the employee and Seara Alimentos. Most ofthese lawsuits were filed by former employees of Seara Alimentos seeking overtime payments and payments relating to their exposure to health hazards, commuting time, allegedwork accidents and recovery time. Among other labor proceedings, there are ongoing proceedings filed by the Labor Ministry (Ministério do Trabalho) related to labor issues.
b. Civil proceedings
As of December 31, 2018, Seara Alimentos subsidiaries were party to 2,918 civil and administrative proceedings (2,490 civil an administrative proceedings on December 31, 2017),involving the total amount of R$685,745 (R$1,380,836 on December 31, 2017). Based on the opinion of the Company's legal counsel, an accrual has been made in the amount ofR$181,305 (R$340,886 on December 31, 2017) for losses arising from such proceedings. Most of these lawsuits are related to indemnity for collective moral damage, moral damagefor improper protest, repairing damages for poultry partnership or pigs integration, cancellation of industry or trade mark complaints and consumer contracts - product quality.
c. Tax Proceedings
As of December 31, 2018, Seara Alimentos and its subsidiaries are party to 615 (632 on December 31, 2017) tax and social security proceedings, in which the individual amountof the contingencies are not relevant. Proceedings with a probable loss risk have contingencies, in the amount of R$332,129 (R$458,963 on December 31, 2017).
d. Other proceedings with possible outcome
As of December 31, 2018, Seara Alimentos and its subsidiaries had other ongoing proceedings in the amount of R$3.3 billions (R$3.0 billions on December 31, 2017) which referto labor, civil and tax and social security proceedings, whose loss potential according to the evaluation of its legal advisors is possible but not probable, therefore there is no accrualrecognized.
JBS S.A.Notes to the financial statements for the years ended December 31, 2018 and 2017(Expressed in thousands of Brazilian reais)
24 Equity
a. Share capital: Share capital on December 31, 2018 and 2017 was R$23,576,206, represented by 2,728,747,412 common shares, having no nominal value. The share capitalamount is net of R$54,865 capitalized transaction costs related to expenses incurred in 2010 consisting of R$37,477 related to the transaction costs for the Company's Initial PublicOffering, and expenses in the amount of R$17,388 regarding the issuance of debentures during 2011. The Company is authorized to increase its capital by an additional 1,375,853,183common shares. According to statute, the Board of Directors shall determine the number, price, payment term and other conditions of the issuance of shares. The Company maygrant options to purchase shares to directors, employees or persons who will provide services, or the directors, employees or person providing the services under its control. Therewas no change in the movement of shares during the year ended December 31, 2018.
b. Capital reserves:
53

b1. Premium on issue of shares: refers to the difference between the subscription price that the stockholders pay for the shares and their fair value;
b2. Share-based compensation:
The Company has a stock option plan settled in shares. The Company grants stock options to employees as an incentive intended to create a sense of ownership and personalinvolvement with the development and financial success of JBS. Executive officers, directors and general managers are eligible to receive stock options under the plan. TheCompany’s Chairman establishes the criteria of granting the options and selecting the employees. The number of grantable shares authorized to be granted under the plan is limitedto 2% of the Company’s share capital, and also limited to 0.4% of the increase in the Company’s share capital per year.
The program's fair value is recognized as an expense with an offset to capital reserves. The total amount of expense is recognized during the period in which the right to exercisethe stock option is acquired, which generally occurs when the options are granted. The number of stock options that each employee is entitled to was calculated based on theaverage of the Company’s stock price for the three months prior to the grant date. The stock option program has the maximum term of ten years varying in accordance with eachindividual agreement. All options must be exercised by physical delivery of the shares of common stock.
The fair value of each stock option granted was estimated at the grant date based on the Black-Scholes-Meton pricing model.
The primary assumptions considered in the model were:
Grants Fair value assumptions
ProgramQuantity of
optionsFair value ofthe option
Exercise pricein R$
Expected exerciseterm
Risk free interestrate Volatility
Share price onthe grant date
DividendYield
2016C Apr-16 2,477,651 R$ 9.85 to R$ 10.75 0.00003 1 to 3 years 13,54% to 13,78% 69.19% 11.12 4.45%
2016D Jun-16 3,259,890 R$ 9.20 to R$ 10.05 0.00001 1 to 3 years 12,66% to 13,60% 65.98% 11.12 4.45%
2016E Nov-16 3,350,000 R$11.27 0.0000003 Immediate vesting — —11.27
—
2016F Nov-16 195,000 R$ 9.81 to R$ 10.49 0.000015 1 to 3 years 11,42% to 11,60% 50.30% 11.27 3.35%
2017A Jan-17 3,700,979 R$11.90 0.01000 Immediate vesting — —11.90
—
2017B May-17 1,004,722 R$ 11.72 to R$ 11.82 0.000002 1 to 3 years 9,31% to 9,64% 46.15% 11.86 0.45%
2017B1 May-17 35,876 R$11.86 0.00003 Immediate vesting — —11.86
—
2017C May-17 2,315,842 R$ 11.10 to R$ 11.15 1.00000 1 to 3 years 9,31% to 9,64% 46.15% 12.07 0.45%
2017D Oct-17 3,350,000 R$8.39 0.0000003 Immediate vesting — — 8.39 —
2018A Apr-18 317,127 R$ 7.50 to R$ 7.57 0.00001 1 to 3 years 6.22% to 7.07% 41.38% 7.57 0.53%
2018B May-18 264,201 R$ 7.50 to R$ 7.57 0.00001 1 to 3 years 6.25% to 6.99% 38.49% 7.57 0.54%
2018C May-18 771,071 R$ 9.66 to R$ 9.75 0.000004 1 to 3 years 6.25% to 6.99% 38.49% 9.75 0.54%
2018D May-18 1,500,000 R$ 9.66 to R$ 9.75 0.000002 1 to 3 years 6.25% to 6.99% 38.49% 9.75 0.54%
2018E Jun-18 153,846 R$ 9.62 to R$ 9.72 0,00002 1 to 3 years 6.74% to 8.81% 41.40% 9.75 0.5%
2018F Jul-18 35,897 R$ 9.63 a R$ 9.73 0.0000800 1 to 3 years 6,79% to 9,25% 47.53% 9.75 0.51%
2018G Oct-18 3,350,000 R$9.75 0.0000003 Immediate vesting — — 9.75 —
Total 26,082,102
* The program 2016B was cancelled during 2017 and its options were transferred to the 2017C program.
December 31, 2018
Program Grant Vesting termsOptions
outstandingRemaining contractual life
(years)
2016C May-16 05.01.16 1/3 per year with final maturity in January 1, 2019 464,350 0.08
2016D Jun-16 06.01.16 1/3 per year with final maturity in January 1, 2019 659,472 0.08
2017B May-17 05.01.17 1/3 per year with final maturity in January 2, 2020 568,146 1.42
2018A Apr-18 04.01.18 1/3 per year with final maturity in January 2, 2020 211,418 2.25
2018B May-18 05.01.18 1/3 per year with final maturity in January 2, 2020 176,134 2.33
2018C May-18 05.01.18 1/3 per year with final maturity in January 2, 2020 706,456 2.33
2018D May-18 05.01.18 1/3 per year with final maturity in January 2, 2020 1,000,000 2.33
2018E Jun-18 06.01.18 1/3 per year with final maturity in January 4, 2021 153,846 2.42
2018F Jul-18 07.01.18 1/3 per year with final maturity in January 4, 2021 35,897 2.50
3,975,719
Risk free interest rate: The Company uses as a risk free interest rate the projection obtained from Interpolation of fixed x floating interest rate swap (BM&F’s index Pre x DI).
Volatility: The Company estimated the volatility of its own shares by calculating historical volatility over the expected term.
Dividends yield: The dividend yield was estimated based on the payment expectation of dividends per share for the next 12 months divided by the share price.
JBS S.A.Notes to the financial statements for the years ended December 31, 2018 and 2017(Expressed in thousands of Brazilian reais)
54

The outstanding options changes and average exercise price per share are demonstrated, as follows:
December 31, 2018 December 31, 2017
Quantity of options Average exercise
price per share Quantity of options Average exercise
price per shareOpening balance 4,672,811 R$ 10.11 8,355,967 R$ 11.80
Granted 6,392,142 R$ 9.75 10,397,847 R$ 11.94Exercised (1) (6,819,078) R$ 11.12 (13,385,915) R$ 10.92Cancelled (270,156) R$ 11,20 (695,088) R$ 10.79
Closing balance 3,975,719 R$ 9.51 4,672,811 R$ 10.11
(1) The exercised shares during the years ended December 31, 2018 and 2017 totaled in the amounts of R$65,655 and R$97,152.
During the years ended December 31, 2018 and 2017, the expense with options plan totaled R$64,979 and R$78,520 in the Company and in the Consolidated in the amount ofR$118,105 and R$122,642. The expenses were recorded in the net income (loss) under the caption "General and administrative expenses", with the respective offset in "CapitalReserves."
b3. Treasury shares:
Treasury share activity during the years ended December 31, 2018 and 2017 were as follows:
December 31, 2018 December 31, 2017Quantity R$ thousand Quantity R$ thousand
Opening balance 19,072,043 192,882 135,261,051 1,625,510Purchase of treasury shares 53,386,400 498,195 25,307,000 255,938Treasury shares used in stock option plan (6,819,078) (66,938) (13,385,915) (148,993)Cancellation of treasury shares — — (128,110,093) (1,539,573)Closing balance 65,639,365 624,139 19,072,043 192,882
b4. Capital transaction: see note 3 - Basis of preparation and presentation of financial statements.
c. Other reserves: Refers to revaluations of fixed assets prior to CPC/IFRS adoption. Other reserves are transferred to retained earnings in proportion with the realization ofrevalued assets through depreciation, disposal and retirement.
d. Profit reserves:
Legal reserve: Credited annually with 5% of the profit of the year.
Investments statutory: Consists of the remaining balance of the net income accumulated over time after the computation of the legal reserve and dividend distribution. The purposeof this reserve is to provide funds for the investment in assets. e. Other comprehensive income (loss): Composed by valuation adjustments to equity reflex from the subsidiaries and accumulated translation adjustments referred to exchangerate variation in the translation of the subsidiaries' financial statements.
f. Non-controlling interest: Material non-controlling interest at December 31, 2018 and 2017 consisted of the 21.5% and 21,4%, respectively, of PPC common stock not ownedby JBS USA. JBS USA’s voting rights in PPC are limited to 78.5% of the total. PPC is one of the largest chicken producers in the world, with operations in the United States, Mexicoand Puerto Rico. The profit allocated to the PPC non-controlling interest during the years ended December 31, 2018 and 2017, was R$191,449 (US$52,388) and R$501,427(US$154,404), respectively. At December 31, 2018 and 2017, the accumulated non-controlling interest in PPC was R$2.2 billions (US$588,190) e R$1.9 billion (US$554,812),respectively. Below are the PPC total net sales, net income, cash provided by operations, total assets and total liabilities for the periods indicated
2018 2017
NET REVENUE 39,971,443 34,968,720
NET INCOME 906,099 2,255,651
Net cash provided by operating activities 1,796,704 2,602,296
December 31, 2018 December 31, 2017
Total assets 22,982,222 20,670,541
Total liabilities 15,156,734 14,532,014
In December 2018, the non-controlling interest from the indirect subsidiary Pilgrim's Pride contributed with capital to finance an expansion project in the south of Mexico in theamount of R$5,414 (US$1,421).
JBS S.A.Notes to the financial statements for the years ended December 31, 2018 and 2017(Expressed in thousands of Brazilian reais)
55

25 Net revenue
Revenue is recognized when the risks and inherent benefits are transferred to the customer or when it is probable that the economic benefits to be received by the Company canbe measured reliably. Revenue is measured at the fair value of the payment received or receivable for the sale of products and services in the Company’s normal course of business.The Company bases its estimate of returns on historical results, taking into consideration the type of customer, the type of transaction and the specifics of each arrangement.
Revenue is recognized at the point that the risks and rewards of the inventory have passed to the customer, which is either at the point of dispatch or on delivery of the products.This varies from customer to customer according to the terms of sale. In the statement of income, revenue is presented net of taxes associated with the sales, returns, rebates anddiscounts.
Revenue by significant category for the years ended December 31, 2018 and 2017 are as follows:
Company Consolidated2018 2017 2018 2017
GROSS REVENUESales of productsDomestic sales 17,792,759 16,028,043 140,053,970 123,583,051Export sales 11,188,051 8,833,623 47,108,704 45,290,376
28,980,810 24,861,666 187,162,674 168,873,427SALES DEDUCTIONReturns and discounts (927,343) (887,033) (3,783,956) (3,696,953)Sales taxes (678,541) (601,325) (1,698,474) (2,006,493)
(1,605,884) (1,488,358) (5,482,430) (5,703,446)NET REVENUE 27,374,926 23,373,308 181,680,244 163,169,981
JBS S.A.Notes to the financial statements for the years ended December 31, 2018 and 2017(Expressed in thousands of Brazilian reais)
26 Finance income (expense)
Finance income (expense) includes (i) interest payable on borrowings and direct issue costs; (ii) results from the daily settlements of future contracts used to protect assets andliabilities, as well as the fair value adjustments for derivative instruments that are described within note 31, (iii) interest receivable on funds invested which is recognized in profit orloss as it accrues using the effective interest method; and (iv) gains and losses associated with transactions denominated in foreign currencies.
Finance income (expense) consisted of the following for the years ended December 31, 2018 and 2017 are as follows:
Company Consolidated2018 2017 2018 2017
Exchange rate variation (3,058,420) (478,827) (4,337,586) (962,374)
Fair value adjustments on derivatives 110,853 8,696 57,781 28,585
Interest expense (1,635,463) (2,461,465) (3,935,177) (4,761,044)
Interest income 380,401 664,202 288,371 258,012
Taxes, contribution, fees and others (153,873) (64,370) (355,609) (158,505)
(4,356,502) (2,331,764) (8,282,220) (5,595,326)
Finance income 1,332,305 2,223,849 1,404,446 1,986,856
Finance expense (5,688,807) (4,555,613) (9,686,666) (7,582,182)
(4,356,502) (2,331,764) (8,282,220) (5,595,326)
At December 31, 2018, the amount of taxes, contributions, fees and others of R$(153,873) includes the payment of premiums of US$21,692 (R$80,291) on October 25, 2018,related to the repurchase of notes due in 2020 and US$32,252 (R$122,882) on October 29, 2018, related to the repurchase of notes due 2021.
27 Earnings per share
Basic: Earnings (loss) per share is calculated by dividing net income (loss) attributable to common shareholders by the weighted average number of common shares outstandingduring the period, excluding common shares purchased and held as treasury shares (shares in thousands).
2018 2017
Net income attributable to shareholders 25,199 534,202Weighted average common shares outstanding 2,728,747 2,856,858Weighted average - treasury shares (65,639) (28,170)Weighted average - common shares outstanding (basic) 2,663,108 2,828,688
Basic earnings per share - (R$) 0.01 0.19
56

Diluted: Diluted earnings (loss) per share is calculated by dividing net income (loss) of the period attributable to common shareholders by the weighted average number of commonshares outstanding during the period, adjusted for the effects of all potential common shares that are dilutive and adjusted for treasury shares held. From May 2015, the Companyhad only one category of potential common shares that would cause dilution: outstanding options to purchase shares (shares in thousands).
2018 2017Net income attributable to shareholders 25,199 534,202Weighted average common shares outstanding (basic) - R$ 2,663,108 2,828,688
Dilutive effect of outstanding stock options 3,488 16,593
Weighted average - common shares outstanding (diluted) 2,666,596 2,845,281
Diluted earnings per shares - (R$) 0.01 0.19
For the year ended December 31, 2018, 3,975,719 shares (4,672,811 shares in December 31, 2017) related to outstanding stock options have been excluded from the calculationof diluted weighted average common shares.
JBS S.A.Notes to the financial statements for the years ended December 31, 2018 and 2017(Expressed in thousands of Brazilian reais)
28 Operating segments and geographic reporting
The Company’s Management established the operating segments based on the reports that are used to make strategic decisions. Starting from 2018, the Company changed itsmanagement structure, and the information per segment started to be elaborated considering the following segments: Brazil, Seara, Beef USA, Pork USA, Chicken USA and Others.
Brazil: this segment includes all the operating activities from Company and its subsidiaries, mainly represented by slaughter facilities, cold storage and meat processing, fat, feedand production of beef by-products such as leather, collagen and others products produced in Brazil.
Seara: this segment includes all the operating activities of Seara and its subsidiaries, mainly represented by chicken and pork processing, production and commercialization of foodproducts.
Beef USA: this segment includes JBS USA’s operations, including Australia and Canada as well, related to beef processing: slaughter, cold storage, production and others beefby-products, besides cattle fattening services.
Pork USA: this segment includes JBS USA’s pork and lamb operations, including Plumrose and Australia as well, related to slaughter, cold storage, production and commercializationof food products.
Chicken USA: this segment includes PPC’s operations, including Moy Park as well, mainly represented by chicken processing, production and commercialization of food productsin the United States of America, Mexico, United Kingdom and France.
Due to the volume’s substantial percentage of the operating segments above, the others segments and activities in which the Company operates do not have a major share. Thosesegments are included in “Others”. Furthermore, the eliminations between the companies of the group are presented separately.
The accounting policies of the reportable segments are the same as described in these financial statements. The Company evaluates its performance per segment, which accordingto its accounting policies, are disclosed with the breakdown of net revenue, net operating income and depreciation.
There are no revenues arising out of transactions with any single customer that represents 5% or more of the total revenues.
The segment profitability reviewed by the Executive Officers is operating income, which does not include finance income (expense), share of profit or loss of equity accountedinvestees, or income taxes. The Company manages its loans and financing and income taxes at the corporate level and not by segment.
The information by consolidated operational segment are as follows:
Net revenue Operating income (loss) (1) Depreciation2018 2017 2018 2017 2018 2017
SegmentsBrazil 27,578,902 23,559,971 468,420 (756,579) 780,347 795,254Seara 17,670,081 17,473,068 446,901 583,741 983,429 984,962Beef USA 78,644,145 69,188,897 5,631,188 3,470,490 680,683 639,146Pork USA 20,774,675 19,830,115 1,674,771 2,242,895 326,829 290,422Chicken USA 39,881,005 34,333,240 1,753,749 3,494,844 1,985,063 1,701,377Others 2,423,734 3,757,332 (43,143) (91,133) 48,626 60,508Intercompany elimination (5,292,298) (4,972,642) — — — —
Total 181,680,244 163,169,981 9,931,886 8,944,258 4,804,977 4,471,669
December 31, 2018 December 31, 2017Total assetsBrazil 36,835,443 39,070,406Seara 23,044,148 20,056,659Beef USA 18,513,199 17,872,295Pork USA 8,904,564 8,460,523Chicken USA 24,076,655 21,450,141Others 29,007,228 17,409,543Intercompany elimination (26,235,406) (15,623,616)Total 114,145,831 108,695,951
57

Below is net revenue, operating income and depreciation and amortization based on geography, presented for supplemental information.
Geographic reportingNet revenue Operating income (loss) (1) Depreciation
2018 2017 2018 2017 2018 2017
United States of America 136,729,002 117,799,652 9,031,747 9,080,417 3,013,072 2,511,335South America 44,924,393 42,125,771 914,799 (158,348) 1,776,864 1,811,383Others 1,996,999 4,833,264 (14,660) 22,189 15,041 148,951Intercompany elimination (1,970,150) (1,588,706) — — — —
Total 181,680,244 163,169,981 9,931,886 8,944,258 4,804,977 4,471,669
Total assets by geographic area:
December 31, 2018 December 31, 2017Total assetsUnited States of America 73,042,765 60,442,617South America 57,347,022 55,186,321Others 6,843,825 4,184,726Intercompany elimination (23,087,781) (11,117,713)Total 114,145,831 108,695,951
(1) - The operating income is reconciled with the consolidated net income, as follows below:
Operating income (loss)
2018 2017Net income (loss) 210,116 1,025,469Income tax and social contribution - current and deferred (1,308,474) 126,287Finance (income) expense, net 8,282,220 5,595,326Share of profit of equity-accounted investees, net of tax (26,455) (18,630)Operating profit 7,157,407 6,728,452Tax payable in installments 2,475,291 2,228,397Investigation impacts due to the leniency agreement 80,520 34,551Negative goodwill on acquisition of tax credits (54,609) (75,985)Impairment 77,822 —
Profit on divestment program (*) 6,684 (162,761)Other operating expense/income 188,771 191,604Net operating profit 9,931,886 8,944,258
(*) Amount refers to the price adjustment in the sale of the shareholding in Vigor Alimentos, whose value of the sale was subject to variations established in clauses of the purchaseand sale instrument.
JBS S.A.Notes to the financial statements for the years ended December 31, 2018 and 2017(Expressed in thousands of Brazilian reais)
58

29 Expenses by nature
The Company’s policy is to present expenses by function on the consolidated statement of income (loss). Expenses by nature are disclosed below:
Company Consolidated2018 2017 2018 2017
Cost of sales Cost of inventories, raw materials and production inputs (20,660,040) (17,888,964) (132,859,355) (119,436,936) Salaries and benefits (1,303,738) (1,237,348) (18,436,408) (16,182,951) Depreciation and amortization (460,247) (489,697) (4,044,291) (3,777,862)
(22,424,025) (19,616,009) (155,340,054) (139,397,749)
General and administrative expenses Tax payable in installments (PRR and PERT) (71,695) 53,200 (156,465) 34,680 Salaries and benefits (1,304,251) (1,267,454) (3,676,528) (3,417,286) Fees, services held and general expenses (826,374) (948,203) (1,881,001) (1,926,899) Depreciation and amortization (233,093) (181,554) (589,482) (498,667) Provisions (2,421,631) (2,228,397) (2,475,290) (2,228,397) Impairment (126,115) (135,192) 191,211 (179,683)
(4,983,159) (4,707,600) (8,587,555) (8,216,252)
Selling expenses Freights and selling expenses (1,445,107) (1,299,832) (8,852,041) (7,306,098) Allowance for doubtful accounts (211,680) (88,210) (239,779) (90,359) Salaries and benefits (170,527) (173,689) (552,170) (595,468) Depreciation and amortization (80,164) (104,955) (171,203) (195,140) Advertising and marketing (72,841) (196,066) (408,863) (492,321) Commissions (70,031) (69,430) (197,939) (182,610)
(2,050,350) (1,932,182) (10,421,995) (8,861,996)
As of December 31, 2018, other income (expenses) includes goodwill on the acquisition of tax credits, sale of assets and gain (losses) from the divestment program carried out bythe Company during the years 2017 and 2018, in the Company, and Consolidated, sale of assets and gain (losses) from the disinvestment program, third party advisory expensesrelated to restructuring projects, impairment expenses and losses related to natural disasters that stroke plants in the United States and Puerto Rico, among others.
JBS S.A.Notes to the financial statements for the years ended December 31, 2018 and 2017(Expressed in thousands of Brazilian reais)
30 Insurance coverage
As of December 31, 2018, JBS S.A. and Seara Alimentos, had as maximum individual limit for coverage was R$150,000 (R$150,000 at December 31, 2017). This coverage includesall types of casualties.
At December 31, 2018, the subsidiary JBS USA has a insurance policy with the same above-mentioned characteristics; however, the maximum indemnification limit was ofR$1.9 billion (US$500,000) and R$1.6 billion (US$500,000) at December 31, 2017.
The assumptions of risk taken, by their nature, are not part of the scope of an audit, therefore, were not audited by independent auditors.
59

31 Risk management and financial instruments
The Company uses the measurement principles described in note 3 at each statement of financial position date in accordance with the guidelines established under IFRS for eachclassification type of financial assets and liabilities. The Company has not designated any of its derivatives as hedges.
Financial instruments:
Financial instruments are recognized in the consolidated financial statements as follows:
Company Consolidated
Notes December 31, 2018 December 31, 2017 December 31, 2018 December 31, 2017AssetsFair value through profit or lossFinancial investments 5 358,097 355,678 4,887,099 5,148,096National treasury bills 5 49,758 708,406 49,758 708,406Derivative assets 31 6,303 — 52,797 30,760Loans and receivables at amortized costCash at banks 5 1,356,338 1,074,718 3,998,922 5,884,806Trade accounts receivable 6 2,729,066 2,302,913 9,657,010 9,333,291Related parties receivables 10 828,802 5,059,258 701,281 897,535Total 5,328,364 9,500,973 19,346,867 22,002,894LiabilitiesLiabilities at amortized costLoans and financing 16 (15,542,268) (20,057,355) (56,153,528) (57,024,651)Trade accounts payable 15 (2,333,255) (2,029,104) (13,075,615) (9,992,778)Related party payables 10 (8,033,436) (3,018,787) — —
Other financial liabilities 21 (42,244) (32,486) (69,213) (113,024)Fair value through profit or lossDerivative liabilities 31 (23,602) (10) (210,015) (118,684)Total (25,974,805) (25,137,742) (69,508,371) (67,249,137)
Fair value through profit or loss: (i) CDBs are updated at the effective rate, but are very short-term and negotiated with financial institutions, and their recognition is similar to fairvalue; (ii) national treasury bill are recognized according to market value.
Amortized cost: (i) with the adoption of IFRS 9 / CPC 48, loans and receivables are classified as amortized cost, but without any change in their nature or business model; (ii) theaccounts receivable are short-term and net from expected losses.
a. Fair value of assets and liabilities through profit or loss:
The Company and its subsidiaries determine fair value measurements in accordance with the hierarchical levels that reflect the significance of the inputs used in the measurement,with the exception of those maturing at short term, equity instruments without an active market and contracts with discretionary characteristics that the fair value can not be measuredreliably, according to the following levels:
Level 1 - Quoted prices in active markets (unadjusted) for identical assets or liabilities;Level 2 - Inputs other than Level 1, in which prices are quoted for similar assets and liabilities, either directly by obtaining prices in active markets or indirectly through valuationtechniques that use data from active markets;Level 3 - Inputs used for fair value calculations which are not derived from an active market. The Company and its subsidiaries do not have any financial instruments that utilizelevel 3 inputs.
CompanyCurrent assets Current liabilities
National treasury bill Financial investments Derivative assets Derivatives liabilitiesDecember31, 2018
December 31,2017
December 31,2018
December31, 2017
December 31,2018
December31, 2017
December 31,2018
December 31,2017
Level 1 49,758 708,406 — — — — — —
Level 2 — — 358,097 355,678 6,303 — (23,602) (10)
ConsolidatedCurrent assets Current liabilities
National treasury bill Financial investments Derivative assets Derivatives liabilitiesDecember 31,
2018December 31,
2017December 31,
2018December 31,
2017December 31,
2018December 31,
2017December 31,
2018December 31,
2017
Level 1 49,758 708,406 — — — — — —
Level 2 — — 4,887,099 5,148,096 52,797 30,760 (210,015) (118,684)
Book value of financial instruments are similar to fair value, considering the criteria defined for levels 1 and 2 in the fair value hierarchy.
JBS S.A.Notes to the financial statements for the years ended December 31, 2018 and 2017(Expressed in thousands of Brazilian reais)
60

b. Fair value of assets and liabilities classified as amortized cost:
Assets and liabilities classified as amortized cost fall within level 2 in the fair value hierarchy. The exception is the Senior Notes that have observable prices in active markets andare therefore considered in the hierarchy of fair value measurement as Level 1.
c. Fair value of assets and liabilities carried at amortized cost:
The fair value of the Notes under Rule 144-A and Regulation S, are estimated using the closing sale price of these securities informed by a financial newswire on December 31,2018, considering there is an active market for these financial instruments. The book value of the remaining fixed-rate loans approximates fair value since the interest rate market,the Company’s credit quality, and other market factors have not significantly changed since entering into the loans. The book value of variable-rate loans and financings approximatesfair value given the interest rates adjust for changes in market conditions and the quality of the Company’s credit rating has not substantially changed. For all other financial assetsand liabilities, book value approximates fair value due to the short duration of the instruments. The following details the estimated fair value of loans and financings:
Company Consolidated
Description
December 31, 2018 December 31, 2017 December 31, 2018 December 31, 2017
Principal
Price (%of the
Principal)
MarketValue of the
Principal Principal
Price (%of the
Principal)
MarketValue of the
Principal Principal
Price (%of the
Principal)
MarketValue of the
Principal Principal
Price (%of the
Principal)
MarketValue of the
Principal
JBS S.A. Notes 2020 — — — 3,308,000 102.37 3,386,400 — — — 3,308,000 102.37 3,386,400
JBS S.A. Notes 2023 3,002,970 99.59 2,990,658 2,563,700 95.43 2,446,539 3,002,970 99.59 2,990,658 2,563,700 95.43 2,446,539
JBS S.A. Notes 2024 2,906,100 101.49 2,949,401 2,481,000 99.02 2,456,686 2,906,100 101.49 2,949,401 2,481,000 99.02 2,456,686
JBS S.A. Notes 2026 — — — — — — 1,937,412 98.69 1,912,110 — — —
JBS Lux Notes 2020 — — — — — — — — — 2,315,600 102.30 2,368,859
JBS Lux Notes 2021 — — — — — — 2,564,994 101.00 2,590,644 3,804,200 102.50 3,899,305
JBS Lux Notes 2024 — — — — — — 2,906,100 99.99 2,905,810 2,481,000 99.75 2,474,798
JBS Lux Notes 2025 — — — — — — 3,487,320 96.75 3,373,983 2,977,200 97.00 2,887,884
JBS Lux Notes 2028 — — — — — — 3,487,320 97.00 3,382,701 — — —
PPC Notes 2025 — — — — — — 3,874,801 93.73 3,631,851 2,481,000 103.25 2,561,633
PPC Notes 2027 — — — — — — 3,293,580 90.38 2,976,573 1,984,800 103.18 2,047,917
Moy Park — — — — — — — — — 1,334,593 103.04 1,375,165
5,909,070 5,940,059 8,352,700 8,289,625 27,460,597 26,713,731 25,731,093 25,905,186
d. Finance income (expense) by category of financial instrument:
Company Consolidated2018 2017 2018 2017
Fair value through profit or loss 154,085 344,360 206,188 (542,948)Amortized cost (4,510,587) (2,676,124) (8,488,408) (5,052,378)Total (4,356,502) (2,331,764) (8,282,220) (5,595,326)
Risk management:
The Company and its subsidiaries during the regular course of its operations is exposed to market, credit and liquidity risks. These exposures are managed by the Risk ManagementDepartment, following the Financial and Commodities Risk Management Policy defined by the Risk Management Committee and approved by the Board of Directors. The RiskManagement Department is responsible for identifying all the risk factors that may cause adverse financial results for the Company and proposing strategies to mitigate those risks.Their proposals are submitted to the Risk Management Committee for submission to the Board of Directors, who supervises the implementation of new solutions, noting limitationsof scope and guidelines of the Financial and Commodities Risk Management Policy.
Below are the risks and operations to which the Company is exposed and a sensitivity analysis for each type of risk, consisting in the presentation of the effects in the financeincome (expense), net, when subjected to possible changes, of 25% to 50%, in the relevant variables for each risk. For each probable scenario, the Company utilizes the Value atRisk Methodology (VaR),for the confidence interval (C.I.) of 99% and a horizon of one day.
a. Market Risk:
The exposure to market risk is continuously monitored, especially the risks related to foreign exchange, interest rates and commodity prices, which directly affect the value of financialassets and liabilities, future cash flows and net investments in foreign subsidiaries In these cases, Company and its subsidiaries may use financial hedge instruments, includingderivatives, with the approval by the Board of Directors.
It is the responsability of the Risk Management Department to ensure that other areas are within the risk exposure limits set by Management to protect against volatility in price,centralize the exposures and apply the Financial and Commodities Risk Management policy.
The Risk Management Department uses proprietary and third party information systems specially developed to control and manage market risk, applying stress scenario and Valueat Risk analysis (VaR) to measure Company's net exposure as well as the cash flow risk with the BM&FBovespa and the Chicago Mercantile Exchange.
a1. Interest rate risk
Interest rate risk is related to potentially adverse results that Company and its subsidiaries may realize from changes in interest rates, which may be caused by economic crisis,changes in sovereign monetary policy, or market movements. The Company primarily has assets and mainly liabilities exposed to variable interest rates like the CDI (Certificadode Depósito Interbancário - Interbank Deposit Certificate), TJLP (Taxa de Juros de Longo Prazo - Long Term Interest Rate), UMBNDES (Unidade Monetária do BNDES - BNDESMonetary Unit), LIBOR (London Interbank Offer Rate) and EURIBOR (Euro Interbank Offer Rate), among others. The Company's Financial and Commodities Risk ManagementPolicy does not define the proportion between float and fixed exposures, but the Risk Management Department monitors market conditions and may propose to the Risk ManagementCommittee strategies to rebalance the exposure.
JBS S.A.Notes to the financial statements for the years ended December 31, 2018 and 2017(Expressed in thousands of Brazilian reais)
61

For informational purposes and in accordance with our Financial and Commodities Risk Management Policy, the notional amounts of assets and liabilities exposed to floating interestrates are presented below:
Company ConsolidatedDecember 31, 2018 December 31, 2017 December 31, 2018 December 31, 2017
Liabilities and assets exposure to the CDI rate net:NCE/ Others (970,879) (1,230,770) (1,840,156) (2,132,038)Working Capital - Reais (113,497) (114,737) (113,497) (114,737)Related parties (2,488,723) 4,609,671 — —
CDB-DI 358,097 355,678 667,979 1,268,286National treasury bill 49,758 708,406 49,758 708,406Total (3,165,244) 4,328,248 (1,235,916) (270,083)Liabilities exposure to TJLP rate:FINAME (67,587) (118,308) (68,105) (149,039)Working Capital - Reais (15,635) (15,635) (26,771) (29,461)Total (83,222) (133,943) (94,876) (178,500)Liabilities exposure to the EURIBOR rate:Working Capital - Euro (68,497) (77,005) (129,631) (178,357)FINIMP — (600) (2,153) (6,376)NCI/ Others — — — (7,804)Others — — (42,501) (6,004)Total (68,497) (77,605) (174,285) (198,541)Liabilities exposure to the LIBOR rate:Working Capital - US dollars — — (177,446) (124,067)Pre-payment (5,333,459) (6,183,791) (6,969,647) (8,133,841)NCI/Others — — (117,700) (278,298)FINIMP — — (3,287) (13,964)ACC - Advances on exchange contracts — — (1,087) (198)Senior Secured Credit Facility JBS Lux — — (415) —
Term loan JBS Lux 2022 — — (12,591,156) —
PPC term loan — — (1,909,974) —
Moy Park revolving credit facility — — (163) —
Others — — — (31,724)Total (5,333,459) (6,183,791) (21,770,875) (8,582,092)
Management believes that exposure to interest rate fluctuations does not have a relevant effect on the Company's results and does not use derivative financial instruments tomanage this risk, except the specific situations that may arise.
Sensitivity analysis:
Scenario (I) VaR 99% I.C. 1 day Scenario (II) Interest rate variation - 25% Scenario (III) Interest rate variation - 50%
Contracts exposure RiskCurrentscenario Rate
Effect on income
Rate
Effect on income
Rate
Effect on income
Company Consolidated Company Consolidated Company Consolidated
CDI Increase 6.4000% 6.4340% (1,076) (420) 8.0000% (50,644) (19,775) 9.6000% (101,288) (39,549)
TJLP Increase 6.9800% 6.9812% (1) (1) 8.7250% (1,452) (1,656) 10.4700% (2,904) (3,311)
Euribor Increase (0.1190)% (0.1190)% — — (0.0893)% (20) (52) (0.0595)% (41) (104)
Libor Increase 3.0131% 3.0138% (37) (152) 3.7664% (40,177) (164,000) 4.5197% (80,354) (328,000)
(1,114) (573) (92,293) (185,483) (184,587) (370,964)
The Company is exposed to rates such as UMBNDES, GBPLibor, US Prime and BBSY that are not significant since their impact on net income (loss) in a scenario with a interestrate variation of 50% is less than R$10,000.
a2. Exchange rate risk:
Exchange rate risk relates to potentially adverse results that the Company may face from fluctuations in foreign currency exchange rates from economic crisis, sovereign monetarypolicy alterations, or market movements. The Company has assets and liabilities exposed to foreign exchange rates, however the Company’s Financial and Commodities RiskManagement Policy states these exposures should not always be netted, since other issues should be considered such as maturities mismatches and market volatility.
The Risk Management Department enters into transaction with derivative instruments previously approved by the Board of Directors to protect financial assets and liabilities andfuture cash flow from commercial activities and net investments in foreign operations. The Board of Directors has approved the use of future contracts, NDFs (non deliverableforwards), DFs (Deliverable forwards), and swaps that may be applied to hedge loans, investments, cash flows from interest payments, export estimate, acquisition of raw material,and other transactions, whenever they are quoted in currencies different than the Company's functional currency. The primary exposures to exchange rate risk are in US Dollars(US$), Canadian Dollars (C$), Euro (€), British Pound (£) and Mexican Pesos (MXN). In the consolidated, the Company disclosures as a combined way its exposure in relation oneach indexer based on the functional currency of the country, highlighting the operations of JBS USA's subsidiaries indexed to the US Dollars (US$), in Australia, which the functionalcurrency is Australian Dollar (AUD).
The carrying amounts of assets and liabilities and other positions exposed to foreign currency risk at December 31, 2018 and 2017 are presented below along with the notionalamounts of derivative contracts intended to offset the exposure, in accordance with the Company’s Financial and Commodities Risk Management Policy. The exposure is in relationto the Brazilian Reais.
JBS S.A.Notes to the financial statements for the years ended December 31, 2018 and 2017(Expressed in thousands of Brazilian reais)
62

Company
USD CAD EUR GBPDecember31, 2018
December31, 2017
December31, 2018
December31, 2017
December31, 2018
December31, 2017
December31, 2018
December31, 2017
OPERATING Cash and cash equivalents 1,271,960 1,032,719 6,065 — 33,566 12,388 82 161Trade accounts receivable 1,392,982 1,545,762 10,614 5,496 707,458 105,726 19,782 56,933Sales orders 2,083,760 1,179,665 48,218 20,568 510,098 219,001 130,914 117,525Trade accounts payable (34,866) (37,854) — — (22,867) (23,919) — —
Subtotal 4,713,836 3,720,292 64,897 26,064 1,228,255 313,196 150,778 174,619FINANCIALRelated parties transaction (net) (4,726,140) (2,572,041) — — 10,229 2,275 — —
Net debt in foreign subsidiaries (28,351,602) (24,170,798) — — — — — —
Loans and financing (14,068,530) (18,355,634) — — (68,497) (77,605) — —
Subtotal (47,146,272) (45,098,473) — — (58,268) (75,330) — —
Total exposure (42,432,436) (41,378,181) 64,897 26,064 1,169,987 237,866 150,778 174,619DERIVATIVESFuture contracts 233,844 — — — — — — —
Non Deliverable Forwards (NDF´s) 5,405,346 — — — — — — —
Total derivatives 5,639,190 — — — — — — —
NET EXPOSURE IN R$ (36,793,246) (41,378,181) 64,897 26,064 1,169,987 237,866 150,778 174,619
Consolidated
USD CAD EUR GBP MXN
December31, 2018
December31, 2017
December31, 2018
December31, 2017
December31, 2018
December31, 2017
December31, 2018
December31, 2017
December31, 2018
December31, 2017
OPERATING
Cash and cash equivalents 2,075,129 1,614,777 8,704 — 68,825 38,285 1,345 462 350,557 168,119
Trade accounts receivable 2,505,561 3,072,269 10,614 5,496 902,741 227,215 37,269 82,550 353,386 272,930
Sales orders 3,184,075 2,867,967 48,218 20,568 518,778 432,811 130,914 117,525 — —
Trade accounts payable (112,520) (77,508) — — (81,770) (65,308) (8,827) (33,398) (552,039) (240,885)
Purchase orders (77,648) (67,668) — — (34,891) (16,056) — — — —
Subtotal 7,574,597 7,409,837 67,536 26,064 1,373,683 616,947 160,701 167,139 151,904 200,164
FINANCIAL
Related parties transaction (net) (13,998,511) (4,786,741) 186,238 — 10,229 2,275 (1,259) — — —
Loans and financing (46,691,785) (46,402,002) — — (70,650) (83,444) — — — (254,233)
Subtotal (60,690,296) (51,188,743) 186,238 — (60,421) (81,169) (1,259) — — (254,233)
Total exposure (53,115,699) (43,778,906) 253,774 26,064 1,313,262 535,778 159,442 167,139 151,904 (54,069)
DERIVATIVES
Future contracts 427,584 — — — — — — — — —
Deliverable Forwards (DF´s) 382,784 (18,237) 14,329 6,864 111,009 (107,603) (43,611) (48,006) (677,765) —
Non Deliverable Forwards (NDF´s) 5,783,480 2,577 — — (39,608) (26,811) (113,249) (101,873) — —
Total derivatives 6,593,848 (15,660) 14,329 6,864 71,401 (134,414) (156,860) (149,879) (677,765) —
NET EXPOSURE IN R$ (46,521,851) (43,794,566) 268,103 32,928 1,384,663 401,364 2,582 17,260 (525,861) (54,069)
a2.1 Sensitivity analysis and derivative financial instruments breakdown:
a2.1.1 US Dollar (amounts in thousands of R$):
Scenario (i) VaR 99% I.C. 1 day Scenario (ii) Interest rate variation - 25% Scenario (iii) Interest rate variation - 50%
Exposure of R$ Risk
Currentexchange
rateExchange
rate
Effect on incomeExchange
rate
Effect on incomeExchange
rate
Effect on income
Company Consolidated Company Consolidated Company Consolidated
Operating Appreciation 3.8748 3.9659 110,778 178,007 4.8435 1,178,459 1,893,649 5.8122 2,356,918 3,787,299
Financial Depreciation 3.8748 3.9659 (441,685) (1,426,256) 4.8435 (4,698,668) (15,172,574) 5.8122 (9,397,335) (30,345,148)
Derivatives Appreciation 3.8748 3.9659 132,524 154,959 4.8435 1,409,798 1,648,462 5.8122 2,819,595 3,296,924
(198,383) (1,093,290) (2,110,411) (11,630,463) (4,220,822) (23,260,925)
Scenario (i) VaR 99% I.C. 1 day Scenario (ii) Interest rate variation - 25% Scenario (iii) Interest rate variation - 50%
Exposure of R$ Risk
Currentexchange
rateExchange
rate
Effect on equityExchange
rate
Effect on equityExchange
rate
Effect on equity
Company Consolidated Company Consolidated Company Consolidated
Net debt in foreignsubsidiaries Depreciation 3.8748 3.9659 (666,279) — 4.8435 (7,087,900) — 5.8122 (14,175,801) —
(666,279) — (7,087,900) — (14,175,801) —
JBS S.A.Notes to the financial statements for the years ended December 31, 2018 and 2017(Expressed in thousands of Brazilian reais)
63

The Company includes the net debt of foreign subsidiaries in the disclosure of economic hedging exposure. Although these debts do not generate foreign exchange gains or lossessince the debt is denominated in the functional currency of each country, these debt instruments are translated to Brazilian Reais upon consolidation and are therefore affected byExchange rate variation, which impacts the Company’s consolidated leverage ratios.
December 31, 2018Company Consolidated
Instrument Risk factor Nature Quantity Notional Fair value Quantity Notional Fair value
Future Contracts B3 American dollar + DDI Long 1,207 233,844 (303) 2,207 427,584 (1,092)
CompanyDecember 31, 2018 December 31, 2017
Instrument Risk factor NatureNotional
(USD)Notional
(R$) Fair valueNotional
(USD)Notional
(R$) Fair value
Non Deliverable Forwards American dollar Long 1,395,000 5,405,346 (16,886) — — —
ConsolidatedDecember 31, 2018 December 31, 2017
Instrument Risk factor NatureNotional
(USD)Notional
(R$) Fair valueNotional
(USD)Notional
(R$) Fair value
Deliverable Forwards American dollar Long 98,788 382,784 9,772 (5,513) (18,237) (2,316) Non Deliverable Forwards American dollar Long 1,492,588 5,783,480 (16,397) 779 2,577 (20)
a2.1.2 C$ - Canadian Dollar (amounts in thousands of R$):
Scenario (i) VaR 99% I.C. 1 day Scenario (ii) Interest rate variation - 25% Scenario (iii) Interest rate variation - 50%
Exposure of R$ Risk
Currentexchange
rateExchange
rate
Effect on incomeExchange
rate
Effect on incomeExchange
rate
Effect on income
Company Consolidated Company Consolidated Company Consolidated
Operating Appreciation 2.8451 2.7702 (1,708) (1,777) 2.1338 (16,224) (16,884) 1.4226 (32,449) (33,768)
Financial Appreciation 2.8451 2.7702 — (4,902) 2.1338 — (46,559) 1.4226 — (93,119)
Derivatives Appreciation 2.8451 2.7702 — (377) 2.1338 — (3,582) 1.4226 — (7,165)
(1,708) (7,056) (16,224) (67,025) (32,449) (134,052)
ConsolidatedDecember 31, 2018 December 31, 2017
Instrument Risk factor NatureNotional
(CAD)Notional
(R$) Fair valueNotional
(CAD)Notional
(R$) Fair value
Deliverable Forwards Canadian dollar Long 5,036 14,329 1,182 2,606 6,864 (409)
a2.1.3 € - EURO (amounts in thousands of R$):
Scenario (i) VaR 99% I.C. 1 day Scenario (ii) Interest rate variation - 25% Scenario (iii) Interest rate variation - 50%
Exposure of R$ RiskCurrent
exchangeExchange
rate
Effect on incomeExchange
rate
Effect on incomeExchange
rate
Effect on income
Company Consolidated Company Consolidated Company Consolidated
Operating Appreciation 4.4390 4.3208 (32,719) (36,593) 3.3293 (307,064) (343,421) 2.2195 (614,127) (686,842)
Financial Depreciation 4.4390 4.3208 1,552 1,610 3.3293 14,567 15,105 2.2195 29,134 30,210
Derivatives Appreciation 4.4390 4.3208 — (1,902) 3.3293 — (17,850) 2.2195 — (35,700)
(31,167) (36,885) (292,497) (346,166) (584,993) (692,332)
ConsolidatedDecember 31, 2018 December 31, 2017
Instrument Risk factor Nature Notional(EUR)
Notional(R$) Fair value Notional
(EUR)Notional
(R$) Fair value
Deliverable Forwards Euro Long 25,008 111,009 2,829 (27,109) (107,603) 275Non Deliverable Forwards Euro Short (8,923) (39,608) 1,418 (6,755) (26,811) (40)
JBS S.A.Notes to the financial statements for the years ended December 31, 2018 and 2017(Expressed in thousands of Brazilian reais)
64

a2.1.4 £ - British Pound (amounts in thousands of R$):
Scenario (i) VaR 99% I.C. 1 day Scenario (ii) Interest rate variation - 25% Scenario (iii) Interest rate variation - 50%
Exposure of R$ Risk
Currentexchange
rateExchange
rate
Effect on incomeExchange
rate
Effect on incomeExchange
rate
Effect on income
Company Consolidated Company Consolidated Company Consolidated
Operating Appreciation 4.9617 4.8252 (4,150) (4,423) 3.7213 (37,694) (40,175) 2.4809 (75,389) (80,351)
Financial Depreciation 4.9617 4.8252 — 35 3.7213 — 315 2.4809 — 630
Derivatives Depreciation 4.9617 4.8252 — 4,317 3.7213 — 39,215 2.4809 — 78,430
(4,150) (71) (37,694) (645) (75,389) (1,291)
ConsolidatedDecember 31, 2018 December 31, 2017
Instrument Risk factor NatureNotional
(GBP)Notional
(R$) Fair valueNotional
(GBP)Notional
(R$) Fair value
Deliverable Forwards British pound Short (8,790) (43,611) (612) (10,736) (48,006) 569Non Deliverable Forwards British pound Short (22,825) (113,249) 2,352 (22,783) (101,873) (486)
a2.1.5 MXN - Mexican Peso (amounts in thousands of R$):
Scenario (i) VaR 99% I.C. 1 day Scenario (ii) Interest rate variation - 25% Scenario (iii) Interest rate variation - 50%
Exposure of R$ Risk
Currentexchange
rateExchange
rate
Effect on incomeExchange
rate
Effect on incomeExchange
rate
Effect on income
Company Consolidated Company Consolidated Company Consolidated
Operating Appreciation 0.1972 0.2018 — 3,505 0.2465 — 37,976 0.2958 — 75,952
Derivatives Depreciation 0.1972 0.2018 — (15,638) 0.2465 — (169,441) 0.2958 — (338,882)— (12,133) — (131,465) — (262,930)
ConsolidatedDecember 31, 2018 December 31, 2017
Instrument Risk factor NatureNotional
(MXN)Notional
(R$) Fair valueNotional
(MXN)Notional
(R$) Fair value
Deliverable Forwards Mexican peso Short (3,436,940) (677,765) (24,314) — — —
b. Commodity price risk
The Company operates globally across (the entire livestock protein chain and related business ) and during the regular course of its operations brings is exposed to price fluctuationsin feeder cattle, live cattle, lean hogs, corn, soybeans, and energy, especially in the American, Australian and Brazilian markets. Commodity markets are characterized by volatilityarising from external factors including climate, supply levels, transportation costs, agricultural policies and storage costs, among others. The Risk Management Department isresponsible for mapping the exposures to commodity prices of the Company and its subsidiaries and proposing strategies to the Risk Management Committee, in order to mitigatesuch exposures.
Biological assets are a very important raw material used by the Company. In order to maintain future supply of these materials, the Company participates in forward contracts toanticipate purchases with suppliers. To complement these forward purchases, the Company use derivative instruments to mitigate each specific exposure, most notably futurescontracts, to mitigate the impact of price fluctuations - on inventories and sales contracts. The Company takes the historical average amount spent on materials as an indication ofthe operational value to be protected by firm contracts.
b1. Position balance in commodities (cattle) contracts
Given the nature of its operations, the Company is exposed to volatility in cattle prices, where price fluctuations arise from factors beyond the Company's control, such asclimate, cattle supply, transportation costs and agricultural policies among others. Forward purchases of cattle can be negotiated at floating (prices marked at the delivery daycurrent price) or fixed prices. The Company may use future contracts traded at the BM&FBovespa to balance these exposures.
The factors that influence the commodity price risk reduction strategy are the timing of term contracts for cattle purchases considering any negotiated values and terms.
The Company’s exposure to cattle price fluctuation as of December 31, 2018 and 2017 are presented below in accordance with the Company’s Financial and Commodities RiskManagement Policy and are representative of the exposure at each period end.
EXPOSURE in Commodities (Cattle) December 31, 2018 December 31, 2017Firm Contracts of cattle purchase 134,684 26,306Subtotal 134,684 26,306DERIVATIVESFuture contracts (5,305) (23,666)Subtotal (5,305) (23,666)NET EXPOSURE 129,379 2,640
JBS S.A.Notes to the financial statements for the years ended December 31, 2018 and 2017(Expressed in thousands of Brazilian reais)
65

Sensitivity analysis:
Scenario (i) VaR 99% I.C. 1 day Scenario (ii) @ Variation - 25% Scenario (ii) @ Variation - 50%
Exposure RiskCurrent
price Price
Effect onincome
Price
Effect onincome
Price
Effect on income
Company Company Company
Operational Cattle arroba depreciation 153.40 150.45 (2,589) 115.05 (33,671) 76.70 (67,342)
Derivatives of cattle Cattle arroba appreciation 153.40 150.45 102 115.05 1,326 76.70 2,652
(2,487) (32,345) (64,690)
Derivatives financial instruments breakdown:
CompanyDecember 31, 2018 December 31, 2017
Instrument Risk factor Nature Quantity Notional Fair value Quantity Notional Fair value
Future Contracts B3 Commodities Short 119 (5,305) (110) 480 (23,666) (10)
b2. Position balance in commodities (grain) derivatives financial instruments of Seara Alimentos:
Seara Alimentos is exposed to price volatility of grain, which changes based on factors beyond the management's control, such as climate, the supply volume, transportation costs,agricultural policies and others.
Seara Alimentos, in accordance with its policy of inventory management, started the strategy of managing the risk of grain's price by actively monitoring the Company´s grainsneeds, including expectations of future consumption, anticipated purchases, combined with future market operations, by hedging with grain futures on BM&F, CME and Over theCounter (OTC), through Non Deliverable Forwards (NDFs), in order reduce price volatility.
The internal controls used for coverage and risk management are made through spreadsheets and monitoring of operations performed and calculation of VAR for 1 day, with aconfidence interval of 99%.
Management's estimate at the exposure risk to grain's price changes at Seara Alimentos at December 31, 2018 and December 31, 2017 are presented below in accordance withthe Financial and Commodities Risk Management Policy and are representative of the exposure incurred during the period.
Seara AlimentosEXPOSURE in Commodities (Grain) December 31, 2018 December 31, 2017OPERATINGPurchase orders 24,378 61,239Subtotal 24,378 61,239DERIVATIVESFuture contracts (243,135) (3,978)Subtotal (243,135) (3,978)NET EXPOSURE (218,757) 57,261
Sensitivity analysis:
Scenario (i) VaR 99% I.C. 1 day Scenario (ii) Price variation - 25% Scenario (ii) Price variation - 50%
Exposure Risk Price
Effect onincome
Price
Effect onincome
Price
Effect onincome
SearaAlimentos
SearaAlimentos
SearaAlimentos
Operational Depreciation 2.50% 609 25.00% 6,095 50.00% 12,189
Derivatives Appreciation 2.50% (6,076) 25.00% (60,784) 50.00% (121,568)
(5,467) (54,689) (109,379)
Derivatives financial instruments breakdown:
ConsolidatedDecember 31, 2018 December 31, 2017
Instrument Risk factor Nature Quantity Notional Fair value Quantity Notional Fair value
Future Contracts B3 Commodities Short 2,585 (243,135) (281) 1,597 (3,978) (631)
b3. Position balance in commodities derivatives financial instruments of JBS USA:
Management believes that quantitative figures regarding the risk exposure of the commodities price changes of the subsidiary JBS USA at December 31, 2018 and December 31,2017 are accurately presented below in accordance with the Financial and Commodities Risk Management Policy and are representative of exposure incurred during the period.
JBS S.A.Notes to the financial statements for the years ended December 31, 2018 and 2017(Expressed in thousands of Brazilian reais)
66
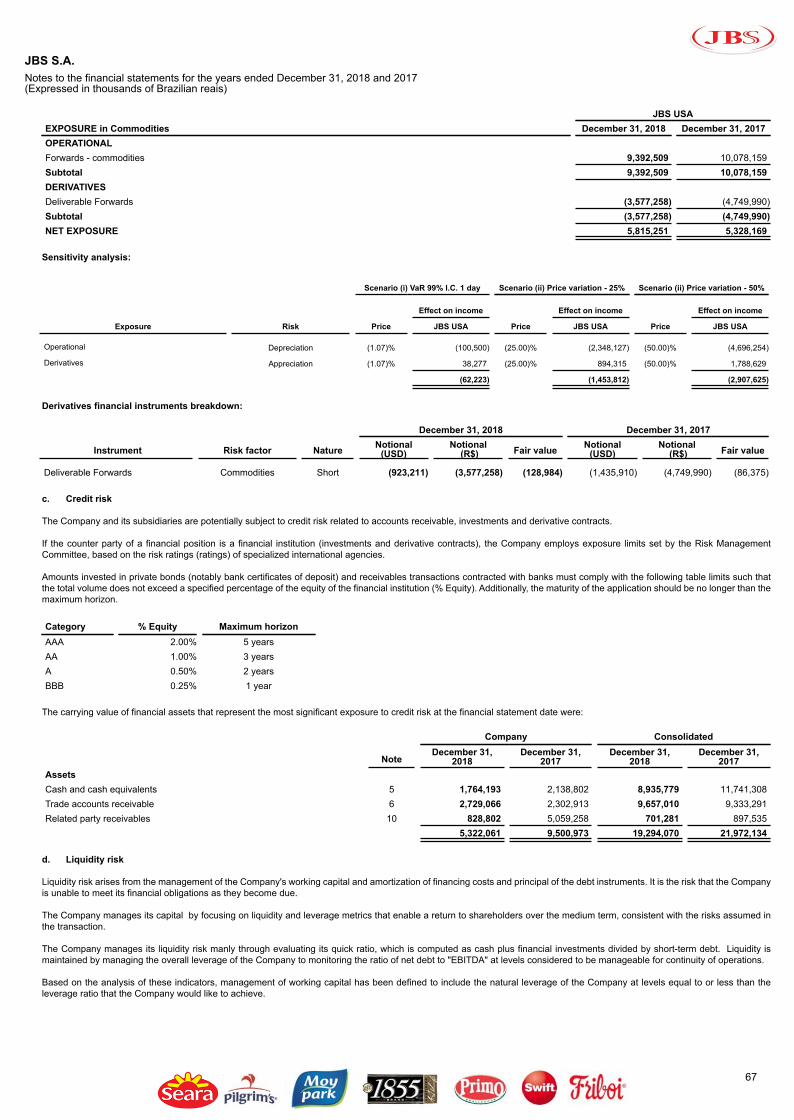
JBS USAEXPOSURE in Commodities December 31, 2018 December 31, 2017OPERATIONALForwards - commodities 9,392,509 10,078,159Subtotal 9,392,509 10,078,159DERIVATIVESDeliverable Forwards (3,577,258) (4,749,990)Subtotal (3,577,258) (4,749,990)NET EXPOSURE 5,815,251 5,328,169
Sensitivity analysis:
Scenario (i) VaR 99% I.C. 1 day Scenario (ii) Price variation - 25% Scenario (ii) Price variation - 50%
Exposure Risk Price
Effect on income
Price
Effect on income
Price
Effect on income
JBS USA JBS USA JBS USA
Operational Depreciation (1.07)% (100,500) (25.00)% (2,348,127) (50.00)% (4,696,254)
Derivatives Appreciation (1.07)% 38,277 (25.00)% 894,315 (50.00)% 1,788,629
(62,223) (1,453,812) (2,907,625)
Derivatives financial instruments breakdown:
December 31, 2018 December 31, 2017
Instrument Risk factor Nature Notional(USD)
Notional (R$) Fair value Notional
(USD)Notional
(R$) Fair value
Deliverable Forwards Commodities Short (923,211) (3,577,258) (128,984) (1,435,910) (4,749,990) (86,375)
c. Credit risk
The Company and its subsidiaries are potentially subject to credit risk related to accounts receivable, investments and derivative contracts.
If the counter party of a financial position is a financial institution (investments and derivative contracts), the Company employs exposure limits set by the Risk ManagementCommittee, based on the risk ratings (ratings) of specialized international agencies.
Amounts invested in private bonds (notably bank certificates of deposit) and receivables transactions contracted with banks must comply with the following table limits such thatthe total volume does not exceed a specified percentage of the equity of the financial institution (% Equity). Additionally, the maturity of the application should be no longer than themaximum horizon.
Category % Equity Maximum horizonAAA 2.00% 5 yearsAA 1.00% 3 yearsA 0.50% 2 yearsBBB 0.25% 1 year
The carrying value of financial assets that represent the most significant exposure to credit risk at the financial statement date were:
Company Consolidated
NoteDecember 31,
2018December 31,
2017December 31,
2018December 31,
2017AssetsCash and cash equivalents 5 1,764,193 2,138,802 8,935,779 11,741,308Trade accounts receivable 6 2,729,066 2,302,913 9,657,010 9,333,291Related party receivables 10 828,802 5,059,258 701,281 897,535
5,322,061 9,500,973 19,294,070 21,972,134
d. Liquidity risk
Liquidity risk arises from the management of the Company's working capital and amortization of financing costs and principal of the debt instruments. It is the risk that the Companyis unable to meet its financial obligations as they become due.
The Company manages its capital by focusing on liquidity and leverage metrics that enable a return to shareholders over the medium term, consistent with the risks assumed inthe transaction.
The Company manages its liquidity risk manly through evaluating its quick ratio, which is computed as cash plus financial investments divided by short-term debt. Liquidity ismaintained by managing the overall leverage of the Company to monitoring the ratio of net debt to "EBITDA" at levels considered to be manageable for continuity of operations.
Based on the analysis of these indicators, management of working capital has been defined to include the natural leverage of the Company at levels equal to or less than theleverage ratio that the Company would like to achieve.
JBS S.A.Notes to the financial statements for the years ended December 31, 2018 and 2017(Expressed in thousands of Brazilian reais)
67

The index of liquidity and leverage at the consolidated are shown below:
ConsolidatedDecember 31, 2018 December 31, 2017
Cash and cash equivalents 8,935,779 11,741,308Loans and financings - Current (2,922,635) (13,526,051)Quick ratio 3.06 0.87Leverage indicator (R$) 3,18 x 3,37 xLeverage indicator (USD) 3,01 x 3.26
The table below shows the contractual obligation amounts from financial liabilities of the Company and its subsidiaries according to their maturities:
Company
December 31, 2018 December 31, 2017
Less than1 year
Between 1and 3years
Between 4and 5years
More than5 years Total
Less than1 year
Between 1and 3years
Between 4and 5years
More than5 years Total
Trade accounts payable 2,333,255 — — — 2,333,255 2,029,104 — — — 2,029,104
Related party payables — — — 8,033,436 8,033,436 — — — 3,018,825 3,018,825
Loans and financings 1,868,061 6,716,044 4,052,068 2,906,095 15,542,268 8,223,197 4,986,261 1,721,616 5,126,282 20,057,355
Estimated interest on loans and financing (1)957,813 1,601,484 645,098 62,037 3,266,432 949,268 1,402,287 724,651 246,329 3,322,535
Derivatives financing liabilities (assets) 23,602 — — — 23,602 10 — — — 10
Other financial liabilities 24,017 13,200 4,950 77 42,244 7,659 13,200 11,550 77 32,486
Consolidated
December 31, 2018 December 31, 2017
Less than1 year
Between 1and 3years
Between 4and 5years
More than5 years
TotalLess than
1 year
Between 1and 3years
Between 4and 5years
More than5 years
Total
Trade accounts payable 13,075,615 — — — 13,075,615 9,992,778 — — — 9,992,778
Loans and financings 2,922,635 13,603,665 17,830,110 21,797,118 56,153,528 13,526,051 10,339,616 18,129,338 15,029,646 57,024,651
Estimated interest on loans and financing (1) 3,260,173 5,975,491 3,567,934 3,040,077 15,843,675 2,743,687 4,535,767 2,878,624 1,918,143 12,076,221
Derivatives financing liabilities (assets) 210,015 — — — 210,015 118,684 — — — 118,684
Other financial liabilities 45,537 18,649 4,950 77 69,213 73,156 28,241 11,550 77 113,024
(1) Includes interest on all loans and financing outstanding. Payments are estimated for variable rate debt based on effective interest rates at December 31, 2018 and December31, 2017. Payments in foreign currencies are estimated using the December 31, 2018 and December 31, 2017 exchange rates.
The Company has securities pledged as collateral for derivative transactions with the commodities and futures whose balance at December 31, 2018 is R$49,791 (R$54,389 atDecember 31, 2017). This guarantee is superior to the need presented for these operations.
The indirect subsidiary JBS USA and its subsidiaries, has securities pledged as collateral for derivative transactions with the commodities and futures whose balance at December31, 2018 is R$365,781 (R$353,625 at December 31, 2017). This guarantee is larger than its collateral.
Also, the direct subsidiary Seara Alimentos has securities pledged as collateral for derivative transactions with the commodities and futures whose balance at December 31, 2018is R$87,411. This guarantee is larger than its collateral.
The Company and its subsidiaries have no guarantees received from third parties deemed relevant.
* * * * *
JBS S.A.Notes to the financial statements for the years ended December 31, 2018 and 2017(Expressed in thousands of Brazilian reais)
68

32 Approval of the financial statements
The issuance of these financial statements was authorized by the Board of Directors on March 28, 2019.
BOARD OF DIRECTORS
Chairman: Jeremiah Alphonsus O'CallaghanVice-Chairman: José Batista SobrinhoBoard Member: Aguinaldo Gomes Ramos FilhoBoard Member: Gilberto Meirelles Xandó Baptista Board Member: Wesley Mendonça Batista Filho Independent Board Member: Sérgio Roberto WaldrichIndependent Board Member: Cledorvino Belini Independent Board Member: Roberto Penteado de Camargo Ticoulat
FISCAL COUNCIL REPORT
The Fiscal Council reviewed the Company's financial statements, individual and consolidated, for the year ended December 31, 2018.
Our review included: a. analysis of the annual financial statements prepared by the Company; b. monitoring of the review done by the external independent auditors through questions and discussions; and c. questions about relevant actions and transactions made by the Company's Management.
Based on our review, in the information and clarifications received and considering the Independent Auditors' Report issued on March 28, 2019 for the individual and consolidated financial statements, the Fiscal Council was not aware of any additional fact that would lead us to believe that the aforementioned financial statements do not reflect in all material respects the information contained therein, and which are in a position to be disclosed by the Company.
FISCAL COUNCIL
Chairman: Adrian Lima da HoraCouncil Member: José Paulo da Silva FilhoCouncil Member: Demetrius Nichele MaceiCouncil Member: Robert Juenemann
AUDIT COMMITTEE
Chairman: Sérgio Roberto WaldrichCommittee Member: Gilberto Meirelles Xandó Baptista Committee Member: Paulo Sérgio Dortas
STATEMENT OF OFFICERS ON THE FINANCIAL STATEMENTS AND ON THE INDEPENDENT AUDITORS REPORT
The Company's Officers declare for the purposes of Article 25, paragraph 1, item V and VI of CVM Instruction No. 480 of December 7, 2009, that:
(i) They reviewed, discussed and agreed with the views expressed in the review report of the independent auditors on the financial statements for the year ended December 31,2018, and
(ii) They reviewed, discussed and agreed with the financial statements for the year ended December 31, 2018.
STATUTORY BOARD
Chief Executive Officer: Gilberto TomazoniAdministrative and Control Officer: Eliseo Santiago Perez Fernandez Financial and Investor Relations Officer: Guilherme Perboyre CavalcantiOfficer: Jeremiah Alphonsus O'CallaghanOfficer: Wesley Mendonça Batista Filho
Accountant: Agnaldo dos Santos Moreira Jr. (CRC SP: 244207/O-4)
* * * * *
JBS S.A.Notes to the financial statements for the years ended December 31, 2018 and 2017(Expressed in thousands of Brazilian reais)
69