management plan for the south australian commercial ... · australian commercial spencer gulf prawn...
TRANSCRIPT

Management Plan for the South Australian Commercial Spencer Gulf Prawn FisheryOCTOBER 2014
1
MANAGEMENT PLAN FOR THE SOUTH AUSTRALIAN COMMERCIAL SPENCER GULF PRAWN FISHERY
Approved by the Minister for Agriculture, Food and Fisheries pursuant to Section 44 of the Fisheries Management Act 2007.
Hon Leon Bignell MP
23 October 2014

2
PIRSA Fisheries and Aquaculture (A Division of Primary Industries and Regions South Australia) GPO Box 1625 ADELAIDE SA 5001 www.pir.sa.gov.au/fisheries Tel: (08) 8226 0900 Fax: (08) 8226 0434
© Primary Industries and Regions South Australia 2014
Disclaimer:
This management plan has been prepared pursuant to the Fisheries Management Act 2007 (South Australia) for the purpose of the administration of that Act. The Department of Primary Industries and Regions SA (and the Government of South Australia) make no representation, express or implied, as to the accuracy or completeness of the information contained in this management plan or as to the suitability of that information for any particular purpose. Use of or reliance upon information contained in this management plan is at the sole risk of the user in all things and the Department of Primary Industries and Regions SA (and the Government of South Australia) disclaim any responsibility for that use or reliance and any liability to the user.
Copyright Notice:
This work is copyright. Copyright in this work is owned by the Government of South Australia. Apart from any use permitted under the Copyright Act 1968 (Commonwealth), no part of this work may be reproduced by any process without written permission of the Government of South Australia. Requests and enquiries concerning reproduction of this work should be addressed to the Chief Executive, Department of Primary Industries and Regions SA, 25 Grenfell Street, Adelaide, SA, 5000 (marked attention Executive Director, Fisheries and Aquaculture Division).
The South Australian Fisheries Management Series
Paper number 67: Management Plan for the South Australian Commercial Spencer Gulf Prawn Fishery
ISBN 978-0-0024621-2-3
ISSN 1322-8072
3
CONTENTS 1 FISHERY TO WHICH THIS PLAN APPLIES ....................................................................... 6
2 CONSISTENCY WITH OTHER MANAGEMENT PLANS ..................................................... 6
3 TERM OF PLAN ................................................................................................................... 6
4 DESCRIPTION OF FISHERY ............................................................................................... 7
4.1 Historical overview ..................................................................................................... 10 4.2 Ecosystem and habitat ............................................................................................... 12 4.3 Economic and social characteristics ........................................................................... 16
5 ECOSYSTEM IMPACTS .................................................................................................... 18
6 GOALS AND OBJECTIVES ............................................................................................... 20
7 CO-MANAGEMENT ARRANGEMENTS ............................................................................ 30
8 ALLOCATION OF ACCESS BETWEEN SECTORS .......................................................... 32
8.1 Current allocated shares of the resource .................................................................... 32 8.2 Spatial scale of allocation ........................................................................................... 33 8.3 Information used to allocate shares ............................................................................ 33 8.4 Sector allocations ....................................................................................................... 34 8.5 Allocation triggers ....................................................................................................... 34 8.6 Review of allocations .................................................................................................. 35
9 HARVEST STRATEGY ...................................................................................................... 38
9.1 Overview .................................................................................................................... 38 9.2 Annual decision-making ............................................................................................. 40 9.3 Within-season decision-making .................................................................................. 41 9.4 Within-season decision rules ...................................................................................... 44 9.5 Review of the Harvest Strategy .................................................................................. 51 9.6 Evaluating and testing the Harvest Strategy ............................................................... 52 9.7 Harvest Strategy decision-making framework ............................................................ 53
10 OTHER COMMERCIAL FISHING ...................................................................................... 54
10.1 Research fishing ......................................................................................................... 54 10.2 Exploratory and developmental fishing ....................................................................... 54
11 STOCK ASSESSMENT AND RESEARCH ........................................................................ 55
11.1 Research services ...................................................................................................... 55 11.2 Data collection and analysis ....................................................................................... 55 11.3 Fishery independent research .................................................................................... 55 11.4 Fishery dependent monitoring .................................................................................... 57 11.5 Reporting .................................................................................................................... 57 11.6 Strategic research plan .............................................................................................. 57
12 COMPLIANCE AND MONITORING ................................................................................... 58
12.1 Objectives................................................................................................................... 58 12.2 Cost-recovery ............................................................................................................. 58 12.3 Planning ..................................................................................................................... 58 12.4 Compliance status report............................................................................................ 60
4
13 REGULATORY ARRANGEMENTS ................................................................................... 61
13.1 Licensing .................................................................................................................... 61 13.2 Management arrangements ....................................................................................... 61 13.3 Fish processing .......................................................................................................... 62
14 REVIEW OF PLAN ............................................................................................................. 62
15 RESOURCES REQUIRED TO IMPLEMENT THE PLAN ................................................... 63
15.1 Cost-recovery – overview ........................................................................................... 63 15.2 Cost-recovery – Spencer Gulf Prawn Fishery ............................................................ 63
16 REFERENCES.................................................................................................................... 64
17 ACRONYMS ....................................................................................................................... 67
18 GLOSSARY OF COMMON FISHERIES MANAGEMENT TERMS .................................... 68
19 APPENDICES ..................................................................................................................... 71
19.1 Justification of biological performance indicator reference points ............................... 71 19.2 Risk assessment of Spencer Gulf Prawn Fishery ....................................................... 76
LIST OF TABLES Table 1: Chronology of management arrangements for the Spencer Gulf Prawn Fishery. .......... 11 Table 2: Management goals, objectives and strategies for management for the Spencer Gulf Prawn Fishery. ............................................................................................................................. 22 Table 3: Shares of Spencer Gulf Prawn Fishery (SGPF) resources allocated to each fishing sector. .......................................................................................................................................... 34 Table 4: Shares of Southern Calamari allocated to each fishing sector at the State-wide level. Marine Scalefish Fishery (MSF), Northern Zone Rock Lobster Fishery (NZRLF), Gulf St Vincent Prawn Fishery (GSVPF), West Coast Prawn Fishery (WCP). ..................................................... 34 Table 5: Allocation trigger limits (percentages – portion of harvest) for Southern Calamari. Marine Scalefish Fishery (MSF), Northern Zone Rock Lobster Fishery (NZRLF), Gulf St Vincent Prawn Fishery (GSVPF), West Coast Prawn Fishery (WCP), Aboriginal Traditional (ABT). ................... 35 Table 6: Reference points for primary biological performance indicator. ..................................... 41 Table 7: Reference points for current adult and juvenile abundance from adult and recruit catch rates from individual SASs in the current season. ....................................................................... 43 Table 8: Reference points for recent recruit prawn abundance from weighted annual average recruit catch rates from the previous season's SAS. .................................................................... 44 Table 9: Pre-Christmas total allowable catch limits in relation to November SAS adult catch rates. Unless specified, these triggers represent the lower limit at which the corresponding level of harvest is determined. ................................................................................................................. 46 Table 10: Target levels for a developing a fishing strategy for a Sustainable Fishery. ................. 48 Table 11: Target levels for management of sustainable fishing strategies. .................................. 49 Table 12: Total allowable fishing nights for a Transitional Fishery, and maximum nights for fishing pre-Christmas. ............................................................................................................................. 49 Table 13: Management controls in the Spencer Gulf Prawn Fishery. .......................................... 62 Table 14: Summary of risk assessment outcomes and related objectives and management strategies from the ESD risk assessment of the Spencer Gulf Prawn Fishery ............................. 76

5
LIST OF FIGURES Figure 1: Map of fishing blocks in the three commercial prawn fisheries of South Australia. ......... 7 Figure 2: Double-rig trawl gear and location of hopper sorting and prawn-grading systems used in the Spencer Gulf Prawn Fishery (figure courtesy of SARDI Aquatic Sciences). ............................ 9 Figure 3: Trawl net configuration showing trawl boards, head rope, ground chain and cod end with crab bag. ................................................................................................................................ 9 Figure 4: Map of Spencer Gulf habitats. ...................................................................................... 13 Figure 5: Catch and effort in the Spencer Gulf Prawn Fishery 1968 to 2011-12 (Dixon et al. 2013). ..................................................................................................................................................... 15 Figure 6: Timeline of annual and within-season decision-making. Note that fishing runs are only relevant to years when the fishery is assessed as being a ‘Sustainable’ or ‘Transitional’ fishery at Section 9.4. .................................................................................................................................. 39 Figure 7: Flow diagram describing the process for determining annual stock status. .................. 40 Figure 8: Framework of within-season decision-making. ............................................................. 42 Figure 9: Decision framework for refining the level of fishing strategies for a Sustainable Fishery. ..................................................................................................................................................... 47 Figure 10: Flow diagram depicting the Harvest Strategy decision-making. .................................. 53 Figure 11: Adult catch rate reference points: reference points are indicated as limit reference point in red; trigger reference point in orange and target reference point in green. The historic SAS results from 2004-05 and 2012-13 are provided in blue. ..................................................... 72 Figure 12: Commercial annual catch and catch rate from 1968 to 2011-12 (Dixon et al. 2013). .. 73 Figure 13: Adult prawn catch rates from SAS (solid lines) and indicative reference points (dashed) set midway between the two highest or lowest results. ................................................................ 75 Figure 14: Recruit catch rates from SAS (solid lines) and indicative lower reference points (dashed) set midway between the two lowest results. ................................................................. 75

6
1 FISHERY TO WHICH THIS PLAN APPLIES
This plan applies to the Spencer Gulf Prawn Fishery (SGPF), which is formally constituted by the Fisheries Management (Prawn Fisheries) Regulations 2006 (hereafter referred to as the Fisheries Management (PF) Regulations).
The regulations define the fishery as:
(a) the taking of prawns in Spencer Gulf; and
(b) the taking of aquatic resources specified in Schedule 1 Part 1 of the regulations in Spencer Gulf where the aquatic resources are taken at the same time in the same net incidentally to the taking of prawns.
The aquatic resources specified in Schedule 1 Part 1 of the regulations are Balmain Bug (Ibacus spp.) and Southern Calamari (Sepioteuthis australis).
Spencer Gulf is defined in the regulations.
2 CONSISTENCY WITH OTHER MANAGEMENT PLANS
This management plan has been developed to be consistent with other fisheries management plans including the ‘Management Plan for the South Australian Commercial Marine Scalefish Fishery’ (PIRSA 2013a) (hereafter referred to as the MSF management plan). In particular, the provisions relating to allocation of access to the SGPF resource between each fishing sector are consistent with the Marine Scalefish Fishery in terms of Southern Calamari.
This management plan has also been developed so that it can be integrated with any Aboriginal traditional fishing management plans made in the future that apply to the waters of this management plan. The Narungga, Barngarla and Nukunu Nations Native Title claims overlap with the waters of the SGPF. No Indigenous land-use agreements (ILUA) and therefore no Aboriginal traditional fishing management plans have been made in relation to those claims at the time of writing this management plan.
3 TERM OF PLAN
This management plan applies from 23 October 2014 for a period of five years.
Section 44 of the Fisheries Management Act 2007 (hereafter referred to as the Act) prescribes the requirements for replacing or extending this management plan upon expiry.

7
4 DESCRIPTION OF FISHERY
Three commercial prawn fisheries occur within South Australia – the SGPF, the Gulf St Vincent Prawn Fishery and the West Coast Prawn Fishery (see Figure 1). The SGPF is the largest in terms of production and number of licence holders. It is a single-species prawn fishery, based on the capture of the King Prawn (Melicertus latisulcatus).
Fishing is permitted in all waters greater than 10 m in depth north of the geodesic joining Cape Catastrophe on Eyre Peninsula and Cape Spencer on Yorke Peninsula, as defined in the Fisheries Management (PF) Regulations. Spencer Gulf is divided into 125 prawn fishing blocks, which are aggregated into regions reflective of the historic main trawl grounds of the fishery (Figure 1).
There are currently 39 commercial fishery licences issued for the SGPF. Any boat used in the SGPF must be registered and endorsed upon the licence under which it is being used. Boats in the fishery must not have an overall length exceeding 22 m nor a main engine continuous brake horsepower rating exceeding 336 kW. Both single and double rigs are permitted, with a minimum mesh size of 4.5 cm and a maximum headline length of 29.26 m.
Figure 1: Map of fishing blocks in the three commercial prawn fisheries of South Australia.

8
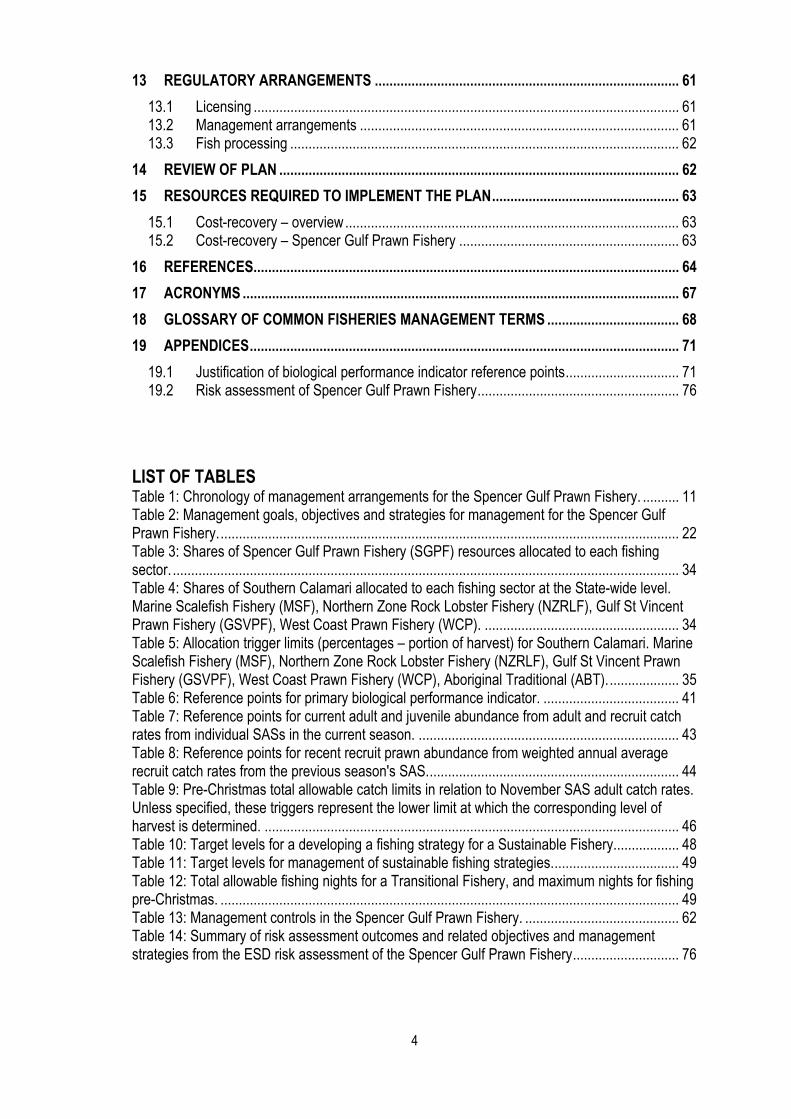
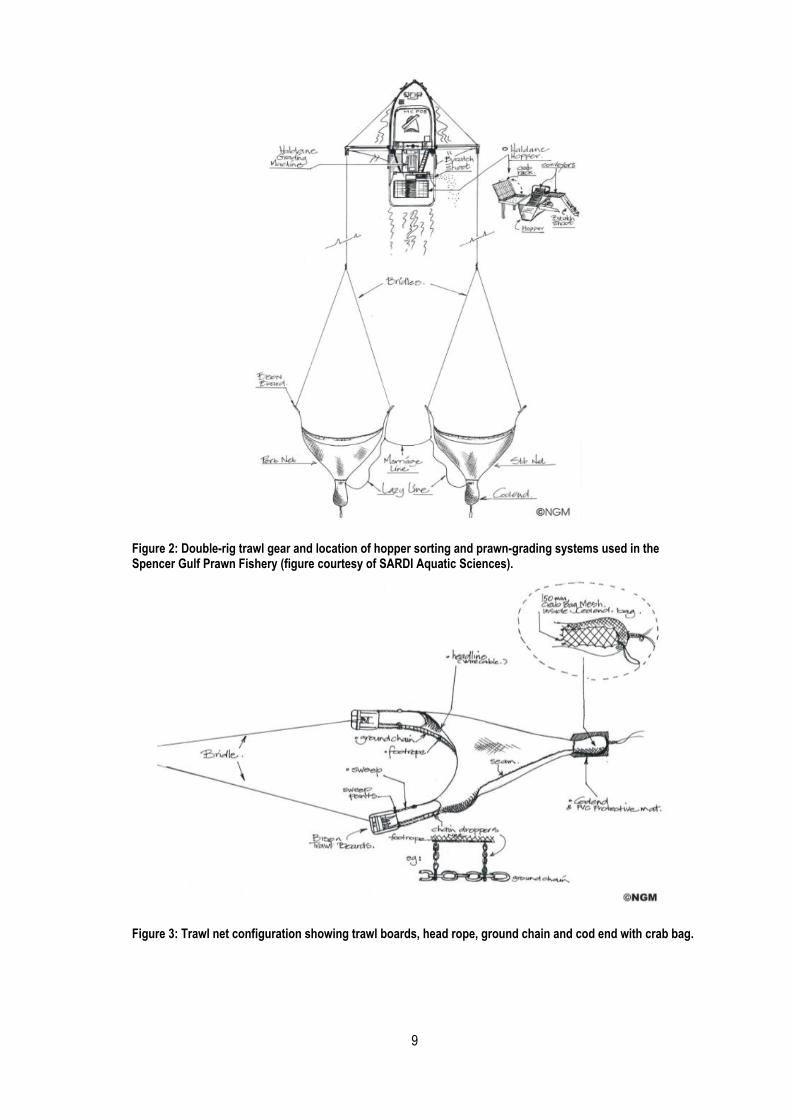
Commercial fishing is undertaken using the demersal otter trawl technique, which involves towing a funnel-shaped net leading into a bag (a ‘cod end’) over the sea floor (Figure 2 and Figure 3). A separate large meshed bag (‘crab bag’) is held within the cod end and acts to retain Blue Crabs and megafauna such as sharks and rays, while prawns flow through to the cod end. The crab bag reduces crab mortality, incidental damage to prawns, and allows the other species to be returned promptly to the sea. Otter and bison boards are used to keep the trawl nets open horizontally whilst being towed.
Trawling is undertaken during the night between sunset and sunrise, and generally between the last quarter of the moon – through the phase of the new moon to the first quarter. Trawl shots are of short duration relative to other prawn fisheries, averaging between 30 to 60 minutes.
All vessels in Spencer Gulf are fitted with a grid and ‘hopper’, into which the contents of the cod ends are spilt. The grid separates out the megafauna, which is immediately returned to the water to maximise species’ survival. The hopper is flooded with water to increase the survival of by-catch. The contents of the hopper trickle onto a conveyer-belt system where the retained catch is sorted from the by-catch and discarded by-catch is returned directly to the water. The prawn catch is then placed through a commercial grading machine that sorts the prawn catch into weight categories. The graded catch is then usually packed and frozen immediately, either cooked or green, into 5 kg or 10 kg cartons. Rarely, the catch is placed directly into a brine solution.
In addition to prawns, commercial licence holders are permitted to retain and sell two species that are harvested incidentally during prawn trawling – the Slipper Lobster (Ibacus spp.) and Southern Calamari (Sepioteuthis australis). These species are referred to as by-product. At the end of each fishing trip, the catch is off-loaded at suitable ports adjacent to the fishing grounds and then transported to fish-processing factories. Major home ports for Spencer Gulf boats are Port Lincoln and Wallaroo, with minor activity at Port Adelaide and Port Pirie.
On 25 July 2011, following a rigorous environmental assessment, the SGPF built upon its reputation as a global leader by becoming the first prawn fishery in Australia to gain certification by the Marine Stewardship Council (MSC). The MSC certification program provides for eco-labelling of fishery products based on a scientifically robust standard for assessing whether wild-capture fisheries are ecologically sustainable and well managed. In gaining this certification, the SGPF has established itself as one that demonstrates best-practice ecologically sustainable fisheries management. As part of gaining MSC certification, a number of conditions were placed on the SGPF, as detailed in a ‘Client Action Plan’. Progress towards meeting these conditions are assessed through the annual MSC audit of fishing operations.
9
Figure 2: Double-rig trawl gear and location of hopper sorting and prawn-grading systems used in the Spencer Gulf Prawn Fishery (figure courtesy of SARDI Aquatic Sciences).
Figure 3: Trawl net configuration showing trawl boards, head rope, ground chain and cod end with crab bag.
10
4.1 Historical overview
4.1.1 Commercial fishing sector
The existence of King Prawns in South Australian waters has been known for many years, but they have most likely been recorded over many years as ‘shrimps’.
The first record of King Prawns being trawled from Spencer Gulf was by the research vessel FIS Endeavour in 1909. In 1948, the first attempt to trawl for prawns on a commercial scale in Spencer Gulf was made by a New South Wales Danish-seine boat, but was unsuccessful. On a number of occasions between 1957 and 1964, the South Australian Department of Fisheries and Fauna Conservation carried out exploratory trawling using the Weeruta but also had no commercial success. In 1961, Port Lincoln fishers Gavin Scott and Roger and Clyde Haldane on the Mameena also tried but had only limited success.
It wasn’t until 1967 that the industry showed its true potential through the work of Port Lincoln fisherman Roger Howlett, who is considered the pioneer of the South Australian prawn fishery. In July 1967 Howlett began an extensive resource survey of Spencer Gulf without any outside financial assistance. After two and a half months of conducting surveys during daylight and dark in the southern area, he finally caught the first commercial quantity of prawns in October 1967. Other fishers soon joined Howlett and a developing fishery was underway. Soon after, commercial quantities were also found in Venus Bay on the West Coast.
In March 1968, A.M. Olsen, the Director of Fisheries, closed all South Australian waters to trawling. Forty permits for prawn fishing in a number of different management zones were then offered and 25 were taken up. These early steps were critical in preventing over-exploitation of the resource and over-capitalisation within the fishery, while providing for rational development of the fishery and quantification of the resource. These principles are still the cornerstone to the successful management of this important fishery resource.
In the early days, it was the fishermen who, by agreement, restricted their fishing times. The SGPF has a detailed database from commercial fisher’s logbooks that provide detailed catch and effort statistics since the fishery’s inception in 1968. Since 1981 the SGPF has halved its total effort while maintaining stable catches (see Figure 5). The Spencer Gulf and West Coast Prawn Fishermen’s Association (SGWCPFA), with its strong membership and dedicated committee, has played a major role in the successful management of the fishery.
The management system now in place for the SGPF has evolved over a number of years and has been largely influenced by the SGWCPFA following a downturn in catch in 1983-84 and 1984-85. At that time, it was believed that the harvesting of smaller size classes of prawns in the immediately preceding years was responsible for the downturn in biomass and subsequent catches, and so the SGWCPFA, in collaboration with the South Australian Research and Development Institute (SARDI) Aquatic Sciences, investigated strategies to change effort patterns in order to target areas with larger-sized prawns, as described in the Harvest Strategy for the fishery in Section 9.
The Harvest Strategy developed with the SGWCPFA included in the 2007 management plan for the fishery aimed to ensure biological sustainability and promote economic efficiency, and used a series of spatial and temporal closures to manage fishing effort. This involved legislating ‘closure

11
lines’ (a series of GPS coordinates) and prescribed times and dates of trawling to target areas of high catch rates of appropriately sized prawns.
In 1992 the first coordination of fishing strategies at sea during fishing operations (termed ‘real time management’) was developed with the appointment of a Committee-at-Sea. Real-time management gives the fleet the ability to apply alternative fishing strategies based on the movement of prawns, their size, fishing effort and catch rates in an ongoing process based on information gathered from the fleet. The Committee-at-Sea, consisting of a Coordinator-at-Sea and skippers, monitor all fished areas and implement changes according to the SGWCPFA’s policies, fishing strategies and the triggering of reference points. In 2012, the Coordinator-at-Sea was authorised to maintain fishing activities at sea under section 79 of the Act.
In August 2011 the SGPF was assessed as ‘sustainable’ by the internationally recognised MSC, through a process of rigorous assessment against third party sustainability criteria. The fishery is audited annually to ensure standards set by the MSC program are maintained. A component of the audit includes monitoring the progress of the fishery in responding to recommendations made in the original assessment. Table 1 presents a chronology of major management changes for the SGPF.
Table 1: Chronology of management arrangements for the Spencer Gulf Prawn Fishery.
Date
1967 First commercial catch of prawns recorded.
1968 All South Australian waters closed to trawling except for specific managed zones for which permits are offered; all waters less than 10 m in depth are closed to trawling.
1969 The Preservation of Prawn Resources Regulations 1969 is introduced and vessels must be licensed to fish for prawns.
1971 The two Spencer Gulf fishing zones are merged to form one.
1976 Fishers operating in Anxious Bay and Coffin Bay zones on the West Coast are offered the opportunity to switch to the Spencer Gulf zone.
1981 Industry closures of the waters north of Point Lowly and adjacent to Port Broughton to trawling.
1995 The Fisheries (Management Committees) Regulations 1995 are introduced and provide a forum for the SGWCPFA to play a major role in the management of the fishery.
1998 First management plan for SGPF introduced.
2002 Industry closure of waters adjacent to Wardang Island to Corny Point.
2007 Second management plan for SGPF introduced.
2011 MSC certifies SGPF as ‘sustainable’.
2012 Coordinator-at-Sea authorised to maintain fishing activities at sea

12
4.1.2 Recreational fishing sector
Recreational fishing for King Prawns and Balmain Bugs has historically been negligible, as fishers are permitted only to use hand-held nets in waters greater than 10 m in depth (the same depth limitation that applies to commercial fishers). Southern Calamari is an important recreational fishing species; more detail on the recreational fishing of this species is provided in the MSF management (PIRSA 2013a).
4.1.3 Indigenous fishing sector
Research has not produced any publically available records of Aboriginal traditional fishing for King Prawns or Balmain Bugs in the Spencer Gulf region, additionally the Jones 2009 survey did not include methodology specific for identifying Aboriginal fishers. Anecdotal knowledge indicates that Aboriginal traditional fishing for prawns and Balmain Bugs was conducted historically in this region (S. Schnierer 2014 pers. comm.) however the extent is not known. If information on Aboriginal traditional harvest of this species becomes available, this position can be reviewed.
Aboriginal fishers have access to prawn resources in Spencer Gulf for traditional, domestic, non-commercial use subject to meeting requirements of the Native Title Act 1994. The Barngarla, Narungga and Nukunu Nations have links to Spencer Gulf and at the time of writing this management plan had Native Title claims registered.
4.2 Ecosystem and habitat
The Spencer Gulf is a shallow embayment, with depths reaching a maximum of 60 m in its southern regions. Due to its shallow nature and temperate location, water temperatures vary markedly throughout the year. A paucity of freshwater influx combined with high levels of evaporation during summer leads to increased levels of salinity, particularly in the shallow northern reaches. This unique ‘hyper-saline’ environment, along with the vast areas of tidal flat and mangrove habitat, creates ideal breeding conditions for the King Prawns.
Dixon et al. (2007) presented analyses of habitat types associated with Spencer Gulf coastal habitats from data presented in Bryars (2003). These analyses concentrated on the habitat types crucial to prawn recruitment, particularly tidal flats and mangrove habitats that were associated with tidal flats.
The Spencer Gulf coastline is estimated at 992 km in total length; 508 km (51%) was tidal flat only and 245 km (25%) was mangrove forest associated with tidal flat. Areas with the greatest juvenile prawn nursery habitat were the Far Northern Spencer Gulf (~201 km tidal flat only and 67 km mangrove forests + tidal flat), Germein Bay (~95 km tidal flat only and 57 km mangrove forests + tidal flat) and False Bay (~63 km tidal flat only and 49 km mangrove forests + tidal flat) (Figure 4). These areas of identified nursery habitat correspond well with sites in Spencer Gulf previously found to have the greatest abundances of juvenile prawns (Roberts et al. 2005).

13
4.2.1 Biology of key species
The following descriptions provide brief background information on the biological characteristics, commercial production statistics and recreational catch and effort levels for King Prawn (Melicertus latisulcatus), Balmain Bug (Ibacus spp.) and Southern Calamari (Sepioteuthis australis) – the latter two of which are important by-product species in the SGPF. More detailed information on biology and stock status is provided in stock assessment and stock status reports prepared by the SARDI Aquatic Sciences. All completed reports are available on the Primary Industries and Regions South Australia (PIRSA) Fisheries and Aquaculture and SARDI Aquatic Sciences websites at www.pir.sa.gov.au/fisheries and www.sardi.sa.gov.au.
Figure 4: Map of Spencer Gulf habitats.
4.2.2 King Prawns
Prawns are crustaceans with five pairs of swimming legs (pleopods) and five pairs of walking legs (pereiopods), the front three of which are clawed. Prawns are nocturnal and burrow into the seabed during the day and emerge at night to feed.
The King Prawn is distributed broadly throughout Spencer Gulf but prefers sand or mud sediments to seagrass or vegetated habitats (Tanner and Deakin 2001). Adults tend to inhabit waters greater than 10 m depth and are harvested in depths of up to 60 m in the southern reaches of the gulf. Tagging studies have shown that the general movement patterns for the species are from north to south (Carrick 2003).
Adult King Prawn aggregate, mature, mate and spawn in deep water between October and April, with the main spawning period occurring between November and February. Females may spawn on multiple occasions during one season. During the peak spawning period, females tend to be more prevalent in the catch, likely due to increased feeding activity associated with ovary development. At other times the catch is generally male biased.
14
Larger female prawns are proportionally more fecund than smaller prawns and the proportion of female prawns with fertilised eggs increases with prawn size. Further, King Prawns have a short spawning season, increased catchability of spawning females, disproportionate fecundity levels and varying fertilisation success. These features mean that the harvest of prawns (particularly of larger size classes of females during the peak spawning period) has substantial implications on recruitment to the fishery and thus sustainable management.
Whilst adult King Prawn have an offshore life phase, the juvenile phase is spent in shallow nearshore environments generally associated with mangroves and/or tidal flats. Prawn larvae undergo metamorphosis through four main larval stages – nauplii, zoea, mysis and post-larvae. The length of the larval stage depends on water temperature, and development occurs more rapidly in warmer water (Hudinaga 1942). The distribution of prawn larvae is influenced by wind patterns and tidal currents, and the highest densities are found in the north of Spencer Gulf (Carrick 1996).
Post-larvae settle in inshore nursery areas when they measure 2–3 mm (carapace length). They can remain there for up to 10 months, depending on the time of settlement (Carrick 1996). The post-larvae produced from early spawning events settle in nursery areas during December or January, where they grow rapidly and then emigrate to deeper water in May or June. Alternatively, post-larvae produced from spawning after January settle in nurseries from March and then grow slowly. They ‘over-winter’ in nursery areas before recruiting to trawl grounds in February the following year (Carrick 2003). The effects of over-wintering on adult growth and survival are unknown.
In Spencer Gulf, spatial and temporal differences in juvenile prawn abundances are evident (Roberts et al. 2005). Even so, inter-annual patterns are generally consistent across sites. Abundances were greatest between February and May, with key nursery sites identified as False Bay, Shoalwater Point, Plank Point, Mount Young, Fifth Creek and Port Pirie – all in the north of the gulf (Carrick 1996; Roberts et al. 2005).
Growth of the King Prawn in Spencer Gulf is highly seasonal and increases with increasing temperature. The highest growth period is immediately after the spawning period is complete. Female prawns grow faster and attain a larger maximum size than males.
4.2.3 Southern Calamari
The Southern Calamari (Sepioteuthis australis) is common throughout southern Australian coastal waters, ranging from Dampier in Western Australia to Moreton Bay in Queensland and also occurring in Tasmania and northern New Zealand waters. S. australis usually inhabits coastal waters and bays in depths of less than 70 m (Winstanley et al. 1983).
It is likely that the Spencer Gulf calamari population share similar characteristics to the adjacent Gulf St Vincent population (Roberts and Steer 2010) where the calamari are spatially segregated into an offshore nursery ground and inshore spawning grounds (Steer et al. 2007). These patterns are closely attributed to spawning behaviour and water clarity.
4.2.4 Balmain Bug
Also referred to as the slipper lobster, the Balmain Bug (Ibacus peronii) inhabits depths of 4–288 m (Brown and Holthuis 1998). It is long-lived and has low fecundity compared to other lobsters in
15
the Scyllaridae family (Stewart and Kennelly 1997, 2000). Whilst little is known of its biology in Spencer Gulf, it exhibits limited movement patterns in New South Wales waters (Stewart and Kennelly 1998).
Although the Balmain Bug is certainly the species of slipper lobster captured most frequently in Spencer Gulf, it is unclear whether other species are harvested. Only one other species of slipper lobster, I. alticrenatus, has been identified in South Australian waters; however, it is unlikely to be captured by Spencer Gulf prawn fishers as it inhabits water depths greater than those fished (depth range: 82–696 m, Brown and Holthuis 1998).
4.2.5 Current biological status of King Prawns in South Australia
The status of the fishery is comprehensively assessed and reported on each year in a stock assessment report made publically available on the SARDI website (www.sardi.sa.gov.au). The most recent available report was published in March 2013 and relates to the 2011-12 fishing season (Dixon et al. 2013).
The primary measure for stock status in Spencer Gulf is the average catch rates (lb/min or kg/hr), which is obtained during fishery independent stock assessment surveys (SASs) conducted in November, February and April that are used as indices of relative biomass. As the fishery has maintained a long and stable history of commercial catches and recruitment, the performance indicators (PIs) for relative biomass aim to maintain survey catch rates within historical ranges that are considered to be at or above maximum sustainable yield (Dixon et al. 2013). Since 2007, when limit reference levels for mean catch rates were set, results from all SASs have achieved these levels.
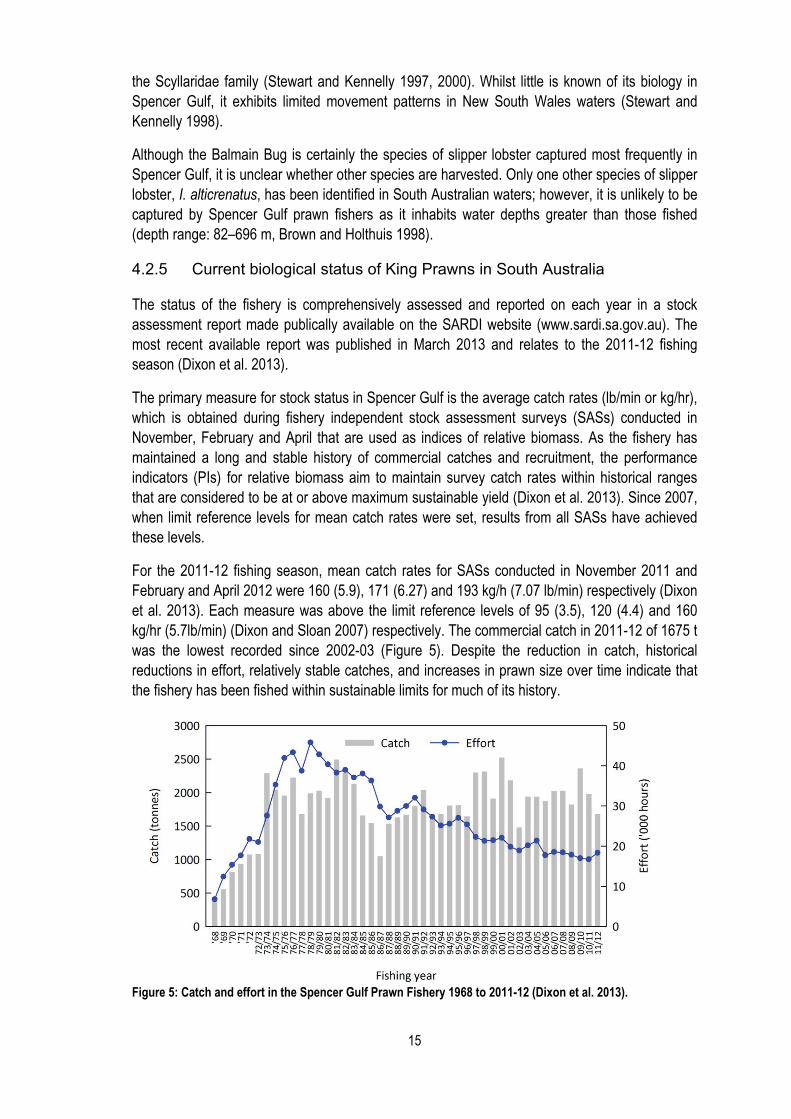
For the 2011-12 fishing season, mean catch rates for SASs conducted in November 2011 and February and April 2012 were 160 (5.9), 171 (6.27) and 193 kg/h (7.07 lb/min) respectively (Dixon et al. 2013). Each measure was above the limit reference levels of 95 (3.5), 120 (4.4) and 160 kg/hr (5.7lb/min) (Dixon and Sloan 2007) respectively. The commercial catch in 2011-12 of 1675 t was the lowest recorded since 2002-03 (Figure 5). Despite the reduction in catch, historical reductions in effort, relatively stable catches, and increases in prawn size over time indicate that the fishery has been fished within sustainable limits for much of its history.
Figure 5: Catch and effort in the Spencer Gulf Prawn Fishery 1968 to 2011-12 (Dixon et al. 2013).

16
Stable measures of relative biomass by size (as determined by surveyed catch rates) indicate that the fishery has continued to be harvested within sustainable limits in recent years. Given the performance against these measures, the current level of fishing mortality is unlikely to cause the fishery to become recruitment overfished (Dixon et al. 2013).
4.3 Economic and social characteristics
A time series of economic information in relation to the SGPF has been collected since 1997-98 and presented in economic indicators reports (Econsearch 2011). The objective of these reports is to provide an update of the economic indicators based on the results of surveys of licence holders. These surveys are undertaken on a regular basis to provide a time series of economic information to aid in management of the fisheries. The surveys of licence holders in the SGPF are not completed annually and therefore the full economic indicators report for the fishery are not completed every year. The summary economic information provided in this section describes the outcomes of the economic indicators report up to the 2009-10 fishing season (Econsearch 2011). Economic indicators for the SGPF are also reported annually in a summary report, Economic Indicators for the Commercial Fisheries of SA Summary Report, which updates the economic indicators based on the most recent survey results to continue the time series. Updated economic indicators reports are available on the PIRSA website.
The SGPF is important in terms of total value and benefit to regional economies in South Australia. The fishery generates direct and indirect employment, contributes to regional development, and supports many small businesses in direct fishing enterprises as well as various support industries, primarily in regional South Australia (Econsearch 2011).
The SGPF had a gross value of production (GVP) of $30.3 million in 2010-11 with a total catch of 1979 t of prawns (Knight and Tsolos 2012), making it one of the more valuable fisheries in Australia. The GVP has fluctuated from year to year and peaked at $44.5 million in 2000-01 (Econsearch 2011). A range of factors affect costs in the fishery, in particular the costs of fishing (number of nights fished determines total cost of fuel, repairs and maintenance and provisions), price of fuel, interest charges, consumer price index, and labour costs.
The SGPF provides significant State and regional economic impacts in terms of direct benefits (fishing, processing, transport, retail, food services and capital expenditure), and indirect flow-on benefits (trade, manufacturing, business services and transport). Contribution to Gross State Product (GSP) from the SGPF and the West Coast Prawn fisheries Fishery was estimated to be $20.5 million in direct benefits and $29.9 million in flow-on benefits in 2009-10.
Further, in 2009-10, the SGPF and the West Coast Prawn fishery were responsible for direct employment of around 185 full-time equivalent (FTE) jobs, and downstream activities created around 273 FTE jobs State-wide. Flow-on business activity was estimated to generate a further 372 FTE jobs State-wide (91 regionally). These State-wide jobs were concentrated in the trade (111), manufacturing (70) and business services (52) sectors. The total employment impact in South Australia was estimated to be 830 FTE jobs (Econsearch 2011).
While the employment generated may be relatively small in measurable dollar terms compared to other industries, the benefits of local employment contributes to communities in other ways. Regional communities rely on employment to exist as it allows individuals and families to maintain an income and stay in the region. The SGPF provides such benefits to the regional communities
17
around Spencer Gulf that supply employees to prawn fishing, processing operations and other direct and indirect activities.
There were 305 FTE jobs in the Eyre Peninsula/Western region generated directly and indirectly from the prawn fishing industry, with an estimated household income from fishing of $16.5 million for the region in 2009-10 (Econsearch 2011). Both employment and household income estimates from the SGPF and the West Coast prawn fishery has increased since 1997-98 when economic data was first collected.
The SGPF is an essential part of the identity of Port Lincoln, which is the main port of operation for this fishing sector. Port Lincoln is renowned for producing some of the most sought-after seafood in the world, including Southern Bluefin Tuna, Southern Rock Lobster and King Prawns. Port Lincoln supports the Southern Hemisphere’s largest fishing fleet, which is accommodated at a purpose-built marina that has become an icon of the city.
The fishing operations themselves tend to be family operated businesses operating single licences, and there have been few licence sales to new operators in the last ten years. The licence holders are generally long-term operators who have worked cooperatively in developing co-management arrangements with government in order to sustainably manage the fishery. As family businesses predominate in the fishery, succession planning may be influenced by perceptions about whether there is sufficient certainty about continued access to the fishery. These perceptions include the impact of changes in future management frameworks on the continuation of viable businesses.

18
5 ECOSYSTEM IMPACTS
A goal of this plan is the management of the SGPF as part of the broader ecosystem, using an ecosystem-based fisheries management (EBFM) approach.
The Act requires that ecological impacts be identified and assessed. The Act specifically requires that the following impacts are identified:
1. Current known impacts of the fishery on the ecosystem;
2. Potential impacts of the fishery on the ecosystem; and
3. Ecological factors that could have an impact on the performance of the fishery.
To efficiently meet its ecological impact accountabilities under both State and Commonwealth legislation, PIRSA Fisheries and Aquaculture has adopted the ‘National Ecologically Sustainable Development Reporting Framework for Fisheries’, developed by Fletcher et al. (2002). The initial steps of this analysis include:
1. Identifying the issues relevant to the fishery.
2. Prioritising these issues.
The primary methods chosen to complete these two elements were: 1. Conducting a qualitative risk assessment for each of the species components of the fishery (including target and non-target species).
2. Conducting a qualitative risk assessment for non-species components including socioeconomic elements that make up the SGPF.
Risk analyses were also conducted and involved considering the sources of risk (being a chance of something going wrong, or a hazard), their consequences, and the likelihood that those consequences may occur.
A semi-quantitative assessment of the species components of the fishery was also conducted in recognition that the fishery is a trawl fishery with a range of by-catch species.
The requirement to conduct an ecologically sustainable development (ESD) risk assessment has been introduced since implementation of the previous SGPF management plan (Dixon and Sloan, 2007), and is, therefore, the first ESD risk assessment to be conducted for the SGPF. Therefore, the information provided in this report and summarised here reflects the outcomes at the time the assessment was completed.
With respect to the identified risks to by-catch species, the ESD risk assessment used data from a 2007 by-catch survey, and, therefore, identifies the risks at that time. It is recognised that the fishery and the Spencer Gulf environment are dynamic and risks will change over time. The risk assessment will be repeated to update the assessment of the fishery as required.
An ESD risk assessment workshop was conducted in November 2011 for the SGPF to identify risks to the non-species components of the fishery. The majority of high risks related to the risk of fishery impacts on non-retained species, community impacts regarding profitability, and external factors including the introduction of disease into wild stocks.
19
Semi-quantitative assessment of the species components of the fishery identified from a 2007 by-catch survey was carried out in February 2013. The method used followed the productivity susceptibility analysis (PSA) methodology described in the ecological risk assessment for the effects of fishing (ERAEF) framework developed by Hobday et al. (2007).
The PSA approach is a method of assessment that allows all units within the ecosystem components to be effectively and comprehensively screened for risk. PSA for species components is often used to assess risk of species whose distribution includes the area in which the fishery operates (regardless of whether there is ever an interaction recorded). The units of analysis for this PSA only comprised the individual target, by-product, discard and threatened, endangered and protected species (TEPS) recorded from the 2007 prawn trawl by-catch survey (see Section 11.3.2)
The PSA measures potential for risk. While the relative fishery interactions are measured through the PSA, assessment of the actual impact of the fishery on a species is not made. It does not take into account the level of catch, the size of the population, or the likely exploitation rate. Thus, the risk rating provided from the PSA identifies species that may require further consideration with regard to mitigation options or additional information requirements.
A stakeholder panel at workshops in February 2013 considered the PSA outcomes for each of 195 species identified from the by-catch surveys. The stakeholder panel identified species at potential high risk or requiring further consideration and considered management arrangements currently in place to mitigate risk. Additional arrangements, including the collation of additional information, were recommended where appropriate.
The main outcomes from these two risk assessment processes are described in the report, ‘ESD Risk Assessment of South Australia’s Spencer Gulf Prawn Fishery’ (PIRSA 2014). The report describing the ESD risk assessment can be found on the PIRSA website at www.pir.sa.gov.au/fisheries. A review of the ESD risk assessment was undertaken as part of a major review of this plan and the reviewers comments have been taken into consideration in finalising the ESD risk assessment report.
Specific management strategies to mitigate risks to the fishery rated at medium risk or higher in the ESD risk assessment report are reported at Appendix 19.2. Many of these strategies have been in place in the SGPF over a long period and include closed areas, limits on issuing licences and gear restrictions. In addition, the Harvest Strategy identified in this plan (Section 9) has been instrumental in the fishery remaining sustainable.
20
6 GOALS AND OBJECTIVES
As set out in Section 7 of the Fisheries Management Act 2007, the objects of the Act is to protect, manage, use and develop the aquatic resources of the State in a manner consistent with ESD. The Act also requires that management plans be consistent with these objects.
A number of biological, social and economic factors are identified in the objects of the Act that must be balanced in pursuing ESD. However, it is specified that the primary consideration is to avoid the over-exploitation or endangerment of resources.
The four key goals for the SGPF set out below are linked to the operational objectives for the South Australia Spencer Gulf Prawn Fishery set out in Table 2: Management goals, objectives and strategies for management for the Spencer Gulf Prawn Fishery.. PIs and reference points for each objective are provided to allow for the assessment of this management plan in meeting the identified goals.
Goal 1: Maintain ecologically sustainable prawn biomass This goal relates to the sustainability of the target stock. The objectives of this management plan in relation to sustainability are that management arrangements are sufficient to maintain:
• Relative spawning stock biomass of prawn stocks at sustainable levels.
• Future prawn biomass is maintained above sustainable levels.
• Information collected is sufficient to manage fishing operations to sustainable levels.
These objectives aim to ensure that prawn resources in Spencer Gulf are harvested within sustainable limits as defined by PIs relevant to reference points described in the Harvest Strategy at Section 9.
The main strategies for ensuring the sustainability of the resource are: • Limited entry.
• Closed areas.
• Gear restrictions.
• Decision rules (described in the Harvest Strategy in Section 9).
Performance of the fishery against identified reference points are reported annually in a stock assessment report developed by SARDI Aquatic Sciences. These reports can be accessed from the SARDI website at www.sardi.sa.gov.au/fisheries.
Goal 2: Optimum utilisation and equitable distribution This goal relates to optimising the economic and social benefits derived from the SGPF and focuses on allowing for economic efficiency of fishing operations. The objective of this management plan in relation to optimum utilisation is:
• Having an economically efficient fleet without compromising sustainability objectives.
The strategies implemented to achieve this goal are focused on a Harvest Strategy (Section 9) that allows for flexible fishing operations within sustainable limits.
With regard to equitable distribution, as the fishery is exclusively a commercial fishery by virtue of the limiting management arrangements that hamper non-commercial fishing, the objectives in this

21
plan relate to ensuring access to the resource is in line with requirements under the Act. The operational objective related to resource access is to:
• Provide access to the resource as per PIRSA’s Allocation policy: Allocation of Access to Fisheries Resources Between Fishing Sectors (PIRSA 2011) (hereafter referred to as the Allocation Policy).
Performance of the fishery against identified economic reference points are reported annually in economics indicators reports developed by Econsearch, which can be accessed from the PIRSA website www.pir.sa.gov.au/fisheries.
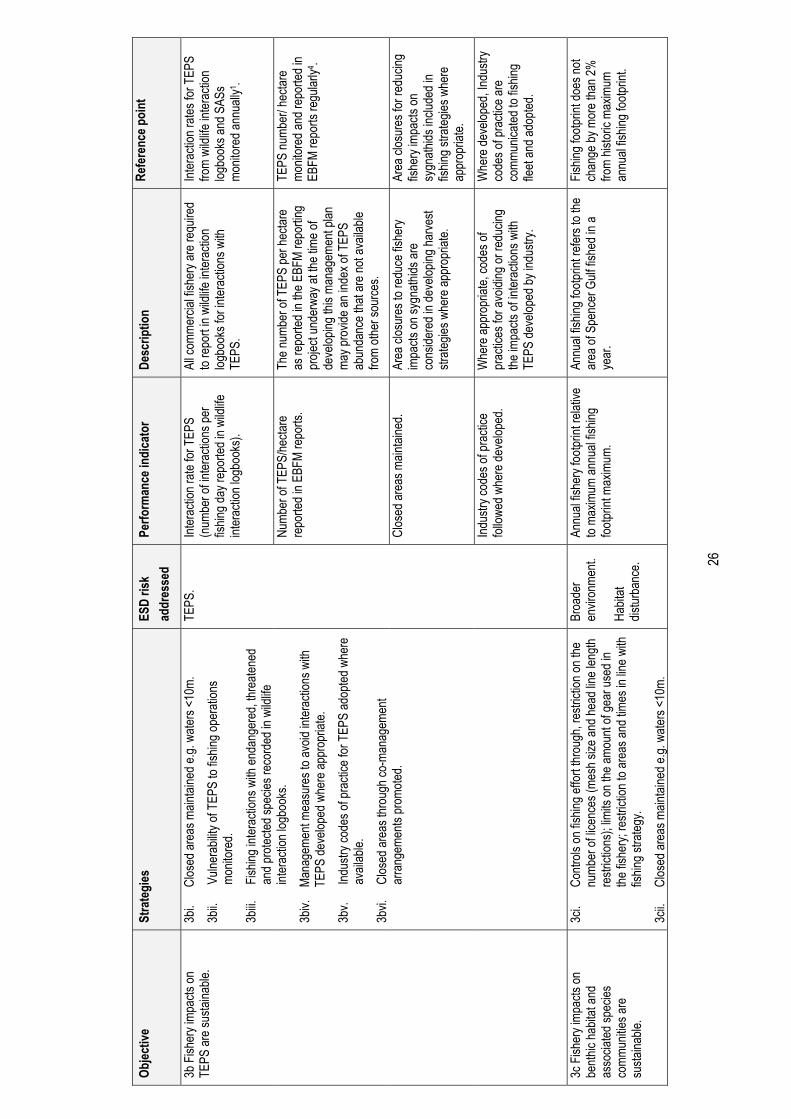
Goal 3: Protect and conserve aquatic resources, habitats and ecosystems This goal relates to the management of the fishery using an EBFM approach. The objectives of this management plan to achieve this goal are:
• Fishery impacts on by-catch and by-product species are sustainable.
• Fishery impacts on threatened, endangered and protected species (TEPS) are sustainable.
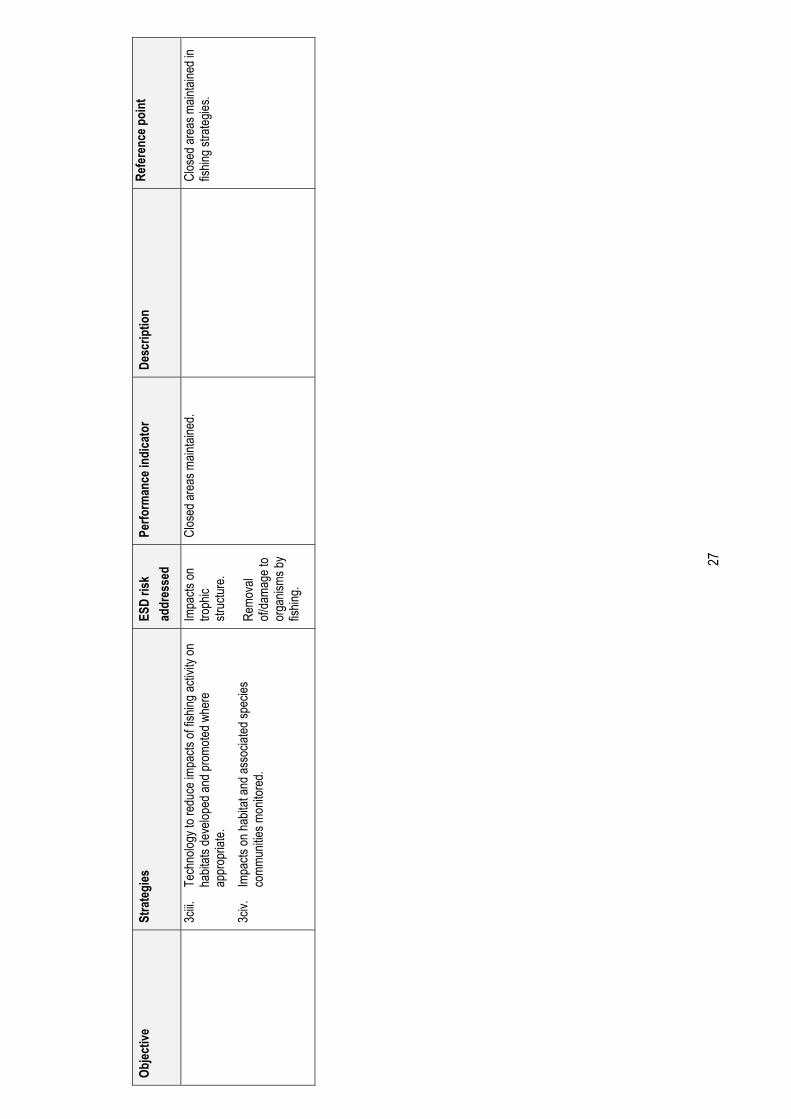
• Fishery impacts on benthic habitat and associated species communities are sustainable.
Management strategies implemented to achieve this goal are: • Controls on fishing effort.
• Closed areas.
• Promoting activities that reduce the impacts of fishing activity.
Goal 4: Cost effective and participative management of the fishery This goal relates to co-management of the fishery, planning of management activities, and the recovery of the costs of management of the fishery.
The overall objectives of this goal are: • To ensure that stakeholders and government fisheries administrations share
responsibility and are involved in the decision-making processes for developing and implementing management arrangements.
• To ensure that management arrangements are complied with.
The cost effectiveness of these arrangements also need to be considered in the development process as the management costs are recovered from fishers in accordance with the government’s cost-recovery policy for fisheries (see Section 15.1).
The operational objectives of this management plan in relation to co-management, planning and cost-recovery are:
• Industry participation in management through co-operative arrangements.
• Management arrangements supporting cohesion between fisheries industry and the wider community.
• Maximise stewardship of fisheries resources.
• Costs of management of the fishery funded by relevant stakeholders.

22
Tabl
e 2: M
anag
emen
t goa
ls, o
bjec
tives
and
stra
tegi
es fo
r man
agem
ent f
or th
e Spe
ncer
Gul
f Pra
wn F
isher
y.
Objec
tive
Stra
tegi
es
ESD
risk
addr
esse
d Pe
rform
ance
indi
cato
r De
scrip
tion
Re
fere
nce p
oint
Goal
1: M
ainta
in ec
olog
ically
sust
ainab
le pr
awn
biom
ass.
1a M
anag
emen
t ar
rang
emen
ts ar
e suff
icien
t to
maint
ain re
lative
spaw
ning
stock
biom
ass o
f pra
wn
stock
s at s
ustai
nable
leve
ls.
1ai.
Contr
ols on
fishin
g effo
rt thr
ough
, res
trictio
n on
the nu
mber
of lic
ence
s (me
sh si
ze an
d hea
d line
len
gth re
strict
ions);
adhe
renc
e to l
imits
on th
e am
ount
of ge
ar us
ed in
the f
isher
y; re
strict
ion to
ar
eas a
nd tim
es in
line w
ith H
arve
st St
rateg
y, ho
rsepo
wer,
vess
el siz
e.
1aii.
Clos
ed ar
eas m
aintai
ned,
e.g. w
aters
<10m
.
1aiii.
An
nual
Harve
st str
ategy
guide
s fish
ing
oper
ation
s.
Fishin
g im
pacts
on
targe
t sp
ecies
.
Aver
age a
dult p
rawn
catch
rate
from
three
SAS
s eac
h sea
son.
Adult
praw
n catc
h rate
s fro
m SA
Ss
is us
ed as
an in
dicato
r of r
elativ
e sp
awnin
g biom
ass.
Catch
rates
are
weigh
ted as
desc
ribed
in th
e Ha
rvest
Stra
tegy a
t Sec
tion 9
.
Aver
age a
dult p
rawn
catch
ra
te ≥
68.2
kg/hr
(2.5
lb/mi
n).1
1b F
uture
praw
n biom
ass i
s ma
intain
ed ab
ove s
ustai
nable
lev
els.
1bi.
Contr
ols on
fishin
g effo
rt thr
ough
, res
trictio
n on
the nu
mber
of lic
ence
s (me
sh si
ze an
d hea
d line
len
gth re
strict
ions);
adhe
renc
e to l
imits
on th
e am
ount
of ge
ar us
ed in
the f
isher
y; re
strict
ion to
ar
eas a
nd tim
es in
line w
ith H
arve
st St
rateg
y, ho
rsepo
wer,
vess
el siz
e.
1bii.
Clos
ed ar
eas m
aintai
ned,
e.g. w
aters
<10m
.
1biii.
An
nual
Harve
st St
rateg
y guid
es fis
hing
oper
ation
s.
Fishin
g im
pacts
on
targe
t sp
ecies
.
Recru
itmen
t inde
x (sq
uare
root
of the
numb
er of
juve
nile
praw
ns (m
ales <
33 an
d fem
ales
<35 m
m CL
) cap
tured
per
nauti
cal m
ile tr
awled
follo
wing
Ca
rrick
(200
3)).
Index
of fu
ture b
iomas
s.
> 35
1
Mean
egg p
rodu
ction
. Co
unt in
milli
on eg
gs/ h
r tra
wled
du
ring N
ovem
ber F
IS.
>500
1
1 Rep
orted
annu
ally i
n a st
ock a
sses
smen
t rep
ort fo
r the
fishe
ry (w
ww.sa
rdi.s
a.gov
.au/fis
herie
s).

23
Objec
tive
Stra
tegi
es
ESD
risk
addr
esse
d Pe
rform
ance
indi
cato
r De
scrip
tion
Re
fere
nce p
oint
1c: In
forma
tion i
s coll
ected
su
fficien
t to m
anag
e fish
ing
oper
ation
s to s
ustai
nable
lev
els.
1ci.
Fishe
ry-de
pend
ent in
forma
tion c
ollec
ted th
roug
h co
mmer
cial lo
gboo
ks.
1cii.
Fishe
ry-ind
epen
dent
praw
n sur
veys
cond
ucted
.
1ciii.
Fis
hery
status
asse
ssme
nt re
porte
d.
1civ.
Ap
prop
riate
envir
onme
ntal d
ata to
aid
asse
ssme
nt co
llecte
d.
1cv.
Rese
arch
plan
main
taine
d to g
uide s
trateg
ic re
sear
ch.
Rese
arch
kn
owled
ge
Comm
ercia
l catc
h and
effor
t. Sp
atial
and t
empo
ral c
atch a
nd
effor
t data
prov
ided b
y all
comm
ercia
l fish
ers f
or ea
ch da
y fis
hed i
n com
merci
al log
book
s.
Mean
comm
ercia
l catc
h ra
te >
80kg
/traw
led ho
ur 1 .
Lo
gboo
k rec
ords
prov
ided
by al
l fish
ers f
or 10
0% of
fis
hing n
ights.
Fis
hery
indep
ende
nt su
rveys
co
nduc
ted.
Fishe
ry as
sess
ment
repo
rts ag
ainst
biolog
ical P
Is in
the H
arve
st St
rateg
y.
Fishe
ry su
rveys
cond
ucted
su
fficien
t to in
form
annu
al fis
hery
status
as
sess
ments
1 . St
rateg
ic re
sear
ch pl
an.
A re
sear
ch an
d mon
itorin
g plan
pr
ioritis
es re
sear
ch an
d mon
itorin
g ac
tivitie
s dev
elope
d by S
GWCP
FA
Rese
arch
Sub
comm
ittee.
Rese
arch
plan
upda
ted
annu
ally.

24
Objec
tive
Stra
tegi
es
ESD
risk
addr
esse
d Pe
rform
ance
indi
cato
r De
scrip
tion
Re
fere
nce p
oint
Goal
2: E
nsur
e opt
imal
utilis
atio
n an
d eq
uita
ble d
istrib
utio
n.
2a A
n eco
nomi
cally
effic
ient
fleet
witho
ut co
mpro
misin
g su
staina
bility
objec
tives
.
2ai.
Harve
st str
ategy
allow
s com
merci
al op
erato
rs to
maxim
ise op
erati
onal
flexib
ility a
nd ec
onom
ic eff
icien
cy.
2aii.
Econ
omic
perfo
rman
ce of
fishe
ry as
sess
ed.
Indus
try pr
ofit.
Econ
omic
value
to
regio
nal
centr
es.
Asse
t valu
e.
Marke
t ac
cess
.
Econ
omics
.
Gros
s valu
e of p
rodu
ction
(G
VP).
Total
catch
value
d at th
e lan
ded
beac
h pric
e. Us
ed to
deter
mine
the
whole
fishe
ry va
lue.
GVP
monit
ored
regu
larly2 ,3
Retur
n on i
nves
tmen
t (RO
I).
Net p
rofit
after
depr
eciat
ion as
a pe
rcenta
ge of
capit
al em
ploye
d re
porte
d in e
cono
mic i
ndica
tors
repo
rts2 .
ROI m
onito
red r
egula
rly2,
3
Gros
s ope
ratin
g sur
plus
(GOS
). GO
S pr
ovide
s an i
ndex
of ca
pacit
y of
oper
ator t
o rem
ain in
the f
isher
y in
the sh
ort to
med
ium te
rm.
GOS
monit
ored
regu
larly2,
3
Econ
omic
indica
tors r
epor
t. Re
portin
g aga
inst e
cono
mic P
Is.
Econ
omic
indica
tor re
port
cond
ucted
regu
larly2 .
Numb
er of
full t
ime e
quiva
lent
(FTE
) pos
itions
dire
ctly a
nd
indire
ctly e
mploy
ed.
Emplo
ymen
t dire
ctly a
nd in
direc
tly
asso
ciated
with
the f
isher
y. Nu
mber
of F
TEs m
onito
red
when
avail
able2 .
2b M
anag
e allo
cated
shar
es
of the
reso
urce
as pe
r Al
locati
on P
olicy
.
2bi.
Reso
urce
alloc
ation
betw
een s
ector
s pro
vided
in
this m
anag
emen
t plan
. 2b
ii. Re
view
of all
ocati
on pr
ovide
d in t
he m
anag
emen
t pla
n.
Alloc
ation
. Al
locati
on re
viewe
d as p
er
Alloc
ation
Poli
cy (P
IRSA
2011
), if a
ppro
priat
e.
Al
locati
on re
viewe
d if
appr
opria
te.
2 Rep
orted
regu
larly
in the
econ
omic
indica
tors r
epor
t for t
he fis
hery
(www
.pir.s
a.gov
.au/fis
herie
s).
3 New
refer
ence
point
s may
be de
velop
ed fo
llowi
ng fin
alisa
tion o
f the b
io-ec
onom
ic re
sear
ch pr
oject
(see s
ectio
n 11.3
.3) un
derw
ay at
the t
ime o
f writi
ng th
is ma
nage
ment
plan.

25
Objec
tive
Stra
tegi
es
ESD
risk
addr
esse
d Pe
rform
ance
indi
cato
r De
scrip
tion
Re
fere
nce p
oint
Goal
3: P
rote
ct an
d co
nser
ve aq
uatic
reso
urce
s, ha
bita
ts an
d ec
osys
tem
s.
3a F
isher
y imp
acts
on by
-ca
tch an
d by-p
rodu
ct sp
ecies
are s
ustai
nable
.
3ai.
Contr
ol fis
hing e
ffort
throu
gh, r
estric
tion o
n the
nu
mber
of lic
ence
s (Me
sh si
ze an
d hea
d line
leng
th re
strict
ions);
limits
on th
e amo
unt o
f gea
r use
d in
the fis
hery,
restr
iction
s on h
orse
powe
r.
3aii.
Clos
ed ar
eas m
aintai
ned e
.g. w
aters
<10m
.
3aiii.
Ri
sks t
o by-c
atch a
nd by
-pro
duct
spec
ies
monit
ored
thro
ugh E
SD ris
k ass
essm
ent.
3aiv.
Cl
osed
area
s thr
ough
co-m
anag
emen
t ar
rang
emen
ts pr
omote
d.
3av.
Prom
ote in
vesti
gatio
n into
tech
nolog
y to r
educ
e im
pacts
of fis
hing a
ctivit
y.
3avi.
Ind
ustry
code
s of p
racti
ce fo
r by-c
atch s
pecie
s wh
ere a
vaila
ble.
3avii
. Lo
ng te
rm by
-catch
repo
rting a
nd m
onito
ring t
o be
estab
lishe
d in l
ine w
ith th
e EBF
M me
thods
.
Impa
cts on
tro
phic
struc
ture.
By-ca
tch.
By-ca
tch an
d by-p
rodu
ct ca
tch
rate
(num
ber/h
ectar
e) fr
om by
-ca
tch su
rveys
.
Monit
oring
chan
ges i
n abu
ndan
ce
of by
-catch
and b
y-pro
duct
spec
ies
that m
ay in
dicate
trop
hic st
ructu
re
chan
ge us
ing pr
oces
s ide
ntifie
d in
the E
BFM
proje
ct4 .
EBFM
repo
rting u
nder
taken
re
gular
ly.
Long
-term
by-ca
tch re
portin
g an
d mon
itorin
g mea
sure
s de
velop
ed w
here
appr
opria
te.
Deve
lopme
nt of
monit
oring
and
repo
rting m
ethod
ologie
s allo
w for
ris
ks to
by-ca
tch sp
ecies
to be
ide
ntifie
d effe
ctive
ly an
d ass
ist in
de
velop
ing ef
fectiv
e mitig
ation
me
asur
es.
Appr
opria
te re
feren
ce
point
s ide
ntifie
d in E
BFM
proje
ct re
port
deve
loped
an
d con
sider
ed fo
r long
ter
m mo
nitor
ing.
Tech
nolog
y for
redu
cing
impa
cts of
fishin
g acti
vity o
n by
-catch
spec
ies su
staina
bility
ad
opted
whe
re ap
prop
riate.
Tech
nolog
y tha
t mitig
ate id
entifi
ed
risk t
o by-c
atch s
pecie
s su
staina
bility
be ad
opted
whe
re
avail
able
and a
ppro
priat
e.
Tech
nolog
y for
redu
cing
impa
cts of
fishin
g acti
vity o
n by
-catch
spec
ies
susta
inabil
ity ad
opted
wh
ere a
ppro
priat
e.
EBFM
repo
rt4 .
EBFM
repo
rt co
mplet
ed.
ESD
risk a
sses
smen
t rep
ort
revie
wed i
n life
of th
e plan
.
ESD
risk a
sses
smen
t re
viewe
d in l
ife of
plan
.
4 An E
BFM
repo
rt wa
s in p
repa
ratio
n at th
e tim
e of fi
nalis
ing th
is ma
nage
ment
plan.
This
repo
rt pr
ovide
s a fr
amew
ork f
or co
ntinu
ed m
onito
ring o
f eco
syste
m co
mpon
ents
of the
fishe
ry.
26
Objec
tive
Stra
tegi
es
ESD
risk
addr
esse
d Pe
rform
ance
indi
cato
r De
scrip
tion
Re
fere
nce p
oint
3b F
isher
y imp
acts
on
TEPS
are s
ustai
nable
. 3b
i. Cl
osed
area
s main
taine
d e.g.
wate
rs <1
0m.
3bii.
Vulne
rabil
ity of
TEP
S to
fishin
g ope
ratio
ns
monit
ored
.
3biii.
Fis
hing i
ntera
ction
s with
enda
nger
ed, th
reate
ned
and p
rotec
ted sp
ecies
reco
rded
in w
ildlife
int
erac
tion l
ogbo
oks.
3biv.
Ma
nage
ment
meas
ures
to av
oid in
terac
tions
with
TE
PS de
velop
ed w
here
appr
opria
te.
3bv.
Indus
try co
des o
f pra
ctice
for T
EPS
adop
ted w
here
av
ailab
le.
3bvi.
Cl
osed
area
s thr
ough
co-m
anag
emen
t ar
rang
emen
ts pr
omote
d.
TEPS
. Int
erac
tion r
ate fo
r TEP
S (n
umbe
r of in
terac
tions
per
fishin
g day
repo
rted i
n wild
life
inter
actio
n log
book
s).
All c
omme
rcial
fishe
ry ar
e req
uired
to
repo
rt in
wildl
ife in
terac
tion
logbo
oks f
or in
terac
tions
with
TE
PS.
Inter
actio
n rate
s for
TEP
S fro
m wi
ldlife
inter
actio
n log
book
s and
SAS
s mo
nitor
ed an
nuall
y1 .
Numb
er of
TEP
S/he
ctare
re
porte
d in E
BFM
repo
rts.
The n
umbe
r of T
EPS
per h
ectar
e as
repo
rted i
n the
EBF
M re
portin
g pr
oject
unde
rway
at th
e tim
e of
deve
loping
this
mana
geme
nt pla
n ma
y pro
vide a
n ind
ex of
TEP
S ab
unda
nce t
hat a
re no
t ava
ilable
fro
m oth
er so
urce
s.
TEPS
numb
er/ h
ectar
e mo
nitor
ed an
d rep
orted
in
EBFM
repo
rts re
gular
ly4 .
Clos
ed ar
eas m
aintai
ned.
Area
clos
ures
to re
duce
fishe
ry im
pacts
on sy
gnath
ids ar
e co
nside
red i
n dev
elopin
g har
vest
strate
gies w
here
appr
opria
te.
Area
clos
ures
for r
educ
ing
fishe
ry im
pacts
on
sygn
athids
inclu
ded i
n fis
hing s
trateg
ies w
here
ap
prop
riate.
Indus
try co
des o
f pra
ctice
fol
lowed
whe
re de
velop
ed.
Whe
re ap
prop
riate,
code
s of
prac
tices
for a
voidi
ng or
redu
cing
the im
pacts
of in
terac
tions
with
TE
PS de
velop
ed by
indu
stry.
Whe
re de
velop
ed, In
dustr
y co
des o
f pra
ctice
are
comm
unica
ted to
fishin
g fle
et an
d ado
pted.
3c F
isher
y imp
acts
on
benth
ic ha
bitat
and
asso
ciated
spec
ies
comm
unitie
s are
su
staina
ble.
3ci.
Contr
ols on
fishin
g effo
rt thr
ough
, res
trictio
n on t
he
numb
er of
licen
ces (
mesh
size
and h
ead l
ine le
ngth
restr
iction
s); lim
its on
the a
moun
t of g
ear u
sed i
n the
fishe
ry; re
strict
ion to
area
s and
times
in lin
e with
fis
hing s
trateg
y.
3cii.
Clos
ed ar
eas m
aintai
ned e
.g. w
aters
<10m
.
Broa
der
envir
onme
nt.
Habit
at dis
turba
nce.
Annu
al fis
hery
footpr
int re
lative
to
maxim
um an
nual
fishin
g foo
tprint
max
imum
.
Annu
al fis
hing f
ootpr
int re
fers t
o the
ar
ea of
Spe
ncer
Gulf
fishe
d in a
ye
ar.
Fishin
g foo
tprint
does
not
chan
ge by
mor
e tha
n 2%
fro
m his
toric
maxim
um
annu
al fis
hing f
ootpr
int.
27
Objec
tive
Stra
tegi
es
ESD
risk
addr
esse
d Pe
rform
ance
indi
cato
r De
scrip
tion
Re
fere
nce p
oint
3ciii.
Te
chno
logy t
o red
uce i
mpac
ts of
fishin
g acti
vity o
n ha
bitats
deve
loped
and p
romo
ted w
here
ap
prop
riate.
3civ.
Im
pacts
on ha
bitat
and a
ssoc
iated
spec
ies
comm
unitie
s mon
itore
d.
Impa
cts on
tro
phic
struc
ture.
Remo
val
of/da
mage
to
orga
nisms
by
fishin
g.
Clos
ed ar
eas m
aintai
ned.
Cl
osed
area
s main
taine
d in
fishin
g stra
tegies
.

28
Objec
tive
Stra
tegi
es
ESD
risk
addr
esse
d Pe
rform
ance
indi
cato
r De
scrip
tion
Re
fere
nce p
oint
Goal
4: E
nabl
e effe
ctive
and
parti
cipat
ive m
anag
emen
t of t
he fi
sher
y.
4a In
dustr
y par
ticipa
tion i
n ma
nage
ment
throu
gh co
-op
erati
ve ar
rang
emen
ts.
4ai.
Fishin
g Stra
tegies
deve
loped
and m
aintai
ned
throu
gh th
e SGW
CPFA
Man
agem
ent C
ommi
ttee
and t
he C
ommi
ttee-
at-se
a.
Mana
geme
nt eff
ectiv
enes
s.
Co-
mana
geme
nt.
Acce
ss.
Gove
rnan
ce –
Indus
try.
Memb
ersh
ip on
SGW
CPFA
’s Ma
nage
ment
Comm
ittee a
nd
Rese
arch
Sub
comm
ittee.
SGW
CPFA
Man
agem
ent
Comm
ittee p
rovid
e adv
ice to
PIR
SA
on fis
herie
s rela
ted is
sues
inclu
ding
fishin
g stra
tegy d
evelo
pmen
t and
at-
sea d
ecisi
ons t
o main
tain f
ishing
str
ategie
s.
Memb
ersh
ip of
SGW
CPFA
co
mmitte
es is
main
taine
d an
d pos
itions
filled
.
Indus
try an
d PIR
SA co
-ma
nage
ment
resp
onsib
ilities
fulfil
led as
pe
r co-
mana
geme
nt ag
reem
ent.
Fishin
g stra
tegies
are s
et in
acco
rdan
ce w
ith th
e Har
vest
Stra
tegy.
Fishin
g stra
tegies
that
set th
e gu
idelin
es fo
r fish
ing op
erati
ons a
re
in lin
e with
the a
ims a
nd
mana
geme
nt fra
mewo
rk de
scrib
ed
in the
Har
vest
Stra
tegy.
Fishin
g stra
tegies
are s
et in
acco
rdan
ce w
ith th
e Ha
rvest
Stra
tegy.
4b M
anag
emen
t ar
rang
emen
ts su
ppor
t co
hesio
n and
co
nnec
tedne
ss be
twee
n fis
herie
s ind
ustry
and w
ider
comm
unity
.
4bi.
Stak
ehold
er in
put to
the m
anag
emen
t of th
e fish
ery,
throu
gh es
tablis
hed c
o-ma
nage
ment
proc
esse
s.
4bii.
Comm
unica
te ma
nage
ment
arra
ngem
ents
to the
wi
der c
ommu
nity.
Mana
geme
nt eff
ectiv
enes
s.
Fishin
g Ind
ustry
re
lation
ship
with
comm
unity
.
Gove
rnan
ce –
Othe
rs (N
GOs).
Ensu
re st
akeh
older
s are
inv
olved
in de
velop
ment
of ma
nage
ment
arra
ngem
ents
throu
gh m
ainten
ance
of co
-ma
nage
ment
arra
ngem
ents.
Mana
geme
nt ar
rang
emen
ts all
ow co
mmer
cial o
pera
tors t
o ma
ximise
oper
ation
al fle
xibilit
y.
Non-
fishin
g stak
ehold
er
posit
ions m
aintai
ned o
n SG
WCP
FA R
esea
rch
Subc
ommi
ttee.
Mana
geme
nt inf
orma
tion i
s av
ailab
le on
PIR
SA w
ebsit
e.
The S
GWCP
FA’s
Mana
geme
nt Co
mmitte
e and
its R
esea
rch
Subc
ommi
ttee p
rovid
e adv
ice to
PI
RSA
on fis
herie
s rela
ted is
sues
un
der f
orma
l a co
-man
agem
ent
agre
emen
t.
Fishin
g stra
tegies
as de
scrib
ed in
the
Har
vest
Stra
tegy a
re de
velop
ed
in co
llabo
ratio
n with
the
SGW
CPFA
.
Infor
matio
n rela
ted to
man
agem
ent
of the
fishe
ry is
corre
ct an
d rele
vant
on P
IRSA
web
site.
Memb
ersh
ip of
indus
try an
d no
n-ind
ustry
stak
ehold
ers
on S
GWCP
FA co
mmitte
es
is ma
intain
ed.
Co-m
anag
emen
t ar
rang
emen
ts be
twee
n SG
WCP
FA an
d go
vern
ment
are m
aintai
ned.
Fishin
g stra
tegies
are
deve
loped
thro
ugh t
he
SGW
CPFA
.
PIRS
A we
bsite
infor
matio
n is
upda
ted as
requ
ired.
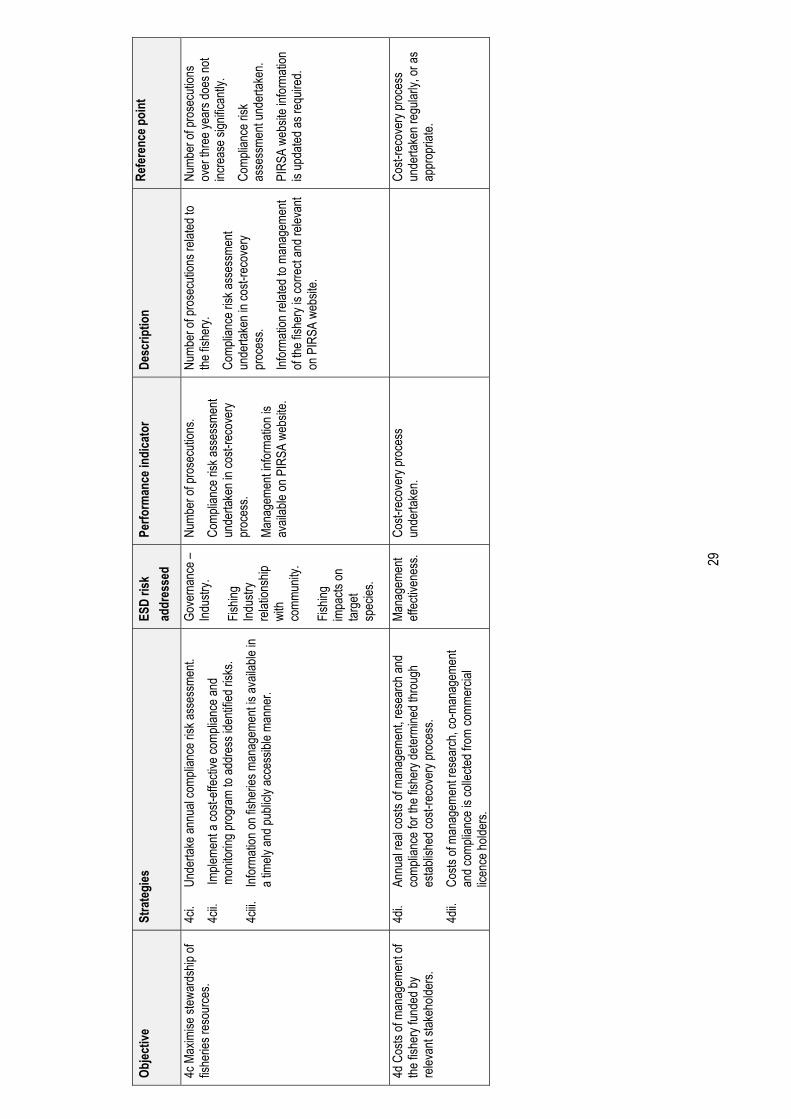
29
Objec
tive
Stra
tegi
es
ESD
risk
addr
esse
d Pe
rform
ance
indi
cato
r De
scrip
tion
Re
fere
nce p
oint
4c M
axim
ise st
ewar
dship
of
fishe
ries r
esou
rces.
4ci.
Unde
rtake
annu
al co
mplia
nce r
isk as
sess
ment.
4cii.
Imple
ment
a cos
t-effe
ctive
comp
lianc
e and
mo
nitor
ing pr
ogra
m to
addr
ess i
denti
fied r
isks.
4ciii.
Inf
orma
tion o
n fish
eries
man
agem
ent is
avail
able
in a t
imely
and p
ublic
ly ac
cess
ible m
anne
r.
Gove
rnan
ce –
Indus
try.
Fishin
g Ind
ustry
re
lation
ship
with
comm
unity
.
Fishin
g im
pacts
on
targe
t sp
ecies
.
Numb
er of
pros
ecuti
ons.
Comp
lianc
e risk
asse
ssme
nt un
derta
ken i
n cos
t-rec
over
y pr
oces
s.
Mana
geme
nt inf
orma
tion i
s av
ailab
le on
PIR
SA w
ebsit
e.
Numb
er of
pros
ecuti
ons r
elated
to
the fis
hery.
Comp
lianc
e risk
asse
ssme
nt un
derta
ken i
n cos
t-rec
over
y pr
oces
s.
Infor
matio
n rela
ted to
man
agem
ent
of the
fishe
ry is
corre
ct an
d rele
vant
on P
IRSA
web
site.
Numb
er of
pros
ecuti
ons
over
thre
e yea
rs do
es no
t inc
reas
e sign
ifican
tly.
Comp
lianc
e risk
as
sess
ment
unde
rtake
n.
PIRS
A we
bsite
infor
matio
n is
upda
ted as
requ
ired.
4d C
osts
of ma
nage
ment
of the
fishe
ry fun
ded b
y re
levan
t stak
ehold
ers.
4di.
Annu
al re
al co
sts of
man
agem
ent, r
esea
rch an
d co
mplia
nce f
or th
e fish
ery d
eterm
ined t
hrou
gh
estab
lishe
d cos
t-rec
over
y pro
cess
.
4dii.
Costs
of m
anag
emen
t res
earch
, co-
mana
geme
nt an
d com
plian
ce is
colle
cted f
rom
comm
ercia
l lic
ence
holde
rs.
Mana
geme
nt eff
ectiv
enes
s.
Cost-
reco
very
proc
ess
unde
rtake
n.
Cost-
reco
very
proc
ess
unde
rtake
n reg
ularly
, or a
s ap
prop
riate.

30
7 CO-MANAGEMENT ARRANGEMENTS
Co-management is an arrangement whereby responsibilities and obligations for sustainable fisheries management are negotiated, shared and delegated at appropriate levels between government, the commercial fishing industry, recreational fishers, Aboriginal traditional fishers and other key stakeholders such as conservation groups (Neville 2008). Co-management is recognised as a collection of positions – starting from centralised government regulation with no industry input at one end to more autonomous management by industry groups and key stakeholders at the other, where government plays more of an audit role. Co-management is designed to achieve efficient regulatory practice (among many other things) and is by no means a way of industry or other key stakeholders avoiding regulatory scrutiny and influence.
PIRSA has adopted a Policy for the Co-Management of Fisheries in South Australia (PIRSA 2013b) to inform discussion with the wider commercial fishing industry and other stakeholder groups as to how best to promote and implement co-management. The policy proposes that implementation of a preferred co-management model should be through a phased approach through which industry and key stakeholders build their capacity over time and which allows for a government audit process to measure performance and success.
The SGWCPFA is recognised as the representative industry body for the commercial SGPF. The co-management arrangements for the fishery have been agreed between PIRSA Fisheries and Aquaculture and the SGWCPFA. The Minister has oversight of the management of the fishery under this management plan, but day-to-day management is conducted by PIRSA Fisheries and Aquaculture in collaboration with the SGWCPFA.
Core elements of the co-management arrangements for the fishery are: • The SGWCPFA Management Committee consists of an independent chair, industry
participants, SARDI and PIRSA.
• The committee develops fishing strategies according to the management plan for the SGPF, and provides guidance on the operation of the fishery.
• Documentation of association policy including:
− Management Committee code of conduct
− Committee-at-Sea charter
− Prawn survey contract
− Industry codes of practice and Bad Weather Deed
− Research and monitoring plan
• The Committee-at-Sea, made up of fishermen, makes real-time decisions about fishing in accordance with the fishing strategy established by the Management Committee, including decisions on temporarily closed areas.
• Participation of industry vessels in surveys and other data collection activities.

31
• The SGWCPFA has developed a working relationship with environmental non-governmental organisations, which is currently facilitated though the Conservation Council of South Australia, which sits on the SGWCPFA's Research Subcommittee.
• The SGWCPFA has a long history of meaningful and productive involvement in annual cost-recovery processes, and through those processes has invested heavily in co-management, as well as other innovative research and compliance programs.
• At-sea management of fishing activities is provided through section 79 notices that require authorisation of the SGWCPFA Coordinator-at-Sea for fishing to be undertaken.
The SGPF has been described as having a collaborative model of engagement (Neville 2008) and to some extent a delegated model (Hollamby et al. 2010). This finding was in recognition of the role of the SGWCPFA Management Committee and the Committee-at-Sea in managing and maintaining fishing operations and in participating in management decision-making, and the involvement of other stakeholders in association operations. This finding is consistent with the broad definitions of collaborative and delegated co-management arrangements as described in Hollamby et al. (2010) being:
• Collaborative: government and stakeholders jointly reach decisions with some functions potentially assigned or delegated.
• Delegated: government and stakeholders negotiate management decisions based on a management framework; functions are assigned or delegated to industry group under formal agreements.
The SGWCPFA and PIRSA will continue to pursue opportunities to improve the co-management arrangements for the SGPF in accordance with the principles provided in the Policy for the Co-Management of Fisheries in South Australia (PIRSA 2013b), in an effort to deliver sound, effective and efficient management outcomes. For example, the SGWCPFA is investigating options for economic optimisation and it is anticipated that PIRSA and the SGWCPFA will work together to consider the identified options.
32
8 ALLOCATION OF ACCESS BETWEEN SECTORS
8.1 Current allocated shares of the resource
The Act (43(2)(h)) provides that a management plan must specify the share of the fishery to be allocated to each fishing sector under the plan.
The Act (43(3)) also provides that, in determining the share of aquatic resources to be allocated to a particular fishing sector under the first management plan for an existing fishery, the share of aquatic resources to which that fishing sector had access at the time the Minister requested the preparation of the plan (based on the most recent information available to the Minister) must be taken into account.
The Minister formally requested preparation of this management plan on 17 June 2010. Therefore, this plan must take into account the share of the SGPF that the commercial fishing sector had access to on that date. Allocations for the recreational and Aboriginal traditional fishing sectors must be determined at the same time.
King Prawns and Balmain Bugs in Spencer Gulf are allocated 100% to the commercial sector – to reflect the existing recorded share of the resource between fishing sectors at the time the Minister requested preparation of the plan. Due to physical and regulatory limitations, access to prawns by recreational fishers is limited. The most recent survey recorded very minor harvest of prawns and no identified take of Balmain Bug by the non-commercial fishing sectors (Jones 2009).
The Act acknowledges Aboriginal or indigenous fishing in the form or Aboriginal traditional fishing. This is defined in part as being “non-commercial” in nature. It should be noted that, under the Act, the Minister may create separate management plans for Aboriginal traditional fishing where an Indigenous land-use agreements (ILUA) exists with any Native Title group. For the purposes of this Management Plan the nature and extent of Aboriginal traditional fishing for prawns and Balmain bugs in the Spencer Gulf region could not be ascertained at the time of preparing this management plan. Aboriginal fishing is not therefore represented in any individual manner separate to recreational fishing. Should the nature and extent of Aboriginal traditional fishing of these species in this region become evident the provisions of this plan can be reviewed.
It should be noted never the less that subject to meeting the requirements of section 211 of the Native Title Act 1993, indigenous fishers are entitled to take aquatic resources in SA outside requirements of the Fisheries Management Act 2007 provided that it is established that they are;
a. an Aboriginal person and native title holder in respect of the land/sea in which the activity is occurring
b. the fishing activity in question forms part of the exercise of their customary native rights and interests, and
c. the fishing activity was for the purpose of satisfying their personal, domestic, non-commercial community needs.
In respect of any future traditional fishing management arrangements for the taking of Prawns and Balmain Bugs they will be subject to any ILUA’s and Traditional Fishing Management plans and any claims of Native Title as they relate to the taking of aquatic resources in SA waters. These will be assessed on their merits and on a case by case basis taking into consideration the

33
circumstances raised at that time. Any necessary variation of this Management plan resulting from this can be ascertained at that time.
It should be noted that at the time of preparing this management plan there were no ILUAs for sea country in Spencer Gulf and of the Native Title claims that are registered, none have yet been finalised.
The shares allocated to each sector in relation to Southern Calamari at the State-wide level reflect those set out in the MSF management plan.
8.2 Spatial scale of allocation
When determining the shares of aquatic resources to be allocated, it is important to clarify the spatial extent of the fishery to which the allocation applies. Shares for a species may be allocated in a number of ways, such as through fishery boundaries, management regions, biological or stock boundaries, or a single allocation across the State.
The spatial scale used to allocate prawns and bugs in this management plan is the area of the SGPF, to best reflect management arrangements and stock boundaries.
Allocated shares of Southern Calamari in this plan are consistent with the shares that have been allocated in the MSF management plan at the State-wide level, providing a single allocation for each of the sectors.
8.3 Information used to allocate shares
Catch data used to allocate shares have been collected through commercial logbooks submitted in accordance with the regulations. For Southern Calamari, recreational data are set out in the report of the ‘Recreational Fishing Survey 2007-08 (Jones 2009).
Access to South Australia’s fisheries resources by Aboriginal communities under the Act will be provided through Aboriginal traditional fishing management plans where necessary. These plans may be developed by the Minister where an ILUA has been negotiated and a final settlement is in place in relation to a particular Native Title claim area with the relevant native title group. At the time of writing there are no ILUAs for sea country in Spencer Gulf region and of the Native title claims that are registered, none have yet been finalised.
Should the nature and extent of Aboriginal traditional fishing of Prawn and Balmain bug species in this region become evident the allocation provisions of this plan can be reviewed.
In this management plan, a share of access has been allocated in relation to Southern Calamari and set aside for the purpose of resolving Native Title claims. A nominal share of 1% has been made to the Aboriginal traditional sector.

34
8.4 Sector allocations
The shares allocated to each sector in relation to King Prawns and Balmain Bug in the SGPF are set out in Table 3.
Table 3: Shares of Spencer Gulf Prawn Fishery (SGPF) resources allocated to each fishing sector.
Species SGPF Other commercial Recreational Aboriginal traditional
King Prawns 100.0% 0.0% 0.0% 0.0%
Balmain Bug 100.0% 0.0% 0.0% 0.0%
The shares allocated to each sector in relation to Southern Calamari at the State-wide level reflect those set out in the MSF management plan (PIRSA 2013a).
Table 4: Shares of Southern Calamari allocated to each fishing sector at the State-wide level. Marine Scalefish Fishery (MSF), Northern Zone Rock Lobster Fishery (NZRLF), Gulf St Vincent Prawn Fishery (GSVPF), West Coast Prawn Fishery (WCP).
8.5 Allocation triggers
An important component of the allocation of shares is monitoring to identify a change in the relative value of those shares over time. The value of shares can be measured in a variety of ways, including catch and effort, economic value and social values. Measuring the social values of a fishery is an evolving area of natural resource management and there are no clearly identifiable indicators of social value that can be readily incorporated into an assessment of share value at this point in time. For these reasons, catch will be used as the indicator to measure changes in the value of shares, noting that catch has been used to determine the first shares in this management plan. Catch estimates are available annually for all commercial fisheries. Estimates of recreational catches will be available a minimum of once every five years from recreational fishing surveys.
Without recreational catch data it is not possible to undertake an accurate assessment of all sector allocations in years when recreational survey data is unavailable. Therefore, comprehensive reviews of all sector allocations will only be undertaken in years for which recreational catch information is available.
Species Commercial Recreational Aboriginal traditional
Southern Calamari
MSF 56%
37.4 1%
NZRL 0.45%
GSVP 0.45%
SGPF 4.6%
WCP 0.1%
Total 61.6% 37.4% 1%

35
Allocation trigger limits provide a benchmark for identifying if an allocation has been exceeded by a sector. This takes into account normal levels of variability. For King Prawns and Balmain Bug, as the commercial sector has been allocated more than 95% share, no commercial trigger limit has been set, as any fluctuations in relative catch would be considered within normal range.
For Southern Calamari, three trigger limits have been determined. Trigger limits have been set at a level that is commensurate with the initial allocation, and allow for variability in catches. Where a sector has been allocated over 91%, no trigger limit (Trigger 1) has been set as any shares greater than this amount are considered to be within normal fluctuation ranges. Similarly, where a commercial sector has been allocated above 95%, no commercial trigger limit (Trigger 2 and 3) has been set. More details on the trigger limit calculations are available in the MSF management plan (PIRSA 2013). The allocation triggers for Southern Calamari are set out in Table 5.
• Primary Trigger 1: exceed fishery sector allocation by relevant percentage in the assessment year (the year following the availability of recreational data).
• Primary Trigger 2 (commercial shares only): exceed commercial sector allocation by relevant percentage in three consecutive years or in four of the previous five years.
• Primary Trigger 3 (commercial shares only): exceed commercial sector allocation by relevant percentage in any one year.
Table 5: Allocation trigger limits (percentages – portion of harvest) for Southern Calamari. Marine Scalefish Fishery (MSF), Northern Zone Rock Lobster Fishery (NZRLF), Gulf St Vincent Prawn Fishery (GSVPF), West Coast Prawn Fishery (WCP), Aboriginal Traditional (ABT).
Southern calamari
MSF NZRL GSVP SGP WCP REC CHTR ABT Fishery Allocation
56.0 0.45 0.45 4.6 0.1 37.4 - 1.0
Trigger 1 61.6 1.0 1.0 7.5 1.0 Commercial Allocation
90.91 0.73 0.73 7.47 0.16
Trigger 2 92.7 1.46 1.46 8.2 0.75 Trigger 3 95.4 2.19 2.19 11.2 1.0
8.6 Review of allocations
The Act requires that each management plan, in addition to allocating shares, also outlines the framework for adjusting shares in the future. Specifically Section 43(2)(i) and (j) provide that a management plan must:
1. Prescribe a method, or establish an open and transparent process for determining the method for adjusting allocations of aquatic resources between the different fishing sectors during the term of the plan.
2. Provide that compensation will be paid to persons whose licences or licence entitlements are compulsorily acquired in order to reduce the share of aquatic resources allocated to the commercial fishing sector and increase the share allocated to another sector.
36
Allocations between sectors may be reviewed in accordance with the Allocation Policy (PIRSA 2011) and under the following scenarios:
1. A review of the management plan, which will reassess the appropriateness of shares and may trigger an adjustment.
2. One or more sectors exceed their allocation of King Prawns, Balmain Bug or, in accordance with the allocation triggers for Southern Calamari in the MSF management plan.
3. A major change in the management of a species and/or a sector that results in a shift of allocations to a sector(s), including the making of an Aboriginal traditional fishing management plan.
The declaration of a Marine Protected Area that would result in a reallocation of shares would be given effect through the Marine Parks Act 2007 and policies applying under that Act. That Act provides that compensation may be paid to licensed fishers affected by the closure of an area or restrictions of activities within a marine park.
8.6.1 Review process
The process to review allocations will be conducted in a two-staged approach. The first stage is an initial assessment to determine whether a full assessment is necessary or appropriate.
8.6.2 Initial assessment
The initial assessment will be conducted by PIRSA in consultation with relevant sectors of the fishery. Once the need for a review has been recognised an assessment committee will be established. The committee will be required to assess the need for a second-stage assessment based on the following:
• Has there been a shift in the access value of the fishery or is new information available that suggests a reallocation of shares would bring additional social and economic benefits to the State?
• If a trigger limit has been breached, can the breach be readily explained and justified?
• Is the potential change in shares significant and considered long term? A minor shift/anomaly may not require a full review.
A written report is to be prepared by the committee, with a recommendation to proceed to a full assessment or not. PIRSA will determine whether to move to a full assessment or may refer a recommendation to the Minister.
8.6.3 Full assessment
As with the initial assessment, a full assessment of allocation will be conducted by PIRSA in consultation with relevant stakeholders. An evaluation panel is to be established including independent experts as required.
The panel needs to evaluate how the value of one or more sectors is changing and the likely trends in the future. In the context of these changes, all options being considered should be evaluated against the option of maintaining the status quo and the potential flow-on effects with regard to:
37
• Contribution to GSP.
• Contribution to employment.
• Access for consumers to fresh seafood.
• Maintenance, growth and wellbeing of regional communities.
• Health impacts.
• Sport and recreation opportunities.
• Consistency with tourism policies.
• Other criteria relevant to the fishery.
8.6.4 Assessment outcomes
Following the full assessment, the Allocation Policy (PIRSA 2011) provides that the review panel may recommend to the Minister one of two actions, either:
• Manage each sector within the existing allocated shares.
• Proceed to adjust shares.
8.6.5 Process for managing within existing shares
If shares are to be maintained between all sectors, it may be necessary, depending on the circumstances, to alter the catch of one or more sectors. To determine the appropriate mechanism to re-establish initial allocations, the existing co-management arrangements will be used to develop a preferred option.
Adjusting commercial shares within the SGPF, if required, is likely to be achieved through a variety of controls consistent with current management arrangements such as seasonal and area closures. Managing adjustments to the recreational allocation, if necessary, would require consideration of current management arrangements.
8.6.6 Process for adjusting allocations
The following points are provided to guide an allocation adjustment process: • Adjustments to the shares will, in the first instance, be implemented through a voluntary
process and through direct negotiations between the relevant sectors. Where possible, market mechanisms will be used to give effect to adjustments in share. Where there are no or limited market mechanisms available, adjustments to shares will be made in a similar manner used to manage shares within existing allocations.
• If agreement cannot be reached, a process of compulsory acquisition may occur in accordance with the Allocation Policy. Acquisition of entitlements will be compensated in accordance with the provisions of the Allocation Policy. Adjustments are to be finalised within two years.
38
9 HARVEST STRATEGY
9.1 Overview
This Harvest Strategy provides a structured framework for decision-making that specifies pre-determined management actions necessary for the Spencer Gulf Prawn Fishery (SGPF) to achieve the ecologically sustainable development (ESD) objectives of the Fisheries Management Act.
Consistent with national guidelines (Sloan et al. 2014), this Harvest Strategy brings together all of the key scientific monitoring, assessment and management elements to form an integrated package to make decisions about the level of fishing intensity that should be applied to the King Prawn stock in Spencer Gulf.
Monitoring of the fishery is achieved through three fishery independent stock assessment surveys (SASs) as well as industry at-sea monitoring of fishing catch and effort through a co-management arrangement with the Spencer Gulf and West Coast Prawn Fishermen’s Association (SGWCPFA).
The fishery is assessed against the sustainability and economic aims described in this Harvest Strategy. Consistent with the Fisheries Management Act, the principle of ecological sustainability has priority over the other principles of ESD; hence the sustainability aim is the primary assessment focus for the Harvest Strategy. Assessment outcomes lead to an annual stock status being determined for the fishery, which is reported in the annual stock assessment report.
Biological performance indicators (PIs) provide information about the biological state of the fishery. A performance indicator (PI) can be measured and monitored to assess if an objective is being met.
Reference levels are established for PIs as a reference against which performance of the indicator can be assessed. A reference level establishes a benchmark for sustainable fishery performance. PIs can be a direct measure of performance (e.g., total biomass of a stock) or a proxy considered an appropriate indicator of a direct measure (e.g., catch rates for indicating relative biomass).
9.1.1 Objectives
As set out in Section 6 objectives of this management plan in relation to sustainability are to ensure that management arrangements are sufficient to maintain relative spawning stock biomass of prawn stocks and future prawn biomass are maintained above sustainable levels and information collected is sufficient to manage fishing operations to sustainable levels.
Specifically, the operational objectives are to maintain average catch rates of adult-sized prawns based on all three fishery independent SASs in a fishing season above 68.2 kg/hr (2.5 lb/min) and the recruitment index above 35 kg/hr.
The Harvest Strategy has also been designed to allow for economic efficiency. The economic performance of this fishery is assessed in economic indicators reports conducted regularly by an economic service provider (see Econsearch 2011).

39
9.1.2 Management framework
The management elements of the Harvest Strategy that achieve these aims are a combination of input (effort) controls (i.e., fishing nights and spatial management) and output (catch) controls (i.e., fleet catch limits).
There is some complexity in the Harvest Strategy for this fishery as the strategy uses within-season management arrangements (termed ‘fishing strategies’) appropriate to the stock status set within an annual management framework.
The annual decision-making framework is based on the status of the stock determined from the primary biological indicator relative to the limit and trigger reference points for that indicator. The annual decision-making process is described in Section 9.2.
The within-season decision-making framework involves setting management arrangements that control catch or effort based on the status of the prawn stock. These within-season management arrangements have evolved from fishing operations described in previous management plans (MacDonald 1998) but used by the fishery before then, and have proven effective in maintaining stocks at sustainable levels. The within-season decision-making process is described in Section 9.3. The annual and within-season activities as part of this Harvest Strategy are depicted in Figure 6.
Some common terms used throughout this Harvest Strategy are provided here for clarity.
Fishing strategy: the rules that guide fishing operations during a fishing run, including pre-Christmas total allowable fleet catch, bucket counts and fleet catch rates. There will be a number of fishing strategies developed throughout the fishing season.
Fishing run: a period of fishing activity between quarters of the lunar cycle that include a new moon.
Bucket count: measure of prawn size derived from the number of prawns in a 7 kg sample monitored during SASs, industry spot surveys and at-sea monitoring of fishing strategies.
Figure 6: Timeline of annual and within-season decision-making. Note that fishing runs are only relevant to years when the fishery is assessed as being a ‘Sustainable’ or ‘Transitional’ fishery at Section 9.4.
Prev
ious
Sea
son’
s SA
S
Sept/Oct
Stock status
Nov
SASFishing
run
Dec
Fishing run
Jan
No Fishing
Feb
SASNo
Fishing
Mar
Fishing run
Apr
SASFishing
run
May
Fishing run
June
Fishing run
Sept/
OctNext
season’s Stock status
Pre-Season Pre-Christmas Post-Christmas
Annual Decision Making
Within-season Decision Making
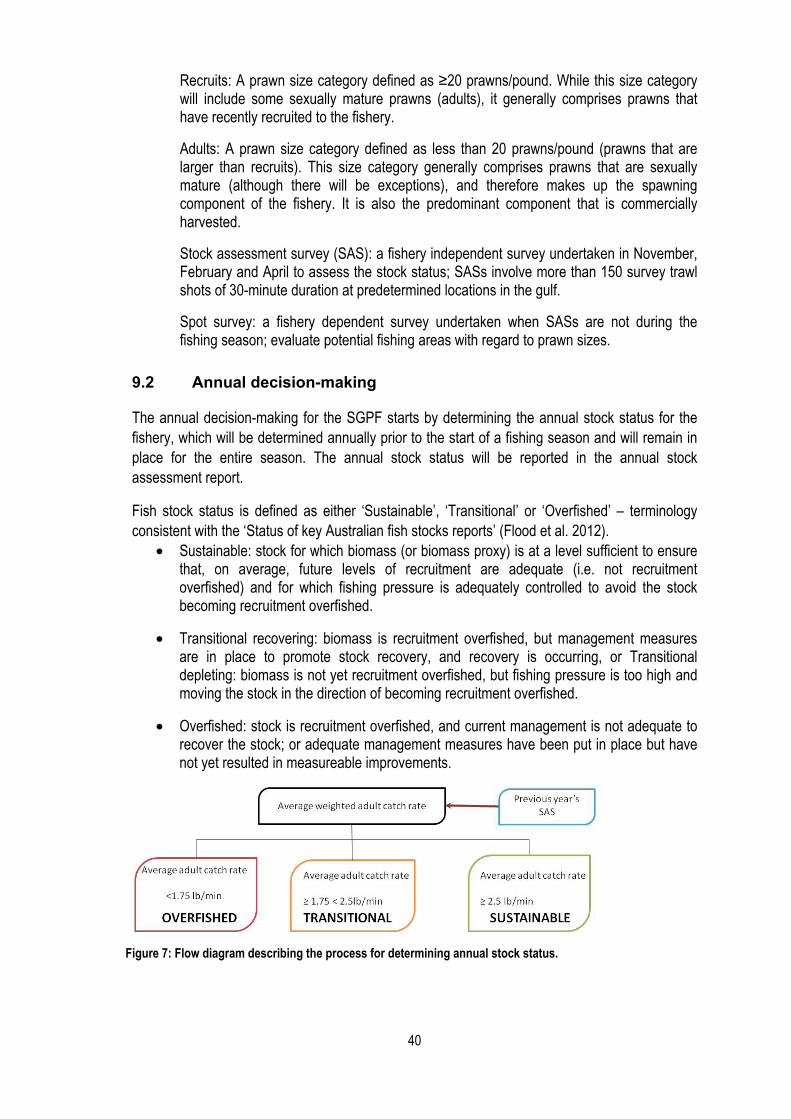
40
Recruits: A prawn size category defined as ≥20 prawns/pound. While this size category will include some sexually mature prawns (adults), it generally comprises prawns that have recently recruited to the fishery.
Adults: A prawn size category defined as less than 20 prawns/pound (prawns that are larger than recruits). This size category generally comprises prawns that are sexually mature (although there will be exceptions), and therefore makes up the spawning component of the fishery. It is also the predominant component that is commercially harvested.
Stock assessment survey (SAS): a fishery independent survey undertaken in November, February and April to assess the stock status; SASs involve more than 150 survey trawl shots of 30-minute duration at predetermined locations in the gulf.
Spot survey: a fishery dependent survey undertaken when SASs are not during the fishing season; evaluate potential fishing areas with regard to prawn sizes.
9.2 Annual decision-making
The annual decision-making for the SGPF starts by determining the annual stock status for the fishery, which will be determined annually prior to the start of a fishing season and will remain in place for the entire season. The annual stock status will be reported in the annual stock assessment report.
Fish stock status is defined as either ‘Sustainable’, ‘Transitional’ or ‘Overfished’ – terminology consistent with the ‘Status of key Australian fish stocks reports’ (Flood et al. 2012).
• Sustainable: stock for which biomass (or biomass proxy) is at a level sufficient to ensure that, on average, future levels of recruitment are adequate (i.e. not recruitment overfished) and for which fishing pressure is adequately controlled to avoid the stock becoming recruitment overfished.
• Transitional recovering: biomass is recruitment overfished, but management measures are in place to promote stock recovery, and recovery is occurring, or Transitional depleting: biomass is not yet recruitment overfished, but fishing pressure is too high and moving the stock in the direction of becoming recruitment overfished.
• Overfished: stock is recruitment overfished, and current management is not adequate to recover the stock; or adequate management measures have been put in place but have not yet resulted in measureable improvements.
Figure 7: Flow diagram describing the process for determining annual stock status.
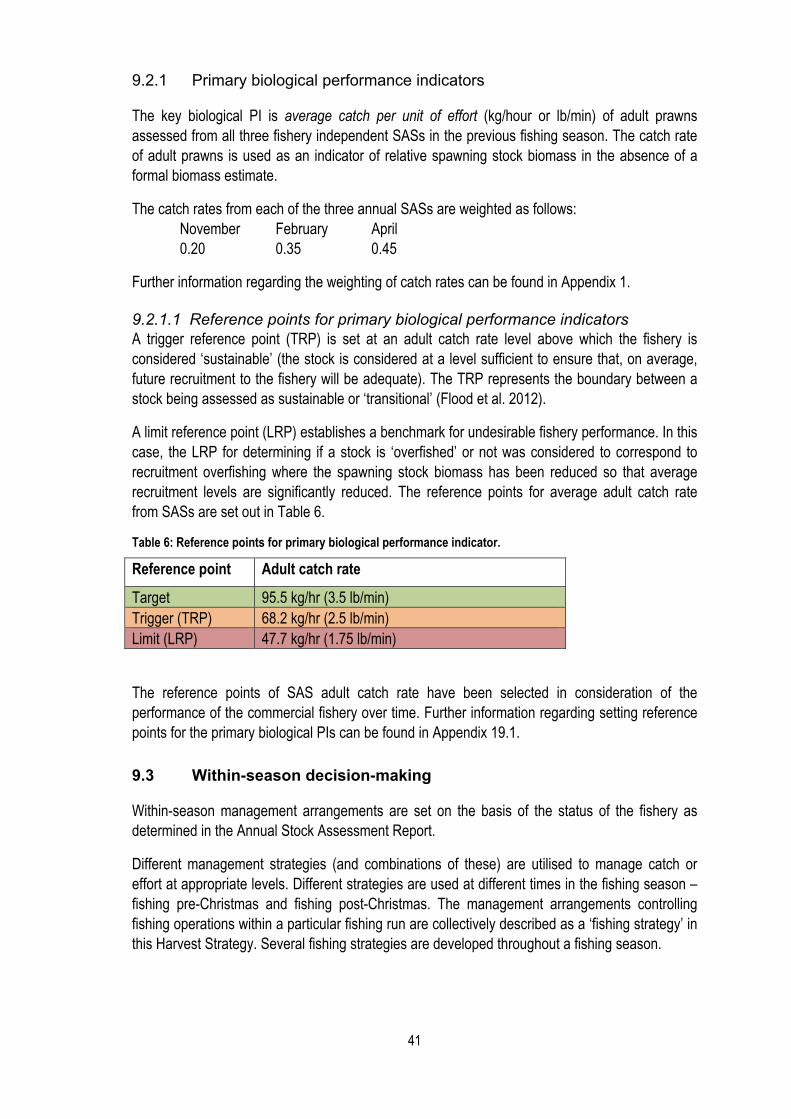
41
9.2.1 Primary biological performance indicators
The key biological PI is average catch per unit of effort (kg/hour or lb/min) of adult prawns assessed from all three fishery independent SASs in the previous fishing season. The catch rate of adult prawns is used as an indicator of relative spawning stock biomass in the absence of a formal biomass estimate.
The catch rates from each of the three annual SASs are weighted as follows: November February April 0.20 0.35 0.45
Further information regarding the weighting of catch rates can be found in Appendix 1.
9.2.1.1 Reference points for primary biological performance indicators A trigger reference point (TRP) is set at an adult catch rate level above which the fishery is considered ‘sustainable’ (the stock is considered at a level sufficient to ensure that, on average, future recruitment to the fishery will be adequate). The TRP represents the boundary between a stock being assessed as sustainable or ‘transitional’ (Flood et al. 2012).
A limit reference point (LRP) establishes a benchmark for undesirable fishery performance. In this case, the LRP for determining if a stock is ‘overfished’ or not was considered to correspond to recruitment overfishing where the spawning stock biomass has been reduced so that average recruitment levels are significantly reduced. The reference points for average adult catch rate from SASs are set out in Table 6.
Table 6: Reference points for primary biological performance indicator.
Reference point Adult catch rate
Target 95.5 kg/hr (3.5 lb/min) Trigger (TRP) 68.2 kg/hr (2.5 lb/min) Limit (LRP) 47.7 kg/hr (1.75 lb/min)
The reference points of SAS adult catch rate have been selected in consideration of the performance of the commercial fishery over time. Further information regarding setting reference points for the primary biological PIs can be found in Appendix 19.1.
9.3 Within-season decision-making
Within-season management arrangements are set on the basis of the status of the fishery as determined in the Annual Stock Assessment Report.
Different management strategies (and combinations of these) are utilised to manage catch or effort at appropriate levels. Different strategies are used at different times in the fishing season – fishing pre-Christmas and fishing post-Christmas. The management arrangements controlling fishing operations within a particular fishing run are collectively described as a ‘fishing strategy’ in this Harvest Strategy. Several fishing strategies are developed throughout a fishing season.

42
The management strategies for the SGPF are broadly described below. For a fishery assessed as being Sustainable, fishing strategies are:
• Set a total allowable catch for pre-Christmas fishing.
• Set areas of fishing based on target prawn size.
• Maintain minimum fleet catch rates post-Christmas.
The decision rules for developing and maintain fishing strategies for a Sustainable Fishery are described in Section 9.4.2.
For fishery assessed as Transitional, fishing strategies are: • Set a total maximum number of nights allowed for fishing for the whole season.
• Within that allowable seasonal nights fishing, set a maximum number of nights that can be fished pre-Christmas.
• Set areas of fishing based on target prawn size.
The decision rules for developing and maintain fishing strategies for a Transitional Fishery are described in Section 9.4.3.
For a fishery assessed as being overfished, no fishing will be allowed for the fishing season (see Section 9.4.4).
Fishery survey results are used throughout the fishing season to inform within-season decision-making. The surveys include fishery independent SASs as well as spot surveys (for further details see Section 11.2). In general, survey results inform the setting of appropriate fishing strategy levels, setting maximum allowable nights fishing (pre-Christmas and for the whole season) and maximum allowable catch (pre-Christmas), as well as identifying fishing areas that meet target prawn size. Spot surveys are used to identify fishing areas that meet target prawn size in the months when SASs are not conducted. The framework of within-season decision-making is depicted in Figure 8.
Fishing Strategy•Target prawn size•Min fleet catch rates
Fishery Stock Status
No Fishing
SUSTAINABLETRANSITIONALOVERFISHED
Fishing Strategy• Catch cap•Target prawn size
Pre-Christmas
Post- Christmas
Fishing Strategy• Max. allowable nights•Target prawn size
Fishing Strategy• Total Allowable Season nights fishing•240 prawns/7kg
No Fishing
Figure 8: Framework of within-season decision-making.
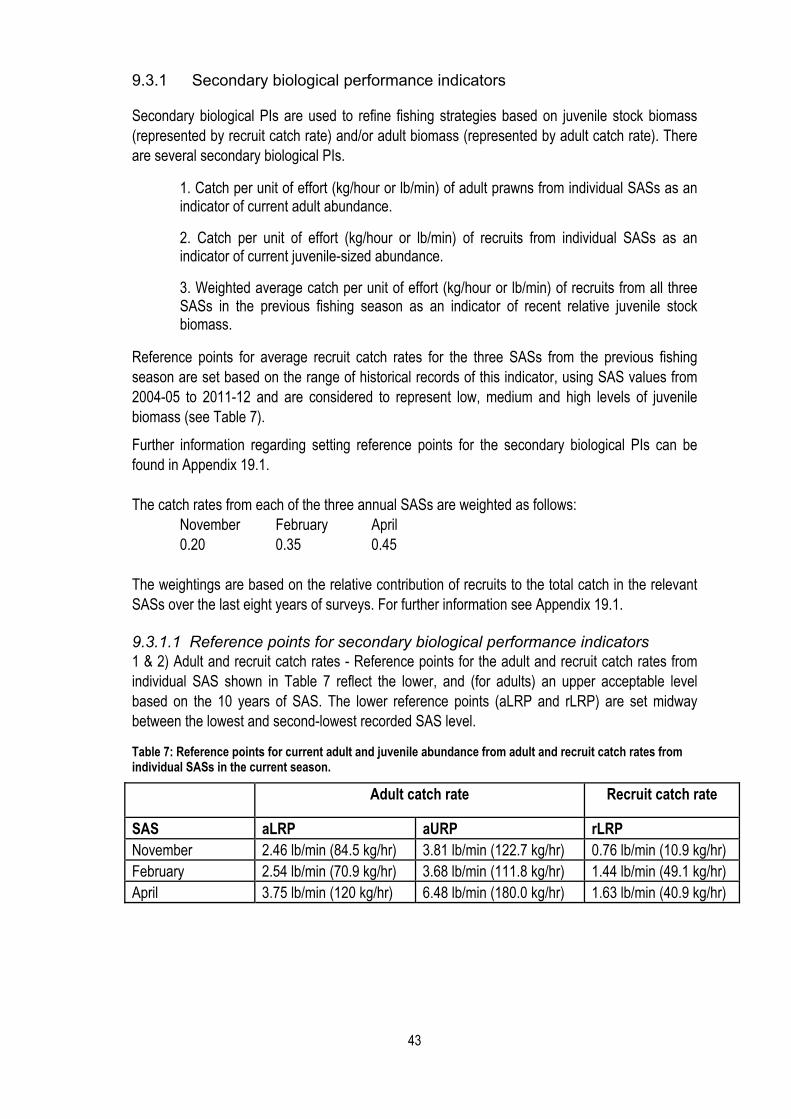
43
9.3.1 Secondary biological performance indicators
Secondary biological PIs are used to refine fishing strategies based on juvenile stock biomass (represented by recruit catch rate) and/or adult biomass (represented by adult catch rate). There are several secondary biological PIs.
1. Catch per unit of effort (kg/hour or lb/min) of adult prawns from individual SASs as an indicator of current adult abundance.
2. Catch per unit of effort (kg/hour or lb/min) of recruits from individual SASs as an indicator of current juvenile-sized abundance.
3. Weighted average catch per unit of effort (kg/hour or lb/min) of recruits from all three SASs in the previous fishing season as an indicator of recent relative juvenile stock biomass.
Reference points for average recruit catch rates for the three SASs from the previous fishing season are set based on the range of historical records of this indicator, using SAS values from 2004-05 to 2011-12 and are considered to represent low, medium and high levels of juvenile biomass (see Table 7).
Further information regarding setting reference points for the secondary biological PIs can be found in Appendix 19.1. The catch rates from each of the three annual SASs are weighted as follows:
November February April 0.20 0.35 0.45
The weightings are based on the relative contribution of recruits to the total catch in the relevant SASs over the last eight years of surveys. For further information see Appendix 19.1.
9.3.1.1 Reference points for secondary biological performance indicators 1 & 2) Adult and recruit catch rates - Reference points for the adult and recruit catch rates from individual SAS shown in Table 7 reflect the lower, and (for adults) an upper acceptable level based on the 10 years of SAS. The lower reference points (aLRP and rLRP) are set midway between the lowest and second-lowest recorded SAS level.
Table 7: Reference points for current adult and juvenile abundance from adult and recruit catch rates from individual SASs in the current season.
Adult catch rate Recruit catch rate
SAS aLRP aURP rLRP November 2.46 lb/min (84.5 kg/hr) 3.81 lb/min (122.7 kg/hr) 0.76 lb/min (10.9 kg/hr) February 2.54 lb/min (70.9 kg/hr) 3.68 lb/min (111.8 kg/hr) 1.44 lb/min (49.1 kg/hr) April 3.75 lb/min (120 kg/hr) 6.48 lb/min (180.0 kg/hr) 1.63 lb/min (40.9 kg/hr)
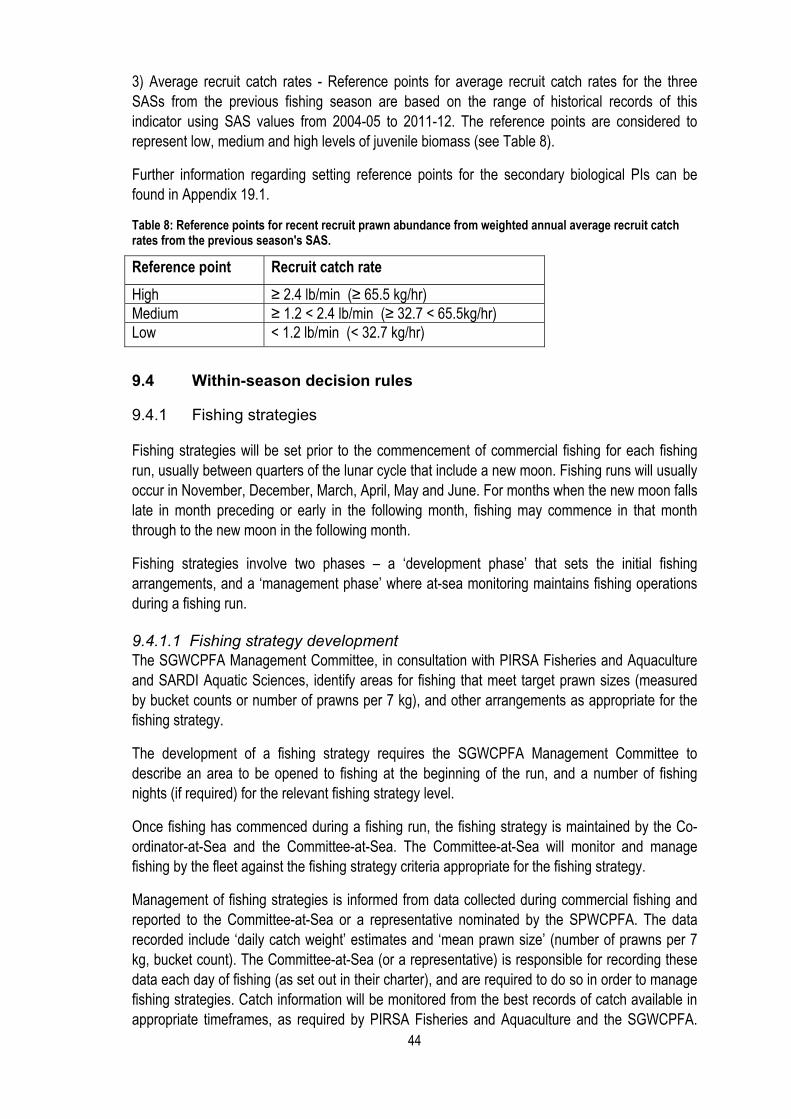
44
3) Average recruit catch rates - Reference points for average recruit catch rates for the three SASs from the previous fishing season are based on the range of historical records of this indicator using SAS values from 2004-05 to 2011-12. The reference points are considered to represent low, medium and high levels of juvenile biomass (see Table 8).
Further information regarding setting reference points for the secondary biological PIs can be found in Appendix 19.1.
Table 8: Reference points for recent recruit prawn abundance from weighted annual average recruit catch rates from the previous season's SAS.
Reference point Recruit catch rate High ≥ 2.4 lb/min (≥ 65.5 kg/hr) Medium ≥ 1.2 < 2.4 lb/min (≥ 32.7 < 65.5kg/hr) Low < 1.2 lb/min (< 32.7 kg/hr)
9.4 Within-season decision rules
9.4.1 Fishing strategies
Fishing strategies will be set prior to the commencement of commercial fishing for each fishing run, usually between quarters of the lunar cycle that include a new moon. Fishing runs will usually occur in November, December, March, April, May and June. For months when the new moon falls late in month preceding or early in the following month, fishing may commence in that month through to the new moon in the following month.
Fishing strategies involve two phases – a ‘development phase’ that sets the initial fishing arrangements, and a ‘management phase’ where at-sea monitoring maintains fishing operations during a fishing run.
9.4.1.1 Fishing strategy development The SGWCPFA Management Committee, in consultation with PIRSA Fisheries and Aquaculture and SARDI Aquatic Sciences, identify areas for fishing that meet target prawn sizes (measured by bucket counts or number of prawns per 7 kg), and other arrangements as appropriate for the fishing strategy.
The development of a fishing strategy requires the SGWCPFA Management Committee to describe an area to be opened to fishing at the beginning of the run, and a number of fishing nights (if required) for the relevant fishing strategy level.
Once fishing has commenced during a fishing run, the fishing strategy is maintained by the Co-ordinator-at-Sea and the Committee-at-Sea. The Committee-at-Sea will monitor and manage fishing by the fleet against the fishing strategy criteria appropriate for the fishing strategy.
Management of fishing strategies is informed from data collected during commercial fishing and reported to the Committee-at-Sea or a representative nominated by the SPWCPFA. The data recorded include ‘daily catch weight’ estimates and ‘mean prawn size’ (number of prawns per 7 kg, bucket count). The Committee-at-Sea (or a representative) is responsible for recording these data each day of fishing (as set out in their charter), and are required to do so in order to manage fishing strategies. Catch information will be monitored from the best records of catch available in appropriate timeframes, as required by PIRSA Fisheries and Aquaculture and the SGWCPFA.
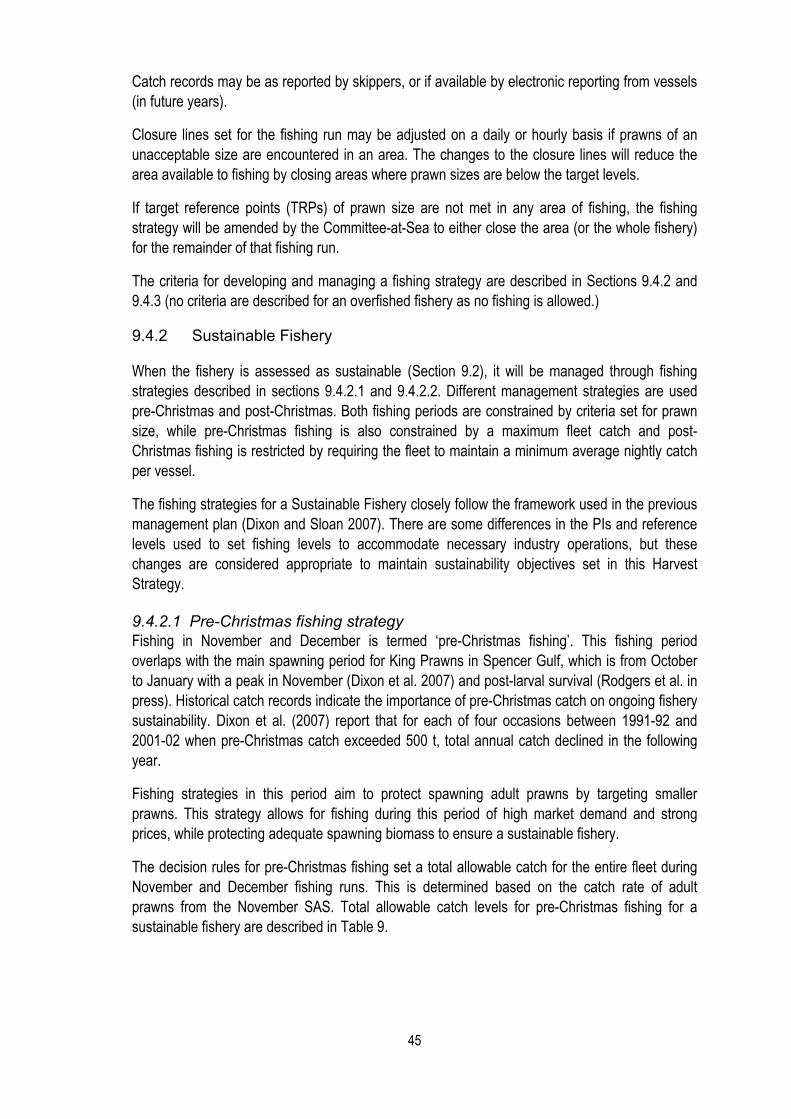
45
Catch records may be as reported by skippers, or if available by electronic reporting from vessels (in future years).
Closure lines set for the fishing run may be adjusted on a daily or hourly basis if prawns of an unacceptable size are encountered in an area. The changes to the closure lines will reduce the area available to fishing by closing areas where prawn sizes are below the target levels.
If target reference points (TRPs) of prawn size are not met in any area of fishing, the fishing strategy will be amended by the Committee-at-Sea to either close the area (or the whole fishery) for the remainder of that fishing run.
The criteria for developing and managing a fishing strategy are described in Sections 9.4.2 and 9.4.3 (no criteria are described for an overfished fishery as no fishing is allowed.)
9.4.2 Sustainable Fishery
When the fishery is assessed as sustainable (Section 9.2), it will be managed through fishing strategies described in sections 9.4.2.1 and 9.4.2.2. Different management strategies are used pre-Christmas and post-Christmas. Both fishing periods are constrained by criteria set for prawn size, while pre-Christmas fishing is also constrained by a maximum fleet catch and post-Christmas fishing is restricted by requiring the fleet to maintain a minimum average nightly catch per vessel.
The fishing strategies for a Sustainable Fishery closely follow the framework used in the previous management plan (Dixon and Sloan 2007). There are some differences in the PIs and reference levels used to set fishing levels to accommodate necessary industry operations, but these changes are considered appropriate to maintain sustainability objectives set in this Harvest Strategy.
9.4.2.1 Pre-Christmas fishing strategy Fishing in November and December is termed ‘pre-Christmas fishing’. This fishing period overlaps with the main spawning period for King Prawns in Spencer Gulf, which is from October to January with a peak in November (Dixon et al. 2007) and post-larval survival (Rodgers et al. in press). Historical catch records indicate the importance of pre-Christmas catch on ongoing fishery sustainability. Dixon et al. (2007) report that for each of four occasions between 1991-92 and 2001-02 when pre-Christmas catch exceeded 500 t, total annual catch declined in the following year.
Fishing strategies in this period aim to protect spawning adult prawns by targeting smaller prawns. This strategy allows for fishing during this period of high market demand and strong prices, while protecting adequate spawning biomass to ensure a sustainable fishery.
The decision rules for pre-Christmas fishing set a total allowable catch for the entire fleet during November and December fishing runs. This is determined based on the catch rate of adult prawns from the November SAS. Total allowable catch levels for pre-Christmas fishing for a sustainable fishery are described in Table 9.
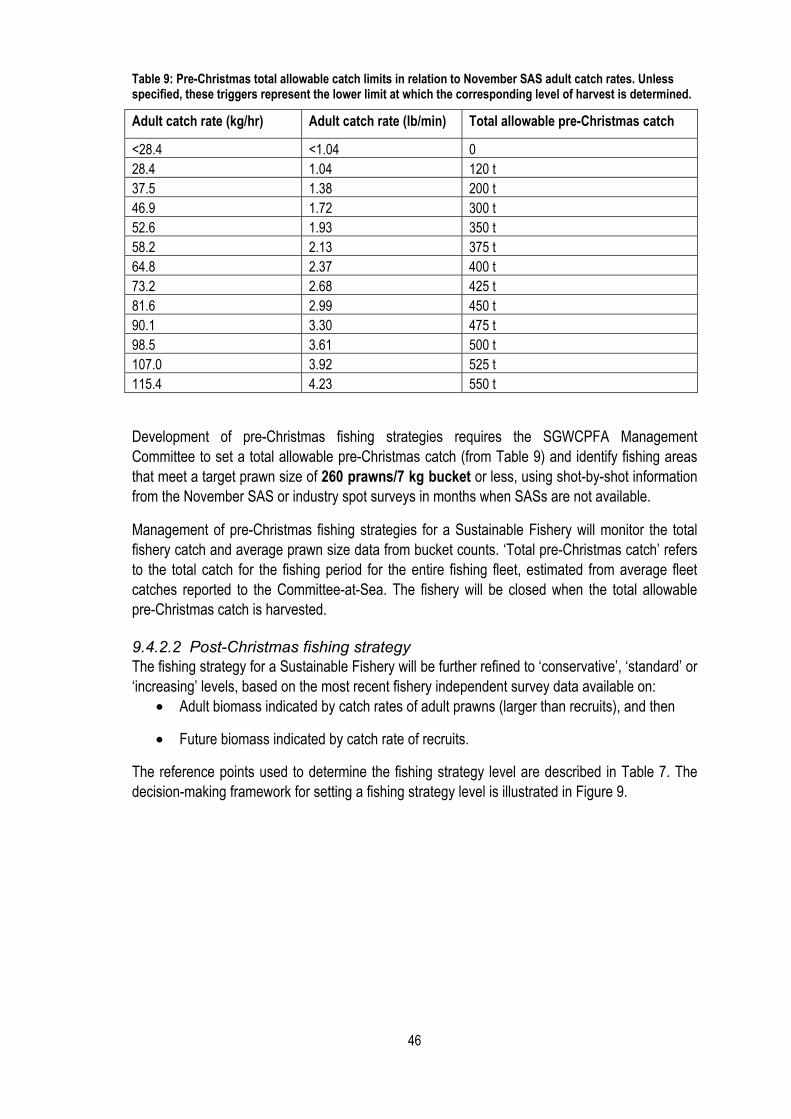
46
Table 9: Pre-Christmas total allowable catch limits in relation to November SAS adult catch rates. Unless specified, these triggers represent the lower limit at which the corresponding level of harvest is determined.
Adult catch rate (kg/hr) Adult catch rate (lb/min) Total allowable pre-Christmas catch
<28.4 <1.04 0 28.4 1.04 120 t 37.5 1.38 200 t 46.9 1.72 300 t 52.6 1.93 350 t 58.2 2.13 375 t 64.8 2.37 400 t 73.2 2.68 425 t 81.6 2.99 450 t 90.1 3.30 475 t 98.5 3.61 500 t 107.0 3.92 525 t 115.4 4.23 550 t
Development of pre-Christmas fishing strategies requires the SGWCPFA Management Committee to set a total allowable pre-Christmas catch (from Table 9) and identify fishing areas that meet a target prawn size of 260 prawns/7 kg bucket or less, using shot-by-shot information from the November SAS or industry spot surveys in months when SASs are not available.
Management of pre-Christmas fishing strategies for a Sustainable Fishery will monitor the total fishery catch and average prawn size data from bucket counts. ‘Total pre-Christmas catch’ refers to the total catch for the fishing period for the entire fishing fleet, estimated from average fleet catches reported to the Committee-at-Sea. The fishery will be closed when the total allowable pre-Christmas catch is harvested.
9.4.2.2 Post-Christmas fishing strategy The fishing strategy for a Sustainable Fishery will be further refined to ‘conservative’, ‘standard’ or ‘increasing’ levels, based on the most recent fishery independent survey data available on:
• Adult biomass indicated by catch rates of adult prawns (larger than recruits), and then
• Future biomass indicated by catch rate of recruits.
The reference points used to determine the fishing strategy level are described in Table 7. The decision-making framework for setting a fishing strategy level is illustrated in Figure 9.
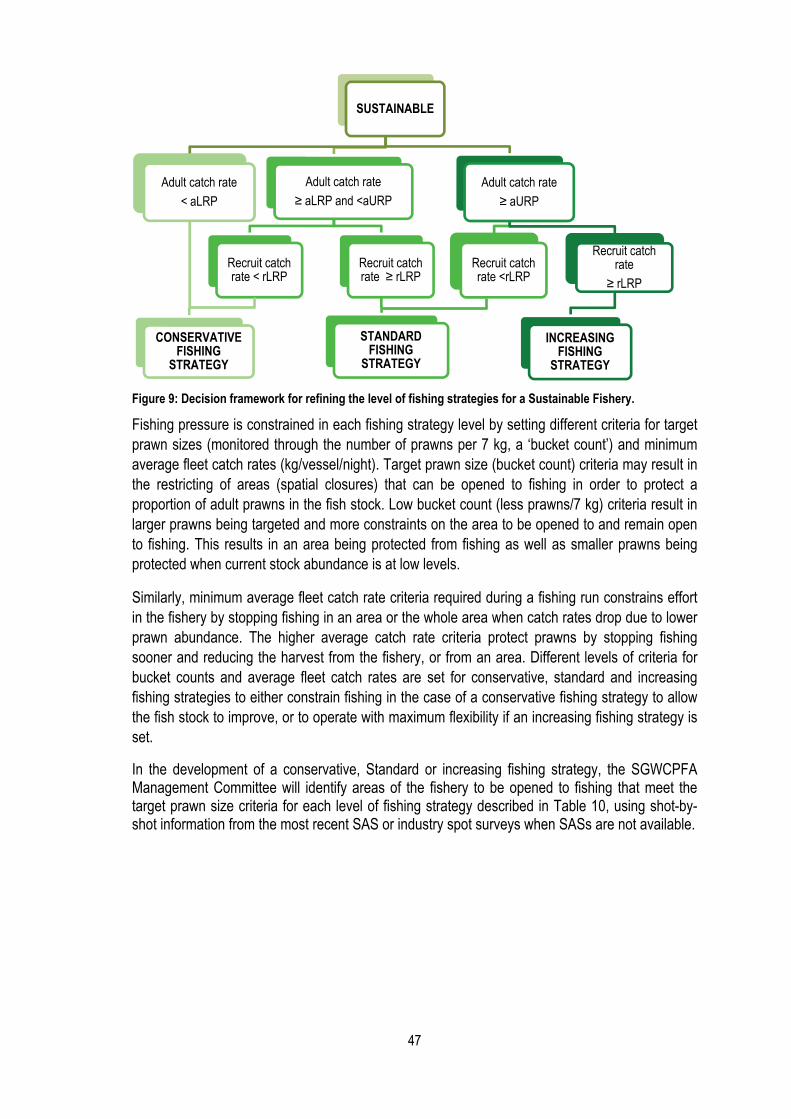
47
Figure 9: Decision framework for refining the level of fishing strategies for a Sustainable Fishery.
Fishing pressure is constrained in each fishing strategy level by setting different criteria for target prawn sizes (monitored through the number of prawns per 7 kg, a ‘bucket count’) and minimum average fleet catch rates (kg/vessel/night). Target prawn size (bucket count) criteria may result in the restricting of areas (spatial closures) that can be opened to fishing in order to protect a proportion of adult prawns in the fish stock. Low bucket count (less prawns/7 kg) criteria result in larger prawns being targeted and more constraints on the area to be opened to and remain open to fishing. This results in an area being protected from fishing as well as smaller prawns being protected when current stock abundance is at low levels.
Similarly, minimum average fleet catch rate criteria required during a fishing run constrains effort in the fishery by stopping fishing in an area or the whole area when catch rates drop due to lower prawn abundance. The higher average catch rate criteria protect prawns by stopping fishing sooner and reducing the harvest from the fishery, or from an area. Different levels of criteria for bucket counts and average fleet catch rates are set for conservative, standard and increasing fishing strategies to either constrain fishing in the case of a conservative fishing strategy to allow the fish stock to improve, or to operate with maximum flexibility if an increasing fishing strategy is set.
In the development of a conservative, Standard or increasing fishing strategy, the SGWCPFA Management Committee will identify areas of the fishery to be opened to fishing that meet the target prawn size criteria for each level of fishing strategy described in Table 10, using shot-by-shot information from the most recent SAS or industry spot surveys when SASs are not available.
SUSTAINABLE
Adult catch rate≥ aURP
Recruit catch rate
≥ rLRP
INCREASING FISHING
STRATEGY
Recruit catch rate <rLRP
Adult catch rate< aLRP
CONSERVATIVE FISHING
STRATEGY
Adult catch rate ≥ aLRP and <aURP
Recruit catch rate < rLRP
Recruit catch rate ≥ rLRP
STANDARD FISHING
STRATEGY

48
Table 10: Target levels for a developing a fishing strategy for a Sustainable Fishery.
Strategy CONS. STAND. INC. CONS. STAND. INC.
March/April (pre survey) April (post survey)/ May/JuneMid/North Gulf
Bucket counts (no. prawns/7 kg)
220 240 260 240 260 260
Southern Gulf
Bucket counts (no. prawns/7 kg)
230 260 260 240 260 260
Over two consecutive nights in Southern Gulf area only
Over two consecutive nights in Southern Gulf area only
Two areas in Spencer Gulf have been identified by industry as having differing characteristics and relative contributions to fishery sustainability, and therefore require different target bucket counts (defined in Table 10) and minimum fleet catches required to maintain fishing (described in Table 11. These areas are referred to as the Mid/North Gulf and the Southern Gulf, and are defined as:
Mid/North Gulf – north of the Southern Gulf area.
Southern Gulf – south of the following coordinates: S33° 51.00’ E136° 40.00’ S34° 02.00’ E136° 51.00’ S34° 17.00’ E136° 43.00’ S34° 17.00’ E136° 51.00’ S34° 14.00’ E136° 55.00’ S34° 14.00’ E136° 57.00’ S34° 11.00’ E137° 01.00’ S34° 11.00’ E137° 30.00’
Management of post-Christmas fishing strategies for Sustainable Fisheries will monitor average fleet catch/vessel/night and average prawn size data from bucket counts. Prawn size data ensures that the fishing activities are effectively managed to reduce the risk of recruitment overfishing by reducing the capture of large amounts of small prawns. The target levels for adult prawn size (bucket counts) and average fleet catch for different levels of fishing strategies are set in Table 11.
When both areas are open to fishing, the fleet average catch will be calculated from all available vessels against the Mid/North catch rate and bucket count criteria (described in Table 11), regardless of where the vessels are fishing. If the Mid/North Gulf area is closed to fishing, the fleet average catch will be calculated from all available vessels against the Southern Gulf catch rate and bucket count criteria.

49
Table 11: Target levels for management of sustainable fishing strategies.
Strategy CONS. STAND. INC. CONS. STAND. INC. March/April (pre survey) April (post survey)/ May/JuneMid/North Gulf
Bucket counts (no. prawns/7 kg)
220 240 260 240 260 260
Fleet average catch kg/vessel/night
600 500 500 600 500 400
OR Bucket counts (no. prawns/7 kg)
200 220 240 220 240 260
Fleet average catch kg/vessel/night
400 400 400 400 400 400
Southern Gulf
Bucket counts (no. prawns/7 kg)
230 260 260 240 260 260
Fleet average catch kg/vessel/night
400 350 350 400 350 350
Over two consecutive nights in Southern Gulf area only
Over two consecutive nights in Southern Gulf area only
9.4.3 Transitional Fishery
A Transitional fishing strategy is required when prawn stocks are assessed as Transitional (defined in Section 9.2). Transitional fishing strategies limit fishing, giving stocks time to recover to sustainable levels. This strategy sets a total allowable number of nights fishing in a fishing season and for fishing pre-Christmas.
9.4.3.1 Setting number of fishing nights The number of nights fishing allowed for a fishing season for a Transitional Fishery is determined by the secondary biological PI of abundance of juvenile prawns (recruits), determined from weighted average recruit catch rate from the previous fishing season’s three SASs (as described in Section 9.3). Within the season’s total allowable fishing nights, a maximum number of nights that may be fished in November and December (pre-Christmas) will also be set (as described in Table 12) in recognition of the need to provide protection to adult spawning prawns during this period (see information on pre-Christmas fishing in section 9.4.2.1).
Table 12: Total allowable fishing nights for a Transitional Fishery, and maximum nights for fishing pre-Christmas.
Recent juvenile abundance level as determined Table 8.
Maximum allowable season fishing nights
Maximum allowable fishing nights pre-Christmas
High 37 11 Medium 31 9 Low 25 7
A ‘night’ in this Harvest Strategy refers to approximately 12 hours of trawling. Any fishing activity carried out over one night exceeding six hours will be considered a night’s fishing effort and will be deducted from the season’s and pre-Christmas (if applicable) allocated total number of fishing nights. Fishing for any part of a night less than 6 hours will be considered to be half a night’s
50
fishing and will be deducted from the season’s and pre-Christmas (if applicable) allocated total number of fishing nights.
9.4.3.2 Pre-Christmas fishing strategy Development of a fishing strategy for fishing pre-Christmas for a Transitional Fishery requires the SGWCPFA Management Committee to:
1. Set a number of fishing nights that does not exceed the number of remaining unfished nights from the pre-Christmas allocation as described in Table 12.
2. Identify areas to open to fishing that meet or exceed a target prawn size of 240 prawns/7 kg bucket using shot-by-shot information from the November SAS or industry spot surveys.
Management of pre-Christmas fishing strategies for a Transitional Fishery will monitor the total number of fishing nights fished and average prawn size data from bucket counts.
9.4.3.3 Post-Christmas fishing strategy Development of a fishing strategy for fishing post-Christmas for a Transitional Fishery requires the SGWCPFA Management Committee to:
1. Set a number of fishing nights that do not exceed the number of remaining unfished nights from the season’s allocation.
2. Identify areas to open to fishing that meet or exceed a target prawn size of 240 prawns/7 kg bucket using shot-by-shot information from the most recent SAS or industry spot surveys.
Management of pre-Christmas fishing strategies for a Transitional Fishery will monitor the total number of fishing nights fished and average prawn size data from bucket counts.
The fishery will be closed to fishing when the total number of fishing nights allowed for the season have been fished.
9.4.4 Overfished Fishery
An overfished fishery is considered to be a stock which is recruitment overfished, and for which current management is not adequate to recover the stock; or adequate management measures have been put in place but have not yet resulted in measureable improvements.
No fishing will be allowed for the SGPF if it is assessed as overfished.
9.4.5 Meta-rules
1. For a fishery assessed as Sustainable, the SGWCPFA may request additional SASs (to be cost recovered from the industry) to allow for reconsideration of the level of fishing strategy required for the fishery. The highest SAS result will be used in applying the Harvest Strategy.
2. It is acknowledged that external factors can substantially affect results from the SAS, particularly for juvenile prawn abundance. Thus a fishing strategy determined as Conservative due to adult catch rates being below the adult lower reference point does not force the implementation of a Conservative fishing strategy unless two SASs deliver results below the lower reference point for adults. That is, before a Conservative fishing strategy is applied, two

51
consecutive SAS outcomes with adult catch rates below the adult lower reference point (described in Table 7) must be recorded.
A fishing strategy determined as Conservative (see the decision tree in Figure 10) due to recruit catch rates being below the recruit lower reference point (while adults are between their lower and upper reference point) does not force the implementation of a Conservative fishing strategy unless three SASs deliver results below the recruit lower reference point. That is, before a Conservative fishing strategy is applied, three consecutive SAS outcomes with recruit catch rates below the lower reference point (described in Table 7) must be recorded.
For fishing pre-Christmas, the fishery would be considered to be Conservative if SAS results for adult and/or recruit catch rates are below the reference points for November described in Table 7.
3. It is recognised that the SGPF is dynamic and has demonstrated rapid increases in catch and catch rate following low catch years. To acknowledge this, for a fishery assessed as Transitional, if two consecutive SASs indicate catch rates for adults and recruits above the relevant reference level (described in Table 7, the fishery may operate under a Conservative Fishing Strategy (as described in Section 9.4.2) for the remainder of the season or until SAS catch rates for either adults or recruits fall below these reference levels; whichever is reached first.
If a further consecutive SASs provides catch rates for adults and recruits above reference levels (described in Table 7) the fishery may operate under a sustainable fishing strategy (as described in Section 9.4.2) for the remainder of the season.
4. It is acknowledged that external factors can substantially affect results from the November SAS and impact on the total pre-Christmas catch cap. For a fishery assessed as Sustainable, during a pre-Christmas fishing strategy with a catch cap set at between 120 t and 425 t (from Table 9), if the fleet average catch rate is ≥ 700 kg/vessel/night when the catch cap is reached, the fleet may fish for an additional two nights providing fleet catch rate remains above 500 kg/vessel/night. The fleet may harvest above the total allowable pre-Christmas catch in this scenario but the total catch will not exceed 550 t.
9.5 Review of the Harvest Strategy
A review of this management plan may be conducted at any time in line with the Act. Further information on reviewing the management plan is in Section 14. A review of the Harvest Strategy would be conducted under Section 49 of the Act as it is part of this management plan.
A bio-economic model for the fishery is under development at the time of writing this management plan. The outcomes from this model may be considered in a review of the Harvest Strategy.
52
9.6 Evaluating and testing the Harvest Strategy
The Harvest Strategy in this management plan includes some differences to the previous harvest strategy included in the 2007 management plan (Dixon and Sloan 2007). The main changes are:
• Limit reference point. Inclusion of a LRP indicating a level of prawn abundance considered undesirable for fishing performance. When the primary biological PI is below this level, the stock is considered to be recruitment overfished and the fishery is closed to allow for stock recovery.
• Trigger reference point. The TRP represents the boundary between a stock being assessed as ‘Sustainable’ or ‘Transitional’. In a year that a fishery is assessed as being Transitional the fishing strategies are managed through limiting the number of nights of fishing allowed for the season and pre-Christmas.
• Changes to the within-season decision rules including the decision framework for the refining fishing strategies, bucket counts and fleet target levels. The changes to the within-season decision rules were introduced to allow for a small level of increased flexibility with respect to the area opened to fishing by increasing the target bucket counts when developing a fishing strategy. This change was offset by increases in the target fleet catches that must be maintained for the fleet to be able to continue fishing in an area and amending the decision framework for refining fishing strategies. These changes were only relevant to years when the fishery is assessed as being Sustainable.
These amendments were evaluated by SARDI Aquatic Sciences to compare the relative conservatism of the Harvest Strategy described in this management plan with the previous Harvest Strategy described in Dixon and Sloan (2007). The evaluation methodology involved retrospectively applying the harvest strategies to historic fisheries data (2004-05 to 2012-13) and evaluating the level of fishing strategy that would have applied, the area (blocks) that met the bucket count targets for the relevant fishing strategy level, the estimated number of nights that fishing may have occurred (i.e. were above the average fleet catch targets), and the estimated catch.
The evaluation found that the harvest strategy in this management plan was comparable to the previous harvest strategy (Dixon and Sloan 2007) when considering the area open to fishing and the nights when fishing may have occurred. The evaluation noted that the estimated additional 12-13% of shot locations that may have been opened to fishing under the new harvest strategy was offset by a reduction of 0-6 nights fishing estimated to represent a 12% reduction in the total catch.
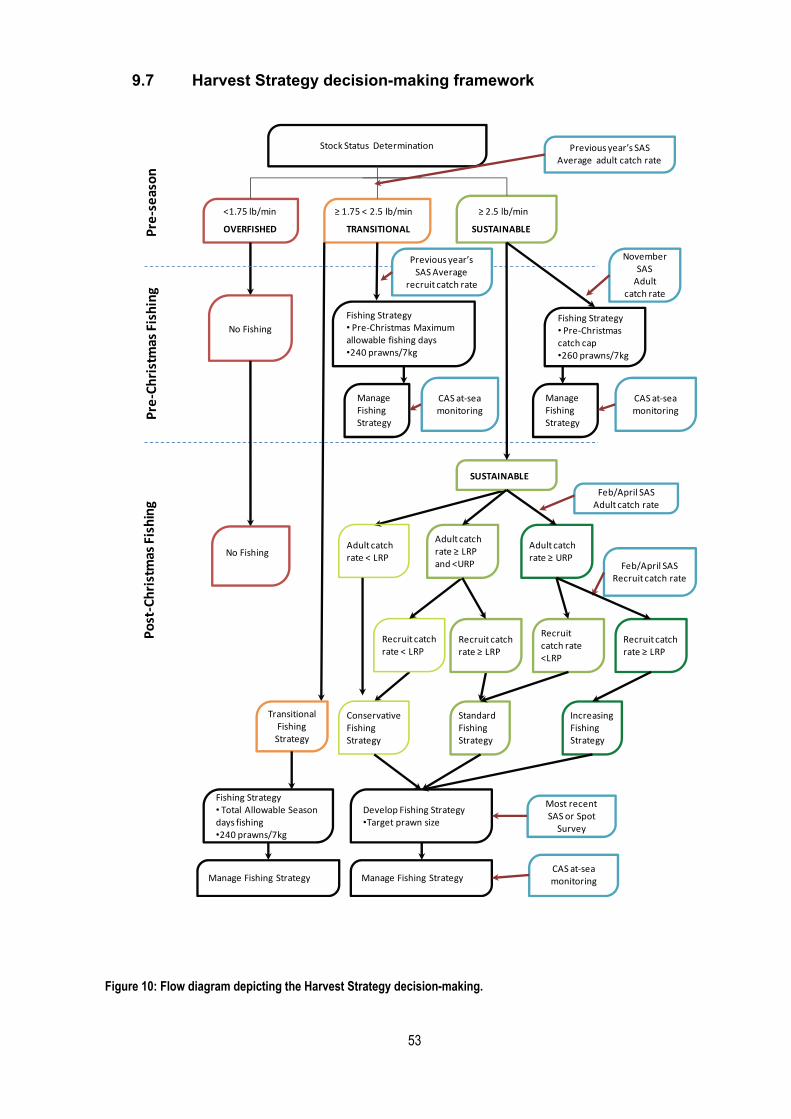
53
9.7 Harvest Strategy decision-making framework
Develop Fishing Strategy•Target prawn size
Stock Status Determination
<1.75 lb/min ≥ 1.75 < 2.5 lb/min ≥ 2.5 lb/min
No Fishing
SUSTAINABLETRANSITIONALOVERFISHED
Fishing Strategy• Pre-Christmas catch cap•260 prawns/7kg
Previous year’s SAS Average adult catch rate
November SAS
Adult catch rate
Most recent SAS or Spot
Survey
Manage Fishing StrategyCAS at-sea monitoring
SUSTAINABLE
No Fishing
Transitional Fishing
Strategy
Feb/April SASAdult catch rate
Adult catch rate ≥ URP
Adult catch rate < LRP
Feb/April SASRecruit catch rate
Recruit catch rate < LRP
Recruit catch rate ≥ LRP
Recruit catch rate <LRP
Recruit catch rate ≥ LRP
Conservative Fishing Strategy
Standard Fishing Strategy
Increasing Fishing Strategy
Fishing Strategy• Pre-Christmas Maximum allowable fishing days•240 prawns/7kg
Fishing Strategy• Total Allowable Season days fishing•240 prawns/7kg
Manage Fishing Strategy
Manage Fishing Strategy
CAS at-sea monitoring
Manage Fishing Strategy
Previous year’s SAS Average
recruit catch rate
CAS at-sea monitoring
Pre-
seas
onPr
e-Ch
ristm
as Fi
shin
gPo
st-C
hris
tmas
Fish
ing
Adult catch rate ≥ LRP and <URP
Figure 10: Flow diagram depicting the Harvest Strategy decision-making.

54
10 OTHER COMMERCIAL FISHING
10.1 Research fishing
Research fishing is fundamental to the management of the SGPF, and the results of research surveys are used to guide fishing operations under the agreed Harvest Strategy.
As the surveys are conducted through collective agreement with the SGWCPFA, fishing surveys are undertaken pursuant to an exemption granted to the SGWCPFA. Therefore, additional research fishing permits are not necessary to facilitate this fishing.
10.2 Exploratory and developmental fishing
Applications for exploratory and developmental fishing for species that are not part of this fishery will be dealt with through Exploratory and Developmental Fishing Policy and the Fisheries Management (Miscellaneous Research Fishery) Regulations 2013 under the Fisheries Management Act 2007.Exploratory and developmental fishing for species that are part of this fishery in the area of the fishery are dealt with either by issuing a permit or an exemption under the Fisheries Management Act 2007, depending on the activity being undertaken. Applications will be considered on a case-by-case basis and guided by the objectives and principles in this management plan.

55
11 STOCK ASSESSMENT AND RESEARCH
11.1 Research services
PIRSA Fisheries and Aquaculture contracts research services for each fishery. SARDI Aquatic Sciences is currently the primary research provider for core research for the SGPF. Costs of the annual research program for the fishery are recovered through licence fees.
External funding sources, such as the Fisheries Research and Development Corporation (FRDC) and universities, also provide funding for specific research projects. The fishery contributes to the FRDC through an annual levy base collected through licence fees.
11.2 Data collection and analysis
To achieve the research and monitoring needs for the fishery, a variety of data types are collected and analysed.
• Fishery independent data − Fishing surveys − By-catch surveys − Economic surveys
• Fishery dependent data − Spot surveys − Commercial catch and effort logbooks data − Wildlife interaction logbook data − At-sea catch data
11.3 Fishery independent research
11.3.1 Fishery independent stock assessment surveys
Fishery independent SASs are conducted before, mid and toward the end of each normal fishing season and inform the fishing strategy undertaken by the fishing fleet and assess the fishery against PIs described in this management plan. Additionally, data from November SAS provide information on egg production, and data from February SAS provide information on recruitment (Dixon et al. 2013).
SASs are conducted using industry vessels with a mix of independent and a small number of industry observers. The surveys involve trawl shots conducted at semi-fixed sites for a specified length of time. The distance trawled depends on trawl speed and is measured with a GPS. The number and locations of shots conducted during each survey has been optimised, taking into account historic data sets, information priorities and logistic reasons. The November SAS generally includes 182 survey shots, and February and April SASs include 207 shots each.
The data collected during SASs include total catch, trawl time, trawl distance, trawl direction, bucket counts and water temperature. A length frequency sample is also taken from the catch to provide sex-specific length, sex ratio and mean prawn weight data. Further details regarding the methods used in undertaking SASs are described in Dixon et al. (2013).

56
11.3.2 By-catch surveys
By-catch surveys are conducted approximately every five years to underpin a risk assessment of the SGPF. The aims of the survey are to assess the potential vulnerability of by-catch species to the trawling activity of the fishery. Specifically, the surveys describe the species composition and spatial distribution patterns of prawn trawl catch. The most recent completed by-catch survey was conducted in 2007 and the report published in 2009 (Currie et al. 2009). This survey provided the basis for the assessment of individual species completed as part of a risk assessment for the SGPF (see Section 5). A further by-catch survey was completed in February 2013 but the results were not analysed in time to inform the risk assessment undertaken in the development of this management plan.
11.3.3 Bio-economic modelling
A bio-economic modeling tool is being developed for the SGPF that will allow for the testing of alternate management strategies, including fleet reduction, quota management and other management frameworks suggested by stakeholders. The model will integrate economic dynamics with biological information to allow for explicit implications on the economic efficiency of various management options with biological outcomes to be taken into account. The project is due for completion in 2014.
11.3.4 Economic indicators
The economic indicators project presents a set of economic PIs for fishers, a consistent time series of economic information to aid management of the fishery in the future as well as information about some social aspects of the fishery. Economic information regarding the fishery is collected from licence holders through regular surveys with information on catch, effort, price and the consumer price index. The first surveys were conducted in 1997-98 and the most recent surveys were conducted in 2007-08. The most recent economics report provides information for 2009-10 (Econsearch 2011).
11.3.5 Optimising business structures and fisheries management systems for key fisheries
This research aims to assess the performance of and identify impediments to wealth creation in selected fisheries, including the SGPF. The project will identify practical opportunities for overcoming impediments, and is due for completion in 2014.
11.3.6 Ecosystem-based assessment
This research aims to develop a reporting framework for environmental assessment of prawn trawl fisheries in Australia, using the SGPF as a case study following accepted EBFM principles. The project will collate and analyse existing data on by-catch/by-product species, threatened and endangered species, benthic habitats and trophodynamics. The outcomes will aid management of the fishery by developing appropriate research priorities for ecosystem-based research. The project is due for completion in 2014.
57
11.4 Fishery dependent monitoring
License holders are required to complete daily and monthly logbooks detailing their fishing activities and harvest. The information is entered into a database maintained by SARDI Aquatic Sciences.
The SGWCPFA conduct spot surveys in fishing months when there are no SASs conducted. These SGWCPFA -driven surveys target particular areas of the gulf that industry consider potential areas for fishing. Data collated from these surveys include estimates of catch rate and mean prawn size (bucket counts).
Spot survey data aim to augment the fishing strategies developed from fishery independent surveys (SASs) by targeting areas that are likely to have changed since the previous survey such that they may be included in fishing strategy development.
PIRSA Fisheries and Aquaculture implemented a generic data recording logbook in 2007 for wildlife interactions (including TEPS for all South Australian commercial fisheries). The wildlife interaction logbook was implemented to ensure consistent reporting practices for interactions with TEPS. SARDI Aquatic Sciences collate and archive the data from the wildlife logbooks and summarise these in an annual report.
11.5 Reporting
SARDI Aquatic Sciences has conducted stock assessments on the SGPF since 1998. The stock assessments aim to synthesise information available for the fishery, assess the status of the resource, and comment on the performance of the fishery with respect to the current biological PIs. Stock assessment reports document the available information on the biology and management of King Prawns, present analyses of commercial logbook and fishery independent survey data, and provide assessment against the PIs in the management plan including:
• Index of future and current catch rate (SAS catch rates of recruits and adults)
• Total commercial catch
• Mean commercial catch rate
• Recruitment index
• Mean egg production
11.6 Strategic research plan
In addition to the core stock assessment work that informs periodic decision-making in the fishery, additional research projects are undertaken to meet longer-term fishery objectives or to underpin the development of strategies under this plan.
The SGWCPFA Research Subcommittee have developed a research plan to undertake research and development projects for the SGPF. The Research Subcommittee review and update the research plan regularly, taking into account the changing nature of the fishery, social expectations, economic performance, and the changing gulf environment.

58
12 COMPLIANCE AND MONITORING
12.1 Objectives
PIRSA Fisheries and Aquaculture runs a compliance program that has dual objectives: 1. To maximise voluntary compliance with fisheries rules.5
2. To create effective deterrence to breaching fisheries rules.
These objectives are consistent with the Australian National Fisheries Compliance Policy6
Voluntary compliance is maximised through ensuring that fishers are aware of and understand the rules that apply to their fishing activities, that they understand the purpose of the rules, and that they operate in a culture of compliance.
Effective deterrence is created through the presence of fisheries officers and compliance operations, as well as through the detection and prosecution of illegal activity7.
12.2 Cost-recovery
The costs of the compliance program attributed to the commercial sector are recovered from licence holders through licence fees. This is done in accordance with the government’s cost-recovery policy for fisheries. PIRSA Fisheries and Aquaculture and industry associations are involved in annual discussions in relation to the proposed compliance program and associated costs.
12.3 Planning
PIRSA Fisheries and Aquaculture compliance programs are developed through a three-year planning cycle, which is designed to ensure that compliance programs:
1. Support the fisheries management objectives for each fishery.
2. Identify compliance risks in each fishery.
3. Respond to key risks within each three-year period.
4. Have an appropriate mix of tools designed to maximise voluntary compliance and create effective deterrence.
5. Establish benchmarks against which to measure responses to risks.
5 Rules include regulations, licence conditions, closure notices or any other enforceable instrument under the Fisheries Management Act 2007. 6 The Australian Fisheries National Compliance Strategy 2010-2015 was developed by the National Fisheries Compliance Committee outlines the objectives that Australian fisheries agencies will pursue to achieve an optimal level of compliance and create effective deterrence to illegal fishing activity. 7 Prosecution may include the issuing of a formal caution or an expiation notice, in addition to prosecution through the courts.
59
12.3.1 Risk assessment
A risk assessment is undertaken every year for each fishery. A major risk assessment is undertaken periodically (approximately every three years) or is triggered by a major change in management arrangements.
The risk assessment identifies and prioritises the compliance risks that exist in the fishery, and rank them according to the likelihood and consequence of the risk occurring. This risk assessment is used to inform annual compliance planning processes.
The first risk assessment for the SGPF under this management plan is scheduled to be conducted in 2014, prior to the commencement of the cost-recovery cycle in October 2014.
The risk assessment process involves industry representatives, and is designed to identify the key risks that the fishery has the potential to be exposed to if not monitored. The key risks identified in the SGPF at present are:
• Compliance with gear restrictions.
• Compliance with spatial closures.
• Monitoring the capture of by-catch and TEPS.
In general, the SGPF has a history of working collectively to set and monitor compliance with regulations.
12.3.2 Responses and benchmarks
Compliance activities are planned to respond to the risks identified in each fishery, with an emphasis on the most serious risks. Responses must include measures aimed at both maximising voluntary compliance and creating effective deterrence.
Benchmarks are established by which to measure compliance activities. These benchmarks are used to guide the allocation of resources in compliance planning.
12.3.3 Compliance plans
Plans are developed each year, including forecasts for the following two years based on the results of the risk assessment.
60
12.4 Compliance status report
Each year a report is to be prepared assessing the compliance status of the SGPF. This report will:
• Describe the compliance program for the previous three years, including an overview of activities and relevant statistics.
• Describe how the program has been implemented to achieve both voluntary compliance and create effective deterrence.
• Describe the risks that have been addressed as a priority over that period.
• Comment on any changes to the risk profile of the fishery during that period.
• Analyse the compliance status of the fishery (including information about intelligence reports received).
• Make suggestions for future compliance planning.
The first compliance status report for the SGPF is scheduled to be prepared by December 2014. A draft of the plan will be provided to the SGWCPFA for comment prior to being finalised.
61
13 REGULATORY ARRANGEMENTS
13.1 Licensing
This section outlines the licensing arrangements in place under the Fisheries Management Act 2007 and Fisheries Management (PF) Regulations.
13.1.1 Issue of licences
No more licences may be issued in the fishery. The number is capped at the current number of 39.
13.1.2 Transferability
The licences are fully transferable, subject to the payment of fees and the transferee meeting ‘fit and proper person’ requirements. A licence may be held by an individual or a company.
There are ‘licence splitting’ provisions in the regulations to prevent the separate transfer of 'bundled' State and Commonwealth entitlements, but in reality these provisions do not affect prawn licences.
13.1.3 Registered boats
A boat may only fish commercially if it is registered on a licence. In the prawn fisheries, there are additional restrictions on boats. Specifically, a boat registered on a SGPF licence must not exceed 22 m in length and the continuous brake power rating of the main engine must not exceed 336 kW. These are some of the core effort restrictions in the fishery.
Only one boat may be registered on a licence at any one time.
13.1.4 Registered masters
A registered vessel must be in the charge of a master who is registered on the licence. The master must meet 'fit and proper person' requirements to be registered.
13.2 Management arrangements
The commercial fishery is managed using a mixture of input controls (aimed at matching harvesting capacity with resource availability) and promoting stock sustainability.
No fishing is permitted in waters that are shallower than 10 m in the Spencer Gulf, and trawling is banned during daylight hours. All licence holders are permitted to use single- or double-rigged gear with a maximum headline length of 29.26 m. A minimum mesh size of 4.5 cm applies. Commercial licence holders are permitted to retain, for the purpose of trade or business, the by-product species Balmain Bugs (Ibacus spp.) and Southern Calamari (Sepioteuthis australis).
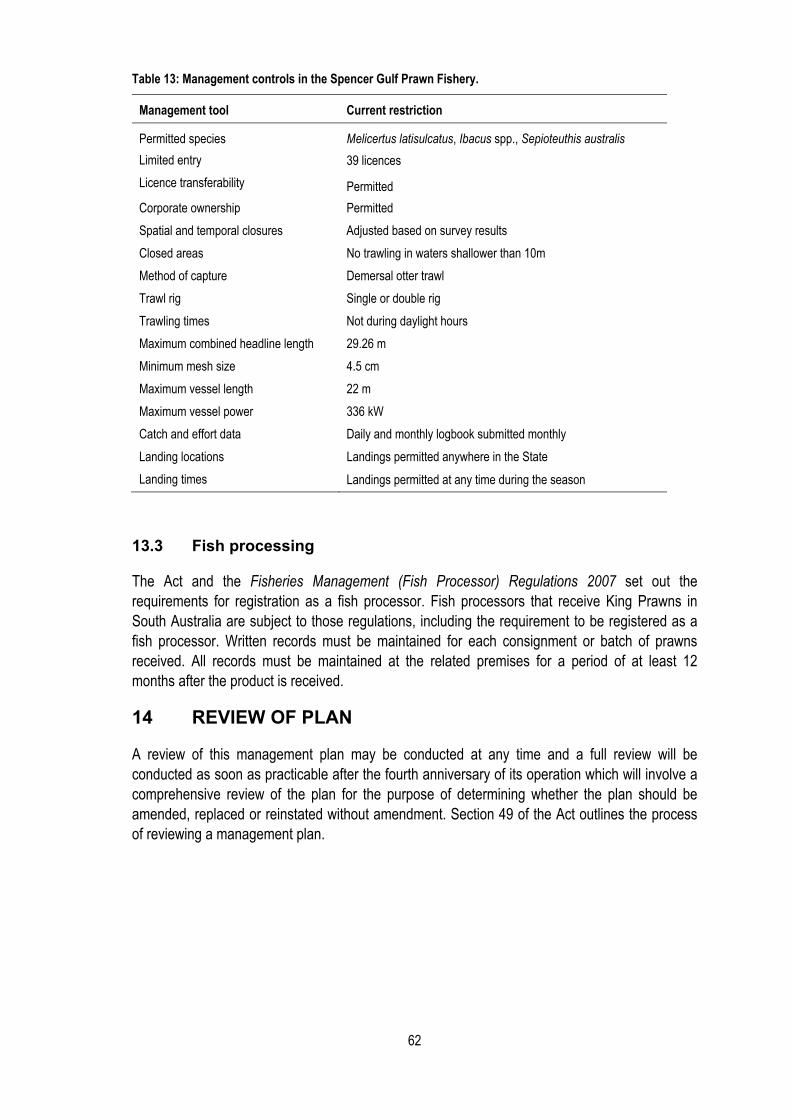
62
Table 13: Management controls in the Spencer Gulf Prawn Fishery.
Management tool Current restriction
Permitted species Melicertus latisulcatus, Ibacus spp., Sepioteuthis australis Limited entry 39 licences Licence transferability Permitted Corporate ownership Permitted Spatial and temporal closures Adjusted based on survey results Closed areas No trawling in waters shallower than 10m Method of capture Demersal otter trawl Trawl rig Single or double rig Trawling times Not during daylight hours Maximum combined headline length 29.26 m Minimum mesh size 4.5 cm Maximum vessel length 22 m Maximum vessel power 336 kW Catch and effort data Daily and monthly logbook submitted monthly Landing locations Landings permitted anywhere in the State Landing times Landings permitted at any time during the season
13.3 Fish processing
The Act and the Fisheries Management (Fish Processor) Regulations 2007 set out the requirements for registration as a fish processor. Fish processors that receive King Prawns in South Australia are subject to those regulations, including the requirement to be registered as a fish processor. Written records must be maintained for each consignment or batch of prawns received. All records must be maintained at the related premises for a period of at least 12 months after the product is received.
14 REVIEW OF PLAN
A review of this management plan may be conducted at any time and a full review will be conducted as soon as practicable after the fourth anniversary of its operation which will involve a comprehensive review of the plan for the purpose of determining whether the plan should be amended, replaced or reinstated without amendment. Section 49 of the Act outlines the process of reviewing a management plan.
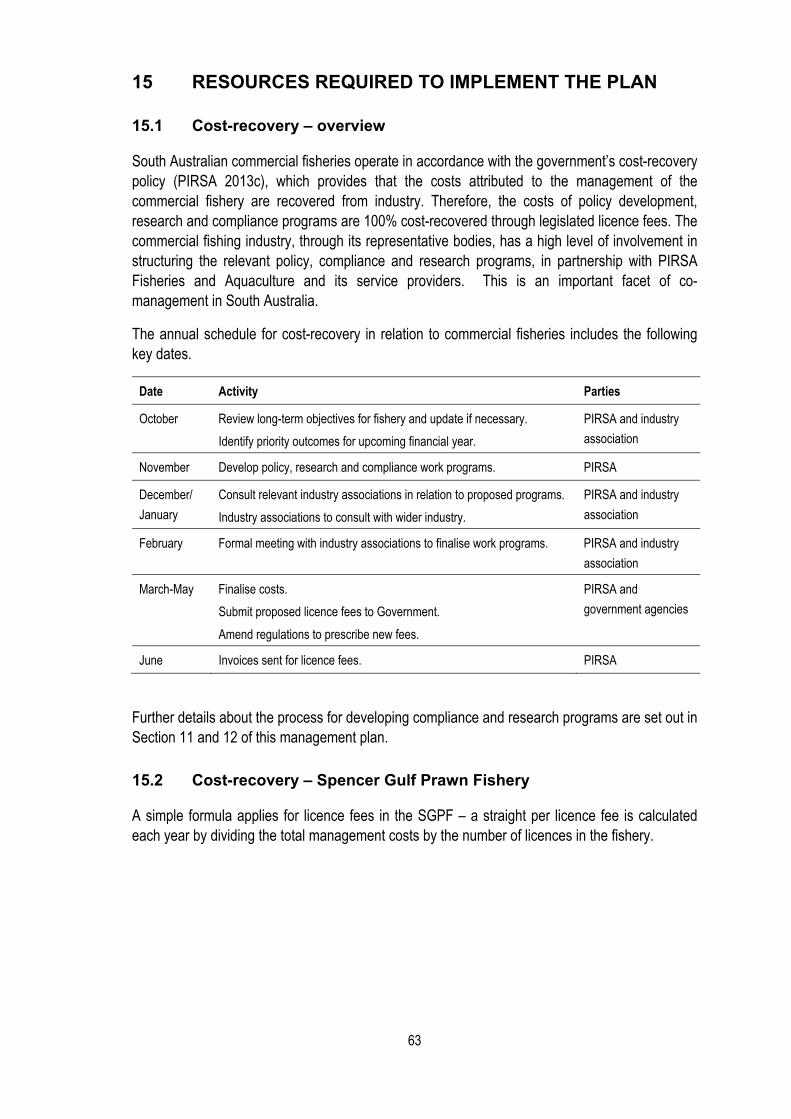
63
15 RESOURCES REQUIRED TO IMPLEMENT THE PLAN
15.1 Cost-recovery – overview
South Australian commercial fisheries operate in accordance with the government’s cost-recovery policy (PIRSA 2013c), which provides that the costs attributed to the management of the commercial fishery are recovered from industry. Therefore, the costs of policy development, research and compliance programs are 100% cost-recovered through legislated licence fees. The commercial fishing industry, through its representative bodies, has a high level of involvement in structuring the relevant policy, compliance and research programs, in partnership with PIRSA Fisheries and Aquaculture and its service providers. This is an important facet of co-management in South Australia.
The annual schedule for cost-recovery in relation to commercial fisheries includes the following key dates.
Date Activity Parties
October Review long-term objectives for fishery and update if necessary. Identify priority outcomes for upcoming financial year.
PIRSA and industry association
November Develop policy, research and compliance work programs. PIRSA
December/ January
Consult relevant industry associations in relation to proposed programs. Industry associations to consult with wider industry.
PIRSA and industry association
February Formal meeting with industry associations to finalise work programs. PIRSA and industry association
March-May Finalise costs. Submit proposed licence fees to Government. Amend regulations to prescribe new fees.
PIRSA and government agencies
June Invoices sent for licence fees. PIRSA
Further details about the process for developing compliance and research programs are set out in Section 11 and 12 of this management plan.
15.2 Cost-recovery – Spencer Gulf Prawn Fishery
A simple formula applies for licence fees in the SGPF – a straight per licence fee is calculated each year by dividing the total management costs by the number of licences in the fishery.

64
16 REFERENCES
Brown DE and Holthuis LB 1998, ‘The Australian species of the genus Ibacus (Crustacea: Decapoda: Scyllaridae), with the description of a new species and addition of new records’, Zoologische Mededelingen Leiden, 72 (10), pp. 113-141.
Bryars, S 2003, An Inventory of Important Coastal Fisheries Habitats in South Australia, Fish Habitats Program, Primary Industries and Resources South Australia, Adelaide.
Carrick, NA 1996, Key factors which affect prawn recruitment and implications to harvesting prawn stocks: final report, Fisheries Research and Development Corporation, FRDC 91/3. Fisheries Research and Development Corporation, Canberra.
Carrick, NA 2003, Spencer Gulf Prawn (Melicertus latisulcatus) Fishery: fishery assessment report to PIRSA, SARDI RD03/0079-2, South Australian Research and Development Institute (Aquatic Sciences), Adelaide.
Currie, DR, Dixon, CD, Roberts, SD, Hooper, GE, Sorokin, SJ & Ward, TM 2009,. Fishery-independent by-catch survey to inform risk assessment of the Spencer Gulf Prawn Trawl Fishery. Report to PIRSA Fisheries. South Australian Research and Development Institute (Aquatic Sciences), Adelaide. SARDI Publication No. F2009/000369-1. SARDI Research Report Series No. 390.
DAFF 2007, Commonwealth fisheries Harvest Strategy: policy and guidelines, Australian Government Department of Agriculture, Fisheries and Forestry, Canberra.
Dixon, CD and Sloan, S 2007, Management plan for the South Australian Spencer Gulf Prawn Fishery: Fisheries Management Series paper no. 54, Primary Industries and Regions South Australia (Fisheries and Aquaculture), Adelaide.
Dixon, CD, Roberts, SD and Hooper, GE 2007, Spencer Gulf Prawn (Melicertus latisulcatus) Fishery: fishery assessment report to PIRSA Fisheries and Aquaculture, SARDI publication no. RD03/0079-4, SARDI Research Report Series no. 161, South Australian Research and Development Institute (Aquatic Sciences), Adelaide.
Dixon, CD, Hooper, GE and Burch, P 2012, Spencer Gulf Prawn Penaeus (Melicertus latisulcatus) Fishery 2010/11: fishery assessment report to PIRSA Fisheries and Aquaculture, SARDI publication no. F2007/000770-5, SARDI Research Report Series no. 603, South Australian Research and Development Institute (Aquatic Sciences), Adelaide.
Dixon, CD, Noell, CJ and Hooper, GE 2013, Spencer Gulf Prawn Penaeus (Melicertus latisulcatus) Fishery 2011/12: fishery assessment report to PIRSA Fisheries and Aquaculture, SARDI publication no. F2007/000770-6, SARDI Research Report Series no. 683, South Australian Research and Development Institute (Aquatic Sciences), Adelaide.
Econsearch 2011, Economic indicators for the Spencer Gulf and West Coast Prawn Fisheries 2009/10: a report prepared for Primary Industries and Fisheries South Australia, Econsearch, Adelaide.
Fletcher, WJ, Chesson, J, Fisher, M, Sainsbury, KJ, Hundloe, T, Smith, ADM and Whitworth, B 2002, National ESD reporting framework for Australian fisheries: the ‘how to’ guide for wild capture fisheries, FRDC Project 2000/145, Fisheries Research and Development Corporation, Canberra.

65
Fletcher, WJ, Sainsbury, KJ, Fisher, M and Hundloe, T 2005, ‘A flexible and practical framework for reporting on ecologically sustainable development for wild capture fisheries’, Fisheries Research, 71, pp. 175-183.
Flood, M, Stobutzki, I, Andrews, J, Begg, G, Fletcher, W, Gardner, C, Kemp, J, Moore, A, O'Brien, A, Quinn, R, Roach, J, Rowling, K, Sainsbury, K, Saunders, T, Ward, T and Winning, M (eds) 2012, Status of Key Australian fish stocks reports 2012, Fisheries Research and Development Corporation, Canberra.
Jones, K 2009, South Australian Recreational Fishing Survey, South Australian Fisheries Management Series paper no. 54, Primary Industries and Regions South Australia (Fisheries and Aquaculture), Adelaide.
Knight, MA and Tsolos, A 2012, South Australian Wild Fisheries Information and Statistics Report 2010/11, SARDI publication no. F2008/000804-4, SARDI Research Report Series no. 612, South Australian Research and Development Institute (Aquatic Sciences), Adelaide.
Hobday, AJ, Smith, ADM, Webb, H, Daley, R, Wayte, S, Bulman, C, Dowdney, J, Williams, A, Sporcic, M, Dambacher, J, Fuller, M, Walker, T 2007, Ecological risk assessment for the effects of fishing methodology: Report R04/1072 for the Australian Fisheries Management Authority, Canberra.
Hollamby, KL, Sloan, S, McShane, PE and Brook, J 2010, Competition to collaboration: exploring co-management models for the Spencer Gulf Prawn Fishery, FRDC project no. 2007/025, Fisheries Research and Development Corporation and the Spencer Gulf and West Coast Prawn Fishermen’s Association, South Australia.
Hudinaga, M 1942, ‘Reproduction, development and rearing of Penaeus japonicus Bate.’, Japanese Journal of Zoology, 10, pp. 305-393.
MacDonald, N 1998, Management plan for the Spencer Gulf and West Coast Prawn Fisheries, South Australian Fisheries Management Series, No. 34.
Neville, P 2008, Co-management: managing Australia’s fisheries through partnership and delegation: report of the Fisheries Research and Development Corporation’s National Working Group on the Fisheries Co-management Initiative, Project No. 2006/068. Fisheries Research and Development Corporation, Canberra.
PIRSA 2014, ESD risk assessment report for South Australia’s Spencer Gulf Prawn Fishery, Primary Industries and Regions (Fisheries and Aquaculture), Adelaide.
PIRSA 2013a, Management plan for the South Australian Commercial Marine Scalefish Fishery, South Australian Fisheries Management Series, Primary Industries and Regions (Fisheries and Aquaculture), Adelaide.
PIRSA 2013b, Policy for the co-management of fisheries in South Australia, Primary Industries and Regions (Fisheries and Aquaculture), Adelaide.

66
PIRSA 2013c, PIRSA cost-recovery policy, Primary Industries and Regions (Fisheries and Aquaculture), Adelaide.
PIRSA 2011, Allocation policy: allocation of access to fisheries resources between fishing sectors, Primary Industries and Regions (Fisheries and Aquaculture), Adelaide.
Roberts, SD, Dixon, CD and Ward, TM 2005, Assessment of juvenile prawn (Melicertus latisulcatus) surveys in Spencer Gulf, South Australia: report to Primary Industries and Regions (Fisheries and Aquaculture), SARDI Aquatic Sciences RD04/0211-2, SARDI Research Report Series no. 95, South Australian Research and Development Institute (Aquatic Sciences), Adelaide.
Roberts, SD and Steer, MA 2010, By-product assessment in the Spencer Gulf Prawn Fishery with an emphasis on developing management options for Balmain Bug, SARDI publication no. F2010/000165-1, SARDI Research Report Series no. 439, South Australian Research and Development Institute (Aquatic Sciences), Adelaide.
Roberts, SD, Deveney, M and Sierp, M 2010, Biosecurity and disease status of prawn nurseries in South Australia, SARDI publication no. F2010/000593-1, SARDI Research Report Series no. 449, South Australian Research and Development Institute (Aquatic Sciences), Adelaide.
Rodgers, GG, Roberts SD and Dixon, CD in press, ‘The effects of temperature on larval size in the Western King Prawn, Penaeus (Melicertus) latisulcatus Kishinouye, from Spencer Gulf, South Australia: implications for fishery management’, Marine and Freshwater Research, CSIRO Publishing online, <http://dx.doi.org/10.1071/MF13020>.
Sainsbury, K 2008, Best practice reference points for Australian fisheries: report to the Australian Fisheries Management Authority, R2001/0999, Canberra.
Sloan, SR, Smith, ADM, Gardner, C, Crosthwaite, K, Triantafillos, L, Jeffries, B and Kimber, N 2014, National guidelines to develop fishery harvest strategies. Fisheries Research and Development Corporation Report, Project 2010/061, Primary Industries and Regions, South Australia, Adelaide.
Steer, MA, Lloyd, MT and Jackson, WB 2006, Southern calamary (Sepioteuthis australis) fishery: report to PIRSA, SARDI Aquatic Sciences RD05/0006-2, SARDI Research Report Series no. 149.
Steer, MA, Lloyd, MT and Jackson, WB 2007, Southern calamari (Sepioteuthis australis) Fishery: fishery assessment report to PIRSA, SARDI publication no. F2007/000528-2, SARDI Research Report Series no. 229, South Australian Research and Development Institute (Aquatic Sciences), Adelaide.
Stewart J and Kennelly SJ 1997, ‘Fecundity and eff-size of the Balmain Bug Ibacus peronii (Leach, 1815) (Decapoda, Scyllaridae) off the east coast of Australia’, Crustaceana, 70 (2), pp. 191-197.
Stewart, J and Kennelly, SJ 1998, ‘Contrasting movements of two exploited Scyllarid lobsters of the genus Ibacus off the east coast of Australia’, Fisheries Research, 36, pp. 127-132.
67
Stewart, J and Kennelly, SJ 2000, Growth of the Scyllarid lobsters Ibacus peronii and I. chacei’, Marine Biology, 136, pp. 921-930.
Tanner, JE and Deakin, S 2001, ‘Active habitat selection for sand by juvenile western king prawns, Melicertus latisulcatus (Kishinouye)’, Journal of Experimental Marine Biology and Ecology, 261, pp. 199-209.
Winstanley RH, Potter, MA and Caton, AE 1983, ‘Australian cephalopod resources’, Memoirs of the National Museum Victoria, 44, pp. 243-253.
17 ACRONYMS Acronyms are spelled out in the first instance and then the acronym is used thereafter. The exception is Chapter 9: Harvest Strategy, in which all acronyms are spelled out in the first instance as they appear in that chapter, then the acronym is used thereafter.
ESD ecologically sustainable development
EBFM ecosystem-based fisheries management
ILUA Indigenous land-use agreements
MSC Marine Stewardship Council
OHS&W Occupational Health, Safety and Welfare
PI performance indicator
PIRSA Primary Industries and Regions South Australia
PSA productivity susceptibility analysis
SARDI South Australian Research and Development Institute
SAS stock assessment survey
SGPF Spencer Gulf Prawn Fishery
SGWCPFA Spencer Gulf and West Coast Prawn Fishermen’s Association TEPS threatened, endangered and protected species
68
18 GLOSSARY OF COMMON FISHERIES MANAGEMENT TERMS
These terms are intended to be used for the purposes of this management plan only.
Aboriginal traditional fishing Fishing engaged in by an Aboriginal person for the purposes of satisfying personal, domestic or non-commercial communal needs, including ceremonial, spiritual and educational needs, and using fish and other natural marine and freshwater products according to relevant Aboriginal custom.
Allocation Distribution of the opportunity to access fisheries resources, within and between fishing sectors.
Benthic Describes animals that live on, in or near the substrate.
Biomass The total weight or volume of individuals in a fish stock.
By-catch At a broad level, fisheries by-catch includes all material, living and non-living, other than targeted species caught while fishing. It usually refers to discards (that part of the catch returned to the water), by-product, and the part of the catch that is not landed but is killed as a result of interaction with fishing gear.
By-product Non-targeted catch that is commercially valuable and retained by fishers.
Catch The total amount (weight or number) of a species captured from a specified area over a given period of time. The catch includes any animals that are released or returned to the water.
Co-management Arrangements between governments and stakeholder groups to allow joint responsibility for managing fisheries resources on a cooperative basis.
Commercial fishing Fishing undertaken for the purpose of trade or business.
Ecologically sustainable development Using, conserving and enhancing the community’s resources so that ecological processes, on which life depends, are maintained, and the total quality of life, now and in the future, can be increased.
Ecosystem A dynamic complex of plant, animal, fungal and microorganism communities and the associated non-living environment interacting as an ecological unit.
Effort Amount of fishing taking place, usually described in terms of gear type and frequency or period during which the gear is in use; for example, hours of trawling.
Exploitation rate Ratio of catch (tonnes) divided by spawning biomass (tonnes).
Fishery A term used to group the collective enterprise of taking fish. A fishery is usually defined by a combination of the species caught (one or several), the gear and/or fishing methods used, and the area of operation.
Fishery dependent data Information collected about a fishery or fish stock by the participants of a fishery; for example, catch and effort information from fishery log sheets.
Fishery independent data Information collected about a fishery or fish stock by researchers, independent of the fishery; for example, scientific surveys and observer reports.
69
Gear restriction A type of input control used as a management tool to restrict the amount and/or type of fishing gear that can be used by fishers in a particular fishery.
Gross value of production (GVP) Value of the total annual catch for individual fisheries, fishing sectors or the fishing industry as a whole, measured in dollar terms. GVP, generally reported on an annual basis, is the quantity of catch for the year multiplied by the average monthly landed beach prices.
Habitat The place or type of site in which an organism naturally occurs.
Harvest The catch or take of fish from an area over a period of time.
Input controls Limitations on the type or amount of fishing effort; restrictions on the number, type and size of fishing vessels or fishing gear or on the fishing areas or fishing times in a fishery.
Limited entry Where fishing effort is controlled by restricting the number of operators, usually by limiting the number of licences in a fishery.
Logbook An official record (statutory declaration) of catch and effort data made by commercial fishers.
Mesh size The size of mesh permitted in nets and traps.
Mortality The death of fish from any source.
Non-target species Any part of the catch except the target species, including by-catch and by-product.
Non-retained species Species that are taken as part of the catch but are subsequently discarded, usually because they have low market value or because regulations preclude them being retained.
Recruitment overfishing Excessive fishing effort or catch which reduces recruitment to the extent that the stock biomass falls below the pre-defined limit reference point.
Reference point A reference against which the performance of the indicator can be assessed.
Retained species The species within the catch that are not discarded, including target species and by-product.
Sample A proportion or a segment of a fish stock that is removed for study and is assumed to be representative of the whole.
Spatial Of or relating to space or area.
Species A group of organisms capable of interbreeding freely with each other but not with members of other species.
Stakeholder An individual or a group with an interest in the conservation, management and use of a resource.
Stock A group of individuals of a species occupying a well-defined spatial range independent of other groups of the same species, which can be regarded as an entity for management or assessment purposes.

70
Stock assessment A detailed analysis of stock status (abundance, distribution, age structure, etc.) to support the management of the species/fishery.
Target species The species fishers aim to catch.
Traditional fishing Fishing for the purposes of satisfying personal, domestic or non-commercial communal needs, including ceremonial, spiritual and educational needs and utilising fish and other natural marine and freshwater products according to relevant Indigenous custom.
Temporal Of or relating to time.
Threatened A species or community that is vulnerable, endangered or presumed extinct.

71
19 APPENDICES
19.1 Justification of biological performance indicator reference points
Biological PIs provide information about the biological state of the fishery. Reference points are established for PIs as a reference against which performance of the indicator can be assessed. A reference point establishes a benchmark for sustainable fishery performance. PIs can be a direct measure of performance (e.g., total biomass of a stock) or a proxy that is considered to be an appropriate indicator of a direct measure (e.g., catch rates for indicating relative biomass).
19.1.1 Primary biological performance indicator
The key PI is the weighted average catch per unit of effort (kg/hour or lb/min) of adult prawns assessed from all three fishery independent SASs in the previous fishing season. The values from each of the three annual SASs are weighted as follows:
November February April 0.20 0.35 0.45
The weightings are based on the relative contribution of adult prawns to the total catch in the relevant SASs over the past eight years of surveys. The weightings also reflect the view that the April SAS is the most indicative of adult biomass and the most recent indication of stock status, while the November SAS is the least indicative and has the least weighting.
The trigger reference point is set at an adult catch rate above which the fishery is considered to be sustainable. That is, the stock is considered to be at a level sufficient to ensure that, on average, future recruitment to the fishery will be adequate. This point represents the boundary between a stock assessed as being Sustainable or Transitional as described in the national stock status report (Flood et al. 2012).
A limit reference point establishes a benchmark for undesirable fishery performance. In this case, the limit reference point for determining if a stock is Overfished or not was considered to correspond to recruitment overfishing where the spawning stock biomass has been reduced, so that average recruitment levels are significantly reduced. The limit reference point for average adult catch rate from SASs are set out in Table 6 and depicted in Figure 11.

72
The reference points of SAS adult catch rate have been selected in consideration of the performance of the commercial fishery over time. Total commercial catches ranging from 1500 to 2200 t have been sustained since 1973, with one exception (Figure 12). Commercial catch rate over this period has had two distinct periods of stability – around 50 kg/hr (1.9 lb/min) between 1968 and 1996-97, and 108 kg/hr (4.0 lb/min) from 1997-98 (Figure 12). Catch rates more than doubled between these periods. Although factors that could have led to this catch rate increase (apart from stock abundance) are considered, including catch efficiency of the fleet and improved targeting of the stock, it is generally considered that the fishery has maintained stocks at or above sustainable levels over its history.
Although the biomass at maximum sustainable yield (Bmsy) cannot be determined at this time, it is widely assumed that the stock has been in a healthy, sustainable position over the history of the fishery and that stocks have been above Bmsy. The fishery has also shown no identifiable signs of recruitment overfishing over its recorded history. Years of low commercial catch rates and total catch have been followed by rapid improvements in the following year, indicating that recruitment overfishing had not occurred (for example 1986-87 to 1988 and 2002-03 to 2003-04).
In the absence of a quantitative model proxy it is difficult to set a stock biomass level that would be considered to be at risk of recruitment overfishing. In this case, reference points have been set based on proxy levels of biomass considered acceptable in other fisheries, for example in Australian commonwealth fisheries (see DAFF 2007).
The range of SAS average adult catch rates from 2004-13 is between 3.53 and 4.5 lb/min. Considering the lower level (3.5 lb/min) of historic SASs average adult catch rates being at, or above, that at Bmsy, a catch rate at 50% of this level, 1.75 lb/min, is considered an appropriate level for setting a limit reference point. Setting a reference point at half of Bmsy has been used in other fisheries for setting limit reference points (Sainsbury 2008, DAFF 2007). A trigger reference point of 2.5 lb/min was set taking into account the additional within-season management arrangements that have been shown to have kept the fishery within sustainable levels over many
0.000.501.001.502.002.503.003.504.004.505.00
Adul
t Cat
ch r
ate
lb/m
in
Adult catch rate reference levels
Overfished
Transitional
Sustainable
Figure 11: Adult catch rate reference points: reference points are indicated as limit reference point in red; trigger reference point in orange and target reference point in green. The historic SAS results from 2004-05 and 2012-13 are provided in blue.

73
years. A target reference point of 3.5 lb/min was set, indicating a level the fishery aims to be at or above. The reference points are set in Table 6. These reference points may be reviewed on completion of a bio-economic model for the fishery that will provide further quantitative information regarding stock status. This model is anticipated to be finalised in 2015.
It is considered that these reference points are appropriate for monitoring the status of the stock and consider various biological and fishery characteristics that indicate the stock is relatively robust to fishing. The species is short-lived and highly fecund, indicating a propensity for resilience to fishing pressure; this is consistent with the commercial catch patterns seen historically (see Figure 12). In addition, management arrangements pre-Christmas specifically aim to protect spawning adults, thus protecting stocks against recruitment overfishing. These arrangements have seen a 25% increase in mean recruitment compared to the historic average (Dixon et al. 2013). Total effort has decreased by over 50% since 1978-79 (Figure 5), indicating that current fishing effort is well below that at maximum sustainable yield and management arrangements and industry practice in place maintain effort at these low levels. In light of the available evidence, a reference point below the range of SAS adult catch rate recorded since 2004 was therefore considered appropriate to indicate a stock biomass level that may be at risk of recruitment overfishing.
Figure 12: Commercial annual catch and catch rate from 1968 to 2011-12 (Dixon et al. 2013).
CPU
E (k
g/hr
)
74
19.1.2 Secondary biological performance indicators
The secondary biological PIs are: 1. Catch per unit of effort (kg/hour or lb/min) of adult prawns from individual SASs.
2. Catch per unit of effort (kg/hour or lb/min) of recruits (juveniles) from individual SASs.
3. Weighted average catch per unit of effort (kg/hour or lb/min) of recruits from all three SASs in the previous fishing season as an indicator of recent relative juvenile stock biomass.
1 and 2) Current adult and juvenile abundance
Reference points for adult and recruit catch rates in Table 7 reflect the lower, and (for adults) an upper acceptable level based on the ten years of SASs.
The lower reference points (LRP) are set midway between the lowest and second lowest recorded SAS level. The upper reference points (URP) are set midway between the highest and second highest recorded SAS level (Figure 13 and Figure 14).
The low or high levels of adults or recruits (being at levels above or below upper or lower reference points respectively), are considered to occur in one in ten years. A level of adult abundance equal to or above the LRP but below the URP is considered to be a standard level of adult abundance and is estimated to occur in around 80% of surveys.
3) Average recent recruit catch rates
The values for recruit (juvenile) catch rates from each of the three annual SASs are weighted as follows:
November February April 0.20 0.35 0.45
The weightings are based on the relative contribution of recruits to the total catch in the relevant SASs over the past eight years of surveys.
Reference points for average recruit catch rates for the three SASs from the previous fishing season are set based on the range of historical records of this indicator using SAS values from 2004-05 to 2011-12 and are considered to represent low, medium and high levels of juvenile biomass as indicated in Table 8. These reference points have been set considering the weighted annual average of the lower juvenile SAS catch rates agreed in the previous Harvest Strategy (Dixon and Sloan 2007).
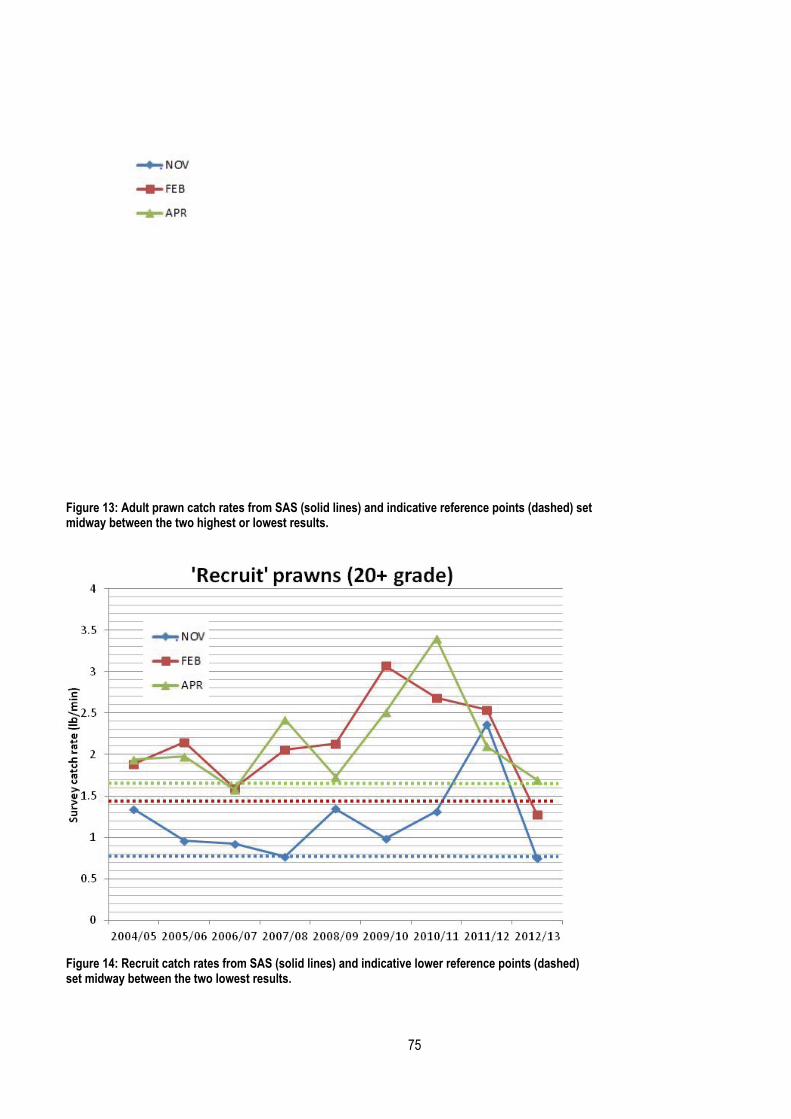
75
Figure 13: Adult prawn catch rates from SAS (solid lines) and indicative reference points (dashed) set midway between the two highest or lowest results.
Figure 14: Recruit catch rates from SAS (solid lines) and indicative lower reference points (dashed) set midway between the two lowest results.

76
19.2
R
isk
asse
ssm
ent o
f Spe
ncer
Gul
f Pra
wn
Fish
ery
Tabl
e 14:
Sum
mar
y of r
isk as
sess
men
t out
com
es an
d re
lated
obj
ectiv
es an
d m
anag
emen
t stra
tegi
es fr
om th
e ESD
risk
asse
ssm
ent o
f the
Spe
ncer
Gul
f Pra
wn F
isher
y
Ri
sk
Desc
riptio
n Ri
sk R
atin
g Ob
jectiv
e8 St
rate
gy8
Perfo
rman
ce
indi
cato
rs
Curre
nt
perfo
rman
ce
Robu
stne
ss
Retai
ned
spec
ies
Targ
et sp
ecies
Ri
sk of
fishe
ry im
pacts
on
bree
ding p
opula
tion
Mode
rate
1a, 1
b, 1c
1a
i, 1aii
, 1aii
i, 1bi,
1bii,
1ci,
1cii,
1ciii,
1civ,
1cv
Yes
Acce
ptable
Hi
gh
Non-
retai
ned
spec
ies
By-ca
tch/di
scar
d spe
cies
Risk
of fis
hery
impa
cts on
br
eedin
g pop
ulatio
n Hi
gh
3a, 3
b
3ai, 3
aii, 3
aiii,
3aiv,
3av,
3avi,
3avii
, 3bi,
3bii,
3biii,
3b
iv
Yes a
nd ot
hers
being
de
velop
ed
throu
gh E
BFM4
n/a
n/a
Gene
ral
ecos
ystem
Im
pacts
on tr
ophic
stru
cture
– re
mova
l of/d
amag
e to
orga
nisms
by (f
ishing
)
Risk
of da
mage
to or
re
mova
l of m
ateria
l on t
he
ecos
ystem
due t
o the
fis
hing o
pera
tions
Mode
rate
1a, 1
b, 3a
, 3c
1a
i, 1aii
, 1aii
i, 1bi,
1bii,
1biii,
3a
i, 3aii
, 3aii
i, 3aiv
, 3av
, 3a
vi, 3a
vii, 3
ci, 3c
ii, 3c
iii,
3civ
Being
de
velop
ed
throu
gh E
BFM4
n/a
n/a
Impa
cts on
trop
hic st
ructu
re –
addit
ion/m
ovem
ent o
f biol
ogica
l ma
terial
(disc
ardin
g by-c
atch)
Poss
ible i
mpac
ts as
socia
ted w
ith ad
dition
of
biolog
ical m
ateria
l from
Mode
rate
3a, 3
c 3a
i, 3aii
, 3aii
i, 3aiv
, 3av
, 3a
vi, 3a
vii, 3
ci, 3c
ii, 3c
iii,
3civ
Being
de
velop
ed
throu
gh E
BFM4
n/a
n/a
8 Ref
er to
Tab
le 2
for d
etai
l on
the
obje
ctiv
es a
nd st
rate
gies
refe
rred
to in
this
tabl
e.

77
Ri
sk
Desc
riptio
n Ri
sk R
atin
g Ob
jectiv
e8 St
rate
gy8
Perfo
rman
ce
indi
cato
rs
Curre
nt
perfo
rman
ce
Robu
stne
ss
fishin
g thr
ough
disc
ardin
g
Habit
at dis
turba
nce –
traw
ling
Risk
of ha
bitat
distur
banc
e fro
m tra
wling
on
envir
onme
nt Mo
dera
te
3c
3ci, 3
cii, 3
ciii, 3
civ
Yes a
nd ot
hers
being
de
velop
ed
throu
gh E
BFM4
n/a
n/a
Broa
der e
nviro
nmen
t – oi
l spil
ls Ri
sk of
envir
onme
ntal
dama
ge fr
om oi
l spil
ls Mo
dera
te
Oil s
pill re
spon
se po
licy i
s su
fficien
t to m
inimi
se
impa
cts to
SGP
F no
ting t
hat
this s
trateg
y lies
outsi
de
fishe
ry leg
islati
on
No
n/a
n/a
Comm
unity
Fis
hing i
ndus
try –
profi
t Im
porta
nce o
f pro
fit to
the
fishin
g ind
ustry
Ex
treme
2a
2a
i, 2aii
Ye
s Ac
cepta
ble
High
Fishin
g ind
ustry
– em
ploym
ent
Impo
rtanc
e of e
mploy
ment
to the
fishin
g ind
ustry
Hi
gh
2a
2ai, 2
aii
Yes
Acce
ptable
Hi
gh
Fishin
g ind
ustry
– oc
cupa
tiona
l he
alth,
safet
y and
welf
are
(OHS
&W)
Impo
rtanc
e of g
ood
OHS&
W pr
actic
es to
the
fishin
g ind
ustry
Hi
gh
En
sure
skipp
ers a
re aw
are
of OH
S&W
requ
ireme
nts
and d
ocum
entat
ion is
cu
rrent
notin
g tha
t this
strate
gy lie
s outs
ide fis
hery
legisl
ation
.
no
n/a
n/a
Fishin
g ind
ustry
– re
lation
ship
with
comm
unity
En
hanc
e soc
ial lic
ense
to
oper
ate
High
4b
, 4c
4bi, 4
bii, 4
cii, 4
ciii
Yes
Acce
ptable
Lo
w
Fishin
g ind
ustry
– as
set v
alue
Impo
rtanc
e of li
cenc
e ass
et Hi
gh
2a
2ai, 2
aii
Yes
Acce
ptable
Me
dium
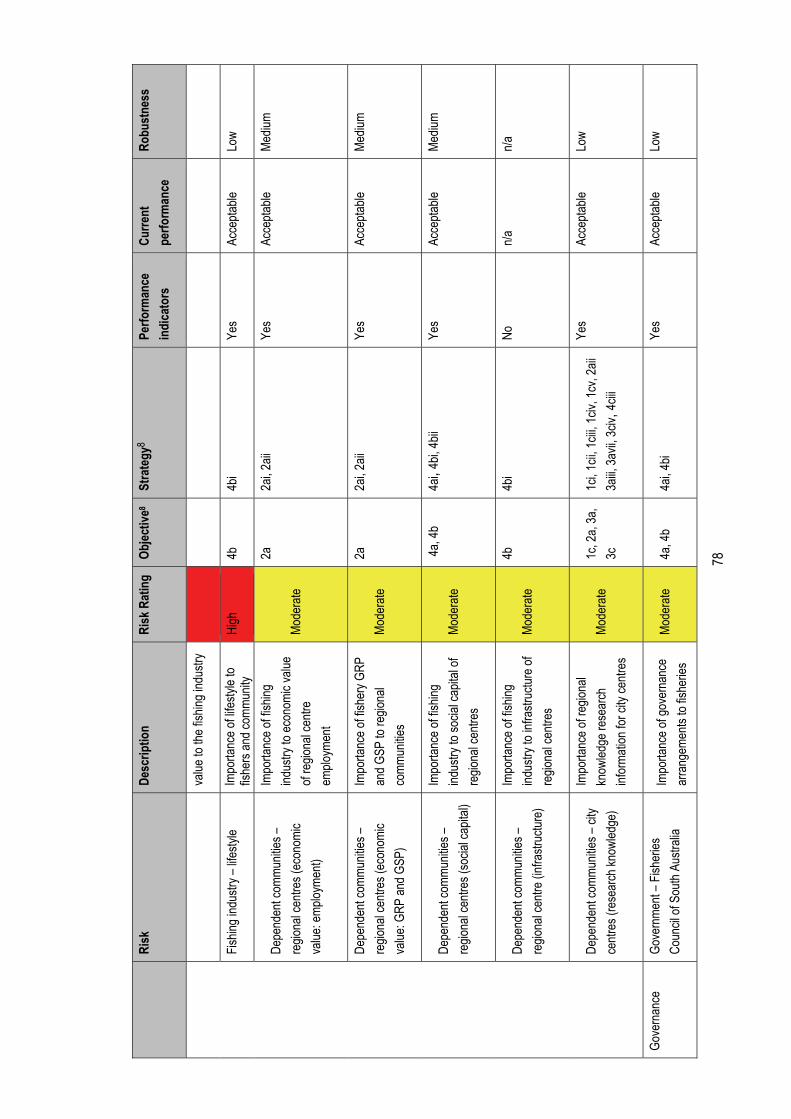
78
Ri
sk
Desc
riptio
n Ri
sk R
atin
g Ob
jectiv
e8 St
rate
gy8
Perfo
rman
ce
indi
cato
rs
Curre
nt
perfo
rman
ce
Robu
stne
ss
value
to th
e fish
ing in
dustr
y
Fishin
g ind
ustry
– life
style
Impo
rtanc
e of li
festyl
e to
fishe
rs an
d com
munit
y Hi
gh
4b
4bi
Yes
Acce
ptable
Lo
w
Depe
nden
t com
munit
ies –
regio
nal c
entre
s (ec
onom
ic va
lue: e
mploy
ment)
Impo
rtanc
e of fi
shing
ind
ustry
to ec
onom
ic va
lue
of re
giona
l cen
tre
emplo
ymen
t
Mode
rate
2a
2ai, 2
aii
Yes
Acce
ptable
Me
dium
Depe
nden
t com
munit
ies –
regio
nal c
entre
s (ec
onom
ic va
lue: G
RP an
d GSP
)
Impo
rtanc
e of fi
sher
y GRP
an
d GSP
to re
giona
l co
mmun
ities
Mode
rate
2a
2ai, 2
aii
Yes
Acce
ptable
Me
dium
Depe
nden
t com
munit
ies –
regio
nal c
entre
s (so
cial c
apita
l)
Impo
rtanc
e of fi
shing
ind
ustry
to so
cial c
apita
l of
regio
nal c
entre
s Mo
dera
te 4a
, 4b
4ai, 4
bi, 4b
ii Ye
s Ac
cepta
ble
Mediu
m
Depe
nden
t com
munit
ies –
regio
nal c
entre
(infra
struc
ture)
Impo
rtanc
e of fi
shing
ind
ustry
to in
frastr
uctur
e of
regio
nal c
entre
s Mo
dera
te 4b
4b
i No
n/a
n/a
Depe
nden
t com
munit
ies –
city
centr
es (r
esea
rch kn
owled
ge)
Impo
rtanc
e of r
egion
al kn
owled
ge re
sear
ch
infor
matio
n for
city
centr
es
Mode
rate
1c, 2
a, 3a
, 3c
1c
i, 1cii
, 1cii
i, 1civ
, 1cv
, 2aii
3a
iii, 3a
vii, 3
civ, 4
ciii
Yes
Acce
ptable
Lo
w
Gove
rnan
ce
Gove
rnme
nt – F
isher
ies
Coun
cil of
Sou
th Au
strali
a Im
porta
nce o
f gov
erna
nce
arra
ngem
ents
to fis
herie
s Mo
dera
te 4a
, 4b
4ai, 4
bi Ye
s Ac
cepta
ble
Low

79
Ri
sk
Desc
riptio
n Ri
sk R
atin
g Ob
jectiv
e8 St
rate
gy8
Perfo
rman
ce
indi
cato
rs
Curre
nt
perfo
rman
ce
Robu
stne
ss
mana
geme
nt
Gove
rnme
nt – P
IRSA
Fish
eries
an
d Aqu
acult
ure
Suffic
ient c
onsu
ltatio
n be
twee
n stak
ehold
ers a
nd
PIRS
A Fis
herie
s and
Aq
uacu
lture
Mode
rate
4a, 4
b, 4d
4a
i, 4bi,
4di
Yes
Acce
ptable
Hi
gh
Gove
rnme
nt – o
ther a
genc
ies
Suffic
ient c
onsu
ltatio
n with
oth
er go
vern
ment
agen
cies
(e.g.
, the D
epar
tmen
t of
Envir
onme
nt, W
ater,
and
Natur
al Re
sour
ces)
Mode
rate
4a, 4
b, 4c
4a
i, 4bi,
4bii,
4ciii
Yes
Acce
ptable
Hi
gh
Indus
try
Suffic
ient c
ommu
nicati
on
betw
een i
ndus
try
Mode
rate
4a, 4
b 4a
i, 4bi,
4bii
Yes
Acce
ptable
Me
dium
Othe
rs (N
GOs)
Suffic
ient c
ommu
nicati
on
with
other
s (NG
Os)
Mode
rate
4b, 4
c 4b
i, 4bii
, 4cii
i Ye
s Ac
cepta
ble
Mediu
m
Exter
nal fa
ctors
affec
ting
perfo
rman
ce of
the
fishe
ry Ec
ologic
al – b
iophy
sical
– Bi
ologic
al – d
iseas
e/viru
ses
Impo
rtanc
e of r
educ
ing ris
k of
intro
duce
d dise
ase o
r vir
uses
to th
e ind
ustry
. Hi
gh
1c
1ciii,
1cv
Enco
urag
e ado
ption
of th
e pr
incipl
es ou
tlined
in th
e St
ate E
merg
ency
Res
pons
e Pl
an no
ting t
hat th
is str
ategy
lies o
utside
fishe
ry leg
islati
on.
Yes
Acce
ptable
Lo
w

80
Ri
sk
Desc
riptio
n Ri
sk R
atin
g Ob
jectiv
e8 St
rate
gy8
Perfo
rman
ce
indi
cato
rs
Curre
nt
perfo
rman
ce
Robu
stne
ss
Ecolo
gical
– anth
ropo
genic
(h
abita
t mod
ificati
on; c
oasta
l de
velop
ment)
Impo
rtanc
e of c
oasta
l de
velop
ment
impa
cting
on
the in
dustr
y Mo
dera
te 1c
1c
iii, 1c
iv No
n/a
n/a
Econ
omic
– fue
l pric
es
Impo
rtanc
e on f
uel p
rices
on
fishe
ry pr
ofitab
ility
Extre
me
2a
2ai, 2
aii,
Yes
Acce
ptable
Me
dium
Econ
omic
– mar
ket fo
rces
Impo
rtanc
e on m
arke
t for
ces o
n fish
ery p
rofita
bility
Ex
treme
2a
2a
i, 2aii
, Ye
s Ac
cepta
ble
Mediu
m
Econ
omic
– mar
ket a
cces
s (m
arke
ting)
Im
porta
nce o
n mar
ketin
g on
fishe
ry pr
ofitab
ility
Mode
rate
2a
2ai, 2
aii,
Yes
Acce
ptable
Lo
w
Econ
omic
– mar
ket a
cces
s (q
uality
contr
ol)
Impo
rtanc
e of q
uality
co
ntrol
on fis
hery
profi
tabilit
y Mo
dera
te 2a
2a
i, 2aii
, Ye
s Ac
cepta
ble
Low
Econ
omic
– lab
our
(ava
ilabil
ity/co
sts)
Impo
rtanc
e on l
abou
r av
ailab
ility a
nd co
sts o
n fis
hery
oper
ation
s Mo
dera
te 2a
2a
i, 2aii
, Ye
s Ac
cepta
ble
Low
Econ
omic
– othe
r fish
ing co
sts
Impo
rtanc
e of o
ther f
ishing
co
sts on
fishe
ry op
erati
ons
Extre
me
2a
2ai, 2
aii,
Yes
Acce
ptable
Lo
w
Econ
omic
– inte
rest
rates
Im
porta
nce o
f inter
est r
ates
on fis
hing p
rofita
bility
Mo
dera
te 2a
2a
i, 2aii
, Ye
s Ac
cepta
ble
Mediu
m

81
Ri
sk
Desc
riptio
n Ri
sk R
atin
g Ob
jectiv
e8 St
rate
gy8
Perfo
rman
ce
indi
cato
rs
Curre
nt
perfo
rman
ce
Robu
stne
ss
Acce
ss –
marin
e par
ks
Impo
rtanc
e of m
arine
parks
to
fishin
g ope
ratio
ns
Mode
rate
1c, 2
a 1c
i, 1cii
, 1cii
i, 1civ
, 1cv
, 2ai,
2a
ii Ye
s Ac
cepta
ble
Mediu
m
Acce
ss –
aqua
cultu
re zo
nes
Impo
rtanc
e of a
quac
ultur
e zo
ning t
o fish
ing op
erati
ons
Mode
rate
1c, 2
a 1c
i, 1cii
, 1cii
i, 1civ
, 1cv
, 2ai,
2a
ii Ye
s Ac
cepta
ble
Mediu
m