management of energy resources in china - world bank group
TRANSCRIPT

Management of Energy Resources in China
Jiang Kejun
Energy Research Institute Abstract China is experiencing rapid economy growth, and energy use in China also increase quickly. Growth of energy use exerts great pressure on energy supply and environment. How to secure the energy supply in next several decades is a important issue for China to deal with. This paper tries to explore the future vision for energy demand, production, supply based on energy resource availability, environment constraints, and in the meantime to promote economy activities to reach government aim. Recent energy development in China was presented, and future energy and emission scenarios were developed by giving three different pathways. Together with the energy scenario and emission scenario, energy resource and possibility for energy import was presented. The results from quantitative analysis show that energy demand in China could be as high as 2.9 billion toe in 2030, which could exceed the available energy supply. Comparing with previous energy scenario studies, this result is much higher. By using various policy options discussed in the paper, however, there is potential to reduce this high demand to 2.4 billion toe in 2030. Many energy policies and environment policies should be further implemented in nexr future to reach national energy target and environment target. 1. Background on energy demand
In China, due to rapid economic growth, total primary energy consumption increased from 400 Mtoe in 1978 to nearly 1320 Mtoe in 2004, with an annual average rate of increase of 4.7% (see Figure 1)(China Energy Year Book 2002-2003, 2004; China Year Book 2004, 2004). Coal is the major energy source, providing 70.7% in 1978 and 69% in 2004 of total primary energy use (see Figure 2). Recent years have witnessed a dramatic surge in the rate of increase of energy use in China and widespread energy shortages.

Figure 1 Energy production and consumption in China
Figure 2 Primary energy use in China by energy type The major reason for surge increase of energy demand in China is rapid extension of energy intensive production. For example, steel output increased from 131million ton in 2000 to 297million ton in 2004. This is similar for other energy intensive products(see figure 3). Figure 3 energy intensive products development in China
China is the largest coal-producing and -consuming country in the world. Between 1980 and 2004, total raw coal output increased from 620 Mt to more than 1900 Mt, with an average annual growth rate of 4.8% per year. Prior to 2000, the share of coal use in total energy use decreased, but it increased again from 66% in 2000 to 72% in 2004. The heavy dependence on coal has led to
0
200
400
600
800
1,000
1,200
1,400
1957
1970
1980
1987
1990
1993
1996
1999
2002
Year
Mto
e
Hydro-power Natural Gas Crude Oil Coal
0
200
400
600
800
1000
1200
1400
1950 1970 1990 2010Year
Mto
e ConsumptionProduction
Index of industry products in China
05
10152025303540
1975 1980 1985 1990 1995 2000 2005
Year
Inde
x, 1
978=
1
Chemical FiberPaperCoalCrude OilNatural GasElectricitySteel ProductsCementPlasticsMachine ToolsMotor Vehicle

serious environmental problems and represents a burden for the transportation system.
From 1980 to 2004, total installed capacity of electricity power generation increased from 66 GW (of which hydropower is 20 GW, accounting for 31%) to 440 GW (of which hydropower is 100 GW, accounting for 23%). In the same period, electricity output increased from 300 TWh (of which hydropower is 58 TWh, accounting for 19%) to 1870 TWh (of which hydropower is 220 TWh, accounting for 12%). In 2004, newly installed capacity reached 50 GW, and newly installed capacity in 2005 and 2006 is expected be around 60 to 70 GW (Power Industry Information, 2005).
Power shortage appeared after 2002 is a key driving force for very large newly installed capacity in China in recently years. It is reported there were 24 provinces(all together China has 31 provinces, not including Taiwan, Hong Kong and Macao) suffered from power shortage in 2004 during summer time.
Between 1980 and 2004, total crude oil output increased from 106 Mt to 175 Mt (average annual growth rate is 2.1%). In 2002, 149 Mt was produced on land and 18 Mt was produced offshore. Crude oil output in China accounts for 4.7% of the world total. However rapid increase of petroleum demand was observed in last several years. Therefore oil import is becoming a significant factor in China’s energy supply. By 2004, imported oil takes share of 45% in total oil supply in China(see figure 4). And this has important impact on international oil market and Chinese oil companies’ future strategies. Figure 4 Petroleum supply in China
Energy efficiency improvement and energy conservation are given high priority in the energy development strategy in China, as is the efficient and clean use of coal and other fossil energy sources. The objective of developing clean coal technology is to improve coal utilization efficiency, to reduce environmental pollution and to promote economic development. High efficiency and clean technology will be crucial for China to achieve a low-emission development path. Figure 5 illustrates the way in which energy efficiency improvements in the steel-making industry have been driven by advanced technology diffusion. However compared with efficiency in Japan, there are still gap for Chinese industry, such as now there are nearly 20% lower efficiency for steel making industry in China.
Petroleum Supply in China
-100
0
100
200
300
400
1978
1985
1990
1992
1994
1996
1998
2000
2002
2004
Year
Mt
DomesticProductionImported

Figure 5 Technology progress and energy efficiency improvement in steel making industry Note: EF- electric furnace, TRT-Top Gas Pressure Recovery Turbine, DCF-Direct Current Furnace Recent energy demand increase has caused energy supply shortage and environment problems. By recognizing the energy situation, Chinese government made effort to try to soft energy pressure, by introducing various policies and instructions. Especially after 2004, energy issue is becoming one of the top concerning of government. Beside energy policies announced before 200, recently published energy policies include Medium- and Long-term Energy Conservation Plan, Eleventh Five Year Energy Plan, Renewable Energy Law, Fuel Efficiency Standard for Passenger Vehicle. And just recently Chinese Government setup target for 20% energy intensity reduction in 2010 compared with that in 2005. In order to reach the target, several programs were taken such as 10 key energy conservation projects(see table 1 for details), 1000 large energy user monitoring program. Subsidy for renewable energy is again confirmed. Fuel tax, energy tax are under discussion. During 11th Five Year Plan, fuel tax will be implemented. Table 1. Ten Programs for Energy Efficiency in the plan (NDRC 2004) Program Potential Annual Energy Savings Coal-fired industrial boilers conversion and energy efficiency improvement
70 Mtce (conversion) 35 Mtce (efficiency)
Heat-power co-generation 5 Mtce Residual heat and pressure usage 2.66 Mtce (steel industry)
3 Mtce (cement industry) 1.35 Mtce (coal mining industry)
Oil conservation and substitution 35 Mt less oil consumption Electrical machinery system energy conservation
20 billion kWh electricity
Energy system optimization strive to achieve international benchmarks of energy efficiency in steel, petrochemical and chemical industries
Construction energy conservation 50 Mtce Green lighting 29 billion kWh electricity Government organisations’ energy conservation
reduce energy consumption per capita and per area of office space by 20% in 2010, compared to 2002
Energy conservation monitoring & technology services system
Unit Energy Use in S tee l M aking Industry
0
50
1 00
1 50
2 00
2 50
3 00
1 97 0 19 75 198 0 1 985 19 90 199 5 2 000
Year
kgce
Large C onvertorC ontinuous C as ting
Large B las t Furnac e
C oke D ry Q uenc hing
C oal P ow der Injec tionTR T
Fluit Gas R ec overy D C F C O R E X
E F

construction. 2. Energy and Emission Scenarios for China 2.1 Methodology
The IPAC-Emission model and IPAC-AIM/Technology model – components of the Integrated Policy Assessment Model for China (IPAC) – were used to perform the quantitative scenario and policy option analysis. The models project future energy and pollutant emissions.
The IPAC-Emission model is a global model developed for the study of greenhouse gas (GHG) emission scenarios (Jiang et al., 2000a; IPCC, 2001b). It divides the world into 9 regions covering United States (US), Pacific OECD (OECD-P), Europe OECD and Canada (OECD-W), Eastern Europe and Former Soviet Union (EFSU), Middle East (ME), China, other Asia (S.E.Asia), Africa, and Latin America (LA). Major emission sources including energy activities, industries, land use, agriculture, and forests, can be simulated in the model framework. The model consists of three modules: (i) macro-economic module, (ii) end-use module and (iii) land-use module.
The IPAC-AIM/Technology model is a single region model for China, developed based on
AIM/enduse model (AIM Project team, 1996; Hu et al., 1996; Hu et al., 2001;Jiang et al., 1998). This model includes three modules (i.e., energy service demand projection, energy efficiency estimation and technology selection). The demand is divided among the industrial, agricultural, service, residential, and transportation sectors, and these sectors are further divided into sub-sectors. For both demand and supply side, more than 400 technologies are considered, including existing as well as advanced technologies that may be used in the future. The model searches for the least-cost technology mix to meet the given energy service demand. The most up-to-date information on these technologies were collected from large number of printed sources, as well as by consulting experts directly. Linking these two models provides both detailed analyses of various sectors and a global analysis of China’s energy future. The same scenarios and related model assumptions were used for both models. Energy demand for China was basically given by the IPAC-AIM/technology model by calculating demand from sectors with detailed technology information; whereas energy price and energy import data are derived from the IPAC-Emission model. The global energy analysis is given based on SRES B2 scenario(IPCC, 2001b), while the part for China is revised in this study. Figure 6 presents the link between two models.
Common parameter for China:GDP, Population, sector activities,
domestic energy supply
IPAC-emission model
IPAC-AIM/technology model
Energy priceEnergy import
Technology mixTechnology efficiency improvement
IPCC SRES B2 scenario

Figure 6 Link between models 2.2 Major assumptions
The major assumptions used in this study (including population, GDP growth and mix) are given in the following tables. The assumptions for population come from other studies. The assumed GDP growth rate is consistent with government targets and research by the Development Research Center (Zheng et al.,2004; Tan et al., 2002; Qu, 2003; Liu et al., 2002)
Table 2 Population assumption, million 2000 2010 2020 2030 Population 1267 1380 1460 1530 Urban 459 656 847 995 Rural 809 725 613 536
Note: Assumptions by authors, based on review of relevant studies Table 3 GDP growth in China
2000-2010 2010-2020 2020-2030 Annual GDP Growth Rate 8.2% 7.0% 5.6%
In order to analyze energy trading, we used the IPCC SRES B2 scenario as a global scenario
(Jiang et al.,2000a). The IPCC SRES scenario is a scenario family developed by the Intergovernmental Panel on Climate Change in 2001, which includes seven scenario groups. The B2 scenario reflects a world with good intentions, which it is not always capable of implementing. This storyline is most consistent with current national and international developments. On balance, the B2 world is one of central tendencies that can be characterized as neutral progress among SRES scenarios. Human welfare, equality and environmental protection all have high priority, but the world proves unable to tackle these concerns at a global level and resolves them as best it can regionally or locally. Generally, high educational levels promote both development and environmental protection. Education and welfare programs are widely pursued, leading to reductions in mortality and to a lesser extent fertility. This results in a central population projection of about 10.4 billion people by 2100, consistent with the United Nations median projection. Gross World Product (GWP) grows at an intermediate growth rate of 2 percent per year, reaching about US$ 235 trillion in 2100. The B2 storyline also presents a generally favorable climate for innovation and technological change, especially in view of high educational levels compared to today and relatively efficient markets at the regional level. B2 is a world of “regional stewardship” that, in some regions, is particularly frugal with energy and many other natural resources. Consequently, energy system structures differ among the regions. Overall high priority is given to environmental protection, although global policies prove elusive and regional polices vary widely. Major assumptions are given in Tables 4 to 6.
For the Developing Asia-Pacific region, the B2 scenario assumes that economic development utilizes resources so as to maintain equity for the future, while maintaining balance among regions as well as between urban and rural areas. Such an approach is introduced based on

the recognition of environmental issues and sustainable development. This scenario can be described as regional stewardship from a global perspective, based on a natural evolution of the present institutional policies and structures. It is characterized by limited population growth, medium economic growth, inequality reduction, weak global governance but strong national and regional governance, a strong de-urbanization trend, strong pursuit of environmental improvement, and encouragement of renewable energy use. It is a low per capita economic development scenario. In this scenario, the per capita GDP in the region is only 1/5 that of the OECD countries by 2100.
All of China’s emission scenarios were developed under the IPCC SRES B2 scenario. In IPAC-emission model, international energy trade was included in the study based on the resource cost effective availability (Jiang et al., 2000b; Jiang et al., 1999). The reason to select SRES B2 scenario is the assumption on economy development, population growth, and technology progress trend is quite similar with the scenario study in China.
Table 4 Key Scenario Drivers Assumed for the Developing Asia-Pacific and the World in IPAC-Emission model
Item Assumptions Asia-Pacific Population 4.7 billion in 2050
5.0 billion in 2100 Asia-Pacific Annual GDP Growth Rate
5.7% from 1990 to 2050, 3.8% from 2050 to 2100
World Population 11.7 billion in 2100 World GDP $250 trillion in 2100 GDP/ capita trends Disparity remains
GDP/capita of OECD becomes 7 times of non-OECD (now 13 times).
AEEI 1.0%-1.2% International Trade Low trade across regions
High trade cost Urbanization Increase in developing world before 2050,
decrease in developed world
Table 5 Assumptions for B2 Scenario for the Developing Asia-Pacific and the world Item Assumptions
Resource availability Oil/gas: medium; Biomass: high
Energy exploitation cost Medium Non-carbon renewable energy cost High for nuclear, medium for solar and
others Biomass availability Medium End-use technology efficiency improvement
Medium
Social efficiency improvement Medium
Transport conservation High Dematerialization trend Medium Land-use productivity improvement Medium Meat-oriented food habit Low Desulphurization degree High
Table 6 Factors influenced by key driving forces Driving forces
Sectors Factors Policies to promote the Change
Industry Value added change by sub-sectors within the sector(as service demand of some sub-sectors including machinery, other chemical, other mining, other industry sector etc.) Products structure change within one sector(as service demand in most industrial sectors)
Various policies relative to value added such as price policy, national plan for key industry, promote well working market Market oriented policies, national development policies.
Residential and Commercial
Energy activity change within the sector(such as change of use of heating, cooling; use of more efficient electric appliances etc.)
Public education, price policies
Social Efficiency Change
Transport Change of transport mode(more public transport, non-mobilty etc.) Traffic volume conservation(use less private car)
Transport development policies, public education
Technology progress
For all sectors
Efficiency progress for technology(unit energy use improvement) Technology mix change(, more
Technology R&D promotion, market oriented policies, international collaboration Market oriented policies, environmental regulation National energy industry policies,

advanced technologies) Fuel mix change(more renewable energy and nuclear)
import & export policies, tax system
2.3. Scenarios In order to analyze future energy demand and emissions in China, we consider three scenarios. Considering the uncertainty for energy intensive products demand with impact of WTO accession, a baseline scenario and a high demand scenario were given. Another one is policy scenario. The three scenarios are defined as follows:
- Baseline scenario: This scenario gives a basic trend to describe future economic activities. There will be better international trading and China’s economy will be part of global economy. Therefore China could rely on international markets and energy resource imports to meet part of its energy supply needs.
- High demand scenario: This scenario presents a high demand for energy in the future. The major driving force is China's assumed role as a center for manufacturing following WTO accession, which will bring more energy-intensive product production to China, such as steel, non-ferrous products and building materials. At the same time, more technology transfer and R&D on high efficiency energy use technologies is also assumed.
- Policy scenario: Various energy and emission control policies are assumed for this low demand scenario, which reflects energy supply and environmental constraints.
The basic assumptions for the three scenarios, such as population and GDP growth, are the
same. Sector service output for the three scenarios is given in Table 7. For the global B2 scenario, there is no change for other regions for these three scenarios.
Table 7 energy intensive products assumption in the model
Baseline scenario/Policy scenario
High demand scenario Unit 2002
2020 2030 2020 2030 Steel Mt 182.4 380 320 430 380 Copper Mt 1.63 4.5 5.2 5.2 5.8 Aluminum Mt 4.51 10 14 12 18 Ethylene Mt 5.43 12 16 14 20 Ammonia Mt 36.75 47 49 50 56 Chemical fertilizer
Mt 37.9 48 50 52 58
Cement Mt 725 1000 900 1100 1100 Glass Million
cases 234.4 480 530 520 560
Vehicles Million 3.25 11 12 15 17
Policy options to be considered in the policy scenario are given in Table 8. These policy options were defined based on policy potential in China and technology trends (Qu, 2003; Liu et al., 2002; IPCC 2001a; IPCC 2002). Many of these policies are already in place but need further implementation and strict standard, such as technology efficiency standard, renewable energy targets and fiscal policies, national energy targets etc.. Some new policies including taxes are also designed here. Table 8 Policy options used in the modeling study Policy options Explanation Technology promotion policy End use technology efficiency increase by
using new technologies Energy efficiency standard for buildings New buildings reach 75% increase standard in
2030 Renewable energy development policy Promote use of renewable energy(subsidy for
wind power, biomass power generation; government supporting village biogas supply system)
Energy tax Introduce vehicle tax by 2005, and energy tax by 2015
Public transport policies In cities public transport in 2030 will take 10 to 15% higher share than 2000.
Transport Efficiency Improvement High fuel efficiency vehicles widely used, including hybrid vehicle, compact cars, advanced diesel car
Power Generation Efficiency Efficiency of coal fired power plants increase to 40% by 2030
Nature Gas Incentive Enhance natural gas supply, localization of technology to reduce cost
Nuclear power development National promotion program by setting up target, enhanced government investment, technology development
2.3. Results
Energy demand is calculated using the IPAC-Emission model, Baseline scenario results are given in Figures 7 and 8.
Primary energy demand in the baseline scenario could go to 2.1 billion toe in 2020 and 2.7
billion toe in 2030. The annual growth rate from 2000 to 2030 is 3.6%, while energy elasticity of GDP is 0.58. Coal will be the major component energy in China (1.5 billion toe in 2030), with a 58% share in total energy demand. There is a rapid increase for natural gas demand in China, with its share in total primary energy use increasing from 4% in 2000 to 17.3% in 2030 (average annual

growth rate: 10%).
Figure 7 Primary energy demand in China for baseline scenario
With respect to final energy use, electricity and oil increase rapidly. Electricity demand increases from 112 million toe in 2000 to 451 million toe in 2030. Coal use in the residential sector will generally decrease and be replaced by gas and electricity; coal will be mainly used in large equipment such as boilers, steel industry and cement industry. Demand for oil products used for transport will increase quickly, with the rapid growth of vehicles in China. Oil use in transport will increase from 74 million toe in 2000 to 410 million toe in 2030(see figure 9).
Figure 8 Final energy demand in China for baseline scenario Figure 9 Final energy demand by sector
0
500
1000
1500
2000
2500
3000
2000 2010 2020 2030
Year
Mto
e
RenewableNuclearN.GasOilCoal
Final Energy Use by Sectors
0
500
1000
1500
2000
2500
2000 2010 2020 2030Year
Mto
e
Rural ResidentUrban ResidentTransportServiceIndustryAgriculture
Final Energy Demand in China, Baseline Scenario
0
500
1000
1500
2000
2500
2000 2010 2020 2030Year
Mto
e
ElectricityHeatGasOilCoal

For the high demand scenario, primary energy demand in 2030 is 2.9 billion toe, which is 250
million tons higher than the baseline scenario. Of the total primary energy demand, coal provides 59.1%, oil 16.1%, natural gas 17.8%, and nuclear 1.2%. Because this scenario assumes better integration in international markets, there is greater reliance on imported energy such as natural gas and oil(see figure 10 and 11).
Figure 10 Primary energy demand in high demand scenario Figure 11 Final energy demand in high demand scenario
By assuming the adoption of energy and environmental policy measures, the policy scenario results are described in Figures 12 and 13. Compared to the baseline scenario, there is nearly 245 million toe energy demand reduction in 2020, 280 mtoe in 2030. By exploring the policy options, we found there is big pressure to apply these policy option in order to reach the lower energy demand scenario, and also need to be introduced at early time because of long life span of energy technologies.
0
500
1000
1500
2000
2500
3000
3500
2000 2010 2020 2030
Year
Mto
e
RenewablesNuclearGasOilCoal
0
500
1000
1500
2000
2500
2000 2010 2020 2030Year
Mto
e
ElectricityGasOilCoal

Figure 12 Primary energy demand in policy scenario
Figure 13 Final energy demand in policy scenario
With the calculation of energy demand, several pollutant emissions were calculated. Figure 14 to 17 give SO2, NOx, TSP and CO2 emission from energy activities. SO2 emission will keep increasing before 2010 with the rapid increase of coal use in China. After 2010, more and more desulphurization technologies will be used and therefore SO2 emission will be reduced from fossil fuel use. Compared with high demand scenario, SO2 emission for baseline scenario in 2010 is 4.5million tons lower, but still increase 9.45million ton from 2000. This will be big challenge for government target. Because of lack of policy to control NOx, its emission keeps going up. Same trend is seen for TSP emission.
0
500
1000
1500
2000
2500
3000
2000 2010 2020 2030Year
Mto
eRenewableNuclearN.GasOilCoal
0
500
1000
1500
2000
2500
2000 2010 2020 2030Year
Mto
e
ElectricityGasOil ProductsCoal
0
5
10
15
20
25
30
35
40
1990 2010 2030 2050Year
Mill
ion
t-S BaselineHigh DemandPolicy

Figure 14 SO2 emission in China Figure 15 NOx emission in China Figure 16 TSP emission in China Figure 17 CO2 Emission in China If we look at the effects for policy options used in the policy scenario, by comparing with baseline scenario and high demand scenario, we found there are a package of policy options could be adopted now to reduce the growth rate of energy demand. For example policy to promote penetration rate of high energy efficiency technologies(see table 9), fiscal energy and environment policies including vehicle fuel taxes, subsidies for renewable energy, emission taxes, resource taxes etc., and policy to promote public involvement, are important for China to go to a low energy demand scenario.
0.0
0.5
1.0
1.5
2.0
2.5
1990 2000 2010 2020 2030 2040Year
Bill
ion
t-C BaselineHigh DemandPolicy
0
5
10
15
20
25
30
1990 2000 2010 2020 2030 2040Year
Mill
ion
t-NO
2
BaselineHigh DemandPolicy
0112233445
1990 2000 2010 2020 2030 2040Year
Mill
ion
ton
BaselineHigh DemandPolicy

Table 9 Technologies contributing to Energy saving and GHG emission reduction in short and middle-term Sector Technologies Steel Industry Large size equipment (Coke Oven, Blast furnace, Basic oxygen
furnace ,etc.), Equipment of coke dry quenching, Continuous casting machine, TRT Continuous rolling machine, Equipment of coke oven gas, OH gas and Blast Furnace gas recovery , DC-electric arc furnace
Chemical Industry Large size equipment for Chemical Production, Waste Heat Recover System, Ion membrane technology, Existing Technology Improving
Paper Making Co-generation System, facilities of residue heat utilization, Black liquor recovery system, Continuous distillation system
Textile Co-generation System, Shuttleless loom, High Speed Printing and Dyeing Non-ferrous metal Reverberator furnace, Waste Heat Recover System, QSL for lead and zinc
production Building Materials Dry process rotary kiln with pre-calciner, Electric power generator with
residue heat, Colburn process, Hoffman kiln, Tunnel kiln Machinery High speed cutting, Electric-hydraulic hammer, Heat Preservation Furnace Residential Cooking by gas, Centralized Space Heating System, Energy Saving
Electric Appliance, High Efficient Lighting, Solar thermal for hot water, insulation of building and energy efficient windows
Service Centralized Space Heating System, Centralized Cooling Heating System, Co-generation System, Energy Saving Electric Appliance, High Efficient Lighting
Transport Hybrid vehicle, advanced diesel truck, Low Energy Use Car, Electric Car, Fuel cell vehicle, Natural Gas Car, Electric Railway Locomotives, public transport development
Common Use Technology
High Efficiency Boiler, Fluid Bed Combustion Technology, High Efficiency Electric Motor Speed Adjustable Motor, Centrifugal Electric Fun, Energy Saving Lighting
Power generation Super critical unit, Natural Gas Combined Cycle, Pressured Fluid Bed Combustion Boiler, Wind turbine, Integrated Gasification Combined Cycle, Smaller Scale Hydropower, biomass based power generation
The energy saving and CO2 emission reduction potential by sector was simulated
with a wider cost range of up to US$50/tC. Emission reduction potential by these sectors with cost less than US$50/tC is shown in Figure 18. From this figure we can much potential could comes from no-regret options.

Figure 18 Emission reduction potentials by sectors
3. Energy resource and energy supply scenario in China Fossil fuel
Among confirmed energy resources, coal is , take the share of 96% total fossil fuel energy resource; remained confirmed oil reserve is 2.36billion tons by end of 2003; natural gas is 572.3trillion m3 by end of 2000, economic reserve is only 1trillion m3. This gives the future for coal supply in a relative low price, and coal will play key role in energy security concern in China. Recent years, with environment protection, natural gas is recognized as a clean fuel. Historically less attention was given to natural gas with much less investment on resource exploration. Chinese government and companies put much more investment on natural gas resource exploration. In last two years three very large natural gas resources were founded in main land China.
Hydro-Power China has planetary hydro-power resource, with very uneven distribution. 70% of hydro
power resource located in south-west China, where is far from consumption center. Recent years, transmit western electric power to eastern economic center is only of key component of west region development. Water resources appropriate to small-scale hydropower are plentiful in China. According to the results of China’s latest hydropower resource survey, the potential total capacity of small-scale hydropower that could be feasibly developed in the country is 125 gigawatts (GW). The resource base is widely distributed, including sites in over 1,600 counties (or cities), spread over 30 of China’s provinces (or provincial-level municipalities). Of 1,600 counties, 65% are located in Southwest China; and the small-scale hydropower resources of this region account for over 50% of total national potential capacity.
The Chinese Government has implemented policies that strongly support small-scale
hydropower and has included small-scale hydropower in its rural electrification plans. Small-scale hydropower has already played a very important role in the electrification of China, particularly in rural areas. About one-third of China’s counties rely on small-scale hydropower as their main source of electricity. China has further made the building of small-scale hydropower stations a critical component of rural energy development in its Western China
-100
1020304050607080
Steel
Am
monia
Ethylene
fertilizer
Calcium
Cem
ent
Brick
Glass
Alum
inum
Copper
Paper
Com
merce
TransportU
rban
Rural
Pow
er
Other
No Cost Less than US$50/t-C

Cropland Conversion Program and its Western China Energy Development Program, providing special funds derived from Government bonds for small-scale hydropower development. At present, existing small-scale hydropower stations, with an installed capacity of 30 GW, represent about 20% of the total projected potential capacity. It is expected that during the period between 2020 and 2030, China’s small-scale hydropower resources will be almost fully developed, with a capacity of 100 GW and accounting for about 10% of China’s total installed power capacity at that time.
However development of hydro power also faced several problems such as bad transportation, hard to construct, economic problem for long-distance transmit, eco-system problems, long pay-back-period and hard funding raising etc. Nuclear power
China has good condition to develop nuclear power. Economicly uranium resource is 650Kt. And international uranium resource is quite large, uranium resource with cost lower than US$80/kgU is around 3 to 4 million tons, enough for more than 50 years use for power generation. If it is used in fast breed reactor, the resource is enough for more then 3000 years. Chinese companies already has 300MW light water reactor technologies, and nuclear power plants could be construct with own technologies. Chinese companies already has ability to produce 3 to 4 set of nuclear power generators. There are more than 40 to 50 GW nuclear power plants allocated in China. China also has ability to produce, supply nuclear fuel, and process used fuels. Biomass Energy
China’s main biomass resources are agricultural wastes, scraps from the forestry and forest
product industries, and municipal waste. Agricultural wastes are widely distributed. Among them, the annual production of crop stalks alone surpasses 600 million tons; and crop stalks suitable to energy production are estimated to represent a potential of 12,000 PJ annually. Wastes from the processing of agricultural products and manure from livestock farms in theory could yield nearly 80 billion cubic meters of biogas. Scraps from forestry and forest product industries represent a resource equivalent to 8,000 PJ per annum. Furthermore, with the implementation of China’s Natural Forest Protection Program (which includes logging bans and logging reductions over much of the nation’s natural forests) and its Sloping Cropland Conversion Program (which calls for the conversion of much of the nation’s sloping cropland to trees and grasses), it is expected that the amount of scraps from forestry and forest product industries used in energy applications will increase substantially, with the potential of reaching 12,000 PJ per annum by 2020. Municipal waste in China is expected to reach 210 million tons per annum in 2020. If 60 percent of this is used is used in landfill methane applications, two to ten billion cubic meters of methane could be produced. Finally, “energy crops” are a biomass energy resource with the potential for commercialization. There are many types of energy crops that are suited to growing in China. Chief among these are rapeseed and other edible oil plants and some plants that grow in the wild, such as sumac, Chinese goldthread, and sweet broomcorn. By 2020, such crops could potentially yield over 50 million tons of liquid fuel annually, including over 28 million tons of ethanol and 24 million tons of bio-diesel. In sum, whether burned directly, used

to produce electricity, or used as a substitute liquid fuel, biomass energy resources have the potential for playing a decisive role in China’s energy supply. Wind Power
With large land mass and long coastline, China has relatively abundant wind resources. According to estimates by the China Meteorology Research Institute, land-based, exploitable wind resources represent a potential power generation capacity of 253 GW. (Note: This estimate is based on wind resources at a height of ten meters above the ground.) The institute has further estimated ocean-based wind resources to represent an exploitable potential of about 750 GW, so that the total estimated wind power potential of China is about 1,000 GW. Areas rich in wind resources are located mainly along the southeast coast and nearby islands and in Inner Mongolia, Xinjiang, Gansu Province’s Hexi Corridor, and in some parts of Northeast China, Northwest China, North China, and the Qinghai-Tibetan Plateau. Aside from this, there are also certain areas in China’s interior that are rich in wind resources. See Figure 4 for an illustration of the distribution of China’s wind resources. China has large marine areas; and ocean-based wind resources are plentiful. With current technology, wind turbines can be installed in the ocean up to 10 kilometers away from the coast and at ocean depths of up to 20 meters.
By the end of 2003, total grid-connected installed capacity of wind power in China was 560 MW. (See Figure 5 for growth in installed wind capacity over the past 13 years.) Currently, China is tenth in the world in terms of total installed wind power capacity. Aside from grid-connected installations, China also has about 200,000 stand-alone small-scale wind turbines (with installed capacity of 25 MW) that provide electricity to rural households located in remote areas. China has basically fully mastered the manufacture of large-scale wind turbines of 750 kW or less and is in the process of developing megawatt-scale turbines, which are expected to be available in 2005. China has also established 40 wind farms and has mastered wind farm operation and management. The nation now has qualified technical personnel in the areas of wind power design and construction. Thus, a sound base for developing large-scale wind power in China has been developed. Energy supply scenarios
This study also simulated future energy production in China. Figures 9 and 10 give energy
production in the baseline and high demand scenarios. Coal production could reach 1.31 billion toe by 2020 and 1.48 billion toe by 2030. Chinese coal industry experts estimate an upper bound of coal production of 1.2 billion toe by 2020. Coal demand, therefore, could exceed domestic coal production in China. Oil production is projected to be 190 million tons in 2020 and 175 million tons in 2030. This is within the forecast of experts from the oil industry, which range from 180 to 200 million tons in 2020. Natural gas production will be 133 billion m3 in 2020 and 312 billion m3 in 2030. The production of natural gas is within the range of natural gas production forecast by energy experts, which ranges from 130 to 150 billion m3 in 2020. Nuclear power generation will increase quickly in future, but still represents a small share, because of its high cost. The model results shows that nuclear power generation could reach 256 TWh in 2020 and 344 TWh in 2030, compared with 16.7 TWh in 2000. The installed capacity will be 39,400 MW in 2020 and 53,030

MW in 2030. Hydropower output will increase from 224 TWh in 2000 to 555 TWh in 2020 and 722 TWh in 2030, with capacity reaching 154 GW in 2020 and 201 GW in 2030.
Figure 9 Energy production in baseline scenario Figure 10 Energy production in high demand scenario
According to the energy demand and production, we can calculate the need for future energy
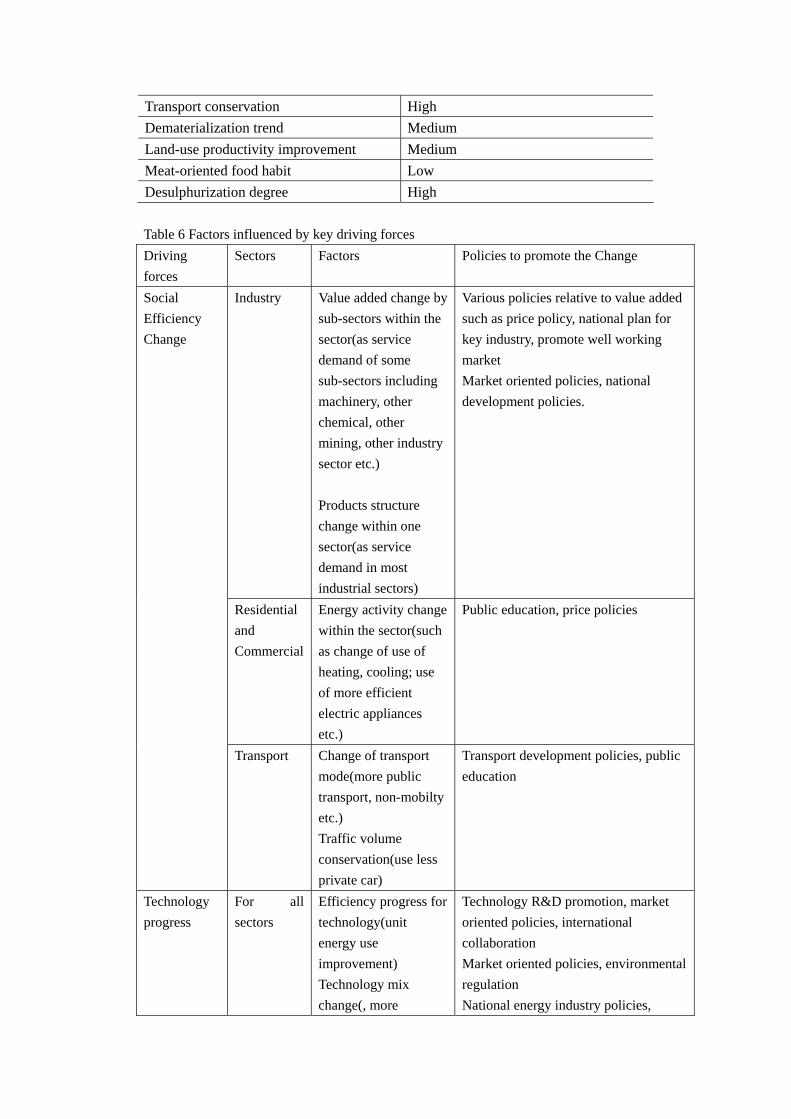
imports (see Figures 11 and 12). In baseline scenario, future fossil energy imports could reach 375 million toe annually in 2020 and 562 million toe in 2030 (for comparison, in 2000, the USA imported 870 million tce). Oil will be the major energy source to be imported: oil imports will reach 230 million tons in 2020 and 300 million tons by 2030. Natural gas imports will amount to 154 billion and 183 billion m3 in 2020 and 2030, respectively. Even coal will be imported after 2020, with 129 million tons of coal needed annually by 2030.
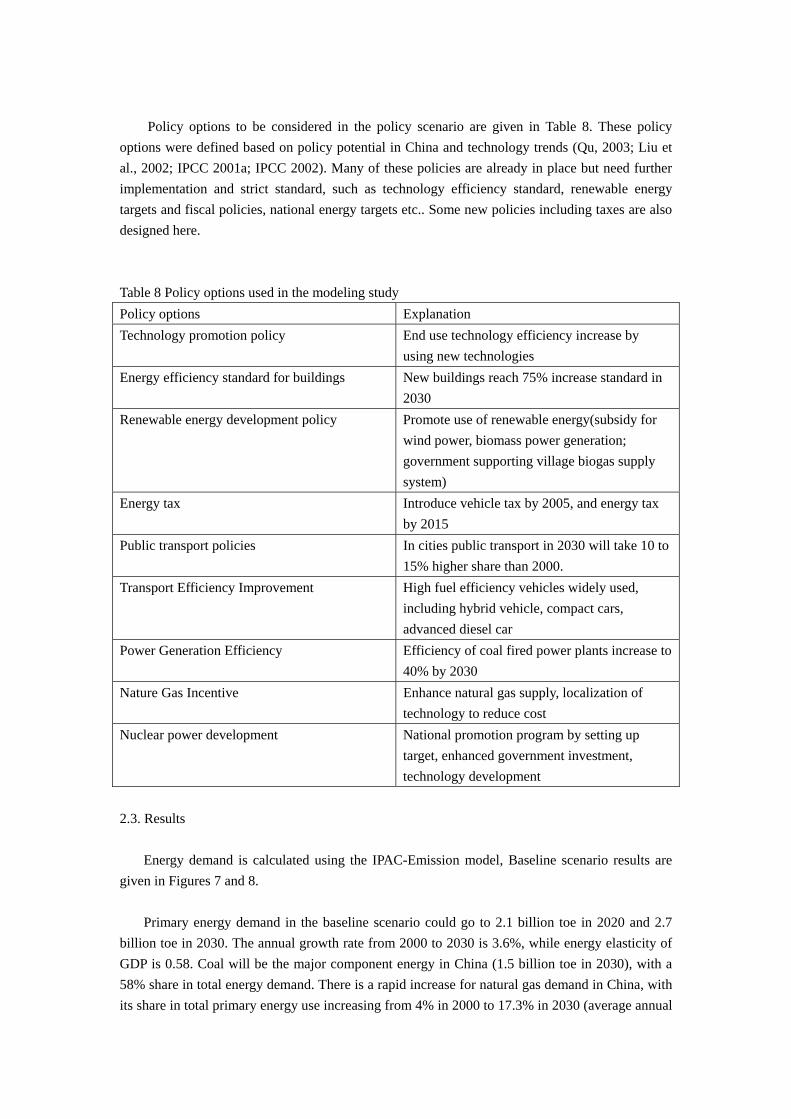
In the high demand scenario, energy imports are much bigger. Total fossil energy import will be 445 million toe in 2020 and 680 million toe in 2030. There will be more coal import in this scenario, reaching 189 million toe in 2030.
0
500
1000
1500
2000
2500
2000 2010 2020 2030
Year
Mtoe
Other Renewable
Modern Biomass
hydro
Nuclear
N.Gas
Oil
Coal
0
500
1000
1500
2000
2500
2000 2010 2020 2030
Year
Mtoe
Other Renewable
Modern Biomass
hydro
Nuclear
N.Gas
Oil
Coal
Figure 11 Energy imports in the baseline scenario Figure 12 Energy imports in the high demand scenario 4. Conclusion
This scenarios study shows primary energy demand in 2020 could range from 1.9 billion toe to 2.4 billion toe. This depends on technology progress, energy intensive sector development, and polices applied etc. Such large amount of energy demand will bring serious pressure on energy supply in China. Studies show that by 2020 the largest domestic oil supply could reach 200million ton, natural gas 160billion m3, and coal 2.8 billion ton. This means for lowest energy demand scenario 200 million ton oil and 100billion m3 natural gas shall have to be imported; for high energy demand scenario, nearly 400million ton oil, 260billion m3 natural gas and 300million ton coal shall have to be imported. Such large amount of energy demand and imports, will put high pressure on energy supply
-100
0
100
200
300
400
500
600
2000 2010 2020 2030
Year
Mto
e N.GasOilCoal
0
100
200
300
400
500
600
700
800
2000 2010 2020 2030
Year
Mto
e N.GasOilCoal

industry in China, therefore a well-designed strategy for energy system and energy industry development in China should be prepared. Considering the possibility of policy options analyzed in this study, following suggestion are given: - Technology progress is a key to reach future low energy demand and clean future, it should be
put much more emphasis for new generation technologies. In the scenario study, technology progress will contribute mush of the energy saving, while no disturbing on welfare. With
- Using of energy tax, resource tax, export tax for energy intensive products etc. , has good effect on energy saving and optimization of economic structure. These should be given much more attention.
- Similar to other developed countries which have large amount of energy import, China should establish energy security system. However the size of strategic storage should be decided based on global perspective of oil demand.
- Multi-energy system should be established to diversify energy supply. Renewable energy should be developed as alternative energy source. Bio-fuel for vehicle fuel could reduce energy import.
- Various national laws, regulations, and standards for energy industry should be prepared to reach the target of clean energy system. So far there is very weak legislation system to promote clean energy system.
- Clean coal technology should be emphasized to mitigate emission from coal combustion. Only a few of countries in the world are using coal in large scale, therefore development of clean coal technologies depends on them. China is the biggest country to use coal, and in future the coal use will increase quickly, which could take more than 40% of world total coal use in 2020. Therefore, clean coal technology is crucial for China. China should have clear development plan to promote clean coal technology. It is better to work in close coordination with other countries to develop new generation of clean coal technologies.
Due to low cost of production, it’s likely that China will become a major manufacturing center
in the world relying on energy intensive and resource intensive products. This trend should be controlled to avoid China becoming a country to provide raw material and cause damage to environment. External cost should be included into production cost. Planning for energy and resource intensive products should be made, to avoid possible environment and economic damage. References AIM Project Team (1996) A Guide to the AIM/End-use Model, AIM Interim Paper, IP-95-05, Tsukuba, Japan. China Year Book 2004 (2004) State Statistical Bureau, Beijing China Environment Year Book 2004 (2004) China Environment Year Book Editing Committee, Beijing China Energy Year Book 2002-2003(2004) State Statistical Bureau, Beijing Hu X, Jiang K(2001), GHG Mitigation Technology Assessment, China Environment Science Publishing House, Beijing(in Chinese) Hu X, Jiang K, Liu J (1996) Application of AIM/Emission Model in P.R. China and Preliminary Analysis on Simulated Results, AIM Interim Paper, IP-96-02, Tsukuba, Japan.

IPCC(2001a) Climate Change 2001: Mitigation, Working Group III, Cambridge University Press, Cambridge. IPCC (2001b) IPCC Special Report on Emission Scenario, Cambridge University Press, UK. IPCC(2002) Synthesize Report of TAR, Cambridge University Press, Cambridge.
Jiang K, Masui T, Morita T, and Matsuoka Y (2000b) Long-term GHG Emission Scenarios of
Asia-Pacific and the World. Technological Forecasting & Social Change 61(2-3).
Jiang K, Morita T, Masui T, and Matsuoka Y, (2000a) Global Long-Term GHG Mitigation Emission Scenarios based on AIM,Environment Economics and Policy Studies Vol.3, 2000. Jiang K, Hu X, Matsuoka Y, Morita T (1998) Energy Technology Changes and CO2 Emission Scenarios in China. Environment Economics and Policy Studies 1:141-160. Jiang K, Morita T, Masui T, and Matsuoka Y,(1999) Long-Term Emission Scenarios for China,Environment Economics and Policy Studies Vol.2:267-287, 1999. Liu J, Ma F, Fang L (2002), China Sustainable Development Strategy, China Agriculture Publishing House, Beijing. (in Chinese) Lu Z, Zhao Y, Shen Z(2003) Whether China Can Become a Global Factory?(in Chinese), Economic Management Publishing House, Beijing. Power Industry Information(2004), China Power, Vol 38, No.3, 2005. QU K, (2003) Energy, Environment Sustainable Development Study, China Environment Science Publishing House, Beijing Tan S., Wang Y, Jiang S (2002), Economy Globalization and Developing Countries, Social Science Documentation Publishing House, Beijing. Zheng Y, Zhang X, Xu S(2004), China Environment and Development Review, Social Science Documentation Publishing House, Beijing.