management discussion and analysis - tmk-group.com
TRANSCRIPT

MANAGEMENT DISCUSSION AND ANALYSISOF FINANCIAL POSITION AND RESULTS OF OPERATIONS
TMKANNUAL REPORT 2011
www.tmk-group.com
80 contents Key eventsLetter to Shareholders
About the Company
TMK Securities Corporate Governance
Corporate Citizenship
Financial Statements
Major Transactions
Management Discussion
MANAGEMENT DISCUSSION AND ANALYSISOF FINANCIAL POSITION AND RESULTS OF OPERATIONS
MANAGEMENT DISCUSSION AND ANALYSISOF FINANCIAL POSITION AND RESULTS OF OPERATIONS
The following review of our financial position and results of operations is based on, and should be read in conjunction with, our consolidated financial statements and related notes for the year ended December 31, 2011.
Certain information contained in this section, includ-ing information with respect to our plans and strategy, in-cludes forward-looking statements and inherently involves risks and uncertainties. In assessing this report, various risk factors must be considered, which means that our actual results may differ significantly from those presented in these forward-looking statements.
RoundingCertain monetary amounts, percentages and other figures included in this report are subject to rounding adjustments. On occasion therefore, amounts shown in tables may not be the arithmetic accumulation of the figures that precede them, and figures expressed as percentages in the text and in tables may not total 100%.
Executive overviewWe are one of the leading global manufacturers and suppliers of tubular products for the energy industry, as well as other industrial applications. We are also the leading manufacturer and supplier of steel pipes for the energy industry in Rus-sia. We focus our efforts on high-margin oil country tubular goods (OCTG) which account for the majority of our sales.
Our industrial operations are geographically diversified with manufacturing facilities in Russia, the United States, Romania and Kazakhstan. We sell our products worldwide to major oil and gas as well as automotive, engineering and power generation companies. In 2011, we delivered 61% of our tubular products to customers located in Rus-sia and 24% to our customers in North America. We also provide related services to oil and gas companies.
Sales volumes of our tubular products increased as the Russian pipe market continued to grow; however, our share in the Russian market decreased from 27% to 25% as competition intensified due to the commissioning of new production facilities for large-diameter pipe and higher imports, in particular from the Ukraine. Nevertheless, we retained a strong market position for our key products, maintaining a 59% market share in seamless OCTG and 64% in seamless line pipe markets.
8.
TMKANNUAL REPORT 2011
www.tmk-group.com
81 contents Key eventsLetter to Shareholders
About the Company
TMK Securities Corporate Governance
Corporate Citizenship
Financial Statements
Major Transactions
Management Discussion
We are the largest exporter of pipes in Russia. Export sales of pipes produced in Russia accounted for 14% of our total sales volumes for the year as compared to 12% in 2010.
In 2011, we sold 4,185 thousand tonnes of tubular prod-ucts, an increase of 6% as compared to last year, including 2,342 thousand tonnes of seamless pipe. Our sales of seam-less and welded OCTG achieved 1,535 thousand tonnes, a 4% increase as compared to 2010.
In 2011, we reported total consolidated revenue of $6,754 million, up 21% as compared to 2010. Adjusted EBITDA1 increased 11% to $1,050 million as compared to $942 million in 2010. Adjusted EBITDA margin was 16% as compared to 17% in 2010.
The second half of 2011 saw lower operating results as compared to the first half of 2011, mainly affected by the slowdown in the third quarter. In the third quarter of 2011, our sales volumes declined as compared to those in the each of the preceding two quarters as market activities are usually lower in that quarter of each year and our planned equip-ment maintenance works occurred during that time. Though not achieved the levels of the first and second quarters, our sales volumes in the fourth quarter increased as compared to those in the third quarter, mainly in the segment of seam-less OCTG and line pipe. Therefore we continued to show a positive trend in 2011 as compared to last year.
Key eventsIn January 2011, we supplied seamless pipe to Gazprom for construction of the Portovaya compressor station. Unique in its technical and operating characteristics, this compres-
sor station is a starting point for gas supplies via the Nord Stream gas pipeline.
In January 2011, we completed the offering of $500 million of 7.75% loan participation notes which fall due in January 2018. The notes have been admitted for trading on the London Stock Exchange. The proceeds were used to refinance existing indebtedness.
In March 2011, we won an open auction for the acqui-sition of a 25.5% stake in OAO Volgograd River Port for RUB113 million (approximately $4 million). The auction was held by the Russian Federal Property Management Agency. The acquisition was finalised on August 4, 2011. This acquisition will allow us to optimise logistics for our Volzhsky plant, located close to the Volgograd River Port, and will create additional opportunities to ship OCTG and line pipe to the oil and gas fields in the Caspian region.
In March 2011, the second thread line for ULTRA connections with a capacity of 240 thousand joints was commissioned at TMK IPSCO’s facility in Brookfield, U.S.A. The new line will also enhance our product range and help us to meet growing demand from oil and gas companies.
In April 2011, we completed shipments of casing pipe with ULTRA SF Premium Connections to Gazprom Neft for the Urmanskoye field in the Tomsk region in Western Siberia. The pipes were produced by TMK IPSCO. This was the first of our deliveries to Russia of premium tubular products made in the United States.
In May 2011, we finalised the sale of TMK Hydroen-ergy Power S.R.L., non-core assets previously owned by
MANAGEMENT DISCUSSION AND ANALYSISOF FINANCIAL POSITION AND RESULTS OF OPERATIONS
1 Adjusted EBITDA — See “Selected financial data”.
8.

TMKANNUAL REPORT 2011
www.tmk-group.com
82 contents Key eventsLetter to Shareholders
About the Company
TMK Securities Corporate Governance
Corporate Citizenship
Financial Statements
Major Transactions
Management Discussion
TMK-RESITA, comprising four hydropower generating units located in Romania.
In June and July 2011, as a part of the Programme on Development and Testing of TMK Premium Connections, we successfully completed qualification tests of TMK PF and ULTRA-QX connections in accordance with ISO 13679 CAL IV standard. Certification of the connections will al-low us to provide more tailored solutions to customers and further strengthen our position in the segment of premium pipe products.
In June 2011, we started production of pipe with a new TMK CWB premium connection for drilling with casing. The implementation of new technology will allow us to increase the connection’s gas-tightness and operational efficiency. One of the TMK CWB connection’s outstand-ing features is its ability to be coupled with other types of threads without adapters.
In June 2011, the annual shareholders’ meeting ap-proved a final dividend in respect of the full-year 2010 in the amount of 796,948 thousand Russian roubles ($28 million at the exchange rate on the date of approv-al) or 0.85 Russian roubles per share ($0.03 per share), of which 60,839 thousand Russian roubles ($2 million at the exchange rate on the date of approval) related to treasury shares in possession of the Group.
In September 2011, Standard & Poor’s Rating Services raised its long-term corporate credit rating on TMK to “B+/ru A”. The upgrade reflects the improvement in TMK’s liquidity and its operating and financial performance in the first half of 2011.
In October 2011, we commissioned a thread line for cas-ing with premium connections at Orsky Machine Building Plant which is part of TMK’s oilfield services division. The capacity of the new thread line is 24,000 tonnes of pipe of the designated product mix per year. Production of casing with gas tight connections will allow the company to expand its product line and ability to offer new products for oil and gas wells and related infrastructure development and services.
In November 2011, an extraordinary general meet-ing of shareholders approved an interim dividend in respect of the first six months of 2011 in the amount of 871,955 thousand Russian roubles ($28 million at the exchange rate on the date of approval) or 0.93 Russian roubles per share ($0.03 per share), from which 69,211 thousand Russian roubles ($2 million at the exchange rate on the date of approval) related to the treasury shares in possession of the Group.
In December 2011, we signed an agreement with LU-KOIL, one of the largest global vertically integrated oil and gas companies, on pipe supplies in 2012. LUKOIL is a longstanding partner of TMK. Under the agreement, we guarantee to supply all of the company’s requirements for pipe products. The supply volumes are planned to be not less than 260 thousand tonnes for the year.
In December 2011, TMK IPSCO and Ferrous Metal Pro-cessing Co. signed a 12-year agreement to install a slitting line at TMK IPSCO’s manufacturing facility in Wilder, KY, U.S.A. This will be the largest slitter in North America. The commercial operation is scheduled to start in autumn 2012. Ferrous will own and operate the new facility and slit steel
MANAGEMENT DISCUSSION AND ANALYSISOF FINANCIAL POSITION AND RESULTS OF OPERATIONS
8.

TMKANNUAL REPORT 2011
www.tmk-group.com
83 contents Key eventsLetter to Shareholders
About the Company
TMK Securities Corporate Governance
Corporate Citizenship
Financial Statements
Major Transactions
Management Discussion
coils for TMK IPSCO on a toll basis, providing 100 percent of the company’s slitting needs for pipe production.
In December 2011, TMK IPSCO completed construction of its new R&D centre located in Houston, TX, USA. Em-ployees and test equipment began moving into the facility in January 2012 and the facility will be fully operational in July 2012. We are one of the few global pipe producers with its own R&D centre and whose testing results are recognised by oil and gas majors. This project underlines TMK’s commitment to developing new products to service the industry and to meet the evolving needs and challenges that oil and gas companies face in their business.
In December 2011 and February 2012, TMK PF and TMK PF ET premium connections successfully passed qualifica-tion tests. All tests were conducted at the Oil States Indus-tries international testing centre in Aberdeen, UK. TMK PF passed qualification tests in accordance with the ISO 13679 CAL IV standard, while TMK PF ET passed tests designed to ensure gas-tightness under the application of internal and external pressure, tension and compression forces.
We developed and introduced a vacuum insulated tubing (VIT), a technologically unique product offered by a limited number of producers globally. In early 2012, we delivered the first shipment of VIT to Gazprom for use in the Bo-vanenkovo gas condensate field on the Yamal Peninsula.
Business structureOur operating segments reflect the Group’s management structure and the way financial information is regularly reviewed. For management purposes, the Group is organ-
ised into business divisions based on geographical location, and has three reportable segments:• Russian division: manufacturing facilities located in
the Russian Federation and Kazakhstan, oilfield service companies and trading companies in Russia, Kazakh-stan, Switzerland, the United Arab Emirates and South Africa. The Russian division is engaged in the produc-tion and supply of seamless and welded pipe, premium products and the rendering of related services to oil and gas companies;
• American division: manufacturing facilities and trad-ing companies located in North America. The Ameri-can division is engaged in the production and supply of seamless and welded pipe and premium products, including ULTRA connections;
• European division: manufacturing facilities located in Romania, and trading companies located in Italy and Germany. The European division is engaged in the production and supply of seamless pipe and steel billets.
MANAGEMENT DISCUSSION AND ANALYSISOF FINANCIAL POSITION AND RESULTS OF OPERATIONS
8.

TMKANNUAL REPORT 2011
www.tmk-group.com
84 contents Key eventsLetter to Shareholders
About the Company
TMK Securities Corporate Governance
Corporate Citizenship
Financial Statements
Major Transactions
Management Discussion
Financial and operating highlightsIn 2011, our operating results demonstrated a positive trend as compared to 2010. The following table provides consolidated operating results for the periods presented:
Year ended December 312011 2010 Change
in millions of U.S. dollars in %Sales volume (in thousand tonnes) 4,185 3,962 6%Revenue 6,754 5,579 21%Cost of sales (5,307) (4,285) 24%GROSS PROFIT 1,446 1,293 12%GROSS PROFIT MARGIN 21% 23%Operating expenses1 (675) (694) (3)%Foreign exchange (loss)/gain, net (1) 10 (110)%
Gain/(loss) on changes in fair value of derivative financial instrument 45 (12) (475)%Finance costs, net (271) (412) (34)%INCOME BEFORE TAX 544 185 194%Income tax expense (159) (81) 96%NET INCOME 385 104 270%
NET INCOME ADJUSTED FOR GAIN/(LOSS) ON CHANGES IN FAIR VALUE OF DERIVATIVE INSTRUMENT2 340 116 193%ADJUSTED NET INCOME MARGIN3 5% 2%ADJUSTED EBITDA4 1,050 942 11%ADJUSTED EBITDA MARGIN 16% 17%
1 “Operating expenses” include selling and distribution, general and administrative, advertising and promotion, research and development, impairment/reversal of assets, gain on disposal of assets held for sale and net other operating income/expense.
2 Net income adjusted for gain/loss on changes in fair value of derivative financial instrument is presented in the table because we consider it an important supplemental measure of our performance. Net income adjusted for gain/loss on changes in fair value of derivative financial instrument is not a measurement of performance under IFRS and should not be considered as an alternative to net income or any other performance measures derived in accordance with IFRS.
3 Adjusted net income margin is calculated as the quotient of Net Income adjusted for gain/loss on changes in fair value of derivative instrument divided by Revenue.
4 Adjusted EBITDA — See “Selected financial data”.
MANAGEMENT DISCUSSION AND ANALYSISOF FINANCIAL POSITION AND RESULTS OF OPERATIONS
8.

TMKANNUAL REPORT 2011
www.tmk-group.com
85 contents Key eventsLetter to Shareholders
About the Company
TMK Securities Corporate Governance
Corporate Citizenship
Financial Statements
Major Transactions
Management Discussion
For the purposes of this report, net income has been ad-justed for the gain on changes in fair value of the derivative financial instrument in the amount of $45 million in 2011 as compared to the adjustment for the comparable loss of $12 million in 2010 to reflect management’s opinion in respect of the treatment of the conversion option (see “Gain/loss on changes in fair value of derivative financial instrument”) .
Following market growth and increased sales volumes, our financial performance and financial indicators im-proved in 2011. Our operating and financial results by quarter nevertheless demonstrated differing development trends. The following table sets forth information regard-ing certain key financial indicators as of the dates and for the quarters ended:
December 31, 2011
September 30, 2011
June 30, 2011
March 31, 2011
December 31, 2010
in millions of U.S. dollarsSales volume 1,017 989 1,119 1,060 1,110Revenue 1,603 1,604 1,878 1,669 1,648Adjusted EBITDA 223 202 332 293 293Adjusted EBITDA margin 14% 13% 18% 18% 18%Net debt-to-EBITDA ratio LTM1 3 .4 3.2 3 .3 3 .7 3 .9
After two successful quarters, our financial and operat-ing results were negatively affected in the third quarter of 2011 by lower sales of welded large-diameter pipe as a result of the completion of certain major projects in Russia. In addition to the decrease in sales volumes of large-diameter pipe shift in our product mix negatively
affected the profitability of the Russian division. At the same time, the profitability of the U.S. welded pipe seg-ment reduced as high cost inventory purchased in the second quarter was consumed. Repair expenses incurred at STZ, VTZ and SinTZ also adversely affected the profit-ability of the Group.
In the fourth quarter of 2011, our results of operations were higher than in the previous quarter, mainly because of the favorable changes in product mix. Share of seam-less OCTG and seamless line pipe increased while share of seamless industrial and welded industrial pipe declined. However, sales volumes of the fourth quarter have not reached those of the first and second quarters, particularly, sales volumes of welded large diameter pipe remained flat
1 Net-Debt-to-EBITDA ratio is defined as the quotient of Net Debt at the end of the given reporting date divided by the Adjusted EBITDA for the 12 months immediately preceding the given reporting date.
Adjusted EBITDA — See “Selected financial data”.
as compared to those in the third quarter. At the same time, the decrease in the cost of scrap in the Russian division and the decrease in the cost of coil in the American division positively affected the cost per tonne of seamless pipe in the Russian division and the cost per tonne of welded pipe in the American division, respectively.
MANAGEMENT DISCUSSION AND ANALYSISOF FINANCIAL POSITION AND RESULTS OF OPERATIONS
8.

TMKANNUAL REPORT 2011
www.tmk-group.com
86 contents Key eventsLetter to Shareholders
About the Company
TMK Securities Corporate Governance
Corporate Citizenship
Financial Statements
Major Transactions
Management Discussion
For the reasons mentioned above, Adjusted EBITDA decreased in the third quarter of 2011 and showed only moderate growth in the fourth quarter of 2011.
The decrease in our net debt as of December 31, 2011 as compared to December 31, 2010 was mainly due to the Russian rouble depreciation against the U.S. dollar, and increased cash balance. As a result the net debt-to-EBITDA ratio improved from 3.9 as of December 31, 2010 to 3.4 as of December 31, 2011.
Following the improvement in our operating performance and stronger financial position, we have resumed the pay-ment of dividends. We distributed a final dividend in respect of 2010 and an interim dividend in respect of the first six months of 2011. No dividends have been paid since 2008.
Sales volumeThe following table presents pipe sales volumes by report-ing segment for the periods presented:
Year ended December 31
2011 2010 Change Change
in thousand tonnes
in thousand tonnes in %
Russia 3,115 2,989 126 4%America 892 804 88 11%Europe 178 169 9 5%TOTAL PIPE 4,185 3,962 223 6%
Russia. In 2011, sales volumes of seamless pipe dem-onstrated an 11% increase year-on-year, on the back of in-
creased demand for seamless pipe, whereas welded pipe sales decreased 5%. Sales of all types of seamless pipe increased with seamless line and seamless OCTG demonstrating the most significant growth, reflecting the increase in demand from oil and gas companies. Seamless OCTG sales growth was achieved despite slowing export sales caused by the po-litical instability in North Africa and the Middle East. Lower sales of welded pipe were mostly attributed to a reduction in deliveries of large-diameter welded pipe for the con-struction of major pipelines as a result of the completion of some major projects in the first half of the year as well as the postponement of new pipeline projects. The growing produc-tion capacities by other pipe producers and higher imports also negatively impacted sales of large-diameter welded pipe which were consequently 13% lower than last year.
America. Sales in the American division increased 11% in 2011 as compared to 2010 reflecting growth in pipe consumption in the U.S. market. Greater volumes were mainly driven by increases in both seamless and welded line pipe sales jumping 85% year-on-year. Sales growth was driven by strong drilling activity reflecting growth in the shales and high oil prices.
Europe. The division produces seamless pipe and steel billets. Sales of seamless industrial pipe, a core product for the division, increased 13% reflecting high market de-mand, mainly from the engineering industry.
In 2011, our seamless pipe sales volumes increased, bringing total sales up 6%. Sales of welded pipe remained flat. The table below presents sales volumes by group of products for the periods presented:
MANAGEMENT DISCUSSION AND ANALYSISOF FINANCIAL POSITION AND RESULTS OF OPERATIONS
8.

TMKANNUAL REPORT 2011
www.tmk-group.com
87 contents Key eventsLetter to Shareholders
About the Company
TMK Securities Corporate Governance
Corporate Citizenship
Financial Statements
Major Transactions
Management Discussion
Year ended December 31
2011 2010 Change Change
in thousand tonnes
in thousand tonnes in %
Seamless pipe 2,342 2,120 222 10%Welded pipe 1,843 1,842 1 0%TOTAL PIPE 4,185 3,962 223 6%
RevenueThe table below presents revenue by reporting segment for the periods presented:
Year ended December 31
2011 2010 Change Change
in millions of U.S. dollars
in millions of U.S. dollars in %
Russia 4,788 3,998 790 20%America 1,590 1,324 266 20%Europe 375 256 119 46%TOTAL REVENUE 6,754 5,579 1,175 21%
Russia. Year-on-year, revenue generated by the Rus-sian division increased 20%, or $790 million, primarily reflecting higher selling prices and sales volumes of tu-bular products.
The revenue growth mainly benefited from higher av-erage selling prices and changes in product mix of seam-less and welded pipe which accounted for a $396 million
and $63 million increase, respectively. A volume effect accounted for a $242 million increase in seamless pipe revenue, whereas revenue from sales of welded pipe de-creased $75 million.
Revenue from other operations grew $10 million mainly due to an increase in revenue from pipe-related services, e.g. protective coating, repair and field services.
The favorable effect of translation from the functional to the presentation currency1 accounted for $155 million.
America. In the American division, revenue grew 20% or $266 million in 2011 as compared to 2010.
Revenue growth due to higher selling prices and changes in product mix of tubular products contributed $94 million and $64 million to the growth of seamless and welded pipe revenue, respectively. In 2011, the share of high-priced seamless OCTG pipe with premium con-nections more than doubled in total sales volumes of seamless OCTG .
The revenue growth of seamless and welded pipe attributable to changes in sales volumes accounted for $58 million and $78 million, respectively. The growth was mostly derived from increased sales volumes of welded and seamless line pipe as well as seamless industrial pipe.
Revenue from other operations, mainly premium threading services, declined $28 million as threading capacities were intensively used for pipes manufactured by TMK production subsidiaries, including plants located in Russia and Romania. As a result, sales of own-produced pipe with ULTRA premium connection increased and
MANAGEMENT DISCUSSION AND ANALYSISOF FINANCIAL POSITION AND RESULTS OF OPERATIONS
1 For the purposes of this management discussion and analysis, the translation effect on revenue/costs and income/expense illustrates an influence of different rates used for translation of such revenue/costs or incomes/expenses from functional to presentation currency in different reporting periods.
8.
TMKANNUAL REPORT 2011
www.tmk-group.com
88 contents Key eventsLetter to Shareholders
About the Company
TMK Securities Corporate Governance
Corporate Citizenship
Financial Statements
Major Transactions
Management Discussion
revenue from pipe threading services for external cus-tomers declined.
Europe. A 46% year-on-year revenue growth was driven primarily by an increase in selling prices for tubular prod-ucts in response to the market recovery and increased costs of raw materials.
Changes in selling prices and product mix contributed $51 million to the total revenue growth. Revenue growth at-tributable to higher sales volumes amounted to $11 million, mainly driven by increased sales of seamless industrial pipe.
An increase in revenue from other operations in the amount of $42 million reflected the substantial growth in sales volumes of steel billets .
The favorable effect of translation from the functional to the presentation currency accounted for a $15 million increase.
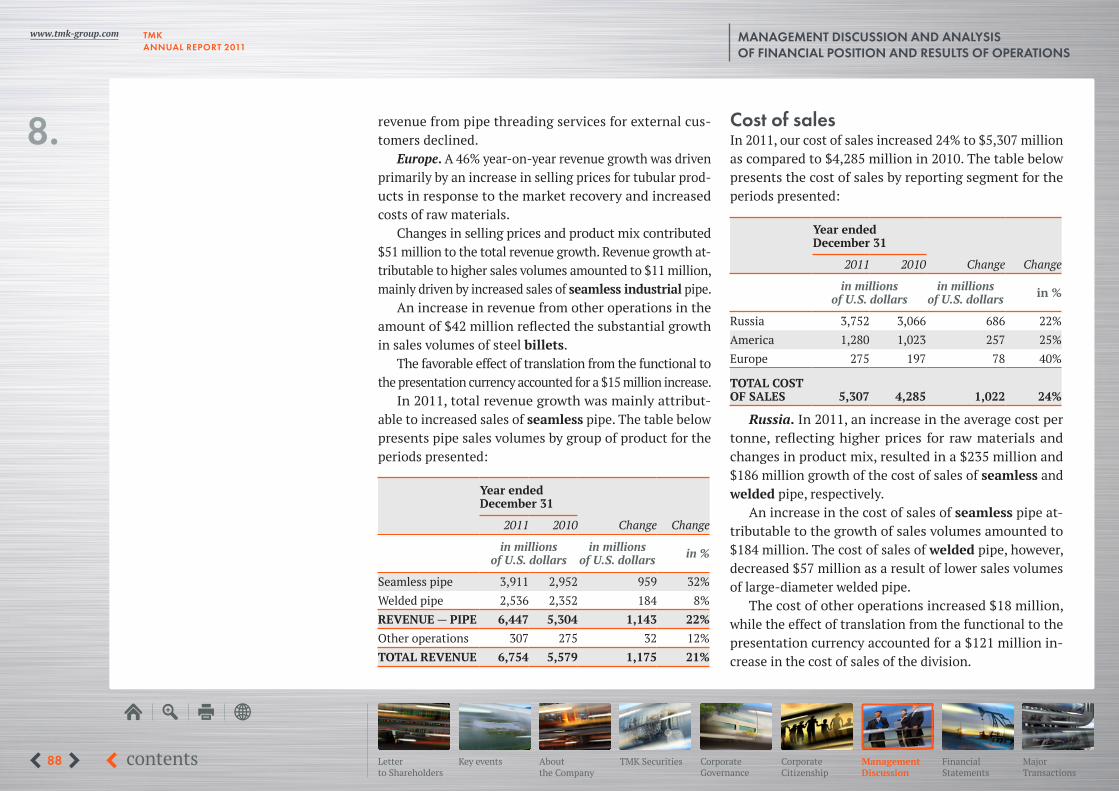
In 2011, total revenue growth was mainly attribut-able to increased sales of seamless pipe. The table below presents pipe sales volumes by group of product for the periods presented:
Year ended December 31
2011 2010 Change Change
in millions of U.S. dollars
in millions of U.S. dollars in %
Seamless pipe 3,911 2,952 959 32%Welded pipe 2,536 2,352 184 8%REVENUE — PIPE 6,447 5,304 1,143 22%Other operations 307 275 32 12%TOTAL REVENUE 6,754 5,579 1,175 21%
Cost of sales In 2011, our cost of sales increased 24% to $5,307 million as compared to $4,285 million in 2010. The table below presents the cost of sales by reporting segment for the periods presented:
Year ended December 31
2011 2010 Change Change
in millions of U.S. dollars
in millions of U.S. dollars in %
Russia 3,752 3,066 686 22%America 1,280 1,023 257 25%Europe 275 197 78 40%
TOTAL COST OF SALES 5,307 4,285 1,022 24%
Russia. In 2011, an increase in the average cost per tonne, reflecting higher prices for raw materials and changes in product mix, resulted in a $235 million and $186 million growth of the cost of sales of seamless and welded pipe, respectively.
An increase in the cost of sales of seamless pipe at-tributable to the growth of sales volumes amounted to $184 million. The cost of sales of welded pipe, however, decreased $57 million as a result of lower sales volumes of large-diameter welded pipe.
The cost of other operations increased $18 million, while the effect of translation from the functional to the presentation currency accounted for a $121 million in-crease in the cost of sales of the division.
MANAGEMENT DISCUSSION AND ANALYSISOF FINANCIAL POSITION AND RESULTS OF OPERATIONS
8.

TMKANNUAL REPORT 2011
www.tmk-group.com
89 contents Key eventsLetter to Shareholders
About the Company
TMK Securities Corporate Governance
Corporate Citizenship
Financial Statements
Major Transactions
Management Discussion
America. An average cost per tonne and changes in product mix, which mainly increased as a result of growth in coil and scrap prices, considerably affected the divi-sion’s cost of sales. The cost of sales of seamless and welded pipe increased $71 million and $74 million, re-spectively.
Higher sales volumes of seamless and welded pipe contributed $39 million and $69 million, respectively.
In 2011, the cost of sales from other operations in-creased $4 million.
Europe. In 2011, an increase in the average cost per tonne caused by a significant growth of scrap prices at the end of 2010, as well as changes in product mix resulted in a $21 million increase in the cost of sales. Growth in the cost of sales attributable to an increase in sales volumes of seamless pipe amounted to $8 million.
An increase in the cost of sales from other operations in the amount of $38 million primarily reflected a substantial growth in the sales volume of steel billets.
The effect of translation from the functional to the presentation currency resulted in an $11 million growth in the cost of sales.
The table below shows our total cost of sales by group of products for the periods presented:
Year ended December 31
2011 2010 Change Change
in millions of U.S. dollars
in millions of U.S. dollars in %
Seamless pipe 2,837 2,200 637 29%Welded pipe 2,192 1,875 317 17%
COST OF SALES — PIPE 5,029 4,075 954 23%
Other operations 278 210 68 32%
TOTAL COST OF SALES 5,307 4,285 1,022 24%
MANAGEMENT DISCUSSION AND ANALYSISOF FINANCIAL POSITION AND RESULTS OF OPERATIONS
8.
TMKANNUAL REPORT 2011
www.tmk-group.com
90 contents Key eventsLetter to Shareholders
About the Company
TMK Securities Corporate Governance
Corporate Citizenship
Financial Statements
Major Transactions
Management Discussion
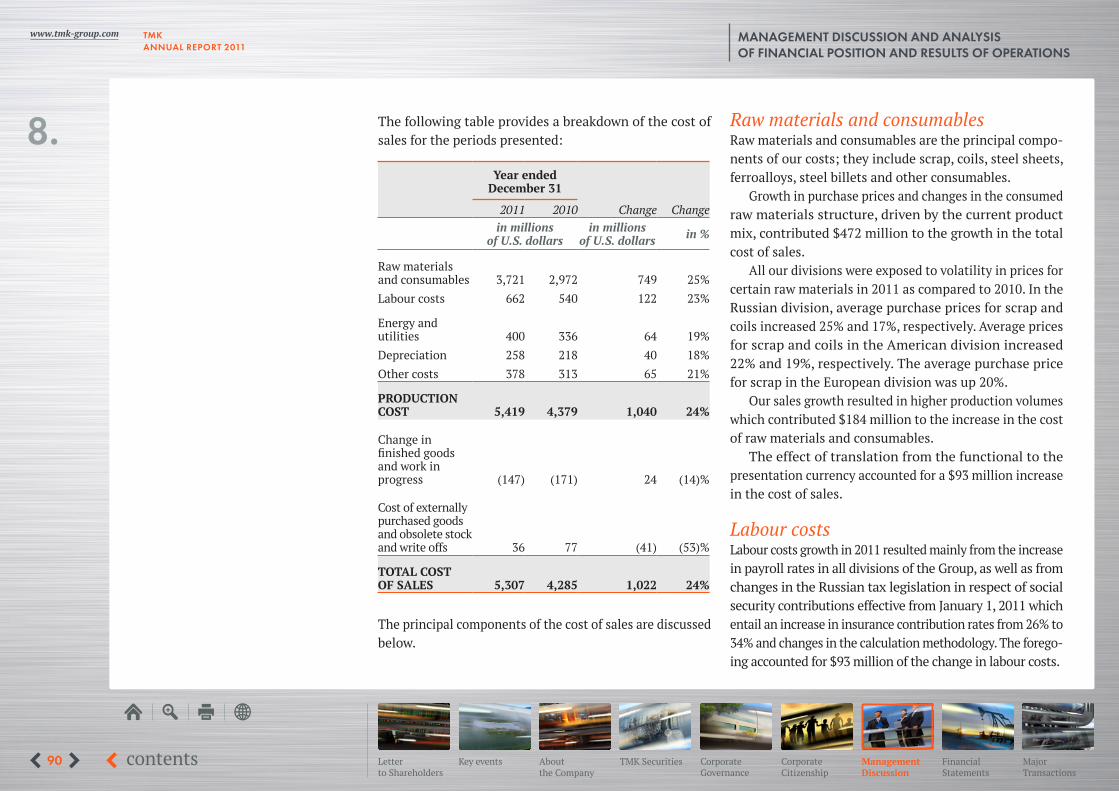
The following table provides a breakdown of the cost of sales for the periods presented:
Year ended December 31
2011 2010 Change Changein millions
of U.S. dollarsin millions
of U.S. dollars in %
Raw materials and consumables 3,721 2,972 749 25%Labour costs 662 540 122 23%
Energy and utilities 400 336 64 19%Depreciation 258 218 40 18%Other costs 378 313 65 21%
PRODUCTION COST 5,419 4,379 1,040 24%
Change in finished goods and work in progress (147) (171) 24 (14)%
Cost of externally purchased goods and obsolete stock and write offs 36 77 (41) (53)%
TOTAL COST OF SALES 5,307 4,285 1,022 24%
The principal components of the cost of sales are discussed below.
Raw materials and consumablesRaw materials and consumables are the principal compo-nents of our costs; they include scrap, coils, steel sheets, ferroalloys, steel billets and other consumables.
Growth in purchase prices and changes in the consumed raw materials structure, driven by the current product mix, contributed $472 million to the growth in the total cost of sales.
All our divisions were exposed to volatility in prices for certain raw materials in 2011 as compared to 2010. In the Russian division, average purchase prices for scrap and coils increased 25% and 17%, respectively. Average prices for scrap and coils in the American division increased 22% and 19%, respectively. The average purchase price for scrap in the European division was up 20%.
Our sales growth resulted in higher production volumes which contributed $184 million to the increase in the cost of raw materials and consumables.
The effect of translation from the functional to the presentation currency accounted for a $93 million increase in the cost of sales.
Labour costs Labour costs growth in 2011 resulted mainly from the increase in payroll rates in all divisions of the Group, as well as from changes in the Russian tax legislation in respect of social security contributions effective from January 1, 2011 which entail an increase in insurance contribution rates from 26% to 34% and changes in the calculation methodology. The forego-ing accounted for $93 million of the change in labour costs.
MANAGEMENT DISCUSSION AND ANALYSISOF FINANCIAL POSITION AND RESULTS OF OPERATIONS
8.

TMKANNUAL REPORT 2011
www.tmk-group.com
91 contents Key eventsLetter to Shareholders
About the Company
TMK Securities Corporate Governance
Corporate Citizenship
Financial Statements
Major Transactions
Management Discussion
The growth of the American division’s headcount due to rehiring production workers accounted for a $23 mil-lion increase in labour costs; this was partially offset by a $10 million decline due to a minor decrease in the head-count of the Russian division.
The effect of translation from the functional to the presentation currency accounted for a $16 million increase in labour costs.
Energy and utilitiesAn increase in prices for energy and utilities consumed in production processes resulted in energy costs growth of $34 million in 2011 as compared to 2010.
As a result of growth in production volumes in 2011 as compared to 2010, energy costs increased $18 million.
In 2011 as compared to 2010, on average, the electricity and natural gas tariffs in the Russian division increased 13%. In the American division, the average electricity tariff barely changed while the average natural gas tariff de-creased 6% because of the regressive tariffs system. The average electricity and natural gas tariffs in the European division were up 28% and 15%, respectively.
The effect of translation from the functional to the presentation currency accounted for a $12 million increase in energy costs.
DepreciationDepreciation increased $40 million in 2011 as compared to 2010. The effect of translation from the functional to the presentation currency accounted for a $7 million increase.
The principal share of the remaining increase relates to the reduction of estimated useful lives of some open-hearth fur-naces, a pilger mill and the 2520 welded pipe mill in the Rus-sian division due to the planned replacement of this equip-ment before the end of the previously assessed useful lives.
Other costsOther costs include repair and maintenance, contracted manufacture, transportation among production sites, taxes and other expenses. Growth of other expenses was consist-ent with the movement in operating activity.
The effect of translation from the functional to the presentation currency accounted for a $4 million increase.
Change in finished goods and work in progressThe gradual growth of finished goods and work-in-progress balances in 2011 and 2010 reflects growing prices for raw materials and tubular products as well as increased stock driven by the growth of sales volumes.
MANAGEMENT DISCUSSION AND ANALYSISOF FINANCIAL POSITION AND RESULTS OF OPERATIONS
8.
TMKANNUAL REPORT 2011
www.tmk-group.com
92 contents Key eventsLetter to Shareholders
About the Company
TMK Securities Corporate Governance
Corporate Citizenship
Financial Statements
Major Transactions
Management Discussion
MANAGEMENT DISCUSSION AND ANALYSISOF FINANCIAL POSITION AND RESULTS OF OPERATIONS
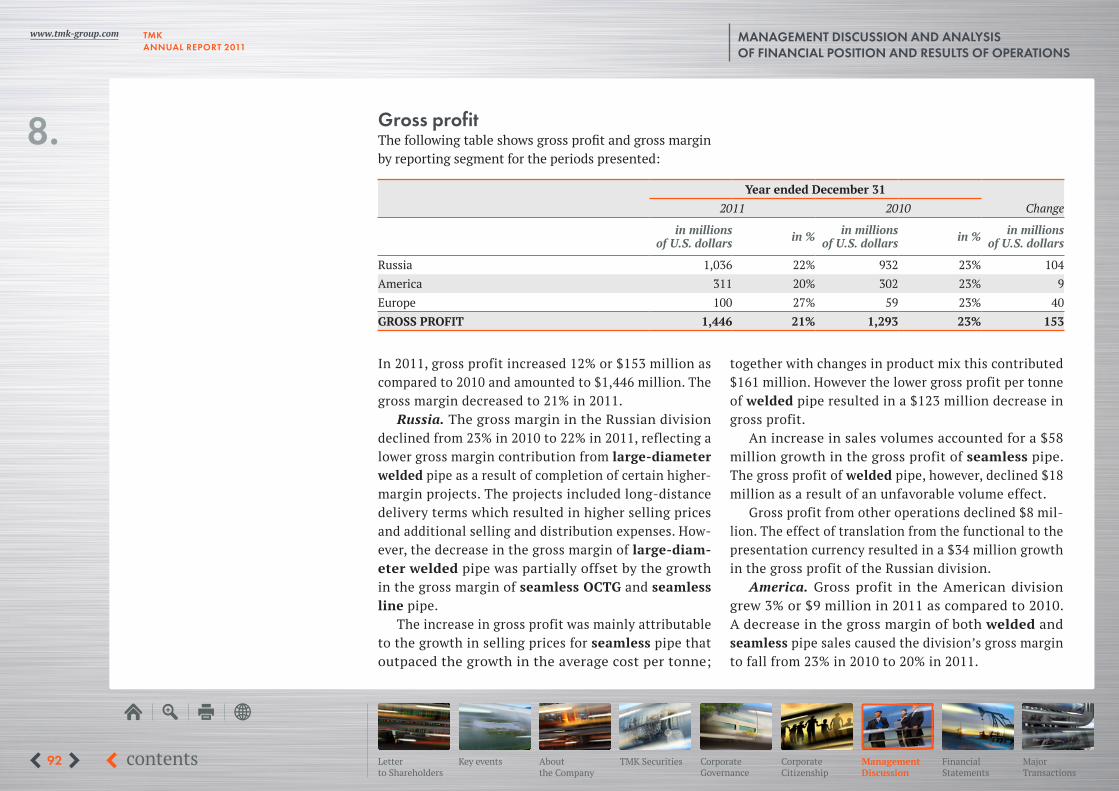
Gross profitThe following table shows gross profit and gross margin by reporting segment for the periods presented:
Year ended December 312011 2010 Change
in millions of U.S. dollars in % in millions
of U.S. dollars in % in millions of U.S. dollars
Russia 1,036 22% 932 23% 104America 311 20% 302 23% 9Europe 100 27% 59 23% 40GROSS PROFIT 1,446 21% 1,293 23% 153
In 2011, gross profit increased 12% or $153 million as compared to 2010 and amounted to $1,446 million. The gross margin decreased to 21% in 2011.
Russia. The gross margin in the Russian division declined from 23% in 2010 to 22% in 2011, reflecting a lower gross margin contribution from large-diameter welded pipe as a result of completion of certain higher-margin projects. The projects included long-distance delivery terms which resulted in higher selling prices and additional selling and distribution expenses. How-ever, the decrease in the gross margin of large-diam-eter welded pipe was partially offset by the growth in the gross margin of seamless OCTG and seamless line pipe.
The increase in gross profit was mainly attributable to the growth in selling prices for seamless pipe that outpaced the growth in the average cost per tonne;
together with changes in product mix this contributed $161 million. However the lower gross profit per tonne of welded pipe resulted in a $123 million decrease in gross profit.
An increase in sales volumes accounted for a $58 million growth in the gross profit of seamless pipe. The gross profit of welded pipe, however, declined $18 million as a result of an unfavorable volume effect.
Gross profit from other operations declined $8 mil-lion. The effect of translation from the functional to the presentation currency resulted in a $34 million growth in the gross profit of the Russian division.
America. Gross profit in the American division grew 3% or $9 million in 2011 as compared to 2010. A decrease in the gross margin of both welded and seamless pipe sales caused the division’s gross margin to fall from 23% in 2010 to 20% in 2011.
8.

TMKANNUAL REPORT 2011
www.tmk-group.com
93 contents Key eventsLetter to Shareholders
About the Company
TMK Securities Corporate Governance
Corporate Citizenship
Financial Statements
Major Transactions
Management Discussion
An increase in sales volumes contributed $19 million and $9 million to the gross profit of seamless and welded pipe, respectively.
In 2011, the higher gross profit per tonne of seamless pipe resulted in a $23 million growth of the division’s gross profit. However, the difficulties in recovering the significant increase in coil costs adversely influenced gross profit on sales of welded pipe and resulted in a $10 million decrease. This was driven by the serious impact of Korean imports, which deflated market pricing on welded carbon casing pipe, and a lower share of welded OCTG in total sales volumes of welded pipe.
The division’s gross profit from other operations de-clined $32 million mainly due to less threading services rendered and changes in the product mix. Product mix of
premium connections applied to customer-owned pipe worsened as a result of lower volumes of the more profit-able premium connections for pipe used in shale plays offset by increased volumes of less profitable premium connections for pipe used in oil basins.
Europe. In 2011, gross margin in the European division was 27% as compared to 23% in 2010, reflecting the favora-ble market situation and, in particular, an increased share of high-margin orders related to industrial heat-treated alloy pipe. An increase in gross profit per tonne of seamless pipe and higher sales volumes accounted for a $31 million and $3 million increase, respectively, in the division’s total gross profit. Gross profit of steel billets was up $2 million. The effect of translation from the functional to the presentation currency resulted in a $4 million growth in gross profit.
MANAGEMENT DISCUSSION AND ANALYSISOF FINANCIAL POSITION AND RESULTS OF OPERATIONS
The following table represents our gross profit by group of products for the periods presented:
Year ended December 312011 2010 Change
in millions of U.S. dollars in % in millions
of U.S. dollars in % in millions of U.S. dollars
Seamless pipe 1,074 28% 752 26% 322Welded pipe 344 14% 477 20% (133)GROSS PROFIT — PIPE 1,418 22% 1,229 23% 189Other operations 29 9% 65 24% (36)TOTAL GROSS PROFIT 1,446 21% 1,293 23% 153
8.

TMKANNUAL REPORT 2011
www.tmk-group.com
94 contents Key eventsLetter to Shareholders
About the Company
TMK Securities Corporate Governance
Corporate Citizenship
Financial Statements
Major Transactions
Management Discussion
MANAGEMENT DISCUSSION AND ANALYSISOF FINANCIAL POSITION AND RESULTS OF OPERATIONS
Selling, general and administrative expensesSelling, general and administrative expenses were slightly down as a percentage of revenue to 11% in 2011 as com-pared to 12% in 2010. The following table sets out our op-erating SG&A expenses for the periods presented:
Year ended December 31
2011 2010 Change Change
in millions of U.S. dollars
in millions of U.S. dollars in %
Russia 530 470 60 13%America 149 153 (4) (3)%Europe 43 36 7 19%
TOTAL SG&A EXPENSES 722 660 62 9%
Russia. The increase was mainly attributable to the growth in sales staff costs in 2011 as compared to 2010. Growing salaries and related social security contributions resulted in a $29 million growth in selling, general and administrative expenses. The decrease in freight expenses under certain sales contracts, though partially offset by grown freight tariffs, resulted in a $2 million decline in selling expenses. The effect of translation from the func-tional to the presentation currency and changes in other expenses accounted for $17 million and $15 million of the total increase, respectively.
America. Selling, general and administrative expenses declined reflecting primarily a $16 million decrease in de-
preciation mainly due to the amortisation of the intangible asset “Customer relationships”; the asset is amortised using the diminishing balance method to reflect the pat-tern of consumption of the related economic benefits. Staff costs and other expenses increased $2 million and $10 million, respectively.
Europe. An increase in selling, general and adminis-trative expenses in the European division reflects higher sales activities in the European division which caused a $2 million growth in freight expenses in 2011 as compared to 2010. The effect of translation from the functional to the presentation currency and changes in staff and other costs accounted for $2 million and $3 million, respectively
The table below provides a breakdown of our total sell-ing, general and administrative expenses for the periods presented:
Year ended December 31
2011 2010 Change Changein millions
of U.S. dollarsin millions
of U.S. dollarsin %
Staff costs 229 190 39 21%Freight 219 212 7 3%Depreciation 80 95 (15) (16)%Professional services 73 68 5 7%Other expenses 121 95 26 27%TOTAL SG&A EXPENSES 722 660 62 9%
8.
TMKANNUAL REPORT 2011
www.tmk-group.com
95 contents Key eventsLetter to Shareholders
About the Company
TMK Securities Corporate Governance
Corporate Citizenship
Financial Statements
Major Transactions
Management Discussion
Impairment of assetsWe determined that the value in use of the European division significantly exceeded its carrying value. We applied a 13.36% pre-tax discount rate for the calculation of the value in use of this cash generating unit. The increase of its recoverable amount was mostly due to the projected increase in the share of most profitable products in total production and the projected increase of sales volumes of the European division. As a result, we reversed the impairment loss recognised in 2008 and 2009 in respect of property, plant and equipment of the European division in the amount of $73 million.
In 2011, we recorded a loss from impairment of invest-ment in associate, the Volgograd River Port, in the amount of $2 million.
In 2011, we determined that the carrying value of TMK-Kaztrubprom exceeded its recoverable amount. As a result, we recognised a loss from the impairment of goodwill in the amount of $3 million.
Foreign exchange gain/loss, netIn 2011, a foreign exchange loss was recognised in the amount of $1 million as compared to a $10 million gain in 2010. In addition, we recognised a foreign exchange loss from exchange rate fluctuations in the amount of $54 million (net of income tax) in 2011 as compared to a $7 million loss (net of income tax) in 2010 in the statement of other comprehensive income. The amount in the statement of comprehensive income represents the effective portion of foreign exchange gains or losses on our hedging instruments. At the date of acquisition
of controlling interests in NS Group, Inc. and IPSCO Tu-bulars, Inc. we hedged our net investment in these op-erations against foreign currency risk using U.S. dollar denominated borrowings made by Russian entities of TMK. Hedging is used to eliminate the foreign currency exchange rate risk associated with the repayment of these liabilities resulting from changes in the U.S. dollar/Rus-sian rouble spot rates.
Gain/loss on changes in fair value of derivative financial instrumentIn February 2010, we issued $413 million 5.25% con-vertible bonds due 2015, convertible into TMK’s GDRs. The convertible bonds represent a combined financial instrument containing two components: (i) a bond li-ability and (ii) an embedded derivative representing a conversion option in foreign currency combined with an issuer call. In accordance with IFRS, a bond liability of $368 million (net of transaction costs of $9 million) was recognised and the liability under the embedded conversion option of $35 million at the initial recogni-tion date.
As of December 31, 2011, the bond liability and the liabil-ity under the embedded conversion option were $386 million and $3 million, respectively. As of December 31, 2010, the bond liability and the liability under the embedded conver-sion option were $378 million and $48 million respectively. As a result, we recognised a gain of $45 million on changes in fair value of the derivative financial instrument in 2011 as compared to a $12 million loss in 2010.
MANAGEMENT DISCUSSION AND ANALYSISOF FINANCIAL POSITION AND RESULTS OF OPERATIONS
8.
TMKANNUAL REPORT 2011
www.tmk-group.com
96 contents Key eventsLetter to Shareholders
About the Company
TMK Securities Corporate Governance
Corporate Citizenship
Financial Statements
Major Transactions
Management Discussion
Management nevertheless believes that the IFRS ac-counting treatment of the conversion option of the bond does not reflect the expected outflow of resources under the conversion rights. The conversion option, whether exercised or expired, will not result in cash outflows. In the event of the bond not being converted, the liability under the conversion option will be recognised as a gain in our income statement. In the event of the exercise of the option, the liability will be transferred to equity (together with the carrying value of the converted bonds); no gain or loss will be recognised on the transaction. Additionally, the accounting treatment of the conversion option requires that changes in fair value of the embedded instrument be recognised in the income statement. The price and volatil-ity of TMK’s GDRs have significant impact on fair value of the embedded derivative. In the event the GDRs perform well, the liability under the conversion option will increase and result in losses in the income statement. Changes in fair value may be material in comparison to our net income and may cause distortions in the income statement.
As such, for the purposes of this report, in addition to net income as reflected in the consolidated income state-ment, it has been decided to present, in this report, an adjusted net income so that it does not reflect gain/loss on changes in fair value of the derivative financial instru-ment with respect to the embedded derivative component of the convertible bond. The adjusted net income is an alternative performance measure that is not reflected in our consolidated financial statements and has not been audited or reviewed in accordance with ISA.
Finance costs, net Finance costs decreased 30%, or $128 million, in 2011 as compared to 2010. In late 2010 and the beginning of 2011, we negotiated lower interest rates for existing loans with major creditors and obtained lower interest rate loans to refinance existing debt. Consequently, the weighted aver-age nominal interest rate stood at 6.92% as of December 31, 2011 as compared to 7.86% as of December 31, 2010. A significant reduction in the amount of unamortised debt issue costs recognised in the income statement in 2011 also decreased our finance costs.
Finance income increased 70% or $13 million in 2011, primarily due to growing dividend income.
As a result, net finance costs decreased $141 million or 34% in 2011 as compared to 2010.
Income taxTMK, as a global company with production facilities and trading companies located in Russia, the CIS, the United States, and Europe, is exposed to local taxes charged to businesses. In 2010 and 2011, the following corporate in-come tax rates were in force in the countries where our production facilities are located: 20% in Russia, 35% (fed-eral rate) in the United States and 16% in Romania.
In 2011, a pre-tax income of $544 million was reported as compared to $185 million in 2010 and in 2011 an income tax expense of $159 million was recognised as compared to $81 million in 2010. Our effective income tax rate declined from 44% to 29%, closer to the normal level of the in-come tax rate of the Group considering the fiscal residence
MANAGEMENT DISCUSSION AND ANALYSISOF FINANCIAL POSITION AND RESULTS OF OPERATIONS
8.

TMKANNUAL REPORT 2011
www.tmk-group.com
97 contents Key eventsLetter to Shareholders
About the Company
TMK Securities Corporate Governance
Corporate Citizenship
Financial Statements
Major Transactions
Management Discussion
structure of the Group’s assets. The effective income tax rate declined due to, first, a significant growth in pre-tax income accompanied by a lower level of non-deductible expenses, second, a higher share of profit before tax of the entities with lower than the Group average income tax rate, and, third, non-taxable income related to gain on changes in fair value of derivative financial instrument.
Net incomeAs a result of the above-mentioned factors, net income in the amount of $385 million was recognised in 2011 as compared to $104 million in 2010. Net income adjusted for the gain on changes in fair value of the derivative financial instrument grew to $340 million in 2011 from $116 million in 2010 (See “Gain/loss on changes in fair value of derivative financial instrument” for the reasons for using this non-IFRS measure). Adjusted net income margin1 increased to 5% in 2011 from 2% in 2010.
Adjusted EBITDA2
Adjusted EBITDA margin slightly decreased from 17% in 2010 to 16% in 2011. The following table shows the Adjusted EBITDA by reporting segments:
Year ended December 31
2011 2010 Change Change
in millions of U.S. dollars
in millions of U.S. dollars in %
Russia 721 633 88 14%America 265 281 (16) (6)%Europe 64 29 35 121%TOTAL ADJUSTED EBITDA 1,050 942 108 11%
Russia. In 2011, Adjusted EBITDA increased 14% or $88 million. The faster pace in cost growth as compared to growth in revenue was partially compensated by the decrease in the share of selling, general and administra-tive expenses in revenue. As a result, the Adjusted EBITDA margin decreased from 16% to 15%.
America. Adjusted EBITDA decreased 6% or $16 mil-lion in 2011. Adjusted EBITDA margin decreased from 21% to 17% following a decline in gross profit margin from 23% to 20%.
Europe. The growth of Adjusted EBITDA margin from 11% to 17% mostly resulted from an increased share of certain high-margin orders for industrial heat-treated alloy pipe.
MANAGEMENT DISCUSSION AND ANALYSISOF FINANCIAL POSITION AND RESULTS OF OPERATIONS
1 Adjusted net income margin is calculated as a quotient of Net Income adjusted for gain on changes in fair value of derivative instrument divided by Revenue.
2 Adjusted EBITDA — See “Selected financial data”.
8.

TMKANNUAL REPORT 2011
www.tmk-group.com
98 contents Key eventsLetter to Shareholders
About the Company
TMK Securities Corporate Governance
Corporate Citizenship
Financial Statements
Major Transactions
Management Discussion
Liquidity and capital resources
Cash flowsThe following table illustrates cash flow for the periods presented:
Year ended December 312011 2010 Change Change
in millions of U.S. dollars in millions of U.S. dollars in %Net cash provided by operating activities 787 386 401 104%Net cash used in investing activities (377) (271) (106) 39%Net cash used in financing activities (335) (186) (149) 80%Increase/(decrease) in cash and cash equivalents 75 (71) 146 206%Effect of exchange rate changes (2) (15) 13 (87)%Cash and cash equivalents at the beginning of year 158 244 (86) (35)%Cash and cash equivalents at year end 231 158 73 46%
Operating activitiesCompared to 2010, a cash inflow provided by operating activities doubled in 2011.
Net cash provided by operating activities before changes in working capital increased from $942 mil-lion in 2010 to $1,050 million in 2011. The increase was mainly attributable to improved operating per-formance. Cash flows in the amount of $156 million were used to finance working capital as compared to $527 million in 2010. Working capital increased in 2010 at a faster pace in response to growing produc-tion and sales activities following the period of the economic downturn.
Investing activitiesIn 2011, net cash used in investing activities equalled to $377 million or 39% above 2010. In 2011, significant pay-ments for certain capital projects were made, particularly the construction of the electric arc furnace at Tagmet and the modernisation of our seamless pipe production line with a new FQM mill at STZ.
Financing activitiesIn 2011, net cash used in financing activities amounted to $335 million as compared to $186 million in 2010.
The net cash obtained to finance our capital requirements amounted to $4 million as compared to $103 million in the
MANAGEMENT DISCUSSION AND ANALYSISOF FINANCIAL POSITION AND RESULTS OF OPERATIONS
8.

TMKANNUAL REPORT 2011
www.tmk-group.com
99 contents Key eventsLetter to Shareholders
About the Company
TMK Securities Corporate Governance
Corporate Citizenship
Financial Statements
Major Transactions
Management Discussion
previous year. We spent $288 million on interest payments, or 16% less as compared to 2010 as a result of lower interest rates negotiated with our creditors. Significant amounts of cash related to proceeds and repayments of borrowings reflect refinancing of existing loans with lower interest rates.
In 2011, we paid a full year dividend for 2010 and an interim dividend in respect of the first six months of 2011
in the total amount of $47 million to OAO TMK sharehold-ers as approved by the annual shareholders’ meeting in June 2011 and the extraordinary shareholders’ meeting in November 2011, respectively. We also paid $2 million to non-controlling shareholders of our subsidiaries as compared to $1 million in 2010.
IndebtednessThe following table illustrates the maturity profile of our total financial debt:
1 year or less 1 to 3 years Over 3 years Unamortiseddebt issue costs Total debt
in millions of U.S. dollarsAs of December 31, 2011 602 1,468 1,740 (23) 3,787As of December 31, 2010 706 1,222 1,968 (24) 3,872
As a result of actions undertaken to improve the debt maturity profile, the share of short-term debt decreased to 16% as of December 31, 2011 as compared to 18% as of December 31, 2010.
Our debt portfolio includes fixed as well as floating interest rate debt facilities. As of December 31, 2011, bor-rowings with a floating interest rate represented $617 mil-lion, or 16%, as compared to $3,134 million, or 84%, of borrowings with a fixed interest rate.
The weighted average nominal interest rate decreased 94 basis points as compared to December 31, 2010 and stood at 6.92% as of December 31, 2011. We are constantly seeking an optimum loan portfolio structure.
The current debt portfolio comprises diversified debt instruments, including bank loans, bonds, convertible bonds and other credit facilities. Total financial debt de-creased 2% from $3,872 million as of December 31, 2010 to $3,787 million as of December 31, 2011. The deprecia-tion of the Russian rouble against the U.S. dollar resulted in a decrease of the U.S. dollar equivalent of the Russian rouble-denominated loans in the financial statements as of December 31, 2011. The net amount of proceeds from borrowings in 2011 equaled to $4 million. As of Decem-ber 31, 2011, U.S. dollar-, Russian rouble- and euro-denom-inated debt accounted for 48%, 46% and 6%, respectively, of the total financial debt.
MANAGEMENT DISCUSSION AND ANALYSISOF FINANCIAL POSITION AND RESULTS OF OPERATIONS
8.
TMKANNUAL REPORT 2011
www.tmk-group.com
100 contents Key eventsLetter to Shareholders
About the Company
TMK Securities Corporate Governance
Corporate Citizenship
Financial Statements
Major Transactions
Management Discussion
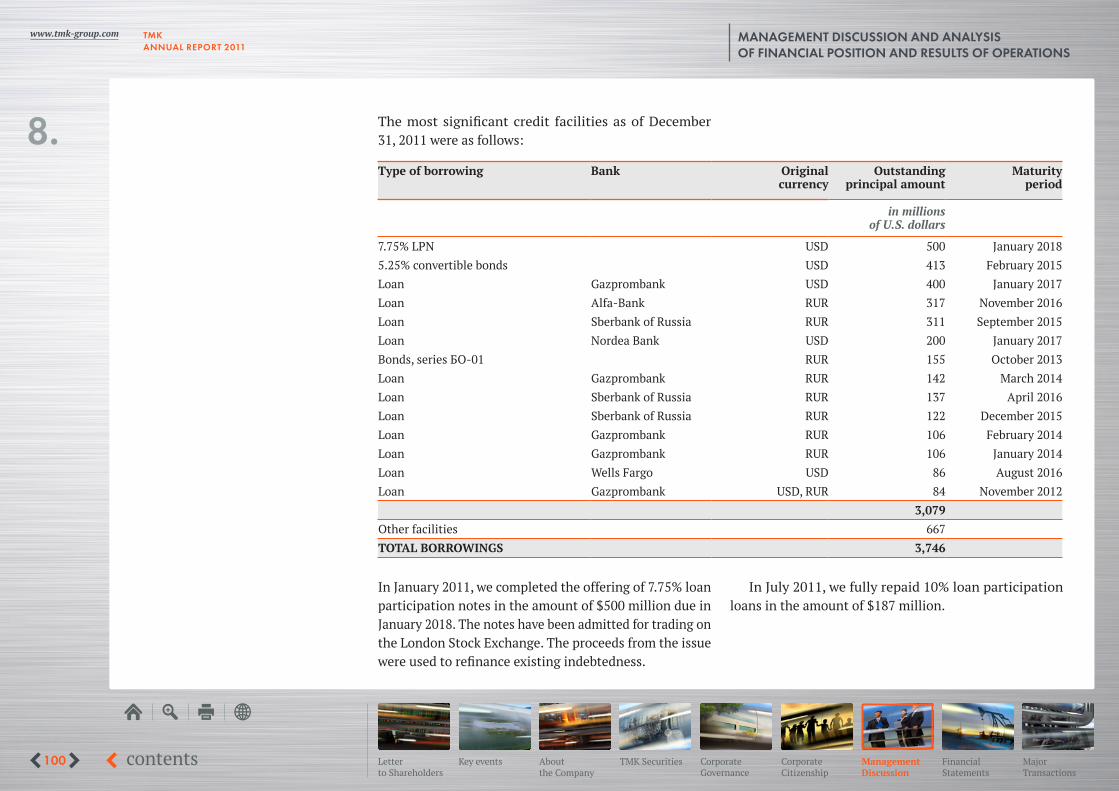
The most significant credit facilities as of December 31, 2011 were as follows:
Type of borrowing Bank Original currency
Outstandingprincipal amount
Maturity period
in millions of U.S. dollars
7.75% LPN USD 500 January 20185.25% convertible bonds USD 413 February 2015Loan Gazprombank USD 400 January 2017Loan Alfa-Bank RUR 317 November 2016Loan Sberbank of Russia RUR 311 September 2015Loan Nordea Bank USD 200 January 2017Bonds, series БО-01 RUR 155 October 2013Loan Gazprombank RUR 142 March 2014Loan Sberbank of Russia RUR 137 April 2016Loan Sberbank of Russia RUR 122 December 2015Loan Gazprombank RUR 106 February 2014Loan Gazprombank RUR 106 January 2014Loan Wells Fargo USD 86 August 2016Loan Gazprombank USD, RUR 84 November 2012
3,079Other facilities 667TOTAL BORROWINGS 3,746
In January 2011, we completed the offering of 7.75% loan participation notes in the amount of $500 million due in January 2018. The notes have been admitted for trading on the London Stock Exchange. The proceeds from the issue were used to refinance existing indebtedness.
In July 2011, we fully repaid 10% loan participation loans in the amount of $187 million.
MANAGEMENT DISCUSSION AND ANALYSISOF FINANCIAL POSITION AND RESULTS OF OPERATIONS
8.

TMKANNUAL REPORT 2011
www.tmk-group.com
101 contents Key eventsLetter to Shareholders
About the Company
TMK Securities Corporate Governance
Corporate Citizenship
Financial Statements
Major Transactions
Management Discussion
Capital expenditureA comprehensive renovation of production facilities has resulted in a considerable increase in the efficiency of seamless and large-diameter welded production processes and advanced product quality.
Our key projects planned for the next several years include:• replacement of the open hearth furnaces with EAF
steelmaking facilities at TAGMET in order to reduce steel-making costs and increase an annual billet-pro-duction capacity to 950 thousand tonnes; the project is planned to be completed in 2014;
• construction of a new Fine Quality Mill (“FQM”) at STZ with an annual seamless pipe production capacity of 550 thousand tonnes and completion in 2014-2015;
• installation of additional non-destructive testing in-strumentation, construction of the new hydro-press, new pipe-threading and coupling-threading facilities at SinTZ to further improve the quality of OCTG; the project is planned to be completed in 2013.
In 2011, we completed the modernization of a hot-rolled section and a continuous casting machine at VTZ. It will significantly enhance production capacity for hot-rolled pipe at VTZ and increase the quality of pipe produced.
A new line to produce premium threaded casing was constructed at our Orsk Machine-Building Plant, with a 30 thousand tonne annual capacity. The line was commis-sioned in 2011. In 2012, we plan to install a hydro-press to run quality tests.
The following projects will enable TMK IPSCO to strength-en its position in the segment of premium connections for horizontal and directional drilling in North America:• the threadshop line at the plant located in Wilder, KY
became operational in October 2011;• consolidation of threading operations at the production
facility located in Odessa, TX is also underway.
As a part of an environmental protection programme, TMK-ARTROM and TMK-RESITA commenced renovation of gas cleaner facilities. The projects will be completed in 2012.
Development trends We confirm our positive outlook on the pipe market in 2012 and expect a slight increase in sales volumes and further improvement in the product mix compared to 2011. E&P budgets of Russian oil companies are continuing to grow in 2012 driven by continued high oil prices, which should support demand for seamless OCTG and seamless and welded line pipe. Although a number of pipelines in both Russia and the CIS countries are scheduled to be started in 2012, overall demand for large-diameter pipe is looking weaker this year compared to a year ago.
The U.S. market outlook remains positive for 2012. Strong oil rig count growth should offset the gas rig count decline as the price of natural gas is expected to re-main depressed throughout 2012. Oil and liquid plays, such as the Eagle Ford and Permian Basin, will continue to drive growth in the U.S. Line pipe for new shale gas pipelines will continue its growth trend. TMK is well-positioned to
MANAGEMENT DISCUSSION AND ANALYSISOF FINANCIAL POSITION AND RESULTS OF OPERATIONS
8.

TMKANNUAL REPORT 2011
www.tmk-group.com
102 contents Key eventsLetter to Shareholders
About the Company
TMK Securities Corporate Governance
Corporate Citizenship
Financial Statements
Major Transactions
Management Discussion
support these diverse and often demanding environments with a flexible and customised portfolio of steel tubulars and premium connections.
Given the current trends in raw materials prices and continuing improvement in the product mix, we expect a growth in EBITDA and EBITDA margin in the first quarter of 2012 as compared to the fourth quarter of 2011. The sustainability of improvement in EBITDA and profitability for 2012 will depend on the level of steel prices and welded pipe sales, particularly large-diameter welded pipe.
We intend to further reduce our indebtedness and to continue to optimise the debt profile. Despite some nega-tive developments on global financial markets, we continue to refinance our debt at favorable terms and expect to extend maturities of our debt facilities as planned.
MANAGEMENT DISCUSSION AND ANALYSISOF FINANCIAL POSITION AND RESULTS OF OPERATIONS
8.

TMKANNUAL REPORT 2011
www.tmk-group.com
103 contents Key eventsLetter to Shareholders
About the Company
TMK Securities Corporate Governance
Corporate Citizenship
Financial Statements
Major Transactions
Management Discussion
Selected financial data
Adjusted EBITDAReconciliation of income before tax to Adjusted EBITDA for the twelve months ended:
December 31, 2011
September 30, 2011
June 30, 2011
March 31, 2011
December 31, 2010
in millions of U.S. dollarsIncome before tax 544 425 443 318 185Depreciation and amortisation 336 333 321 312 301Finance costs, net 271 346 366 376 412(Reversal of impairment)/Impairment of assets (68) 3 3 - -(Gain)/loss on changes in fair value of derivative financial instrument (45) (22) 29 (18) 12Foreign exchange loss/(gain), net 1 11 (29) 10 (10)(Gain)/Loss on disposal of property, plant and equipment (17) (16) (15) 9 10Movement in allowances and provisions 28 39 35 24 32Other non-cash items 0 0 - - -Adjusted EBITDA 1,050 1,119 1,153 1,031 942
analysis of our operating results as reported under IFRS. Some of these limitations include:• Adjusted EBITDA does not reflect the impact of financ-
ing or finance costs on our operating performance, which can be significant and could further increase if we were to incur more debt;
• Adjusted EBITDA does not reflect the impact of income taxes on our operating performance;
• Adjusted EBITDA does not reflect the impact of de-preciation and amortisation on our operating perfor-
Adjusted EBITDA is not a measurement of our operating performance under IFRS and should not be considered as an alternative to gross profit, net profit or any other per-formance measures derived in accordance with IFRS or as an alternative to cash flow from operating activities or as a measure of our liquidity. In particular, Adjusted EBITDA should not be considered to be a measure of discretionary cash available to invest in our growth. Adjusted EBITDA has limitations as analytical tool, and potential investors should not consider it in isolation, or as a substitute for
MANAGEMENT DISCUSSION AND ANALYSISOF FINANCIAL POSITION AND RESULTS OF OPERATIONS
8.

TMKANNUAL REPORT 2011
www.tmk-group.com
104 contents Key eventsLetter to Shareholders
About the Company
TMK Securities Corporate Governance
Corporate Citizenship
Financial Statements
Major Transactions
Management Discussion
mance. The assets which are being depreciated and/or amortised will have to be replaced in the future and such depreciation and amortisation expense may ap-proximate the cost to replace these assets in the future. By excluding this expense from Adjusted EBITDA, it does not reflect our future cash requirements for these replacements; and
• Adjusted EBITDA does not reflect the impact of other non-cash items on our operating performance, such as foreign exchange (gain)/loss, impairment/(reversal of impairment) of non-current assets, movements in
Net DebtNet debt has been calculated as of the dates indicated:
December 31, 2011
September 30, 2011
June 30, 2011
March 31, 2011
December 31, 2010
in millions of U.S. dollarsShort-term loans and borrowings 599 446 539 520 702Long-term loans and borrowings 3,188 3,323 3,478 3,509 3,170TOTAL DEBT 3,787 3,769 4,017 4,029 3,872Net of:Cash and short-term financial investments (235) (157) (174) (176) (161)NET DEBT 3,552 3,612 3,843 3,853 3,711
Net Debt is not a measure under IFRS, and it should not be considered to be an alternative to other measures of financial position. Other companies in the pipe industry may calculate Net Debt differently and therefore com-
parability may be limited. Net Debt is a measure of our operating performance that is not required by, or presented in accordance with, IFRS. Although Net Debt is a non IFRS measure, it is widely used to assess liquidity and the ad-
allowances and provisions, (gain)/loss on disposal of property, plant and equipment, (gain)/loss on changes in fair value of financial instruments, share of (profit)/loss of associate and other non-cash items. Other com-panies in the pipe industry may calculate Adjusted EBITDA differently or may use it for other purposes, limiting its usefulness as comparative measure.
We compensate for these limitations by relying primarily on its IFRS operating results and using Adjusted EBITDA only supplementally.
MANAGEMENT DISCUSSION AND ANALYSISOF FINANCIAL POSITION AND RESULTS OF OPERATIONS
8.
TMKANNUAL REPORT 2011
www.tmk-group.com
105 contents Key eventsLetter to Shareholders
About the Company
TMK Securities Corporate Governance
Corporate Citizenship
Financial Statements
Major Transactions
Management Discussion
equacy of a company’s financial structure. We believe Net Debt provides an accurate indicator of our ability to meet our financial obligations, represented by gross debt, from available cash. Net Debt demonstrates investors the trend in our net financial position over the periods presented. However, the use of Net Debt assumes that gross debt can be reduced by cash. In fact, it is unlikely that all available cash will be used to reduce gross debt all at once, as cash must also be available to pay employees, suppliers and taxes, and to meet other operating needs and capital ex-penditure requirements. Net Debt and its ratio to equity, or leverage, are used to evaluate our financial structure in terms of sufficiency and cost of capital, level of debt, debt rating and funding cost.
These measures also make it possible to evaluate if our financial structure is adequate to achieve our business and financial targets. Our management monitors the net debt and leverage or similar measures as reported by other com-panies in Russia or abroad in order to assess our liquidity and financial structure relative to such companies. Our management also monitors the trends in our Net Debt and leverage in order to optimise the use of internally generated funds versus borrowed funds.
Principal risks and uncertaintiesIndustry risksDependence on the oil and gas industryThe oil and gas industry is the principal consumer of steel pipe products worldwide and accounts for most of our sales, in particular sales of OCTG, line pipe and large-diameter
welded pipe. In 2011, sales volumes of pipes used in oil and gas industry (mainly OCTG, line pipe and large-diameter pipe) accounted for approximately 74% of our tubular prod-ucts. The oil and gas industry has historically been volatile and downturns in the oil and gas markets can adversely affect demand for our products, which largely depends on the number of oil and gas wells being drilled, completed and reworked, the depth and drilling conditions of wells and the construction of oil and gas pipelines. The level of such industry specific activities in turn depends on the level of capital spending by major oil and gas companies. The level of investment activities of oil and gas companies, which is largely driven by prevailing prices for oil and natural gas and their stability, significantly affects the level of consump-tion of our products. In case of significant and/or sustained decline in oil and natural gas prices energy companies could reduce their levels of expenditures. As a result, the demand for oil and gas pipes can substantially decrease, leading to the tightening of competition and a possible decrease of market prices for tubular products. Thus, the decline in oil and gas exploration, drilling and production activities and prices for energy commodities could have a negative impact on our results of operations and financial position.
Increases in the cost of raw materialsWe require substantial quantities of raw materials to pro-duce steel pipes. The principal raw materials used in pro-duction processes include scrap, pig iron, ferroalloys and refractories for use in steelmaking operations, steel billets used for the production of seamless pipes and steel coils
MANAGEMENT DISCUSSION AND ANALYSISOF FINANCIAL POSITION AND RESULTS OF OPERATIONS
8.
TMKANNUAL REPORT 2011
www.tmk-group.com
106 contents Key eventsLetter to Shareholders
About the Company
TMK Securities Corporate Governance
Corporate Citizenship
Financial Statements
Major Transactions
Management Discussion
and plates for the production of welded pipes. The demand for the principal raw materials we utilise is generally cor-related with macroeconomic fluctuations, which are in turn affected by global economic conditions.
In 2011, the costs of raw materials and consumables accounted for 69% of total cost of production. Prices for raw materials and supplies are one of the main factors affecting our results of operations. They are influenced by many factors, including oil and gas prices, worldwide production capacity, capacity utilisation rates, inflation, exchange rates, trade barriers and improvements in steel-making processes. Raw material prices increased in 2011 as compared to 2010. However in the fourth quarter of 2011, prices began to fall. Prices for certain types of raw materials and supplies varied depending on the region. In 2011, in the Russian division, the average purchase cost of metal scrap increased 25%, the average price for coils increased 17% and the average purchase price for pig iron increased 11% as compared to 2010. The average purchase cost of metal scrap and coils in the American division increased 22% and 19%, respectively, as compared to 2010. Average purchase costs for metal scrap in the European division were higher by 20% in 2011 than those in 2010. As a result of the increase both in prices for raw materials and sales volumes, our costs of raw materials and consumables increased from $2,972 million in 2010 to $3,721 million in 2011.
Raw materials prices continue to have a key influence on our production costs. The increase in prices for scrap, coils and other raw materials, if not passed on to customers
in a timely fashion, can adversely affect our profit margins and results of operations.
Our plants also consume significant quantities of energy, particularly electricity and gas. In 2011, energy costs amount-ed to 7% of the total cost of production. In January 2011, the liberalisation of the Russian electricity market was finalised, which resulted in an increase in electricity tariffs. Average natural gas tariffs in Russia, although remaining significantly below Western European levels, also increased in 2011. At the same time, natural gas consumption has been decreasing recently as we have replaced most of open hearth furnaces with EAFs. Further price increases for energy resources will increase our costs of production and could have an adverse effect on results of operations and financial results.
Dependence on a small group of customersAs we focus on supplying primarily the oil and gas indus-try, our largest customers are oil and gas companies. In 2011, our five largest customers were Gazprom (excluding Gazprom Neft), Rosneft, Surgutneftegas, TNK BP and Lu-koil, which together accounted for 34% of total revenue. We maintain strong business relationships with key customers and expect this concentration of customers in Russia to continue for the foreseeable future. The increased depend-ence of pipe sales on a single large customer bears the risk of an adverse effect on results of operations in the event that our relationship with any of these major customers deteriorated. In the United States, TMK IPSCO cooperates with a wide range of distributors in North America, whose shares in our total sales are not significant.
MANAGEMENT DISCUSSION AND ANALYSISOF FINANCIAL POSITION AND RESULTS OF OPERATIONS
8.
TMKANNUAL REPORT 2011
www.tmk-group.com
107 contents Key eventsLetter to Shareholders
About the Company
TMK Securities Corporate Governance
Corporate Citizenship
Financial Statements
Major Transactions
Management Discussion
Our large-diameter welded pipe business is largely de-pendent on one of our largest customers, Gazprom, and is subject to increasing competitive pressure. Gazprom is one of our largest customers for 1,420 mm diameter welded pipes used for construction of gas trunk pipelines. Increased competition in the supply of large-diameter pipes or a change in relationships with Gazprom could negatively af-fect our competitive position in the 1,420 mm diameter pipe market, resulting in decreased revenues from sales of these products and adversely affecting our business, financial po-sition and results of operations. Additionally, large-diameter welded pipe business depends significantly upon the level of construction of new oil and gas pipelines in Russia and the CIS. The delay, cancellation or other changes in the scale or scope of significant pipeline projects, or the selection by the sponsors of such projects of other suppliers could have an adverse effect on our sales of large-diameter welded pipes, and thus on the results of operations and financial position. Thereby in the second half of 2011, Gazprom finished con-struction of several pipelines, including Gryazovets-Vyborg, Pochinki-Gryazovets, SRTO-Torzhok and the first string of Nord Stream. We mitigate this risk by developing coopera-tion with new customers from CIS countries.
CompetitionThe global market for steel pipe products, particularly in the oil and gas sector, is highly competitive and primarily based on compliance with technical requirements, price, quality and related services. In the Russian and CIS mar-kets, we face competition primarily from ChTPZ, which
produces both welded and seamless pipes, OMK, which produces welded pipes, and the Ukrainian pipe produc-ers. Outside Russia and the CIS, we compete against a limited number of producers of premium-quality prin-cipally seamless steel pipe products, including Tenaris, Vallourec, Sumitomo and a limited number of Chinese producers, including Baosteel and TPCO. In the United States, TMK IPSCO faces competition primarily from Boo-merang, Tenaris, U.S. Steel and V&M Star, a subsidiary of Vallourec, as well as from imported OCTG and line pipe products, principally from Asia, Canada and Mexico. In 2011, our several key competitors added new capacities and started their ramp-up, which is expected to increase competition we face on international pipe markets.
Financial risksLiquidity riskAs a result of borrowings undertaken for the acquisition of TMK IPSCO in 2008, as well as a result of continued large-scale capital expenditure program, our leverage re-mains significant. As of December 31, 2011, our total debt amounted to $3,787 million as compared to $3,872 million at the end of 2010. The decrease of our total debt in 2011 was primarily attributable to the rouble depreciation. To-gether with the improvement of our operating performance in 2011, our leverage decreased and Net-Debt-to-EBITDA ratio reduced to 3.4 as of December 31, 2011.
In 2011, we continued to concentrate on improving our liquidity profile and optimising financial performance. We negotiated extensions of credit terms and lower interest
MANAGEMENT DISCUSSION AND ANALYSISOF FINANCIAL POSITION AND RESULTS OF OPERATIONS
8.

TMKANNUAL REPORT 2011
www.tmk-group.com
108 contents Key eventsLetter to Shareholders
About the Company
TMK Securities Corporate Governance
Corporate Citizenship
Financial Statements
Major Transactions
Management Discussion
rates in order to improve our financial position and overall debt maturity profile. The actions relating to the loan port-folio allowed us to further decrease the share of short-term debt in the total credit portfolio, which stood at 16% as of December 31, 2011 as compared to 18% at the end of 2010.
Improving liquidity profile remains one of our priorities, and we continue to carry out measures to maintain sufficient liquidity and improve loan portfolio structure. Thus, in Janu-ary 2011 we partially repaid Gazprombank loan facilities in the total amount of $1,108 million using the proceeds from the issuance of TMK 7.75% $500 million Eurobonds due in 2018. In October 2011, we refinanced a loan from Gazprom-bank in the aggregated amount of $208 million using the proceeds from operating cash flow and from a $200 million Nordea Bank loan due 2017 with a lower interest rate. Due to improved liquidity in 2011 our S&P rating was upgraded to B+/ruA, outlook stable and Moody’s rating of B1/A2.ru, outlook stable was confirmed. Nevertheless, there can be no assurance that our efforts to improve liquidity profile and reduce leverage will prove successful. The negative market reaction on deteriorating global financial situation may have an adverse impact on our ability to borrow in banks or capital markets, and may put pressure on our liquidity, increase bor-rowing costs, temporary reduce the availability of credit lines and lead to unavailability of financing on acceptable terms.
Compliance with covenantsCertain of our loan agreements and public debt securities currently include financial covenants. For example, some covenants are set in relation to leverage, total indebtedness
and tangible net worth, and impose financial ratios that must be maintained. Other covenants impose restrictions in respect of certain transactions, including restrictions in respect of indebtedness. A breach of a financial or other covenant in existing debt facilities, if not resolved by means such as obtaining a waiver from the relevant lender, could trigger a default under our obligations.
In January 2011, we undertook a consent solicitation to modify certain covenants contained in the loan agreement relating to the loan participation notes fully repaid in July 2011 issued by TMK Capital S.A. in order to continue our growth strategy and further enhance our flexibility to im-plement refinancing plan. In relation to other debt facilities covenants were not revised due to our stable financial and economic position and absence of covenants violation.
Nevertheless, in case financial markets or economic environment deteriorate in the future, we may not comply with relevant covenants. Though, historically, we have suc-cessfully secured from the relevant lenders all necessary waivers or standstill letters to address possible breaches of financial covenants we may not be able to secure such nec-essary waivers or standstill letters during future reporting periods if not in compliance with financial covenants. We do not expect the occurrence of such events in the near future.
Interest rate riskInterest expenses are the prevailing part of our finance costs. In 2011, our finance costs decreased 30% or $128 million and amounted to $303 million as compared to $431 million in 2010. The decrease in a nominal interest
MANAGEMENT DISCUSSION AND ANALYSISOF FINANCIAL POSITION AND RESULTS OF OPERATIONS
8.

TMKANNUAL REPORT 2011
www.tmk-group.com
109 contents Key eventsLetter to Shareholders
About the Company
TMK Securities Corporate Governance
Corporate Citizenship
Financial Statements
Major Transactions
Management Discussion
expense, net of transaction and issue costs, was achieved primarily as a result of our negotiations to reduce interest rates on most of significant borrowings that took place as a part of the measures to improve the structure of our loan portfolio. Consequently, our weighted average nominal interest rate as of December 31, 2011 decreased by 94 basis points as compared to December 31, 2010. Although we currently benefit from relatively low interest rates, there can be no assurance that rates will stay low in the future. The cost of funding for Russian and international banks may increase in the future, which can increase our inter-est expense and adversely affect our financial position.
Additionally, certain part of our loan portfolio is repre-sented by loans taken out at floating interest rates. As of December 31, 2011, loans with floating interest rates rep-resented $617 million or 16% of our total credit portfolio. The underlying rates in current loans with floating interest rates are LIBOR and EURIBOR. In 2011, floating interest rates remained close to their historical lows, which kept our inter-est expense on the relevant loans low. Taking into account current low levels of interest rates, we considered to hedge a part of interest rate risks at the beginning of 2012. Neverthe-less, several loans with floating interest rates still exist in our credit portfolio and, should floating interest rates increase in the future, interest expenses on relevant loans will increase.
Currency riskOur products are typically priced in roubles for Russian sales and in U.S. dollars and euros for CIS, U.S. and other international sales. Our direct costs, including raw materi-
als, labour and transportation costs are largely incurred in roubles and U.S. dollars. Other costs, such as interest expense, are currently incurred largely in U.S. dollars and roubles, and capital expenditures are incurred principally in roubles, euros and U.S. dollars.
We hedge our net investment in operations located in the Unites States against foreign currency risks using U.S. dollar denominated liabilities. Gains or losses on the hedging instruments relating to the effective portion of the hedge are recognised as other comprehensive income while any gains or losses relating to the ineffective portion are recognised in the income statement. In 2011, we incurred foreign exchange losses from spot rate changes in the total amount of $69 million, including $1 million recognised in the income statement and $68 million recognised in the statement of comprehensive income. Losses in the state-ment of comprehensive income from foreign exchange difference relating to hedged financial instruments arose from the revaluation of U.S. dollar denominated loans attracted by Russian companies of the Group.
The rouble remains volatile. Our debt is currently large-ly denominated in U.S. dollars, and the possible devalu-ation of the rouble against the dollar in the future could result in foreign exchange losses. To mitigate this risk, during 2011 we refinanced certain U.S. dollar denominated loans with a series of loans taken in roubles. As a result, the share of U.S. dollar denominated loans in the loan portfolio as of December 31, 2011 decreased to 48% as compared to 50% at the end of 2010. Since revenue of the Group is nominated in EUR, USD and Russian rouble due to the
MANAGEMENT DISCUSSION AND ANALYSISOF FINANCIAL POSITION AND RESULTS OF OPERATIONS
8.

TMKANNUAL REPORT 2011
www.tmk-group.com
110 contents Key eventsLetter to Shareholders
About the Company
TMK Securities Corporate Governance
Corporate Citizenship
Financial Statements
Major Transactions
Management Discussion
geographic diversification of sales, this provides a natural hedge for our foreign exchange position. Nevertheless, if the U.S. dollar appreciates against the rouble in the future, this could adversely affect our net profit as coherent losses will be reflected in our consolidated income statements.
Inflation riskA significant amount of our production activities are lo-cated in Russia, and a majority of direct costs are incurred in Russian roubles. We tend to experience inflation-driven increases in certain costs, such as raw material costs, trans-portation costs, energy costs and salaries that are linked to the general price level in Russia. In 2011, inflation in Russia reached 6.1% as compared to 8.8% in 2010. In spite of the intention of the Russian government to reduce rates of inflation in the coming years, inflation may increase in the future. We may not be able to increase the prices suf-ficiently in order to preserve existing operating margins.
Inflation rates in the United States, with respect to TMK IPSCO operations, are historically much lower than in Rus-sia. Nevertheless, in 2011, inflation in the United States in-creased to 3.0% in comparison to 1.5% in 2010. Accordingly, high rates of inflation, especially in Russia, could increase our costs, decrease our operating margins and materially adversely affect our business and financial position.
Legal risksChanges in tax legislation and tax systemOur subsidiaries make significant tax payments, in par-ticular, profit tax, VAT, social and pension payments and
property tax. Changes in tax legislation could lead to an increase in tax payments and, as a result, to a lowering of financial results. As significant part of the operations is located in Russia, the main risks relate to changes in the legislation of the Russian tax system. The Russian Gov-ernment continually reviews the Russian tax system and passes a number of laws to carry out tax reforms. The new laws generally reduce the number of taxes and the overall tax burden on business while simplifying tax legislation. Despite measures to improve the tax system, tax legisla-tion continues to give wide latitude to local tax authorities and leaves a multitude of unresolved problems which may have a negative effect on our operating results.
In 2010, the Russian government returned to the sys-tem of separate contributions by employers to the state pension, medical insurance and social insurance funds, which are payable in connection with employee salaries. Starting on January 1, 2011, the applicable rate for social contributions increased from 26% to 34%. As a result in 2011, our total costs of social contributions in Russia in-creased. However in 2012, the regressive taxation system has come into effect and the upper bound of social security tax has been limited to 30%.
In addition, the Russian oil industry is subject to sub-stantial taxes, including significant resources production taxes and significant export customs duties. Changes to the tax regime and customs duties rates may adversely affect the level of oil and gas exploration and development in Russia, which can adversely affect the demand for our products in Russia.
MANAGEMENT DISCUSSION AND ANALYSISOF FINANCIAL POSITION AND RESULTS OF OPERATIONS
8.

TMKANNUAL REPORT 2011
www.tmk-group.com
111 contents Key eventsLetter to Shareholders
About the Company
TMK Securities Corporate Governance
Corporate Citizenship
Financial Statements
Major Transactions
Management Discussion
Changes in environmental lawWe meet the requirements of national environmental regu-lations at our Russian plants, the directives and regulations of the European Union and Romanian legislation at our Romanian plants, and the U.S. environmental laws.
The main ecological-and-economical risks are related to expected changes and tightening of Russian environ-mental protection laws. Environmental legislation in Russia is currently undergoing significant change. The imposition of a new environmental law and regulation system may require further expenditures to modernize production operations, install pollution control equipment, perform site clean-ups and reclamation, pay fees and fines or make other payments if not in compliance with new environmental laws and regulations. Stricter regulations will also lead to increases in the rate of payments for nega-tive impact on the environment and the use of increasing payment coefficients. Compliance with the regulations will be accompanied by stricter control by state monitoring authorities. Such changes in existing legislation may lead to additional costs or unforeseen environmental liabilities, which could have a material adverse effect on our financial position and results of operations.
We are also responsible for compliance with stringent U.S. environmental laws. The environmental protection regime in the United States is more onerous than what we face with respect to operations in Russia and other coun-tries and compliance with these U.S. laws may expose us to additional costs. We estimate that the environmental legislation of the European Union and the United States
will not undergo any material changes in the near future. Romania’s admission into the European Union, which occurred in 2007, resulted in increased environmental liabilities for our Romanian operations. Our Romanian subsidiaries may be required to adopt and implement more stringent environmental and labor laws in the future. There can be no assurance that the European Union will not im-pose new environmental regulations or that Romanian state authorities will not change national environmental laws in the future.
Although we don’t anticipate any significant environ-mental matters in the United States and Romania, if such matters arise, the cost of compliance could have a material adverse effect on our business.
Other risksEquipment failures or production curtailments or shutdownsOur production capacities are subject to the risk of equip-ment failures due to unanticipated events, such as fires, explosions and adverse weather conditions. Manufactur-ing processes depend on critical pieces of steelmaking and pipe-making equipment. Such equipment may, on occasion, be out of service as a result of unanticipated failures could require us to close part of the relevant production facility or cause to reduce production on one or more of produc-tion lines. Any interruption in production capability may require us to make significant and unanticipated capital expenditures to affect relevant repairs, which could have a negative effect on our profitability and cash flows. We
MANAGEMENT DISCUSSION AND ANALYSISOF FINANCIAL POSITION AND RESULTS OF OPERATIONS
8.

TMKANNUAL REPORT 2011
www.tmk-group.com
112 contents Key eventsLetter to Shareholders
About the Company
TMK Securities Corporate Governance
Corporate Citizenship
Financial Statements
Major Transactions
Management Discussion
currently maintain insurance against losses that may arise in case of property damage, accidents and transportation of goods. We also maintain corporate product liability and directors’ and officers’ liability insurance policies. Never-theless, any recoveries under insurance coverage that may be obtained in the future may not offset lost revenues or increased costs resulting from a disruption of operations.
Insurance against all potential risks and lossesWe do not carry insurance against all potential risks and losses that may arise in connection with the quality of our products, property damage, work-related accidents and occupational illnesses, natural disasters and environ-mental contamination. We currently maintain no business interruption insurance. Losses or liabilities arising from these or other events could increase our costs and could adversely affect our business, financial position and op-erating results.
Ability to effect staff alterations and shortages of skilled laborOur Russian subsidiaries are in many regions the larg-est employers in the cities in which they operate, such as Volzhsky, Taganrog, Kamensk-Uralsky and Polevskoy. While we do not have any specific legal social obligations or responsibilities with respect to these regions, the abil-ity to effect alterations in the number our employees may nevertheless be subject to political and social considera-tions. Any inability to make planned reductions in the
number of employees or other changes to operations in such regions could have an adverse effect on the results of operations and prospects.
Competition for skilled labor in the steel pipe industry remains relatively intense, and labor costs continue to in-crease moderately, particularly in the CIS, Eastern Europe and the United States. We expect the demand and, hence, costs for skilled engineers and operators will continue to increase, reflecting the significant demand from other in-dustries and public infrastructure projects. Continual high demand for skilled labor and continued increases in labor costs could have a material adverse effect on our business, financial position and results of operations.
Furthermore, any work stoppages, strikes or other la-bor-related developments could have an adverse effect on our business, financial position and results of operations. Responsibility statementWe confirm to the best of our knowledge that: 1. the consolidated financial statements prepared in con-
formity with International Financial Reporting Standards and presented together with this management discussion and analysis of financial condition and results of opera-tion give a true and fair view of the assets, liabilities, financial position and profit or loss of OAO TMK and its consolidated subsidiaries, taken as a whole; and
2. the management report includes a fair review of the development and performance of the business and the position of OAO TMK and its consolidated subsidiaries, taken as a whole.
MANAGEMENT DISCUSSION AND ANALYSISOF FINANCIAL POSITION AND RESULTS OF OPERATIONS
8.