management discussion & analysis - cg global
TRANSCRIPT

The Switchgear Division developed and type tested its 420 kV, 4500A, 50 kA spring-spring operated circuit breaker and its 800kV variant at KERI, Republic of Korea
Management Discussion & Analysis
Rs.1 crore is Rs.10 million. | FY2012 stands for fiscal year 2011-12, i.e. from 1 April 2011 to 31 March 2012. Analogously, FY2011 and other fiscal years. | All figures in US$ for FY2012 are translated at an average exchange rate of US$1 = Rs.48.1233. For FY2011, these are translated at US$1 = Rs.45.5712. | All figures in € for FY2012 are translated at an average exchange rate of €1 = Rs.66.1764. For FY2011, these are translated at €1 = Rs.60.5116.
2 6 C R O M P T O N G R E A V E S L I M I T E D A N N U A L R E P O R T 2 0 1 1 - 1 2

With a global turnover in FY2012 of over US$ 2.4 billion, Crompton Greaves Limited (Ô CGÕ or Ô the CompanyÕ ) has manufacturing, solutions and services facilities in Belgium, Brazil, Canada, Hungary, Indonesia, Ireland, France, the UK, the USA, Saudi Arabia, Sweden, in addition to over 14 manufacturing and design locations in India. Employing approximately 9,000 people from different nations across the world, CG is a multinational, multi-product, multi-solutions and multi-services company. Though diversified and differentiated, the Company is bound by the objective of ‘One CG’ — a unified entity offering solutions, products and services to create customer delight though best-in-class global excellence.
CG has three major businesses: Power
Systems, Industrial Systems and Consumer
Products.
Power Systems � At Rs.7,315 crore in FY2012, power
systems accounted for 65% of CG’s
consolidated net revenues.
� It has overseas facilities at Mechelen
and Charleroi (Belgium), Rio Grande do Sul
(Brazil), St. Leonard (France), Cavan and
Dublin (Ireland), Tapioszele (Hungary), Jarrow
and Stockport (UK), Winnipeg (Canada),
Washington (Missouri, USA), Springfield (New
Jersey, USA), Albany, Arizona, Connecticut,
Florida, Idaho, Maryland, Pennsylvania, Rhode
Island and Texas (USA), Saudi Arabia and
Bogor (Indonesia).
� Has Indian facilities at Kanjur Marg
(Mumbai), Malanpur and Mandideep
(Madhya Pradesh), Nashik and Aurangabad
(Maharashtra), Bangalore (Karnataka) and
Gurgaon (Haryana).
Industrial Systems � Net revenue in FY2012 was Rs.1,820 crore,
or 16% of CG’s consolidated top-line.
� Has facilities at Tapioszele (Hungary),
Helsingborg (Sweden), Mandideep and
Pithampur (Madhya Pradesh), Kanjur Marg
(Mumbai, Maharashtra), Ahmednagar
(Maharashtra) and Colvale and Kundaim (Goa).
Consumer Products � Earned net revenue of Rs.2,134 crore in
FY2012, and accounted for 19% of CG’s
consolidated net revenue.
� Has facilities at Bethora and Kundaim
(Goa), Baddi (Himachal Pradesh), Kanjur
Marg (Mumbai), Ahmednagar (Maharashtra),
and Vadodara (Gujarat).
BUSINESS PERFORMANCE FY2012 The key performance highlights of the
Company for FY2012 are given to the right.
Chart A tracks the net revenue growth of the
three key businesses Ñ Power Systems,
Industrial Systems and Consumer Products.
CG POWER SYSTEMSCG Power Systems (or CG Power)
represents the Company’s global
transmission, distribution, power solutions
and services businesses, and is the largest
SBU. It manufactures power transformers,
distribution transformers, extra high voltage
(EHV) and medium voltage (MV) circuit
CONSOLIDATED FINANCIAL HIGHLIGHTS
NET SALES AND SERVICES IN RS. CRORE
10,005 11,249 12.4In FY2011 In FY2012 Percent
Thus, the CompanyÕ s net turnover rose to over US$ 2.3 billion.
EARNINGS BEFORE INTEREST, DEPRECIATION, TAXES, AND AMORTISATION IN RS. CRORE
1,443 856 40.7In FY2011 In FY2012 Percent
Because of increased pricing pressure for power sector products and rising manufacturing costs particularly in some overseas locations, earnings before interest, depreciation, taxes, and amortisation (EBIDTA) reduced by 40.7%.
PROFIT BEFORE TAXES IN RS. CRORE
1,229 550 55.3In FY2011 In FY2012 Percent
Profit before taxes (PBT) fell by 55.3%, from Rs.1,229 crore in FY2011 to Rs.550 crore in FY2012.
PROFIT AFTER TAXES IN RS. CRORE
927 374 59.7In FY2011 In FY2012 Percent
Profit after taxes net of minority interests and share of profit/loss of associate companies, but excluding
extraordinary items (or PAT) reduced by 59.7%.
RETURN ON CAPITAL EMPLOYED IN PERCENT
33.1 12.9 20.2In FY2011 In FY2012 Percent Points
Despite the fall, the Return on capital employed (ROCE) still remains in the top quartile among comparable players
in India and the rest of the world.
EARNINGS PER SHARE IN RS.
14.45 5.82 59.7In FY2011 In FY2012 Percent
Earnings per share (EPS) excluding extraordinary items reduced from Rs.14.45 in FY2011 to Rs.5.82 in FY2012.
UNEXECUTED ORDER BOOK IN RS. CRORE
7,169 8,368 16.7In FY2011 In FY2012 Percent
The unexecuted order book as on 31 March 2012 stood at Rs.8368 crore. This was up by 16.7% over the previous year.
Note All figures in US$ for FY2012 are translated at an average exchange rate of US$1 = Rs.48.1233. For FY2011, these are translated at US$1 = Rs.45.5712. Figures for FY2011 have been regrouped wherever necessary in order to make them comparable with those of FY2012.
CHART A NET REVENUE FROM THE KEY BUSINESSES in Rs. crore
Note There is a minor and non-material discrepancy between the total consolidated turnover that can be calculated from Chart A and the total given in the box on right as well as the financials. That is on account of a small fourth category under Ô OthersÕ .
5.6%
Consumer Products
21.6%
Industrial Systems
12.5%
Power Systems
FY20
11 6
,503
1,49
72,
021
FY20
12 7
,315
1,82
02,
134
2 7M A N A G E M E N T D I S C U S S I O N & A N A LY S I S

breakers, switchgears, EHV instrument
transformers, lightning arrestors, isolators
and vacuum interrupters. It provides turnkey
solutions for transmission and distribution
(T&D) through custom-made sub-station
projects, engineering, procurement
and construction (EPC) as well as other
integrated end-to-end contracts that involve
solutions, design, products, procurement,
construction, erection and servicing. CG
Power’s facilities abroad and in India have
been listed earlier; a more detailed listing is
found at the end of this annual report.
Consolidated Financial PerformanceThe key consolidated performance of CG
Power is given in Table 1. As the table shows,
while the SBU benefited from a healthy
growth in net sales and a significant increase
in the unexecuted order book (UEOB), its
profitability was affected in FY2012. The
reasons are given later in the chapter.
� Net sales of CG Power grew by 12.5% to Rs.7,315 crore in FY2012.
� EBIDTA fell by 57.3% to Rs.401 crore in FY2012, and EBIT by 70.3% to Rs.239 crore.
� There was a 19% increase in capital employed to Rs.2,569 crore. This was mostly due to additional investments, as well as some key customers not taking delivery of successfully tested orders on due dates, which tied up working capital.
� As on 31 March 2012, the UEOB was up by 19.3% to Rs.7,832 crore.
CG Power Overseas: Financial PerformanceThe financial performance of the CG Power
Overseas is given in Table 2.
CG Power India: Financial PerformanceTable 3 gives the key financial performance
indicators for FY2011 and FY2012.
As Tables 2 and 3 indicate, despite double-
digit growth in the top-line Ñ a creditable
achievement given the difficult global
economic scenario Ñ both the overseas
and India-based CG Power businesses have
been affected by lower profits. There are four
reasons for this which need explaining. Three
of these are external to the Company, and
one is internal.
� First, the markets in FY2012 were more
competitive than ever before. Prices came
under pressure because of competition
from some Chinese and South Korean
manufacturers who were eager to increase
the line-utilisations by offering rock-bottom
prices to the major global buyers of T&D
equipment. All T&D suppliers had to respond
to the lower prices, if only to maintain their
market shares. CG was no exception. The
positive news is that the period of intense
competition, which began in FY2011
and continued through much of FY2012,
seems to be a thing of the past. Buyers
have understood which global players can
deliver quality Ñ on-time and without re-
work. Prices have begun to gradually firm
up. Having said that, it is unlikely that any
supplier can get the prices and margins that
were readily available up for a four to five
TABLE 1 CONSOLIDATED FINANCIAL PERFORMANCE, CG POWERYear ended 31 March
NET SALES IN RS. CRORE
6,503 7,315 12.5In FY2011 In FY2012 Percent
EBIDTA IN RS. CRORE
937 401 57.3In FY2011 In FY2012 Percent
EBIT IN RS. CRORE
807 239 70.3In FY2011 In FY2012 Percent
CAPITAL EMPLOYED IN RS. CRORE
2,159 2,569 19.0In FY2011 In FY2012 Percent
ROCE IN PERCENT
37.4% 9.3% 28.1In FY2011 In FY2012 Percent points
UNEXECUTED ORDER BOOK IN RS. CRORE
6,565 7,832 19.3In FY2011 In FY2012 Percent
Note Figures have been re-grouped wherever necessary to make them comparable
The M7 Large Machine plant at Mandideep, which manufactures large and traction motors, won the Frost & SullivanÕ s Gold Award for Manufacturing Excellence
2 8 C R O M P T O N G R E A V E S L I M I T E D A N N U A L R E P O R T 2 0 1 1 - 1 2

year period upto FY2010. Every player in
the space will need to be more productive;
more competitive; and learn how to bundle
attractive solutions instead of selling discrete
equipment.
� Second, from FY2011 right up to the third
quarter of FY2012, raw material costs rose
at rates much higher than finished goods
prices. This was especially true of copper
and steel. Consequently, all companies in
the power T&D business Ñ barring perhaps
the Chinese, for whom no authentic cost
data are available Ñ witnessed steady, often
sharp, increases in the value of their material-
to-sales ratio (MSR). CG Power was no
exception. Thankfully, the growth in MSR has
plateaued out with there being a line of sight
of a slow decline in the ratio in the coming
future. Thus, it is hoped that the pincer of
falling product prices and higher MSR will be
a thing of the past.
� Third, many T&D customers all over the
world are not taking physical delivery of their
transformers or sub-stations. They have had
either cash problems or other operational
issues. The typical method is to push back
the date of testing at the bay, which blocks
scarce factory space, does not allow revenue
recognition, and extends the working capital
cycle. Given the importance of many of the
key customers, the suppliers acquiesce Ñ to
the detriment of profits.
� Fourth, CG Power had certain internal
issues regarding test-bed problems and
re-work at some of its facilities in India and
abroad, which have been identified and will
be solved in FY2013. However, it is a fact
that from the last quarter of FY2011 and
through the first three quarters of FY2012,
these led to blocking up of lines as well as
higher cost of time and material in re-work
and re-testing Ñ which affected EBIDTA.
CG Power: Key Developments in FY2012 Having stated the negatives up-front, it is
time to dwell on the positives. There are
many, of which the most significant is that
CG is definitely being globally recognised
as an end-to-end systems provider Ñ
an enterprise that goes beyond offering
products to designing and delivering
complete power systems.
Creating Power Solutions � EONÕ S HUMBER GATEWAY WIND-FARM
PROJECT Readers may recall that in 2010,
CG installed and commissioned its first
off-shore sub-station of a 165MW wind-
farm called Belwind, located 50 km in the
coastal waters of Belgium. Based on this
success, CG Power Solutions UK and
CG System Belgium together bid for and
secured the order for setting up the offshore
and onshore sub-stations at the Humber
estuary, off the coast of Yorkshire in the
UK. The offshore sub-station is 8 km off the
Yorkshire coast. It will connect 73 offshore
wind turbines of 3 MW each, or 219 MW
in total, with power of 280 MVA. A 132 kV
sub-sea cable will connect the offshore
sub-station to the onshore facility, which will
then hook up to the 132/275 kV National
Grid connection. The project is worth £46
million Ñ £22.7 million for setting up the
onshore facilities, and £23.3 million for the
offshore. CG products that will be used in the
project are: (i) power transformers, reactors
and distribution transformers for onshore
and offshore, (ii) 132kV GIS switchgears for
offshore; and (iii) CG automation and control
systems for both onshore and offshore.
� OTHER OFFSHORE WIND-FARM PROJECTS
There have been other orders as well for
setting up offshore sub-stations, such as
from:
� Amrumbank West, 35 km off shore from Helgoland in the German part of the North Sea, valued at Û 10.7 million,
TABLE 2FINANCIAL PERFORMANCE, CG POWER OVERSEAS Year ended 31 March
NET SALES IN RS. CRORE
4,060 4,493 10.7In FY2011 In FY2012 Percent
EBIDTA IN RS. CRORE
455 64 86.0In FY2011 In FY2012 Percent
EBIT IN RS. CRORE
346 (69) 120.0In FY2011 In FY2012 Percent
CAPITAL EMPLOYED IN RS. CRORE
1,480 1,789 20.9In FY2011 In FY2012 Percent
ROCE IN PERCENT
23.5 -3.9 27.4In FY2011 In FY2012 Percent points
UNEXECUTED ORDER BOOK IN RS. CRORE
3,608 4,397 21.9In FY2011 In FY2012 Percent
TABLE 3 FINANCIAL PERFORMANCE, CG POWER INDIA Year ended 31 March
NET SALES IN RS. CRORE
2,554 2,867 12.3In FY2011 In FY2012 Percent
EBIDTA IN RS. CRORE
482 339 29.7In FY2011 In FY2012 Percent
EBIT IN RS. CRORE
460 311 32.5In FY2011 In FY2012 Percent
CAPITAL EMPLOYED IN RS. CRORE
672 853 27.0In FY2011 In FY2012 Percent
ROCE IN PERCENT
68.5 36.4 32.1FY2011 In FY2012 Percent points
UNEXECUTED ORDER BOOK IN RS. CRORE
2,957 3,435 16.2In FY2011 In FY2012 Percent
Note Adding each element of Table 2 & 3 does not necessarily combine to the corresponding consolidated element in Table 1. That is because of some netting out that occurs of inter-company transactions when the entities are consolidated.
2 9M A N A G E M E N T D I S C U S S I O N & A N A LY S I S

� Butendiek, also on German North Sea, some 35 km off the coast of Schleswig-Holstein, at Û 10 million, and � Northwind, in North Sea, 40 km offshore from Belgian coast at Û 3.4 million. These orders and their execution are
increasing the ‘systems competence’ within
CG, not only to create a systems reputation
but also to create ‘pull through’ for CG
products. The end-to-end systems approach
also de-risks the Power SBU from an over-
reliance on stand-alone transformers.
� WIND RENEWABLES From a zero base
three years ago, CG now accounts for
4.2% of the global offshore wind market
in systems Ñ a share that is expected to
increase in the future. CG’s SLIM® and Bio-
SLIM® transformers now comprise 51.2% of
products in the global offshore wind markets.
� SOLAR RENEWABLES FY2012 saw
CG making its entry into market for solar
renewables. The Company won an order
from the US-based solar energy major, First
Solar for Û 19.5 million. First Solar is a US
listed corporation. At the end of 2011, it had
a cumulative global production of 5 GW of
solar energy across the US, Asia (including
India) and Australia Ñ providing electricity
to 2.5 million homes and earning a net sales
of almost US$ 2.8 billion. In addition, CG
won another solar order from SMA for Û 5
million. These orders give CG a 5.9% share
of the overall US solar market, including
households; and a 23.5% share of the US
solar utility market. Incidentally, FY2012 saw
CG selling over 500 distribution transformers
for photo-voltaic applications in solar
renewables.
� RENEWABLES CG’s renewables business
constitute executing projects Ñ through its
Systems and Solutions divisions Ñ as well as
supplying products. This business generated
global revenue of around Û 270 million in
FY2012, divided as shown in the table shown
on the left.
It is worth noting that Systems and
Solutions now account for 61% of the
growing renewables business. At the end
of FY2012, a renewables project pipeline
of Û 214 million was in place. Of this, wind
accounted for Û 148 million, and solar Û 66
million.
FOR RENEWABLES, IN THE AMERICAS
� DT US finished FY2012 with an order
intake in excess of US$ 55 million. The DT
US plant is full with renewables orders till
October 2012.
IN EMEA
� The order booking with Northwind for Û 3.4
million represents the fifth offshore sub-
station contract won by CG.
� Letter of Intent has been signed with
Alstom Wind, valued at Û 2.8 million.
� Frame contract received from Enercon,
valued at Û 25 million.
IN ASIA
� CG in the process of creating a set up to
undertake medium voltage (MV) sub-station
projects in Australia.
� CG India Systems Division is now tracking
solar opportunities.
� ENGINEERING PROJECTS DIVISION (EPD)
OF CG POWER INDIA FY2012 was a stellar
year for EPD, including Power Automation
Systems (PAS). It had a growth of 102% of
order intake and 61% of net sales. In the
process, it executed several key projects,
some of which are given below:
� In January 2012, it successfully commissioned a 765 kV /400 kV sub-station for the Uttar Pradesh Power Transmission Corporation Limited (UPPTCL) at Unnao, in a record time of 14 months.� Successfully commissioned four sub-station projects for the Power Grid Corporation of India Limited (PGCIL), each
REVENUE OF CGÕ S RENEWABLES BUSINESS € million
PRODUCTS
55 50 105 39%EMEA The Americas Total Share
SYSTEMS
80 85 165 61%EMEA The Americas Total Share
TOTAL
135 135 270 100%EMEA The Americas Total Share
* EMEA is Europe, Middle East and Africa
From a zero base three years ago, CG now accounts for 4.2% of the global offshore wind market in systems Ñ a share that is expected to increase in the future
3 0 C R O M P T O N G R E A V E S L I M I T E D A N N U A L R E P O R T 2 0 1 1 - 1 2

well ahead of schedule. These were: (i) 400 kV at Bhiwadi, Rajasthan (five months before schedule); (ii) 400 kV at Neemrana, Rajasthan (six months ahead); (iii) 400 kV at Sikar, Rajasthan (six months ahead); and (iv) 400 kV at Panchkula, Haryana (five months before schedule).� In August 2011, EPD booked its first PGCIL order for a 765 kV / 400 kV sub-station valued at Rs.145 crore. To be located at Durg (near Raipur in the district of Chhattisgarh), it involves setting up 13 bays of 765 kV and 10 bays of 400 kV. The project is to be completed by October 2013.� With an order intake of Rs.606 crore during FY2012, EPD and PAS together accounted for 18% of the total order intake of CG Power India. This would have been inconceivable even two years ago, and demonstrates the need for, and the power of providing end-to-end systems and solutions across all CG’s geographies.
Making Best-in-Class Power TransformersFY2012 has seen CG Power producing,
erecting and commissioning some
outstanding power transformers (PT). Here
are a few examples:
� CG POWER INDIAÕ S PLANT AT MANDIDEEP,
NEAR BHOPAL (CALLED T3) delivered its first
80 MVAr, 765 kV shunt reactor to PGCIL in
June 2011. In January 2012, it delivered its
first 500 MVA 765 kV power transformer, also
to PGCIL. In March 2012, T3 manufactured,
type-tested and delivered its first 110 MVAr,
765 kV shunt reactor to PGCIL.
� During FY2012, T3 delivered a large
number of 765 kV power transformers and
reactors to PGCIL. These were:
� three 765 kV 500 MVA transformers; � 30 units of 80 MVAr 765 kV shunt reactors; and� two 110 MVAr 765 kV shunt reactors.
� In FY2012, the following number of 765 kV
transformers and reactors supplied from T3
were actually commissioned:
� Three 333 MVA 765 kV transformers at UPPTCL’s sub-station at Unnao.� One 765 kV generator transformer for the National Thermal Power Corporation (NTPC) at Sipat in Chhattisgarh.� Seven 80 MVAr 765kV shunt reactors at different PGCIL sites.
� During FY2012, for the 765 kV category,
PGCIL alone has given orders to CG Power
India for (i) 28 units of 500 MVA 765 kV
power transformers, and (ii)10 units of 80
MVAr 765 kV shunt reactors.
� T1, WHICH IS CGÕ S POWER TRANSFORMER
FACILITY AT KANJUR MARG, MUMBAI,
designed, produced and commissioned
for Adani Power a bank of seven 270 MVA
single-phase Generator Step Up (GSU)
power transformers. It was the largest such
order in India, and meant for the client’s 2 x
660 MW super-critical thermal power plant in
Rajasthan.
� THE SWITCHGEAR DIVISION OF CG POWER
INDIA had several wins in FY2012. Some of
key ones were:
� Test charged the first 1200 kV capacitive voltage transformer (CVT) for PGCIL at its National Test Station at Bina, Madhya Pradesh. � Successfully erecting and testing the first 1200 kV surge arrester — also at PGCIL’s National Test Station at Bina. � Developed and type tested at KERI, Republic of Korea (i) 420 kV 4500A, 50 KA spring-spring operated circuit breaker, as well as (ii) its 800 kV variant. The testing was successfully concluded in February 2012.
� CG-ZIV POWER AUTOMATION SOLUTIONS
LIMITED, a joint venture with the ZIV Group
of Spain for sub-station automation solutions
received its first orders from PGCIL for 132
kV and 220 kV control panels.
� PT-HUNGARY, CGÕ S POWER TRANSFORMER
FACILITY AT TAPIOSZELE, has begun to
contribute in a significant manner. Here are
a few facts:
� Six 765 kV power transformers manufactured by this facility are now operational at different sites. � It has designed a new type of 765 kV transformer with the regular winding on auxiliary limb, which promises to have a strong market for specific applications.� It has successfully completed a KEMA ‘short-circuit proof’ test for a 250 MVA, 420 kV transformer that is being built for TERNA, Italy’s transmission grid major.� It has received orders from EDF (France), Union Fenosa (Spain), Ukraine, Lithuania, Estonia, Germany and Norway.
This financial year saw CG sell over 500 distribution transformers for photo-voltaic applications in solar renewables
3 1M A N A G E M E N T D I S C U S S I O N & A N A LY S I S

It has successfully pre-qualified for Saudi Electricity Company and the Western Power Distribution in the UK. It has also received the GOST certification from Russia, which opens the door to supply transformers for Russian power transmission projects.� Hungary leveraged its strong engineering and product manufacturing skills to launch a servicing business for (i) refurbishment of other makes of transformers, (ii) calibration of measuring instruments for other divisions and third parties, and (iii) replacement of windings on site. The business has started picking up.
� PT-BELGIUM AT MECHELEN had some
notable successes, such as:
� Manufacturing low noise power transformers at less than 50 dB on the A-scale. It sold three such transformers Ñ 80 MVA in the range of 150 kV to 20 kV Ñ to Alliander, a Dutch power distribution major, and ought to be an important reference for the EMEA markets.� Building a 400 kV, 530 MVA dual voltage power transformer — a first for CG Power in EMEA Ñ for a Belgian generator company. � Producing the first water-cooled ‘oil-forced, water-forced’ (OFWF) power transformer for an offshore sub-station.� Winning major orders from (i) the Saudi Electricity Company (SEC), (ii) National Contracting Company Limited, for SEC, (iii) Sonelgaz in Algeria, (iv) Statnett in Norway, and (vi) the Ministry of Electricity, Iraq.
� PT USA, AT WASHINGTON, MISSOURI,
has stabilised, and started production and
shipment. The key performances for FY2012
were:
� Generator Step-Up (GSU) transformers were rolled out. This should enable power transformers manufactured in the USA to enter the wind, solar and geo-thermal markets Ñ which are growing faster than the typical utility market.� Produced the first set of 161 kV rated power transformers, which were sold to the Tennessee Valley Authority. � Secured 46 new customers as well as multi-year blanket contracts from key utilities.
� PT CANADA AT WINNIPEG performed
creditably, given the constraints of working
with a single production line. The main
achievements in FY2012 were:
� New design for its HVDC convertor transformer delivered over 20% performance enhancement compared to the previous versions. � Winnipeg is now the Ô Centre of Excellence’ for HVDC. There has been a significant order intake from Manitoba Hydro. � There were significant orders for generator step-up (GSU) transformers from Ontario Power Corporation; and for power transformers from SNC Lavalin as well as First Solar.
� PT INDONESIA AT BOGOR did extremely
well in FY2012. Here are some key
indicators:
� Crossed US$ 100 million in sales for the first time. Has a healthy order intake US$ 133 million and an UEOB of US$ 128 million.� FY2012 saw the maximum MVA produced in any year: 7,267 MVA comprising 148 units.� 500 kV test bay expansion was completed.� Big DT and 500 kV power transformers were introduced in the product portfolio.� Received the first orders for 12 units of 167 MVA 550 kV transformers from PLN, Indonesia’s government-owned corporation that controls electricity distribution throughout the archipelago. PT Indonesia secured over US$ 62 million of business from PLN during the course of the year. � Successfully designed, manufactured and tested 220 kV delta connected transformers for copper mines in Peru.
New Business Vertical for CG Power: Oil and GasGiven the huge growth in global investments
in the oil and gas sector, it was a natural
area for CG to offer power equipment as
well as solutions. The business started in
the second half of FY2012, and has had an
encouraging beginning. In the course of four
months, a tentative order pipeline of Û 150
million has been developed. The requisite
sales infrastructure is being set up in various
locations, such as at Houston, the Middle
East and Asia.
The Company is working on creating
structures of business cooperation between
CG and other entities in medium- and low-
CG’s new Brazil plant qualified for a project for supplying eight mobile substations to CEMIG — one of the largest electricity distribution utilities in Brazil
3 2 C R O M P T O N G R E A V E S L I M I T E D A N N U A L R E P O R T 2 0 1 1 - 1 2

voltage transformer space to (i) offer a larger
suite of products to oil and gas majors and
international EPC players, and (ii) access
major oil and gas markets in the USA, Russia,
the Caspian and the Middle East. At the
time of writing this Management Discussion
and Analysis, CG products from India and
Indonesia are in the process of being pre-
qualified for oil and gas end-users and global
EPC contractors. The Company expects
to see good results from this vertical in the
years to come.
PT and Switchgears: The Brazil ProjectLast year, the Board of Directors of CG had
in-principle approved the establishment of
a greenfield power transformer plant up to
100 MVA and an HT switchgear plant in
Brazil. The Brazil operations commenced
in FY2012. CG has signed a Letter of Intent
with the State of Rio Grande do Sul (in south
Brazil) to set up a plant to manufacture HV
power transformers and switchgear. Land
has been made available in an industrial
complex; and fiscal incentives are expected
from the state government.
In the meanwhile, CG has started operating
from a leased facility to assemble, distribute
and provide technical assistance for EHV
switchgears. It is also setting up a team
of skilled technical professionals to offer
EPC solutions for sub-stations. At present,
CG Brazil has qualified for a project of
approximately US$ 17 million for supplying
eight mobile sub-stations to CEMIG Ñ one
of the largest electricity distribution utilities in
Brazil.
Distribution Transformers (DT)The headline news are as follows:
A The DT-USA business has picked up.
FY2012 saw a 9% increase in DT production
(in MVA terms) in the US versus the previous
year. This is creditable, in two counts.
First, the growth is greater than the overall
increase in demand from the traditional DT
users; and second, because this growth was
accompanied by price increases.
B The DT-Ireland business has also grown
by 12% in terms of MVA produced. However,
price pressures have continued. Ireland
suffered from lack of orders during the first
half of the year; strong sales growth in the
second half brought the unit back to break-
even levels. Also, production realignment in
Ireland has created flexibility on the line to
shift from single phase to three phase DTs.
C DT-Belgium has contracted by 5% in
volume terms.
DT-USA
Some key developments in FY2012 were:
� Entered the solar market and secured over US$ 29 million of orders from major solar developers. As mentioned earlier, total US orders from the renewable market, i.e. wind and solar, for FY2012 were US$ 55 million. � 23% of total order revenue came from new designs that fetched higher margins.� In less than a year, DT-USA won over 50% of the solar market share in the country.
DT-BELGIUM
The major items worth noting were:
� Produced KFWF (forced water cooling) Bio-SLIM® DTs for multi-MW wind turbines.
� Initiated work in development of arc suppression coils, which is especially targeted for the French market.� New markets were developed, such as Hungary, Kazakhstan and Algeria.� Worked closely with the Renewables vertical to offer solutions, and orders were received via Enercon for Canada.
CG POWER INDIAÕ S EXPORTS
CG Power India’s exports did well in FY2012.
In the USA, it secured a seven-year global
frame agreement with a power major for the
supply of generator transformers ranging
from 20 MVA to 320 MVA and up to 230
kV. It executed another significant order
in the USA for power transformers and
switchgear. The business maintained its
market leadership in Peru and Colombia;
secured major orders in Nigeria to retain
its No.1 position in the market; entered
Ghana, Zambia and Zimbabwe, the latter
with 100% advance payment; won orders in
Bangladesh; received its first order from Sri
Lanka after a gap of a decade; and sustained
market leadership in Malaysia for the sixth
consecutive year with 60% market share in
transformers and switchgears. In FY2012,
Malaysia gave orders for CG India’s largest
GSU power transformer of 350 MVA / 275
kV and its largest single phase auto power
transformer of 350 MVA / 500 kV.
NEW PRODUCTS
New products accounted for 24% of the
sales of CG Power in FY2012.
CG Power IndiaÕ s exports did well in FY2012. In the USA, it secured a seven-year global frame agreement with a power major for the supply of generator transformers ranging from 20 MVA to 320 MVA and up to 230 kV
3 3M A N A G E M E N T D I S C U S S I O N & A N A LY S I S

CG INDUSTRIAL SYSTEMS
CG Industrial Systems manufactures the
following types of products:
� High tension (HT) motors.
� Low tension (LT) motors.
� Fractional horse power (FHP) motors.
� Direct current (DC) motors.
� AC drives.
� AC generators.
� Variable frequency drives and solutions based on insulated gate bi-polar transistor (IGBT) technology; soft starters and shaft power monitors; and rotary heat exchangers with switch reluctance motors for saving energy.
� Railway transportation and signalling equipment.
� Stampings.
Table 4 gives the financial performance of
Industrial Systems over the last two years.
Industrial Systems’ net sales increased by
21.6% over FY2011 to reach Rs.1,820 crore.
Thanks to higher input costs and pricing
pressures, EBIDTA declined by 3.1% to
Rs.266 crore. There was almost a doubling of
capital employed in the SBU, which grew by
95.9% to Rs.823 crore at the end of FY2012.
This was on account of investments in, and
further modernisation of, existing plants; as
well as incorporating the capital employed
in Emotron Ñ the Swedish drives business
which was acquired in May 2011.
Higher depreciation on greater capital
employed played a role in Industrial System’s
EBIT declining by 20.4% to Rs.210 crore. It
also reduced the ROCE from a high of 62.9%
in FY2011 to a nevertheless healthy 25.5%
in FY2012.
The somewhat worrying story is the fall in
UEOB, which reduced by 11% to Rs.534
crore at the end of FY2012. It should be
mentioned, however, that the UEOB is
still quite adequate. The concern is how
it will grow in FY2013, given the sharp
deterioration in GDP growth witnessed in
FY2012 Ñ to 6.5% for the full year, and to
5.3% for Q4, FY2012.
Some of the key developments for FY2012
are given below:
� CG ACQUIRED EMOTRON, LOCATED
AT HELSINGBORG, SWEDEN, IN MAY 2011
FOR AN ENTERPRISE VALUE OF Û 57.8
MILLION. Emotron is engaged in the design,
engineering and manufacturing of drive
solutions, using the latest insulated gate bi-
polar transistor (IGBT) technology for variable
frequency drives ranging from 200 V to 690
V, and from 0.2 kW to 3,000 kW. These are
used for: (i) flow controls in pumps, fans and
compressors; (ii) material handling, such
as cranes, crushers, mills and conveyors;
and (iii) lift controls such as elevators.
Emotron also manufacturers soft starters
and shaft power monitors that are used in
industrial applications, as well as rotary heat
exchangers with switch reluctance motors for
saving energy.
� NELCO FACILITIES SHIFTED TO MANDIDEEP.
Bought by CG in FY2011, all operations
of NELCO’s erstwhile Mahape plant, near
Mumbai, were shifted to Mandideep by
February 2012.
� NEW PRODUCTS ACCOUNTED FOR 18% OF
SALES OF CG INDUSTRIAL SYSTEMS IN FY2012.
The year saw the successful manufacture
and sale of several new products, such as:
� LARGE MOTORS The rotating machine division of CG Hungary produced (i) 8.3 MW, 8 Pole, 6.6 kV motors for a steel mill in the Middle East; and (ii) 4.5 MW, 20 Pole, 6 kV motors as well as 3.3 MW, 22 Pole, 6 kV water-cooled motors for the circulating water pump of the Rostov nuclear power plant in Russia. The Large Machines plant at Mandideep in India manufactured and sold: (i) 2.85 MW, 16 Pole, 11 kV motors for a thermal power plant in India; (ii) 7.5 MW, 6 Pole, 11 kV motor for a cement mill in Egypt; (ii) 4.6 MW, 6 Pole, 3.3 kV cage rotor motor for a cement mill in the UK; and (iii) large flame-proof motors for oil and gas applications.� SYNCHRONOUS GENERATORS CG produced (i) 1,680 kVA, 6 Pole, 690V synchronous generator with Bureau Veritas certification, for marine duty application in France; and (ii), 19 MVA, 12 Pole, 6.3 kV horizontal hydro-generator for a customer in Italy. � LV AC DRIVES (i) CG Sweden developed and supplied a new series of drives for the German market, ranging from 11 kW to 22 kW; (ii) launched a new frame size, called Size D, in the FDU/VFX range between 30 kW and 37 kW. CG Global R&D and traction team developed IGBT-based auxiliary convertors, to be used in AC locomotives for the Indian Railways.� THREE-PHASE LV MOTORS (i) Developed and launched the APEX series-IE2 high
18 motors were supplied for the Narmada water supply project, providing water to Bhopal, India
3 4 C R O M P T O N G R E A V E S L I M I T E D A N N U A L R E P O R T 2 0 1 1 - 1 2

efficiency motors in the range up to 100 HP Ñ for India and global markets, especially for the European market; (ii) introduced the Agnita series, which are Group IIC flame-proof motors, ranging from 0.75 kW to 300 kW, for the oil and gas industry.� LV ALTERNATORS (i) Developed new USTAD series of SR Alternators, which has found a strong demand in northern India; and (ii) was the first in India to develop a variable speed integrated generator, with drive and controller, for an engine manufacturer.� SINGLE PHASE LV AND FRACTIONAL
HORSEPOWER (FHP) MOTORS A new range of single phase LV and FHP motors have been launched for various applications. These are: (i) the Sheetal series, for agro-industries, (ii) wet grinder motors, (iii) desert cooler motors, (iv) flange mounting motors, and (ii) the e-lite series motors with aluminium bodies, for the Middle East and European markets.
� REPAIRS AND REFURBISHMENT CG
Industrial Systems is using a section of
its rotating machine facility at Tapioszele,
Hungary, for large scale repairs, refurbishing
and servicing of older motors. As an
example, a 44 MVA, 10.5 kV synchronous
turbo-generator rotor for a power station in
Hungary was repaired and serviced. More
such orders are in the pipeline.
� FACILITY DEVELOPMENT There have been
many such initiatives in the year, in addition
to setting up the new plant for drives and
automation at Mandideep. The Company
invested in (i) improving winding facilities,
layout and capacities in Hungary; (ii) plant,
machinery and manpower for greater
productivity, as well as in major design and
process cost reduction in M7 at Mandideep;
(iii) facility upgrading in the LT motors plant at
Ahmednagar, with better layout and material
flows, plus improvements in the supply
chain and production planning systems; (iv)
increasing capacities and reducing design
costs in the FHP plant in India to raise
throughput; and (v) creating a repairs and
refurbishment facility in Hungary.
� CG Industrial Systems major sales come
from railway, cement, power, water and
irrigation. The business is rapidly globalising.
Export from India is growing to the Middle
East and European markets.
� The Large Machine plant at Mandideep
won the Frost & Sullivan’s Gold Award for
Manufacturing Excellence.
CG CONSUMER PRODUCTS The CG Consumer Products business
supplies fans, lighting equipment (light
sources and luminaires), pumps, a wide
range of electrical household appliances and
provides solutions for integrated security
systems, home automation and street
lighting. Its financial performance is given
in Table 5.
The CG Consumer Products business
— CG’s second largest SBU in terms of
revenues and its largest cash generator Ñ
grew net sales by 5.6% to Rs.2,134 crore in
FY2012. Because of competitive conditions
New products accounted for 18% of the sales of CG Industrial Systems in FY2012
TABLE 4CONSOLIDATED FINANCIAL PERFORMANCE, CG INDUSTRIAL Year ended 31 March
NET SALES IN RS. CRORE
1,497 1,820 21.6In FY2011 In FY2012 Percent
EBIDTA IN RS. CRORE
275 266 3.1In FY2011 In FY2012 Percent
EBIT IN RS. CRORE
264 210 20.4In FY2011 In FY2012 Percent
CAPITAL EMPLOYED IN RS. CRORE
420 823 95.9In FY2011 In FY2012 Percent
ROCE IN PERCENT
62.9 25.5 37.4In FY2011 In FY2012 Percent points
UNEXECUTED ORDER BOOK IN RS. CRORE
601 534 11.0In FY2011 In FY2012 Percent
LT Motors has the largest manufacturing capacity for M1 range of motors in India
3 5M A N A G E M E N T D I S C U S S I O N & A N A LY S I S

and higher raw material costs, the EBIDTA
fell by 13.4% to Rs.270 crore; EBIT also fell
by 10.2% to Rs.263 crore. The business’
ROCE reduced, but was still high, at 286%.
CG is a fast growing consumer product
brand in India. It is the market leader in fans
with a strong brand image; occupies the
second spot in lighting; is the fastest growing
brand in home appliances; and the leader
in the domestic pumps segment. It has
developed and launched a whole range of
energy efficient and green products. Its foray
into the rural segment has helped the business
to maintain its growth objectives despite
difficult market conditions in urban India.
� CGÕ S FANS grew at 2% by value in
FY2012, in a market that shrank by 2.3%. It
continued its overall leadership status and,
in doing so, further increased its market
share in the country. CG’s fans retained
their ‘Superbrand’ status for the sixth year
in succession. In its portfolio, there are four
Bureau of Energy Efficiency (BEE) Star rated
products: two having the highest 5-star
rating, one 4-star, and another 3-star. The
business also introduced a full range of
premium ceiling fans, which allow flexibility
to consumers to select from a wide range of
colours and styles. The portfolio that is being
developed will include a range of battery
back-up fans. Its foray into the segment of
industrial fans has been successful. New
products accounted for over 25% of total
fan sales. It also developed a new 35 watts
brushless DC (BLDC) ceiling fan. It has also
introduced a range of energy efficient ‘power-
saver’ fans that use a new motor which
delivers the same breeze at either 50 watts
or 60 watts of power. The BLDC platform is
aimed at revolutionising segment offerings.
� CGÕ S LIGHTING also retained its
‘Superbrand’ status for the fifth consecutive
year, with an overall number two position in
India. CG’s lighting business grew by 17%
in FY2012, compared to an overall market
growth of 12% Ñ resulting in the Company
increasing its overall market share. In
FY2011, CG was the first in India to produce
a highly energy efficient light emitting diode
(LED) lamp with an average life of 50,000
burning hours, and consuming only 5 watts
of power to produce the light of a 40 watt
bulb. FY2012 saw the Company pushing
hard to make inroads with LED lamps and
street lighting. It did so successfully: (i)
by selling over 40,000 LED street lighting
units; and (ii) by winning an LED street
lighting contract from the Government of
Punjab for 9,500 units. The business won
another special project Ñ that of putting
up 1,500 LED-based luminaires across the
River Sabarmati in Ahmedabad, Gujarat.
In FY2012, CG continued to enjoy industry
leadership in high intensity discharge lamps
used for public lighting. This business has
taken a leadership position in LED luminaires,
with the introduction of full range of down
lighters, office lighting tiles and industrial
luminaires Ñ apart from the already
introduced outdoor range. The green initiative
has led to the business having achieved
the lowest consumption of mercury in the
manufacturing of lamps at its integrated unit
at Baroda.
� THE PUMPS DIVISION de-grew by 4% in
FY2012, in a market that shrank by over
8%. which was considerably faster than the
market. Overall, CG retained its number two
position in this business, with leadership in
the domestic pumps segment. The division
is focusing on industrial and agricultural
pumps as well as integrated water treatment
solutions to grow the business. The new
manufacturing unit at Ahmednagar is being
automated to deliver higher productivity
per man hour. Introduction of specialised
industrial application pumps has enabled
successful entry into the B2B segment.
� CGÕ S APPLIANCES DIVISION grew by 25%
in value terms during FY2012 versus an
estimated market growth of 21%. Now a
significant player in geysers, it is perceived to
be ranked number three in the market. The
business is poised to make an entry with a full
portfolio of small and personal care appliances.
� NEW PRODUCTS accounted for 25% of the
sales of the CG Consumer business.
GLOBAL RESEARCH & DEVELOPMENTThis section outlines the key Research &
Development (R&D) achievements in FY2012.
New product developmentThe Company has a well defined
metric to determine new product (NP)
development.
� For CG Power India, some of the
new products were: (i) the 1200 kV auto
CGÕs Consumer Products have four BEE Star rated products; two of which have the highest 5-star rating, one 4-star and another 3-star
3 6 C R O M P T O N G R E A V E S L I M I T E D A N N U A L R E P O R T 2 0 1 1 - 1 2

transformer for PGCIL’s National Test Station
at Bina; (ii) the first 1200 kV surge arrester,
also at Bina; (iii) an 110 MVAr, 765 kV single
phase shunt reactor; (iv) an 80 MVAr, 765 kV
single phase shunt reactor; (v) a 36 kV, 26.3
kA, 1250A indoor gas insulated switchgear
(GIS); (vi) control switching on 800 kV
generator circuit breakers (GCB) for the Uttar
Pradesh Power Transmission Corporation
Limited and the Rajasthan Rajya Vidyut
Prasaran Limited; and (vii) the 72.5 kV, 40 kA,
3150 A vacuum interrupter, developed jointly
with Vacuum Interrupters Limited, UK.
� For CG Industrial Systems, R&D has
helped in creating new products such as: (i)
eight-pole, 8.3 MW, 6.6 kV motors for a steel
mill; (ii) a variable speed integrated generator,
with drive and controller; and (iii) BLDC motor
of 63 W and 900 rpm for heating, ventilation
and air conditioning applications.
� For CG Consumer Products, R&D has
played helped conceptualise and design
35 watt BLDC ceiling fans, other new fans,
and the prototype of an integrated, console-
based lighting management system.
Other significant developments in CG’s
Global R&D during FY2012 have been:
� 6.5 kW variable speed integrated generator for telecom applications.
� Wide voltage-band motors.
� 375 watt electronically commutated motor.
� Five new motors of different frame sizes of CG’s N Series.
� 180 kVA , 415 V load balancers for any continuous process applications, such as railways and smelting furnaces.
� Thyristor switched capacitor controllers Development
� Isolators: 36 kV, 800 A, 25 kA isolator and 72.5 kV, 1250 A, 40 kA versions with significant cost reduction.
� 25 watt LED street light.
Technology InitiativesDuring FY2012, Global R&D was involved
in various technology initiatives. Some of
these were in areas such as: motors, nano
technology, SMART systems, insulation
systems, electronics for power quality,
materials, sensors and transformer design.
IPR AchievementsAt the end of FY2012, CG had a cumulative
stock of 308 IPRs, comprising 138 patents
and 170 designs. Three patents were
granted in India. During the year FY2012,
138 patents were filed: 28 from CG Power
Systems; 21 from CG Consumer Products;
30 from CG Industrial Systems; and 59 from
Global R&D.
SIX SIGMA AT CGSix Sigma is a business management
strategy which seeks to improve the quality of
process outputs by identifying and removing
the causes of defects, and minimising
variability in manufacturing and business
processes. It uses a set of defined quality
management methods, including statistical
tools, and creates a special infrastructure of
people within the organisation such as Ô Black
TABLE 5PERFORMANCE OF CG CONSUMER PRODUCTS Year ended 31 March
NET SALES IN RS. CRORE
2,021 2,134 5.6In FY2011 In FY2012 Percent
EBIDTA IN RS. CRORE
312 270 13.4In FY2011 In FY2012 Percent
EBIT IN RS. CRORE
293 263 10.2In FY2011 In FY2012 Percent
CAPITAL EMPLOYED IN RS. CRORE
81 92 14.2In FY2011 In FY2012 Percent
ROCE IN PERCENT
363.5 285.7 77.8In FY2011 In FY2012 Percent points
CGÕ s Lighting Products used to illuminate the Sabarmati River waterfront by the night
3 7M A N A G E M E N T D I S C U S S I O N & A N A LY S I S

Belts’ and ‘Green Belts’ who are experts
in these methods. Each Six Sigma project
follows a defined sequence of steps and has
quantified financial targets, i.e. cost reduction
and/or profit increase.
CG, especially in India, has been following
Six Sigma for several years. Given below are
the key facts about Six Sigma in CG during
FY2012.
� Within CG India, there were 28 Black Belts
(BBs) who implemented 71 Six Sigma projects
in FY2012, versus 52 in the previous year.
� Similarly, 469 Green Belts (GBs) helped to
execute 612 GB projects in the year Ñ which
was 33% more than the previous year.
� The estimated direct financial impact of
these projects in FY2012 was Rs.7.6 crore.
� The Six Sigma drive is being
internationalised. Projects have been
undertaken in the USA, Indonesia and
Hungary. At present, 31 GBs have been
trained at these locations.
� 166 projects have been identified for CG
India during FY2013. If these are all successfully
executed, the estimated savings should be
between Rs.28 crore and Rs.35 crore.
HUMAN RESOURCESFY2012 saw focused organisational attention
on the creation of ‘One CG’ — an initiative
to better leverage CG’s strengths from the
revenue and cost perspectives. Creating
a single organisation is based upon the
execution of three key elements: One Offering,
One Structure and One Face to the Customer.
Going forward, the Company’s businesses
will be managed along product lines Ñ for
instance, Power Transformers, instead of a
division called CG Power. This new approach
should create better global accountability
and visibility with respect to revenues and
costs for each major product line. All support
functions, such as finance, legal and Human
Resources (HR), have been organised into
one global team to support all product lines
and, hence, the business units, across all
geographies.
With the objective of ‘One CG’, FY 2012
saw an acceleration of CG’s HR practices to
all foreign locations Ñ in an effort to create an
integrated HR organisation with a common
direction and themes. Towards this objective,
CGHR4U, the Company’s HR portal which
integrates employees with Company’s
initiatives, was launched across the world.
The mission: to complete a full-fledged
implementation of CGHR4U everywhere
before the end of FY2013.
To further strengthen CG’s performance
orientation, the Performance Management
Systems (PMS) was enhanced with greater
data-based objectivity and measurement of
performance Ñ including a uniform approach
to goal setting through the creation of a
Goal Directory. Introduction of behavioural
evaluation to the PMS has contributed to more
holistic performance evaluation outcomes.
Strengthening leadership capabilities
continues as a priority area. The Company has
launched its second global programme, called
‘Leading a Global Organisation’ (LAGO), which
exposes chosen executives to international
management inputs and gives them exposure
across divisions and geographies. To
enhance functional competencies, Ô Functional
Leadership Academies’ are being conducted
globally in key areas.
At CG, increasing labour productivity
quotients are central to HR. During FY2012,
revised time standards to further improve
manpower utilisation under the Company’s
CGPS initiatives were conducted to
recalibrate expectations from the workforce.
These studies have been completed at most
of the divisions in India, and have yielded
increased productivity at various plants.
Given the tested, proven and measured
business benefits of CGPS in India, this
initiative has been extended across the globe.
It has been already completed in Indonesia
and Hungary; and is in an advanced stage of
progress in Ireland and Canada. For FY2012,
Belgium and the USA will be the focal point
for CGPS.
CORPORATE SOCIAL RESPONSIBILITYFY2012 is the sixth year of CG’s dedication
to Corporate Social Responsibility (CSR).
The Company believes that it must have a
conscious objective to support, uplift and
enhance the sustainability of the communities
surrounding its facilities at a global level.
CSR in India � In India, the theme of education continued
with CG enlarging its efforts to improve
infrastructure facilities of schools through
renovation of school buildings, providing
amenities and financial subsidies for better
teaching staff.
� CG’s theme of encouraging affirmative
action helped students in this category
Going forward, the CompanyÕ s businesses will be managed along product lines to create better global accountability for each major product line
3 8 C R O M P T O N G R E A V E S L I M I T E D A N N U A L R E P O R T 2 0 1 1 - 1 2

through training in skill development
training and specialised courses to enhance
employability. The priority was higher
secondary students, with the objective of
making them self sufficient.
� In the area of HIV/AIDS awareness, the
coverage continues to expand through an
increasing number of organised awareness
and training programmes facilitated by the
ILO.
� Health and sanitation continued to be a
significant component of the Company’s
CSR activities. These involved providing
communities around CG’s facilities in various
parts of India with better levels of sanitation,
health camps and sponsorships to hospitals.
� CG is also a key participant in ‘Udaan’ —
a programme initiated by the Government
of India together with the CII Naoroji Godrej
Centre of Excellence. It is aimed improving
professional skills of students from the state
of Jammu & Kashmir. CG is an important
host company over the last two years, and
provides internship programmes for these
students.
� The three dedicated company-wide days
Ñ the Blood Donation Day, the HIV/AIDS
Awareness Day and Environment Day Ñ
continue to receive focused attention of the
Company and its employees. Consider blood
donation: in one day, CG employees donated
almost 1,200 bottles of blood.
CSR in the Rest of the WorldBelgium(i) CG Blood Donation Day was celebrated
on 17 June 2011, with a large number of
employees donating blood; (ii) World Health
Day was celebrated on 7 April 2011; (iii) 243
participants joined in the Car-free Day in July
2011; (iv) 31 May 2011 was recognised and
adopted as the Anti-Tobacco Day; (v) the
CEO visited several technical schools in the
region; and (vi) Foundation YvensÐ Boons
continued to be supported
Ñ for assisting children who cannot go to
school due to serious illness.
UKPSOL UK formally took up CSR activities for
the first time. Here are some of the activities
that it did in FY2012: (i) It started a ‘Payroll
Giving Scheme’, where employees donate
to charities, which is deducted from their
salaries; (ii) sponsored the local football
club, the Houston United Football Club by
donating three sets of strips; (iii) several
employees participated in the Ô Manchester
10 Km Run’ for MedEquip4Kids, a local
charity that works to provide equipment and
facilities to hospitals; and (iv) entered four
teams for the Ô SCA Million Makers Charity
Golf Day’ for the Prince of Wales Trust, which
aims to help 45,000 young people across
the UK.
USA(i) Employees and CG Power US together
donated US$ 30,000 to the United Way,
with DT and PT US being among the top
10 contributing entities; (ii) sponsored the
11th Annual Golf Tournament to benefit the
United Way; (iii) was a corporate sponsor
for Relay for Life, and donated US$7,400
towards cancer research; (iv) adopted one
mile of the Missouri highway to keep it free
of debris; (v) adopted ‘Habitat for Humanity’,
and sponsored a home near Albany; (vi)
got into a strategic partnership with Ô Junior
Achievement’, a K-12 partner for financial
literacy and workforce readiness; (vii) gave
over 200 hours of employee time and US$
20,000 in employee and company donations.
Canada(i) Set up two scholarships with the local
high school: the first two recipients were
chosen in June 2011; (ii) built a house for
‘Habitat for Humanity’, and supplied the
entire HVAC system; (iii) held a fund-raiser to
support those employees’ families that were
affected by the Philippines earthquake; (iv)
supported charitable organisations (cancer,
heart disease, multiple-sclerosis, children
with illness) with donations and fund-raising
events; (v) was the main sponsor for Ô Five
Days for the Homeless’, with the University of
Manitoba; and (vi) celebrated
the World Blood Donor Day, the Earth Day,
and the Global Green Consumer Day.
Indonesia(i) Received the ‘Best CSR’ award for
2011 from the head of the Bogor region;
(ii) awarded the Platinum Award, 2011,
in the Indonesian CSR Award held by the
Social Ministry, Indonesia; (iii) conducted
programmes such as scholarships
programme with Polytechnic Manufacturing,
Bandung, blood donation, cervical cancer
workshop for women, renovation of the
orphan’s School Hall, and the children’s
painting competition.
CGÕs Corporate Social Responsibility activities revolve around its three pronged approach Ñ commitment to Community, Workplace and Environment
3 9M A N A G E M E N T D I S C U S S I O N & A N A LY S I S

FINANCIAL PERFORMANCEWe first highlight CG’s standalone results,
after which we discuss the financial
performance of overseas entities and, finally,
the consolidated financials for the Company.
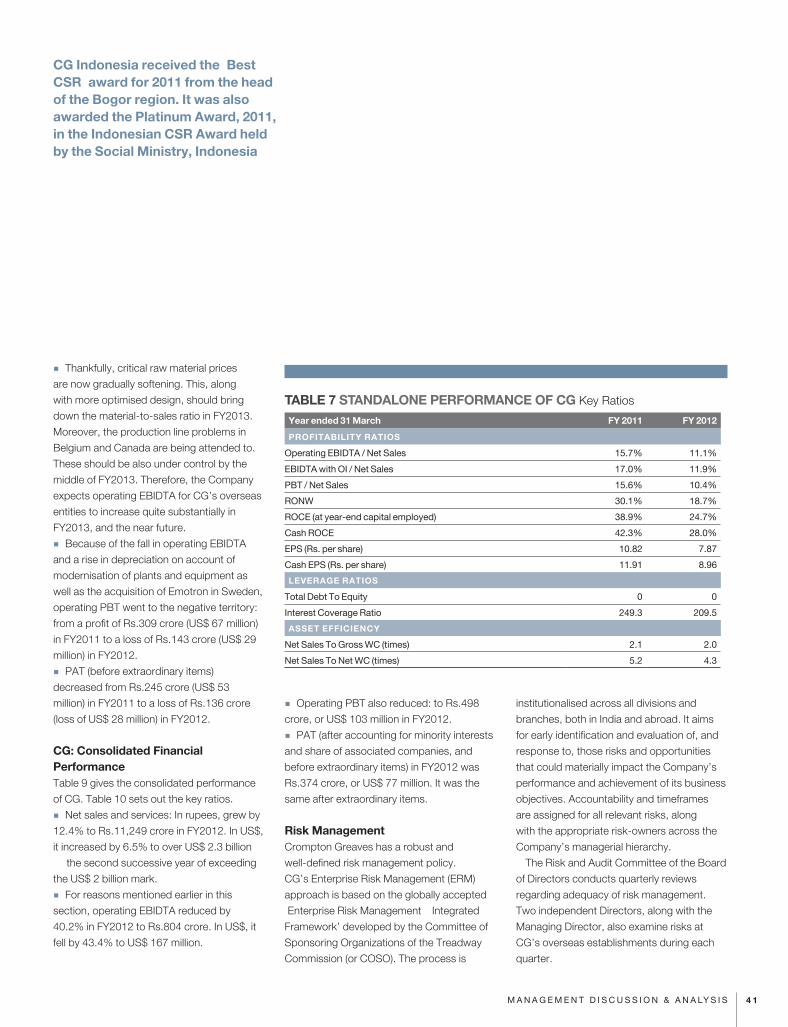
CG: Standalone Financial PerformanceThe standalone results of CG for the year
ended 31 March 2012 and 2011 are detailed
in Table 6. Table 7 gives the key ratios
(profitability, assets efficiency and leverage
ratios) of the standalone entity for FY2011
and FY2012.
� Gross sales, or revenue from operations
grew by 9.1% to Rs.6,850 crore in FY2012.
Net sales and services increased by 9% to
Rs.6,485 crore.
� Thanks to the sharp rise in the cost of key
inputs such as steel and copper, raw material
costs as a share of net sales increased
from 68.3% in FY2011 to 72.9% in FY2012.
This played a major role in the 22.7% fall in
operating EBIDTA Ñ from Rs.933 crore in
FY2011 to Rs.721 crore in FY2012.
� Due to a rise in depreciation on account of
additional commissioned investments in plant
and machinery, operating PBT reduced by
26.1% to Rs.627 crore in FY2012.
� PAT decreased by 27.3% to Rs.505 crore.
� The ratio of operating EBIDTA to net
sales reduced from 15.7% in FY2011 to
11.1% in FY2012. This was in line with the
managements estimates as discussed with
shareholders and analysts at the end of the
second, third and fourth quarters of the year.
� RONW reduced by 11.4 percent points to
18.7% in FY2012. This still remains the highest
RONW among the key players in the industry.
� Given the fall in EBIT and some increase
in capital employed, ROCE declined by 14.2
percent points to 24.7% at the end of FY2012.
It needs stating that 24.7% is the highest
ROCE among all significant competitors in the
sectors that CG India operate.
� As a standalone entity, CG is effectively a
debt free company, with an interest coverage
ratio that stood at 209.5 in FY2012.
CG: Overseas Financial PerformanceThe consolidated financial performance of all
overseas entities is given in Table 8.
For the CG overseas entities:
� Net sales grew by 15.5% in rupee terms
to Rs.4,794 crore in FY2012. In US$ terms, it
increased by 9.4% to US$ 996 million.
� Operating EBIDTA decreased by 84.3% to
Rs.68 crore in FY2012; in US$, by 85.2% to
US$15 million. This sharp decline in operating
EBIDTA was on account of two key factors:
(i) first, the increase in raw material and
consumable costs, which began in FY2011
and continued right up to Q3, FY2012; and
(ii) second, a sudden spike in the percentage
of test bay problems as well as major re-work
of power transformers, especially in Belgium
and Canada, which led to higher costs.
TABLE 6 STANDALONE PERFORMANCE OF CG in Rs. Crore
Year ended 31 March FY 2011 FY 2012
Revenue from operations 6,276 6,850
Less: excise duty 325 365
Net sales and services 5,951 6,485
Material consumption and construction material 4,065 4,726
Employee benefits 310 363
Other expenses 643 675
Operating EBIDTA 933 721
Other income (OI) 79 50
EBIDTA Including OI 1,012 771
Finance costs 4 3
Depreciation and amortisation 81 91
Operating PBT 848 627
PBT including OI (before extraordinary items) 927 677
Less: tax expenses
Current tax 244 193
Deferred tax (11) (21)
PAT 694 505
CGÕs foreign locations organised a childrenÕ s painting competition, blood donation camps and participated in Habitat for Humanity projects
4 0 C R O M P T O N G R E A V E S L I M I T E D A N N U A L R E P O R T 2 0 1 1 - 1 2
� Thankfully, critical raw material prices
are now gradually softening. This, along
with more optimised design, should bring
down the material-to-sales ratio in FY2013.
Moreover, the production line problems in
Belgium and Canada are being attended to.
These should be also under control by the
middle of FY2013. Therefore, the Company
expects operating EBIDTA for CG’s overseas
entities to increase quite substantially in
FY2013, and the near future.
� Because of the fall in operating EBIDTA
and a rise in depreciation on account of
modernisation of plants and equipment as
well as the acquisition of Emotron in Sweden,
operating PBT went to the negative territory:
from a profit of Rs.309 crore (US$ 67 million)
in FY2011 to a loss of Rs.143 crore (US$ 29
million) in FY2012.
� PAT (before extraordinary items)
decreased from Rs.245 crore (US$ 53
million) in FY2011 to a loss of Rs.136 crore
(loss of US$ 28 million) in FY2012.
CG: Consolidated Financial PerformanceTable 9 gives the consolidated performance
of CG. Table 10 sets out the key ratios.
� Net sales and services: In rupees, grew by
12.4% to Rs.11,249 crore in FY2012. In US$,
it increased by 6.5% to over US$ 2.3 billion
Ñ the second successive year of exceeding
the US$ 2 billion mark.
� For reasons mentioned earlier in this
section, operating EBIDTA reduced by
40.2% in FY2012 to Rs.804 crore. In US$, it
fell by 43.4% to US$ 167 million.
� Operating PBT also reduced: to Rs.498
crore, or US$ 103 million in FY2012.
� PAT (after accounting for minority interests
and share of associated companies, and
before extraordinary items) in FY2012 was
Rs.374 crore, or US$ 77 million. It was the
same after extraordinary items.
Risk ManagementCrompton Greaves has a robust and
well-defined risk management policy.
CG’s Enterprise Risk Management (ERM)
approach is based on the globally accepted
Ô Enterprise Risk Management Ð Integrated
Framework’ developed by the Committee of
Sponsoring Organizations of the Treadway
Commission (or COSO). The process is
institutionalised across all divisions and
branches, both in India and abroad. It aims
for early identification and evaluation of, and
response to, those risks and opportunities
that could materially impact the Company’s
performance and achievement of its business
objectives. Accountability and timeframes
are assigned for all relevant risks, along
with the appropriate risk-owners across the
Company’s managerial hierarchy.
The Risk and Audit Committee of the Board
of Directors conducts quarterly reviews
regarding adequacy of risk management.
Two independent Directors, along with the
Managing Director, also examine risks at
CG’s overseas establishments during each
quarter.
TABLE 7 STANDALONE PERFORMANCE OF CG Key Ratios
Year ended 31 March FY 2011 FY 2012
PROFITABILITY RATIOS
Operating EBIDTA / Net Sales 15.7% 11.1%
EBIDTA with OI / Net Sales 17.0% 11.9%
PBT / Net Sales 15.6% 10.4%
RONW 30.1% 18.7%
ROCE (at year-end capital employed) 38.9% 24.7%
Cash ROCE 42.3% 28.0%
EPS (Rs. per share) 10.82 7.87
Cash EPS (Rs. per share) 11.91 8.96
LEVERAGE RATIOS
Total Debt To Equity 0 0
Interest Coverage Ratio 249.3 209.5
ASSET EFFICIENCY
Net Sales To Gross WC (times) 2.1 2.0
Net Sales To Net WC (times) 5.2 4.3
CG Indonesia received the Ô Best CSRÕ award for 2011 from the head of the Bogor region. It was also awarded the Platinum Award, 2011, in the Indonesian CSR Award held by the Social Ministry, Indonesia
4 1M A N A G E M E N T D I S C U S S I O N & A N A LY S I S

Internal Controls and their AdequacyCG believes that a strong internal controls
framework is an essential pre-requisite of
growing businesses. To that end, it has
well documented policies, procedures and
authorisation guidelines commensurate with
the size of the organisation, as well as an
independent internal audit system to conduct
audits of various divisions, sales offices,
corporate headquarters and overseas
operations. The Risk and Audit Committee
of the Board is updated on significant
internal audit observations, compliance
with statutes, progress of risk management
and effectiveness of working of the control
systems every quarter. Internal audit also
extensively interacts with the external
auditors.
During FY2011, a Risk Control Framework
(RCF) software was developed, which was
extended across the Company in FY2012.
The RCF is a process embedded in the
organisation to understand the risk and
control environment from the perspective of
each unit within an SBU. It also highlights the
lack or weakness of controls, assessing what
risk these present to the business, and how
these risks are to be reduced.
OutlookThe global economic scenario for FY2013
remains depressed. There are serious
concerns about the fate of Greece and what
that may bring to some other nations within
the Euro zone, such as Spain and Portugal.
Though better than Europe, the US economy
has still a long way to go before getting back
to a steady-state GDP growth of around
3% per year; and it is unlikely that there will
be significant action on the economic front
before the new President assumes office in
January 2013.
In this difficult situation, the emerging
economies are still performing creditably.
By all accounts, China should post a GDP
growth of around 8% in 2012. And while
India’s growth has fallen to a new low of
6.1% in FY2012, there is a possibility of an
uptick in the coming year, bringing growth
up to the range of 6.5% to 6.8%. Though
lower than 9%, it will still be a healthy rate of
growth.
One pattern is becoming clear: the demand
for end-to-end power solutions and industrial
solutions is growing rapidly throughout
emerging economies. CG is positioning
itself as a significant global player in this
space. By creating a ‘One CG’ across all
its locations, markets and businesses, and
by leveraging capacities, engineering skills,
TABLE 8 CONSOLIDATED PERFORMANCE OF THE OVERSEAS ENTITIESYear ended 31 March FY 2011 FY 2012
Rs. crore US$ million Rs. crore US$ million
Revenue from operations 4,151 911 4,794 996
Operating EBIDTA 438 96 68 15
Other income (OI) 22 5 16 3
EBIDTA including OI 460 101 84 18
Finance costs 16 4 42 9
Depreciation and amortisation expenses 113 25 169 35
Operating PBT 309 67 (143) (29)
PBT including OI (before extraordinary items) 331 72 (127) (26)
Less: tax expenses
Current tax 49 11 23 5
Deferred tax 38 8 (14) (3)
PAT (before extraordinary items) 244 53 (136) (28)
Minority interest 0 0 0 0
Share of profit / (loss) of associates 1 0 0 0
PAT (before extraordinary items) 245 53 (136) (28)
Extraordinary item (38) (8) - -
PAT(after extraordinary items), carried forward to the Balance Sheet 207 45 (136) (28)
Exchange rate for US$ 1 45.5712 48.1233
By creating a Ô One CGÕ across all its locations, markets and businesses and by leveraging capacities, engineering skills, R&D and cost as well as quality synergies, CG is well placed to be a power and industrial systems major across much of fast growing emerging markets
4 2 C R O M P T O N G R E A V E S L I M I T E D A N N U A L R E P O R T 2 0 1 1 - 1 2

R&D cost as well as quality synergies, CG is
soundly placed to be a power and industrial
systems major across much of the relatively
fast growing emerging markets. To this, one
needs to add the Company’s core skills and
success in selling consumer products across
India.
Therefore, despite overall economic
constraints and concerns, CG looks well
placed to achieve double-digit top-line
growth in FY2013. And to deliver higher
profits than FY2012. All efforts within the
Company are geared to meet precisely these
targets.
Laurent DemortierCEO and Managing DirectorMumbai, 25 May 2012
CAUTIONARY STATEMENT
The management of Crompton Greaves has
prepared and is responsible for the financial
statements that appear in this report.
These are in conformity with accounting
principles generally accepted in India and,
therefore, may include amounts based on
informed judgements and estimates. The
management also accepts responsibility for
the preparation of other financial information
that is included in this report. Statements in
this Management Discussion and Analysis
describing the Company’s objectives,
projections, estimates and expectations
may be ‘forward looking statements’
within the meaning of applicable laws and
regulations. Management has based these
forward looking statements on its current
expectations and projections about future
events. Such statements involve known and
unknown risks significant changes in political
and economic environment in India or key
markets abroad, tax laws, litigation, labour
relations, exchange rate fluctuations, interest
and other costs and may cause actual results
to differ materially.
TABLE 10 CONSOLIDATED FINANCIAL PERFORMANCE Key Ratios
FY 2011 FY 2012
PROFITABILITY RATIOS
EBITDA w/o other income (OI) / Net sales 13.4% 7.1%
EBITDA with OI / Net sales 14.4% 7.6%
PBT / Net sales 12.3% 4.9%
RONW (with extraordinary item) 27.1% 10.5%
ROCE (terminal) 33.1% 12.9%
Cash ROCE (terminal) 38.2% 18.5%
PER SHARE RATIOS
EPS (without extraordinary items) 14.5 5.8
EPS (with extraordinary items) 13.9 5.8
Cash EPS (without extraordinary items) 17.7 9.3
Cash EPS (with extraordinary items) 17.1 9.3
LEVERAGE RATIOS
Total debt to equity 0.1 0.2
Interest coverage ratio 71.9 18.5
ASSETS EFFICIENCY RATIOS
Net sales to gross working capital (times) 2.0 1.9
Net sales to net working capital (times) 6.2 6.1
TABLE 9 CONSOLIDATED FINANCIAL PERFORMANCE Year ended 31 March FY2011 FY2012
Rs. crore US$ million Rs. crore US$ million
Sales and services 10,331 2,267 11,615 2,414
Less: excise duty 326 72 366 76
Revenue from operations 10,005 2,195 11,249 2,338
Material consumption and construction material 6,269 1,376 7,685 1,597
Employee benefits 1,181 259 1,466 305
Other expenses 1,211 265 1,294 269
Operating EBIDTA 1,344 295 804 167
Other income (OI) 99 21 52 11
EBIDTA including OI 1,443 316 856 178
Finance costs 20 4 46 10
Depreciation and amortisation 194 42 260 54
Operating PBT 1,130 249 498 103
PBT including OI ( before extraordinary items) 1,229 270 550 114
Less: tax expenses
Current tax 293 64 217 45
Deferred tax 17 4 (35) (7)
PAT (before extraordinary items) 919 202 368 76
Minority interest in income 0 0 1 0
Share of profit /(loss) of associate companies 8 1 5 1
PAT after minority interest and share of associate companies 927 203 374 77
Extraordinary items (38 ) (8) - -
PAT (after extraordinary items) 889 195 374 77
Exchange rate for US$ 1 45.5712 48.1233
4 3M A N A G E M E N T D I S C U S S I O N & A N A LY S I S