management cybernetics 1 stuart a. umpleby the george washington university washington, dc umpleby
Post on 21-Dec-2015
217 views
TRANSCRIPT

Management Cybernetics 1
Stuart A. UmplebyThe George Washington University
Washington, DCwww.gwu.edu/~umpleby
Perspectives on Management
• Professional approaches: finance, accounting, marketing, personnel admin.
• Disciplinary approaches: organizational behavior, operations research, decision analysis, information systems
• Type of organization: small business, international business, public administration
Management Cybernetics
• Is an interdisciplinary approach
• Addresses organizations of any size or type
• Focuses on the organization as a whole rather than a part
• Emphasizes cognitive processes: information processing and decision making, learning, adaptation
What will be discussed
• Edwards Deming – process improvement methods
• Stafford Beer – the Viable System Model
• Russell Ackoff – Interactive Planning
• Forrester and Senge – system dynamics
• Elliott Jaques – the quintave theory
• Gerard Endenburg -- sociocracy
Themes in the tutorial
• There are MANY ways to think about the management of organizations
• Only a few attempt to take a holistic perspective
• But there are great differences even among the holistic views
• Can each of these views be “right”
About management consulting
• Usually a management consultant is hired for his technical expertise
• But success depends more on emotional skill
• Often there is an underlying problem that is creating the perceived problem
• What are emotional or political reasons why the underlying problem is not addressed?
Underlying themes
• Complexity is defined by the observer
• Using any analytic method is better than using no analytic method
• The reason is the law of requisite variety and the “magical number seven plus or minus two”
Process improvement methods
• Are the most significant contribution to management thought in the last half of the 20th century
• Have had a dramatic effect on the relative competitiveness of nations
• Embody Ross Ashby’s theory of adaptive behavior

His name is Dr. W. Edwards Deming, and he’s a quality control expert.
In 1950, the Union of Japanese Scientists and Engineers (JUSE) invited Dr. Deming to lecture several times in Japan, events that turned out to be overwhelmingly successful.
To commemorate Dr. Deming’s visit and to further Japan’s development of quality control, JUSE shortly thereafter established the Deming Prizes, to be presented each year to the Japanese companies with the most outstanding achievements in quality control.
Today, Dr. Deming’s name is well known within Japan’s industrial community, and companies compete fiercely to win the prestigious Demings.
In 1953, Sumitomo Metals was fortunate enough to win the Deming Prize For Application. In retrospect, we believe it may have been the single most important event in the history of quality control at Sumitomo. By inspiring us to even greater efforts, it helped us to eventually become one of the world’s largest and most advanced steel-makers.
Sumitomo Metals owes a great deal to the American quality control expert who became one of Japan’s greatest inspirations. On that point, the management and employees of Sumitomo metals would like to take this opportunity to say simply, “Thanks, Dr. Deming, for helping to start it all.”
The most famous name in Japanese quality control is American
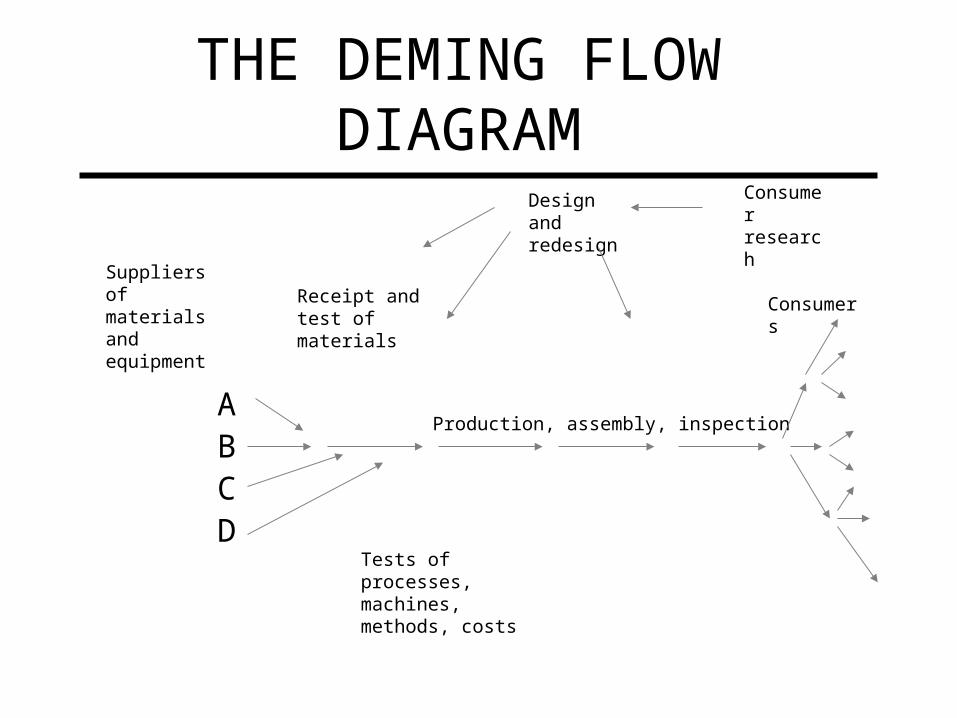
THE DEMING FLOW DIAGRAM
Suppliers of materials and equipment
A B C D
Receipt and test of materials
Tests of processes, machines, methods, costs
Production, assembly, inspection
Design and redesign
Consumer research
Consumers

Worksheet
Customer Model
YOUR
PROCESS
YOUR
SUPPLIERSYOUR
CUSTOMERS
INPUT OUTPUTS
REQUIREMENTS & FEEDBACK REQUIREMENTS & FEEDBACK
Name two or three of your most important CUSTOMERS and what you or your group provides:
My customers: What I provide them: Is there a quality gap between what I provide them andwhat they want?
______________ ________________________________________________
_____________________________________________
__________________________________________________________________________________________

Worksheet
Supplier Model
YOUR
PROCESS
YOUR
SUPPLIERSYOUR
CUSTOMERS
INPUT OUTPUTS
REQUIREMENTS & FEEDBACK REQUIREMENTS & FEEDBACK
Name two or three of your most important SUPPLIERS and what they deliver or provide to you or your group:
My suppliers: What they provide me: Is there a quality gap between what I get and what Iwant?
______________ ________________________________________________
_____________________________________________
__________________________________________________________________________________________

The Deming Chain Reaction
Improve Quality
Costs decrease because of less rework, fewer mistakes, fewer delays, snags
Productivity improves
Capture the market with better quality and lower price
Stay in business
Provide jobs and more jobs
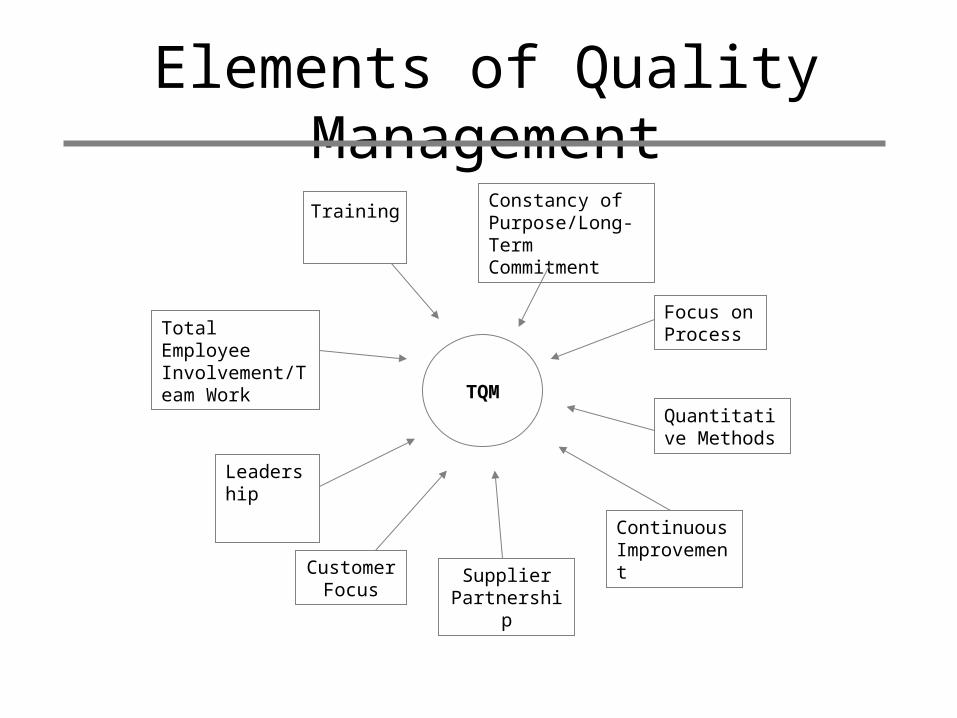
Elements of Quality Management
Constancy of Purpose/Long-Term Commitment
Total Employee Involvement/Team Work
Leadership
Customer Focus
Supplier Partnership
Focus on Process
Quantitative Methods
Continuous Improvement
Training
TQM

The Old Way
1. 2. 3.
Design it Make it Sell it
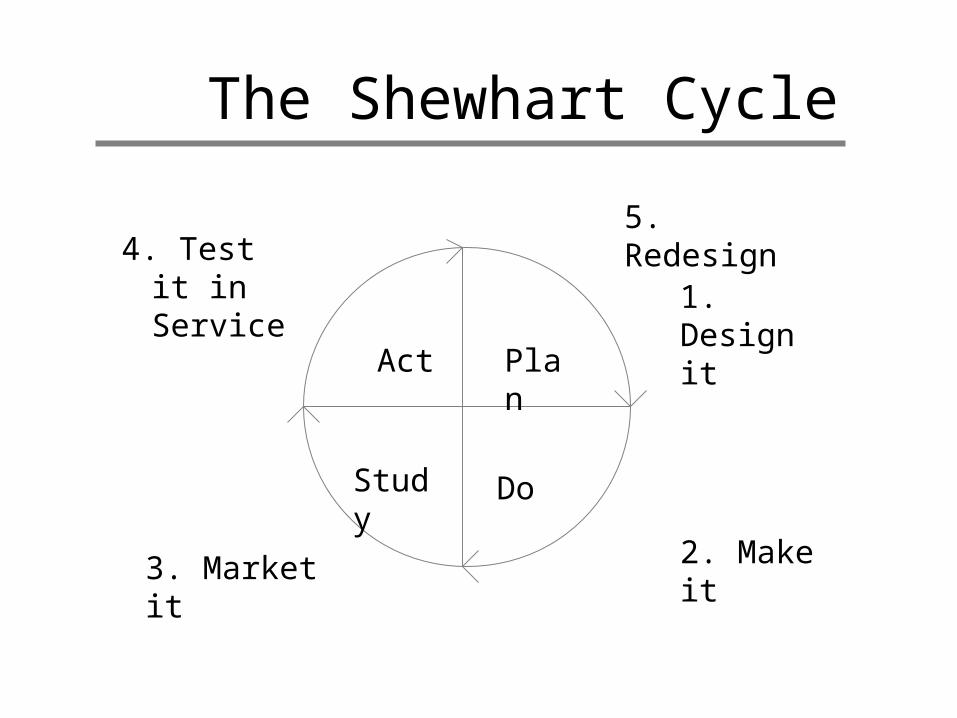
The Shewhart Cycle
4. Test it in Service
5. Redesign
1. Design it
2. Make it3. Market it
Act Plan
Study Do

What’s Different?The New, Excellent Organizations Concentrate
on Process, Not on Problems
PROBLEMMotivate PeopleWho is wrong?Define: responsibilityWatch bottom lineMeasure peopleDefine jobFix deviations“Do your job”
“Obey orders”
PROCESSRemove barriers
What is wrong?
Define: procedure
Watch quality
Measure systems
Define customer
Reduce variability
“Can I help you?”
“Improve things”

The Concept of Two Processes
I. The Production Process:
The way we produce output.
II. The Improvement Process:
The way we change process number 1.
“People must be given time to work on the process, not just in the process.”
R. Reid

Lack of Common Language
TOP MANAGEMENT
MIDDLE MANAGEMENT
HOURLY WORKERS
“How many units did I produce?”
“What is my return oninvestment?”
“How many overtime hoursdid we work this week?”
Juran’s Pyramid of PowerOne of the causes of the lack of two-way communication is that managers and workers do not share a common language. The language of quality is successfully being used in many organizations to develop meaningful two-way communication.

Future State
TOP
MANAGEMENT
MIDDLE
MANAGEMENT
HOURLY WORKERS
A common language:“What is the level of quality?”
Open Honest Two-Way Communication

Getting Better Faster
Time
Per
form
ance
Company ACompany B

FOCUS-PDCA
Find a Process to improve
Organize a Team That Knows the Process
Clarify Current Knowledge of the Process*
Understand Sources of Process Variation*
Select the Process Improvement
-To hold gain
- To continue improvement
- Improvement
- Data collection
• Data for processImprovement:
•Customer view•Worker view
•Lessons learned
•Improvement
•Data collection
•Data analysis
ACT
CHECKDO
PLAN
*
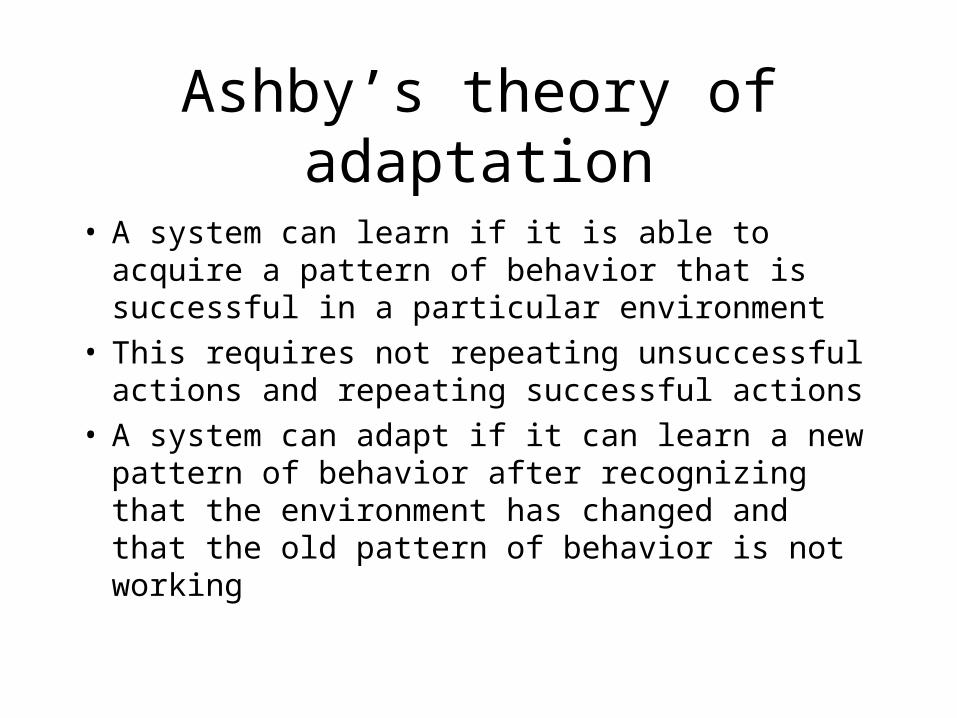
Ashby’s theory of adaptation
• A system can learn if it is able to acquire a pattern of behavior that is successful in a particular environment
• This requires not repeating unsuccessful actions and repeating successful actions
• A system can adapt if it can learn a new pattern of behavior after recognizing that the environment has changed and that the old pattern of behavior is not working

Two nested feedback loops
• A system with two nested feedback loops can display adaptive behavior
• The interior, more frequent feedback loop makes small adjustments and enables learning
• The exterior, less frequent feedback loop restructures the system (wipes out previous learning), thus permitting new learning
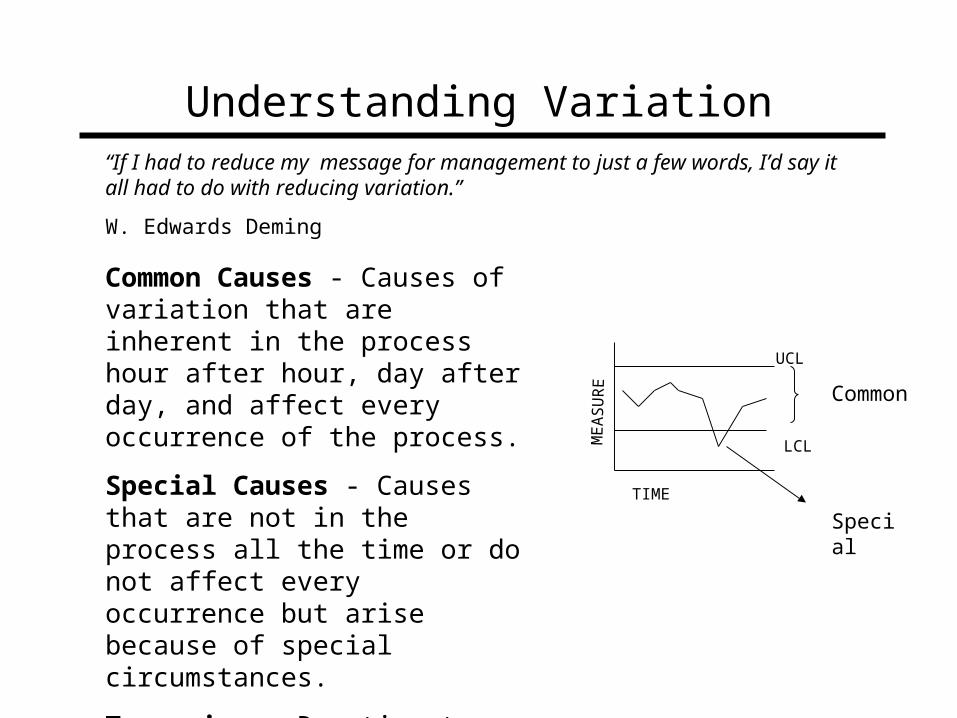
Understanding Variation“If I had to reduce my message for management to just a few words, I’d say it all had to do with reducing variation.”
W. Edwards Deming
Common Causes - Causes of variation that are inherent in the process hour after hour, day after day, and affect every occurrence of the process.
Special Causes - Causes that are not in the process all the time or do not affect every occurrence but arise because of special circumstances.
Tampering - Reacting to an individual occurrence of a process when only common cause variation is present.
Common
SpecialTIME
ME
AS
UR
E
UCL
LCL

Fig. 31. Average daily scores for a patient learning to walk after an operation: (1) before lessons began; (2) 10 days after lessons began; (3) 3 weeks after lessons began. From Hirokawa and Sugiyama; reference in footnote. The control limits came from the whole group of patients.
(1) Just before lessons began.
(2) 10 days after lessons began.
(3) 3 weeks after lessons began.
0.7
0.8
0.6
x
UCL
LCLUCL
UCL
LCLLCL
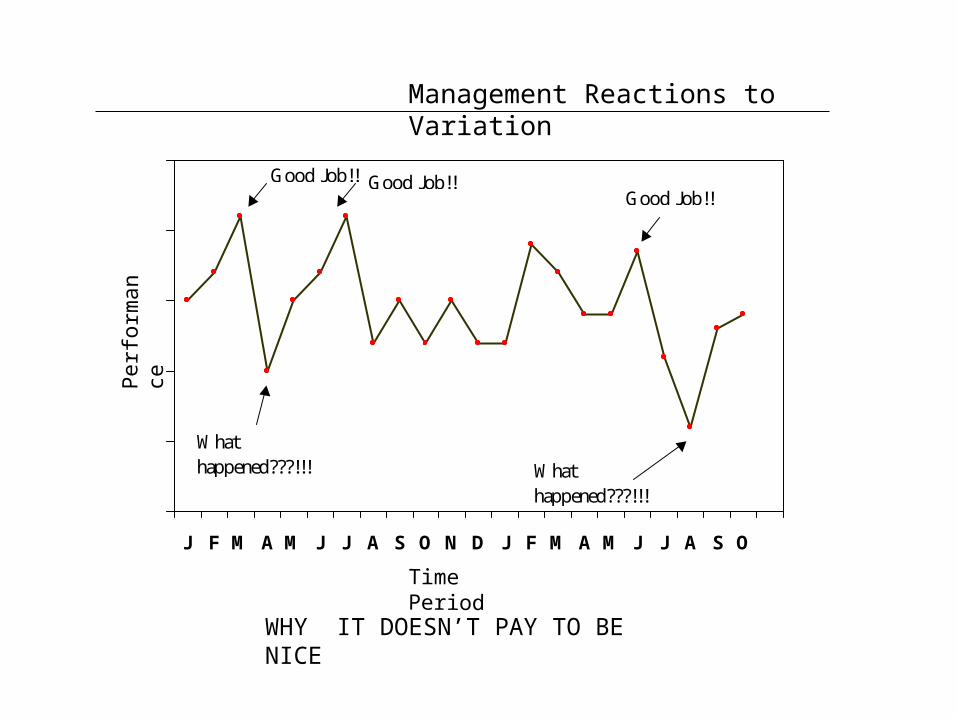
Management Reactions to Variation
J F M A M J J A S O N D J F M A M J J A S O
What happened???!!! What
happened???!!!
Good Job!!Good Job!!
Good Job!!
Per
f orm
ance
Time Period
WHY IT DOESN’T PAY TO BE NICE
Quality Improvement Priority Matrix
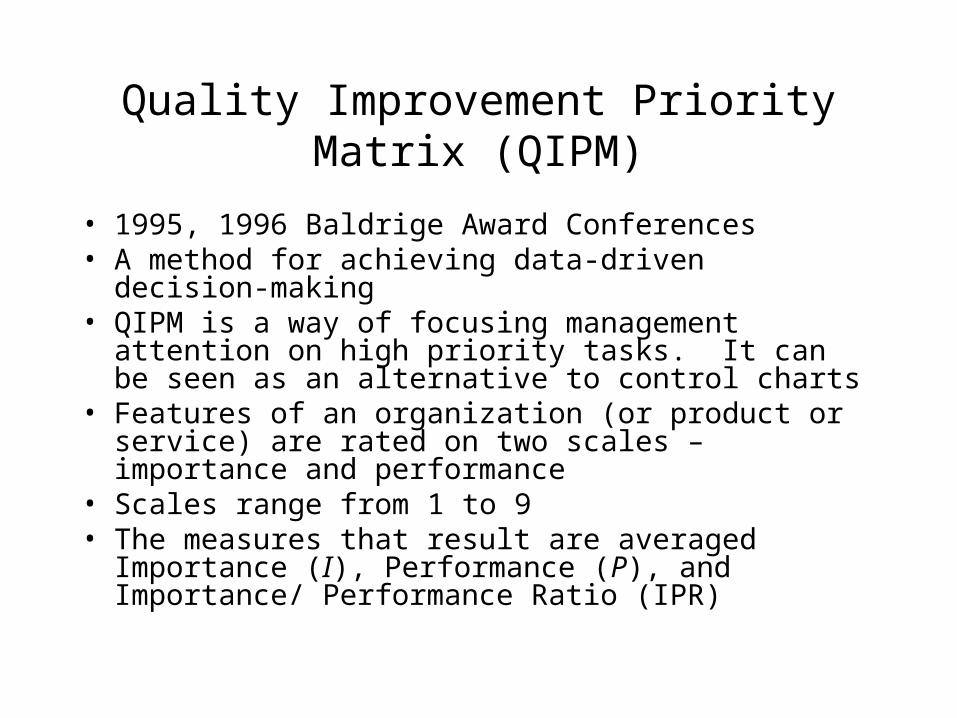
Quality Improvement Priority Matrix (QIPM)
• 1995, 1996 Baldrige Award Conferences • A method for achieving data-driven decision-making • QIPM is a way of focusing management attention on high
priority tasks. It can be seen as an alternative to control charts
• Features of an organization (or product or service) are rated on two scales – importance and performance
• Scales range from 1 to 9 • The measures that result are averaged Importance (I),
Performance (P), and Importance/ Performance Ratio (IPR)
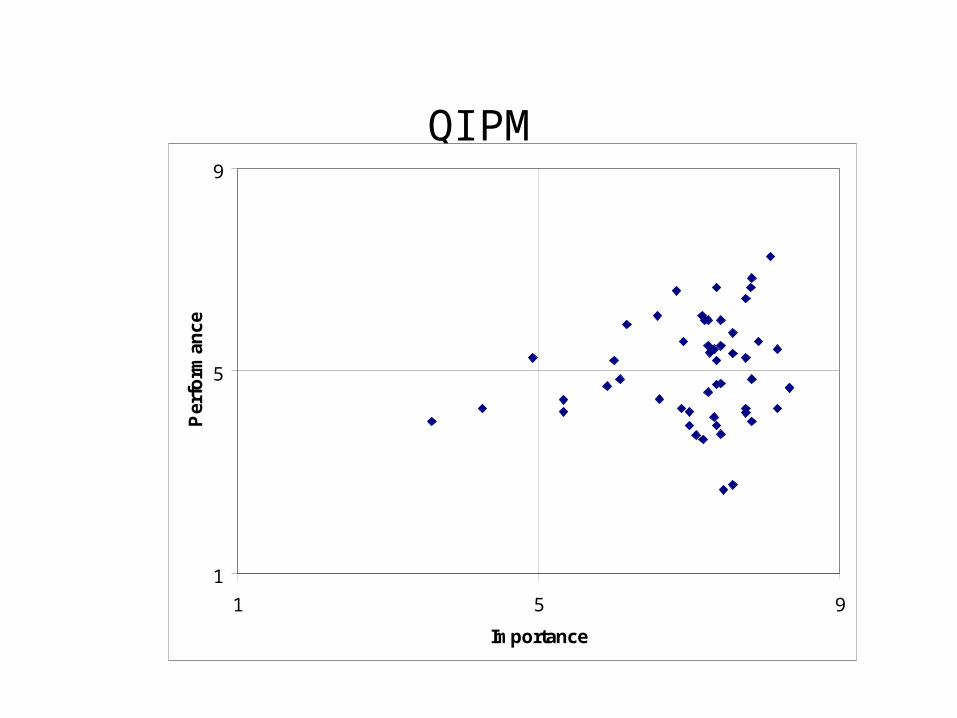
QIPM
1
5
9
1 5 9
Importance
Per
form
ance
1
52 50
45
4
32
13
6
49
2
16
41
25
21
46
47
35
2234
43
48
51
53
12
11
36
19 17
42
27
10
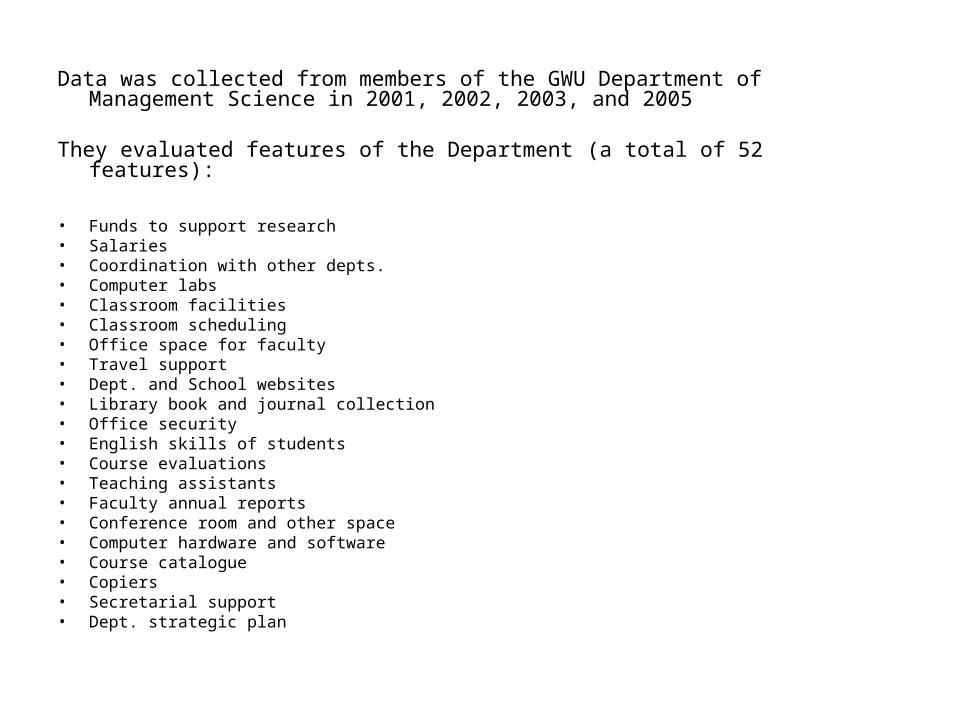
Data was collected from members of the GWU Department of Management Science in 2001, 2002, 2003, and 2005
They evaluated features of the Department (a total of 52 features):
• Funds to support research• Salaries• Coordination with other depts.• Computer labs• Classroom facilities• Classroom scheduling• Office space for faculty• Travel support• Dept. and School websites• Library book and journal collection• Office security• English skills of students• Course evaluations• Teaching assistants• Faculty annual reports• Conference room and other space• Computer hardware and software• Course catalogue• Copiers• Secretarial support• Dept. strategic plan

The most stable high importance features (always in the first 15) from 2001 to 2005
Feature Ave. Imp.
1. Health care benefits 8.72
2. Computer software 8.65
3. Classroom facilities 8.65
4. A supportive climate in
the dept. 8.60
5. Salaries 8.58
6. Projection equipment 8.48
7. Computer labs 8.47
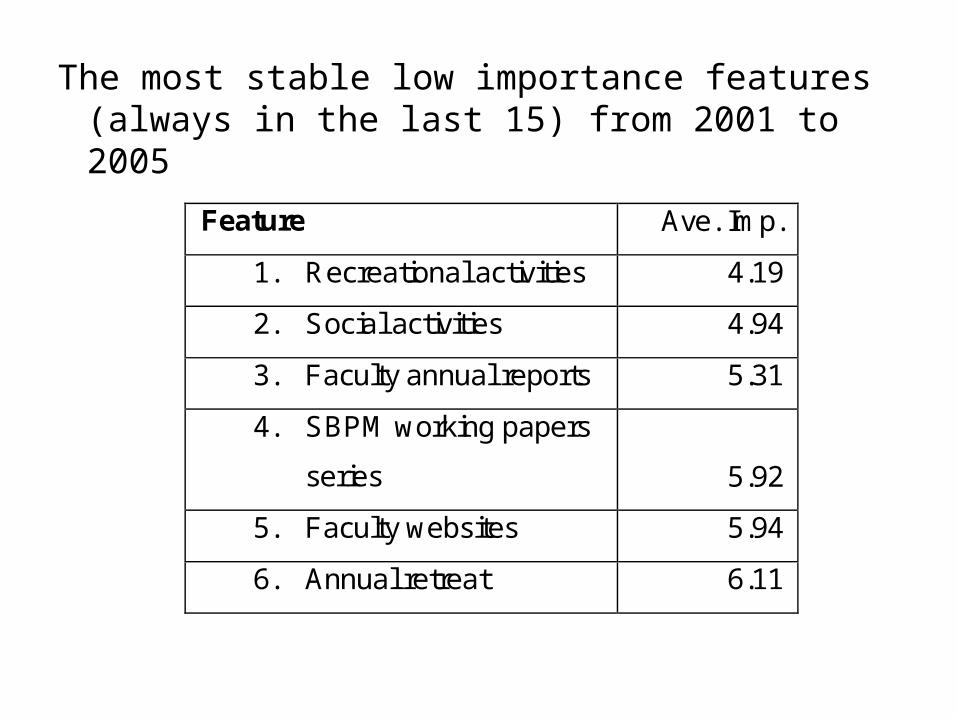
The most stable low importance features (always in the last 15) from 2001 to 2005
Feature Ave. Imp.
1. Recreational activities 4.19
2. Social activities 4.94
3. Faculty annual reports 5.31
4. SBPM working papers
series 5.92
5. Faculty websites 5.94
6. Annual retreat 6.11

The most stable low Performance features (always in the last 15) from 2001 to 2005
Feature
Ave.
Perf.
Help with writing research proposals 3.34
Dept. organization to implement its strategic plan 3.54
Use of continuous improvement methods in the Dept. 3.74
Conference room and other space 3.81
Dept. strategic plan 3.89
Building/ physical environment 3.94
Recreational activities 4.06
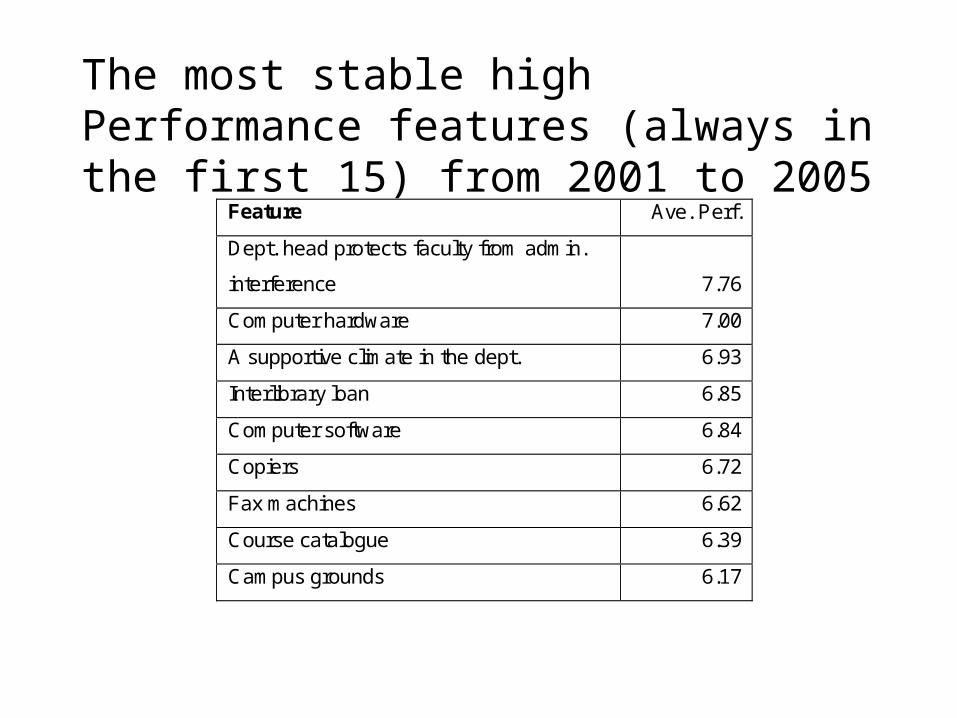
The most stable high Performance features (always in the first 15) from 2001 to 2005
Feature Ave. Perf.
Dept. head protects faculty from admin.
interference 7.76
Computer hardware 7.00
A supportive climate in the dept. 6.93
Interlibrary loan 6.85
Computer software 6.84
Copiers 6.72
Fax machines 6.62
Course catalogue 6.39
Campus grounds 6.17
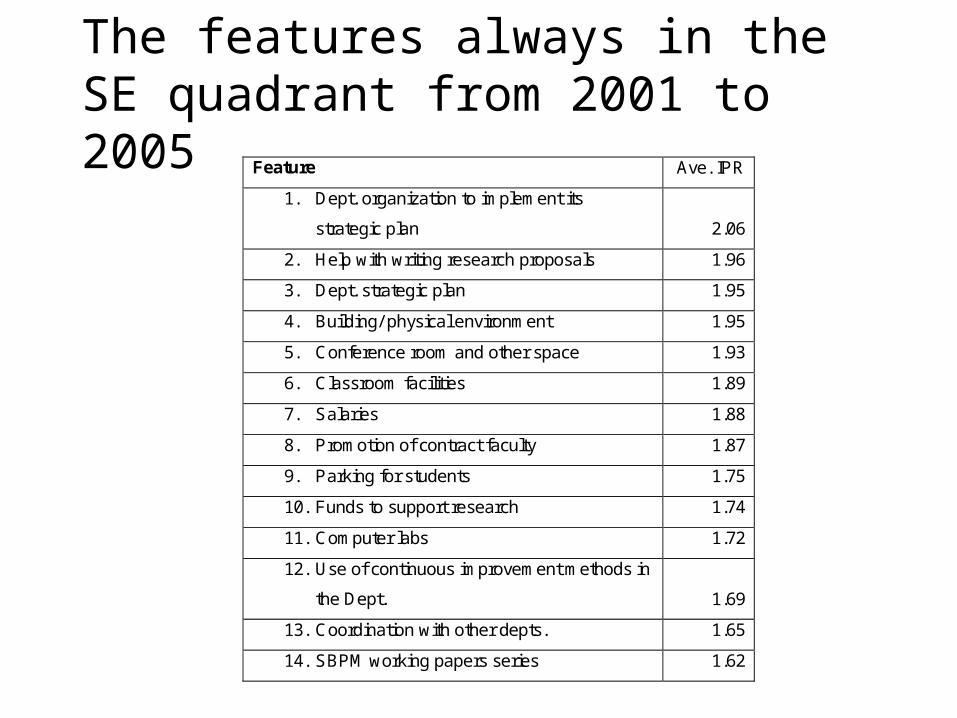
The features always in the SE quadrant from 2001 to 2005
Feature Ave. IPR
1. Dept. organization to implement its
strategic plan 2.06
2. Help with writing research proposals 1.96
3. Dept. strategic plan 1.95
4. Building/ physical environment 1.95
5. Conference room and other space 1.93
6. Classroom facilities 1.89
7. Salaries 1.88
8. Promotion of contract faculty 1.87
9. Parking for students 1.75
10. Funds to support research 1.74
11. Computer labs 1.72
12. Use of continuous improvement methods in
the Dept. 1.69
13. Coordination with other depts. 1.65
14. SBPM working papers series 1.62

– From 1/3 to 1/2 of all features routinely fall into the SE quadrant
(e.g., 19 of 51 features in 2001, 17 of 52 in 2002, 23 of 52 in
2003, and 26 of 52 in 2005
– The “border effect”
– The problem of automatic clustering of factors by their priorities
1
5
9
1 5 9
ImportanceP
erfo
rman
ce
1
52 50
45
4
32
13
6
49
2
16
41
25
21
46
47
35
2234
43
48
51
53
12
11
36
19 17
42
27
10
A classical approach: features in the SE quadrant are considered to have a high priority
Visual analysis of QIPM does not discriminate features’ priorities sufficiently

Using average Importance and Performance as a midpoint rather than the scale midpoint
1
5
9
1 5 9
Importance
Perf
orm
an
ce
1
52 50
45
4
32
13
6
49
2
16
41
25
21
46
47
35
2234
43
48
51
53
12
11
36
19 17
42
27
10
1
5
9
3 7
Importance
Perf
orm
an
ce
1
52 50
45
4
32
13
6
49
2
16
41
25
21
46
47
35
2234
43
48
51
53
12
11
36
19 17
42
27
10
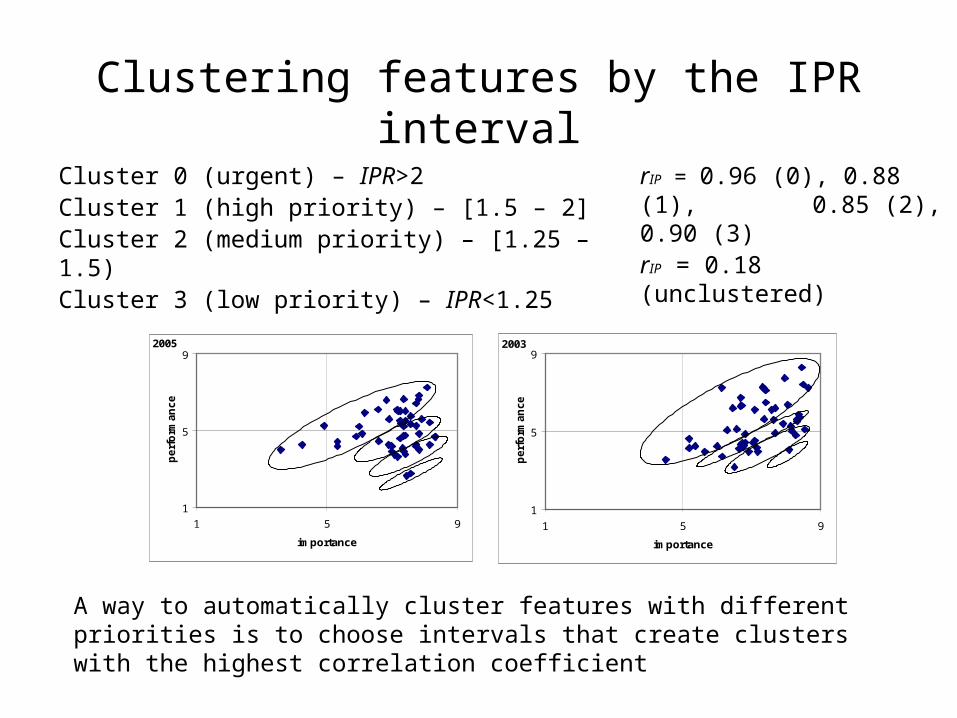
Clustering features by the IPR interval
1
5
9
1 5 9
importance
perf
orm
an
ce
2005
1
5
9
1 5 9
importance
perf
orm
an
ce
2003
Cluster 0 (urgent) – IPR>2 Cluster 1 (high priority) – [1.5 – 2] Cluster 2 (medium priority) – [1.25 – 1.5)Cluster 3 (low priority) – IPR<1.25
rIP = 0.96 (0), 0.88 (1), 0.85 (2), 0.90 (3)rIP = 0.18 (unclustered)
A way to automatically cluster features with different priorities is to choose intervals that create clusters with the highest correlation coefficient

QIPM
• Is easy to understand• Is efficient in terms of time and resources• Provides enough precision for monitoring changes
in priorities and performance• Is based on subjective data, so can be used to
extend process improvement methods beyond manufacturing into service-oriented activities

SOURCES OF CUSTOMER INFORMATION
Basic or Reactive Sources
• Customer service
• Technical support
• Claims/refunds
• Sales force reporting
Advanced or Proactive Sources
• Focused questioning of selected customers
• Observing customers using the product or service
• Monitoring customer satisfaction
• Monitoring of broad market trends

Result: quality improves and costs decline
Total costs =
Cost of producing goods or services
+Cost of producing waste or errors
+Cost of doing quality improvement
SAVE HERE SPEND HERE
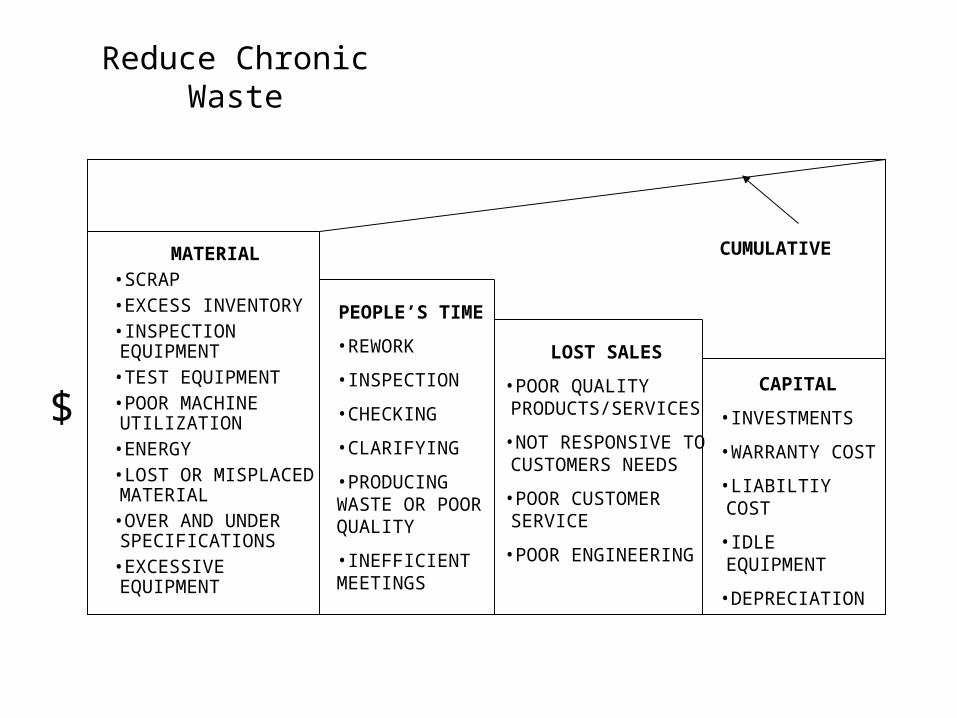
Reduce Chronic Waste
MATERIAL•SCRAP•EXCESS INVENTORY•INSPECTION EQUIPMENT
•TEST EQUIPMENT•POOR MACHINE UTILIZATION
•ENERGY•LOST OR MISPLACED MATERIAL
•OVER AND UNDER SPECIFICATIONS
•EXCESSIVE EQUIPMENT
PEOPLE’S TIME
•REWORK
•INSPECTION
•CHECKING
•CLARIFYING
•PRODUCING WASTE OR POOR QUALITY
•INEFFICIENT MEETINGS
LOST SALES
•POOR QUALITY PRODUCTS/SERVICES
•NOT RESPONSIVE TO CUSTOMERS NEEDS
•POOR CUSTOMER SERVICE
•POOR ENGINEERING
CAPITAL
•INVESTMENTS
•WARRANTY COST
•LIABILTIY COST
•IDLE EQUIPMENT
•DEPRECIATION
CUMULATIVE
$
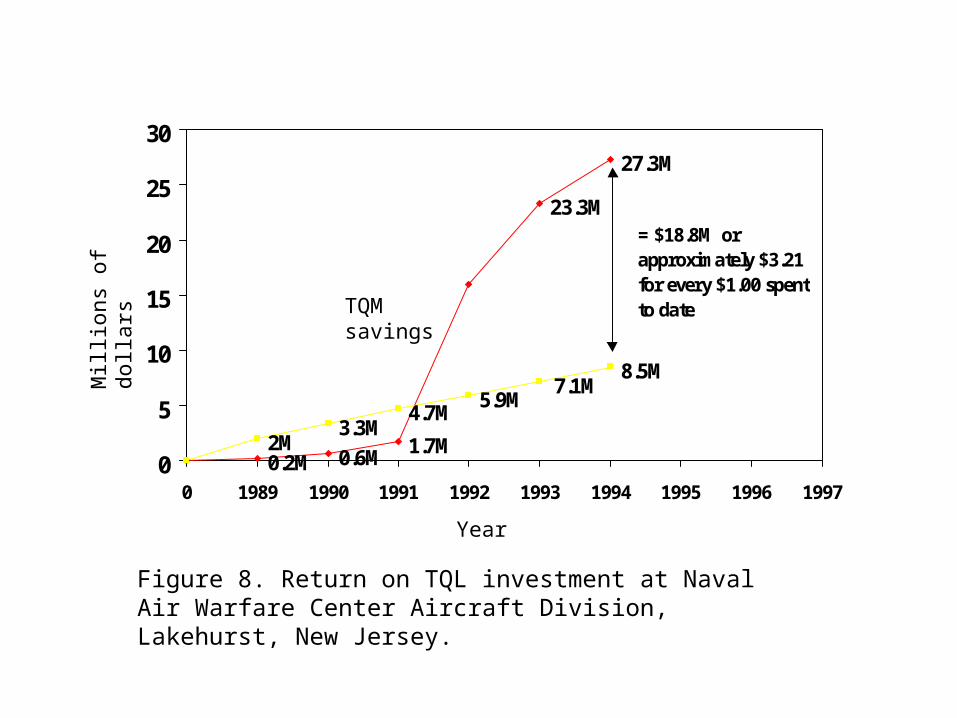
23.3M
0.2M 0.6M1.7M
27.3M
2M3.3M
4.7M5.9M
7.1M8.5M
0
5
10
15
20
25
30
0 1989 1990 1991 1992 1993 1994 1995 1996 1997
= $18.8M or approximately $3.21 for every $1.00 spent to date
Year
Mil
lion
s of
dol
lars
TQM savings
Figure 8. Return on TQL investment at Naval Air Warfare Center Aircraft Division, Lakehurst, New Jersey.
1987 1988 19901989 1991 199319920
20
30
40
50
60
10
Mil
lion
s of
dol
lars
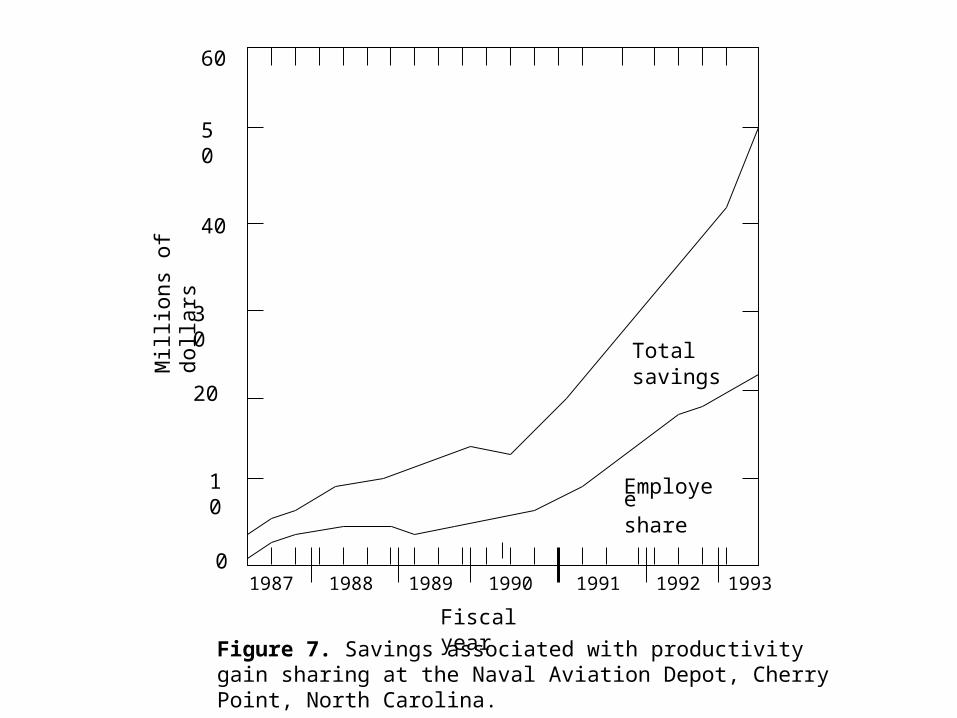
Figure 7. Savings associated with productivity gain sharing at the Naval Aviation Depot, Cherry Point, North Carolina.
Totalsavings
Employeeshare
Fiscal year

A manager who fails to provide resources and time for prevention activities is practicing false economy
Concentrate on Prevention, Not Correction
PREVENTIONCORRECTION
QUALITY
PREVENTION HAS MORE LEVERAGE WHEN IMPROVING QUALITY
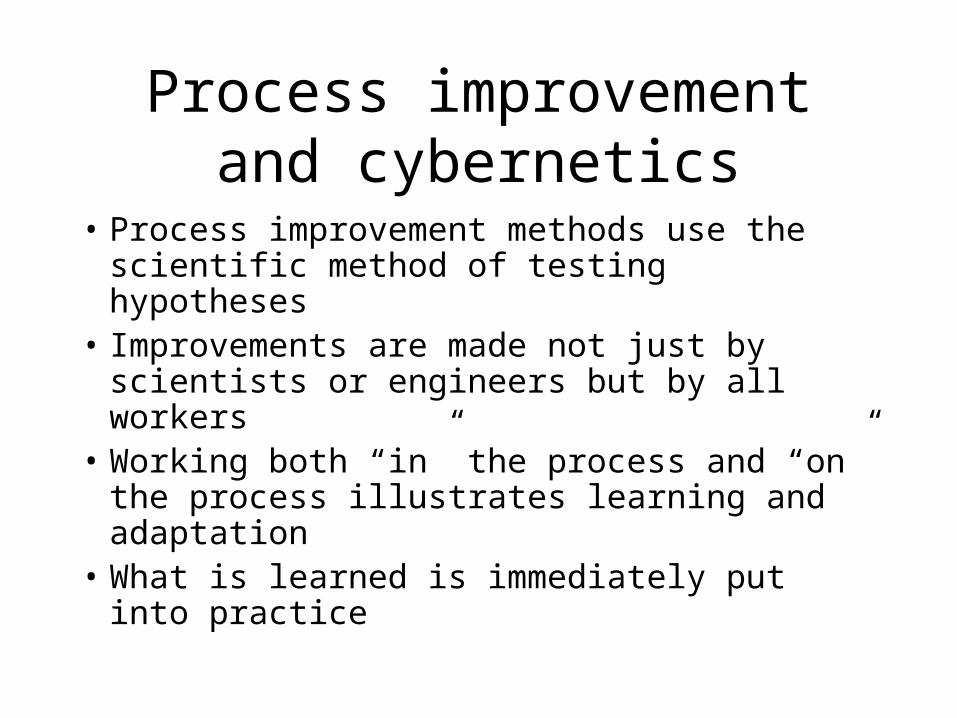
Process improvement and cybernetics
• Process improvement methods use the scientific method of testing hypotheses
• Improvements are made not just by scientists or engineers but by all workers
• Working both “in” the process and “on” the process illustrates learning and adaptation
• What is learned is immediately put into practice

An Example of Process Improvement in A University
Hospital
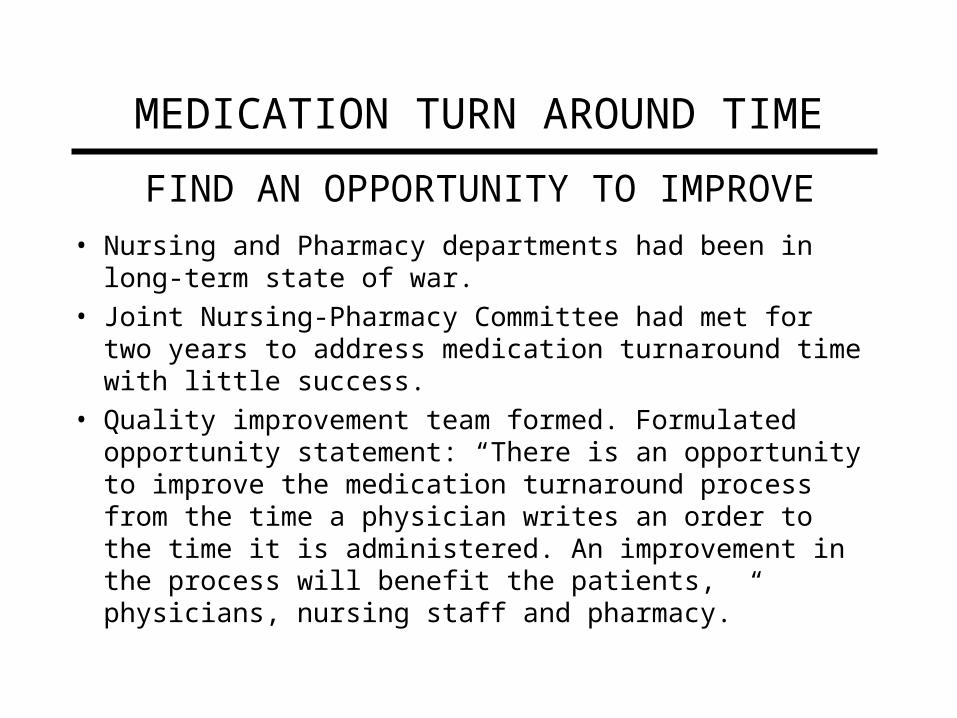
MEDICATION TURN AROUND TIME
• Nursing and Pharmacy departments had been in long-term state of war.
• Joint Nursing-Pharmacy Committee had met for two years to address medication turnaround time with little success.
• Quality improvement team formed. Formulated opportunity statement: “There is an opportunity to improve the medication turnaround process from the time a physician writes an order to the time it is administered. An improvement in the process will benefit the patients, physicians, nursing staff and pharmacy.”
FIND AN OPPORTUNITY TO IMPROVE

Medication Turnaround Time Process Flowchart Order written
Chart available?
Order Delivered to Unit
Pull yellow copy and place in pharmacy box (Station Secretary)
Reason for Order Errors:IllegibleNo SignatureNo Co-signatureNon-conforming (Id)Nursing JudgmentMulti-Service orderPatient AllergyIncorrect StampRestricted Drug
Wait
Order Filled
Order entered in computer
See Reasons for Order Errors (above).
Reasons for Delay of Pick-Up:ElevatorsVolume too largeNames on drawersPatient dischargedOff schedule
Medication administered to patient
Order reviewed, Is it correct?
Pharmacy Pick-Up?
Order checked, Is it OK?
no
yes
no
yes
no
yes
no
yes
Order delivered in Pharmacy
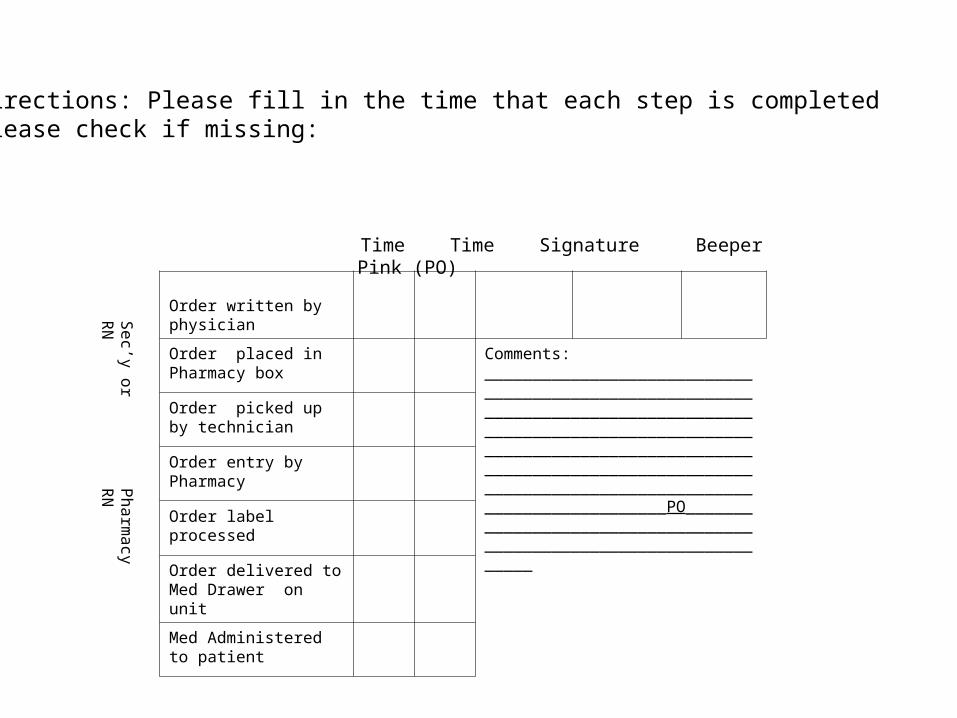
Time Time Signature Beeper Pink (PO)
Sec’y or R
N
Order written by physician
Order placed in Pharmacy box
Comments: _______________________________________________________________________________________________________________________________________________________________________________________________________________________PO____________________________________________________________________
Order picked up by technician
Order entry by Pharmacy
Order label processed
Order delivered to Med Drawer on unit
Med Administered to patient
Directions: Please fill in the time that each step is completedPlease check if missing:
Pharm
acy R
N

Median Elapsed Time
68
3040
8
30
01020304050607080
Ord
er
Pla
ce
s in
Ph
arm
ac
yB
ox
Te
ch
. Pic
kU
p Ord
er
En
try
Ord
er
pro
ce
ss
ed
me
dD
eliv
ere
dto
Un
it
Min
ute
s E
lap
se
d
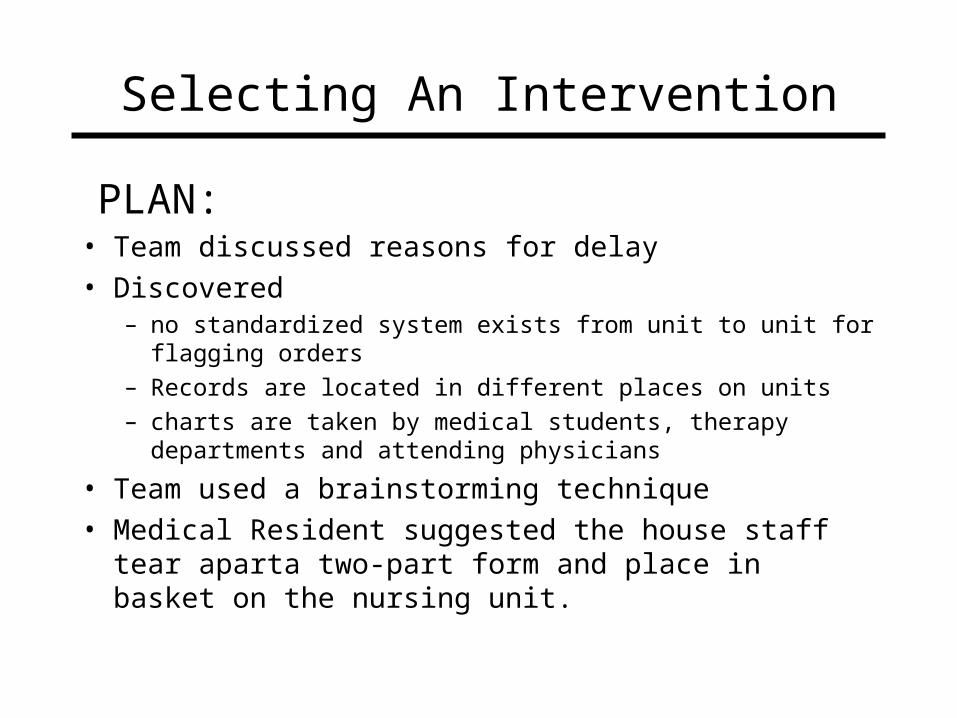
Selecting An Intervention
• Team discussed reasons for delay
• Discovered– no standardized system exists from unit to unit for flagging orders
– Records are located in different places on units
– charts are taken by medical students, therapy departments and attending physicians
• Team used a brainstorming technique
• Medical Resident suggested the house staff tear aparta two-part form and place in basket on the nursing unit.
PLAN:
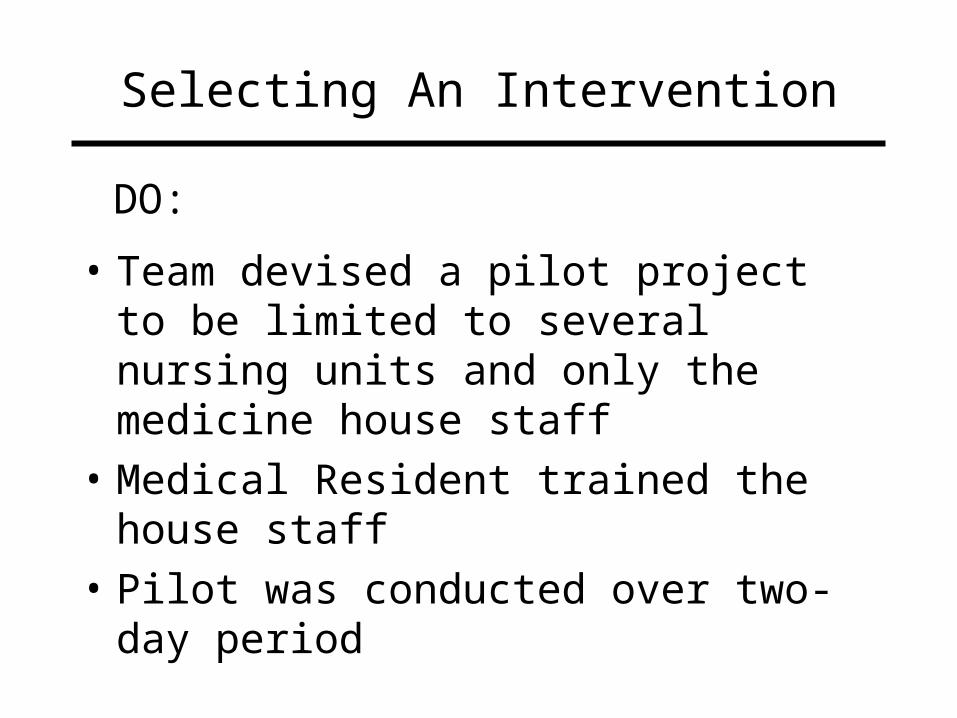
Selecting An Intervention
• Team devised a pilot project to be limited to several nursing units and only the medicine house staff
• Medical Resident trained the house staff
• Pilot was conducted over two-day period
DO:

Selecting An Intervention
• On first day, almost 100% compliance of test group; time in this step of the process was reduced from up to six hours to zero
• New process eliminated need for secretary to handle orders, thus minimizing opportunity for human error
• Second day a fiasco: Team hadn’t taken into account that the medical service changed and a new batch of house staff arrived unprepared for change in process
CHECK:
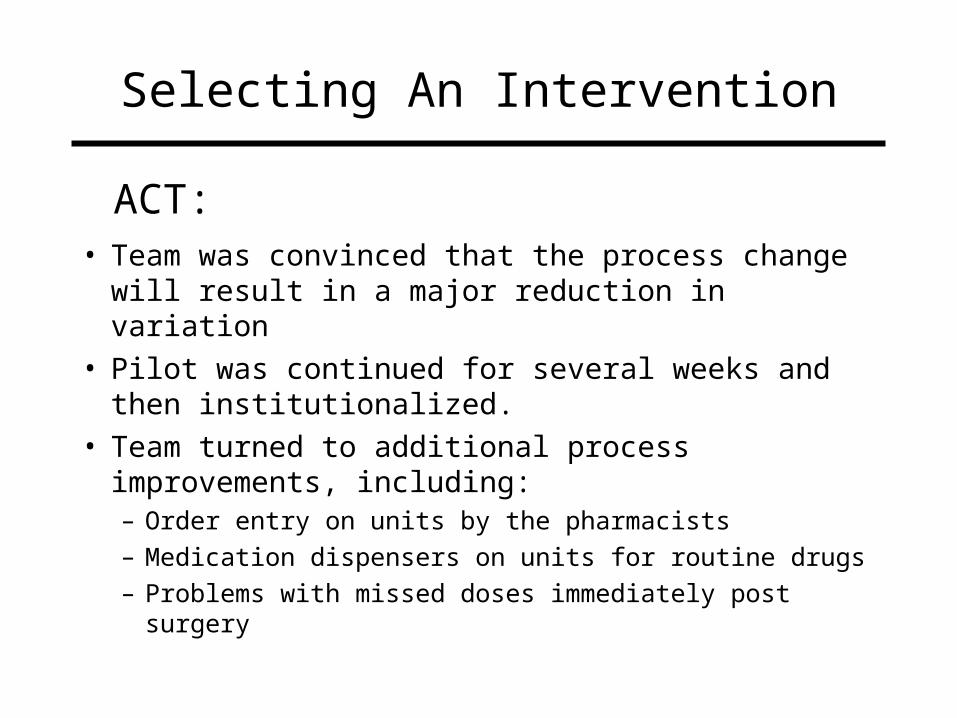
Selecting An Intervention
• Team was convinced that the process change will result in a major reduction in variation
• Pilot was continued for several weeks and then institutionalized.
• Team turned to additional process improvements, including:– Order entry on units by the pharmacists
– Medication dispensers on units for routine drugs
– Problems with missed doses immediately post surgery
ACT:
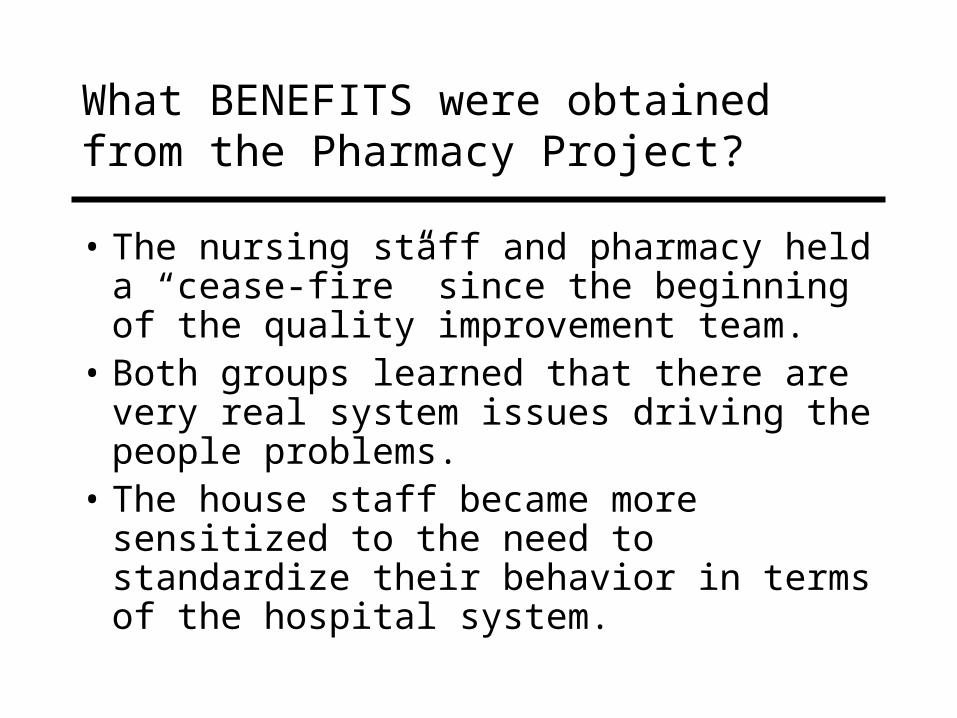
What BENEFITS were obtained from the Pharmacy Project?
• The nursing staff and pharmacy held a “cease-fire” since the beginning of the quality improvement team.
• Both groups learned that there are very real system issues driving the people problems.
• The house staff became more sensitized to the need to standardize their behavior in terms of the hospital system.
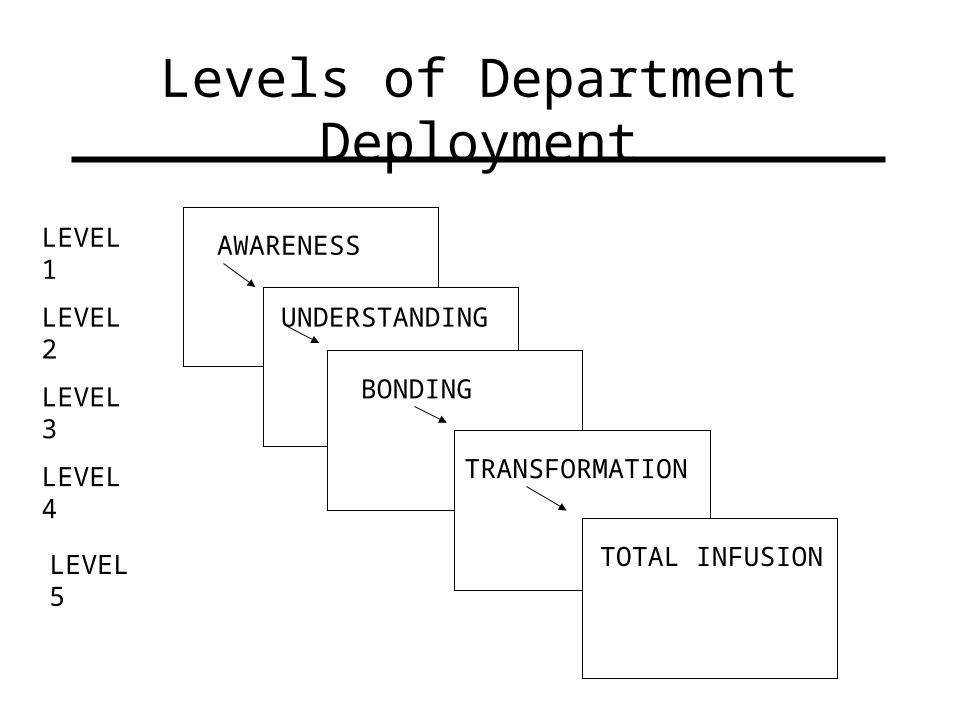
Levels of Department Deployment
AWARENESS
UNDERSTANDING
BONDING
TRANSFORMATION
TOTAL INFUSION
LEVEL 1
LEVEL 2
LEVEL 3
LEVEL 4
LEVEL 5

A tutorial presented at the
World Multi-Conference on Systemics, Cybernetics, and Informatics
Orlando, Florida
July 8, 2007