managed care and community health centers · managed care and community health centers leiyu shi,...
TRANSCRIPT

P1: fgiAspen Pub./JACM AS026-01 November 13, 1999 17:52 Char Count= 0
Managed Care and CommunityHealth Centers
Leiyu Shi, DrPH, MBAKevin D. Frick, PhD
Bonnie Lefkowitz, MPAJulia Tillman, MPA
This study has two objectives: (1) to examine the relationship between the involvement of commu-nity health centers (CHCs) in managed care and various center characteristics, including patient,provider, services, and financial characteristics, that are critically linked with the fulfillment of theirmission and (2) to identify factors significantly associated with CHCs’ involvement in managed care.Regarding the first objective, the study indicates that CHCs involved in managed care have morediversified sources of revenue and depend less on grant funding than other CHCs, and they serve asignificantly smaller proportion of uninsured and homeless patients. Involvement in managed care isalso associated with greater financial vulnerability, reflected in higher costs and net revenue deficits.Regarding the second objective, the study finds that CHCs have become involved in managedcare largely in response to external market pressures, such as the prospect of reduced federalgrant funding. Other significant factors include center size, location, and the percentage of userswho are Medicaid patients. Key words: community health center, managed care, Medicaid UniformData System
I N RECENT YEARS, many states have turnedto managed care as a way to address rising
costs and access problems for their Medicaidpopulation (Alpha Center, 1995; Oliver, 1998).Under prepaid managed care, health care or-ganizations are paid a per capita amount eachmonth to provide for contracted medical ser-vices (U.S. General Accounting Office [GAO],1995). In 1996, over 13 million Medicaid recip-ients (40.1%) nationwide were enrolled in man-aged care (prepaid as well as primary care casemanagement), representing a more than threefoldincrease in enrollment levels over 1991 (9.5%)(Health Care Financing Administration, 1996).The rapid transformation of Medicaid has af-fected safety-net providers, including commu-nity health centers, which provide services tonearly 8% of the nation’s Medicaid population.
Since their inception in the 1960s, communityhealth centers (CHCs) have provided a primarycare safety net for the nation’s poor and under-served in both inner-city and rural areas (U.S.Senate, 1988). CHCs incorporate the concepts ofcomprehensive and coordinated health services
along with continuity of care within a single in-stitutional setting by providing integrated care,
Leiyu Shi, DrPH, MBA, Associate Professor, Departmentof Health Policy and Management, Johns Hopkins School ofPublic Health and Hygiene, Baltimore, Maryland;Associate Director, Primary Care Policy Center for theUnderserved, Baltimore, Maryland
Kevin D. Frick, PhD,Assistant Professor, Department ofHealth Policy and Management, Johns Hopkins School ofPublic Health and Hygiene, Baltimore, Maryland
Bonnie Lefkowitz, MPA,Consultant/Writer, Bethesda,Maryland
Julia Tillman, MPA, Health Policy Analyst, Bureau ofPrimary Health Care, Health Resources and ServicesAdministration, U.S. Department of Health and HumanServices, Bethesda, Maryland
The authors would like to acknowledge the support fromthe Bureau of Primary Health Care, Health Resources andServices Administration. At the time of writing BonnieLefkowitz was Associate Bureau Director for Data, Eval-uation, Analysis, and Research, Bureau of Primary HealthCare, Health Resources and Services Administration, U.S.Department of Health and Human Services.
J Ambulatory Care Manage2000, 23(1), 1–22c© 2000 Aspen Publishers, Inc.
1

P1: fgiAspen Pub./JACM AS026-01 November 13, 1999 17:52 Char Count= 0
2 JOURNAL OF AMBULATORY CARE MANAGEMENT/JANUARY 2000
including primary and preventive care services.Their central mission is to increase access tocommunity-based primary health care servicesand improve the health status of medically un-derserved populations.
Called by various names—neighborhoodhealth centers, community health centers, fam-ily health centers, migrant health centers, andrural health initiatives—CHCs, whose ranksnumbered 685 organizations in 1996, served anestimated 8 million people during that year, in-cluding 5.2 million whose income was below thepoverty line and another 1.6 million whose in-come was between the poverty line and 200%above the poverty line. Data collected throughthe Bureau of Primary Health Care shows thattheir patients are primarily drawn from specificethnic or racial minority groups: 28% black, 32%Hispanic, and 4% other minority groups.
CHCs employ a sliding fee schedule based onpatient income and seek direct and third-party re-imbursement for services. Nationally, about 28%of CHCs’ revenues are derived directly from thefederal government through funds authorized un-der Section 330 of the Public Health ServiceAct plus other federal grants. Remaining fundscome from Medicare (7%); Medicaid (34%);other third parties (8%); state, local, and privategrants (17%); and direct patient fees (6%). Thefederal and other grant funds are used largely tosupport care for the uninsured, who constitute40% (3.2 million) of health center patients. The1989 federally qualified health center (FQHC)legislation, which required states to pay CHCsfor Medicaid services on the basis of reasonablecost, significantly increased the amount and pro-portion of CHC revenues attributable to Medi-caid and facilitated expansion of capacity (Lewis-Idema, Chu, Hughes, & Lefkowitz, 1998). As aresult, both Medicaid recipients receiving carefrom CHCs and total CHC service users, includ-ing the uninsured, increased as grant funds pre-viously subsidizing Medicaid were freed up.
The rapid increase of managed care participa-tion among CHCs is no accident. Concerned thatthey may lose Medicaid patients, who account for
one-third of their funding, an increasing numberof CHCs are participating in Medicaid managedcare arrangements. Since the onset of Medicaidmanaged care, four major models of CHC par-ticipation have emerged:
1. CHCs contract directly with the state withinthe context of primary care case manage-ment (PCCM). Centers receive cost-basedreimbursement as well as a case manage-ment fee.
2. CHCs subcontract with health maintenanceorganizations (HMOs) as a primary careprovider, usually bearing some risk asso-ciated with primary care delivery.
3. CHCs form networks with other providersfor the purpose of group contracting withan HMO.
4. CHCs form their own managed care plansand contract directly with the state for fullrisk (Bonnie Lefkowitz BPHC, personalcommunication, 1998).
In 1991, there were 41 CHCs with managedcare arrangements (6% of the total number ofCHCs). By 1996, 308 CHCs (45% of the to-tal number) had managed care arrangements,more than a sixfold increase (see Figure 1). To-tal managed care enrollment, including Medi-caid, Medicare, and commercial payer–insuredpatients, was over 1.2 million.
While CHCs are seeking to maintain or ex-pand the number of their Medicaid patients in-sured by managed care organizations (MCOs),the centers may be attractive to MCOs be-cause they are located in target communities,offer support services to Medicaid recipients,and have established relationships with these pa-tients (Abrams et al., 1995). CHCs are also rec-ognized by MCOs and Medicaid agencies ascost-effective providers of care for the high-risk,vulnerable Medicaid population (Abrams et al.,1995; Lewin-VHI and MDS Associates, 1994).
Although managed care may help CHCssustain their revenue sources, it has created a se-ries of concerns. First, as Medicaid reimburse-ments decrease, centers are having trouble main-taining their service capacity. This is happening

P1: fgiAspen Pub./JACM AS026-01 November 13, 1999 17:52 Char Count= 0
Managed Care and Community Health Centers 3
Figure 1. Community health centers and managed care.
at the same time that they are seeing growingnumbers of uninsured people. Moreover, declin-ing employment-based coverage contributes tothe increase in the uninsured, thus exacerbatingthe demand for uncompensated care (EmployeeBenefits Research Institute, 1995). Hendersonand Markus (1996) note that the ability of CHCsto provide community-based primary care to allmedically underserved populations might be injeopardy because of a reduction in Medicaid re-imbursement and the increase in the uninsured.
Second, restricted revenues may affect theCHCs’ ability to continue to provide nonre-imbursable services under managed care, suchas enabling services and culturally sensitive
services, including translation, nutrition, coun-seling, and outreach (GAO, 1995; Abrams et al.,1995).
Third, prepaid managed care also exposesCHCs to significant financial risk. They may beespecially vulnerable financially if they have cap-itation rates that do not fully cover their cost ofservices, have assumed financial responsibilityfor services other than primary care, and get asizable portion of total revenues from Medicaidprepaid managed care (GAO, 1995).
Fourth, CHCs dealing with managed care forthe first time are likely to face additional require-ments that demand improved internal accountingand integrated management information systems.

P1: fgiAspen Pub./JACM AS026-01 November 13, 1999 17:52 Char Count= 0
4 JOURNAL OF AMBULATORY CARE MANAGEMENT/JANUARY 2000
New staff might have to be hired to deal withmanaged care plans and monitor costs. All thesechanges necessitate significant financial out-lays, which could increase costs of services andthreaten financial sustainability.
Fifth, centers may lose Medicaid managed carepatients through head-to-head competition withother providers or disadvantageous enrollmentpractices.
The purpose of this study was to examinethe relationship between CHCs’ involvement inmanaged care and various center characteristicscritically linked with the fulfillment of the CHCs’mission. Specifically, we compared centers withdifferent levels of managed care involvement interms of a host of patient, provider, services, andfinancial characteristics. The purpose of the com-parisons was to provide evidence to determinewhether and to what extent the concerns listedabove have become reality. Further, the studyidentified factors significantly associated withCHCs’ involvement in managed care. Knowl-edge of these factors would help in the devel-opment of a theory of managed care contractingfor CHCs and assist policy makers in anticipatingfuture managed care contracting within CHCs.
METHODS
Data
The data for this study primarily came from the1996 Uniform Data System (UDS) maintainedby the Bureau of Primary Health Care (BPHC), acomponent of the Health Resources and ServicesAdministration of the Department of Health andHuman Services. Started in 1996, UDS is an inte-grated reporting system that provides uniformlydefined data for major BPHC grant programs andyields consistent information on center, patient,and clinical characteristics that can be comparedwith other national and state data (Bureau ofPrimary Health Care [BPHC], 1995). The 1996UDS contains data on 685 BPHC-funded CHCs,which form the universe of our study population.
In addition to UDS, we also obtained datafrom the Health Care Financing Administration
(HCFA) on the status of states’ implementation ofthe Comprehensive Health Care Reform Demon-strations or Medicaid statewide Section 1115research and demonstration waiver. To the ex-tent that CHCs view Section 1115 waivers asrequiring their involvement in managed care tomaintain market share, the increase in CHCs’ in-volvement in managed care may be attributedto the implementation of Section 1115 waiverprograms by the states (Henderson & Markus,1996).
Measures
Managed care
For the purpose of this study and based on theUDS manual, managed care was defined as anyprepaid arrangement health centers have madewith a third party, including Medicaid, Medicare,and private HMOs and PPOs. CHCs’ involve-ment in managed care is obtained from UDSTable 9C. All grantees participating in Medi-care, Medicaid, private, or other managed careplans are required to complete this table. Thedata collected include information on revenuereceived and expenses for prepaid plans and in-formation on the number of enrollees in differ-ent managed care plans. Using information fromthis table and information on center revenue andusers, we define CHCs’ involvement in managedcare in terms of two indicators: managed carerevenues and managed care enrollees. These twoindicators were also used in the site selection fora case study of managed care CHCs (Abramset al., 1995). Many studies have used enrolleesas a measure to capture managed care experienceat the national (Ermann & Richmond, 1994; Hoy,Curtis, & Rice, 1991; Iglehart, 1992; Zarabozo,1996), regional (Gold, 1991), state (Gold, 1991),local (Feldman, Kralewksi, & Qowd, 1989; Gold,1991), and organizational (Gold, 1991; Iglehart,1994) levels. Research also has used revenue tomeasure product line within a plan or organiza-tion (Hoy et al., 1991). The sources of managedcare revenues and enrollees are Medicaid, Medi-care, private HMOs or PPOs, and other.

P1: fgiAspen Pub./JACM AS026-01 November 13, 1999 17:52 Char Count= 0
Managed Care and Community Health Centers 5
For the purpose of this study, CHCs’ involve-ment in managed care was defined as a contin-uum, including:• high-volume and high-revenue managed
care CHCs (HVHR centers); that is, CHCswhose prepaid enrollees constituted at least10% of total users (note that not all enrolleesare users for a given year) and whose revenuefrom prepaid managed primary care was atleast 5% of total revenue• high-volume and low-revenue managed
care CHCs (HVLR centers); that is, CHCswhose managed care enrollees constitutedat least 10% of the users but whose rev-enue from prepaid managed primary carewas more than 0% and less than 5% of totalrevenue• low-volume and low-revenue managed care
CHCs (LVLR centers); that is, CHCs whosemanaged care enrollees constituted morethan 0% and less than 10% of total users andwhose revenue from prepaid managed pri-mary care was more than 0% and less than5% of total revenue• non-managed-care CHCs; that is, CHCs
with no managed care enrollees and norevenue from prepaid managed primarycare
Centers with fewer than 10 managed careenrollees and less than $100 in managed carerevenue were considered outliers and weregrouped in the non-managed-care category aswell.
The choice of 10% cutoff for enrollees and 5%for revenue was based on the distribution of thesetwo measures among CHCs. Sensitivity analysisperformed using slightly different cutoff pointsyielded similar results. Further, we performedan analysis with a less restrictive definition ofmanaged care revenue: total (rather than just pri-mary care) prepaid managed care revenue. Totalprepaid managed care revenue includes specialtyand inpatient referral expenses and is not reportedas part of the centers’ scope of services in otherrevenue tables. Since the two methods producedalmost identical results, we present only those
based on the more restrictive definition of man-aged care revenue.
We divided centers into these categories so thatnot only could we compare centers involved inmanaged care with those that were not but wecould compare centers with different levels ofinvolvement. Policy makers are likely to be par-ticularly interested in the comparison betweenHVHR centers and HVLR centers to assess thepotential impact of low managed care revenue onfinancial and clinical performance.
Center characteristics
The center characteristics examined includedthose related to patients, providers, services, andfinancial performance. Most of the measureswere directly available from the UDS. The finan-cial measures of stability, efficiency, and produc-tivity were created based on industry standards,prior research, and our experience (Feldman,Dietz, & Brooks, 1978; Mullner, 1990; Mullner,Rydman, Whiteis, & Rich, 1989; Rosenblatt &Moscovice, 1982; Shi et al., 1994; Walleck &Kretz, 1981).
The variables representing “self-sufficiency,”grant revenue, service revenue, and net revenuewere used to measure financial stability. Self-sufficiency, expressed as a percentage, was in-terpreted as an estimate of a program’s subsidygap—the difference between what a program canpay for its health care, whether through insur-ance (including both public and private) or pa-tients themselves, and what it costs for the pro-gram to provide acceptable health care (HealthServices Research Center, 1983). Programs withself-sufficiency ratios less than 1 required fed-eral and other grants to cover their costs, gen-erally because they served a large proportion ofuninsured patients. This measure was based on asimilar ratio developed by Feldman, Dietz, andBrooks (1978) and modified by others studyingprimary care projects (Rosenblatt & Moscovice,1978; Rosenblatt & Moscovice, 1982; Wallack& Kretz, 1981). Grant revenue was the per-centage of total revenue that came from publicsources (e.g., federal, state, or local) and private

P1: fgiAspen Pub./JACM AS026-01 November 13, 1999 17:52 Char Count= 0
6 JOURNAL OF AMBULATORY CARE MANAGEMENT/JANUARY 2000
sources (e.g., the Robert Wood Johnson andKellogg Foundations) as subsidies for services.Service revenue was the percentage of total rev-enue that came from direct payments for services,either by patients themselves or through third-party payers. Net revenue was used to reflectthe program’s financial status (Hadley, Mullner,& Feder, 1982; Kilstein, Sanders, & Schieber,1980).
Efficiency was measured by average programcosts, defined as the total program costs dividedby the total number of medical encounters orvisits (Health Services Research Center, 1983).Average cost per encounter has been used asa measure of efficiency related to ambulatorycare as well as other health care settings (Frech& Ginsburg, 1974; Golladay, Manser, & Smith,1974; Rosenblatt & Moscovice, 1978). Averagepersonnel costs were also included to measure theaverage costs of employing medical and supportstaff, including physicians, midlevel practition-ers (MLPs), nurses, administrators, and others.Average medical costs were the average costsof physicians, and average administrative costswere the average costs of administrators.
Provider productivity was measured by thenumber of encounters or visits per MD or MLP(midlevel practitioner). CHCs are staffed by pri-mary care physicians (e.g., general and familypractitioners, internists, and pediatricians) andMLPs (e.g., physician assistants [PAs], nursepractitioners [NPs], and certified nurse mid-wives) (Samuels & Shi, 1992). CHCs request-ing federal funds authorized by community ormigrant health center programs were formerlyrequired to maintain a minimum number of pa-tient encounters per provider as a condition ofapproval for funding (Health Services ResearchCenter, 1983). Since the measure does not ac-count for patient case-mix or outcome, produc-tivity is currently one of several variables consid-ered in funding adjustment but is not used as anexplicit requirement. Appendix A provides defi-nitions and descriptive statistics for the variablesused in the analyses.
Correlates of CHCs’ involvementin managed care
Organizations are now viewed, not as closedsystems operating autonomously within fixedboundaries, but as open systems operating inclose association with the external environment(Hannan & Freeman, 1977; Scott 1987). Theopen system perspective emphasizes the impor-tance of environment and demonstrates how itexerts its influence. Organizations are seen to betransacting with other elements of their environ-ment to acquire needed resources and thus areoften subject to some form of external control.Consequently, to understand organizational ac-tions, it is necessary to take into account an orga-nization’s external environment and the extent towhich the organization depends on it for criticalresources.
Guided by the open system perspective andby research on the determinants of health ser-vices organizations’ strategic orientation (Ginn& Young 1992), we conceptualize CHCs’involvement in managed care as influenced byboth external environmental and internal organi-zational characteristics. As regards external de-terminants, following Porter (1980), we treatmarket structure and general economic condi-tions as factors that influence an organization’schoice of strategy. The involvement by states inmanaged care for their Medicaid population alsoprovides an impetus for CHCs to get involved inmanaged care. CHCs, founded in the 1960s asanti-mainstream providers of health care, havebeen interacting with their environment for sometime to maximize revenue streams; they mustnow interact even more comprehensively lestthey lose Medicaid patients.
Under current law, a state must obtain a waiverfrom the U.S. Department of Health and HumanServices if it wants to require Medicaid bene-ficiaries to enroll in a managed care program.Absent a waiver, enrollment must be the vol-untary choice of the beneficiary. Although boththe freedom-of-choice waiver (1915b) and the

P1: fgiAspen Pub./JACM AS026-01 November 13, 1999 17:52 Char Count= 0
Managed Care and Community Health Centers 7
research and demonstration waiver (1115) maybe used by states, we choose to use a state’s Sec-tion 1115 waiver status as a measure of exter-nal market forces, because demonstration waiverauthority permits states to try out a far greaterrange of policies than would otherwise be per-missible in ordinary freedom-of-choice waiverprograms. Specifically, CHCs situated in statesthat received approval for and implemented Sec-tion 1115 waiver programs during or before 1996(when UDS data were collected) were expectedto be more likely to get involved in managedcare than CHCs in states that did not imple-ment the Section 1115 waiver. The states thatimplemented the Section 1115 waiver duringor before 1996 are Arizona, Delaware, Hawaii,Minnesota, Ohio, Oklahoma, Oregon, RhodeIsland, Tennessee, and Vermont.
With respect to economic factors, externalfunding sources (e.g., grant funding) and payermix could influence choice of strategy (Ginn &Young, 1992). Thus, CHCs receiving less fund-ing from grants may have to reduce their ser-vices to the uninsured. CHCs with relatively largeMedicaid revenues are expected to be more mo-tivated to get involved in Medicaid managed careto retain and expand their patient base. How-ever, it is also possible that CHCs with fewMedicaid patients may get involved in Medi-caid managed care to attract more Medicaid en-rollees. In addition, population density, as mea-sured by rural versus urban location, is expectedto have an important impact on the feasibility ofmanaged care (Kronick, Goodman, Wennberg,and Wagner, 1993). Managed care has achievedinsignificant penetration in rural areas not onlybecause these areas have relatively sparse pop-ulations (Kronick et al., 1993; Wellever &Deneen, 1994) but because rural providers aresuspicious of managed care, an urban-based phe-nomena (Kuder & Colebaugh, 1996).
As for organizational determinants, the own-ership, size, and case-mix within an organizationare viewed as factors associated with choice ofstrategy (Bigelow & Mahon, 1989; Gray, 1986;
Shortell, Morrison, & Friedman, 1990; Zajac &Shortell, 1989). Since all CHCs are not-for-profitor public agencies, we did not include ownershipin the analysis. Size is important, because it isrelated to the organization’s capacity to providemore services or diversify into other areas to uti-lize slack resources (Shortell, Morrison, Hughes,Friedman, and Vitek, 1987). Larger CHCs aremore likely to be involved in managed care. Weused total CHC staff, including providers of alltypes and administrative staff, to represent size.We chose to use “inputs” rather than “outputs”(i.e., patient volume), because inputs best rep-resent the capacity for services, and empiricalresults indicate patient volume is a function ofstaff availability. The level of staffing dictateshow many patients CHCs can see and the extentof the outreach work. The current need amongunderserved populations is significantly greaterthan the supply of professionals at CHCs. Sincelarger centers are in urban areas, where managedcare hits first, we controlled for location (rural orurban) in the analysis. The lack of case-mix mea-sures in the UDS limited our choice to the payer-mix variable only (i.e., proportion of Medicaidpatients).
Analysis
In examining the relationship between CHCs’involvement in managed care and various cen-ter characteristics, we used chi-squares for cate-gorical measures and ANOVA for interval-ratiomeasures. Post hoc means tests (Scheffe F)were performed on significant ANOVA results.To identify factors significantly associated withCHCs’ involvement in managed care, we per-formed logistic regression analysis, with involve-ment in managed care as the dependent measure(coded 1 if yes and 0 if no) and state Section1115 waiver status, percentage of revenue fromgrant funding, center size (measured by total cen-ter staff ), rural/urban location, and Medicaid pa-tients as a proportion of total users as indepen-dent measures. Additional analyses were alsoconducted, including the performance of a Tobit

P1: fgiAspen Pub./JACM AS026-01 November 13, 1999 17:52 Char Count= 0
8 JOURNAL OF AMBULATORY CARE MANAGEMENT/JANUARY 2000
Table 1. Patient characteristics
Managed care status
High volume, High volume, Low volume,high revenue low revenue low revenue Non-managed-care
(n = 178) (n = 91) (n = 36) (n = 373)
Total users∗∗ 15,531.7 12,034.9 15,258.0 9,518.2
Users under age 1 4.0% 4.2% 4.0% 3.4%Users aged 1–14∗∗ 29.4% 27.2% 28.2% 25.2%Users aged 15–64∗∗ 60.0% 60.3% 59.4% 63.1%Users aged 65+∗∗ 6.6% 8.4% 8.3% 8.4%
White∗∗ 36.4% 51.6% 50.9% 45.7%Black 33.3% 26.8% 26.1% 35.2%Hispanic (all races)∗ 36.7% 25.3% 30.0% 27.0%Asian/Pacific Islander 8.2% 6.4% 1.4% 3.8%American Indian 3.7% 3.5% 1.1% 3.8%
100% and below poverty line∗∗ 60.2% 49.7% 52.3% 53.3%101–150% of poverty line∗ 10.2% 13.6% 12.1% 10.8%151–200% of poverty line∗∗ 5.9% 7.3% 5.6% 4.8%Over 200% of poverty line∗∗ 10.5% 16.2% 20.8% 15.1%Homeless∗∗ 3.2% 2.5% 7.0% 14.6%
Uninsured∗∗ 34.4% 38.4% 34.9% 47.3%Medicaid∗∗ 35.5% 28.4% 32.3% 25.7%Medicare∗∗ 6.5% 9.0% 9.7% 9.6%Other public insurance∗∗ 4.9% 5.4% 5.3% 2.4%Private insurance∗ 18.8% 18.9% 18.4% 15.0%
Note:Differences among managed care status categories were evaluated by chi-square test for categorical variables and one-wayanalysis of variance for continuous variables.∗P < .05.∗∗P < .01.
model with different levels of involvement inmanaged care as a dependent measure and severalOLS multiple regressions with proportion of rev-enue and users from managed care as dependentvariables. These analyses yielded similar resultsand thus are not presented.
Results
Managed care status and patientcharacteristics
Table 1 shows the distribution of patients inCHCs arranged by level of involvement in man-aged care. Measured by total users, centers in-
volved in managed care to some degree are signif-icantly larger, averaging 12,035 to 15,532 usersannually per center, compared with 9,518 users ina non-managed-care center. There are no signifi-cant differences between centers having differentlevels of managed care involvement.
Regarding patient age, there are proportionallymore elderly patients and fewer pediatric patientsin non-managed-care centers than HVHR centers(8.4% vs. 6.6% for patients 65 and older, 25.2%vs. 29.4% for patients 1–14;p < .05). The resultis largely due to the fact that there are proportion-ally more elderly patients (65 and older) in ruralcenters (10%) than in urban centers (5%). The

P1: fgiAspen Pub./JACM AS026-01 November 13, 1999 17:52 Char Count= 0
Managed Care and Community Health Centers 9
observed differences across managed care cen-ters are not statistically significant.
HVHR centers lead all CHCs in the proportionof patients of Hispanic origin (36.7% vs. 27% fornon-managed-care centers,p < .05) and havethe lowest proportion of white patients (36.4%vs. 51.6% for HVLR centers and 45.7% for non-managed-care centers,p < .05). Although ruralcenters have more white (59.2% vs. 28.0%) andHispanic patients (33.1% vs. 26.8%) than urbancenters, which have more black patients (40.0%vs. 24.6%), there is no significant difference inthe proportion of black patients between man-aged care and non-managed-care centers
HVHR centers have proportionally more pa-tients who are at or below the poverty linethan other centers (60.2% vs. 53.3% for non-managed-care centers and 51.6% for HVLR cen-ters, p < .05). The result is again influencedby patient distribution in rural and urban centers,since urban centers have proportionally more pa-tients who are at or below the poverty line thanrural centers (65.5% vs. 45.2%). However, non-managed-care centers have proportionally morehomeless users (14.6% vs. 2.5–5% for managedcare centers,p < .05). This may be becausehomeless users are less likely to be insured.
In terms of insurance status, there are signifi-cantly more uninsured patients in non-managed-care centers than managed care centers (47.3%vs. 34.4–38.4%,p < .05). Centers involved inmanaged care have proportionally more Med-icaid and privately insured patients than thosethat are not (28.4–5.5% vs. 25.7% for Medi-caid, 18.4–18.9% vs. 15% for private insurance;p < .05). Among managed care centers, there isa significant difference in Medicaid patients be-tween HVHR centers and HVLR centers (35.5%vs. 28.4%,p < .05).
Managed care status and providercharacteristics
Table 2 displays the provider characteristicsfor CHCs arranged by level of involvement inmanaged care. Whether measured by total physi-cians, their patient encounters, other medical and
dental professionals and their patient encounters,or total administrative staff, managed care centersare significantly larger, averaging 75.1–101 totalstaff, compared with 48.6 for non-managed-carecenters. Among managed care centers, HVHRcenters have significantly more staff, both medi-cal and administrative, than other centers. How-ever, the numbers of enabling services pro-fessionals (including case managers, educationspecialists, outreach workers, and transportationstaff) are comparable among managed care cen-ters (12.6–13.2 per center) although exceedingthose in non-managed-care centers (7.2). Sincerural centers are largely uninvolved in managedcare, this finding reflects a rural-urban differ-ence in funding history: enabling services aremore likely to be funded in urban centers thanrural ones, where a “leaner” model of care ispracticed.
When measured by the number of patientsseen by physicians, NPs, and PAs, no statisti-cally significant differences are found betweenmanaged care and non-managed-care centers oracross managed care centers. The reported differ-ences in means reflect a small group of outliers.Dentists in non-managed-care centers are signif-icantly more productive than those in managedcare centers, seeing an average of 1,664–2,008more patients annually (p < .05).
Managed care status and servicesprovided
There are few significant differences in the ser-vices offered by CHCs based on involvement inmanaged care. Most centers provide an array ofprimary care, obstetrical and prenatal care, den-tal care, and other professional services. Table 3shows the service components of the varioustypes of centers. In all cases, managed care cen-ters are more likely to provide special medicaland enabling services than non-managed-carecenters. This may be explained by size. Sincemanaged care centers are larger, they are morelikely to provide a complete array of services thannon-managed-care centers.

P1: fgiAspen Pub./JACM AS026-01 November 13, 1999 17:52 Char Count= 0
10 JOURNAL OF AMBULATORY CARE MANAGEMENT/JANUARY 2000
Table 2. Provider characteristics
Managed care status
High volume, High volume, Low volume,high revenue low revenue low revenue Non-managed-care
(n = 178) (n = 91) (n = 36) (n = 373)
Providers and staffFamily practitioners∗∗ 3.4 3.0 3.6 1.9General practitioners∗∗ 2.6 1.0 1.1 1.2Internists∗∗ 2.6 2.3 2.4 1.6OB/GYN 1.3 1.0 1.3 0.9Pediatricians∗∗ 2.8 2.1 2.5 1.7Psychiatrists 0.5 0.4 0.5 0.5Other specialist physicians∗ 0.8 0.6 0.3 0.4Total physicians∗∗ 8.7 6.5 7.3 4.2Nurse practitioners/physician 4.0 2.7 3.9 2.5
assistants∗∗
Nurses∗∗ 11.7 8.4 9.3 6.2Total medical care services 38.7 26.4 32.5 18.3
personnel∗∗
Dentists∗∗ 2.9 2.1 2.2 1.8Total dental service personnel∗∗ 8.5 6.3 6.3 5.0Mental health specialists∗ 3.6 2.7 2.3 1.9Substance abuse specialists 3.3 3.5 2.3 2.0Pharmacy personnel∗∗ 4.0 2.7 3.1 2.5Case managers∗ 4.5 3.3 5.4 3.2Education specialists∗ 3.9 3.2 4.8 2.4Outreach workers∗ 3.5 2.3 2.1 2.3Transportation staff 2.5 2.3 1.2 1.6Total enabling services∗∗ 13.2 12.6 12.8 7.2Administration staff∗∗ 18.5 14.9 15.5 9.3Total staff∗∗ 101.0 75.1 85.5 48.6
EncountersTotal physician encounters∗∗ 33,933.7 26,609.3 29,486.4 17,207.2Family practitioner encounters∗∗ 13,171.9 12,810.2 14,359.0 8,145.3General practitioner encounters∗∗ 12,887.7 3,647.9 6,059.8 4,579.9Internist encounters∗∗ 9,597.9 9,926.4 8,666.6 6,276.6OB/GYN encounters∗∗ 4,642.5 3,775.9 6,771.5 2,996.8Pediatrician encounters∗∗ 10,901.4 8,287.9 9,260.9 6,859.0Psychiatrist encounters 1,130.2 1,178.5 1,287.9 999.1Other specialist physician 3,599.6 1,576.1 1,313.4 1,607.6
encounters
continues( )
NP/PA encounters∗∗ 10,270.7 7,335.5 11,607.4 6,922.0Total medical care services 51,387.9 36,790.0 46,668.5 26,974.0
personnel encounters∗∗
Dentist encounters∗∗ 7,171.0 5,394.5 5,347.9 4,334.5Total dental encounters∗∗ 8,146.6 6,021.0 6,182.2 4,969.3

P1: fgiAspen Pub./JACM AS026-01 November 13, 1999 17:52 Char Count= 0
Managed Care and Community Health Centers11
Table 2.
Managed care status
High volume, High volume, Low volume,high revenue low revenue low revenue Non-managed-care
(n = 178) (n = 91) (n = 36) (n = 373)
ProductivityTotal physician productivity 3,889.5 3,835.2 6,128.7 4,360.1NP/PA productivity 2,625.0 2,695.7 2,912.4 2,798.5Total medical care services 1,425.1 1,492.5 1,603.6 1,573.3
personnel productivity∗
Dentist productivity∗ 2,488.9 2,531.6 2,832.7 4,496.9
Note: Differences among managed care status categories were evaluated by chi-square test for categorical variables and one-wayanalysis of variance for continuous variables.∗ P < .05.∗∗ P < .01.
(continued )
Managed care status and financialcharacteristics
Table 4 compares financial indicators amongcommunity health centers. Managed care cen-ters are more likely to receive a variety of fed-eral grants, including CHC Comprehensive Peri-natal Care Program, Ryan White, and otherBPHC grants, than non-managed-care centers,which might receive only CHC funding. How-ever, the total grant revenue as a proportion oftotal revenue is significantly less in managed carethan non-managed-care centers. Instead, man-aged care centers have a larger share of theirrevenue generated from services (43.9–52.1%vs. 34.3%,p < .01) and thus they have higher“self-sufficiency” ratios than non-managed-carecenters (44–47.8% vs. 34.7%,p < .01). Amongmanaged care centers, HVHR centers have sig-nificantly larger service revenue than HVLR cen-ters (52.1% vs. 43.9%,p < .05).
Managed care centers incur higher coststhan non-managed-care centers. The average en-counter cost ranges from $85.27 to $95.41 formanaged care centers, compared with $82.90 fornon-managed-care centers (p < .01). The aver-age personnel and medical costs are highest inLVLR centers. However, these cost differentials
are likely related to higher costs in urban areas.More managed care centers have deficits in netrevenue in excess of $100,000 (43.2% of HVHRcenters, 37.4% of HVLR centers, 33.4% of LVLRcenters, and 24.9% in non-managed-care cen-ters). Net revenue as a percentage of total revenueis more likely to be in deficit in managed care cen-ters than non-managed-care centers (−10.20%in HVHR centers,−1.63% in HVLR centers,−0.81% in LVLR centers, and 1.34% in non-managed-care centers). Thus, managed care cen-ters are in a more vulnerable financial situation.
Factors associated with CHCs’ involvementin managed care
Table 5 displays the results of a logistic regres-sion model identifying the significant correlatesassociated with CHCs’ involvement in man-aged care. As can be seen, Medicaid Section1115 waiver status, a measure of external mar-ket forces, is highly significant: centers situatedin waiver states are more than four times morelikely to be involved in managed care than cen-ters situated in states without the waiver. Withrespect to economic factors, external subsidygrant funding as a percentage of total revenue isinversely related to involvement in managed care.

P1: fgiAspen Pub./JACM AS026-01 November 13, 1999 17:52 Char Count= 0
12 JOURNAL OF AMBULATORY CARE MANAGEMENT/JANUARY 2000
Table 3. Services directly provided
Managed care status
High volume, High volume, Low volume,high revenue low revenue low revenue Non-managed-care
(n = 178) (n = 91) (n = 36) (n = 373)
Primary medical care servicesUrgent medical care∗ 82.6 85.7 91.7 75.624-hour coverage∗∗ 93.3 96.7 91.7 79.4Family planning∗∗ 98.9 100.0 94.4 91.4HIV testing∗∗ 92.7 85.7 83.3 81.8Following hospitalized 87.1 86.8 88.9 75.3
patients∗∗
OB/GYN careObstetrical care∗∗ 97.2 94.5 94.4 87.7Prenatal care∗∗ 88.2 87.9 80.6 68.4Antepartum fetal 66.9 61.5 55.6 46.1
assessment∗∗
Ultrasound∗∗ 41.6 33.0 30.6 21.7Genetic counseling 25.3 17.6 13.9 15.8
and testing∗
Labor and delivery 50.0 50.5 52.8 30.8professional care∗∗
Postpartum care∗∗ 86.0 84.6 77.8 65.7
Dental care servicesDental care—preventive∗∗ 75.3 72.5 72.2 62.5Dental care—restorative∗∗ 69.1 52.7 63.9 48.5Dental care—emergency∗ 66.3 56.0 66.7 52.8
Mental health/substance abuse services24-hour crisis intervention/ 24.7 16.5 11.1 11.3
counseling∗∗
Other mental health services∗ 32.0 24.2 19.4 21.4Other substance abuse services∗ 33.7 28.6 13.9 23.1
Other professional servicesHearing screening∗∗ 86.5 92.3 94.2 75.6Nutrition services other 82.6 81.3 86.1 71.3
than WIC∗∗
Pharmacy∗ 68.0 63.7 80.6 60.3WIC services∗∗ 53.9 40.7 38.9 35.1
Enabling servicesDischarge planning∗∗ 52.8 49.5 52.8 39.1Employment/educational 25.3 23.1 2.8 20.6
counseling∗
Interpretation/translation 78.7 76.9 72.2 66.5services∗
Note:Differences among managed care status categories were evaluated by chi-square test for categorical variables and one-wayanalysis of variance for continuous variables.∗P < .05.∗∗P < .01.

P1: fgiAspen Pub./JACM AS026-01 November 13, 1999 17:52 Char Count= 0
Managed Care and Community Health Centers13
Table 4. Financial characteristics
Managed care status
High volume, High volume, Low volume,high revenue low revenue low revenue Non-managed-care
(n = 178) (n = 91) (n = 36) (n = 373)
Bureau of Primary HealthCare (BPHC) funding
Community Health Center 96.6% 100.0% 94.4% 80.7%(Section 330)∗∗
Comprehensive Perinatal 41.6% 41.8% 41.7% 21.2%Care Program∗∗
Ryan White Title IIIb HIV 18.0% 13.2% 16.7% 8.6%Early Intervention∗∗
Other BPHC Resources∗∗ 9.0% 13.2% 5.6% 3.8%
Self-sufficiency∗∗ 47.8% 44.0% 47.1% 34.7%Grant revenue∗∗ 44.2% 44.4% 42.1% 54.1%Service revenue∗∗ 52.1% 43.9% 46.3% 34.3%
Net revenue∗∗
More than $500,000 10.7% 8.8% 5.6% 7.8%$100,000 to $500,000 18.5% 22.0% 36.1% 19.6%$0 to $99,999 18.0% 14.3% 11.1% 29.8%−$1 to−$99,999 9.6% 17.6% 13.9% 18.0%−$100,000 to−$500,000 21.9% 29.7% 16.7% 19.0%Less than−$500,000 21.3% 7.7% 16.7% 5.9%
Average encounter cost∗∗ $91.6 $95.4 $85.3 $82.9Average medical encounter cost∗ $56.5 $59.0 $53.3 $50.2Average enabling services cost $163.6 $136.9 $170.9 $157.4Average personnel cost∗ $59,761.9 $61,542.7 $80,919.1 $58,744.8Average medical cost∗∗ $72,389.5 $78,514.4 $95,627.5 $71,723.9Average administrative cost $100,411.1 $94,233.1 $120,284.5 $100,457.8
Note:Differences among managed care status categories were evaluated by chi-square test for categorical variables and one-wayanalysis of variance for continuous variables.∗P < .05.∗∗P < .01.
Centers that rely less on subsidy grants and moreon Medicaid are more likely to seek involvementin managed care. As for location, rural centers arenearly half as likely to get involved in managedcare as urban centers.
In terms of organizational determinants, thepercentage of users who are Medicaid recipi-ents is the most significant correlate of managedcare experience. A 10% or greater proportion ofMedicaid users is associated with 1.12 times the
odds of involvement in managed care. The sizeof the center, as measured by total center staff, isalso significantly associated with involvement inmanaged care.
DISCUSSION
CHCs are becoming increasingly involved inmanaged care. While it is premature to assess the

P1: fgiAspen Pub./JACM AS026-01 November 13, 1999 17:52 Char Count= 0
14 JOURNAL OF AMBULATORY CARE MANAGEMENT/JANUARY 2000
Table 5. Logistic regression: significant correlates associated with community health centers’ involvement inmanaged care (dependent measure: primary care [managed care= 1; non-managed-care= 0])
Variables B S.E. Wald P-value Odds Ratio
Constant .3168 .5425 .3409 .5593Medicaid 1115 waiver 1.4508 .2755 27.7336 .0000 4.2667Rural/urban (default) −.4677 .1940 5.8121 .0159 .6265Percentage of users who were 1.1003 .5665 3.7727 .0521 3.0050
medicaid membersPercentage of grant revenue −1.7604 .4509 15.2420 .0001 .1720Total center staff .0088 .0016 29.1182 .0000 1.0088
impact of managed care on CHCs given its rela-tively short history, policy makers must quicklyfind out what are the likely consequences of man-aged care. Timely knowledge of warning signsthat CHCs’ ability to fulfill their mission of pro-viding access to health care for medically under-served populations might be compromised canalert policy makers to the need for and suggesttypes of policy interventions. Our study com-pared CHCs with different levels of managed careinvolvement on a number of patient, provider,services, and financial characteristics. Althoughthe cross-sectional nature of the data and analy-sis does not allow us to establish causal relation-ships, these comparisons help identify the dif-ferences between and similarities of CHCs withdifferent levels of managed care involvement.Knowledge of these differences and similaritiescan help identify the likely impact of managedcare and enable us to design a more in-depthlongitudinal analysis in order to establish causalrelationships.
Potential influences of managed care
There are indications that centers involved inmanaged care have more diversified sources ofrevenue and depend less on grant funding. Theyare more likely to obtain a variety of BPHC fund-ing than non-managed-care centers, which mightreceive only CHC funding.
However, this does not suggest that CHCs’reliance on grant support is reduced as a result
of managed care. CHCs would still need sig-nificant grant support to continue to serve thosewho are uninsured or medically indigent. Indeed,our findings indicate that CHCs involved in man-aged care have served a significantly smaller pro-portion of uninsured patients (34.4–38.4%) andhomeless patients (2.5–7%) than CHCs not in-volved in managed care (47.3% and 14.6%, re-spectively). Although it is unclear whether in-volvement in managed careled to a reductionin services to the uninsured and homeless orwhether having a lower proportion of uninsuredand homeless and a higher proportion of insuredpatientsledto easier acceptance of managed care,it is certain that prepaid or capitation-based man-aged care does not reward cross-subsidization oruncompensated care (Dubay, Norton, & Moon,1995; Mann, Melnick, Bamezai, and Zwanziger,1995; Weissman, 1996). Greater and continuedinvolvement in managed care is expected to re-duce CHCs’ capacity to provide uncompensatedcare despite their willingness and stated missionto do so.
Consistent with a recent case study on CHCs’experience with prepaid managed care (GAO,1995), our study confirms the financial vulner-ability of centers participating in prepaid man-aged care. Managed care centers are more likelyto have deficits than non-managed-care centers(47.2% of the low-volume managed care centers,54.9% of the high-volume managed care cen-ters, and 42.8% of non-managed-care centers).

P1: fgiAspen Pub./JACM AS026-01 November 13, 1999 17:52 Char Count= 0
Managed Care and Community Health Centers15
Involvement in managed care is also positivelyassociated with both the amount and propor-tion of the deficits. The cash flow problem iden-tified by case studies of CHCs may well ac-count for the deficits (Finkler, Knickman, &Hanson, 1994; GAO, 1995). Another poten-tial cause is the higher costs incurred by man-aged care centers. The average encounter costis $2.37–$12.51 higher in managed care centersthan in non-managed-care centers. It is likely thatpart of the additional costs is related to managedcare involvement, for such involvement requiresthe development of new organizational skills andthe enhancement of the management informa-tion system, the financial management system,and patient management techniques (Abramset al., 1995; Buchanan, Lindsey, Leibowitz, andDavies, 1992). New systems and administrativedemands generated by managed care will likelycost, rather than save, money, at least in the shortrun (Gold, Sparer, & Chu 1996). Under managedcare, centers may be required to pay for a broaderrange of services. Although the magnitude of thedeficit may also be related to the size of the facil-ity, and deficits as a proportion of total revenueare relatively small, continued financial strain asa result of reduced payment from Medicaid man-aged care and higher operating costs heightenconcern about the ability of CHCs to sustain theircommitment to providing uncompensated care.
Our study demonstrates that dental staff inmanaged care centers are less productive thanthose in non-managed-care centers. Providers seefewer patients in managed care centers than innon-managed-care centers. One explanation forthis is that managed care provides an incentiveto reduce visits, since additional visits wouldnot lead to additional revenue (Rodwin, 1995;Schroeder, Clarke, & Webster, 1985). Anotherpossible explanation is that providers in man-aged care centers have to spend more hours onactivities unrelated to patient care. A recent na-tional survey of medical directors at CHCs in-dicates that medical directors at urban centers,where managed care involvement is more preva-lent, spent significantly less hours on patient care
than those at rural centers, which have limitedmanaged care involvement (20.31 vs. 23.91 hoursper week) (Shi, Samuels, Cochran, Glover, andSingh, 1998).
The concern that CHCs involved in managedcare would not continue to provide patients withnonreimbursable services under managed care,such as enabling and culturally sensitive services,is not supported by our findings. Regardless ofmanaged care involvement, CHCs have so farmaintained their commitment to the provision ofthese services. However, whether they can sus-tain their efforts remains to be seen.
Among managed care centers, we are inter-ested in the comparison between HVHR andHVLR centers—in particular, in how low rev-enue has affected the performance of the HVLRcenters. HVHR centers draw a significantlyhigher portion of their revenue from services thando HVLR centers (52.1% vs. 43.9%). HVHRcenters have proportionally more Medicaid pa-tients and fewer uninsured patients than HVLRcenters (35.5% vs. 28.4% and 34.4% vs. 38.4%,respectively). The medical encounter cost is sig-nificantly higher in HVLR centers than in HVHRcenters ($95.41 vs. $91.65). The average per-sonnel and medical costs are higher in HVLRthan HVHR centers. A significant proportion ofboth HVLR and HVHR centers have net revenuedeficits (55.0% vs. 52.8%).
Correlates of CHCs’ involvement inmanaged care
In addition to examining the influence of man-aged care on CHCs, the study also identified fac-tors significantly associated with CHCs’ involve-ment in managed care. The results indicate thatboth external and internal factors contributed toCHCs’ involvement in managed care. Externally,the most dominant factor is Medicaid Section1115 waiver status. When states mandate thattheir Medicaid patients enroll in managed care,CHCs have to get involved in managed care orrisk losing the Medicaid patients and the associ-ated revenue. External funding source is critical:centers with proportionally less grant funding are

P1: fgiAspen Pub./JACM AS026-01 November 13, 1999 17:52 Char Count= 0
16 JOURNAL OF AMBULATORY CARE MANAGEMENT/JANUARY 2000
more likely to get involved in managed care. Ru-ral location is also significantly but inversely re-lated to involvement in managed care. Many ob-served patient differences between managed careand non-managed-care centers can be explainedby location-related characteristics. Rural centershave proportionally more elderly, white, and His-panic patients, whereas urban centers have pro-portionally more black patients and patients whoare at or below the poverty line. These find-ings are consistent with the open system model,which emphasizes the resource dependency oforganizations on their environment (Hannan &Freeman, 1977; Scott, 1987).
The most dominant internal factor is the pro-portion of a center’s Medicaid users. Centers withproportionally more Medicaid users are morelikely to get involved in managed care, perhapsout of a strategic need to retain or expand thepatient and revenue base. The size of the cen-ter also matters. Whether measured by providers,administrators, services, revenues, users, or en-counters, managed care centers are significantlylarger, averaging 75.1–101 total staff per center,compared with 48.6 in non-managed-care cen-ters. Indeed, the logistic regression model indi-cates that size is a significant predictor of CHCs’involvement in managed care. Larger CHCs havelarger service capacity and are more likely to beadversely affected by slack resources. Gettinginvolved in managed care may well be a strat-egy chosen by centers to utilize this capacity oravoid the prospect of underutilizing this capacity.This finding is consistent with strategic decisionmaking by other health services organizations(Bigelow & Mahon, 1989; Ginn & Young, 1992).
• • •
This study is limited by the data collected an-nually from the centers and by the availabilityof secondary data. For example, CHCs’ involve-ment in managed care is likely to be influenced byother external and internal factors, such as com-munity characteristics, availability of managedcare, administrator characteristics, the influence
of the board, and the culture of the center. Like-wise, in addition to managed care, CHCs’ out-comes are also influenced by other factors, suchas community characteristics (e.g., populationsserved), management characteristics, and prac-tice characteristics. Future attention to these othervariables could help inform the analysis.
Several terms used in the analyses are incom-plete or imprecise. For example, we are unable tocharacterize the types of managed care arrange-ment a center is involved in (e.g., an HMO, a PPO,or some other arrangement). Although from ear-lier case studies we know that four major modelsof CHC participation in the prepaid environmenthave emerged, we do not know which model isadopted by a particular center. Failure to differ-entiate the managed care models will make theassessment of managed care impact incomplete.We use productivity and average cost indicatorsas measures of a center’s performance. But thesemeasures are imprecise and can be explainedby other factors (e.g., case mix or outcomes).Moreover, centers that fulfill their mission byserving the uninsured are by definition less self-sufficient. Centers with lower productivity maybe doing a better job by either taking more timewith patients or doing a better preventive work sothat patients visit them less frequently. In eithercase, lower productivity actually indicates betterperformance than higher productivity. Similarly,centers with higher average costs might producehigher quality services. Future studies might fo-cus on more sensitive information from all or arepresentative sample of centers with differenttypes of managed care and different case mixes.
This study does enable us, nonetheless, tomake some important points. It suggests thatCHCs’ involvement in managed care is largelyin response to external market pressures—Medicaid managed care and the prospect of re-duced federal grant funding. However, involve-ment in managed care is associated with greaterfinancial vulnerability reflected in higher costsand net revenue deficits. With modest budgets,limited experience in dealing with managed care,and the mission to serve all regardless of ability

P1: fgiAspen Pub./JACM AS026-01 November 13, 1999 17:52 Char Count= 0
Managed Care and Community Health Centers17
to pay, CHCs that choose managed care partic-ipation face great challenges. Yet if CHCs areunable to preserve their paying Medicaid patient
base, they risk even greater losses in revenue andconsequently the capacity to extend care to theindigent.
REFERENCES
Abrams, R., Savela, T., Trinity, M.T., Falik, M., Tutunjian,B., & Ulmer, C. (1995). Performance of communityhealth centers under managed care. Journal of Am-bulatory Care Management, 18(3), 77–88.
Alpha Center. (1995, Jan.-Feb.). More for less?: In-creasing insurance coverage through Medicaidwaiver programs. State Initiatives in Health Care Re-form, 10, 1–3.
Bigelow, B., & Mahon, J. (1989). Strategic behavior ofhospitals: A framework for analysis. Medical CareReview, 46, 295–311.
Buchanan, J.L., Lindsey, P.A., Leibowitz, A., & Davies,A.R. (1992). HMOs for Medicaid: The road to finan-cial independence is often poorly paved. Journal ofHealth Politics, Policy, and Law, 17(1), 71–96.
Bureau of Primary Health Care. (1995). User manual:Uniform data system. Bethesda, MD: Author.
Dubay, L.C., Norton, S.A., & Moon, M. (1995). Med-icaid expansions for pregnant women and infants:Easing hospitals’ uncompensated care burdens? In-quiry, 32, 332–344.
Employee Benefits Research Institute. (1995). Sourcesof health insurance and characteristics of the unin-sured: Analysis of the March 1994 current populationsurvey (EBRI Special Report SR-28, Issue Brief No.158). Washington, DC: Author.
Ermann, D., & Richmond, J. (1994). Managed care ar-rangements: Barriers to cost savings potential. Med-ical Care Review, 51, 125–148.
Feldman, R., Dietz, D., & Brooks, E.F. (1978). The fi-nancial viability of rural primary health care centers.American Journal of Public Health, 68, 981–988.
Feldman, R., Kralewski, J., & Qowd, B. (1989). Healthmaintenance organization: The beginning or theend? Health Services Research, 24, 191–211.
Finkler, S.A., Knickman, J.R., & Hanson, K.L. (1994).Improving the financial viability of primary care healthcenters. Hospitals and Health Services Administra-tion, 39, 117–131.
Frech, H.E., & Ginsburg, P.B. (1974). Optimal scale inmedical practice: A survival analysis. Journal of Busi-ness, 47(1): 23–36.
Ginn, G.O., & Young, G.J. (1992). Organizationaland environmental determinants of hospital strat-egy. Hospital and Health Services Administration, 37,291–302.
Gold, M.R. (1991, Winter). HMOs and managed care.Health Affairs, 189–206.
Gold, M., Sparer, M., & Chu, K. (1996, Fall). Medicaidmanaged care: Lessons from five states. Health Af-fairs, 153–166.
Golladay, F.L., Manser, M.E., & Smith, K.R. (1974).Some economics in the delivery of medical care:A mixed integer programming analysis of efficientmanpower utilization. Journal of Human Behavior,9(1), 50–62.
Gray, B. (Ed.). (1986). For-profit enterprise in healthcare. Washington, DC: National Academy Press.
Hadley, J., Mullner, R., & Feder, J. (1982). The finan-cially distressed hospital. New England Journal ofMedicine, 307, 1283–1287.
Hannan, M.T., & Freeman, J. (1977). The populationecology of organizations. American Journal of Soci-ology, 82, 929–964.
Health Care Financing Administration, Office of Man-aged Care. (1996). Medicaid managed care en-rollment report. Washington, DC: U.S. GovernmentPrinting Office.
Health Services Research Center, University of NorthCarolina. (1983). National evaluation of rural primaryhealth care programs (Report to the Robert WoodJohnson Foundation). Chapel Hill, NC: University ofNorth Carolina.
Henderson, T., & Markus, A.R. 1996. Medicaid man-aged care: How do community health centers fit?Health Care Financing Review, 17, 135–142.
Hoy, E.W., Curtis, R.E., & Rice, T. (1991, Winter).Change and growth in managed care. Health Affairs,18–36.
Iglehart, J.K. (1992). The American health care system:Managed care. New England Journal of Medicine,331, 63–67.
Iglehart, J.K. (1994). The struggle between managedcare and fee-for-service practice. New England Jour-nal of Medicine, 327, 742–747.
Kilstein, S.M., Sanders, C.R., & Schieber, G.J. (1980).An analysis of hospital financial distress. Journal ofContemporary Business, 9(4), 55–66.
Kronick, R., Goodman, D.C., Wennberg, J., & Wagner,E. (1993). The marketplace in health care reform: Thedemographic limitations of managed competition.New England Journal of Medicine, 328, 148–152.

P1: fgiAspen Pub./JACM AS026-01 November 13, 1999 17:52 Char Count= 0
18 JOURNAL OF AMBULATORY CARE MANAGEMENT/JANUARY 2000
Kuder, J.M., & Colebaugh, J.B. (1996). A provisionalframework for the economic analysis of managedcare development in rural areas (New York RuralHealth Research Center Working Paper No. 12). Buf-falo, NY: State University of New York at Buffalo, De-partment of Family Medicine.
Lewin VHI and MDS Associates. (1994). Communityhealth centers’ performance under managed care.Bethesda, MD: Health Resources and Services Ad-ministration, Bureau of Primary Health Care.
Lewis-Idema, D., Chu, R., Hughes, R., & Lefkowitz, B.(1998). FQHC: Harnessing the incentives of cost re-imbursement. Journal of Ambulatory Care Manage-ment, 21(2), 58–75.
Mann, J., Melnick, G., Bamezai, A., & Zwanziger, J.(1995, Spring). Uncompensated care: Hospitals’ re-sponses to fiscal pressures. Health Affairs, 263–270.
Mullner, R.M., Rydman, R.J., Whiteis, D.G., & Rich, R.F.(1989). Rural community hospitals and factors corre-lated with their risk of closing. Public Health Reports,104, 315–325.
Mullner, R.M. (1990). Rural hospital survival: An analy-sis of facilities and services correlated with risk of clo-sure. Hospital and Health Services Administration,35, 121–137.
Oliver, T.R. (1998). The collision of economics and pol-itics in Medicaid managed care: Reflections on thecourse of reform in Maryland. The Milbank Quarterly,76(1), 1–43.
Porter, M.E. (1980). Competitive strategy: Techniquesfor analyzing industries and competitors. New York:The Free Press.
Rodwin, M.A. (1995). Conflicts in managed care. NewEngland Journal of Medicine, 332, 604–607.
Rosenblatt, R.A., & Moscovice, I. (1978). The growthand evolution of rural primary care practice: The na-tional health service corps experience in the North-west. Medical Care, 16, 819–827.
Rosenblatt, R.A., & Moscovice, I. (1982). Rural healthcare. New York: Wiley.
Samuels, M.E., & Shi, L. (1992). Survey of communityand migrant health centers regarding utilization ofnurse practitioners, physicians assistants, and certi-fied nurse midwives. Kansas City, MO: National RuralHealth Association.
Schroeder, J.L., Clarke, J.T., & Webster, J.R. (1985).
Prepaid entitlements: A new challenge for physician-patient relationship. JAMA, 254, 3080–3082.
Scott, W.R. (1987).Organizations:Rational, natural, andopen systems. Englewood Cliffs, NJ: Prentice Hall.
Shi, L., Samuels, M.E., Konrad, T.R., Porter, C.Q.,Stoskopf, C.H., & Richter, D.L. (1994). Rural primarycare program survival: An analysis of financial vari-ables. Journal of Rural Health, 10, 173–182.
Shi, L., Samuels, M.E., Cochran, C., Glover, S., & Singh,D.A. (1998). Physician practice characteristics andsatisfaction: A rural-urban comparison of medical di-rectors at U.S. community and migrant health cen-ters. Journal of Rural Health.
Shortell, S.M., Morrison, E.M., & Friedman, B.S. (1990).Strategic choices for America’s hospitals: Managingchange in turbulent times. San Francisco: Jossey-Bass.
Shortell, S.M., Morrison, E.M., Hughes, S.L., Friedman,B.S., & Vitek, J.L. (1987). Diversification of the healthcare services: The effects of ownership, environ-ment, and strategy. In R.M. Scheffler & L.F. Rossiter(Eds.), Advances in Health Economics and HealthServices Research. Greenwich, CT: JAI Press.
U.S. Congress, Office of Technology Assessment.(1990). Health Care in Rural America, OTA-H-434.Washington, DC: U.S. Government Printing Office.
U.S. General Accounting Office. (1995). Communityhealth centers: Challenges in transitioning to prepaidmanaged care (GAO/HEHS Publication No. 95–138).Washington, DC: Author.
Walleck, S.S., & Kretz, S.E. (1981). Rural medicine: Ob-stacles and solutions for self-sufficiency. Lexington,MA: Lexington Books.
Weissman, J. (1996). Uncompensated hospital care:Will it be there if we need it? JAMA 276, 823–828.
Wellever, A., & Deneen, V. (1994). Managed health carereform and rural areas: Literature review and syn-thesis (AHCPR Rural Center Contract Report). Min-neapolis, MN: University of Minnesota.
Zajac, E.J., & Shortell, S.M. (1989). Changing genericstrategies: Likelihood, direction, and performanceimplications. Strategic Management Journal, 10,413–430.
Zarabozo, C., Taylor, C., & Hicks, J. (1996). Medicaremanaged care: Numbers and trends. Health CareFinancing Review, 17, 243–261.

P1: fgiAspen Pub./JACM AS026-01 November 13, 1999 17:52 Char Count= 0
Managed Care and Community Health Centers19
Table 1 Variables used in study analysis
Mean (stnd dev.)Variable name Definition Number (percentage)
Rural/urban status Community health centers designatedas rural or urban
Urban 315 (46.3%)Rural 366 (53.7%)
Service sites Number of service sites per 2.9 (2.1)community health center
Medicaid 1115 Community health centers located 83 (12.2%)waiver states in states that implemented
Medicaid 1115 waiverprogram by 1996
Patient characteristicsTotal users Total community health center 11,825.4 (11,360.4)users in
1996Users under age 1 Percentage of community health 3.7% (2.9%)center
users under age 1 in 1996Users aged 1–14 Percentage of community health 26.7% (9.7%)center
users between age 1 and age 14in 1996
Users aged 15–64 Percentage of community health center 61.7% (11.4%)users between age 15 and age 64 in 1996
Users aged 65+ Percentage of community health center 7.9% (6.1%)users aged 65 and older in 1996
White Community health center users who 44.5% (33.3%)are white and not Hispanic
Black Community health center users who are 33.0% (30.3%)black and not Hispanic
Hispanic Community health center users who 29.6% (32.4%)areHispanic, including all races
Asian/Pacific Islander Community health center users who are 5.4% (16.2%)Asian/Pacific Islanders
American Indian Community health center users who are 3.6% (9.6%)American Indians or Alaska Natives
100% and below poverty line Community health center users 54.6% (27.2%)whosefamily income is 100% of povertyline or below
101–150% of poverty line Community health center users whose 11.1 (9.7%)family income is 101–150%of poverty line
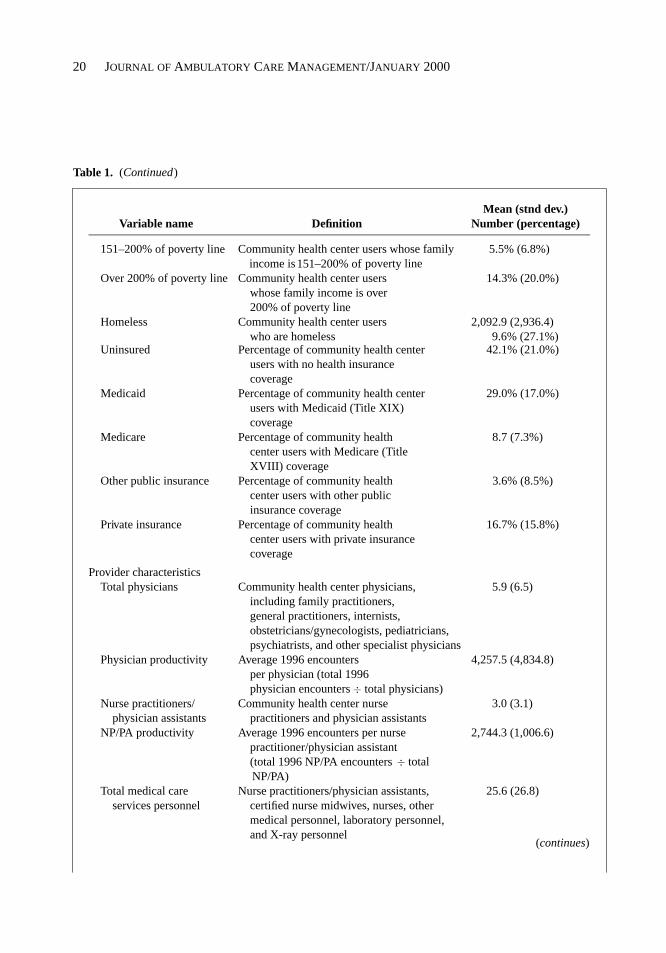
Appendix A
Definitions and Descriptive Statistics
(continues)
P1: fgiAspen Pub./JACM AS026-01 November 13, 1999 17:52 Char Count= 0
20 JOURNAL OF AMBULATORY CARE MANAGEMENT/JANUARY 2000
Table 1.
Mean (stnd dev.)Variable name Definition Number (percentage)
151–200% of poverty line Community health center users 5.5% (6.8%)whose familyincome is
Over 200% of poverty line Community health center users 14.3% (20.0%)whose family income is over200% of poverty line
Homeless Community health center users 2,092.9 (2,936.4)who are homeless 9.6% (27.1%)
Uninsured Percentage of community health center 42.1% (21.0%)users with no health insurancecoverage
Medicaid Percentage of community health center 29.0% (17.0%)users with Medicaid (Title XIX)coverage
Medicare Percentage of community health 8.7 (7.3%)center users with Medicare (TitleXVIII) coverage
Other public insurance Percentage of community health 3.6% (8.5%)center users with other publicinsurance coverage
Private insurance Percentage of community health 16.7% (15.8%)center users with private insurancecoverage
Provider characteristicsTotal physicians Community health center physicians, 5.9 (6.5)
including family practitioners,general practitioners, internists,obstetricians/gynecologists, pediatricians,psychiatrists, and other specialist physicians
Physician productivity Average 1996 encounters 4,257.5 (4,834.8)per physician (total 1996physician encounters ÷ total physicians)
Nurse practitioners/ Community health center nurse 3.0 (3.1)physician assistants practitioners and physician assistants
NP/PA productivity Average 1996 encounters per nurse 2,744.3 (1,006.6)practitioner/physician assistant(total 1996 NP/PA encounters ÷ totalNP/PA)
Total medical care Nurse practitioners/physician assistants, 25.6 (26.8)services personnel certified nurse midwives, nurses, other
medical personnel, laboratory personnel,and X-ray personnel
(continues)
(Continued)
151–200% of poverty line

P1: fgiAspen Pub./JACM AS026-01 November 13, 1999 17:52 Char Count= 0
Managed Care and Community Health Centers21
Table 1.
Mean (stnd dev.)Variable name Definition Number (percentage)
Total medical care Average 1996 encounters per total medical care 1,523.8 (597.2)productivity services personnel (total 1996 medical care
encounters ÷ total medical care servicespersonnel)
Dentists Community health center dentists 2.2 (2.0)Dentist productivity Average 1996 encounters per dentist (total 1996 3,508.6 (17,783.5)
dentist encounters ÷ total dentists)Total dental services Community health center dentists, dental 6.3 (6.0)
personnel hygienists, dental assistants, aides, andtechnicians
Total enabling services Community health center personnel 9.9 (16.5)performing enabling service activities,including case management, outreach,transportation, and other
Administration staff Community health center administration staff 12.8 (14.3)Total staff Total community health center staff, including 68.0 (69.5)
providers and administrative staff
Financial characteristics
Self-sufficiency Self-sufficiency ratio = total third-party 40.1% (20.0%)payments (patient collections +Medicaid + Medicare + other publicinsurance + other private insurance) ÷total calendar year costs
Grant revenue The percentage of total revenues that 49.5% (25.6%)come from federal, state, local, andprivate grants (total BHEC grants +total other federal grants + totalnonfederal grants or contracts) ÷total revenue
Service revenue The percentage of total revenues 40.9% (27.0%)that comefrom payments (total third-partyrevenue ÷ total revenue)
Net revenue Total revenue − total calendar year costsMore than $500,000 58 (8.6%)$100,000 to $500,000 139 (20.5%)$0 to $99,999 160 (23.6%)−$1 to −$99,999 105 (15.5%)−$100,000 to −$500,000 143 (21.1%)Less than −$500,000 73 (10.8%)
Average encounter Total calendar year costs ÷ total $86.95 ($39.47)cost staffing encounters
Average medical Total calendar year medical $53.18 ($28.10)encounter cost care services costs ÷ total
medical care services encounters
(Continued)
(continues)

P1: fgiAspen Pub./JACM AS026-01 November 13, 1999 17:52 Char Count= 0
22 JOURNAL OF AMBULATORY CARE MANAGEMENT/JANUARY 2000
Table 1.
Mean (stnd dev.)Variable name Definition Number (percentage)
Average enabling Total calendar year enabling and other $157.50 ($328.92)services cost Medicare nonreimbursable services
costs ÷ total enabling servicesencounters
Average personnel Total employee costs ÷ total employees $60,578.1 ($39,712.5)cost
Average medical Total medical care services costs ÷ total $73,988.1 ($40,171.1)cost medical care services personnel
Average administrative Total administration costs ÷ $100,584.3 ($209,794.0)cost administration staff
Enabling servicesCase management Number and percentage of centers that 597 (97.2%)
provided this serviceChild care Number and percentage of centers
that128 (18.7%)
provided this service duringvisit to center
Discharge planning Number and percentage of centers that 306 (44.4%)provided this service
Eligibility assistance Number and percentage of centers that 546 (79.7%)provided this service
Employment/educational Number and percentage of centers that 145 (21.2%)counseling provided this service
Environmental health Number and percentage of centers 205 (29.9%)risk reduction that provided this service (via
detection and/or alleviation)Food bank/delivered Number and percentage of centers that 63 (9.2%)
meals provided this serviceHealth education Number and percentage of centers that 658 (96.1%)
provided this serviceHousing assistance Number and percentage of centers that 154 (22.5%)
provided this serviceInterpretation/translation Number and percentage of centers that 489 (71.4%)
services provided this serviceNursing home and Number and percentage of centers that 198 (28.9%)
assisted-livingplacement
provided this service
Outreach Number and percentage of centers that 568 (82.9%)provided this service
(Continued)