mammalian laryngseal air sacs add variability to the vocal...
TRANSCRIPT

Mammalian laryngseal air sacs add variability to the vocal tractimpedance: Physical and computational modeling
Tobias Riedea�
Japan Advanced Institute of Science and Technology, 1-1 Asahidai, Nomi-shi, Ishikawa 923-1292, Japan;National Center for Voice and Speech, 1101 13th Street, Denver, Colorado 80204;and Department of Biology, University of Colorado at Denver and Health Sciences, Denver,Colorado 80204
Isao T. Tokudab�
Japan Advanced Institute of Science and Technology, 1-1 Asahidai, Nomi-shi, Ishikawa 923-1292, Japan
Jacob B. Munger and Scott L. ThomsonDepartment of Mechanical Engineering, Brigham Young University, Provo, Utah 84602
�Received 31 October 2007; revised 17 March 2008; accepted 15 April 2008�
Cavities branching off the main vocal tract are ubiquitous in nonhumans. Mammalian air sacs existin human relatives, including all four great apes, but only a substantially reduced version exists inhumans. The present paper focuses on acoustical functions of the air sacs. The hypotheses areinvestigated on whether the air sacs affect amplitude of utterances and/or position of formants. Amultilayer synthetic model of the vocal folds coupled with a vocal tract model was utilized. As anair sac model, four configurations were considered: open and closed uniform tube-like sidebranches, a rigid cavity, and an inflatable cavity. Results suggest that some air sac configurations canenhance the sound level. Furthermore, an air sac model introduces one or more additional resonancefrequencies, shifting formants of the main vocal tract to some extent but not as strongly aspreviously suggested. In addition, dynamic range of vocalization can be extended by the air sacs. Anew finding is also an increased variability of the vocal tract impedance, leading to strong nonlinearsource-filter interaction effects. The experiments demonstrated that air-sac-like structures candestabilize the sound source. The results were validated by a transmission line computationalmodel. © 2008 Acoustical Society of America. �DOI: 10.1121/1.2924125�
PACS number�s�: 43.80.Ka, 43.70.Aj, 43.70.Bk, 43.25.Ba �JAS� Pages: 634–647
I. INTRODUCTION
Study on vocal tract shape and vocal fold anatomy isindispensable for understanding the acoustic property ofsounds used in vocal communications. Many aspects of non-human anatomy are, however, poorly understood in terms oftheir acoustic functions. Cavities branching off or extendingfrom the supraglottal vocal tract are ubiquitous in mamma-lian species. Some of those are inflatable, for example, hugeair sac in siamang �Symphalangus syndactylus� �Hill andBooth, 1957; Starck and Schneider, 1960; Schneider, 1964�or in reindeer �Rangifer tarandus� �Frey et al., 2007�. Somecavities are non-inflatable because they are surrounded par-tially or completely by the cartilaginous or bony material, forinstance, the Bulla hyoidea in howler monkeys �Alouattaspec.� �Starck and Schneider, 1960� or the human nasal cav-ity. Apart from the nasal cavity, only relatively small laterallaryngeal ventricles exist in humans. It is possible that majorair sacs were lost during human evolution since they exist inall four great apes, the closest relatives to the human. Onlyone similar voluminous anatomical structure is sometimesfound in humans, the laryngocele, which is an extension of
a�Electronic mail: [email protected]�
Electronic mail: [email protected]634 J. Acoust. Soc. Am. 124 �1�, July 2008 0001-4966/2008/1
the lateral laryngeal ventricles. It is, however, considered aspathology.
The physiological functions of mammalian air sacs orbulla-like extensions and the reason for their absence in hu-mans are a subject of much speculation. Hereafter, for sim-plicity, we use the term “air sac” to refer to both inflatable airsac and non-inflatable bulla-like extension, unless stated oth-erwise. We investigate possible acoustic functions of air sacson the basis of physical model experiments as well as com-putational simulations. Two hypotheses on acoustic roles ofthe air sacs are examined in the present study. The first hy-pothesis is that air sacs help to optimize sound radiation byimproving sound transfer through the vocal tract. This willbe tested by comparing the sound emissions from physicalvocal tract models with and without an air sac. The secondhypothesis states that air sacs affect the position of formants.This will be tested by comparing the spectral characteristicsof the sound output from the vocal tract models with andwithout an air sac.
The mammalian voice apparatus is mainly composed ofvocal folds, which work as a sound source generator, and avocal tract, which works as an acoustic filter. The vocal tractconsists of oral and pharyngeal cavities, parts of a laryngealcavity, and sometimes a nasal cavity �Fant, 1960�. An impor-tant feature of the vocal folds is their multilayered structure
�Hirano and Kakita, 1985�. Mammalian vocal folds generally© 2008 Acoustical Society of America24�1�/634/14/$23.00
consist of at least two layers: a relatively loose superficial“cover” layer and a muscular “body” layer �Hirano and Ka-kita, 1985�. The human vocal folds also have a ligamentbetween the cover and body layers. In some species, thisligament is not very prominent �Kurita et al., 1983; Riedeand Titze, 2008�, although the situation is unknown for mostspecies. Functionally, most of the vocal fold vibrations occurin the cover layer because of its high degree of compliance.The vibrations are regarded as a result of the energy transferfrom the glottal airflow to the vocal fold motion �Titze,1988�. To study laryngeal aerodynamics as well as vocal foldvibrations, physical models have been developed that synthe-size the flow-induced vibrations of the human vocal folds�Titze et al., 1995; Chan et al., 1997; Chan and Titze, 2006;Thomson et al., 2005; Zhang et al., 2006a; 2006b; Neubaueret al., 2007�. Physical models have also been constructed tosimulate the vocal tract to study open questions regardingvocal tract acoustics, such as nonlinear interaction betweenthe vocal tract and the sound source �Chan and Titze, 2006;Zhang et al., 2006b�, acoustic role of the piriform fossa inhumans �Dang and Honda, 1997�, and acoustic effect of dif-ferent degrees of beak opening in birds �Fletcher and Tarnop-olsky, 1999�. In the present study, a modified version of thephysical model of the vocal folds, which has been repeatedlyexamined by preceding studies �e.g., Thomson et al., 2005;Zhang et al., 2006a; 2006b; Neubauer et al., 2007�, is at-tached to a physical model of the vocal tract that includes theair sac. Both inflatable and non-inflatable configurations ofthe air sac cavity are considered. We test the hypotheses thateither of these structures can help amplify sound or affectvocal tract resonances. In addition to the physical model ofthe vocal folds, we exploit a sweep tone generator as thesound source to determine the acoustical transfer function ofthe vocal tract model.
The purpose of this study is not only to determine thetransfer function of the vocal tract but also to consider
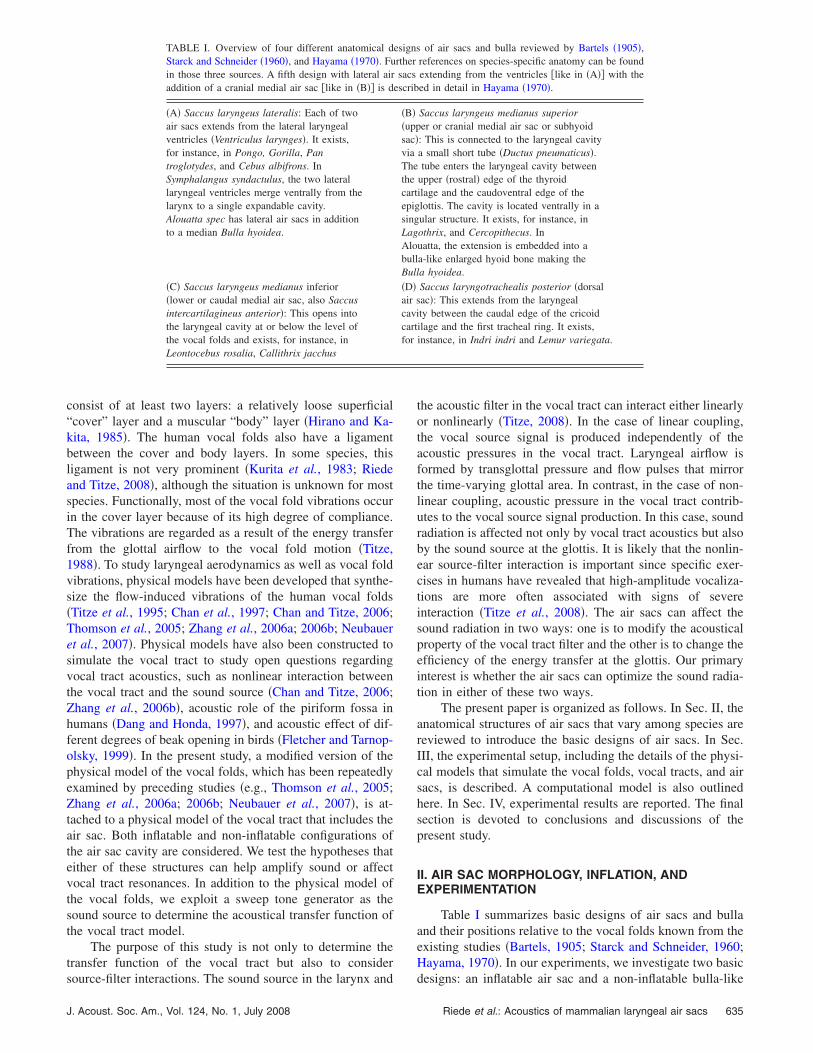
TABLE I. Overview of four different anatomical dStarck and Schneider �1960�, and Hayama �1970�. Fuin those three sources. A fifth design with lateral airaddition of a cranial medial air sac �like in �B�� is de
�A� Saccus laryngeus lateralis: Each of twoair sacs extends from the lateral laryngealventricles �Ventriculus larynges�. It exists,for instance, in Pongo, Gorilla, Pantroglotydes, and Cebus albifrons. InSymphalangus syndactulus, the two laterallaryngeal ventricles merge ventrally from thelarynx to a single expandable cavity.Alouatta spec has lateral air sacs in additionto a median Bulla hyoidea.
�C� Saccus laryngeus medianus inferior�lower or caudal medial air sac, also Saccusintercartilagineus anterior�: This opens intothe laryngeal cavity at or below the level ofthe vocal folds and exists, for instance, inLeontocebus rosalia, Callithrix jacchus
source-filter interactions. The sound source in the larynx and
J. Acoust. Soc. Am., Vol. 124, No. 1, July 2008
the acoustic filter in the vocal tract can interact either linearlyor nonlinearly �Titze, 2008�. In the case of linear coupling,the vocal source signal is produced independently of theacoustic pressures in the vocal tract. Laryngeal airflow isformed by transglottal pressure and flow pulses that mirrorthe time-varying glottal area. In contrast, in the case of non-linear coupling, acoustic pressure in the vocal tract contrib-utes to the vocal source signal production. In this case, soundradiation is affected not only by vocal tract acoustics but alsoby the sound source at the glottis. It is likely that the nonlin-ear source-filter interaction is important since specific exer-cises in humans have revealed that high-amplitude vocaliza-tions are more often associated with signs of severeinteraction �Titze et al., 2008�. The air sacs can affect thesound radiation in two ways: one is to modify the acousticalproperty of the vocal tract filter and the other is to change theefficiency of the energy transfer at the glottis. Our primaryinterest is whether the air sacs can optimize the sound radia-tion in either of these two ways.
The present paper is organized as follows. In Sec. II, theanatomical structures of air sacs that vary among species arereviewed to introduce the basic designs of air sacs. In Sec.III, the experimental setup, including the details of the physi-cal models that simulate the vocal folds, vocal tracts, and airsacs, is described. A computational model is also outlinedhere. In Sec. IV, experimental results are reported. The finalsection is devoted to conclusions and discussions of thepresent study.
II. AIR SAC MORPHOLOGY, INFLATION, ANDEXPERIMENTATION
Table I summarizes basic designs of air sacs and bullaand their positions relative to the vocal folds known from theexisting studies �Bartels, 1905; Starck and Schneider, 1960;Hayama, 1970�. In our experiments, we investigate two basic
of air sacs and bulla reviewed by Bartels �1905�,references on species-specific anatomy can be foundextending from the ventricles �like in �A�� with theed in detail in Hayama �1970�.
Saccus laryngeus medianus superiorer or cranial medial air sac or subhyoid: This is connected to the laryngeal cavitya small short tube �Ductus pneumaticus�.tube enters the laryngeal cavity between
upper �rostral� edge of the thyroidilage and the caudoventral edge of thelottis. The cavity is located ventrally in aular structure. It exists, for instance, inothrix, and Cercopithecus. Inuatta, the extension is embedded into aa-like enlarged hyoid bone making thea hyoidea.Saccus laryngotrachealis posterior �dorsalac�: This extends from the laryngealty between the caudal edge of the cricoidilage and the first tracheal ring. It exists,instance, in Indri indri and Lemur variegata.
esignsrthersacsscrib
�B��uppsac�viaThethecartepigsingLagAlobullBull�D�air scavicartfor
designs: an inflatable air sac and a non-inflatable bulla-like
Riede et al.: Acoustics of mammalian laryngeal air sacs 635
cavity, both of which branch off from the supraglottal vocaltract. In the case of bulla, the cavity size is always keptconstant during the phonation, which must occur with openmouth or nose. In contrast, the inflatable air sacs are notsupported by a skeletal frame, but they have a flexible wallcomposed of high amounts of elastic and collagen fibers and,to some extent, muscle fibers. Air sac walls thus contain bothpassive and active components that facilitate collapse. Theair sac, which is connected to the rest of the vocal tractcavity via a tube-like structure �either pairwise lateral ven-tricles or the single ductus pneumaticus�, expands up to acertain size, ranging from a few milliliters up to several litersin large apes �Starck and Schneider, 1960; Nishimura et al.,2007� and in muskox and reindeer �Frey et al., 2006, 2007�.For inflation, the oral and nasal cavities are closed and theanimal impels air into the air sac �in a Valsalva-like maneu-ver�.
The critical point of modeling the air sac seems to bewhether phonation occurs with an open or a closed mouth.With an open mouth, the air sac might serve as some sort ofa side branch. With a closed mouth, however, vocalizationoccurs with air flowing into the air sac, and sound is emittedthrough the soft air sac wall and skin, which serves as themain filter. In the siamang �Symphalangus syndactylus�, twolateral ventricles merge ventrally from the larynx into asingle large air sac at a ventral neck position. Anatomicalmeasurements in an adult female siamang cadaver �providedby Dr. Nishimura at the Japan Primate Research Institute�revealed that the lateral ventricles have an inner diameter of1–1.5 cm and a length of approximately 4 cm; these mergeventrally into the air sac, which can maximally expand toapproximately 800–1000 ml. During the boom call produc-tion of siamangs, inflation of the air sac has been reported tobe accompanied by closed lips or nares �Haimoff, 1981,Tembrock, 1974�. When the lips are open, the air follows theleast resistance and is expelled from the mouth and possiblyfrom the nose. The air sac deflates accordingly. It should benoted that there exists some speculation that air sacs caninflate even with open lips. For instance, entrance to the airsac can be closed by some mechanism, which keeps the airsac inflated by separating it from the vocal tract �Schön-Ybarra, 1995�. Another speculation is that exhalation pres-sure during open-mouth phonation alone is able to inflate theair sac �Frey et al., 2007�. These hypotheses are, however,not a subject of this study and have to await further investi-gations.
Little experimentation has been performed on the acous-tic roles of the air sacs. Gautier �1971� conducted a fistula-tion surgery of the singular, ventrally located air sac in onemale DeBrazza’s monkey �Cercopithecus neglectus�. Gautierobserved an effect on the amplitude of higher harmonics butnot on the location of any formant. Hilloowala and Lass�1978� also reported no effect on formant positions in rhesusmonkeys �Macaca mulatta�, which also possess a singularventrally located air sac �Schneider, 1964�. They surgicallyremoved the air sac �without detailed description of the sur-gical procedure� in three males and found very similar fre-quency values before and after surgery. Although their report
is somewhat confused with the terms “fundamental fre-636 J. Acoust. Soc. Am., Vol. 124, No. 1, July 2008
quency” and “formant frequencies” �see Table I inHilloowala and Lass, 1978�, it is most likely that they reportformant frequencies since their frequency values resemblethe formant values reported for rhesus monkeys by Rendallet al. �1998�.
III. METHODS
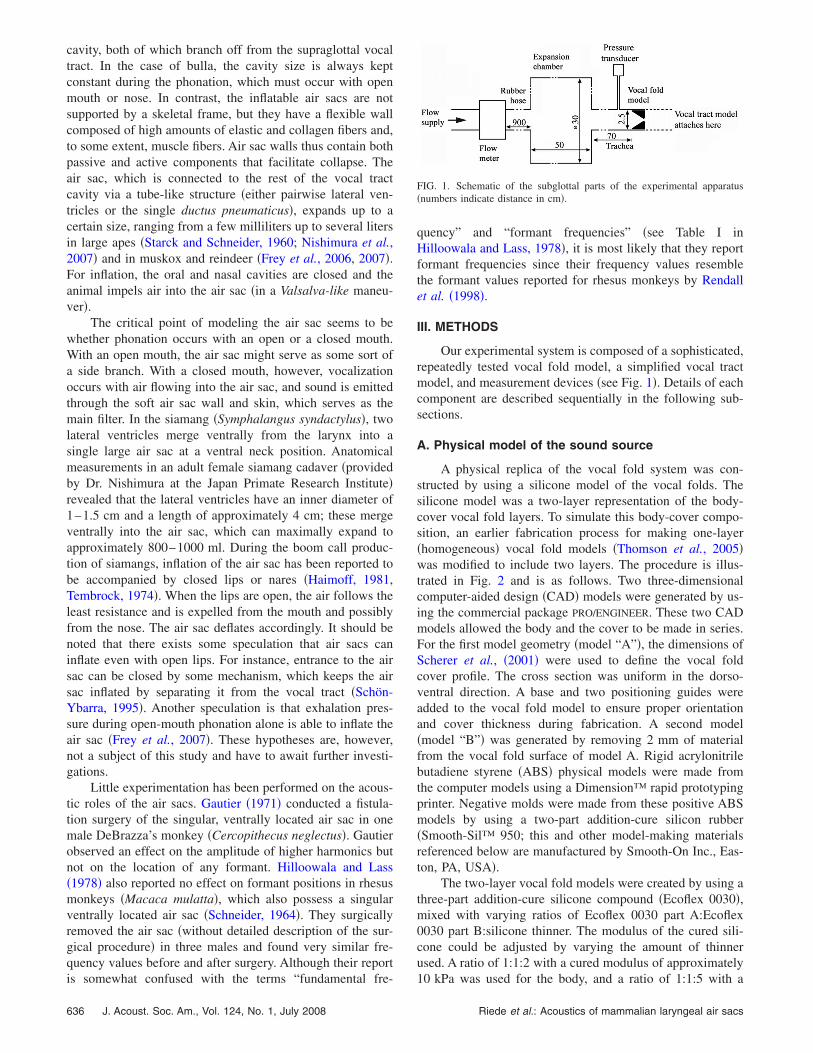
Our experimental system is composed of a sophisticated,repeatedly tested vocal fold model, a simplified vocal tractmodel, and measurement devices �see Fig. 1�. Details of eachcomponent are described sequentially in the following sub-sections.
A. Physical model of the sound source
A physical replica of the vocal fold system was con-structed by using a silicone model of the vocal folds. Thesilicone model was a two-layer representation of the body-cover vocal fold layers. To simulate this body-cover compo-sition, an earlier fabrication process for making one-layer�homogeneous� vocal fold models �Thomson et al., 2005�was modified to include two layers. The procedure is illus-trated in Fig. 2 and is as follows. Two three-dimensionalcomputer-aided design �CAD� models were generated by us-ing the commercial package PRO/ENGINEER. These two CADmodels allowed the body and the cover to be made in series.For the first model geometry �model “A”�, the dimensions ofScherer et al., �2001� were used to define the vocal foldcover profile. The cross section was uniform in the dorso-ventral direction. A base and two positioning guides wereadded to the vocal fold model to ensure proper orientationand cover thickness during fabrication. A second model�model “B”� was generated by removing 2 mm of materialfrom the vocal fold surface of model A. Rigid acrylonitrilebutadiene styrene �ABS� physical models were made fromthe computer models using a Dimension™ rapid prototypingprinter. Negative molds were made from these positive ABSmodels by using a two-part addition-cure silicon rubber�Smooth-Sil™ 950; this and other model-making materialsreferenced below are manufactured by Smooth-On Inc., Eas-ton, PA, USA�.
The two-layer vocal fold models were created by using athree-part addition-cure silicone compound �Ecoflex 0030�,mixed with varying ratios of Ecoflex 0030 part A:Ecoflex0030 part B:silicone thinner. The modulus of the cured sili-cone could be adjusted by varying the amount of thinnerused. A ratio of 1:1:2 with a cured modulus of approximately
FIG. 1. Schematic of the subglottal parts of the experimental apparatus�numbers indicate distance in cm�.
10 kPa was used for the body, and a ratio of 1:1:5 with a
Riede et al.: Acoustics of mammalian laryngeal air sacs

cured modulus of approximately 2 kPa was used for thecover. Modulus data were obtained by mounting cylindricalspecimens �0.8 cm diameter and 6 cm long� of the givenratios in a tensile testing machine �Instron 3342� and strainedat a rate of 1000 mm /min to 40% strain. Both ratios yieldedmaterials with nearly linear stress-strain curves.
To fabricate the vocal folds, the body of the vocal foldmodel was created first. Mold B was sprayed with UniversalMold Release, and the 1:1:2 silicone mixture was pouredinto the mold so the liquid just filled the body area, leavingthe base and guide volumes unfilled. After the body cured��6 h�, a very stiff silicone mixture �Dragon Skin� waspoured into the mold to fill in the base and guides and al-lowed to cure for 2 h. The stiffness of the base was deemedto be sufficiently high so as to not vibrate with the vocalfolds. A second mold release agent �Ease Release 800� wasthen sprayed into mold A. The 1:1:5 silicone mixture waspoured into mold A. The silicone model cast using mold Bwas inserted into mold A. The cover was allowed to cure for24 h and the entire model was removed from mold A. Theportion of the base not directly under the vocal fold modelwas removed, and the model was then cut into two 1.7 cmlengths �for two symmetric vocal folds�.
The dorsoventral and lateral surfaces of the model were
attached to a 1.2 cm thick acrylic orifice plate using a liquidJ. Acoust. Soc. Am., Vol. 124, No. 1, July 2008
polyurethane adhesive �Pro Bond®, Elmer’s Products, Inc.�.Two such components were fastened together to form asingle orifice plate, representing a full laryngeal configura-tion. The separation distance between the support plates wasvariable. The medial surface of the two folds was positionedto be in contact so that the glottis was closed when no air-flow was applied. A uniform polyvinylchloride �PVC� tra-cheal tube �2.5 cm inner diameter� was connected upstreamto an expansion chamber to simulate the subglottal system�Fig. 1�.
A sweep tone experiment was conducted to stimulate thevocal tract models using an alternative sound source. To gen-erate a well controlled sound, a horn driver �P-15F, UNI-PEX� was utilized. The vocal tract models, which will beexplained in detail in the following subsection, were attachedto the horn driver. The sweep tone signals �pure tones whosefrequency changes continuously from low to high frequency�were designed with the COOLEDIT 2000 software �SyntrilliumSoft. Corp.�.
B. Physical models of the vocal tract
The vocal tract models were made of PVC tubes. Fourmain configurations were designed as follows.
FIG. 2. �Color online� Schematic ofthe two-layer vocal fold fabricationprocess, including computer modelgeneration, rapid prototyping, andcasting of the different layers. Shownat lower left is an image of the crosssection of the vocal fold model.
�1� As a reference configuration to study the effect of the air
Riede et al.: Acoustics of mammalian laryngeal air sacs 637

sac models, cases with no vocal tract �Fig. 3�A�� andwith a main uniform tube vocal tract �25 mm inner di-ameter, 200 mm long; Fig. 3�B�� were considered. Notethat in the situation without a vocal tract, there is no tubeextending from the vocal folds.
�2� A tube-like side branch �hereafter “tube-SB”� was at-tached to the main vocal tract �Figs. 3�C� and 3�D��. Theinner diameter was varied to examine its effect on theproduced sound. Anatomically, this tube-SB may corre-spond to the connecting tube between the main vocaltract and a large actual air sac �lateral ventricle or Ductuspneumaticus; Table I�B�� or a very small air sac systemalone. Both open and closed situations were considered.Acoustical measurements of the tube-SB are of particu-lar importance for understanding the exclusive effect ofthe air sac models, which are attached to the vocal tractthrough the tube-SB.
�3� A non-inflatable bulla-like cavity was attached to themain vocal tract through the tube-SB �Fig. 3�E��. Such aconfiguration exists, for example, in howler monkeys�subfamily Alouattinae�. As a rigid non-inflatable cavity,
2
FIG. 3. �Color online� Schematic illustrations of the physical model con-figurations. Whereas no vocal tract is attached to the vocal fold physicalmodel in �A� the following vocal tract models are attached to the vocal foldmodel in �B�–�F�. �B� Single uniform tube as main vocal tract. �C� Mainvocal tract with closed uniform tube side branch �“tube-SB”�. �D� Mainvocal tract with open tube-SB. �E� Main vocal tract with tube-SB and rigidcavity of variable volume �“bulla”�. The volume is regulated by the watercavity level. �F� Main vocal tract with tube-SB and inflatable air sac �“airsac”�. The inflation is regulated by “closing the mouth,” i.e., inserting a plugto close the aperture of the vocal tract as if the lips are closed.
a PVC cube �100�100�100 mm � was used. Variable
638 J. Acoust. Soc. Am., Vol. 124, No. 1, July 2008
water levels in the cavity, controlled through an outlet�3 mm� located at the lowest point of the cavity, enabledthe investigation of different cavity volumes.
�4� An inflatable air sac was attached to the main vocal tractthrough the tube-SB �Fig. 3�F��. Such a configurationexists, for example, in siamangs �Symphalangus syndac-tylus� and reindeers �Rangifer tarandus� �Frey et al.,2007�. An inflatable air sac was simulated by using aurinary bladder from a pig �Sus scrofa f. domestica� or acow �Bos taurus�. The bladder wall has similar wallcharacteristics as real air sacs. Namely, the wall containshigh amounts of elastic and collagen fibers, which can berepeatedly stretched to its maximal size, i.e., few timeslarger than its relaxed state, without causing any damage�Ogura, 1915�. Two situations were considered: closedmouth and open mouth, simulated by repeatedly openingand closing the open end �corresponding to the “mouth”�of the main vocal tract with a plug. After inserting theplug, the sound persisted until the air sac model wasinflated up to its maximum size.
Wall characteristics of the vocal tract model affect theformant bandwidth. A nonyielding wall �such as PVC� nar-rows the bandwidth and therefore might affect the overallsound pressure level. However, we are interested in the rela-tive measurements and hence believe that the data can becompared in a fair manner. We expect the sound wave reflec-tion on the water surface to be similar to that of the PVCsurface.
C. Experimental setup
Vocal fold vibration is affected by resonances of the sub-glottal system �Titze and Story, 1997�. A tracheal resonance�in particular, the negative reactance� in the vicinity of thefundamental frequency lowers the vocal fold efficiency�Titze, 2008�, which is undesirable since a stable vocalsource signal is needed here. Therefore, the length of thetrachea tube was chosen based on the recommendations pro-vided for a similar vocal fold system �Zhang et al., 2006a�.The vocal fold model was installed at the end of a 70 cmlong PVC tube that models the trachea. An expansion cham-ber �inner cross-sectional diameter: 30 cm: length, 50 cm�was connected to the air flow supply through a 9 m longrubber hose so as to reduce possible flow noise from the airsupply. This chamber served to simulate the change in cross-sectional area from the lungs to the primary bronchi �Ish-izaka et al., 1976�. This design is quite similar to that testedin Zhang et al. �2006a�, in which an ideal open-ended termi-nation of the tracheal tube for frequencies above approxi-mately 50 Hz was realized.
The sound generated from the physical model was re-corded by using an omnidirectional microphone �Bruel andKjær, type 4192; Nexus conditioning amplifier�, located20 cm from the sound source or from the vocal tract open-ing. The sound pressure level �SPL� was measured by asound level meter �Bruel and Kjær, type 2250�.
The subglottal pressure in the tracheal tube was moni-tored by using a pressure transducer �Differential pressure
transducer, PDS 70GA, Kyowa, Japan� with a signal condi-Riede et al.: Acoustics of mammalian laryngeal air sacs

tioner �CDV 700A, Kyowa, Japan�. The pressure transducertube was mounted flush with the inner wall of the trachealtube, 2 cm upstream of the vocal fold plates.
The volumetric flow rate through the glottis was mea-sured by using a precision mass-flow meter �CMQ-V,Yamatake Corp., Japan� at the setup inlet. During the experi-ments, the flow rate was increased from zero to a certainmaximum value in discrete increments. At each step, afterthe flow rate was changed, measurement was delayed for aninterval of about 4–5 s in order to allow for flow field sta-bilization
All three signals were recorded as WAV files �16 bitresolution, 44 kHz sampling rate� on a digital recorder �R4Edirol, Yamaha, Japan� or alternatively with a fast Fouriertransform �FFT� analyzer �DL 750, Scopecorder, Yokogawa,Japan�. Experiments were conducted in a sound attenuatedroom with controlled climate �22 °C, 75% humidity�.
D. Computational simulation
In order to validate the experiments, acoustical charac-teristics of the physical model of the vocal tract were esti-mated by using the transmission line model �Flanagan, 1972;Sondhi and Schroeter, 1987�. In this model, the vocal tract isrepresented by a series connection of many uniform tubes.Assuming plane-wave propagation, the input-output relation-ship of the pressure and the volume velocity at each tube isdescribed in terms of a four terminal network. Acousticalcharacteristics of the vocal tract are obtained by computingthe transmission characteristics of the cascaded connectionof such lumped elements. This approach can be applied toestimate the transfer function of the vocal tract even in thepresence of a side branch �Sondhi and Schroeter, 1987; Dangand Honda, 1996�. As acoustic impedance parameters, stan-dard values that assume a static wall condition were utilized�Flanagan, 1972�. Radiation impedance at the open end ofthe vocal tract was determined according to Causse et al.�1984�.
Configuration of the transmission line was constructedin accordance with the basic design of the physical model ofthe vocal tract including the air sac. A uniform tube wasdivided into a cascade connection of 1000 lumped elements.In order to match the first formant frequency, a correctedvalue of 19.8 cm was used as the length of the main vocaltract. All other parameters such as the length of the tube-SB,the tube diameter, and the cavity size were adopted from theoriginal values of the physical model.
IV. RESULTS
A. Reference measurements
First, phonation threshold pressure �PTP�, fundamentalfrequency �F0�, and SPL values of the vocal fold physicalmodel were measured without any vocal tract �Fig. 3�A��.These measurements will serve as a reference to study theeffect of different vocal tract configurations examined in thefollowing experiments. PTP represents the minimum sub-glottal pressure required to initiate and sustain the vocal foldoscillations. Functionally, it provides an index for the vocal
effort. PTP data are given in Table II.J. Acoust. Soc. Am., Vol. 124, No. 1, July 2008
F0 of the vocal fold model ranged from 105 to 113 Hzfor subglottal pressures between 6 and 20 cm H2O. Stiffnessand length of the vocal folds, which are considered as majorcauses to change F0, were kept constant. Figure 4 demon-strates the relationship between subglottal pressure and flowrate. The pressure-flow relationship is expected to be qua-dratic for an orifice with yielding walls, as is the case withthe vocal folds �Alipour and Scherer, 1997�.
The SPL ranged between 48 dBA �at PTP� and 69 dBAfor subglottal pressures between 6 and 20 cm H2O �Fig.5�a��. Next, as a basic design for all vocal tract models, onlythe main vocal tract model �Fig. 3�B�� was attached to thevocal fold model. Compared to the no vocal tract measure-ment, the main vocal tract model lowered PTP �Table II� andincreased SPL for varied subglottal pressure �Fig. 5�a��. To-gether with the no vocal tract measurement, this basic designis also utilized as a reference to study the relative effect ofvarious air sac models added to the main vocal tract.
B. Side branch modeled as a uniform tube
In the case of a closed tube-SB connected to the mainvocal tract �Fig. 3�C��, the SPL was further increased, wherethe tube-SB with an inner diameter of 0.4 or 0.8 cm providedthe maximum SPL �Fig. 5�b��. The closed tube-SB also low-
TABLE II. Phonation threshold pressure �PTP� and flow rate at voice onsetpoint for different vocal tract �VT� physical models. Values are averagedover three trial measures; the standard deviations in all cases are less than0.5%. For uniform tube side branches �tube-SBs�, two measurements aregiven: one for a closed side branch and the other for an open side branch.
VT modelPTP �cm
H2OFlow rate
�ml/s�
No VT 5.749 24120 cm uniform tube 5.427 183SB0.8ID closed/open tube-SB 5.734 /5.646 216 /216SB1.3ID closed/open tube-SB 5.646 /5.354 225 /216SB1.6ID closed/open tube-SB 5.719 /5.383 233 /216SB1.3ID 1000 ml cavity 5.456 216SB1.3ID 600 ml cavity 5.734 133SB1.3ID 200 ml cavity 5.486 150
FIG. 4. Subglottal pressure–flow rate relationship of the vocal fold physicalmodel during phonation. Data for the physical model with no vocal tract,data with a 20 cm uniform tube as the vocal tract, and data with all othertested vocal tract models are combined. Note that the pressure-flow rate
relationship is identical for different vocal tracts.Riede et al.: Acoustics of mammalian laryngeal air sacs 639

ered PTP below that of the basic design �Table II�. The opentube-SB also showed PTP lower than the reference values�Table II�.
Addition of these side branches introduces a pole/zeropair to the spectrum and consequently moves the neighbor-ing formants �Table II�. Among the four formants, the firstformant is affected most strongly �12%–20%� �Table III�.Depending on whether the tube-SB is closed or open, theadditional pole/zero pair of a 5 cm tube-SB is located differ-ently, at approximately 1.8 kHz for closed tube-SB and atapproximately 3.6 kHz for open tube-SB �Fig. 6�. Obviously,position of the pole/zero pair behaves as a quarter-wavelength resonator �c /4L, where c is the sound speed andL is the tube length� when the tube-SB is closed and as ahalf-wavelength resonator �c /2L� when the tube-SB is open.
To investigate whether the inner diameter of the tube-SBprovides any limit on vocalization, we measured the relation-ship between the subglottal pressure and SPL for the opentube-SB models under the condition that the mouth was
FIG. 5. Sound pressure level �SPL�—subglottal pressure relationship of thetube as a vocal tract. �B� 20 cm long tube with tube-SB. Side branch is closedifferent inner diameters �inner diameters, IDs: 0.4, 0.8, 1.3, and 1.6 cm�. �SB tube. Results for three cavity sizes are shown �cavity sizes: 1.0, 0.6, andwithout vocal tract; upper line: 20 cm uniform tube vocal tract�.
TABLE III. Resonant frequencies obtained from meaand open side branches �SB: side branch; no SB: 20 coSB: open side branch; SB-0.8: side branch with indenoted as Fn. The term “pole” stands for an additcavity. Values in parentheses show deviations in pertube without a side branch.
VT model pole �Hz� F1 �Hz� F2 �Hz
No SB 380 1170cSB-0.4 320 �−15.7� 1250 �+cSB-0.6 300 �−21� 1250 �+cSB-0.8 290 �−23.7� 1140 �−cSB-1.3 300 �−21� 1160 �−cSB-1.6 290 �−23.7� 1115 �−oSB-0.4 310 �−18.7� 1230 �+oSB-0.6 320 �−15.8� 1260 �+oSB-0.8 370 �−2.6� 1220 �+oSB-1.3 380 �0� 1270 �+oSB-1.6 380 �0� 1260 �+cav 100 ml 115 660 �+73.7� 1320 �+cav 500 ml 78 650 �+71� 1310 �+
640 J. Acoust. Soc. Am., Vol. 124, No. 1, July 2008
closed. The inner diameter of the side branch was varied�0.4, 0.8, 1.3, and 1.6 cm�. Phonation with a side branchmodel with an inner diameter of 0.8 cm was possible onlywith a very high flow rate. No phonation was possible whenthe inner diameter was smaller than 0.8 cm. The results im-ply that there exists a minimum inner diameter required tomaintain vocal fold vibrations, below which vocal fold vi-bration cannot be achieved �or at least demands an exces-sively high subglottal pressure�. This may be because theincreased flow resistance associated with the small tube-SBopening creates a high supraglottal pressure and thus makesthe pressure difference between the subglottal and supraglot-tal systems insufficient for sustained vocal fold oscillation.
C. Non-inflatable bulla-like cavity
For the case of a rigid cavity attached to the main vocaltract, dependence of SPL on cavity size was studied �Fig.
fold physical model during phonation. �A� Without and with a 20 cm longmouth is open. Three side branches were tested; each has 5 cm length withcm long tube with tube-SB. A rigid cavity of variable size is added to the
�. The same trendlines as in Fig. 5�a� are drawn �lower line: physical model
ents of different vocal tract �VT� models with closedg tube without side branch; cSB: closed side branch;iameter of 0.8 cm�. The nth resonant frequency isresonant frequency introduced by a side branch or
ge from the resonant frequencies of the 20 cm long
pole �Hz� F3 �Hz� F4 �Hz�
1990 25601640 1890 �−5� 2460 �−3.9�1630 1890 �−5� 2450 �−4.3�1620 1820 �−8.5� 2400 �−6.3�1630 1880 �−5.5� 2500 �−2.3�1650 1900 �−4.5� 2500 �−2.3�
1875 �−5.8� 2465 �−3.7�1890 �−5� 2465 �−3.7�1820 �−3.7� 2410 �−5.8�1900 �−4.5� 2410 �−5.8�1890 �−5� 2410 �−5.8�
� 2110 �+11.6� 3030 �+18.3�2110 �+11.6� 3030 �+18.3�
vocald andC� 200.2 l
suremm lonner d
ionalcenta
�
6.8�6.8�2.5�1�4.7�5.1�7.7�4.3�8.5�7.7�12.812�
Riede et al.: Acoustics of mammalian laryngeal air sacs

5�c��. Compared to the 600 ml cavity, the 200 ml cavitygives higher SPL values, which can even exceed those of thebasic design for high subglottic pressures.
It should be noted that Figs. 5�a�–5�c� reveal an interest-ing effect of the tube-SB as well as of the rigid cavity.Namely, the slope of the SPL-subglottal pressure relationshipbecomes much steeper compared to the reference measure-ment or the basic design. For instance, increasing the sub-glottic pressure from 8 to 16 cm H2O caused an increase inSPL by 12 dB �from 54 to 66 dB� for the reference measure-ment �Fig. 5�a��; a comparable amount of increase in SPLwas also observed for the basic design �from 60 to 73 dB�.However, in the case of the attachment of a tube-SB �Fig.5�b�, 1.3 cm diameter� or a 1 l rigid cavity �Fig. 5�c��, thesame increase in subglottic pressure �from 8 to 16 cm H2O�resulted in an increase in SPL of 20 dB �from 53 to 73 dB�.
FIG. 6. Spectra and linear predictive coding �LPC� envelopes for differentphysical models. The vocal tract model is schematized in the top right cor-ner of each spectrum. �A� No vocal tract �as in Fig. 3�A��, �B� uniform tubevocal tract �as in Fig. 3�B��, �C� uniform tube vocal tract with closed sidebranch �as in Fig. 3�C�� �arrow indicates additional pole�, �D� uniform tubevocal tract with closed side branch �as in Fig. 3�D��, �E� uniform tube vocaltract with rigid cavity �50 ml volume� �as in Fig. 3�E��, �F� uniform tubevocal tract with large rigid cavity �400 ml volume� �as in Fig. 3�E��. Notethat the additional zero in the vocal tract with the open side branch overlapswith the fourth formant �arrow in panel �D��.
This implies that within the same range of subglottic pres-
J. Acoust. Soc. Am., Vol. 124, No. 1, July 2008
sure, dynamic range of the sound emission can be widenedby introducing the side branch or the rigid cavity.
To study the dependence of SPL on the rigid cavity vol-ume in more detail, another experiment was conducted inwhich the cavity size was gradually changed from0 to 300 ml �Fig. 7�. At a cavity size of approximately210 ml, the physical model ceased to vibrate. The corre-sponding PTP was too high to measure at this point �Fig. 8�.This phenomenon is due the following nonlinear source-filterinteraction. The pole/zero pair introduced by the rigid cavitydepends on the cavity size �Table III�. A small cavity intro-duces a pole/zero pair around 150 Hz. As the cavity size isincreased �from 0 to 350 ml in Fig. 7�, the pole/zero pairdecreases and eventually crosses the fundamental frequencyof the vocal fold model �F0=110 Hz� at a cavity volume of
FIG. 7. Experiment with a continuous change in rigid cavity volume at-tached to the main vocal tract. During the experiment, the cavity was gradu-ally filled with water. Note the aphonic regime when the resonant frequencycrossed F0. Phonation started again slowly after the resonance moved be-yond from F0. The SPL reached a higher level after the crossing.
FIG. 8. Dependence of phonation threshold pressure �PTP� on the volume of
the rigid cavity attached to the main vocal tract.Riede et al.: Acoustics of mammalian laryngeal air sacs 641

erag
approximately 210 ml. The interaction between the soundsource and the vocal tract becomes very strong and inhibitsthe model vibrations. Once the pole/zero pair passes awayfrom the fundamental frequency, the source-tract interactionweakens and the vocal folds resume oscillation. The interac-tion effect is different on both sides of this phonation stop.The SPL was higher after the phonation stop, implying thatphonation is facilitated when F0 is larger than the pole/zeropair. Before and after the phonation stop, the subglottal pres-sure changed by approximately 1 cm H2O. F0 also changedfrom 110 to 120 Hz.
To locate a precise value of the pole/zero pair and tostudy its dependence on the cavity size, the transfer functionof the vocal tract model was determined by a sweep toneexperiment �Fig. 9�. In this experiment, the vocal tract modelwas stimulated by a horn driver with a variable frequencyranging from 90 to 150 Hz. The cavity size was changedfrom 0 to 500 ml with an increment of 100 ml. The spectralanalysis of the output sound shows that the pole/zero loca-tion is lowered as the cavity size is increased �Fig. 9�. This isin good agreement with the computational simulation �seeSec. IV E below�.
D. Inflatable air sac
To study an inflatable air sac added to the side branch�Fig. 3�F��, two distinct situations were considered: closedmouth �plug inserted� and open mouth �plug not inserted�.For a given air flow rate �for instance, 34 l /min�, the SPLmeasured with a closed mouth was approximately 59 dB forthe pig urinary bladder �approximately 500 ml maximum in-flation, approximately 10 cm diameter� and 68 dB for thecow urinary bladder �approximately 5 l maximum inflation,approximately 20 cm diameter�.
After the plug was released from the mouth, the air sacwas deflated. Gravity of the air sac, recoiling properties ofthe elastic tissue, and the air exiting through the open mouthcaused a complete collapse. Partial inflation of the air sac,which is sometimes observed in vivo, was not simulated inthe present experiment.
Spectral analysis of the sound emitted from the inflatingair sac model indicates one major resonance in the area of250 Hz �Fig. 10�a�, bottom�. Higher harmonics are dimin-
FIG. 9. �A� Spectrograms of the vocal tract model stimulated by sweep tonvolume was changed from 0 to 500 ml. The arrows indicate the location ofno side branch. �B� Pole-cavity size relationship. For each sweeptone, an av
ished. This is in good agreement with the siamang boom call,
642 J. Acoust. Soc. Am., Vol. 124, No. 1, July 2008
which has a major peak at the fundamental frequency be-tween 200 and 300 Hz and only weak energy at higher har-monics �Fig. 10�b�, bottom�.
As shown in Figure 10�b�, parts of the siamang song arecharacterized by a stereotypic repetition of the boom calls�arrow 2� and the scream calls �arrow 1�. The fundamentalfrequency jumps from approximately 250 Hz in the boomcall to approximately 800 Hz in the scream call. In the physi-cal model, a relatively small shift in the fundamental fre-quency �up to 15 Hz� was observed when the closed mouthwas quickly opened. This sudden mouth opening induces asituation with high glottal flow and high transglottal pres-sure, which is known to cause F0 changes in human voice�Hsiao et al., 1994�. Since our physical model has rather asmall F0 variability �presumably primarily due to the linearstress-strain material response�, the observed F0 jump wasnot as large as the real siamang vocalization.
The deflation process was very interesting. Using a largecow bladder, the deflation lasted for about 5–10 s. Duringthis deflation process, the spectral characteristics of the voiceinitially resembled those of an open tube-SB and then laterthose of a closed tube-SB. This can be confirmed in thesweep tone data shown in Fig. 11. During deflation, the pole/zero pairs �arrow 2� are located at the same positions as theopen tube-SB �nc /2L, where n is an integer�. In the col-lapsed configuration, the pole/zero pairs �arrows 3 and 4� arelocated at the same positions as the closed tube-SB ��2n−1�c /4L�. In addition, we found in some cases a zero fre-quency in the range between 100 and 200 Hz. This is verysimilar to the pole/zero location of the non-inflatable cavity�see Sec. IV C�. In contrast to the non-inflatable cavity, wenever observed a phonation stop during the experiment.
We note that the vocal fold physical model was worn outrather quickly during this experiment. It is speculated thatthe repeated crossing of the zero frequency through F0caused a higher stress in the vocal fold model and henceaccelerated structural deterioration.
E. Computational simulation
To examine the acoustical characteristics of the physicalmodel of the vocal tract, computational simulations were car-ried out to estimate the transfer functions for various con-figurations of the vocal tract. Figure 12 compares the transferfunction of the main vocal tract �basic design� with that of
nging from 90 to 150 Hz. As indicated above each spectrogram, the cavitye �vocal tract resonance peak� introduced by the cavity; “no SB” stands fored FFT was calculated. The pole shows up as a peak in the FFT spectrum.
es raa pol
the vocal tract with open or closed side branch. The open
Riede et al.: Acoustics of mammalian laryngeal air sacs

e.
side branch produced a pole/zero pair at approximately3.6 kHz, whereas the closed side branch produced a pole-zero pair at approximately 1.8 kHz. The neighboring for-mants were moved accordingly. These results are in goodagreement with the experiments summarized in Table III.
The transfer functions were also computed for the vocaltract with a rigid cavity �Fig. 13�a��. The rigid cavity pro-duced a pole/zero pair around 150 Hz. Location of this pairis sensitive to the cavity volume, where the dependence ofthe pole/zero frequencies on the cavity size is drawn in Fig.13�b�. Again, this agrees quite well with the experimentalcurve shown in Fig. 9. The computational model also iden-tifies an additional pole/zero pair in the midfrequency range�Fig. 13�a��. This pair at around 3.6 kHz might be related tothe one computed for the open side branch in Fig. 12.
The experimentally obtained PTP curve shown in Fig. 8can also be predicted by the computational model. Titze�1988� determined theoretically that PTP is dependent notonly on the vocal fold parameters but also on the vocal tractinput impedance. Since the input impedance corresponds tothe acoustic load imposed on the vocal source, higher input
FIG. 10. Sound wave form �top panels�, its spectrogram �second panels�,inflatable bladder cavity �A� and from a siamang vocalization �B�. Spectra athe formant structure of the open-mouth vocalization with a collapsed air sacbranch �see Fig. 6�c��. “o”—open mouth or tube; “c”—closed mouth or tub
impedance of the vocal tract requires a higher subglottic
J. Acoust. Soc. Am., Vol. 124, No. 1, July 2008
pressure to induce vocal fold oscillations. In Fig. 14, inputimpedance was drawn for the vocal tract with variable cavitysize. Assuming that the input comes from the vocal source,the input impedance was computed by the convolution of thetransfer function of the vocal tract with the power spectrumof the sound source signal measured from the vocal foldmodel �without any vocal tract�. Although the computed in-put impedance has a peak at approximately 300 ml, which issomewhat different from the experiment, the qualitativestructure of the experimental curve of Fig. 8, including theasymmetry between the left and right sides of the peak, iswell reproduced by the computational model. One of thereasons for the inconsistency may be the bidirectionalsource-tract interaction, which is not considered in thepresent computation but which exists in the real experiment.The obtained peak frequency can be utilized to predict thephonation stop induced by the strong source-tract interactionof Fig. 7.
V. DISCUSSIONS
Experiments and computer simulations were carried out
wo spectra �third and fourth panels� from vocal fold physical model withlculated from 50 ms segments indicated with arrows “1” and “2.” Note thatal tract model as schematized in Fig. 3�F�� resembles that of the closed side
and tre ca�voc
to investigate the questions on whether mammalian air sacs
Riede et al.: Acoustics of mammalian laryngeal air sacs 643

or bulla-like cavities affect formant position and/or SPL.Four vocal tract configurations were investigated: �1� a uni-form tube-like main vocal tract without any attachment, �2� avocal tract with open or closed uniform tube-SB, �3� a vocal
FIG. 11. Spectrogram of sweep tone �90–150 Hz� transmitted through a20 cm tube vocal tract system with an inflatable air sac. Two situations areexamined; first, a completely collapsed sac, up to about 5 s �arrow 1�; sec-ond, continual deflation from air sac volume of about 5 l to complete defla-tion �from arrow 1 to end of sound�. Arrow 2 indicates the location of zerofrequency around 2500 Hz �which corresponds to zero frequency producedby the open side branch of 5 cm length�. Arrows 3 and 4 indicate locationsof zero frequency at about 1500 and 4500 Hz �which correspond to zerofrequency produced by the closed side branch of 5 cm length�. Note thatduring the deflation process �approximately between 9 and 14 s�, anotherzero-like structure appears at approximately 1400 Hz, decreasing to1300 Hz.
-80
-60
-40
-20
0
20
0 1 2 3 4 5
Frequency (kHz)
Lev
el
open SB closed SB no SB
FIG. 12. Transfer functions obtained by the computational model that simu-lates the vocal tract without a side branch and the vocal tract with an openor a closed uniform side branch. Depending on whether the side branch isclosed or open, an additional pole/zero pair of a 5 cm uniform side branch islocated differently, at approximately 1.8 kHz for closed side branch �leftarrow� and at approximately 3.6 kHz for open side branch �right arrow�. Theposition of the pole/zero pair behaves according to a quarter-wavelengthresonator when the side branch is closed and to a half-wavelength resonator
when the side branch is open.644 J. Acoust. Soc. Am., Vol. 124, No. 1, July 2008
tract with a tube-SB plus a rigid cavity air sac, and �4� avocal tract with a tube-SB plus an inflatable air sac.
A uniform tube shapes the sound source signal in anexpected way, i.e., formants at uneven multiplies of c /4L arepresent �Fig. 6�b��. The 5 cm long tube-SB introduced apole/zero pair in the midfrequency range �1.5–4.0 kHz, theexact position depends on whether the side branch is open orclosed or on the length or the inner diameter of the sidebranch� �Dang and Honda, 1997; Dang et al., 1994, 1998�.As a consequence, all neighboring formants were shiftedsomewhat, where the first formant was most strongly shiftedup to 25% �Figs. 6�c� and 6�d��. The second and higher reso-nances were changed by not more than 10%.
-80
-60
-40
-20
0
20
0 1 2 3 4 5
Frequency (kHz)
Lev
el
50 ml 300 ml no SBA
0
200
400
600
0 200 400 600 800 1000
Cavity volume (ml)
Fre
quen
cy(H
z)
pole zeroB
FIG. 13. �A� Transfer functions obtained by the computational model thatsimulates two rigid cavities �50 and 300 ml volume�. Note that the firstformant is affected by the pole/zero pair located in the low frequency range.The uniform tube that connects the main vocal tract and the rigid cavityintroduces another pole/zero pair around 3.6 kHz �arrow�, which resemblesthat of an open side branch. �B� Dependence of the pole/zero location on thecavity volume of the rigid cavity attached to the main vocal tract.
FIG. 14. Dependence of the input impedance of the vocal tract with a rigidcavity on the cavity volume. As an input signal to the vocal tract, referencesound measurement from the vocal fold physical model without a vocal tractis utilized. Since the input impedance is one of the key parameters that
determine the PTP, the curve can be compared to the curve in Fig. 9.Riede et al.: Acoustics of mammalian laryngeal air sacs

A rigid cavity added to the tube-SB, which models thebulla hyoidea most prominent in Allouatinae, added a pole/zero pair in the range between 80 and 150 Hz. Again, theneighboring formants were shifted somewhat, where the firstformant was shifted by up to 70% �Figs. 6�e� and 6�f��. Fi-nally, the inflatable air sac model added to a tube-SB wasstudied. In the case of a closed mouth, the air sac representsthe main vocal tract, which gives rise to one major resonancebelow 400 Hz. On the other hand, if the mouth is open, thespectral characteristics depend on the degree of air sac infla-tion, which resembles either a rigid cavity or a closed sidebranch.
All air sac models mentioned above also have an effecton the SPL. Because of the nonlinear source-tract interac-tion, dependence of the SPL on the air sac configuration ishard to be systematically understood. Nevertheless, our ex-perimental study showed that compared to the basic vocaltract configuration having no side branch, certain air sac con-figurations can enhance the SPL, for example, the closedtube-SB with inner diameter less than 1 cm and the rigidcavity of relatively small volume.
The present experiments also showed that the tube-SBand the rigid cavity models can widen the dynamic range ofthe sound emission within the same subglottal pressure range�Figs. 5 and 7�. Such physiological configurations would ex-tend the vocal efficiency not only at higher pressures thatmake the sound louder but also at lower pressures. The lowerlevels are useful for “private” talk, in which the senderwishes to exclude unwanted listeners �eavesdroppers�. Tokeep the voice “intelligible” in such private talk, the soundsource must maintain its stable oscillations even at lowerpressure levels.
A. Inflatable air sac cavity
Our inflatable air sac model suggests the presence of asingle resonant frequency when the mouth is closed. Sincethere is no sound radiation from the mouth, the phonationoccurs presumably through the air sac and skin walls. Ac-cording to our experiment, when small air sac models �pigurinary bladder� were utilized, the closed mouth configura-tion gave a lower SPL than that of the open mouth. Whenlarge air sac models �cow urinary bladder� were utilized, theSPL values were comparable between the open and closedmouth configurations. The latter case is similar to siamangcalls, which exhibit similar amplitude between scream calland boom call.
In siamang boom call, F0 is located around 250 Hz,which is close to the air sac resonance. Higher harmonics aremostly filtered out but can be observed sometimes �Fig.10�b�, bottom panel�. This F0 matching with the resonantfrequency implies more efficient transmission of the soundenergy than a mistuned system like our model, in which F0�110 Hz� is more than an octave below the resonance �ap-proximately 250 Hz� of the air sac �Fig. 10�a�, bottompanel�.
Phonation with closed oral and nasal cavities and intoinflatable cavities has also been discussed in other contexts.
For instance, ring doves �Streptopelia risoria� vocalize withJ. Acoust. Soc. Am., Vol. 124, No. 1, July 2008
a closed beak. They expel the air and phonate into an inflat-able esophagus during their coo-call production �Riede et al.,2004�. The inflated esophagus of the dove is likely to act asan amplifier as well as a bandpass filter �Fletcher et al.,2004�. A modeling study based on the Helmholtz resonatorclarified that the resonant frequency of the inflated cavity isdetermined mainly by the wall characteristics of the cavityand it is rather insensitive to the cavity size �Fletcher et al.,2004�. This enables the F0-resonance matching for a variablecavity size. Applying this idea to our inflatable cavity, wespeculate that the air sac resonance is mainly determined bythe wall characteristics of the bladder used in the experiment.
A large group of nonhuman primates with small air saccavities �100 ml and less� remains to be discussed. Phonationinto such a small cavity with a closed mouth situation prob-ably plays no role, since the capacity of the air impelled intothe sac is limited. Moreover, the connecting tube to those airsacs is relatively narrow �“less” than 10 mm in diameter��Starck and Schneider, 1960�. This narrow tube connection islikely to be insufficient to produce vocalizations with aclosed mouth, as our side branch experiments with smallinner diameter suggest. On the other hand, when the mouthis open, our closed tube-SB experiments demonstrate thatthere can be a positive effect of the narrow tube-SB on theSPL. These structures can thus help raise the SPL above thatof the basic vocal tract configuration. This kind of soundamplification can be expected if we may regard the small airsacs as a closed tube-SB. A quarter-wavelength resonanceshould be detected in the spectrum.
B. Formant deviation
It seems unlikely that an air sac �either inflatable or non-inflatable� alone is able to explain the severe formant devia-tions observed in nonhuman vocalizations. Our non-inflatable air sac models changed the first formant by up to72%, the second formant by up to 20%, and the higher for-mants less. In Diana monkey alarm calls, however, the firstand second formants are deviated from those of the uniformvocal tract by 23% and 60%, respectively �Riede et al.,2005�. The severe deviation observed in the second formantseems unlikely to be produced by the air sac. Although theair sacs have been suggested to be the main reason for thiseffect �Lieberman, 2006�, discontinuities in the nonhumanvocal tract are more likely to be the candidate �Riede et al.,2006�.
C. Nonlinear source-filter interaction and theefficiency of the sound source
The physical model of the vocal folds experienced lowerPTP and increased SPL after the main vocal tract was added.The vocal tract models with side branches or rigid cavitiesalso lowered PTP. Certain side branch models can decreasePTP even below that of the basic vocal tract configuration.This phenomenon is due to the nonlinear source-filter inter-action as explained by theoretical studies, which state thatPTP decreases as the inertive impedance of the vocal tractincreases �Titze, 2004a, 2004b� and which have been con-
firmed in other physical model experiments �Chan and Titze,Riede et al.: Acoustics of mammalian laryngeal air sacs 645

2006�. Given a similar basic design of the vocal fold sourceand the vocal tract filter, it is reasonable to assume the non-linear source-filter characteristics also in nonhuman mam-mals, just as in humans performing specific vocal exercises�Titze et al., 2008�.
Of particular interest is the region where F0 and vocaltract resonance �pole/zero pair� are in close proximity. Nearthis region, the vocal tract impedance is quite variable andmay produce dramatic changes in the source-filter interac-tion. This has been most impressively demonstrated here bythe low frequency pole/zero pair introduced by the cavity. Asthe cavity resonance crosses F0, the interaction becomes sostrong that the vocal folds stop vibrating. The experimentalresults suggest that the effect of the source-filter interactionis asymmetric about both sides of the filter resonance. Forinstance, SPL was higher when F0 was on the right side ofthe resonance than when it was on the left side �Fig. 7�. Thissuggests that a perfect matching between vocal tract reso-nance and F0 is not as desirable, as previously considered�e.g., Riede et al., 2006�, but F0 slightly off the resonance ismore beneficial for energy feedback to the sound source�Titze, 2008�.
Another positive effect on SPL was found in the experi-ments, possibly due to the additional pole/zero pair thatshifted the other formants in such a way that the fundamentalfrequency was located in a more beneficial range of the vocaltract impedance. More efficient energy feedback from thevocal tract to the sound source can make the sound overalllouder. This provides another possibility of increasing thesound level, besides the optimal radiation theory.
In general, nonlinear source-filter interaction can be in-duced by various resonant frequencies, which are not neces-sarily due to the air sacs. However, compared to a simplesituation of a vocal tract having no air sacs, the presence ofthe air sac gives rise to additional pole/zero pairs that mayproduce more areas of enhanced source production as well asmore areas of source instabilities.
Howler monkeys �Allouatinae� are the most prominentexamples with a large Bulla hyoidea �Starck and Schneider,1960; Schön-Ybarra, 1995�. It is interesting to note thathowler monkey vocalization is characterized by a sourcespectrum with many bifurcations �Whitehead, 1995�. Ourpreliminary investigation of those vocal utterances �unpub-lished data� suggests that source instabilities occur more of-ten in the howler monkeys than, for instance, in Japanesemacaques or chimpanzees which have an inflatable cavity�Riede et al., 1997, 2004b, 2007� or in dogs and cats whichpossess no air sacs �Riede et al., 1997, 2000�.
D. Advantages and disadvantages of possessing anair sac for vocal communication
To summarize our discussions, we have recognized twoacoustic effects of the air sacs. First, the air sac can increasethe dynamic range of the sound emission within a givensubglottic pressure range, both at the upper and lower limits.Second, vocal variability can be increased in the followingthree ways. �A� In the case of inflatable air sacs, open andclosed mouth situations enable a switch between different
radiation and filtering mechanisms. �B� In the case of non-646 J. Acoust. Soc. Am., Vol. 124, No. 1, July 2008
inflatable air sacs, they extend the frequency range, in whichvoice instability and nonlinear phenomena are induced bysource-tract coupling. This provides additional vocal vari-ability. �C� The formants of the main vocal tract are shiftedby a pole/zero pair introduced by air sac. Our experimentssuggest that such formant shifts are most prominent on thefirst formant and less on the higher formants.
The latter point leads to the question of why humans donot possess any major extensions of the vocal tract. All fourgreat apes do possess air sacs, but not humans. Obviously,humans developed a much more convenient way to alter for-mants, i.e., speech articulation through varying cross-sectional vocal tract area. For predominantly close-rangecommunications, such as human speech, of particular impor-tance are neither loudness nor vocal variability but a stablesound source and well articulated formants. In humanspeech, the fundamental frequency ranges between 100 and300 Hz �average male F0, 110 Hz; average female F0,220 Hz�. Among normal phonations of various vowels, theones which possess the first formant closest to F0 are Englishvowels /i/ �first formant, 300–400 Hz� and /u/ �first formant,280–350 Hz�. The first formants in both cases are still faraway from F0 in both sexes. If a pole/zero pair close to theF0 range was created by an air sac, this would interfere withF0 and could cause more voice instabilities in human voice.In this sense, the absence of air sacs in humans may beessential for maintaining a stable sound source.
ACKNOWLEDGMENTS
T.R. was supported by a short-term Postdoctoral Fellow-ship for North American and European Researchers by theJapan Society for the Promotion of Science �JSPS��PE06030� and by a Postdoctoral fellowship by the “Deut-sche Akademie der Naturforscher Leopoldina” �BMBF-LPD9901/8-127�. I.T.T. was supported by SCOPE �071705001�of Ministry of Internal Affairs and Communications �MIC�,Japan. J.B.M. and S.L.T. were supported in part by NIHGrant No. NIDCD R01 DC05788. For technical support, wethank Dr. Ishikawa. For many helpful discussions, we aregrateful to Professor Dang and Dr. Fujita.
Alipour, F., and Scherer, R. C. �1997�. “Effects of oscillation of a mechani-cal hemilarynx model on mean transglottal pressures and flows,” J.Acoust. Soc. Am. 110, 1562–1569.
Bartels, P. �1905�. “Über die Nebenräume der Kehlkopfhöhle,” Z. Morphol.Anthropol. 8, 11–61.
Causse, R., Kergomard, J., and Lurton, X. �1984�. “Input impedance of brassmusical instruments,” J. Acoust. Soc. Am. 75, 241–254.
Chan, R. W., Titze, I. R., and Titze, M. R. �1997�. “Further studies ofphonation threshold pressure in a physical model of the vocal fold mu-cosa,” J. Acoust. Soc. Am. 101, 3722–3727.
Chan, R. W., and Titze, I. R. �2006�. “Dependence of phonation thresholdpressure on vocal tract acoustics and vocal fold tissue mechanics,” J.Acoust. Soc. Am. 119, 2351–2362.
Dang, J., Honda, K., and Suzuki, H. �1994�. “Morphological and acousticalanalysis of the nasal and paranasal cavities,” J. Acoust. Soc. Am. 96,2088–2100.
Dang, J., and Honda, K. �1996�. “Acoustic characteristic of the human para-nasal sinuses derived from transmission characteristic measurement andmorphological observation,” J. Acoust. Soc. Am. 100, 3374–3383.
Dang, J., and Honda, K. �1997�. “Acoustic characteristics of the piriformfossain models and humans,” J. Acoust. Soc. Am. 101, 456–465.
Dang, J., Shadle, C. H., Kawanishi, Y., Honda, K., and Suzuki, H. �1998�.
Riede et al.: Acoustics of mammalian laryngeal air sacs

“An experimental study of the open end correction coefficient for sidebranches within an acoustic tube,” J. Acoust. Soc. Am. 104, 1075–1084.
Fant, G. �1960�. “Acoustic Theory of Speech Production,” 2nd ed. �Mouton,The Hague, The Netherlands�.
Flanagan, J. L. �1972�. Speech Analysis, Synthesis and Perception �Springer,Berlin�.
Fletcher, N. H., and Tarnopolsky, A. �1999�. “Acoustics of the avian vocaltract,” J. Acoust. Soc. Am. 105, 35–49.
Fletcher, N., Riede, T., Beckers, G. J. L., and Suthers, R. A. �2004�. “Vocaltract filtering and the ‘coo’ of doves,” J. Acoust. Soc. Am. 116, 3750–3756.
Frey, R., Gebler, A., and Fritsch, G. �2006�. “Arctic roars—laryngealanatomy and vocalization of the muskox �Ovibus moschatus Zimmer-mann, 1780, Bovidae�,” J. Zool. 268, 433–448.
Frey, R., Gebler, A., Fritsch, G., Nygren, K., and Weissengruber, G. E.�2007�. “Nordic rattle—the hoarse phonation and the inflatable laryngealair sac of reindeer �Rangifer tarandus�,” J. Anat. 210, 131–159.
Gautier, J. P. �1971�. “Etude morphologique et fonctionnelle des annexesextra-laryngées des cercopithecinae; liason avec les cris d’espacement,”Biol. Gabon. 7, 229–267.
Haimoff, E. H. �1981�. “Video analysis of Siamang �Hylobates syndactylus�songs,” Behaviour 76, 128–151.
Hayama, S. �1970�. “The Saccus larynges in Primates,” Journal of the An-thropological Society of Nippon. 78, 274–298.
Hill, W. C. O. and Booth, A. H. �1957�. “Voice and Larynx in African andAsian Colobidae,” J. Bombay Natural His. Soc. 54, 309–321.
Hillowala, R. A., and Lass, N. J. �1978�. “Spectrographic analysis of air sacresonance in rhesus monkeys,” Am. J. Phys. Anthropol. 49, 129–132.
Hirano, M., and Kakita, Y. �1985�. “Cover-body theory of vocal fold vibra-tion,” in Speech Science: Physiological Aspects, edited by R. Daniloff�College-Hill, San Diego, CA�, pp 1–46.
Hsiao, T., Solomon, N. P., Luschei, E. S., Titze, I. R., Kang, L., Fu, T., andHsu, M. �1994�. “Effect of subglottic pressure on fundamental frequencyof the canine larynx with active muscle tensions,” Ann. Otol. Rhinol.Laryngol. 103, 817–821.
Kurita, S., Nagata, K., and Hirano, M. �1983�. “A. comparative study of thelayer structure of the vocal fold,” in Vocal Fold Physiology: Contempo-rary Research and Clinical Issues, edited by D. M. Bless and J. H. Abbs�College-Hill, San Diego�, pp. 3–21.
Ishizaka, K., Matsudaira, M., and Kaneko, T. �1976�. “Input acoustic-impedance measurement of the subglottal system,” J. Acoust. Soc. Am. 60,190–197.
Lieberman, P. �2006�. “Limits on tongue deformation—Diana monkey for-mants and the impossible vocal tract shapes proposed by Riede et al.�2005�,” J. Hum. Evol. 50, 219–221.
Neubauer, J., Zhang, Z., Miraghaie, R., and Berry, D. A. �2007�. “Coherentstructures of the near field flow in a self-oscillating physical model of thevocal folds,” J. Acoust. Soc. Am. 121, 1102–1118.
Nishimura, T., Mikami, A., Suzuki, J., and Matsuzawa, T. �2007�. “Devel-opment of the laryngeal air sac in chimpanzees,” International Journal ofPrimatology 28, 483–492.
Ogura, Y. �1915�. “Beitraege zur Kenntnis des Kehlsackes des Rentieres,” J.Coll. Agr. Tohoku Imp. University, Sapporo 6, 151–155.
Rendall, D., Owren, M. J., and Rodman, P. S. �1998�. “The role of vocaltract filtering in identity cueing in rhesus monkey �Macaca mulatta� vo-calizations,” J. Acoust. Soc. Am. 103, 602–614.
Riede, T., Herzel, H., Mehwald, D., Seidner, W., Trumler, E., Böhme, G.,and Tembrock, G. �2000�. “Nonlinear phenomena and their anatomicalbasis in the natural howling of a female dog-wolf breed,” J. Acoust. Soc.Am. 108, 1435–1442.
Riede, T., Arcadi, A. C., and Owren, M. �2004b�. “Nonlinear acoustics inpant hoots of common chimpanzees �Pan troglodytes�: Frequency jumps,subharmonics, biphonation, and deterministic chaos,” Am. J. Primatol 64,277–291.
Riede, T. and Titze, I. R. �2008�. “Vocal fold elasticity of the Rocky Moun-
J. Acoust. Soc. Am., Vol. 124, No. 1, July 2008
tain elk �Cervus elaphus nelsoni� — producing high fundamental fre-quency vocalization with a very long vocal fold,” J. Exp. Biol. �in press�.
Riede, T., Arcadi, A. C., and Owren, M. J. �2007�. “Nonlinear acoustics inpant hoots and screams of common chimpanzees �Pan troglodytes�. Vo-calizing at the edge,” J. Acoust. Soc. Am. 121, 1758–1767.
Riede, T., Beckers, G. J. L., Blevins, W., and Suthers, R. A. �2004�. “Infla-tion of the esophagus and vocal tract filtering in ring doves,” J. Exp. Biol.207, 4025–4036.
Riede, T., Bronson, E., Hatzikirou, H., and Zuberbühler, K. �2005�. “Vocalproduction mechanisms in a non-human primate: Morphological data anda model,” J. Hum. Evol. 48, 85–96.
Riede, T., Bronson, E., Hatzikirou, H., and Zuberbühler, K. �2006�. “Mul-tiple discontinuities in nonhuman vocal tracts—A response to Lieberman�2006�,” J. Hum. Evol. 50, 222–225.
Riede, T., Suthers, R. A., Fletcher, N., and Blevins, W. �2006�. “Songbirdstune their vocal tract to the fundamental frequency of their song,” Proc.Natl. Acad. Sci. U.S.A. 103, 5543–5548.
Riede, T., Wilden, I., and Tembrock, G. �1997�. “Subharmonics, biphona-tions, and frequency jumps-common components of mammalian vocaliza-tion or indicators for disorders?” Z. Säugetierkunde �Suppl. II� 62, 198–203.
Scherer, R. C., Shinwari, D., DeWitt, K. J., Zhang, C., Kucinschi, B. R., andAfjeh, A. A. �2001�. “Intraglottal pressure profiles for a symmetric andoblique glottis with a divergence angle,” J. Acoust. Soc. Am. 109, 1616–1630.
Schneider, R. �1964�. “Der Larynx der Säugetiere �The larynx of mam-mals�,” Handbuch der Zoologie 5, 1–128.
Schön-Ybarra, M. �1995�. “A comparative approach to the non-human pri-mate vocal tract: Implications for sound production,” in Current Topics inPrimate Vocal Communication, edited by E. Zimmermann, J. D. Newman,and U. Juergens �Plenum, New York�, pp. 185–198.
Sohndi, M. M., and Schroeter, J. �1987�. “A hybrid time-frequency domainarticulatory speech synthesizer,” IEEE Trans. Acoust., Speech, Signal Pro-cess. 35, 955–967.
Starck, D., and Schneider, R. �1960�. “Respirationsorgane, Larynx,” Prima-tologia 3, 423–587.
Tembrock, G. �1974�. “Sound production in Hylobathes and Symphalan-gus,” in Gibbon and Siamang, edited by D. Rumbaugh �Karger, Basel�,Vol. 3, pp. 176–205.
Thomson, S. L., Mongeau, L., and Frankel, S. H. �2005�. “Aerodynamictransfer of energy to the vocal folds,” J. Acoust. Soc. Am. 118, 1689–1700.
Titze, I. R. �1988�. “The physics of small-amplitude oscillation of the vocalfolds,” J. Acoust. Soc. Am. 83, 1536–1552.
Titze, I. R., and Story, B. H. �1997�. “Acoustic interaction of the voicesource with the lower vocal tract,” J. Acoust. Soc. Am. 101, 2234–2243.
Titze, I. R., Schmidt, S. S., and Titze, M. R. �1995�. “Phonation thresholdpressure in a physical model of the vocal fold mucosa,” J. Acoust. Soc.Am. 97, 3080–3084.
Titze, I. R. �2004a�. “A theoretical study of F0-F1 interaction with applica-tion to resonant speaking and singing voice,” J. Voice 18, 292–298.
Titze, I. R. �2004b�. “Theory of glottal airflow and source-filter interactionin speaking and singing,” Acta Acust. 90, 641–648.
Titze, I. R. �2008�. “Nonlinear source-filter coupling in phonation: Theory,”J. Acoust. Soc. Am. 123, 2733–2749.
Titze, I. R., Riede, T., and Popollo, P. �2008�. “Nonlinear source-filter cou-pling in phonation: Vocal exercises,” J. Acoust. Soc. Am. 123, 1902–1915.
Whitehead, J. M. �1995�. “Vox Alouattinae: A preliminary survey of theacoustic characteristics of long-distance calls of howling monkeys,” Int J.Primatol. 16, 121–144.
Zhang, Z., Neubauer, J., and Berry, D. A. �2006a�. “The influence of sub-glottal acoustics on laboratory models of phonation,” J. Acoust. Soc. Am.120, 1558–1569.
Zhang, Z., Neubauer, J., and Berry, D. A. �2006b�. “Aerodynamically andacoustically driven modes of vibration in a physical model of the vocal
folds,” J. Acoust. Soc. Am. 120, 2841–2849.Riede et al.: Acoustics of mammalian laryngeal air sacs 647