malwarebytes multilayer performance testing (december 2014) · installing malwarebytes anti-malware...
TRANSCRIPT

Malwarebytes Multilayer Performance Testing
(December 2014)
Performance Benchmark Document: Malwarebytes Multilayer Performanc (December 2014) Authors: T.Rowling, D. Wren Company: PassMark Software Date: 23 December 2014 File: Malwarebytes_Multilayer_Performance.docx Edition 1

Malwarebytes Multilayer Performance PassMark Software
Performance Benchmark Page 2 of 23 23 December 2014
Table of Contents
TABLE OF CONTENTS ......................................................................................................................................... 2
REVISION HISTORY ............................................................................................................................................ 3
EXECUTIVE SUMMARY ...................................................................................................................................... 4
PRODUCT SCORES ............................................................................................................................................. 5
PRODUCTS AND VERSIONS ............................................................................................................................... 6
PERFORMANCE METRICS SUMMARY ................................................................................................................ 7
TEST RESULTS ................................................................................................................................................... 9
BENCHMARK 1 – INSTALLATION TIME .......................................................................................................................... 9
BENCHMARK 2 – INSTALLATION SIZE ......................................................................................................................... 10
BENCHMARK 3 – BOOT TIME ................................................................................................................................... 10
BENCHMARK 4 – BROWSE TIME ............................................................................................................................... 11
BENCHMARK 5 – FILE COPY, MOVE, AND DELETE (BINARY FILES) ................................................................................... 11
BENCHMARK 6 – FILE COPY, MOVE, AND DELETE (FILE FORMAT) ................................................................................... 12
BENCHMARK 7 – FILE COMPRESSION AND DECOMPRESSION (BINARY FILES) ..................................................................... 12
BENCHMARK 8 – FILE COMPRESSION AND DECOMPRESSION (FILE FORMAT) ..................................................................... 13
BENCHMARK 9 – FILE WRITE, OPEN, AND CLOSE ......................................................................................................... 14
BENCHMARK 10 – NETWORK THROUGHPUT (BINARY FILES) .......................................................................................... 15
BENCHMARK 11 – NETWORK THROUGHPUT (FILE FORMAT) .......................................................................................... 16
DISCLAIMER AND DISCLOSURE ....................................................................................................................... 17
CONTACT DETAILS .......................................................................................................................................... 17
APPENDIX 1 – TEST ENVIRONMENT ................................................................................................................ 18
APPENDIX 2 – METHODOLOGY DESCRIPTION ................................................................................................. 19

Malwarebytes Multilayer Performance PassMark Software
Performance Benchmark Page 3 of 23 23 December 2014
Revision History Rev Revision History Date
Edition 1 Initial version of this report. 18 December 2014

Malwarebytes Multilayer Performance PassMark Software
Performance Benchmark Page 4 of 23 23 December 2014
Executive Summary PassMark Software® conducted objective performance testing on seven (7) security software products, on
Windows 7 Ultimate Edition (64-bit) during December 2014. This report presents our results and findings as a
result of performance benchmark testing conducted for these endpoint security products.
The aim of this report is to compare the performance impact of Malwarebytes Anti-Malware when installing it in
conjunction with another security product on the same system. Each test was performed with a single product
installed and then repeated after installing Malwarebytes Anti-Malware in conjunction with that product.
Testing was performed on all products using eleven (11) performance metrics. These performance metrics are as
follows.
Installation Time;
Installation Size;
Boot Time;
Browse Time;
File Copy, Move, and Delete (Binary Files – EXE, SYS, DLL, etc);
File Copy, Move, and Delete (File Format Files – PDF, DOC, PPT, XLS, etc);
File Compression and Decompression (Binary Files – EXE, SYS, DLL, etc);
File Compression and Decompression (File Format Files – PDF, DOC, PPT, XLS, etc);
File Write, Open, and Close;
Network Throughput (Binary Files – EXE, SYS, DLL, etc);
Network Throughput (File Format Files – PDF, DOC, PPT, XLS, etc);

Malwarebytes Multilayer Performance PassMark Software
Performance Benchmark Page 5 of 23 23 December 2014
Product Scores
As products were not being compared against each other an overall score for each product was not calculated.
Instead, the below graphs show the difference when running the tests on the system with a single product
installed and when running the tests on the same system after installing Malwarebytes Anti-Malware in
conjunction with that product.

Malwarebytes Multilayer Performance PassMark Software
Performance Benchmark Page 6 of 23 23 December 2014
Products and Versions
For each security product we have tested these versions.
Manufacturer Product Name Product Version
Malwarebytes Malwarebytes Anti-Malware for Business 1.75.0.13
ESET ESET Endpoint Security 5.0.2229.1
Kaspersky Lab Kaspersky Endpoint Security 10.2.1.23
McAfee, Inc. McAfee Endpoint Protection Suite
Agent 4.8.0.1500
VirusScan 8.8.0.1247
Microsoft Corporation Microsoft System Center Endpoint Protection
AntiMalware 4.3.220
Engine 1.1.11202.0
Sophos Sophos Endpoint Security Antivirus 5.2.2
Symantec Symantec Endpoint Protection 12.1.5 build
5337
Trend Micro Trend Micro OfficeScan Endpoint Protection 11.0.1028

Malwarebytes Multilayer Performance PassMark Software
Performance Benchmark Page 7 of 23 23 December 2014
Performance Metrics Summary
We have selected a set of objective metrics which provide a comprehensive and realistic indication of the areas
in which endpoint protection products may impact system performance for end users. Our metrics test the
impact of the software on common tasks that end-users would perform on a daily basis.
All of PassMark Software’s test methods can be replicated by third parties using the same environment to obtain
similar benchmark results. Detailed descriptions of the methodologies used in our tests are available as
“Appendix 2 – Methodology Description” of this report.
Benchmark 1 – Installation Time
The speed and ease of the installation process will strongly influence the user’s first impression of the security
software. This test measures the installation time required by the security software to be fully functional and
ready for use by the end user. Lower installation times represent security products which are quicker for a user
to install.
Benchmark 2 – Installation Size
In offering new features and functionality to users, security software products tend to increase in size with each
new release. Although new technologies push the size limits of hard drives each year, the growing disk space
requirements of common applications and the increasing popularity of large media files (such as movies, photos
and music) ensure that a product's installation size will remain of interest to home users.
This metric aims to measure a product’s total installation size. This metric is defined as the total disk space
consumed by all new files added during a product's installation.
Benchmark 3 – Boot Time
This metric measures the amount of time taken for the machine to boot into the operating system. Security
software is generally launched at Windows startup, adding an additional amount of time and delaying the
startup of the operating system. Shorter boot times indicate that the application has had less impact on the
normal operation of the machine.
Benchmark 6 – Browse Time
It is common behavior for security products to scan data for malware as it is downloaded from the internet or
intranet. This behavior may negatively impact browsing speed as products scan web content for malware. This
metric measures the time taken to browse a set of popular internet sites to consecutively load from a local
server in a user’s browser window.
Benchmark 7 & 8 – File Copy, Move, and Delete
This metric measures the amount of time taken to copy, move and delete a sample sets of files, this test was run
twice on two different sample sets;
Binary Files – Common binary system files (EXE, SYS, DLL, etc)
File format - Common document and media files (PDF, JPG, DOC, MP3, AVI etc).

Malwarebytes Multilayer Performance PassMark Software
Performance Benchmark Page 8 of 23 23 December 2014
Benchmark 9 & 10 – File Compression and Decompression
This metric measures the amount of time taken to compress and decompress different types of files. This test
was run twice on two different sample sets;
Binary Files – Common binary system files (EXE, SYS, DLL, etc)
File format - Common document and media files (PDF, JPG, DOC, MP3, AVI etc).
Benchmark 11 – File Write, Open, and Close
This benchmark was derived from Oli Warner’s File I/O test at http://www.thepcspy.com (please see Reference
#1: What Really Slows Windows Down). This metric measures the amount of time taken to write a file, then
open and close that file.
Benchmark 12 & 13 – Network Throughput
The metric measures the amount of time taken to download a variety of files from a local server using the
HyperText Transfer Protocol (HTTP), which is the main protocol used on the web for browsing, linking and data
transfer. This test was run twice on two different sample sets;
Binary Files – Common binary system files (EXE, SYS, DLL, etc)
File format - Common document and media files (PDF, JPG, DOC, MP3, AVI etc).

Malwarebytes Multilayer Performance PassMark Software
Performance Benchmark Page 9 of 23 23 December 2014
Test Results
Each test was run once with a single product installed and then repeated after installing Malwarebytes Anti-
Malware for Business (MBAM).
In the following charts, we have presented the results before (highlighted in green) and after (highlighted in red)
installing Malwarebytes Anti-Malware in conjunction with each product listed. The total performance impact of
installing both products is the sum of the before (green) and after (red) measurements.
The first entry in each chart is the Malwarebytes Anti-Malware result with no other product installed.
Where there was no measureable difference, or a negative value (the test results were faster after installing
Malwarebytes Anti-Malware) we have used a ‘0’ value to represent no change, these are noted for each chart.
Benchmark 1 – Installation Time
The following chart compares the minimum installation time in seconds it takes for endpoint security products to
be fully functional and ready for use by the end user.
564.50
172.50
201.79
121.40
136.20
283.00
129.90
39.00
152.30
71.50
50.80
49.50
36.50
29.00
25.30
0 s 100 s 200 s 300 s 400 s 500 s 600 s 700 s 800 s
Sophos & MBAM
Trend Micro & MBAM
ESET & MBAM
Microsoft & MBAM
Kaspersky & MBAM
Symantec & MBAM
McAfee & MBAM
MBAM

Malwarebytes Multilayer Performance PassMark Software
Performance Benchmark Page 10 of 23 23 December 2014
Benchmark 2 – Installation Size
The following chart compares for the total size of files added during the installation of endpoint security
products before and after Malwarebytes Anti-Malware is installed as an additional layered protection.
Benchmark 3 – Boot Time
The following chart compares the average time taken in seconds for the system to boot (from a sample of five
boots) for each endpoint security product before and after Malwarebytes Anti-Malware is installed as an
additional layered protection.
* These products recorded no change or an improvement in the test after installing Malwarebytes Anti-Malware
2106.34
272.15
1290.04
765.33
573.06
374.78
566.50
24.19
26.46
25.05
24.07
23.61
23.57
23.56
23.55
0 MB 500 MB 1,000 MB 1,500 MB 2,000 MB 2,500 MB
Sophos & MBAM
Symantec & MBAM
Kaspersky & MBAM
McAfee & MBAM
Trend Micro & MBAM
ESET & MBAM
Microsoft & MBAM
MBAM
35.17
36.69
32.46
37.76
48.30
51.62
44.67
31.83
13.76
11.19
10.58
1.10
*
*
*
0 s 10 s 20 s 30 s 40 s 50 s 60 s
Trend Micro & MBAM
Sophos & MBAM
ESET & MBAM
McAfee & MBAM
Microsoft & MBAM
Kaspersky & MBAM
Symantec & MBAM
MBAM

Malwarebytes Multilayer Performance PassMark Software
Performance Benchmark Page 11 of 23 23 December 2014
Benchmark 4 – Browse Time
The following chart compares the minimum time taken in seconds for Internet Explorer to successively load a set
of popular websites through the local area network from a local server machine for each endpoint security
product before and after Malwarebytes Anti-Malware is installed as an additional layered protection.
* These products recorded no change or an improvement in the test after installing Malwarebytes Anti-Malware
Benchmark 5 – File Copy, Move, and Delete (Binary Files)
The following chart compares the average time taken in seconds to copy, move and delete several sets of sample
files for each endpoint security product before and after Malwarebytes Anti-Malware is installed as an additional
layered protection.
* These products recorded no change or an improvement in the test after installing Malwarebytes Anti-Malware
22.69
25.59
24.33
26.02
23.50
23.59
28.63
23.50
*
*
*
*
*
*
*
0 s 5 s 10 s 15 s 20 s 25 s 30 s 35 s
Sophos & MBAM
Trend Micro & MBAM
ESET & MBAM
McAfee & MBAM
Microsoft & MBAM
Symantec & MBAM
Kaspersky & MBAM
MBAM
20.72
10.72
20.62
9.15
10.87
15.28
11.85
10.78
2.67
2.03
1.44
0.65
0.56
0.04
*
0 s 5 s 10 s 15 s 20 s 25 s
Microsoft & MBAM
Symantec & MBAM
ESET & MBAM
Sophos & MBAM
McAfee & MBAM
Trend Micro & MBAM
Kaspersky & MBAM
MBAM

Malwarebytes Multilayer Performance PassMark Software
Performance Benchmark Page 12 of 23 23 December 2014
Benchmark 6 – File Copy, Move, and Delete (File format)
The following chart compares the average time taken in seconds to copy, move and delete several sets of sample
files for each endpoint security product before and after Malwarebytes Anti-Malware is installed as an additional
layered protection.
* These products recorded no change or an improvement in the test after installing Malwarebytes Anti-Malware
Benchmark 7 – File Compression and Decompression (Binary files)
The following chart compares the average time it takes in seconds for sample files to be compressed and
decompressed for each endpoint security product before and after Malwarebytes Anti-Malware is installed as an
additional layered protection.
15.59
10.36
10.97
11.44
11.18
12.98
9.64
10.09
1.98
0.53
0.47
0.39
*
*
*
0 s 2 s 4 s 6 s 8 s 10 s 12 s 14 s 16 s 18 s 20 s
Trend Micro & MBAM
Symantec & MBAM
McAfee & MBAM
Kaspersky & MBAM
ESET & MBAM
Microsoft & MBAM
Sophos & MBAM
MBAM
23.56
16.32
16.63
17.74
18.91
17.09
16.46
16.89
2.32
1.40
1.27
1.26
0.88
0.57
0.55
0 s 5 s 10 s 15 s 20 s 25 s 30 s
Microsoft & MBAM
McAfee & MBAM
Kaspersky & MBAM
Trend Micro & MBAM
ESET & MBAM
Symantec & MBAM
Sophos & MBAM
MBAM
Malwarebytes Multilayer Performance PassMark Software
Performance Benchmark Page 13 of 23 23 December 2014
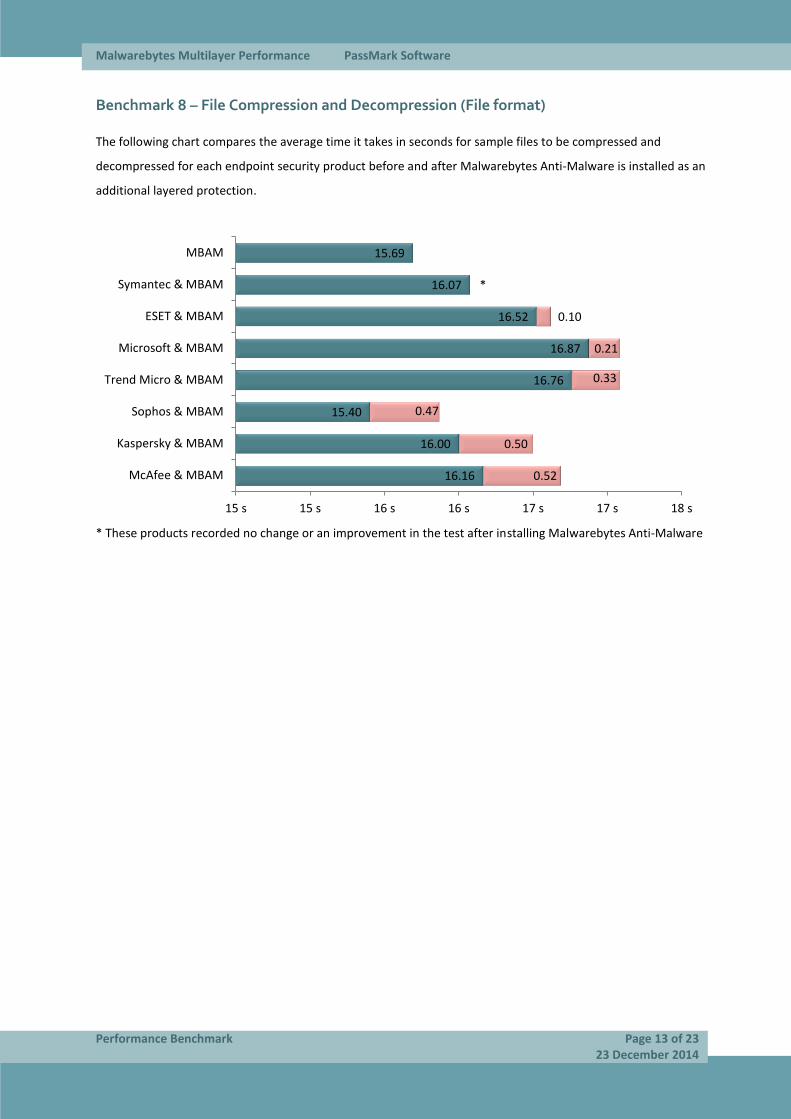
Benchmark 8 – File Compression and Decompression (File format)
The following chart compares the average time it takes in seconds for sample files to be compressed and
decompressed for each endpoint security product before and after Malwarebytes Anti-Malware is installed as an
additional layered protection.
* These products recorded no change or an improvement in the test after installing Malwarebytes Anti-Malware
16.16
16.00
15.40
16.76
16.87
16.52
16.07
15.69
0.52
0.50
0.47
0.33
0.21
0.10
*
15 s 15 s 16 s 16 s 17 s 17 s 18 s
McAfee & MBAM
Kaspersky & MBAM
Sophos & MBAM
Trend Micro & MBAM
Microsoft & MBAM
ESET & MBAM
Symantec & MBAM
MBAM

Malwarebytes Multilayer Performance PassMark Software
Performance Benchmark Page 14 of 23 23 December 2014
Benchmark 9 – File Write, Open, and Close
The following chart compares the average time it takes in seconds for a file to be written to the hard drive then
opened and closed 180,000 times, for each endpoint security product before and after Malwarebytes Anti-
Malware is installed as an additional layered protection.
The Microsoft and Malwarebytes Anti-Malware results below have been separated into an individual chart due
to the scale difference.
* These products recorded no change or an improvement in the test after installing Malwarebytes Anti-Malware
70.85
16.14
6.45
20.08
28.77
125.18
10.29
5.36
0.25
0.06
0.02
0.02
*
0 s 20 s 40 s 60 s 80 s 100 s 120 s
ESET & MBAM
Kaspersky & MBAM
Sophos & MBAM
Symantec & MBAM
McAfee & MBAM
Trend Micro & MBAM
MBAM
327.5 2.31
0 s 50 s 100 s 150 s 200 s 250 s 300 s 350 s
Microsoft & MBAM

Malwarebytes Multilayer Performance PassMark Software
Performance Benchmark Page 15 of 23 23 December 2014
Benchmark 10 – Network Throughput (Binary files)
The following chart compares the average time in seconds to download a sample set of common file types for
each endpoint security product before and after Malwarebytes Anti-Malware is installed as an additional layered
protection.
The ESET and Malwarebytes Anti-Malware results below have been separated into an individual chart due to the
scale difference.
* These products recorded no change or an improvement in the test after installing Malwarebytes Anti-Malware
14.38
16.24
18.22
11.68
11.96
15.86
11.63
1.37
0.78
0.59
0.48
*
*
0 s 2 s 4 s 6 s 8 s 10 s 12 s 14 s 16 s 18 s 20 s
Kaspersky & MBAM
Microsoft & MBAM
Trend Micro & MBAM
McAfee & MBAM
Sophos & MBAM
Symantec & MBAM
MBAM
1,230.44 *
0 s 200 s 400 s 600 s 800 s 1,000 s 1,200 s 1,400 s
ESET & MBAM

Malwarebytes Multilayer Performance PassMark Software
Performance Benchmark Page 16 of 23 23 December 2014
Benchmark 11 – Network Throughput (File format)
The following chart compares the average time in seconds to download a sample set of common file types for
each endpoint security product before and after Malwarebytes Anti-Malware is installed as an additional layered
protection.
* These products recorded no change or an improvement in the test after installing Malwarebytes Anti-Malware
20.89
13.30
17.06
13.95
13.82
15.87
47.34
13.52
1.42
0.80
0.08
0.08
0.02
*
*
0 s 5 s 10 s 15 s 20 s 25 s 30 s 35 s 40 s 45 s 50 s
Trend Micro & MBAM
Microsoft & MBAM
Kaspersky & MBAM
McAfee & MBAM
Sophos & MBAM
Symantec & MBAM
ESET & MBAM
MBAM

Malwarebytes Multilayer Performance PassMark Software
Performance Benchmark Page 17 of 23 23 December 2014
Disclaimer and Disclosure
This report only covers versions of products that were available at the time of testing. The tested versions are as
noted in the “Products and Versions” section of this report. The products we have tested are not an exhaustive
list of all products available in these very competitive product categories.
Disclaimer of Liability
While every effort has been made to ensure that the information presented in this report is accurate, PassMark
Software Pty Ltd assumes no responsibility for errors, omissions, or out-of-date information and shall not be
liable in any manner whatsoever for direct, indirect, incidental, consequential, or punitive damages resulting
from the availability of, use of, access of, or inability to use this information.
Disclosure
Malwarebytes funded the production of this report. The list of products tested and the metrics included in the
report were selected by Malwarebytes.
Trademarks
All trademarks are the property of their respective owners.
Contact Details
PassMark Software Pty Ltd
Suite 202, Level 2
35 Buckingham St.
Surry Hills, 2010
Sydney, Australia
Phone + 61 (2) 9690 0444
Fax + 61 (2) 9690 0445
Web www.passmark.com
Malwarebytes Multilayer Performance PassMark Software
Performance Benchmark Page 18 of 23 23 December 2014
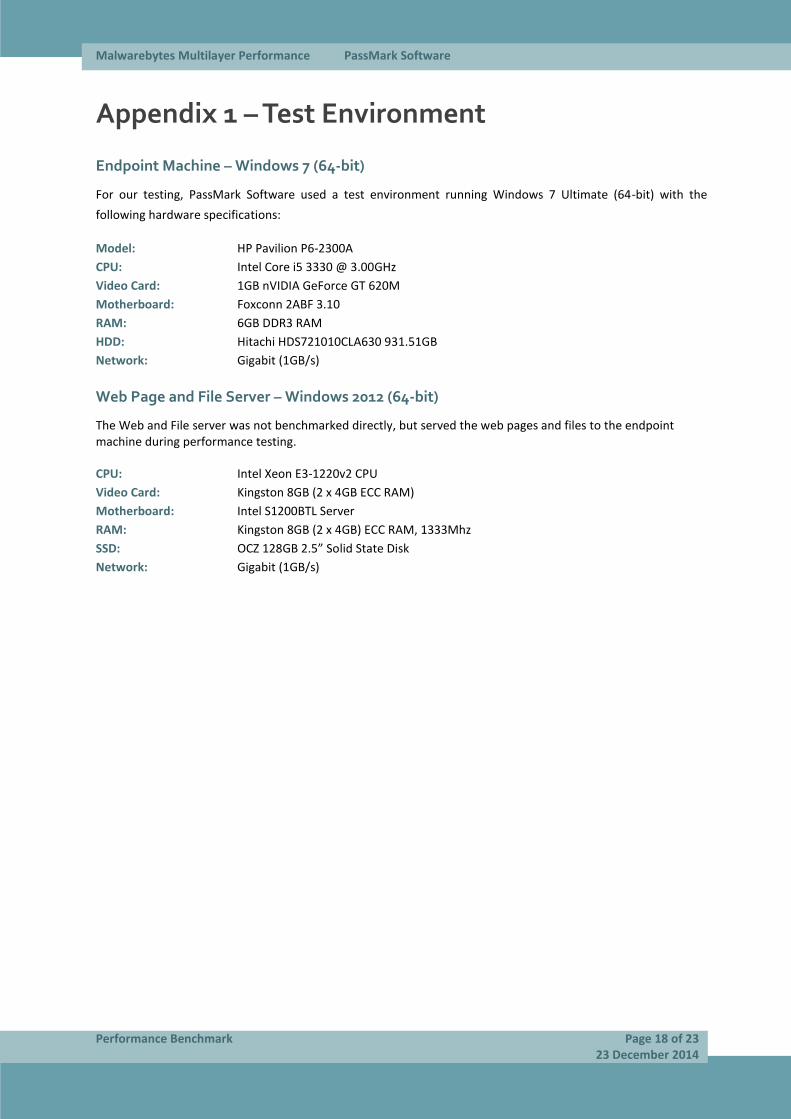
Appendix 1 – Test Environment
Endpoint Machine – Windows 7 (64-bit)
For our testing, PassMark Software used a test environment running Windows 7 Ultimate (64-bit) with the
following hardware specifications:
Model: HP Pavilion P6-2300A
CPU: Intel Core i5 3330 @ 3.00GHz
Video Card: 1GB nVIDIA GeForce GT 620M
Motherboard: Foxconn 2ABF 3.10
RAM: 6GB DDR3 RAM
HDD: Hitachi HDS721010CLA630 931.51GB
Network: Gigabit (1GB/s)
Web Page and File Server – Windows 2012 (64-bit)
The Web and File server was not benchmarked directly, but served the web pages and files to the endpoint machine during performance testing.
CPU: Intel Xeon E3-1220v2 CPU
Video Card: Kingston 8GB (2 x 4GB ECC RAM)
Motherboard: Intel S1200BTL Server
RAM: Kingston 8GB (2 x 4GB) ECC RAM, 1333Mhz
SSD: OCZ 128GB 2.5” Solid State Disk
Network: Gigabit (1GB/s)

Malwarebytes Multilayer Performance PassMark Software
Performance Benchmark Page 19 of 23 23 December 2014
Appendix 2 – Methodology Description
Windows 7 Image Creation
As with testing on Windows Vista, Norton Ghost was used to create a “clean” baseline image prior to testing.
Our aim is to create a baseline image with the smallest possible footprint and reduce the possibility of variation
caused by external operating system factors.
The baseline image was restored prior to testing of each different product. This process ensures that we install
and test all products on the same, “clean” machine.
The steps taken to create the base Windows 7 image are as follows:
1. Installation and activation of Windows 7 Ultimate Edition.
2. Disabled Automatic Updates.
3. Changed User Account Control settings to “Never Notify”.
4. Disable Windows Defender automatic scans to avoid unexpected background activity.
5. Disable the Windows firewall to avoid interference with security software.
6. Installed Norton Ghost for imaging purposes.
7. Disabled Superfetch to ensure consistent results.
8. Installed HTTP Watch for Browse Time testing.
9. Installed Windows Performance Toolkit x64 for Boot Time testing.
10. Installed Active Perl for interpretation of some test scripts.
11. Install OSForensics for testing (Installation Size test) purposes.
12. Disabled updates, accelerators and compatibility view updates in Internet Explorer 8.
13. Update to Windows Service Pack 1
14. Created a baseline image using Norton Ghost.
Benchmark 1 – Installation Time
This test measures the minimum Installation Time a product requires to be fully functional and ready for use by
the end user. Installation time can usually be divided in three major phases:
The Extraction and Setup phase consists of file extraction, the EULA prompt, product activation and user
configurable options for installation.
The File Copy phase occurs when the product is being installed; usually this phase is indicated by a progress
bar.
The Post-Installation phase is any part of the installation that occurs after the File Copy phase. This phase
varies widely between products; the time recorded in this phase may include a required reboot to finalize the
installation or include the time the program takes to become idle in the system tray.
To reduce the impact of disk drive variables, each product was copied to the Desktop before initializing
installation. Each step of the installation process was manually timed with a stopwatch and recorded in as much
detail as possible. Where input was required by the end user, the stopwatch was paused and the input noted in
the raw results in parenthesis after the phase description.

Malwarebytes Multilayer Performance PassMark Software
Performance Benchmark Page 20 of 23 23 December 2014
Where possible, all requests by products to pre-scan or post-install scan were declined or skipped. Where it was
not possible to skip a scan, the time to scan was included as part of the installation time. Where an optional
component of the installation formed a reasonable part of the functionality of the software, it was also installed
(e.g. website link checking software as part of a Security Product).
Installation time includes the time taken by the product installer to download components required in the
installation. This may include mandatory updates or the delivery of the application itself from a download
manager. We have noted in our results where a product has downloaded components for product installation.
We have excluded product activation times due to network variability in contacting vendor servers or time taken
in account creation. For all products tested, the installation was performed directly on the endpoint, either using
a standalone installation package or via the management server web console.
Benchmark 2 – Installation Size
A product's Installation Size was previously defined as the difference between the initial snapshot of the Disk
Space (C: drive) before installation and the subsequent snapshot taken after the product is installed on the
system. Although this is a widely used methodology, we noticed that the results it yielded were not always
reproducible in Vista due to random OS operations that may take place between the two snapshots. We
improved the Installation Size methodology by removing as many Operating System and disk space variables as
possible.
Using PassMark’s OSForensics 2.2 we created initial and post-installation disk signatures for each product. These
disk signatures recorded the amount of files and directories, and complete details of all files on that drive
(including file name, file size, checksum, etc) at the time the signature was taken.
The initial disk signature was taken immediately prior to installation of the product. A subsequent disk signature
was taken immediately following a system reboot after product installation. Using OSForensics, we compared
the two signatures and calculated the total disk space consumed by files that were new, modified, and deleted
during product installation. Our result for this metric reflects the total size of all newly added files during
installation.
The scope of this metric includes only an ‘out of the box’ installation size for each product. Our result does not
cover the size of files downloaded by the product after its installation (such as engine or signature updates), or
any files created by system restore points, pre-fetch files and other temporary files.
Benchmark 3 – Boot Time
PassMark Software uses tools available from the Windows Performance Toolkit version 4.6 (as part of the
Microsoft Windows 7 SDK obtainable from the Microsoft Website) with a view to obtaining more precise and
consistent boot time results on the Windows 7 platform.
The boot process is first optimized with xbootmgr.exe using the command “xbootmgr.exe -trace boot –
prepSystem” which prepares the system for the test over six optimization boots. The boot traces obtained from
the optimization process are discarded.
After boot optimization, the benchmark is conducted using the command "xbootmgr.exe -trace boot -numruns
5”. This command boots the system five times in succession, taking detailed boot traces for each boot cycle.

Malwarebytes Multilayer Performance PassMark Software
Performance Benchmark Page 21 of 23 23 December 2014
Finally, a post-processing tool was used to parse the boot traces and obtain the BootTimeViaPostBoot value. This
value reflects the amount of time it takes the system to complete all (and only) boot time processes. Our final
result is an average of five boot traces.
Benchmark 4 – Browse Time
We used a script in conjunction with HTTPWatch (Basic Edition, version 9.1.13.0) to record the amount of time it
takes for a set of 106 ‘popular’ websites to load consecutively from a local server. This script feeds a list of URLs
into HTTPWatch, which instructs the browser to load pages in sequence and monitors the amount of time it
takes for the browser to load all items on one page.
For this test, we have used Internet Explorer 11 (11.0.9600.16476) as our browser.
The set of websites used in this test include front pages of high traffic pages. This includes shopping, social,
news, finance and reference websites.
The Browse Time test is executed five times and our final result is the minimum of these five samples. The local
server is restarted between different products and one initial ‘test’ run is conducted prior to testing to install
Adobe Flash Player, an add-on which is used by many popular websites.
Benchmarks 5-11 – Real-Time Performance
We used a single script in testing Benchmarks 6-12. The script consecutively executes tests for Benchmarks 10-
13. The script times each phase in these benchmarks using CommandTimer.exe and appends results to a log file.
Benchmarks 5 &6 – File Copy, Move, and Delete
This test measures the amount of time required for the system to copy, move and delete samples of files in
various file formats.
Binary Set
This sample was made up of 588 files over 423,759,030 bytes and can be categorized as documents [32% of
total] and media files [68% of total]
File Format Set
This sample was made up of 559 files over 423,768,758 bytes and can be categorized as PE files (i.e. System Files)
100%.
File format Number Size (bytes)
EXE 85 57,785,508
DLL 390 328,727,832
AX 2 36,864
CPL 4 4,218,880
CPX 4 8,768
DRV 21 517,600
ICO 2 215,240

Malwarebytes Multilayer Performance PassMark Software
Performance Benchmark Page 22 of 23 23 December 2014
MSC 2 83,174
NT 2 3,376
ROM 4 73,222
SCR 4 4,500,480
SYS 27 27,183,378
TLB 6 271,160
TSK 2 2,304
UCE 2 45,968
COM 1 18,944
XML 1 76,060
Total 559 423,768,758
The breakdown of the main file types, file numbers and total sizes of the files in the sample set is shown in the
following table:
File format Number Size (bytes)
DOC 7 30,278,144
DOCX 4 13,522,409
PPT 3 5,769,216
PPTX 3 4,146,421
XLS 4 2,660,352
XLSX 4 1,426,054
PDF 73 136,298,049
JPG 351 31,375,259
GIF 6 148,182
MOV 7 57,360,371
RM 1 5,658,646
AVI 8 78,703,408
WMV 5 46,126,167
MP3 28 191,580,387
Total 504 605,053,065
This test was conducted five times to obtain the average time to copy, move and delete the sample files, with
the test machine rebooted between each sample to remove potential caching effects.

Malwarebytes Multilayer Performance PassMark Software
Performance Benchmark Page 23 of 23 23 December 2014
Benchmark 7 & 8 – File Compression and Decompression
This test measured the amount of time required to compress and decompress a sample set of files. For this test,
we used a subset of the media and documents files used in the File Copy, Move, and Delete benchmark.
CommandTimer.exe recorded the amount of time required for 7zip.exe to compress the files into a *.zip and
subsequently decompress the created *.zip file.
This test uses the same ‘Binary’ and ‘File format’ data sets as the ‘File Copy, Move and Delete’ benchmark.
This test was conducted five times to obtain the average file compression and decompression speed, with the
test machine rebooted between each sample to remove potential caching effects.
Benchmark 9 – File Write, Open, and Close
This benchmark was derived from Oli Warner’s File I/O test at http://www.thepcspy.com (please see Reference
#1: What Really Slows Windows Down).
For this test, we developed OpenClose.exe, an application that looped writing a small file to disk, then opening
and closing that file. CommandTimer.exe was used to time how long the process took to complete 180,000
cycles.
This test was conducted five times to obtain the average file writing, opening and closing speed, with the test
machine rebooted between each sample to remove potential caching effects.
Benchmark 10 & 11 – Network Throughput
This benchmark measured how much time was required to download a sample set of binary files of various sizes
and types over a 100MB/s network connection. The files were hosted on a server machine running Windows
Server 2012 and IIS 7. CommandTimer.exe was used in conjunction with GNU Wget (version 1.10.1) to time and
conduct the download test.
This test uses the same ‘Binary’ and ‘File format’ data sets as the ‘File Copy, Move and Delete’ benchmark.
This test was conducted five times to obtain the average time to download this sample of files, with the test
machine rebooted between each sample to remove potential caching effects.