malnutrition in adolescents & children · • time of rapid developmental change at multiple...
TRANSCRIPT

Malnutrition in Adolescents & Children: The Hidden Deficiencies
Dr. Omar Obeid
The 2nd Gulf conference on Nutrition of Children and Adolescents
Sharjeh, UAE23-25 April , 2012

• Puberty onset
• Changes in body composition
• Physical activity
• Onset of menstruation in girls
American Academy of Pediatrics. Pediatrics 1999; 103:516-20
Factors affecting normal nutritional needs
ñ In body fat
ñ In fat-free mass
ñ In bone mass

• Time of rapid developmental change at multiple levels.
• Nutrient needs greater as compared to any other period after birth.
• Failure to consume an adequate diet can disrupt normal growth and development
American Academy of Pediatrics. Pediatrics 1999; 103:516-20
Children & Adolescence

Mineral
Average for age 10-20yr (mg)
At peak of growth spurt period (mg)
Male Female Male Female
Calcium 210 110 400 240
Iron 0.57 0.23 1.1 0.9
Nitrogen 320 160 610 360
Zinc 0.27 0.18 0.50 0.31
Magnesium 4.4 2.3 8.4 5.0
Food and Nutrition Board, Institute of Medicine. Iron. In: Dietary Reference Intakes for Vitamin A, Vitamin K, Arsenic, Boron, Chromium, Copper, Iodine, Iron, Manganese, Molybdenum, Nickel, Silicon, Vanadium and Zinc. Washington, DC: National Academy Press, 2000
Daily increments in body content due to growth


Followed the skeletal maturational progress of 30 undernourished and 30 well-nourished girls.From early childhood to early adulthood
30 undernourished 30 well-nourished
•Delayed onset of menarche by 24 months & height spurt
•Prolonged growth periodDreizen S et al. J Pediatr 1967; 70: 256-63
The tempo of growth is slower in undernourished adolescent populations
Dreizen S et al. J Pediatr 1967; 70: 256-63

• In developing countries iron requirements of adolescents are greater due to:– infectious diseases & parasitic infections that
can cause iron loss– low bio-availability of iron from diets.
• Low calcium intake in early life may account for as much as 50% of the difference in hip fracture rates in postmenopausal years
Brabin and Brabin, Am J Clin Nutr l992;55:955-8.
Minerals

•The associations between:– intakes of the primary food and beverage sources of added sugars and –intakes of key nutrients and food pyramid groups among U.S. children aged 6–17 years.
•The nationally representative sample (n=3038) included children age 6–11 (n =1913) and adolescents age 12–17 (n=1125).
Frary CD et al. Journa l of Adolescent Health 2004; 34:56–63
Children and Adolescents’ Choices of Foods & Beverages

Frary CD et al. Journal of Adolescent Health 2004; 34:56–63
a, b, c, d means in row with different superscripts are sign. different (P < 0.05)
•ò Calcium intake
•ò Iron intake
•ñ Saturated fat
•ò Servings of fruits and vegetables
•ò Servings of dairy products
Measures of Diet Quality by Consumption Level of Sugar-Sweetened Beverages

Frary CD et al. Journal of Adolescent Health 2004; 34:56–63
a, b, c, d means in row with different superscripts are sign. different (P < 0.05)
•ñ Calcium intake
•ò Saturated fat
•ñ Servings of dairy products
Measures of Diet Quality by Consumption Level of Sweetened Dairy Products

Frary CD et al. Journal of Adolescent Health 2004; 34:56–63
•Consumption of sweetened dairy foods had a positive impact on the diet quality of U.S. children and adolescents
•Sugar sweetened beverages & sugars and sweets had a negative impact.
Children and Adolescents’ Choices of Foods & Beverages

• Cross-sectional study
– 460 9th- & 10th-grade girls
– Completed a self-administered questionnaire relating to their physical activities and personal and behavioral practices.
Wyshak, G. Arch Pediatr Adolesc Med. 2000;154:610-613
Teenaged Girls, Carbonated Beverage Consumption and Bone Fractures

Wyshak, G. Arch Pediatr Adolesc Med. 2000;154:610-613
All girls, OR(95% CL)
P Active, OR(95% CL)
P Less Active, OR(95% CL)
P
A: Drink carbonated beverages
Some/None
3.14 (1.45, 6.78)
0.004 2.78 (0.90, 8.62)
0.08 3.28 (1.13, 9.54)
0.03
B: Drink colasSome/None
2.01 (1.17, 3.43)
0.011 4.94 (1.79, 13.62)
0.002 1.16(0.60, 2.24)
0.66
C: DrinkNone Noncolas Colas Both
1.00 (. . .)2.48 (0.97,6.34)2.70 (1.30, 5.60)3.68 (1.58, 8.53)
0.060.0080.002
1.00 (. . .)0.43 (0.05, 4.22)2.83 (0.87, 9.23)7.00 (2.00, 24.45)
0.470.08
0.002
1.00 (. . .)4.27 (1.40,13.07)2.46 (0.97, 6.24)1.31 (0.34, 5.04)
0.010.060.69
For less active girls: marginal association between carbonated cola beverages and bone fractures.
For active girls: highest risk of bone fractures when consuming both cola and noncola drinks
Odds Ratios for the Association of Carbonated Beverage Consumption and
Bone Fractures in Teenaged girls

Huerta MG et al. Diabetes Care 28:1175–1181, 2005
Magnesium Deficiency Is Associated WithInsulin Resistance in Obese Children
48 childrenaged 8–17 yrs48 children
aged 8–17 yrs
24 obese nondiabetic(BMI ≥ 85th percentile)24 obese nondiabetic
(BMI ≥ 85th percentile)24 lean control subjects(BMI <85th percentile)
24 lean control subjects(BMI <85th percentile)

Serum magnesium & adiposity• Serum Mg was inversely associated with:Ø Adiposity as measured by BMI
(rs = -0.44 [95% CI -0.65 to -0.17]; P=0.002)
Ø BMI z-score (-0.42 [-0.63 to -0.14]; P=0.003)
Ø Percentage body fat(-0.37 [-0.60 to -0.09];P=0.009)
Huerta MG et al. Diabetes Care 28:1175–1181, 2005
Magnesium Deficiency Is Associated WithInsulin Resistance in Obese Children

Serum magnesium & insulin sensitivitySerum Mg:
• Inversely correlated with:• Fasting insulin (rs = -0.36 [95% CI -0.59 to -0.08];
P=0.011)• HOMA (-0.35 [-0.58 to -0.06]; P=0.015)
• Positively correlated with QUICKI (0.35 [0.06–0.58];P=0.015).
Huerta MG et al. Diabetes Care 28:1175–1181, 2005
Magnesium Deciency Is Associated WithInsulin Resistance in Obese Children
QUICKI: Quantitative Insulin Sensitivity Check Index
The association between Mg deciency & IR is present during childhood.
Serum Mg deciency in obese children may be secondary to ò dietary Mg intake.
Huerta MG et al. Diabetes Care 28:1175–1181, 2005
Magnesium Deficiency Is Associated WithInsulin Resistance in Obese Children

Objective: – To assess whether overweight children
and adolescents (3-19 yrs), who often have poor dietary habits, are at increased risk of iron deficiency (ID).
Pinhas-Hamiel O et al. International Journal of Obesity (2003) 27
Greater prevalence of iron deficiency in overweight & obese children & adolescents

Methods: The study sample included children & adolescents followed between
1999-2001
Pinhas-Hamiel O et al. International Journal of Obesity (2003) 27
ID: Iron levels <8 µmol/l (45 mcg/dl)IDA: ID & Hb level < 2 SDS for the mean for age & gender
321 children &adolescents
321 children &adolescents
Group 1
BMI < 85th percentileNormal
n=136
Group 1
BMI < 85th percentileNormal
n=136
Group 2
85th < BMI < 97th percentileOverweight
n=33
Group 2
85th < BMI < 97th percentileOverweight
n=33
Group 3
BMI > 97th percentileObese
n=152
Group 3
BMI > 97th percentileObese
n=152

Pinhas-Hamiel O et al. International Journal of Obesity (2003) 27
Iron levels according to BMI SDS corrected for age and gender

Pinhas-Hamiel O et al. International Journal of Obesity (2003) 27
• ID common in overweight & obese children• A significantly greater proportion of obese
than normal-weight children have iron deficiency anemia
• Obese children should be routinely screened & treated
Greater prevalence of iron deficiency in overweight & obese children & adolescents

Energy intake
Water soluble vitamins
Vitamins

Kerr, MA et al. Pediatrics 2009;123;627-635
Objective:
To investigate the impact of age, gender & lifestyle factors on B-vitamin status & corresponding homocysteine concentrations, in a representative sample of British children & adolescents (4-18yrs).
Folate, Related B Vitamins, and Homocysteine in Childhood and
Adolescence: Potential Implications for Disease Risk in Later Life

Red cell folate
Kerr, MA et al. Pediatrics 2009;123;627-635
Folate and vitamin B12 biomarker status according to age
Serum B12

Ker
r, M
A et
al.
Pedi
atric
s 20
09;1
23;6
27-6
35
Vitamin B6, riboflavin and homocysteine biomarker status according to age
EGRac * HomocysteineVitamin B6
*EGRac: erythrocyte glutathione activation coefficient
Kerr, MA et al. Pediatrics 2009;123;627-635
•Throughout childhood & adolescence an optimal level of folate and related B vitamins is essential in preventing the accumulation of homocysteine and, in turn, potentially preventing the long-term risk of homocysteine-related disease.
•Age specific laboratory reference range
Folate, Related B Vitamins, and Homocysteine in Childhood and
Adolescence: Potential Implications for Disease Risk in Later Life

Objectives:
To assess micronutrient intake & blood biomarkers prospectively in pregnant adolescents recruited to the About Teenage Eating (ATE) Study & to determine associations with pregnancy outcome
Baker N et al. Am J Clin Nutr 89: 1114-1124, 2009
Micronutrient status in adolescent pregnancy

RBC folate & serum folate were significantly lower in adolescents who delivered SGA infants
Baker N et al. Am J Clin Nutr 89: 1114-1124, 2009
Micronutrient status in adolescent pregnancy

Kerr, MA et al. Pediatrics 2009;123;627-635
Poor micronutrient intake and status increase the risk of SGA births in
pregnant adolescents
Micronutrient status in adolescent pregnancy

Methods: – 471 children (7–9.9 y of age) & adolescents (10–17 y of
age), living in a poor region of the city of Rio de Janeiro, Brazil, were assessed.
– Cutoffs for inadequacy of retinol & carotenoids were <30 & <40g/dL, respectively.
de Souza Valente da Silva L et al. Nutrition 23 (2007) 392–397
Association of serum concentrations of retinol and carotenoids with overweight in children
& adolescents

Overweight children & adolescents may have a greater chance of presenting low
concentrations of carotenoids and, hence, a lower antioxidant defense.
de Souza Valente da Silva L et al. Nutrition 23 (2007) 392–397
Association of serum concentrations of retinol and carotenoids with overweight in
children & adolescents

• Eating habits developed early in life will persist or track into adulthood.
• In the USA:– Fat intake: 70% of boys & 65% of girls 12-19 yrs report
an intake that exceeds dietary recommendations.– Fruits & vegetables: Only one in five children
consumes five or more servings per day.– Dairy products: 70% of adolescent boys & 88% of girls
consume less than the recommended 3 servings of per day.
US Department of Agriculture, Agricultural Research Service. Food and nutrient intakes by children 1994–96, 1998
Krebs-Smith SM, Archives of Paediatric and Adolescent Medicine 1996; 150: 81–86.
Should we be concerned about the nutritional health of adolescents?

Supplementation
Fortification
Labeling
Education
……
US Department of Agriculture, Agricultural Research Service. Food and nutrient intakes by children 1994–96, 1998
Krebs-Smith SM, Archives of Paediatric and Adolescent Medicine 1996; 150: 81–86.
Should we be concerned about the nutritional health of adolescents?
What to do?
Yes

Weekly and daily supplementation improved Hb, Zn and retinol similarly.

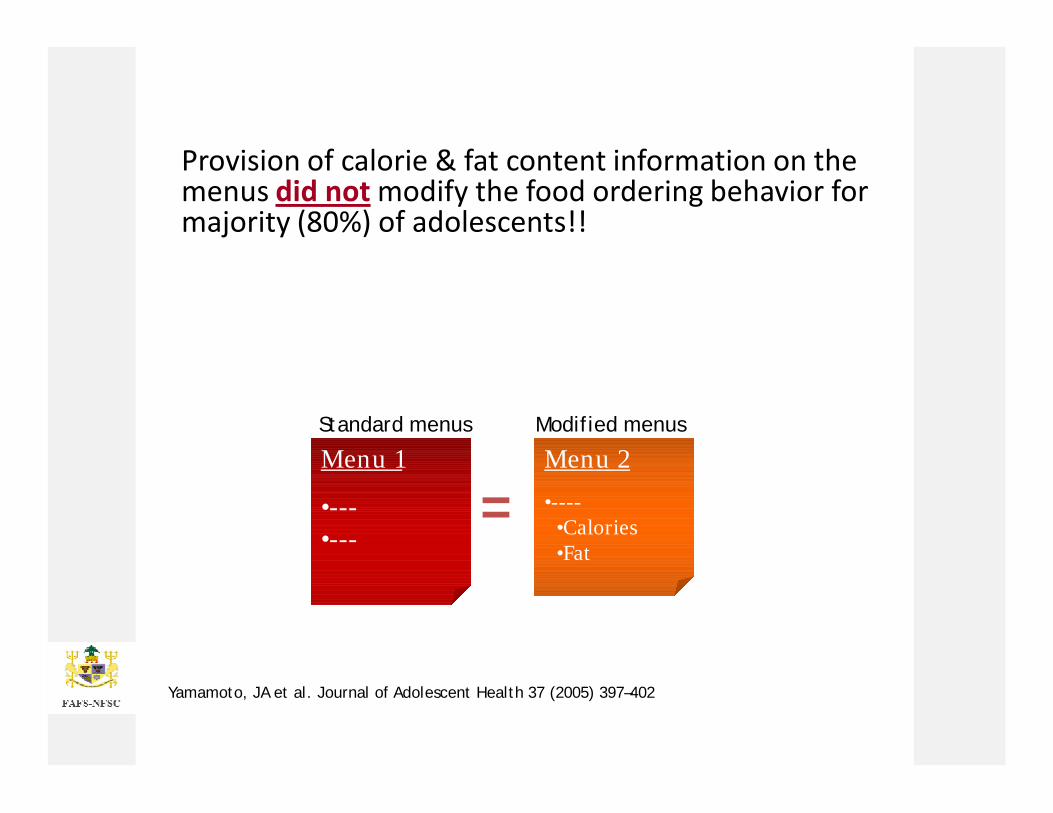
Adolescents (11-18yrs) (n=106) were asked to order a dinner of their choice from 3 different restaurant menus & then from a 2nd set of modified menus with calorie & fat content information posted next to each menu item.
Yamamoto, JA et al. Journal of Adolescent Health 37 (2005) 397–402
Menu 1
•---•---
Menu 2• Calories
•Fat
Modified menusStandard menus
Adolescents fast food and restaurant ordering behavior.
Provision of calorie & fat content information on the menus did not modify the food ordering behavior for majority (80%) of adolescents!!
Provision of calorie & fat content information on the menus did not modify the food ordering behavior for majority (80%) of adolescents!!
Yamamoto, JA et al. Journal of Adolescent Health 37 (2005) 397–402
Menu 1
•---•---
Menu 2•----
•Calories•Fat
=
Modified menusStandard menus
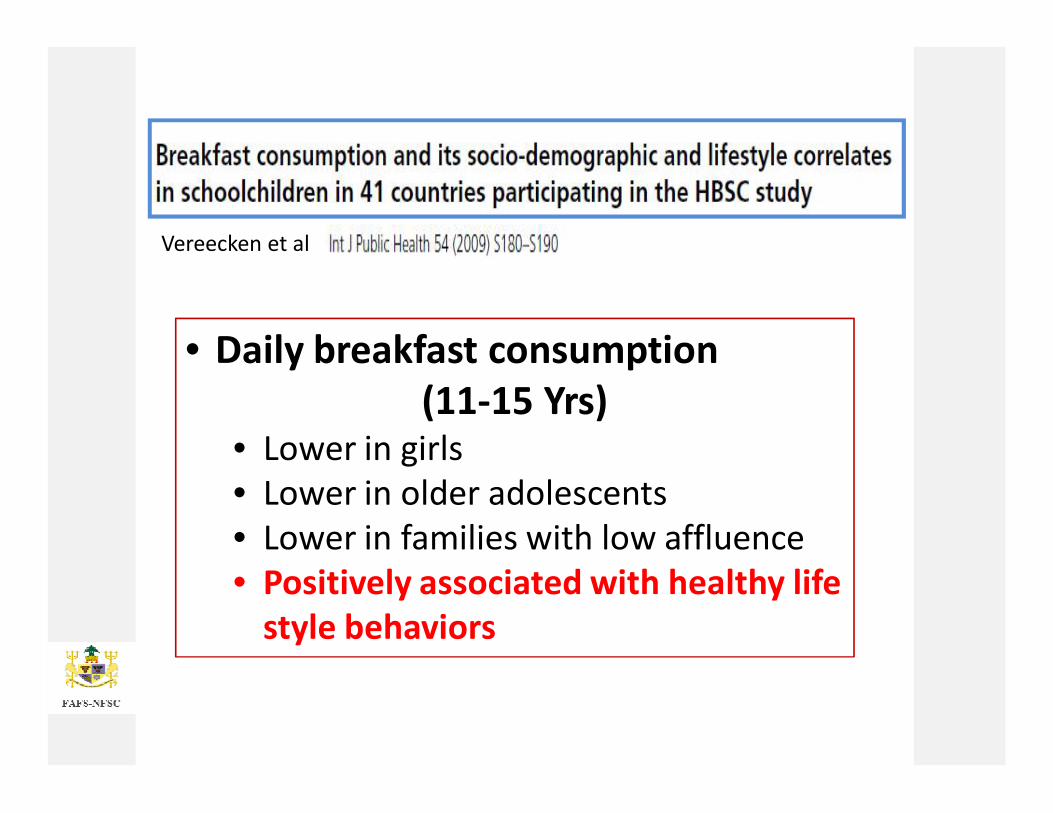
Vereecken et al
• Daily breakfast consumption (11-15 Yrs)
• Lower in girls• Lower in older adolescents• Lower in families with low affluence• Positively associated with healthy life
style behaviors

Studies that examined ≥5 versus ≤1 meals.
Hammons A J , Fiese B H Pediatrics 2011;127:e1565-e1574
Overweight (Down 12%)Unhealthy eating (Down 20%)Disordered eating (Down 35%)Healthy eating (Up 24%)