maldi ms tutorial - home-cigs · maldi ms tutorial pierre chaurand, lisa manier mass spectrometry...
TRANSCRIPT

MALDI MS Tutorial
Pierre Chaurand, Lisa Manier
Mass Spectrometry Research CenterVanderbilt University

Mass Range
OrganicChemistry
p+n0
0.000 000 000 000 000 000 000 001 g
AtomsBiochemistrye-
Alchemy
Beginning of the 20th Century

Desorption / Ionization : The Probes
Molecules are brought from a surface into the gas phase (desorbed) and ionized at the same time.
Plasma Desorption (PD)252Cf fission fragments, High energy (MeV) particles or ions
Fast Atom Bombardment (FAB)Low energy atoms (keV), (cesium)
Secondary Ion MSLow energy ions (keV), (cesium, gallium...)
Matrix-assisted Laser Desorption/Ionization (MALDI)UV and IR lasers

Matrix Assisted Laser Desorption-Ionization or MALDI
Mixture between a MATRIX andan analyte molecule (5000 for 1)
Co-crystallization (solid sample)
Laser pulse (106W/cm2)
Desorption-Ionization of the analyte molecule (Molecular ion [M+H]+)
Analysis of the molecular ions bytime-of-flight mass spectrometry
+ ++

Matrix for UV nm laser light (337 & 355 nm)
C C
OCH3
HO
3H COH
H
COOHC C
HO
H
CN
COOHSinapinic ac. (SA)Alpha Cyano-4-hydroxy-
cinnamic ac. (αCHCA)
OH
COOHN
OH
HO COOH
2,5-Dihydroxy- benzoic ac. 3-Hydroxy-picolinic (DHBA) (3HPA)
• Absorb at wave length used• Low vapor pressure (< 10-7 Torr)• Solvent compatible with sample• Co-crystallize with sample• Proton donor (M → [M+H]+)

Matrix for UV laser light (337 & 355 nm)
Matrix PolarityBiomolecule
PeptidesProteinsPolysaccharidesNucleic ac.
SA- αCHCAαCHCA
DHBA3HPA
++
+
+/
SA: 10-20 mg/ml, in 50/50/0.1 - Acetonitrile/H2O/TFAαCHCA: 10 mg/ml, in 50/50/0.1 - Acetonitrile/H2O/TFADHBA: 10 mg/ml, in:100/0.1 - H2O/TFA
50/50/0.1 - EtOH/H2O/TFA

Loading Methods
Droplet method:
1. Pipette 0.3-0.5 µl of sample directly onto the sample plate.
2. Immediately pipette 0.3-0.5 µl of matrix on top of sample drop.
3. Dry in the desiccator under vacuum.
Mixing method:
1. Mix 0.3-0.5 µl sample and 0.3-0.5 µl matrix solution in a small Eppendorf tube.
2. Pipette ~1 µl of mixture onto the sample plate.3. Dry in desiccator under vacuum.

Thin Layer Method
1. Make up a solution of 99% acetone/ 1% 0.1% TFA with 20 mg/ml CHCA or 100% MeOH with 20 mg/ml THAP.
2. Pipette 0.5-1 µl of matrix solution onto sample plate and allow it to spread and dry at room temperature and pressure.
3. For acidic sample solutions (<pH2), add the sample directly on top of dried matrix. For other samples, place 0.5 µl of TFA (0.5-10%) on top of dried matrix and then pipette the sample solution on top of the TFA drop.
4. Dry at room temperature and pressure.
Ref. O. Vorm, et al., Anal. Chem. 1994, 66, 3281.

Matrix Crystallization After DryingαCHCA
rounded
Sinapinic Acid
rhomboid
DHBA, air dried
irregular crystals
3-HPA
fan-like around edge of sample well

Buffers
Suitable for Direct Analysis by MALDI MS
Unsuitable for Direct Analysis by MALDI MS
Ammonium bicarbonate
Ammonium acetate
Bis-Tris
Tris (≤ 100 mM)
Hepes (< 100 mM)
Phosphate buffers
Sulfate buffers
Tris (> 100 mM)
Hepes (>100 mM)

Sample Clean upFor samples containing: Phosphate or sulfate buffers, Salts, Detergents
Washing:
1. Use either 0.1% TFA for buffer and salt removal or 5% isopropanol for removal of nonionic detergents.
2. Pipette 1-5 µl of cleaning solvent onto the dried sample and matrix spot. Wait 5-10 seconds and remove the liquid either by pipette or blowing off with a stream of clean air.
3. Repeat step 2 two to five times.
4. Dry before MALDI analysis.
Cation Exchange: Used for desalting
1. Place ~0.1 mg of cation exchange beads (200 mesh) on a piece of parafilm.
2, Add 5 to 10 µl of sample to the beads.
3. Mix by pipetting up and down about 20 times.
4. Allow the beads to settle for 30 seconds.
5. Remove the supernatant with a clean pipet tip and spot onto the MALDI plate.

Time-of-Flight Mass Spectrometry
Probe (Start)+/- U
+m/z
dsource dtof
Ion detectorIon Source Field free drift tube
ttotal = tsource + ttof

Eqm aFrrr
==
Time-of-flight in Source (constant field acceleration)
Time-of-flight in tube (field-free)
Ekin = qU = ½ mV2
V = t tof
d tof
qUm
V 2t tof == d tof d tof
Kinetic energy:(U, accelerating potential)
Drift time : orV
=d toft tof
ts qEmds2
=
a Eq/m=
V = Eq/m = Vo + (Eq/m)t⌡⌠
~0
Force and acceleration:(a, acceleration; E, electric field in source; q, charge; m, mass)
Velocity and time:(V, velocity; t, time)
t =E
V - Vo (m/q)
d = V dt⌡⌠Position:
(d, position in source)
~0d = do + Vot + ½(Eq/m)t2
~0
a dV/dt=
Total time-of-flight
ttot = ts + ttof
bqmat +=
where a and b are defined by the physical dimensions of the instrument and the operating parameters.
qUmttot 2
+= d tofmds2
qE
~0

Time-of-Flight Mass Spectrometry (TOF-MS)
Linear TOF :
Ionsignals
Ionizing Probe (start)M3 M2 M1
+/- U
Ion detector (MCP)
M3
M2
M1
t3t 2t 1 Time or MStart
t = a M + b

MALDI: Data acquisition Transient Recorder
Ionsignals
Ion detector (MCP)
++
0 200 1000 1200400 600 800
Time [100 ns]
4000 6000 8000 10000
Mass [m/z]
SoftwareData transfer to PC,Calibration

MALDI DE-STR TOF MS from Applied Biosystems

Time-of-Flight Mass Spectrometers, General Organization
Laser
AttenuatorPrism
Camera
Guide Wire
Reflector
Detectors
Ion Selector
Sample Plate
Grids
BA1
TC2
BA2
TC1
Turbo PumpsValves
Inlet
Fore Pump

Instrument Panel
Indicates that the laser is powered on Mayor problem! High voltage is on
Pumps are operating
normal
Computer is controlling the
instrument (software is ready)
Indicates the laser is firing

Select Gauge
Press to Switch on / off Gauge
Pressure Gauges
displays E03 (indicates gauge not connected)
Not usedTC1,TC3,TC4
Less than 10 –2 during operationHigher when loading or ejecting sample plate.
Pressure in sample loading chamberTC2
Less than 5 x10 -8Pressure in mirror chamberBA2
Less than 5 x 10 –7Pressure in main source chamberBA1
Expected PressureMeasuresGauge
[torr]

Isotopic Distribution
1312
100
90
80
70
60
50
40
30
20
10
0
C1
122121120
100
90
80
70
60
50
40
30
20
10
0
C10
1,2061,2041,2021,200
100
90
80
70
60
50
40
30
20
10
0
C100
12,03012,02012,01012,000
100
90
80
70
60
50
40
30
20
10
0
C1000

1,6821,6801,6781,6761,6741,672
1673.9 Average MassNeurotensin 100
90
80
70
60
50
Res. 1’000 40
30
20
10
pQLYENKPRRPYILMW 1672.9
40
1,6821,6801,6781,6761,6741,672
100
90
80
70
60
50
30
20
10
0
[M+H]+
[M+H+1]+
[M+H+2]+
[M+H+3]+
[M+H+4]+
1672.9 Monoisotopic Mass
Res. 10’000

Constant field extraction TOF MS
Sample E1
25 kV
++
Single ion counting (PDMS, SIMS, FAB...)
E1
25 kV
∆ t
++
++
Sample
LD, MALDI
+εE
++
∆ t
+εE, + ∆d∆d

V. Bokelmann, B. Spengler, R. Kaufmann, Eur. Mass Spectrom. 1, 81-93 (1995)
B. SpenglerJ. Mass Spectrom., 32, 1019-1036 (1997)
MALDI ion plume
DHB matrix and Substance P [M+H]+ ions densities measured 1 µs after laser impact.
Bleu: DHBRed: Substance P (MW 1347.7

Delayed Extraction in MALDI TOF MS
[M+H]+
velocitydistribution
(300<v<1000 m/s)
Sam
ple
E1 E20
25 t=0, startUbias=25 kVt=TextUpulse<25 kV
+
+
M/∆M = f(Ubias, Upulse, Text., m)
Compensation of the initial velocity distribution resulting from the MALDI desorption process to time focus the ions on the detector.
Increase in resolution

MALDI TOF MS of Cytochrome C, MW 12360.1
Constant field extraction Delayed extraction
12000 12200 12400 12600 12800 13000Mass (m/z)
12000 12200 12400 12600 12800 13000Mass (m/z)
[M+H]+ [M+H]+
[M+SA+H]+
[M+SA+H]+
M/∆M = 300 M/∆M = 1100

MALDI TOF MS of Protein Mixture
2000 7000 12000 17000 22000 27000Mass (m/z)
0
20
40
60
80
100%
Inte
nsity
5734
.6[M
+H]+
Insu
lin
1695
2.5
[M+H
]+M
yogl
obin
1236
1.1
[M+H
]+C
ytoc
hrom
e C
2399
2.8
[M+H
]+T
ryps
inog
en
8476
.8, [
M+2
H]2+
Myo
.
6181
.4, [
M+2
H]2+
Cyt
.C
1199
6.8,
[M+2
H]2+
Try
p.
2865
.4, [
M+2
H]2+
Ins.

MALDI TOF MS of Protein Mixture, Ubias= 25 keV
5550 5650 5750 5850 5950 6050 23100 23540 23980 24420 24860 25300
5550 5650 5750 5850 5950 6050Mass (m/z)
23100 23540 23980 24420 24860 25300
M/∆M = 800
M/∆M = 350 M/∆M = 500
M/∆M = 220[M+H]+
[M+H]+
[M+H]+
[M+H]+
Upulse = 23625 V
delay = 150+εns
Upulse = 22750 V
delay = 250+εns
[M+SA+H]+
[M+SA+H]+
[M+SA+H]+
[M+2SA+H]+

Delayed extraction in linear MALDI TOF MS
Usample = 10 kVText = 1050 ns
Sub P, MW 1347Melittin, MW 2848Insulin, MW 57342Ins., MW 11467

Reflex Time-of-Flight Mass Spectrometry
Increase in resolutionTandem mass spectrometry
Detector
+U
+U1, (U1>U)
Ion source Reflectron
++
E
E+ε
+
+
+U1+U1
Single stage Two-stage Curved-field
+U1+ U1

Reflex MALDI TOF Mass Spectrometer
LaserOptics
Nitrogen Laser (337 nm)
TOFAnalyzer
MicrochannelDetector
MALDITarget
Ion MirrorIon
Grid
(1)

Reflex MALDI TOF Mass Spectrometer
LaserOptics
Nitrogen Laser (337 nm)
TOFAnalyzer
MicrochannelDetector
MALDITarget
Ion MirrorIon
Grid
(2)

Time-of-Flight variation f(energy variation)
Two-stage electrostatic reflectron
(20 keV)(+600 eV)
(-600 eV)
U, Nominal energy∆U, Energy variations acquired during the desorption processT, Nominal time-of-flight∆ T, Time-of-flight variations

1672
.92
Cou
nts
1665 1670 1675 1680 Mass (m/z)
1672
.92
1670 1675 1680 1685
M/∆M = 4000 M/∆M = 12700
∆M = 1 u∆M = 1 u
DE Linear Mode DE Reflex Mode
+U +U +U1
MALDI TOF MS of Neurotensin, MW 1671.92

MALDI TOF MS of Bovine Insulin, MW 5733.5
DE Linear Mode DE Reflex Mode
+U
5725 5730 5735 5740 5745 Mass (m/z)
∆M = 1 u
M/∆M ≥ 10,000
5725 5730 5735 5740 5745
M/∆M ≥ 1000
(FWHM)
C254 H377 N65 O75 S6
Calculated(FWHM 4000)
Measured
+U +U1

Delayed extraction in reflex MALDI TOF MS
+U +U1
Laser irradiance less critical under DE conditions
Sub P, MW 1182

Ion detection: Microchannel plate detector
R2 R2R3 R4-2 kV
+
+
Gain / MCP ~ 103-4
e-
e-
Anode
Single Ion counting, n < 1(PDMS, SIMS…)
Time to Digital Converter+ Histogram PC card
Nb ions > 10, (n1000)(LD, MALDI…)
Transient Recorder
(20 keV)
MCP
1 < Nb ions < 10TDC + charge coder,or Multi Anode Detector
~106-8 e-

Electronic emission from a CsI coated surface
Mass (Da)
γe
γe ~ M0.6 f(V)(1-4)

2000 7600 13200 18800 24400 30000
27000 41600 56200 70800 85400 100000
80000 164000 248000 332000 416000 500000Mass (m/z)
Inte
nsity
Protein extract from mouse anterior prostate

Signal Optimization
Accelerating VoltageGuide Wire Voltage%Shots/SpectrumLow Mass Gate
Signal-to-Noise Ratio
Delay TimeGuide Wire Voltage%Grid Voltage%
ResolutionLaser intensitySignal intensityAdjust…To Optimize…

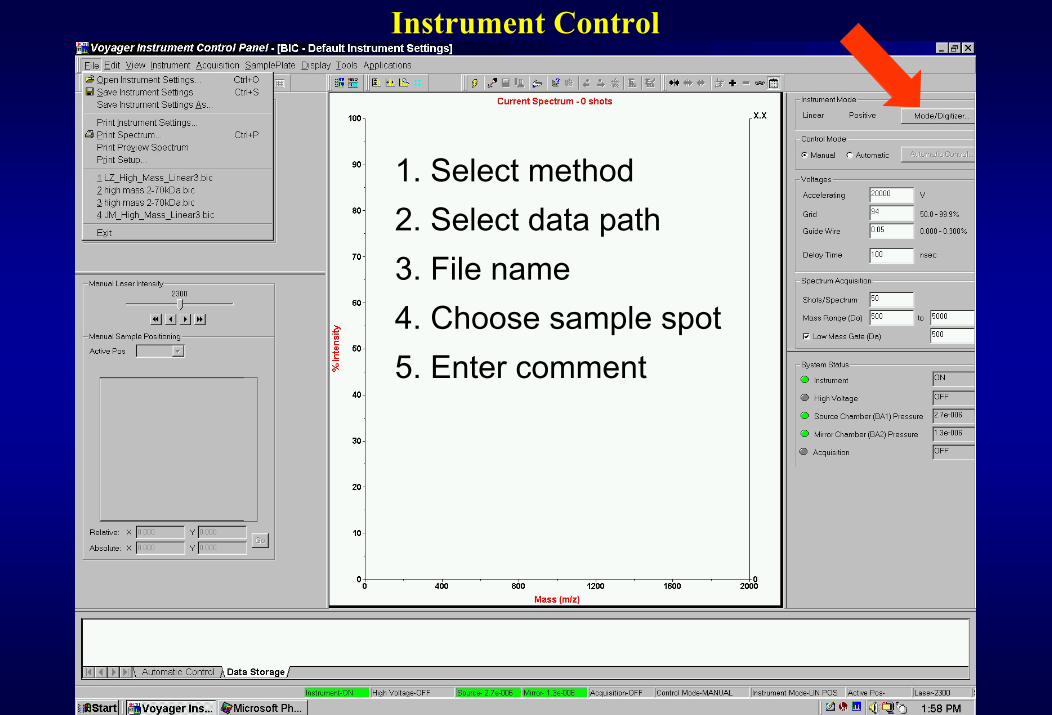
Instrument Control
1. Select method2. Select data path3. File name4. Choose sample spot5. Enter comment
Instrument Control
1. Select method2. Select data path3. File name4. Choose sample spot5. Enter comment

Instrument Parameters

Instrument Parameters
Peptides – linear mode 0.5 – 1 ns 200 mV – 1000 mV
Proteins – linear mode5 to 20 kDa, 4 – 10 ns 200 mV> 20 kDa 10 – 20 ns 50 – 200 mV
Peptides – reflex mode 1 – 2 ns 50 – 200 mv
Bin size Vertical scaleExperiment

Substance P in HCCA
0
10000
20000
30000
40000C
ount
s
1340 1350 1360 1370 1380 1390 1400 Mass (m/z)
[M+H]+
[Mox+H]+[M+Na]+
[M+K]+
[M+H]+
[Mox+H]+ +18 u[M+Na]+ +22 u[M+K]+ +38 u
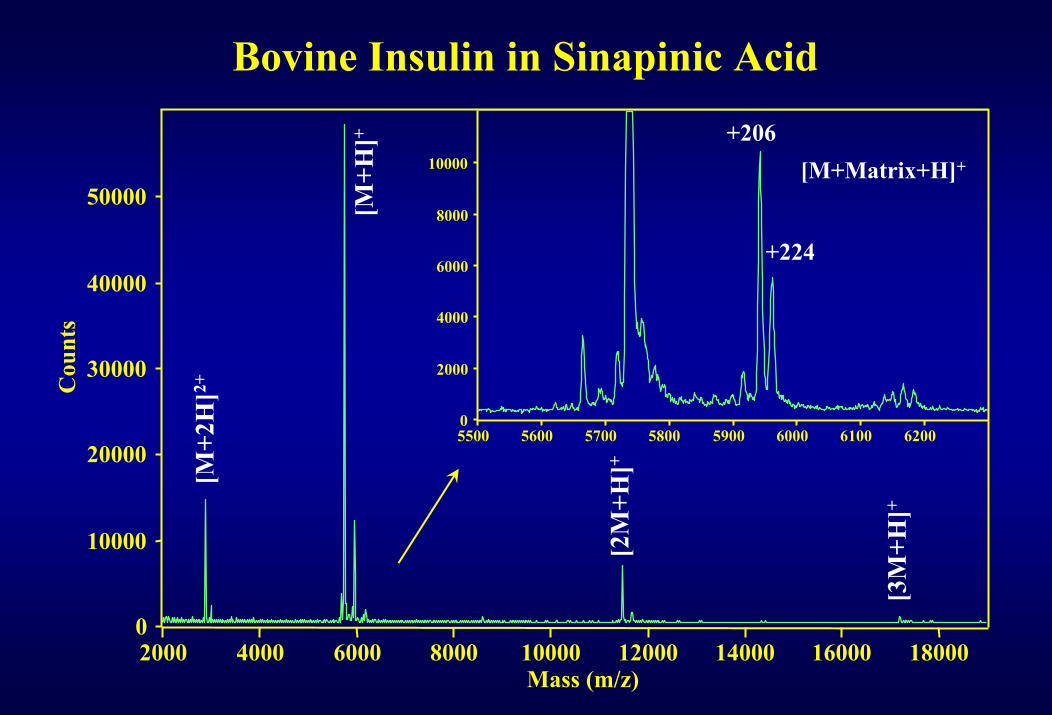
Bovine Insulin in Sinapinic AcidC
ount
s
5500 5600 5700 5800 5900 6000 6100 6200
0
10000
20000
30000
40000
50000
2000 4000 6000 8000 10000 12000 14000 16000 18000 Mass (m/z)
[M+H
]+
[M+2
H]2+
[2M
+H]+
[3M
+H]+
0
2000
4000
6000
8000
10000
+206
+224
[M+Matrix+H]+

0
2000
4000
6000
8000C
ount
s
5000 10000 15000 20000 25000 Mass (m/z)
Ins+
Cyt.C+
Trg+Cyt.C2+
Ins2+ Trg2+
2Cyt
.C+
Bovine Insulin, MW 5733.5Cytochrome C, MW 12360.1Trypsinogen, MW 23981
Mixture of 3 Proteins in SA

Mixture of Trypsin and Trypsinogen
0
10000
20000
30000
40000C
ount
s
10000 20000 30000 40000 50000 Mass (m/z)
Trp+Trg+
Trp2+Trg2+ Trp+, Trg+
[Trp+Trg]+
Trp, MW 23293Trg, MW 23981

Mixture of Trypsin and Trypsinogen
0
10000
20000
30000
40000C
ount
s
21000 22000 23000 24000 25000 26000 27000 Mass (m/z)
[M+H]+Trp+Trg+
Trp, MW 23293Trg, MW 23981
[M+Matrix+H]+
[M+2Matrix+H]+
[M+3Matrix+H]+

MALDI TOF MS of Glucose 6 Phosphate Dehydrogenase
10000 28000 46000 64000 82000 1000000
20
40
60
80
% In
tens
ity
56500 56940 57380 57820 58260
57432, [M+H]+
57630, [M+SA+H]+
57827,[M+2SA+H]+
[M+H]+
[M+2H]2+
100
Mass (m/z)

Influence of the Choice of Matrix
20000 40000 60000 80000 100000 120000 Mass (m/z)
Rel
ativ
e in
tens
ities
[M+H
]+4+
5+
6+
[2M
+H]+
3+
2+
2M3+
2M5+
Sinapinic Ac.
α-Cyano-4OH-cinnamic Ac

0
5000
10000
15000
20000
Cou
nts
50000 60000 70000 80000 90000 100000 Mass (m/z)
BSA+ Cox2+, 73 070 +/- 200 Da
8050
0
6820
0
Cox2 in Sinapinic Acid (Glycoprotein)

IgG in Sinapinic Acid
0
1000
2000
3000
4000
Cou
nts
50000 100000 150000 200000 250000 300000 Mass (m/z)
[M+3H]3+
[M+2H]2+
[M+H]+
[2M+H]+
Igg, 1.5 pmole on target

MALDI-TOF Mass SpectrometryPerformances
Biological materials : Peptides, Proteins, Polysaccharides, Polynucleotides...
Mass accuracy : 1000 ≤ Mass ≤ 30,000 Da ⇒ ≤ 10-4
Mass > 30,000 Da ⇒ ≥ 10-4
Sample amounts : Mass analysis ⇒ a few fentomoles toa few picomoles.Structure analysis ⇒ high femtomole range
AdvantagesRapid, easy sample preparation, Large mass scan (Routine, up to 150,000 Da), Mixture analysis, Tolerance towards impurities (buffers, salts...).
Disadvantages
No on-line couplingpossibilities

Getting Started…
• Fill out form• Check pressure gauges and instrument status• Start Voyager software• Load sample plate

Before you leave…
• Eject plate (and press ‘load no plate’)• (Close Voyager software)• Complete form• Report problems with the instrument to a
MSRC member