malaysian construction research - cream.my
TRANSCRIPT


MALAYSIAN CONSTRUCTION RESEARCH
JOURNAL (MCRJ)
SPECIAL ISSUE Vol. 4 | No. 2 | 2018
GLOBAL CONGRESS ON CONSTRUCTION,
MATERIAL AND STRUCTURAL ENGINEERING
(GCoMSE) 2017
The Malaysian Construction Research Journal is indexed in
Scopus Elsevier
eISSN No.: 2590 – 4140
Construction Research Institute of Malaysia (CREAM) Level 29, Sunway Putra Tower,
No. 100, Jalan Putra, 50350 Kuala Lumpur
MALAYSIA

MCRJ Special Issue Vol. 4 | No. 2 | 2018
Contents
Introduction
iv
Editorial Advisory Board
v
Editorial
vi
THEME 1: CONSTRUCTION
1
INVESTIGATING BENEFITS OF NET ZERO ENERGY BUILDINGS
(NZEBS) FOR HEALTHCARE BUILDINGS: PRELIMINARY
FINDINGS FROM ARCHITECT’S PERSPECTIVE Roy Hazli Abdellah, Md Asrul Nasid Masrom, Goh Kai Chen, Sulzakimin
Mohamed and Norpadzlihatun Manap
2
A CRITICAL REVIEW OF MANAGEMENT OF BUILDING FIRE
SAFETY IN MALAYSIAN PUBLIC UNIVERSITIES Mohamed Sulzakimin, Ebenehi Ibrahim Yakubu, Sarpin Norliana, Ta Wee Seow,
Masrom Md Asrul Nasid and Zainal Rozlin
20
FEASIBILITY STUDY ON COMPOSITION AND MECHANICAL
PROPERTIES OF PALM OIL FUEL ASH AND QUARRY DUST
REPLACEMENT IN SOLIDIFICATION/ STABILIZATION MATRICES Mohd Ikhmal Haqeem Hassan, Aeslina Abdul Kadir and Nur Jannah Abdul Hamid
31
STRENGTH AND PHYSICAL PROPERTIES OF SUSTAINABLE
CONCRETE MASONRY AT ELEVATED TEMPERATURE: A
REVIEW Nurain Izzati Mohd Yassin, Suraya Hani Adnan, Shahiron Shahidan,
Noorwirdawati Ali, Nurul Amirah Kamarulzaman and Norwardatun Abd Roni
45
THEME 2: MATERIAL
56
SAND CEMENT BRICK CONTAINING COMPOSITE OF RCA AND
PET AS SAND AGGREGATE REPLACEMENT Faisal Sheikh Khalid, Nurul Bazilah Azmi, Sallehudin Shah Ayop, Puteri Natasya
Mazenan, Nickholas Anting Anak Guntur, Shahiron Shahidan and Alvin John Lim
Meng Siang
57
THE EFFECT OF USING DIFFERENT SUBSTITUTES OF RUBBER
ASH ON COMPRESSIVE STRENGTH OF CEMENT MORTAR Mohamad Syamir Senin, Shahiron Shahidan, Nor Hayati Abd Ghafar,
Noorwirdawati Ali, Alif Syazani Leman, Nurul Izzati Raihan Ramzi Hannan,
Sharifah Salwa Mohd Zuki and Mohd Haziman Wan Ibrahim
72

MCRJ Special Issue Vol. 4 | No. 2 | 2018
UTILISATION OF WASTE GLASS POWDER AS A PARTIAL
REPLACEMENT OF CEMENT IN SUSTAINABLE MORTAR
PRACTICE Bassam Abdul Tayeh, Shahiron Shahidan, Ahmed. J. A. El-Kurd, Sharifah Salwa
Mohd Zuki, Ahmad Ruslan Mohd Ridzuan, Mohd Haziman Wan Ibrahim and
Faisal Sheikh Khalid
83
INFLUENCE OF GROUND COAL BOTTOM ASH WITH DIFFERENT
GRINDING TIME AS CEMENT REPLACEMENT MATERIAL ON THE
STRENGTH OF CONCRETE Mohd Khairy Burhanudin, Mohd Haziman Wan Ibrahim, Mohd Syahrul Hisyam
Mohd Sani, Mohd Irwan Juki, Norwati Jamaluddin, Ramadhansyah Putra Jaya,
Shahiron Shahidan, Nurul Fasihah Basirun and Mohamad Zulhairi Mohd Bosro
93
THE EFFECT OF ASPHALT DUST WASTE ON THE
RHEOLOGICAL PROPERTIES OF SELF COMPACTING
CONCRETE Isham Ismail, Shahiron Shahidan, Norwati Jamaluddin and Aeslina Abdul Kadir
103
ALKALINE TREATMENTS ON EFB FIBRE: THE EFFECT ON
MECHANICAL-PHYSICAL PROPERTIES AND FIBRE-CEMENT
HYDRATION RATE Nik Mohd Zaini Nik Soh, Zainal Abidin Akasah, Hayana Dullah, Astimar Abdul
Aziz and Eeydzah Aminudin
117
BIO-CONCRETE ON CHLORIDE CONDITION: EFFECT ON
COMPRESSIVE STRENGTH AND WATER PENETRATION Tambunan Teddy, Mohd Irwan Juki, Norzila Othman and Paran Gani
129
CHARACTERIZATION OF COAL BOTTOM ASH (CBA) HEAVY
METAL ELEMENT AFTER ACID LEACHING TREATMENT Ahmad Asyari Yahya, Noorwirdawati Ali, Nur Liyana Mohd Kamal, Shahiron
Shahidan, Salmia Beddu, Muhd Fadhil Nuruddin and Nasir Shafiq
141
IMPROVEMENT OF STRENGTH AND WATER ABSORPTION OF
INTERLOCKING COMPRESSED EARTH BRICKS (ICEB) WITH
ADDITION OF UREOLYTIC BACTERIA (UB) Mohd Megat Zamer, Mohd Irwan Irwan, Norzila Othman and Faisal Sheikh
Khalid
152
THE EFFECT OF CEMENT AND BAGASSE ASH ON THE
ENGINEERING PROPERTIES OF CONTAMINATED SOIL Mohamad Azim Mohammad Azmi, Saiful Azhar Ahmad Tajudin, Ahmad Tarmizi
Abdul Karim and Shahiron Shahidan
161

MCRJ Special Issue Vol. 4 | No. 2 | 2018
THEME 3: STRUCTURAL ENGINEERING 173
THE NATURAL FREQUENCY ANALYSIS OF REINFORCED
CONCRETE BEAM WITH ADDITIONAL OF LIGHTNING
PROTECTION CABLE Mustaqqim Abdul Rahim, Yeap Sook Cheng, M. Arkam Che Munaaim, Zuhayr Md
Ghazaly, Abdul Naser Abdul Ghani, Ahmad Nur Aizat Ahmad and Shahiron
Shahidan
174
DAMAGE OF REINFORCED CONCRETE BEAMS CONSISTING
MODIFIED ARTIFICIAL POLYETHYLENE AGGREGATE (MAPEA)
UNDER LOW IMPACT LOAD Shahrul Niza Mokhatar, Sharifah Salwa Mohd Zuki, Josef Hadipramana, Ahmad
Fahmy Kamarudin, Mohammad Soffi Md Noh, Mohamed Muftah Mustafa and
Nurul Shazlin Norshahimi
184
EXPERIMENTAL STUDY ON THE VIBRATION RESPONSES AND
ENERGY DISSIPATION OF FOAMED CONCRETE COMPOSITE
SLABS Zainorizuan Mohd Jaini, Rahmat Hidayat Mohammed Rum, Nor Hayati Abd
Ghaffar, Mohammad Shahrul Aizat Misbah and Mohd Shaffiq Md Desa
193
STATE OF THE ART ON PRE-TENSIONING STEEL STRAPS
CONFINEMENT: LITERATURE REVIEW Chau-Khun Ma, Abdullah Zawawi Awang, Wahid Omar, Noor Nabilah Sarbini and
Shahiron Shahidan
210
FINITE ELEMENT PROCEDURES DEVELOPMENT FOR
NONLINEAR STEEL FRAME ANALYSIS WITH QUASI-STATIC
SEMI-RIGID CONNECTION Shahrin Mohammad, Ahmad Baharuddin Abd Rahman, Cher Siang
Tan, Chau Khun Ma, Yee Yong Lee and Yeong Huei Lee
221
EFFECTIVENESS OF REPAIR METHOD USING HYBRID FIBER
REINFORCED POLYMER FABRIC ON CONCRETE-FILLED
DOUBLE SKIN STEEL TUBULAR COLUMNS EXPOSED TO FIRE Sharifah Salwa Mohd Zuk, Shahiron Shahidan, Choong Kok Keong and
J.Jayaprakash
239

MCRJ Special Issue Vol. 4 | No. 2 | 2018 iv
INTRODUCTION
Welcome to the Special Issue of Malaysian Construction Research Journal (MCRJ) in
conjunction with The Global Congress on Construction, Material and Structural Engineering
(GCoMSE) 2017. This special issue is a platform for researchers and engineers to share their
knowledge and experiences in creating sustainable and environmental friendly world for the
present and the future. As we all know that this world is borrowed from the next generation
and in other for us to ensure that it is well looked-after. Therefore, sustainable in construction,
material and structural building are important keys to reduce direct impact on the
environment. Sustanability in construction building and structural engineering are the
optimization of construction activities in way that does not have harmful effects on resources,
surroundings and living ecosystem.
This Special Issue of Malaysian Construction Research Journal theme which is ‘Green
Technology for Global Awareness and a Better Future’ indicates the needs of preparing the
world for future generation to continue their responsibility to make it a better place to live.
This theme was divided into 3 major areas which are construction, material and structural
engineering. These majors demonstrate the cornerstones of today’s construction engineering
and structural research in promoting new ideas, developments and innovations that focuses
on new current problems.
This Special Issue of Malaysian Construction Research Journal is significance to the
academics and the professionals with research works in construction sustainability by
introducing the reduction usage of natural materials and increasing the use of recycled and
sustainable materials. By this efforts, pollution and negative environmental impacts can be
reduced. This initiative must be followed and well planned towards the sustainable
construction and environment. In addition, this special isues also brings opportunity for all
authors to share ideas as well as stimulating awareness of this important field. Therefore,this
Special Issue of Malaysian Construction Research Journal are consist of 20 selected papers
by the conference committee and expert reviewer from the papers submitted at the GCoMSE
2017.

MCRJ Special Issue Vol. 4 | No. 2 | 2018 v
Editorial Advisory Board Ir. Dr. Zuhairi Abd. Hamid, Dr., Chief Editor Construction Research Institute of Malaysia (CREAM)
Faisal Sheikh Khalid, Dr., Co-Chief Editor Faculty of Civil and Environmental Engineering Universiti Tun Hussein Onn Malaysia Lee Yee Yong, Dr., Faculty of Engineering Universiti Malaysia Sarawak Shahiron Shahidan, Ts. Dr., Faculty of Civil and Environmental Engineering Universiti Tun Hussein Onn Malaysia Fadzli Mohd Nazri, Assoc. Prof. Dr., School of Civil Engineering Universiti Sains Malaysia Hamidah Mohd Saman, Prof. Dr., Faculty of Civil Engineering Universiti Teknologi MARA Sharifah Salwa Mohd Zuki, Dr., Faculty of Civil and Environmental Engineering Universiti Tun Hussein Onn Malaysia Mustaqqim Abdul Rahim, Ir., School of Environmental Engineering Universiti Malaysia Perlis Nor Hazurina Othman, Dr., Faculty of Civil and Environmental Engineering Universiti Tun Hussein Onn Malaysia Abdul Aziz Abdul Samad, Prof. Ir. Dr., Faculty of Civil and Environmental Engineering Universiti Tun Hussein Onn Malaysia Ismail Abdul Rahman, Prof. Dr., Faculty of Civil and Environmental Engineering Universiti Tun Hussein Onn Malaysia Norsuhada Md. Nor, Dr., Faculty of Civil Engineering Universiti Teknologi MARA Norashidah Abd Rahman, Dr., Faculty of Civil and Environmental Engineering Universiti Tun Hussein Onn Malaysia
Noorwirdawati Ali, Dr., Faculty of Civil and Environmental Engineering Universiti Tun Hussein Onn Malaysia Mohd Haziman Wan Ibrahim, Assoc. Prof. Dr., Faculty of Civil and Environmental Engineering Universiti Tun Hussein Onn Malaysia Abdul Halim Abdul Ghani, Assoc. Prof. Ir. Dr., Jamilus Research Center Universiti Tun Hussein Onn Malaysia Maria Zura Mohd. Zain, Mrs. Construction Research Institute of Malaysia (CEAM)
Secretariat: Sharifah Salwa Mohd Zuki, Dr., Faculty of Civil and Environmental Engineering Universiti Tun Hussein Onn Malaysia Nurulhuda Mat Kilau, Ms., Construction Research Institute of Malaysia (CREAM) Tengku Mohd Hafizi Raja Ahmad, Mr., Construction Research Institute of Malaysia (CREAM) Intan Diayana Musa, Ms., Construction Research Institute of Malaysia (CREAM)
MCRJ Special Issue Vol. 4 | No. 2 | 2018 vi
Editorial Welcome from the Editors
Welcome to the Special issue of Malaysian Construction Research Journal (MCRJ) for
The Global Congress on Construction, Material and Structural Engineering. The editorial
team would like to extend our gratitude to all authors and reviewer for their contributions and
valuable comments. The purpose of this special issue is to share their knowledge and
experiences in creating sustainable and environmental friendly world for the present and the
future. It is hope that the readers will find beneficial information from this special issue
edition. Twenty (20) papers are discussed in this issue.
Abdellah et al., determined benefits of NZEBs practices through preliminary
investigation among architects. Several existing energies works of literature and pilot studies
by using semi-structured interviews were conducted. The findings reveal that, although the
term ‘NZEBs design strategies’ is not being used broadly across construction industry in
Malaysia, some green practices related to the design stage of construction has been carried
out. The findings are also encouraging in increasing awareness, practices and implementation
of NZEBs design strategies by the practitioner in Malaysia.
Mohamed Sulzakimin et al., carried out a comprehensive review on FSM within the
context of Malaysian public universities and sustainability from relevant databases by
examining the possibility of reducing incidents that could lead to expending unbudgeted
resource to rehabilitating property destroyed by fire on campus, in addition to limiting risk to
life and interruption of academic and business activities. Several types of research had been
conducted on FSM, nevertheless very few consider Higher Education Institutions (HEI)
holistically. The paper reveals that FSM is critical to preventing fire disaster in buildings. It
identifies the need for an investigation into the implementation of FSM to developing
effective FSM framework for assisting facilities managers and other stakeholders to preserve
the university buildings against fire risks.
Haqeem Hassan et al., investigated the suitable waste materials to be used in
solidification/stabilization (S/S) technique using palm oil fuel ash and quarry dust. In this
research, different percentages of Palm Oil Fuel Ash (POFA) and quarry dust (0%, 10%, 20%,
30% and 40%) are used to replace the Portland cement and sand respectively. The results
indicated that 10% of POFA and 20% of quarry dust are the best percentages to be
incorporated in S/S matrices. The 10% replacement of POFA recorded a considerable value
of density ranging from 1500 kg/m3 to 1660 kg/m3.Meanwhile the compressive strength 10%
of POFA achieved the strength of 22.60 MPa. Besides that, 20% replacement of quarry dust
in natural sand recorded a value of density ranging from 2080 kg/m3 to 2147 kg/m3 with the
highest strength is 24.91MPa.
Nurain Izzati Mohd Yassin et al., presented an overview of the performance of
sustainable concrete masonry containing industrial waste as cement replacement which
exposed to high temperature. Based on previous researches, the performance of these
sustainable concrete have been investigated in terms of its residual compressive strength and
physical properties at elevated temperature. Large numbers of research on pozzolanic
concrete at elevated temperature have been conducted where pozzolanic concrete have better

MCRJ Special Issue Vol. 4 | No. 2 | 2018 vii
performance than OPC concrete at temperature less than 500⁰C. In terms of physical
properties, surface cracks and discolouration of concrete has been observed. Studies show
that, surface cracks on pozzolanic concrete were less than OPC concrete. Meanwhile, for
discolouration impact, it was observed that, both OPC and pozzolanic concrete have similar
changes in colour where the colour of concrete became lighter as the firing temperature
increased.
Faisal Sheikh Khalid et al., established sustainable material properties for sand cement
composite brick containing Recycles Concrete Aggregate (RCA) and Polyethylene
Terephthalate (PET). This study replaces the fine aggregates with 25%, 50% and 75% of
Recycled Concrete Aggregate (RCA) and 0.5%, 1.0% and 1.5% of waste PET in the
production of brick. The best compressive strength was recorded at 24.9 MPa for brick
contains 75% RCA and 0.5% PET. Meanwhile, an increment of RCA contents in brick
increased the water absorption and Initial Rate of Suction (IRS) percentages compared to a
normal brick. As a result, the use of RCA and PET in the production of sand cement composite
brick has provided better strength with tolerable results on water absorption and initial rate of
suction compared to normal bricks.
Mohamad Syamir Senin et al., investigated the changes of the properties for rubber ash
cement mortar with respect to different content of rubber ash as cement and as sand
substitution and filler. Cubic specimens were produced by adding 10% volume rations of
rubber as fillers, sand replacement and cement replacement into M30 quality cement mortar.
The physical and mechanical tests were conducted at the end of day 7, 14 and 28. Tire rubber
ash is more suitable to be used as sand replacement. It also works as an alternative to cement
replacement and fillers. The compressive strength of the mortar specimen reduced when
rubber ash was added in the cement mortar where reduction of density occurred. At the early
stages, better compressive strength for tire rubber ash used as fillers however at 28 days the
use of tire rubber ash as cement replacement had the strongest compressive strength.
Bassam. A. Tayeh et al., investigated the performance of cement mortar containing Glass
Powder (GP) as a partial substitution for cement. Portland cement was partially replaced with
10%, 20% and 30% GP. The unit weight and compressive strength of the cement mortar after
a curing period of 7 and 28 days were measured. Although the compressive strength of the
cement mortar decreased, its unit weight had no significant change and remained equal to
those of the control samples. Therefore, GP can be considered as a viable replacement for
cement and is thus an economical construction material
Mohd Khairy Burhanudin et al., conducted a study to determine the strength of concrete
containing Coal Bottom Ash (CBA) as cement replacement material. The original CBA were
sieved passing 150 um sieve size then ground for 20, 30, and 40 hours using ball mill machine.
The normal concrete were designed for grade 30 based on Department of Environmental
method (DOE). The concrete were produced by replacement level of cement 10%, 20% and
30%. The fresh concrete were tested using slump cone to determine the workability of
concrete. It is found that slump height was decrease with increasing the replacement level of
CBA. Besides that, from the result, 20% replacement level of cement with 30 hours grinding
time contributed high compressive strength compared to others. The presence of CBA in
cement as a binder was improves the strength of concrete.

MCRJ Special Issue Vol. 4 | No. 2 | 2018 viii
Utilizing powder waste produced from asphalt batching plant so called Asphalt Dust
Waste (ADW) was an alternative solution to reduce this waste material that cause pollution
to surrounding dumping area. Isham Ismail et al., evaluated the optimum percentage of ADW
as filler in coarse aggregate and the effect of ADW as cement replacement in develops Self
Compacting Concrete (SCC). According to the results obtained, utilizing ADW as filler and
cement replacement in develop SCC was benefit for high workability, stability and
segregation resistance in fresh state conditions. As conclusion, the utilization of ADW for the
production of self-compacting concrete is perfectly possible and also potentially reducing
amount of cement in concrete mixture with high workability.
This research had been conducted by Nik Mohd Zaini Nik Soh et al., to explore the
suitable proportion of Sodium Hydroxide (NaOH) treatment for Oil Palm Empty Fruit Bunch
(EFB) fibre to increase the compatibility of cement with EFB fibre. The fibre treated with
NaOH has shown a significant different on the hydration temperature for EFB fibre- cement
mixed compared with the untreated fibre. The higher NaOH concentration, the greater
hydration temperatures obtain. Besides that, the increment NaOH concentration applied, the
rougher EFB fibre surface is observed with lesser silica body remain. The tensile properties
of individual fibre treated with NaOH (0.4%, 1% and 4%) has shown significant increment as
compare to the untreated fibre.
Teddy et al., conducted a study on different Sulphate Reduction Bacteria (SRB)
concentration (0%, 3%, 5% and 7%) and water cement ratio (0.4w/c, 0.5w/c and 0.6w/c) in
term of compressive strength and water penetration. Test results indicated that the best SRB
concentration to be mixed in bio-concrete was 5% while 0.5w/c for water cement ratio. Both
values enhanced significantly the compressive strength and reduced porosity and water
penetration of bio-concrete. These improvements were due to deposition on the SRB cells
within the pore of the concrete cube as cured in chloride water. Results of this study
demonstrated the role of SRB induced calcium carbonate precipitation in improving the
concrete structure cured in extreme condition in term of compressive strength and water
penetration.
From previous studies, the strong acid leaching treatment was carried out to remove
metallic impurities in Coal Bottom Ash (CBA). The usage of strong acid could significantly
hazardous to human and environment. Yahya et al., conducted a study on the leaching process
by replacing the usage of strong acid with citric acid which acted as weaker acid. Experimental
result shows that the acid leaching treatment has potential to be used in reducing metallic
elements in CBA under optimum solution temperature of 400⁰C with 4% acid concentration
at 60 min reaction period. The characteristic of CBA was also determined by comparing the
SEM, particle distribution, specific gravity, water content and setting time of raw CBA with
treated CBA.
Interlocking Compressed Earth Brick (ICEB) are cement stabilized soil bricks that allow
for dry stacked construction. M.M. Zamer et al., used Ureolytic Bacteria (UB) in this study
as a partial replacement of limestone water with percentage of 1%, 3% and 5%. Enrichment
process was done in soil condition to ensure the survivability of UB in ICEB environment.
This paper evaluates the effect of UB in improving the strength and water absorption
properties of ICEB and microstructure analysis. The results show that addition of 5% UB in

MCRJ Special Issue Vol. 4 | No. 2 | 2018 ix
ICEB indicated positive results in improving the ICEB properties by 15.25% in strength,
14.72% in initial water absorption and 14.68% reduction in water absorption.
Mohamad Azim Mohammad Azmi et al., investigated the addition of cement and
bagasse ash in contaminated landfill soil in term of its engineering properties such as the
Atterberg limit, specific gravity, linear shrinkage and soil compaction. Tests were conducted
on three different groups of soil samples: landfill soil as the control sample, samples which
contained cement only (5%, 10%, 15% and 20% of cement) and samples which contained a
mixture of cement and bagasse ash (BA) (2.5% cement + 2.5% BA, 5% cement + 5% BA,
7.5% cement + 7.5% BA and 10% cement + 10% BA). The addition of cement and bagasse
ash increased the optimum moisture content and reduced the maximum dry density of soil.
As conclusion, the use of cement and bagasse ash in this study improved the engineering
properties of contaminated landfill soil.
Lightning Protection System (LPS) plays a vital role to protect the structure by dissipate
the lightning current to underground safely. New installation method of LPS has implement
in Malaysia which to embed the lightning protection cable in a concrete structure. Mustaqqim
Abdul Rahim et al., carried out a study to determine the natural frequency of additional
reinforcement concrete beam by using impact hammer test. The results shown that the natural
frequency of additional reinforcement concrete beam has slightly decreases after strike of
electric current. From the results also found out that the location of lightning protection cable
to attach in the concrete beam will influence the natural frequency of concrete beam.
Shahrul Niza Mokhatar et al., explored the impact damage of reinforced concrete beams
subjected to low velocity impact loading at the ultimate load range. In this study, an impact
tests is carried out on reinforced concrete beam consisting Modified Artificial Polyethylene
Aggregate (MAPEA) as the replacement of coarse aggregate. There are twelve beam
specimens of size 120 mm x 150 mm x 800 mm are categorized into three groups which
denoted as Normal Reinforced Concrete (NRC), reinforced concrete with MAPEA concrete
block infill (RCAI) and reinforced concrete with 9% of MAPEA as a coarse aggregate
(RC9A). The result of the laboratory test showed that the RC9A beams produced less crack
and low value of residual displacement.
Composite slab usually consists of corrugated steel deck and concrete topping. Therefore,
Zainorizuan Mohd Jaini et al., introduced foamed concrete as concrete topping to reduce
the self-weight of composite slab. More focus was given on the effect of thickness toward the
natural frequency, damping ratio and energy dissipation of composite slab. The composite
slab was cast with the size of 840mm width, 1800 length and five different thicknesses range
between 75mm to 175mm. Foamed concrete was deliberately designed for the density of
1800kg/m3 with the utilization of Rice Husk Ash (RHA) as partially sand replacement and
Polypropylene Mega-Mesh (PMM) as fiber reinforcement. It was observed that the natural
frequency decreases with the increment of thickness. The damping ratio and energy
dissipation indicate a significant increment correspond to the thickness of composite slab.
Ma Chau-Khun et al., presents a critical review on the state-of-the-art of the current
research development on pre-tensioning steel straps confinement. The paper was started with
highlighting the features of such confining technique, then an extensive description of the
connection clip systems was presented. The experimental and numerical investigations

MCRJ Special Issue Vol. 4 | No. 2 | 2018 x
performed on steel-strapped concrete structures were discussed. This paper also covered the
potential usage of pre-tensioning steel straps confinement in increasing the bond properties of
confined concrete and as a repairing technique of damaged concrete.
Shahrin Mohammad et al., presents a study on the development of a nonlinear numerical
analysis that is capable of simulating the quasi-static semi-rigid behaviour of structural steel
frames under variable loadings for reliable design. The beam element shape functions with
semi-rigid connections are formulated and the overall stiffness matrix is derived. The theory
to solve the nonlinear analysis is also presented. The developed procedures also revealed the
complex finite element calculations in order to identify the structural performance of
nonlinearity for steel structures. The major modifications that include the revised solution
procedure, the variable load pattern capability, the quasi-static connection model, the
modification of input data to cater for initial imperfections and the inelastic constitutive model
for steel are presented. From the results, the modified procedures are capable to predict the
behaviour of the structural steel frames under varying loading conditions with various
connections configuration and material properties.
Concrete-Filled Double Skin Steel Tubular (CFDST) columns were often used in outdoor
construction where fire is not a main concern. Therefore, this series of research, Sharifah
Salwa Mohd Zuki et al., deals with the behaviour of Concrete-Filled Double Skin Steel
Tubular (CFDST) columns after fire exposure, residual strength and method of repairing fire-
damaged columns. This particular paper focused on the effectiveness of Hybrid Fiber
Reinforced Polymer (FRP) repairing method. It was found that by using Hybrid FRP, the
ultimate strength at failure of repaired specimens greatly increased when compared to fire-
damaged specimens to the extent of exceeding the control specimens. In addition, FRP is also
effectively confined thinner outer steel tube than thicker outer steel tube.

THEME 1:
CONSTRUCTION

MCRJ Special Issue Vol. 4 | No. 2 | 2018 2
INVESTIGATING BENEFITS OF NET ZERO ENERGY BUILDINGS (NZEBS) FOR HEALTHCARE BUILDINGS: PRELIMINARY FINDINGS FROM ARCHITECT’S PERSPECTIVE Roy Hazli Abdellah1, Md Asrul Nasid Masrom, Goh Kai Chen, Sulzakimin Mohamed and Norpadzlihatun Manap 1Department of Construction Management, Faculty of Technology Management and Business, Universiti Tun Hussein Onn Malaysia, 86400 Parit Raja, Johor, Malaysia
Abstract In recent years, Net-Zero Energy Buildings (NZEBs) concept has received incrementing attention especially since European Union Parliament are progressively moving towards regulation in which all new buildings to be “nearly Zero-Energy” Buildings by 2020. In the context of Malaysia construction industry, the government has a significant concern about energy consumption and the negative impacts of inefficient of energy usage. Although this concept provides promising benefits, however, previous studies found that the benefit of NZEB is still doubtable to the Malaysian construction industry, particularly for healthcare buildings. The NZEBs concept implementation is crucial in healthcare building as it seen as a key part of the needed transition towards sustainable energy efficiency as well as co² emissions control in its energy dimension. This paper aims to determine benefits of NZEBs practices through preliminary investigation among architects. Several existing energies works of literature and pilot studies by using semi-structured interviews were conducted. The findings reveal that, although the term ‘NZEBs design strategies’ is not being used broadly across construction industry in Malaysia, some green practices related to the design stage of construction has been carried out. The findings are also encouraging in increasing awareness, practices and implementation of NZEBs design strategies by the practitioner in Malaysia. It is envisaged that the paper will provide a basic knowledge for future research in NZEBs design strategies practices for healthcare buildings construction in Malaysia. Keywords: Net zero energy buildings; Healthcare buildings; Benefits; Architect’s perspective; Malaysia
INTRODUCTION
Net-Zero Energy Buildings (NZEBs) is a concept that uses renewable energy technology
to produce a mix of renewable electricity and other renewable heat resources like biomass and
solar to generate as much energy as they consume (Antonin et al., 2014). Similarly, Sartori et
al. (2010) emphasized that NZEBs is conceptually a building with a lower of energy demand
and are balanced by the on-site generation of electricity, or other energy carriers, from
renewable sources. Moreover, another study by Kurnitzki et al. (2011) and Voss et al. (2011)
highlighted that Net-Zero Energy Buildings (NZEBs) are typically a grid-connected building
with very high energy performance. On the other hand, NZEBs are buildings with the concept
of cost-optimal in which ensuring the minimum cost of the estimated economic life cycle of
the building, by taking the package of efficiency measures.
Despite today’s buildings energy consumption demand increasing significantly, NZEBs
concept practices enable to develop a network of clean domestic energy assets. The timeline
for the implementation of NZEBs according to the Energy Performance of Buildings
Directive (EPBD) recast is illustrated in Figure 1.

MCRJ Special Issue Vol. 4 | No. 2 | 2018 3
Figure 1. Timeline for NZEBs implementation according to the EPBD recast. (D’Agostino et al., 2016)
As highlighted in Figure 1, NZEBs has gained much attention in 2010 through EPBD
recast. Based on the recast, European Union Parliament had agreed to set the targets for all
members of Parliament to regulate a regulation in their counties that all new buildings are
NZEBs in 2020. Thus, NZEBs has been seen as one of important concept that need to be
address and implement in every country. Besides that, the NZEBs implementation in
healthcare building is a key part of the needed transition towards sustainable energy efficiency
as well as (CO2) emissions control in its energy dimension. According to Morgenstern et al.
(2016), the healthcare buildings have high electricity consumption as the result of the
extensive use of various medical equipment, mechanical ventilation of building, lightings, and
sterilization. Besides that, some of the countries have shown that healthcare buildings are
considered as one of the most energy-intensive commercial-sector buildings. For instance,
healthcare buildings in the United States are considered as one of the most intensive users of
total energy among the building types where the high electricity consumptions are due to the
continuity of services and the utilizations variety of complex applications in energy-intensive
equipment such as medical imaging equipment (USEIA, 2016).
In the context of Malaysia’s construction industry, there is an upward trend of demand in
energy consumption in building sector as the energy consumption in the commercial and
residential building had an increase of 2.7% and accounts for up to 14.4% in 2013 as compared
to 11.7% in 1993 (Suruhanjaya Tenaga, 2015). Additionally, Saidur et al. (2011), analysed
the energy use, energy savings and corresponding emission reductions for the energy using
equipment in a public hospital in Malaysia. The authors reported that around 19,311 MWh of
energy consumption for the hospital in 2008. Besides that, for the end-use energy breakdown
for the hospital, the authors found that lighting uses a major fraction of total energy
consumption comprises of 36% and followed by medical equipment which accounts for 34%.
The findings also showed that the energy intensity of the hospital is 234 kWh/m.
In response, the aim of this paper is to present findings based on an exploratory study of
architect’s perspectives in terms of their knowledge of NZEBs and sustainable practices in
Malaysia. An emphasis is given on the NZEBs benefits through NZEBs design strategies
since the literature finds there are many possible ways of design strategies to achieved NZEBs.
This paper intends to fill gaps in our understanding of benefits that can be gained from NZEBs
concept in Malaysia healthcare buildings through NZEBs design strategies and necessary to
recommend ways for constructions practitioners to design a healthcare building according to
NZEBs concept while maintaining quality in the delivery of health services.

MCRJ Special Issue Vol. 4 | No. 2 | 2018 4
LITERATURE REVIEW
The objective of this section is to review the Malaysia healthcare projects developments
as well as an overview of sustainability in construction. Moreover, the existing NZEBs
definitions framework will be reviewed in this section as it is important to be clear and
understand for this paper. Besides that, this section will also explain the principle of NZEBs
and the NZEBs adaptation in healthcare building design.
MALAYSIA HEALTHCARE PROJECT DEVELOPMENT
In general, the total health expenditure for Malaysia’s national spending shows an
increasing trend from RM8,303 million in 1997 to RM44,748 million in 2013 (MoH, 2015).
From this trend, it is indicating that the Malaysia’s health expenditure is growing
exponentially over sixteen years. Even though there is a breakdown of several types of
expenditure, but most of this expenditure is spent for curative care whereby curative care
services provided by hospitals include in-patient, out-patient, day-care services with minimal
home care services in which consuming 61 percent of the total expenditure as illustrated in
Figure 2.
Figure 2. Public sector expenditure by functions of health services, 2013
(Malaysia Ministry of Health, 2015)
Furthermore, based on the Tenth Malaysia Plan (10MP – 2011-2015), there are four
strategies that need to be implemented in order to support one of the trust in 10MP which is
to achieve the quality of life of an advanced nation. The four strategies involved are: 1.
Establish a comprehensive healthcare system & recreational infrastructure, 2. Encourage
health awareness & healthy lifestyle activities, 3. Empower the community to plan or
implement individual wellness programme (responsible for own health), 4. Transform the
health sector to increase the efficiency and effectiveness of the delivery system to ensure
universal access. Based on those strategies, three Key Result Areas (KRA) were identified
which comprising health sector transformation towards a more efficient and effective health
system in ensuring universal access to healthcare, health awareness and healthy lifestyle and
empowerment of individual and community to be responsible for their health (MoH, 2012).
Therefore, The Country Health Plan: 10th Malaysia Plan 2011-2015 has highlights several
physical healthcare development projects that will need to be implemented in order to achieve
KRA (MoH, 2012).

MCRJ Special Issue Vol. 4 | No. 2 | 2018 5
As a matter of facts, since 2007 until 2014, the development progress of healthcare
buildings projects in Malaysia is consistent every year although, for the past four years, the
allocation budget for the healthcare project development is decreasing in 2014 as compared
to 2011. However, as compared to 2010, there is an increase of 2 new hospitals in 2014.
Moreover, up to 2014, there are 133 government hospitals and 9 special medical institutions
which comprise of 35,318 beds and 4,942 beds respectively (MoH, 2014). Overall Bed
Occupancy Rate (BOR) for MoH hospitals and Institutions in 2014 was 71.79%. Besides that,
in the Tenth Malaysia Plan (10MP – 2011-2015), the government has approved an allocation
of RM21.98 billion in 2014 to be allocated for MoH which consists of RM20.49 billion for
the Operating Budget and RM1.49 billion for the Development Budget.
The initial allocation for the development budget that has been approved by the
government for MoH in 2014 was RM 1.662 billion which includes constructing new
hospitals, upgrading existing hospitals, facilities and others (MoH, 2014). However, the
allocation was reduced to RM1.495 billion due to warrants restrictions. MoH has spent
92.90% of the adjusted development budget allocation, or equivalent to RM1.389 billion
which comprised of 71 new MoH programs. Based on 71 new MoH programs, it is involved
in 67 physical projects and 4 non-physical projects (MoH, 2014). Moreover, for the physical
projects, Public Works Department (JKR) will handle 53 projects while JKR Sabah and JKR
Sarawak will handle 4 projects and 3 projects respectively. The remaining 4 projects will be
handled by the Engineering Services Division (ESD) of MoH (MoH, 2014).
Therefore, it is important to consider the healthcare buildings sustainability in the long
term. Some of the challenges including low building performance and high energy
consumption for Malaysian healthcare buildings need to be address in order to ensure the
sustainability of healthcare buildings can be performed and thus the KRA in which to support
the health sector transformation towards a more efficient and effective health system in
ensuring universal access to healthcare could be achieved.
OVERVIEW OF SUSTAINABILITY IN CONSTRUCTION
Recently, there is a growing attention given towards sustainability in construction or
sustainable development. Generally, sustainability can be described as the use of natural
resources whereby these resources are in such an equilibrium condition that do not attain
deterioration, depletion and non-renewable point and these resources able to be used for the
next generations (Yılmaz & Bakış, 2015). In addition, the term sustainable development can
be defined as improving social, economic and environmental conditions by increasing the
quality of life of people and allow them to live in a healthy environment (Ortiz et al., 2015).
In other words, sustainability enables people to foresee a continuous development without
take it for granted of the resources that were used in order to prevent resources depletion for
the next generations.
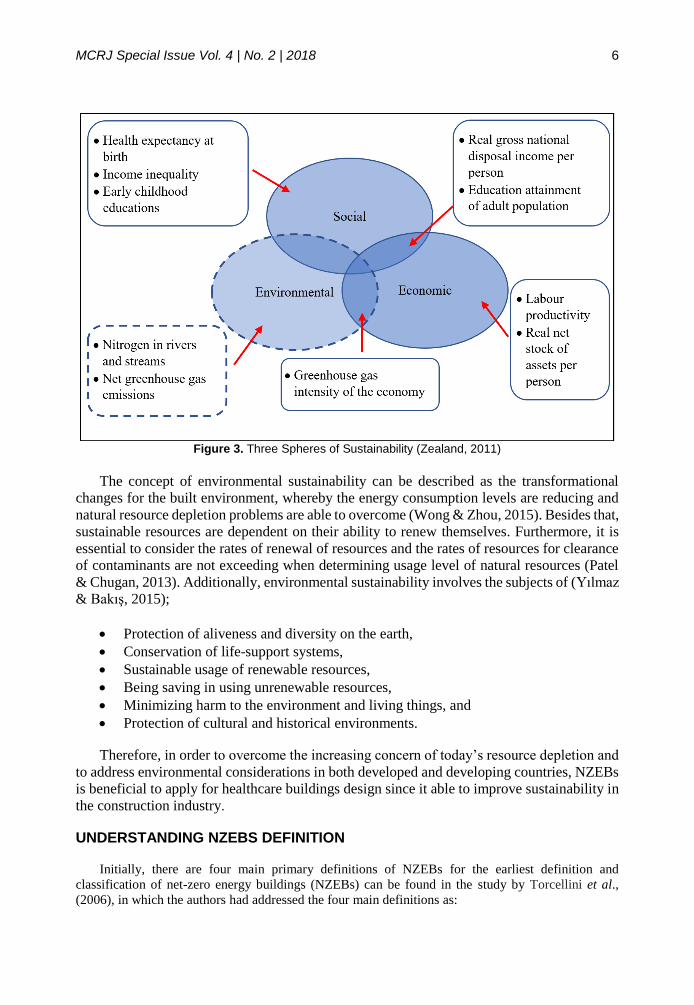
In general, sustainability has three main components namely environmental, economic,
and social as illustrated in Figure 3. For the sustainability of construction, it is directly
involved in the environmental aspects of sustainability. Moreover, the NZEBs concept in
constructions will enable to support the environmental aspect.
MCRJ Special Issue Vol. 4 | No. 2 | 2018 6
Figure 3. Three Spheres of Sustainability (Zealand, 2011)
The concept of environmental sustainability can be described as the transformational
changes for the built environment, whereby the energy consumption levels are reducing and
natural resource depletion problems are able to overcome (Wong & Zhou, 2015). Besides that,
sustainable resources are dependent on their ability to renew themselves. Furthermore, it is
essential to consider the rates of renewal of resources and the rates of resources for clearance
of contaminants are not exceeding when determining usage level of natural resources (Patel
& Chugan, 2013). Additionally, environmental sustainability involves the subjects of (Yılmaz
& Bakış, 2015);
• Protection of aliveness and diversity on the earth,
• Conservation of life-support systems,
• Sustainable usage of renewable resources,
• Being saving in using unrenewable resources,
• Minimizing harm to the environment and living things, and
• Protection of cultural and historical environments.
Therefore, in order to overcome the increasing concern of today’s resource depletion and
to address environmental considerations in both developed and developing countries, NZEBs
is beneficial to apply for healthcare buildings design since it able to improve sustainability in
the construction industry.
UNDERSTANDING NZEBS DEFINITION
Initially, there are four main primary definitions of NZEBs for the earliest definition and
classification of net-zero energy buildings (NZEBs) can be found in the study by Torcellini et al.,
(2006), in which the authors had addressed the four main definitions as:

MCRJ Special Issue Vol. 4 | No. 2 | 2018 7
• Net Zero Source Energy - A source ZEB produces at least as much energy as it uses in a year
when accounted for at the source. Source energy refers to the primary energy used to generate
and deliver the energy to the site.
• Net Zero Energy Costs - In a cost NZEB, the amount of money the utility pays the building
owner for the renewable energy the building exports to the grid is at least equal to the amount
the owner pays the utility for the energy services and energy used over the year.
• Net Zero Site Energy - A site NZEB produces at least as much energy as it uses in a year
when accounted for at the site.
• Net Zero Emissions - A net-zero emissions building produces at least as much emissions-free
renewable energy as it uses from emissions-producing energy sources.
According to the four definitions as highlighted above, it showed that NZEBs is a concept
that can represent buildings that is a grid-connected, where the buildings able to produces
energy from various types of renewable sources and the building’s energy consumption are
equal with its energy production during the period of one year. This view is supported by
Sartori et al. (2010) that highlighted NZEBs is theoretically a building with a lower of energy
demand and are equal by the on-site generation of electricity, or other energy carriers, from
renewable sources. In the same vein, another study by Kurnitzki et al. (2011) and Voss et al.
(2011) emphasized that NZEBs are characteristically a grid-connected building with very high
energy performance. Thus, it showed that there is a large volume of previous studies
describing the role of renewable sources toward NZEBs and resulting a lower of energy
demand in buildings.
Concerning that the pathway to a NZEB is given by the balance of energy efficiency and
energy supply, hence the criteria on energy efficiency and energy supply are important to the
definition framework (Sartori et al., 2012). As illustrated in Figure 4, the graph displayed that
the NZEBs underlines the priority of energy efficiency as the path to success. Similarly,
Buildings Performance Institute Europe (BPIE) in its reports entitled “Implementing Nearly
Zero-Energy Buildings (NZEB) In Poland - Towards A Definition And Roadmap”, BPIE
specified that the government of Poland has to support the energy efficiency measure in order
to successfully implementing NZEBs (BPIE, 2015). Hence, it shows that energy efficiency
measure has a significant part in NZEBs and this measure should not be overlooked.
To conclude, based on the developed NZEBs definition framework, it is understood that
NZEBs represent buildings that are connected to the electricity grid and the total usage of
energy is equal to the total ‘onsite’ generation of energy from a renewable source over the
course of a year. Besides that, NZEBs are buildings with high energy performance and are
optimally efficient. Other than that, it is important to realise that energy efficiency plays an
important role towards NZEBs implementation success.

MCRJ Special Issue Vol. 4 | No. 2 | 2018 8
Figure 4. Graph represents the balance concept of NZEBs (Sartori et al., 2012)
EXISTING REVIEWS ON NZEBS CONCEPTS
Since 2008, the participation of several countries through an international collaborative
research initiative IEA SHC Task 40 / ECBCS Annex 52 “Towards Net Zero Solar Energy
Building” has been working to establish an internationally agreed understanding on NZEBs
and international definitions framework (Marszal et al., 2011). Even though it is a challenging
task to determine if a building is truly NZEB, but Buildings Performance Institute Europe
(BPIE) (2011), in the study towards a successful implementation of nearly Zero-Energy
Buildings introduced that there are three principles and approaches for implementing NZEBs
as illustrated in Figure 5, which are the first principle of energy demand, second principle for
renewable energy share and third principle for primary energy and CO2 emissions.
Figure 5. Principles in implementing NZEBs
For the first principle which is energy demand, it is essential to be realised that there are
a variety of ways to approach energy demand reduction with much different of academic
disciplines (Sorrell, 2015). Furthermore, socio-economic aspects mostly dominated the
energy demand side (Schmidt & Weigt, 2013). Therefore, it is important that the boundary in
the energy flow related to the operation of the building which consists of energy demand
quality and method to assess corresponding value should be a clearly defined (BPIE, 2011).
According to Schmidt & Weigt (2013), several aspects such as efficiency of markets, the
performance of business and design of products, including choices, behaviors, practices, and
lifestyles of consumers need to be considered in order to achieve a change on the demand
First Principle
•Energy Demand
Second Principle
•Renewable Energy Share
Third Principle
•Primary Energy and CO² Emissions

MCRJ Special Issue Vol. 4 | No. 2 | 2018 9
side. Besides that, building’s energy demand involving the sum of useful heat, cold and
electricity needed for space cooling, space heating, domestic hot water, and lighting should
also include the distribution and storage losses within the building (BPIE, 2011).
For the second principle which is renewable energy share, the application of renewable
energy technologies has a lot of benefits and potentials in providing energy services with
reducing the emissions of both air pollutants and greenhouse gases as well as protecting the
environment. According to Panwar et al. (2010) in the study of renewable energy gadgets to
meet out energy needs and mitigation potential of greenhouse gases, the authors highlighted
that the development of renewable energy system potentially to resolve the presently most
critical tasks such as improving the reliability of energy supply, solving problems that relates
to the local energy and water supply, improving the standard of living as well as increasing
the level of employment of the local population, and implementation of the obligations of the
countries with regard to fulfilling the international mutually agreements relating to
environmental protection.
Therefore, BPIE (2011) stated it is important that the boundary in the energy flow related
to the operation of the building where the calculation and measurement of renewable energy
share are clear and method to assess this share including the sum of energy needs and system
losses should be clearly defined. For instance, the application of hybrid power generation
system which involves the combination of two energy resources which are the wind and solar
energy is an effective solution to generate energy and this hybrid power generation system
has better efficiency for energy generation than the conventional energy resources (Ingole &
Rakhonde, 2015).
For the third principle, that is primary energy and CO2 emissions are crucial to being
considered in the implementation of NZEBs. According to Zavadskas et al. (2017), primary
energy can be generally defined as the total energy consumption in the form of natural
resources to produce final energy in the form of electricity or district heating. Furthermore,
the consideration of primary energy use is important, as it will reflect the NZEBs concept. For
instance, 13 Member States in the European Union have included a numerical target of
primary energy use to apply with NZEBs definition in practice (Boermans et al., 2014).
In addition, the role of primary energy as a performance indicator is significant as in the
Directive 2010/31/EU on the energy performance of buildings (EPBD), it is stated that the
energy performance of a building shall include an indicator based on primary energy factors
(PEFs) (Recast, 2010). Moreover, Bruni & Sarto et al. (2013) pointed out that the use of
primary energy as performance indicator able to provide a measure of CO2 emissions besides
energy consumption, and the authors added that the current Italian building regulations use
primary energy as the indicator.
Therefore, it is important that the principles of NZEBs are clear and method to assess
should be clearly defined. Besides that, clear national rules should be available on how to
account for the net export if the generation of renewable energy is greater than the energy
consumptions during a balance period.

MCRJ Special Issue Vol. 4 | No. 2 | 2018 10
RESEARCH METHODOLOGY
The objective of this section is to explain the methods that were used for this paper
comprised of research design and interview data collection procedures. This paper reviewed
an existing literature relating to NZEBs in order to gain an understanding as well as insight
into previous studies. To ensure the quality of this paper. A literature review is important to
provide insight into ways in which the researcher can limit the scope to a needed area of
inquiry (Creswell, 2013). Besides that, the semi-structured interviews were conducted with
architects in order to explore their understanding on NZEBs as well as to explore the
sustainable practices in the context of Malaysian construction industry. The summary data
gathering process is illustrated in Figure 5.
Figure 5. Data gathering process
INTERVIEW DATA COLLECTION PROCEDURE
A semi-structured interview was chosen for this study since there is a limited literature
on the NZEBs practices or sustainable practices for designing healthcare buildings in
Malaysia context. Thus, these interviews were conducted to focus on getting an understanding
of this aspect. In addition, despite simply rely on studies from other countries, the interview
sessions that have been conducted are important to ensure that all sustainable practices in
Malaysia are captured. The interviews sessions are important since Malaysia’s culture differs
than the other countries. The difference in terms of locality aspect, cultural aspect or
governance aspect should be taken into consideration. Hence, by directly asking the architects
who are involved in Malaysian construction industry, sustainable practices that may only
apply to Malaysia context can be identified.
Moreover, the “face-to-face” method of interviews will be undertaken for this study. The
selections of places for interviews was decided by interviewees, and each of interview took
approximately 30 to 60 minutes to complete. All sessions are recorded for the purpose of
transcription as well to ensure that the data is accurate. Besides that, all information that has
been obtained from the interview sessions are screened and compared with the literature
review in order to find similarities and disparities.

MCRJ Special Issue Vol. 4 | No. 2 | 2018 11
Furthermore, the authors used the concept of saturation in order to determine the suitable
sample size for the interviews. This decision was based upon recommendations by Mason
(2010) to avoid ending up with repetitive and unessential information which does not
contribute to the research. Besides that, the amounts of information obtainable from
interviews do not necessarily increase just because more data was obtained (Mason, 2010)
and the authors further claimed that researchers generally use saturation as a guiding principle
during their data collection towards determining appropriate sample sizes. Therefore, the
authors decided to choose 3 interviewees to be interviewed for this paper. The interviewees
were assigned codes as R1, R2, and R3. Besides that, to ensure the quality of the interviews,
all respondents required to be active in Malaysian construction industry and had direct
involvement in the buildings projects located within Malaysia. The key profiles for the
interviewees are shown in Table 1.
Table 1. Key profiles for interviewees
Item R1 R2 R3
Position Architect Architect Architect
Organization Consultant Consultant Developer / Client
Experience More than 5 years More than 5 years More than 5 years
As for the interviews, the objective of this paper will be involved to obtain the architect’s
opinions on design and practices of NZEBs based on the Malaysian construction industry
context as well as to identify the benefits of NZEBs.
FINDINGS AND DISCUSSION
In order to identify the benefits of NZEBs, the practices that support this concept are
crucial to being identified. Based on Leach et al. (2014) there is a growing interest in NZEBs
as many NZEBs demonstration projects showed that the goal of this concept is achievable.
However, the need to identify NZEBs approaches is crucial in order to enable broad
replication of NZEBs, especially in a healthcare building.
Furthermore, all interviewees indicate that there are various of ways to achieve
sustainability in construction since construction sustainability is too wide and different
architect will have its own different of sustainable practices, but then all practices will be
based on the same principles which are to increase the dependent on renewable sources as
well as to protect the environment (R1, R2, R3). Similarly, according to Aelenei et al. (2013)
in the study on close inspection of the relevant design strategies and relative performance
indicators of the eight case studies, the authors stated that there is no standard approach for
designing NZEBs. However, Habash et al. (2014) highlighted that it is important for architects
or engineers to have specific design guidelines and strategies in order to popularize NZEBs.
Even though there are still no specific design strategies in achieving NZEBs design, but
based on Lu et al. (2015) there are several common design elements and some consensus in
designing NZEBs. The design elements that support NZEBs is important to be identified since
the adaptation of NZEBs in buildings will ensuring the high performance in buildings can be
achieved as well as to support the use of renewable energy for buildings.

MCRJ Special Issue Vol. 4 | No. 2 | 2018 12
Generally, according to Aelenei et al. (2012) and Lu et al. (2015), there are three main
steps of a design approach that can be applied in designing NZEBs which are the first design
approach is a passive approach that focused on reducing energy demand. The second design
approach is the use energy efficiency system, and the third design approach is renewable
energy system which is needed to generate renewable energy as well as to offset in large
measure the energy demand. The combination of this three-design approach is also crucial to
be taken in designing healthcare buildings since these approaches able to succeed in reaching
the desired energy performance as well as NZEBs target.
Passive approaches are one of the key element when designing NZEBs as this approach
will affect directly to the energy needs for the buildings mechanical and electrical systems,
and also indirectly affect the renewable energy generation (Aleinei et al., 2013). Similarly,
Scognamiglio et al. (2014) also highlighted that the passive approach plays a significant part
in the NZEBs design. Besides that, the improvement of energy consumption of a building can
be achieved through passive design strategies as buildings are constructed that react to the
environment, hence it is possible for a building to achieve high environmental quality
(Hootman, 2012).
Furthermore, Habash et al. (2014) stated that architects have an important role in
controlling aspects of a passive design when designing NZEBs. Similarly, some of the
interviewees have highlighted that an architect is responsible to ensure some elements of
passive approach should be carried out in order to support the sustainability of construction.
When designing a healthcare building, an architect has to follow the standard specification
and requirements that have been set by the government. However, an architect can propose
some sustainable materials to be applied when designing the healthcare buildings (R1). For
design and build projects, an architect is encouraged to apply some sustainable elements into
passive approaches such as materials selections and a number of ventilation for the buildings.
(R2).
One of the most important aspects of passive design strategies is maximizing the amount
of natural daylight into a building and reduce the amount of energy requires for artificial
lighting in a building (Aksamija, 2015). This strategy is important for designing buildings,
especially healthcare buildings since these types of buildings is operating continuously 24
hours a day and required a huge amount of artificial light to provide services to patients.
Besides that, it is important to control passive design strategies in a building as this approach
will influence the energy performance of a building such as natural lighting, heat gain,
shading, and envelope conduction. (Habash et al., 2014; Omrany and Marsono, 2015). In
addition, Aleinei et al. (2013) stated that the passive design strategies in buildings should be
appropriately orientating building towards solar heating maximization when buildings are
dealing with heating challenges.
Moreover, according to Thalfeldt et al. (2013) when designing NZEBs, façades have a
strong impact on heating, cooling and artificial light in the building needs as well as on
daylight. Thus, it is important to realise that the passive heating solutions are essential to be
studied along with passive cooling solutions in order to prevent overheating in a building
(Aleinei et al., 2013). Therefore, it is important to consider passive approach while designing
NZEBs as it will enable maximisation of natural daylight and the amount need of artificial
light in the building needs will be reduced, hence it will create a pleasant environment.

MCRJ Special Issue Vol. 4 | No. 2 | 2018 13
Besides that, the energy required for heating, cooling and lighting the healthcare buildings
can be reduced through passive approach, thus this design approachable to support the
principles of NZEBs and the benefits that can be gained from NZEBs is where the energy
demand for buildings can be reduced.
In regards to second design approaches which is the utilisations of energy efficiency
system, it is important to realise that the pathway towards NZEBs is reducing energy demand
by means of energy efficiency measures (Sartori et al., 2010). Besides that, energy efficiency
has a significant part to act as a parameter that indicates the reduction level of energy
consumption in carrying out a related task (Parameshwaran et al., 2012). Generally, energy
efficiency can be improved by several design strategies including airtightness to avoid
infiltration and mechanical ventilation systems with heat recovery to provide air conditioning
and indoor air quality (IAQ) (Barbolini et al., 2017). However, the selection of high-efficiency
technologies is also crucial in the improvement of energy efficiency in a building. One of the
interviewees has indicated the importance of energy efficiency system in healthcare buildings.
As an architect, we have emphasized the importance of energy efficiency measure for this
healthcare building since this measure is much easier to be applied rather than the passive
approaches and these measures do not relates to any hygienic condition requirements (R1).
There are various energy efficiency technologies that can be applied in buildings. For
instance, the use of low power lighting, energy efficient electrical equipment such as washing
machines and dishwashers with a warm water connection are strategies in planning an equated
energy balance (Musall & Voss, 2012). Similarly, based on Maassen (2017), healthcare
building’s energy demand can be significantly reduced by considering energy efficiency as a
factor in buying medical equipment, besides the proper use of electricity.
Moreover, in relation to the availability of energy efficiency technologies in Malaysia,
there are no problems to obtain the technologies since Malaysia is one of developing countries
(R2, R3). However, the cost of this technologies is quite high and for that reason, most of the
developers are not fully utilised the application of energy efficiency technologies in buildings
(R3). Similarly, based on Vogel et al. (2015) which investigated barriers that prevent energy
efficiency adoption in multifamily buildings in Sweden and authors proposed a novel
categorization framework for barriers to energy efficiency in buildings.
The results showed that barriers related to contextual level are the most significant to
prevent energy efficiency adoption. The contextual level is characterized by the rules and
regulations that influence technological design and market development. In addition, as stated
by interviewees R2, The local authorities will reject the proposal of purchasing some energy
efficiency technologies form the architect if the cost is too high (R2). Thus, based on the
findings and the arguments, energy efficiency measure in a building is vital towards designing
a healthcare that achieved NZEBs since energy reduction, as well as energy savings in
buildings, can be achieved. Moreover, by improving the energy efficiency of the various
incorporated building systems, it will help to reduce building´s energy demand (Sartori et al.,
2012). It shows that NZEBs can provide a reduction in both primary energy as well as CO2
emissions.
For the third design approaches which are renewable energy system, the necessity of
renewable energy systems is vital towards NZEBs since these systems are required to reduce
MCRJ Special Issue Vol. 4 | No. 2 | 2018 14
and as well as to offset the thermal energy need in buildings. Moreover, designing NZEBs is
not only achieved by reducing the energy consumption of the building with passive design
methods or the application of energy efficient system in buildings, but NZEBs should also be
designed with the balances energy requirements between active energy production techniques
and renewable technologies in order to achieve the NZEBs objective (Kolokotsa et al., 2011).
For designing a healthcare building, it is important to consider renewable technologies as
part of the building since it able to reduce the dependency of non-renewable sources especially
past literature had shown that the energy consumption of healthcare buildings is high. Besides
that, the utilization of renewable energy systems in buildings can be a critical need and
solutions against global warming and environmental pollution (Koo et al., 2013).
Furthermore, most of the countries have already promoted the application of renewable
energy systems in buildings through enforcement, regulation, target, incentive, and fund
provided in the countries (Winkel et al., 2011). However, in the context of Malaysia, the
interviewees agreed that there is a lack of enforcement and target set by the government even
though there is some government efforts to promote renewable energy systems in Malaysia
(R1, R2, R3). One of the interviewees has highlighted that, The government has provided
some incentives to promote the green concept in construction such as tax exemption, however,
the enforcement is not executed strictly and thus, the utilisation of renewable technologies is
not widely used (R2).
With respect to renewable energy systems, there are a lot of benefits that can be gain from
these systems and several studies have demonstrated the benefits of these systems. For
instance, Phuangpornpitak & Tia (2013) studying the integration of renewable energy in a
smart grid system and they concluded that renewable energy system is one of incomparable
option to generate energy since these systems able to provide a clean energy resource.
However, they suggested that some issues such as the design, sizing, and the suitability of the
system in terms cost for energy generation need to be addressed in order to ensure that it can
be used thoroughly and commercially.
As a result, since renewable energy system is crucial towards NZEBs and there is a lot of
benefits that can be gained through these systems, this design approach should be applied
appropriately when designing a healthcare building. Besides that, policies and guidelines that
have been provided by the government should be along with enforcement in order to ensure
that all government’s efforts and targets can be achieved. Therefore, through the application
of renewable energy technologies to support NZEBs, it indicates that this concept can reduce
the dependency on non-renewable energy and thus, a greener environment can be achieved.
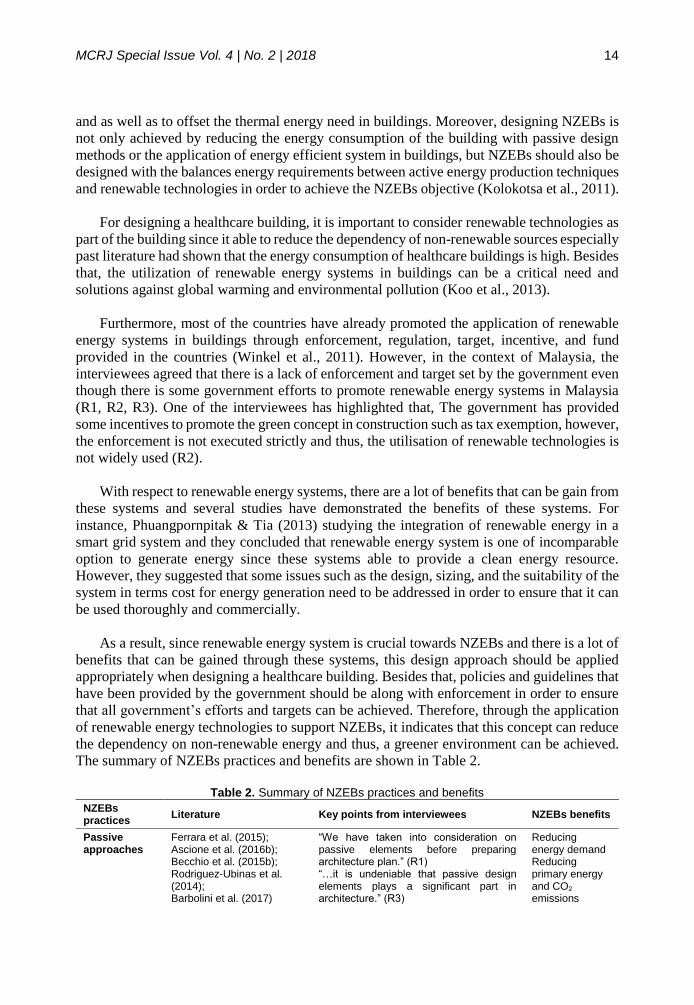
The summary of NZEBs practices and benefits are shown in Table 2.
Table 2. Summary of NZEBs practices and benefits
NZEBs practices
Literature Key points from interviewees NZEBs benefits
Passive approaches
Ferrara et al. (2015); Ascione et al. (2016b); Becchio et al. (2015b); Rodriguez-Ubinas et al. (2014); Barbolini et al. (2017)
“We have taken into consideration on passive elements before preparing architecture plan.” (R1) “…it is undeniable that passive design elements plays a significant part in architecture.” (R3)
Reducing energy demand Reducing primary energy and CO2 emissions

MCRJ Special Issue Vol. 4 | No. 2 | 2018 15
NZEBs practices
Literature Key points from interviewees NZEBs benefits
Energy efficiency technologies
Gaitani et al. (2015); Dalla et al. (2015); Buonomano et al. (2015); Ascione et al. (2016a)
“As an architect, we can propose to developer some energy efficiency system for buildings.” (R1) “If we don’t have any cost constraints, we can widely use energy efficiency in buildings to save electricity.” (R2)
Reducing primary energy and CO2 emissions
Renewable energy systems
Kurnitski et al. (2011); Becchio et al. (2015a); Tian et al. (2015): Mohamed et al. (2014); Ajla Aksamija (2015)
“…even though the movement is still slow, but we are still put our efforts to increase the utilisation of renewable energy technologies in buildings” (R2)
Increasing renewable energy share Reducing primary energy and CO2 emissions
CONCLUSION AND RECOMMENDATION
The NZEBs concept is gaining significant since it is a realistic solution for the mitigation
of CO2 emissions. The adoption of this concept into Malaysian healthcare buildings is vital
because of the energy consumption for this buildings is high and this concept able to support
the government initiative in Construction Industry Transformation Programme (CITP) 2016-
2020 which one of strategic thrust that seeks to transform the industry is environmental
sustainability. However, NZEBs concept in Malaysian construction industry is still
considered new and it needs to be explored. But, the previous studies on NZEBs able to give
an insight into design and practice of this concept and thus, it gives the understanding to be
explored based on Malaysia context. This paper is comprised of a comprehensive existing
literature review and through semi-structured interviews with architects in Malaysia that aims
to explore the architect’s opinions on benefits of NZEBs concept through the design and
practices of NZEBs in Malaysian construction industry context. The findings showed that by
the adaptation of NZEBs concept in Malaysia healthcare buildings, benefits that can be gained
through this concept are it helps to reduce energy demand for healthcare buildings, reduce
primary energy and CO2 emissions for healthcare buildings, and increase the renewable
energy share for healthcare buildings. However, the authors recommend that by increasing
the number of sample size, it will produce any significantly different findings. Besides that, it
is also recommended that this paper need to further investigate in order to get more
comprehensive findings as well as reflect more on the Malaysia context. Further, this paper
provides some sustainable design and practices as basis for further investigation.
REFERENCES
Aelenei, D., Aelenei, L., Musall, E., Cubi, E., Ayoub J. and Belleri, A. (2013) Design
strategies for non-residential zero-energy buildings: Lessons learned from Task40/Annex
52: towards net zero-energy solar buildings. In: CLIMA 2013 - 11th REHVA World
Congress & 8th International Conference on IAQVEC, Book of Proceedings, Prague,
Czech Republic, 1-10.
Aelenei, L., Ayoub, J. and Aelenei, D. (2012) Net Zero Energy Residential Building Case
Studies. Energy Conservation in Buildings & Community Systems, 56:10-12.
Aksamija, A. (2015) Regenerative Design of Existing Buildings for Net-Zero Energy
Use. Procedia Engineering, 118:72-80.

MCRJ Special Issue Vol. 4 | No. 2 | 2018 16
Antonin, V. D. B., Bernhard, V. M., Lou R. and Markus, O. (2014) Role of building
automation related to renewable energy in NZEB’s. (Report No. BUINL13782).
Kanaalweg: Ecofys Netherland.
Ascione, F., Bianco, N., De Rossi, F., De Masi, R. F. and Vanoli, G. P. (2016a) Concept,
Design and Energy Performance of a Net Zero-Energy Building in Mediterranean
Climate. Procedia Engineering, 169:26-37.
Ascione, F., De Masi, R. F., de Rossi, F., Ruggiero, S. and Vanoli, G. P. (2016b) Optimization
of building envelope design for nZEBs in Mediterranean climate: Performance analysis
of residential case study. Applied Energy, 183:938-957.
Barbolini, F., Cappellacci, P. and Guardigli, L. (2017) A Design Strategy to Reach nZEB
Standards Integrating Energy Efficiency Measures and Passive Energy Use. Energy
Procedia, 111:205-214.
Becchio, C., Bottero, M. C., Corgnati, S. P. and Ghiglione, C. (2015a) nZEB design:
challenging between energy and economic targets. Energy Procedia, 78:2070–2075.
Becchio, C., Dabbene, P., Fabrizio, E., Monetti, V. and Filippi, M. (2015b) Cost optimality
assessment of a single family house: Building and technical systems solutions for the
nZEB target. Energy and Buildings, 90:173-187.
Boermans, T., Grözinger, J., Ashok, J., Seehusen, J., Wehringer, F. and Scherberich, M.
(2014) Overview of Member States information on NZEBs-Working version of the
progress report-final report.
Bruni, E. and Sarto, L. (2013) An Italian pilot project for zero energy buildings: Towards a
quality-driven approach. Renewable energy, 50:840-846.
Buildings Performance Institute Europe. (2011) Principles for nearly Zero-Energy Buildings
Paving the way for effective implementation of policy requirements (Publication).
Buildings Performance Institute Europe.
Buildings Performance Institute Europe. (2015) Implementing Nearly Zero-Energy Buildings
(NZEB) In Poland - Towards A Definition and Roadmap (Publication). Buildings
Performance Institute Europe.
Buonomano, A., Montanaro, U., Palombo, A. and Vicidomini, M. (2015) NZEBs in
Mediterranean climates: energy design and optimization for a non-residential
building. Energy Procedia, 82:458-464.
Creswell, J. W. (2013) Research design: Qualitative, quantitative, and mixed methods
approaches, California: Sage publications, 31 pp.
D’Agostino, D., Zangheri, P., Cuniberti, B., Paci, D. and Bertoldi, P. (2016) Synthesis Report
on the National Plans for Nearly Zero Energy Buildings (NZEBs).
Dalla Mora, T., Cappelletti, F., Peron, F., Romagnoni P. and Bauman F. (2015) Retrofit of an
historical building toward NZEB. Energy Procedia, 78:1359-1364.
Ferrara, M., Fabrizio, E., Virgone, J. and Filippi, M. (2015) Appraising the effect of the
primary systems on the cost optimal design of nZEB: A case study in two different
climates. Energy Procedia, 78:2028-2033.
Gaitani, N., Cases, L., Mastrapostoli, E. and Eliopoulou, E. (2015) Paving the way to nearly
zero energy schools in Mediterranean region-ZEMedS project. Energy
Procedia, 78:3348-3353.
Habash, G., Chapotchkine, D., Fisher, P., Rancourt, A., Habash, R. and Norris, W. (2014)
Sustainable Design of a Nearly Zero Energy Building Facilitated by a Smart
Microgrid. Journal of Renewable Energy, 2014:1-14.
Hootman, T. (2012) Net zero energy design: a guide for commercial architecture. New Jersey:
John Wiley & Sons, 182 pp.

MCRJ Special Issue Vol. 4 | No. 2 | 2018 17
Ingole, A. S. and Rakhonde, B. S. (2015) Hybrid power generation system using wind energy
and solar energy. International Journal of Scientific and Research Publications, 5(3):1-
4.
Kolokotsa, D, Rovas, D., Kosmatopoulos, E. and Kalaitzakis, K. (2011) A roadmap towards
intelligent net zero- and positive-energy buildings. Solar Energy, 85(12):3067-3084.
Koo, C., Hong, T., Park, H. and Yun, G. (2013) Framework for the analysis of the potential
of the rooftop photovoltaic system to achieve the net-zero energy solar buildings.
Progress in Photovoltaic: Research and Application, 22(4):462-478.
Kurnitski, J., Allard, F., Braham, D., Goeders, G., Heiselberg, P., Jagemar, L. and Seppänen,
O. (2011) How to define nearly net zero energy buildings nZEB. Rehva Journal, 48(3):6-
12.
Kurnitski, J., Saari, A., Kalamees, T., Vuolle, M., Niemelä, J. and Tark, T. (2011) Cost
optimal and nearly zero (nZEB) energy performance calculations for residential buildings
with REHVA definition for nZEB national implementation. Energy and
Buildings, 43(11):3279-3288.
Leach, M., Pless, S. and Torcellini, P. (2014) Cost Control Best Practices for Net Zero Energy
Building Projects: Preprint (No. NREL/CP-5500-61365). National Renewable Energy
Laboratory (NREL), Golden, CO.
Lu, Y., Wang, S. and Shan, K. (2015) Design optimization and optimal control of grid-
connected and standalone nearly/net zero energy buildings. Applied Energy, 155:463-
477.
Maassen W. (2017) Zero Energy Healthcare buildings (Report No. I&BBE3112R001F0.1).
Netherland, Haskoning DHV Nederland B.V.
Marszal, A. J., Heiselberg, P., Bourrelle, J. S., Musall, E., Voss, K., Sartori, I. and Napolitano,
A. (2011) Zero Energy Building–A review of definitions and calculation
methodologies. Energy and buildings, 43(4):971-979.
Mason, M. (2010) Sample size and saturation in PhD studies using qualitative interviews.
In Forum qualitative Sozialforschung/Forum: qualitative social research. Deutschland,
11(3):19.
Ministry of Health Malaysia. (2012) The Country Health Plan: 10th Malaysia Plan 2011-
2015. Putrajaya: Kementerian Kesihatan Malaysia.
Ministry of Health Malaysia. (2014) Annual Report 2014. Putrajaya: Kementerian Kesihatan
Malaysia.
Ministry of Health Malaysia. (2015) Malaysia National Health Account, Health Expenditure
Report 1997-2013. Putrajaya: Kementerian Kesihatan Malaysia.
Mohamed, A., Hasan, A. and Sirén, K. (2014) Fulfillment of net-zero energy building (NZEB)
with four metrics in a single family house with different heating alternatives. Applied
Energy, 114:385-399.
Morgenstern, P., Li, M., Raslan, R., Ruyssevelt, P. and Wright, A. (2016) Benchmarking acute
hospitals: Composite electricity targets based on departmental consumption
intensities. Energy and Buildings, 118:277-290.
Musall, E. and Voss, K. (2012) The passive house concept as suitable basis towards net zero
energy buildings. In 16th International Passive House Conference. Hanover, 1-6.
Omrany, H. and Marsono, A. K. (2015) Optimization of building energy performance through
passive design strategies. British Journal of Applied Science & Technology, 13(6):1-16.
Ortiz, O., Castells, F. and Sonnemann, G. (2009) Sustainability in the construction industry:
A review of recent developments based on LCA. Construction and Building
Materials, 23(1):28-39.

MCRJ Special Issue Vol. 4 | No. 2 | 2018 18
Panwar, N.L., Kaushik, S.C. and Surendra Kothari. (2010) Role of renewable energy sources
in environmental protection: A review. Renewable and Sustainable Energy Reviews,
15(3):1513-1524.
Parameshwaran, R., Kalaiselvam, S., Harikrishnan, S. and Elayaperumal, A. (2012)
Sustainable thermal energy storage technologies for buildings: a review. Renewable and
Sustainable Energy Reviews, 16(5):2394-2433.
Patel, C. and Chugan, P. K. (2013) Measuring awareness and preferences of real estate
developers for green buildings over conventional buildings. Consumer Behaviour and
Emerging Practices in Marketing, 2013:332-341.
Phuangpornpitaka, N. and Tiab, S. (2013) Opportunities and challenges of integrating
renewable energy in smart grid system. Energy Procedia, 34:282–290.
Recast, E. P. B. D. (2010) Directive 2010/31/EU of the European Parliament and of the
Council of 19 May 2010 on the energy performance of buildings (recast). Official Journal
of the European Union, 18(06), 2010.
Rodriguez-Ubinas, E., Montero, C., Porteros, M., Vega, S., Navarro, I., Castillo-Cagigal, M.
and Gutiérrez, A. (2014) Passive design strategies and performance of Net Energy Plus
Houses. Energy and buildings, 83:10-22.
Saidur, R., Hasanuzzaman, M., Mahlia, T. M. I., Rahim, N. A. and Mohammed, H. A. (2011)
Chillers energy consumption, energy savings and emission analysis in an institutional
buildings. Energy, 36(8):5233-5238.
Sartori, I., Napolitano, A. and Voss, K. (2012) Net zero energy buildings: A consistent
definition framework. Energy and buildings, 48:220-232.
Sartori, I., Napolitano, A., Marszal, A. J., Pless, S., Torcellini, P. and Voss, K. (2010) Criteria
for definition of net zero energy buildings. In International Conference on Solar Heating,
Cooling and Buildings (EuroSun 2010), Denmark, 1-8.
Schmidt, S. and Weigt, H. (2013) A review on energy consumption from a socio-economic
perspective: reduction through energy efficiency and beyond. University of Basel: Center
of Business and Economics (WWZ).
Scognamiglio, A., Garde, F. and Røstvik, H. N. (2014) How net zero energy buildings and
cities might look like? New challenges for passive design and renewables design. Energy
Procedia, 61:1163-1166.
Sorrell, S. (2015) Reducing energy demand: A review of issues, challenges and
approaches. Renewable and Sustainable Energy Reviews, 47:74-82.
Suruhanjaya Tenaga. (2015) Malaysia Energy Statistics Handbook 2015, Putrajaya:
Suruhanjaya Tenaga, 94 pp.
Thalfeldt, M., Pikas, E., Kurnitski, J. and Voll H. (2013) Facade design principles for nearly
zero energy buildings in a cold climate. Energy and Buildings, 67:309-321.
Tian, Z., Zhang, S., Li, H., Jiang, Y., Dong, J., Zhang, B. and Yi, R. (2015) Investigations of
Nearly (net) Zero Energy Residential Buildings in Beijing. Procedia
Engineering, 121:1051-1057.
Torcellini, P., Pless, S., Deru, M. and Crawley, D. (2006) Zero energy buildings: a critical
look at the definition. Washington, D.C., National Renewable Energy Laboratory and
Department of Energy.
U.S. Energy Information Administration - EIA - Independent Statistics and Analysis. (2016)
Retrieved July 25, 2017, from
https://www.eia.gov/consumption/commercial/reports/2012/energyusage/ Vogel, J. A., Lundqvist, P. and Arias, J. (2015) Categorizing barriers to energy efficiency in
buildings. Energy Procedia, 75:2839-2845.

MCRJ Special Issue Vol. 4 | No. 2 | 2018 19
Voss, K., Musall, E. and Lichtmeß, M. (2011) From low-energy to Net Zero-Energy
Buildings: status and perspectives. Journal of Green building, 6(1):46-57.
Winkel, T., Rathmann, M., Ragwitz, M., Steinhilber, S., Winkler, J., Resch, G., Panzer, C.,
Busch, S. and Konstantinaviciute, I. (2011) Renewable energy policy country
profiles (Rep. No. EIE/08/517/SI2.529243). Intelligent Energy Europe.
Wong, J. K. W. and Zhou, J. (2015) Enhancing environmental sustainability over building
life cycles through green BIM: A review. Automation in Construction, 57:156-165.
Yılmaz, M. and Bakış, A. (2015) Sustainability in construction sector. Procedia-Social and
Behavioral Sciences, 195:2253-2262.
Zavadskas, E. K., Antucheviciene, J., Kalibatas, D. and Kalibatiene, D. (2017) Achieving
Nearly Zero-Energy Buildings by applying multi-attribute assessment. Energy and
Buildings, 143:162-172.
Zealand, N. and Zealand, S. N. (2011) Key Findings on New Zealand's Progress Using a
Sustainable Development Approach 2010. Wellington, Statistics New Zealand.

MCRJ Special Issue Vol. 4 | No. 2 | 2018 20
A CRITICAL REVIEW OF MANAGEMENT OF BUILDING FIRE SAFETY IN MALAYSIAN PUBLIC UNIVERSITIES Mohamed Sulzakimin1, Ebenehi Ibrahim Yakubu2,3, Sarpin Norliana1, Ta Wee Seow1, Masrom Md Asrul Nasid1 and Zainal Rozlin1
1 Department of Construction Management, FPTP, Universiti Tun Hussein Onn Malaysia, 86400 Parit Raja, Johor, Malaysia 2 Faculty of Technology Management & Business, Universiti Tun Hussein Onn Malaysia, 86400 Parit Raja, Johor, Malaysia 3Department of Building Technology, The Federal Polytechnic Bauchi, Gwallameji Village, Off Dass Road, Bauchi-Tafawa Balewa, 0231, Bauchi, Nigeria
Abstract Fire Safety Management (FSM) is essential in ensuring the safety of building occupants from the fire as well as property protection. Recently, there had been a reduction in annual budgetary allocations to public universities in Malaysia due to some economic tensions. This situation had left many institutions in question with the options of scaling down their expenses as well as sourcing for other means of meeting up with the shortfalls in allocated funds. Hence, it affects the sustainability of the building itself. This paper aims at examining the possibility of reducing incidents that could lead to expending unbudgeted resource to rehabilitating property destroyed by fire on campus, in addition to limiting risk to life and interruption of academic and business activities. Several types of research had been conducted on FSM, nevertheless very few consider Higher Education Institutions (HEI)s holistically. This study was carried out through a comprehensive review of the literature on FSM within the context of Malaysian public universities and sustainability from relevant databases. The paper reveals that FSM is critical to preventing fire disaster in buildings. It identifies the need for an investigation into the implementation of FSM to developing effective FSM framework for assisting facilities managers and other stakeholders to preserve the university buildings against fire risks. Implementation of effective FSM is beneficial in several ways including reduction of property insurance premiums, business continuity and promoting an efficient and sustainable work environment. Keywords: Fire safety; FSM; Malaysian public universities; Sustainability
INTRODUCTION
Buildings are among the most important investments for any Higher Educational
Institution (HEI) which serve as meeting point for students, teachers and the communities
(Nadzim and Taib, 2014). Malaysian government and private organisations made huge
investments running into billions of Ringgits in constructing these structures and the facilities
within them. The number of HEIs including Universities and Colleges publicly and privately
funded is evident for the expenditure (StudyMalaysia, 2015). For instance, located in
Malaysia are over 500 tertiary institutions comprising 20 public universities, over 70 private
universities, 33 polytechnics, 72 community colleges, 27 teachers’ education institutes and
about 403 colleges (StudyMalaysia, 2015; Ahmad, 2013). HEIs provide students and the
entire institutions’ community with an environment that is attractive, conducive to learning
and academic success (Hassanain, 2008). It is therefore essential to adequately protect
buildings from fire destruction, as well as the life of the users through appropriate Fire safety
management (FSM) implementation (Nadzim and Taib, 2014). FSM encompasses the
combination of or coordination of some activities or programs to avert destruction from fire
(Nadzim and Taib, 2014). Such agendas include escape routes provisions and maintenance,
fire prevention measures, staff training, and fire drill training, etc. Howard and Kara-Zaitri,
(1999) described FSM as “the application by a manager of policy, standards, tools,

MCRJ Special Issue Vol. 4 | No. 2 | 2018 21
information, and practices to the task of analysing, evaluating and controlling fire safety.”
Pickard (1994) asserted that fire safety strategy for a specific building requires management
policies and procedures for the plan to efficiently function. Fire safety strategy should be a
continuing process such that fire safety systems are regularly checked and maintained.
Usually, fire takes place without warning allowing building occupants limited time to either
react to escape or suppress the fire (Salleh and Ahmad, 2009).
Effective FSM requires identifying all the potential risk associated with the premises and
efficiently undertake an assessment of the adequacy of the measures provided or needed to
resist the threat (The Scottish Government’s Police, Community Safety Directorate, Her
Majesty Fire Service Inspectorate for Scotland, 2008). Also, the concept of sustainable
development was firmly embedded within the environmental movement but still has social
and economic values in sustainable use of natural resources. It implies that sustainability is a
vast area covering topics from economics to social and the issues relating to ecological
sustainability. While all business enterprises can make contributions towards its sustainability
attainment, the ability to make a difference varies by sector and organisation size where the
role of business in contributing to sustainable development remains unlimited (Mohamed and
Wee, 2016; Mohamed et al., 2016). Given that, sustainable development is a decent business
in itself; it creates chances for suppliers of ‘green consumers,' as well as developers of
environmentally safer materials and processes. Hence, firms that invest in ‘green’ are eco-
efficiency and engage themselves in social well-being.
BACKGROUND OF STUDY
FSM is concerned with lessening the potential of harm to life and damage to properties
resulting from the occurrence of fire in buildings (Canadian Wood Council, 2000; Sanni-
Anibire and Hassanain, 2015). The importance of FSM in relation to modern large or complex
structures has been identified for several years, though, the challenges are yet to be thoroughly
addressed. The growing complexity of buildings, as well as sophistication of the fire safety
systems, places more responsibility on management that has been traditionally essential
(Porter, 1990). Protecting buildings from the fire can be tackled from two perspectives.
Namely Building design, and Building operation /management (Ramli et al., 2013). Although
fire safety priority is very low during the building design process, it is included to satisfy
minimum requirements for building regulations and recommendation of the insurance
company (Mydin, 2013). Therefore, if an efficient management team is put in place to operate
a property, such property would be safe from the fire even if poorly designed. However, a
well-designed building that is not run by efficient management team may likely have issues
with fire safety during the building lifecycle. Many of the major disasters including fires
which happened in recent decades were characterised by a failure of management, whether
before or during those incidences. An example was the 1987 fire at King's Cross underground
station, London. Consequently, considerable emphasis has been placed on the importance of
management in safety as well as focusing on both corporate and individual liability in this
respect (Porter, 1990). Apart from that, sustainable development is a process of change in
which exploitation of resources, the investments direction, the orientation of technological
developments and institutional are all in agreement and enhance the present and prospects of
meeting human needs and aspirations. It is reflected on many Governments around the world
when they take on sustainable development on the agenda for the development project (Masrom et al. 2017; Mohamed et al., 2017). Organisations around the globe that incorporate

MCRJ Special Issue Vol. 4 | No. 2 | 2018 22
sustainable practices to strengthen their organisational goals can increase shareholders’ values
and build better international market share.
PROBLEM STATEMENT
Campus Firewatch (2011) stated that no fewer than 146 people perished in campus fire in
the United States between 2000 and 2011. These comprised of both on-campus and off-
campus fire incidences. Several injuries were sustained and property loss worth $9 million
were reported (United States Fire Administration, 2011). The impact of fire fatality on HEIs
campuses could be severe due to the homogenous nature of students’ population concerning
age and experience (Taub and Servaty-Seib, 2008). Furthermore, substantial fire loads such
as books, papers, and another document in lecturer’s offices in High Education Institutions
(HEI)s could contribute significantly to fire severity (Kong, 2009).
Research had shown that some fire incidence occurs in tertiary institutions’ buildings
(Mowrer, 1999). The cost of the incidents to the HEIs from both financial and public image
perspectives could be substantial (Bubka, Mary Ann, and Coderre, 2010). These incidents
take place especially among students in hostels while they are attending classes or during
siesta (Hassanain, 2008). Numerous fire incidents mainly of small-scale occur on campuses
without being reported. Report from the United States Fire Administration (USFA) indicated
that an average 1700 fires were recorded yearly in the United States of America (USA)
(United States Fire Administration, 2001). The abovementioned figure increased by over
100% in the USFA’s report between 2007 and 2009 as 3,800 fires were recounted in university
houses in 2009. The campus fires usually occur during September and October when schools
are starting a fresh academic session which leads to estimated fatalities of five people annually
(United States Fire Administration, 2011).
In the United Kingdom, two campus fire incidents were recorded in 2001 (Times Higher
Education, 2001a, 2001b). The first one occurred in the main campus of the City University
London and destroyed College Building on 25 of May. The result of the fire investigation
exposed that the fire started from an office of a member of staff. The affected building was
grade II listed building accommodating five academic departments, the school of journalism
and computing as well as the vice-chancellor’s office. The second incident took place on
November 2, 2001. The fire attacked a 100 years old Bower Building at the Glasgow
University, Scotland destroying Ph.D. work of ten Botany students. It took two years to carry
out restoration work on the damaged building at the cost 6.5 pound and GBP 3.5 million for
the equipment. The building was opened for use in 2005 (University of Glasgow, 2017; Times
Higher Education, 2001b). Furthermore, on September 12, 2014, the GlaxoSmithKline
Carbon Neutral Laboratory for Sustainable Chemistry at the Nottingham University, UK was
destroyed by fire attributed to an electrical fault. The GBP 20 million structure which was at
the advanced stage of completion was razed entirely down (British Broadcasting Corporation
(BBC), 2015; Nottinghamshire and City of Nottingham Fire and Rescue Authority
Community Safety Committee, 2015). Other examples of a fire incident in HEIs include a
clubhouse fire at Nelson Mandela Metropolitan University South Africa in October 2016, the
University of Jos Nigeria Library fire on October 10, 2016. The hostel fire at International
Islamic University of Malaysia (IIUM), 2014, Dewan Tunku Canselor (DTC), of Universiti
Malaya (UM) among others are more examples (Ali, 2003; Nottinghamshire and City of
Nottingham Fire and Rescue Authority Community Safety Committee, 2015; Sadiq, 2016;

MCRJ Special Issue Vol. 4 | No. 2 | 2018 23
Spies, 2016). The need for HEIs to protect students, employees, and physical facilities cannot
be overstated, because if a disastrous loss ensues, media coverage may affect the institutions’
reputation, posing a risk to future admissions, financial strengths, and endowments (Bubka,
Mary Ann and Coderre, 2010).
Report from the Fire and Rescue Department of Malaysia (FRDM) indicated a steady
increase in fire incidents from 2000 to 2015 (Sulaiman, 2008; Salleh and Ahmad, 2009;
Rahim, 2015). For instance, in 2006 FRDM attended to 18,913 fire calls, and 20,225 in 2007.
Fire occurrences in 2012 were 29,848 which was 11% higher than the relatively stable
statistics from 2009 to 2012. From 2013 to 2015, fire incidents recorded were 33,640 for 2013,
54,517 for 2014 and 80,183 for 2015 (Salleh and Ahmad, 2009; Rahim, 2015). Rahim (2015)
also conveyed that fire-related death doubled between 2011 to 2012 that is, from 72 deaths in
2011 to 152 in 2012 and then to 165 in 2013. The cost implication of damages from a fire in
2013 is about 20 billion Malaysia Ringgit (MYR 20 billion), which was an increase of MYR
874.31 million from 2012 (Department of Statistic Malaysia, 2013; Fire and Rescue
Department Malaysia, 2014). The main causes of fire include arson, cooking, smoking,
electrical sources, and other unknown sources, to this Rahim (2015) called for more
investigative efforts to obtain useful information for developing precautionary strategies in
Malaysia.
No doubt enormous investments made in the education especially in the higher education
sector is in line with fulfilling a set target of creating an attractive environment, conducive for
learning and academic excellence (Hassanain, 2008). It is, therefore, duty bound on all
stakeholders to zealously guard various infrastructure against fire destruction. In accordance
with building world-class higher education institutions, Malaysian government spent more on
education compared to other sectors, for instance, Musa (2003) reported that about 27% of
the National budget was spent on education. Such gesture allows for training of human
resources that shall tackle future challenges in various sectors of the economy (Kaur et al.,
2008). However, in recent time, the fund allocation to public universities is dwindling due to
some challenging economic situation (Else, 2016; Malay Mail, 2016). Therefore,
necessitating paying considerable attention to protecting buildings from all form of disasters
including fire.
Figure 1 illustrates the aim and objectives of the research from which this review paper
was derived.

MCRJ Special Issue Vol. 4 | No. 2 | 2018 24
Figure 1. Diagrammatic representation of research aim and objectives
DISCUSSION
The substantial effort had also been made at internationalising Malaysian higher
education with a resultant saving of about RM4 billion annually. RM2.5billion is the amount
that could be saved if Malaysian students decide not to study abroad and take advantage of
provisions made in Malaysian universities and other higher educations, whereas RM1.5
billion in net revenue realised from over 50000 students from various countries (Kaur et al.
2008). Malaysia had also set the target of becoming by 2020, the world’s sixth-biggest
education exporting country, and therefore making plans to accommodating about 200,000
international students (Hughes, 2015). This projection doubled the aspiration in the 9th
Malaysia plan for attracting 100,000 students from overseas by 2010 (Kaur et al. 2008). Given
these strides, research relating to the managing fire safety in Malaysian higher education’s
buildings becomes imperative especially as no structure has total immunity against fire
occurrences (Ramachandran, 1999; Rahim, 2015). Previous research concerning management
of fire safety in buildings had dealt with other types of building/structure such as karaoke
establishment (Lui & Chow, 2000), oil and gas (Santos-reyes and Beard, 2001), non-
residential high-rise buildings (Chow, 2002; Tharmarajan, 2007), residential high-rise
buildings (Yatim, 2009), Nursing homes (Moore, 2012), Hotel buildings (Chen et al. 2012),
Heritage buildings (Salleh and Ahmad, 2009), Passenger terminals Howard and Kara-Zaitri,
1999) and airport terminals (Chow and Ng, 2003), enclosed shopping centres (Freeman,
2010), Cruise Vessel Construction (Räisänen, 2014) and hospital (Ong and Suleiman, 2015).
However, few of these studies had explicitly looked at tertiary education buildings
holistically. Though Kong (2009) studied possible implementation of performance-based
AIM: To develop a framework for implementing effective fire safety management
for higher education institutions’ buildings in Malaysia.
Data
Analyses
RO1: Investigate current
practices in fire safety
management for
university buildings in
Malaysia
RO2: To determine key
factors contributing to
effective management of
fire safety for university
buildings in Malaysia
RO3: Examine the
users/occupants’
perception on, awareness
of, and attitude toward,
fire safety in Malaysian
Higher Education
Institutions (HEIs)
Buildings
RO5: Develop and
validate a framework
for effective
management of fire
safety for university
buildings in Malaysia
RO4: Determine the
effect users/occupants’
perception on,
awareness of, and
attitude toward, fire
safety on effective of
FSM in HEIs
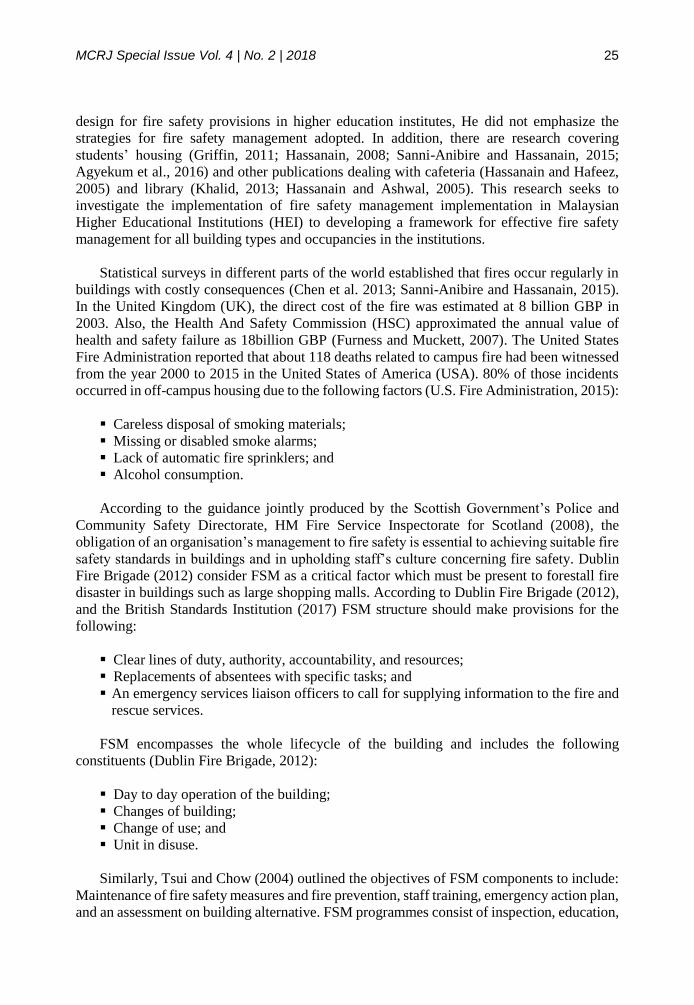
MCRJ Special Issue Vol. 4 | No. 2 | 2018 25
design for fire safety provisions in higher education institutes, He did not emphasize the
strategies for fire safety management adopted. In addition, there are research covering
students’ housing (Griffin, 2011; Hassanain, 2008; Sanni-Anibire and Hassanain, 2015;
Agyekum et al., 2016) and other publications dealing with cafeteria (Hassanain and Hafeez,
2005) and library (Khalid, 2013; Hassanain and Ashwal, 2005). This research seeks to
investigate the implementation of fire safety management implementation in Malaysian
Higher Educational Institutions (HEI) to developing a framework for effective fire safety
management for all building types and occupancies in the institutions.
Statistical surveys in different parts of the world established that fires occur regularly in
buildings with costly consequences (Chen et al. 2013; Sanni-Anibire and Hassanain, 2015).
In the United Kingdom (UK), the direct cost of the fire was estimated at 8 billion GBP in
2003. Also, the Health And Safety Commission (HSC) approximated the annual value of
health and safety failure as 18billion GBP (Furness and Muckett, 2007). The United States
Fire Administration reported that about 118 deaths related to campus fire had been witnessed
from the year 2000 to 2015 in the United States of America (USA). 80% of those incidents
occurred in off-campus housing due to the following factors (U.S. Fire Administration, 2015):
▪ Careless disposal of smoking materials;
▪ Missing or disabled smoke alarms;
▪ Lack of automatic fire sprinklers; and
▪ Alcohol consumption.
According to the guidance jointly produced by the Scottish Government’s Police and
Community Safety Directorate, HM Fire Service Inspectorate for Scotland (2008), the
obligation of an organisation’s management to fire safety is essential to achieving suitable fire
safety standards in buildings and in upholding staff’s culture concerning fire safety. Dublin
Fire Brigade (2012) consider FSM as a critical factor which must be present to forestall fire
disaster in buildings such as large shopping malls. According to Dublin Fire Brigade (2012),
and the British Standards Institution (2017) FSM structure should make provisions for the
following:
▪ Clear lines of duty, authority, accountability, and resources;
▪ Replacements of absentees with specific tasks; and
▪ An emergency services liaison officers to call for supplying information to the fire and
rescue services.
FSM encompasses the whole lifecycle of the building and includes the following
constituents (Dublin Fire Brigade, 2012):
▪ Day to day operation of the building;
▪ Changes of building;
▪ Change of use; and
▪ Unit in disuse.
Similarly, Tsui and Chow (2004) outlined the objectives of FSM components to include:
Maintenance of fire safety measures and fire prevention, staff training, emergency action plan,
and an assessment on building alternative. FSM programmes consist of inspection, education,

MCRJ Special Issue Vol. 4 | No. 2 | 2018 26
and training, fire suppression, emergency service, evaluation of fire probability, fire
prevention, report and record keeping, as well as communication (Malhotra, 1993; Chow,
2001). The following benefit can be accomplished when an effective FSM is developed and
implemented (Chow, 2001):
▪ Reduction of property insurance premiums;
▪ Continuity of business operation;
▪ Enhancement of public images and customer service;
▪ Promote an efficient work environment;
▪ Quality gain realisation; and
▪ Influence an organisation profitability.
For the above-stated benefits to be realised, the fire safety managers should come up with his
responsibilities as indicated by the Dublin fire brigade, thus:
▪ Awareness of fire safety features and their functions;
▪ To monitor general maintenance and building/refurbishment work;
▪ To maintain register of fire certificates and compliance for all buildings/ refurbishment
works;
▪ Fire safety risk assessment;
▪ To be present at the commencement of building occupation; and
▪ To liaise with fire authority and seek advice.
The person appointed as a fire safety manager is responsible for total control and daily
building safety management. The appointed fire safety manager should be practically
knowledgeable to direct firefighters to affected areas in buildings during emergency
especially in complex structures (Chow, 2001). Hence, Fire safety practices and awareness is
essential as adequate knowledge of fire, cause, prevention, suppression and the provision of
proper firefighting equipment are important to be available and handled adequately by the
appointed person in any building.
CONCLUSION
This research seeks to investigate the implementation of fire safety management strategies
in Malaysian Higher Educational Institutions (HEI) to having sustainability aspects. The
paper highlighted FSM as a critical factor in preventing fire incidents and destructive effects
on human and properties. FSM identifies all probable risk associated with the universities
built facilities and provide necessary measures to resist the threat. The work also creates a
space for research into detail understanding of fire safety management practices, and current
implementation strategies of FSM principles among Malaysian universities. Therefore, a
framework for effective fire safety management for all building types and occupancies in the
institutions shall be developed and validated on completion of the research.
ACKNOWLEDGEMENTS
The authors are unreservedly grateful to Ministry of Education (MOE), Pejabat Pendaftar
UTHM, Office of Research, Innovation, Commercialisation and Consultancy (ORICC),
UTHM, for supporting this research under the Research Acculturation Collaborative Effort

MCRJ Special Issue Vol. 4 | No. 2 | 2018 27
(RACE: No.1517), Grant Scheme under the Graduate Postgraduate Incentive Scheme (U729),
Centre for Graduate Studies (UTHM) and FPTP Universiti Tun Hussein Onn Malaysia. Our
sincere appreciation also goes to the Federal Polytechnic Bauchi, Nigeria for granting the
second author study leave to participate in this project.
REFERENCES
Agyekum, K., Ayarkwa, J. and Amoah, P. (2016) Challenges to Fire Safety Management in
Multi-Storey Students’ Hostels. Modern Management Science & Engineering, 4(1):53–
61.
Ahmad, A. R., (2013) The impact of government funding reforms on the strategic planning of
Malaysian public universities. Ph.D. Thesis, Victoria University, Melbourne. 436 pp.
Ali, Z. M. (2003) Rehabilitation of the Tunku Canselor Hall, University of Malaya, Kuala
Lumpur, Malaysia. The ICOMOS & ISPRS Committee for Documentation of Cultural
Heritage CIPA 2003 19th International Symposium: New Perspectives to Save Cultural
Heritage, At Antalya, Turkey, Volume: XIX -2003.
British Broadcasting Corporation (BBC). (2015) University of Nottingham laboratory fire
caused by the electrical fault, says report.
The British Standards Institution (2017) Section 9: Managing occupied buildings, BS 9999,
2017:220–250.
Bubka, Mary Ann and Coderre, P. (2010) Best Practices in Risk Management for Higher
Education Addressing the “What If” Scenarios. Retrieved from
http://www.ficurma.org/misc/PMA Education Best Practices_WhitePaper.pdf
Campus Firewatch (2011) Fatal campus fires. Retrieved from
http://www.campusfirewatch.com/resources/resource center/fatalcampusfires.html
Canadian Wood Council (CWC). (2000) Fire safety in residential building. Ottawa.
Chen, T., Pan, L., Zhang, H., Narayanan, S. and Soldner, N. (2013) Experimental study of
evacuation from a 4-story building. Procedia Engineering, 62:538–547.
Chen, Y. Y., Chuang, Y. J., Huang, C. H., Lin, C. Y. and Chien, S. W. (2012) The adoption
of fire safety management for upgrading the fire safety level of existing hotel buildings.
Building and Environment, 51:311–319.
Chow, W. K. (2001) Review on Fire Safety Management and Application to Hong Kong,
International Journal on Engineering Performance Based Fire Code, 3(1):52–58.
Chow, W. K. (2002) Proposed Fire Safety Ranking System EB-FSRS for Existing High-Rise
Non-residential Buildings in Hong Kong. Journal of Architectural Engineering,
8(December):116–124.
Chow, W. K. and Ng, M. Y. (2003). Review on Fire Safety Objectives and Application for
Airport Terminals. Journal of Architectural Engineering, 9(2):47–54.
Department of Statistics Malaysia. (2013) State/District Social Statistics Malaysia 2013.
Department of Statistics Malaysia.
Dublin Fire Brigade. (2012) Fire Safety Management of Shopping Centres with Covered
Malls. Retrieved from
https://www.dublincity.ie/sites/default/files/content/WaterWasteEnvironment/DublinFir
eBrigade/FirePrevention/FireSafetyAdvice/Documents/Fire Safety Management of
Shopping Centres-Final.pdf.
Else, H. (2016) Malaysia cuts public university funding. Retrieved January 17, 2017, from
https://www.timeshighereducation.com/news/malaysia-cuts-public-university-funding.
FRDM. (2014) Statistik Kebakaran mengikut Jenis Kebakaran Tahun 2013. Fire and Rescue

MCRJ Special Issue Vol. 4 | No. 2 | 2018 28
Department of Malaysia.
Freeman, M. (2010). How fire risks should be managed in enclosed Australian shopping
centres. Ph.D. Thesis, Victoria University, Melbourne. 189 pp.
Furness, A. and Muckett, M. (2007) Introduction to Fire Safety Management. Oxford:
Butterworth-Heinemann. 419 pp.
Griffin, B. D. (2011) Effective Fire Safety Education for Residential Students. Ph.D. Thesis,
The University of North Carolina at Greensboro. 91 pp.
Hassanain, M. A. (2008) Fire safety in the design and operation of student housing facilities.
Structural Survey, 26(1):55–62.
Hassanain, M. A. and Ashwal, N. A. (2005) An approach to assess fire safety requirements in
library facilities. Facilities, 23(5/6):239–252.
Hassanain, M. A. and Hafeez, M. A. (2005) Fire safety evaluation of restaurant facilities.
Structural Survey, 23(4):298–309.
Howarth, D. J. and Kara‐Zaitri, C. (1999) Fire safety management at passenger terminals.
Disaster Prevention and Management: An International Journal, 8(5):362–369.
Hughes, J. (2015) Malaysia Seeks 200,000 International Students by 2020. Retrieved May 11,
2017, from https://www.masterstudies.com/news/Malaysia-Seeks-200-000-
International-Students-by-2020-495/.
Kaur, S., Sirat, M. and Azman, N. (2008) Globalisation and internationalisation of higher
education in Malaysia. Pinang: Penerbit Universiti Sains Malaysia and National Higher
Education Research Institute, 373 pp.
Khalid, S. J. B. M. (2013) Disaster Preparedness in Academic Libraries in Malaysia. MLIS
Dissertation, International Islamic University Malaysia. 70 pp.
Kong, S. K. (2009) A study of implementing a performance-based design for fire safety
provisions in higher education institutes. Ph.D. Thesis, The Hong Kong Polytechnic
University. 90 pp.
Lui, C. H. G. and Chow, W. K. (2000) A preliminary proposal on fire safety management for
karaoke establishments. Proceedings of the 18th International System Safety
Conference, 11-16 September 2000. Fort Worth, Texas, USA, 76-84.
Malay Mail. (2016) Budget 2017: Public universities suffer almost 20pc spending cut.
Retrieved January 17, 2017, from
http://www.themalaymailonline.com/malaysia/article/budget-2017-public-universities-
suffer-almost-20pc-spending-cut
Malhotra, H. (1993) Proposed Code for Fire safety in buildings for the State of Sao Paulo. Sao
Paulo: British Consulate , Sao Paulo, Brazil, 113pp.
Masrom, M.A.N., Abd Rahim, M. H. I., Siow, C. A., Mohamed, S. Goh Kai Chen (2017) A
Preliminary Exploration of The Barriers of Sustainable Refurbishment for Commercial
Building Projects in Malaysia, Procedia Engineering, 180:1363-1371.
Mohamed, S., and Wee, S. T. (2016) Initial Findings on Knowledge Transfer Practices
Towards Sustainable Development at Malaysian Local Government, International
Journal of Trend in Research and Development, 8(1)
Mohamed, S., Wee, S. T. and Masrom, M.A.N. (2016) Sustainable Development at Malaysian
Local Governments from Management View of the Knowledge Transfer Practices, IIU,
Indonesia, 1,
Mohamed, S., Abd Rahim, M. H. I., Wee, S. T. and Goh Kai Chen (2017). Preliminary
Concept of Knowledge Transfer Practices, Medwell Journal, Medwell Publication, 4, 502
Moore, J. (2012) Assessment of Fire Safety and Evacuation Management in Nursing Homes.
M. Phil. Thesis, Dublin Institute of Technolgy. 289 pp.

MCRJ Special Issue Vol. 4 | No. 2 | 2018 29
Mowrer, F. W. (1999) Fire Safe Student Housing: A Guide for Campus Housing
Administrators. Maryland: Maryland University, College Park, 61pp.
Musa, B. (2003) An Education System Worthy of Malaysia. Lincoln: iUniverse, Inc. 307 pp.
Mydin, M. A. O. (2014) Human Factors in Fire Safety Management and Prevention, 1: 213–
219.
Nadzim, N. and Taib, M. (2014) Appraisal of Fire Safety Management Systems at Educational
Buildings. Proceeding of SHS Web of Conferences, volume 11, Sustainable Built
Environment Symposium (SBES, 2014). Penang, 01005-p.1-7.
Nottinghamshire and City of Nottingham Fire and Rescue Authority Community Safety
Committee. (2015) Fire Investigation for the University of Nottingham Jubilee Campus -
Report of the Chief Fire Officer. Retrieved from http://www.bbc.com/news/uk-england-
nottinghamshire-30751431
Ong, C. and Suleiman, M. Z. (2015) Problems in Implementation of Fire Safety Management
in Malaysia Government Hospital. The advance of Environmental Biology, 9(March):47–
50.
Pickard, R. (1994) Fire safety and protection in historic buildings in England and Ireland–Part
I. Structural Survey, 12(2):27–31.
Porter, A. (1990) Management of Fire Safety. Property Management, 8(2):154–158.
Rahim, M. S. N. A. (2015) The current trends and challenging situations of fire incident
statistics. Malaysian Journal of Forensic Sciences, 6(1):63–78.
Räisänen, P. (2014) Fire Risk and its Management in Cruise Vessel Construction Projects.
Ph.D. Thesis, Aalto University. 201 pp
Ramachandran, G. (1999) Fire safety management and risk assessment. Facilities,
17(9/10):363–377.
Ramli, A., Akasah, Z. A. and Masirin, M. I. M. (2013) Factors Contributing Building Safety
and Health Performance of Low-Cost Housing in Malaysia, 2(1):1–9.
Sadiq, L. (2016) Fire ravages Unijos library, 6 departments. Retrieved October 15, 2016, from
http://www.dailytrust.com.ng/news/general/fire-ravages-unijos-library-6-
departments/165984.html#F2wXguuQ7fviSDVp.99
Salleh, N. H. and Ahmad, A. G. (2009). Fire Safety Management in Heritage Buildings: The
Current Scenario in Malaysia. Proceeding of the 22nd CIPA Symposium: Digital
Documentation, Interpretation & Presentation of Cultural Heritage, 11-15 October 2009.
Kyoto, Japan, 1-6.
Sanni-Anibire, M. O. and Hassanain, M. A. (2015) An integrated fire safety assessment of a
student housing facility. Structural Survey, 33(4/5):354–371.
Santos-Reyes, J. and Beard, A. N. (2001) A systemic approach to fire safety management.
Fire Safety Journal, 36:359–390.
Spies, D. (2016) NMMU clubhouse torched overnight. Retrieved December 1, 2016, from
http://www.news24.com/SouthAfrica/News/pics-nmmu-clubhouse-torched-overnight-
20161017.
StudyMalaysia. (2015) The Malaysian Higher Education System – An Overview. Retrieved
from https://www.studymalaysia.com/...malaysia/the-malaysian-higher-education-
system-an-overview%0A%0A
Sulaiman, A. (2006) Exploring Fire Safety Awareness Among the Malaysian Public. M.Sc
Dissertation, Universiti sains Malaysia. 175 pp.
Taub, D. J. and Servaty-Seib, H. L. (2008) Developmental and contextual perspectives on
bereaved college students. New Directions for Student Services, Wiley Periodicals, Inc.
121:15–26.

MCRJ Special Issue Vol. 4 | No. 2 | 2018 30
Tharmarajan, P. A. (2007) The Essential Aspects of Fire Safety Management in High Rise
Building M.Sc Dissertation, Universiti Teknologi Malaysia. 122 pp.
The British Standards Institution. (2017) BS 9999:2017, Fire safety in the design,
management and use of buildings. Code of practice. London: The BSI Standard Limited,
440pp.
The Scottish Government’s Police and Community Safety Directorate, HM Fire Service
Inspectorate for Scotland, (2008) Practical fire safety guidance for educational and day
care for children premises.
Times Higher Education. (2001a) City University’s fire. Retrieved November 30, 2016, from
https://www.timeshighereducation.com/news/city-universitys-fire/160570.article
Times Higher Education. (2001b) Fire destroys Ph.D. work. Retrieved November 30, 2016,
from https://www.timeshighereducation.com/news/city-universitys-fire/160570.article
Tsui, S. C. and Chow, W. K. (2004) Legislation aspects of fire safety management in Hong
Kong. Facilities, 22(5/6):149–164.
U.S. Fire Administration. (2015) Campus Fire Fatalities in Residential Buildings (2000-
2015). Retrieved from
https://www.usfa.fema.gov/downloads/pdf/.../campus_fire_fatalities_report.pdf
United States Fire Administration. (2001) Dormitory Fires. Topical Fire Research Series,
1(14).
United States Fire Administration. (2011) University Housing Fires (2007-2009). Topical
Fire Report Series, 12(9):1–12.
The University of Glasgow. (2017) Bower Building. Retrieved January 17, 2017, from
http://www.universitystory.gla.ac.uk/building/?id=90
Yatim, Y. M. (2009) Fire Safety Models for High-Rise Residential Buildings in Malaysia.
Ph.D. Thesis, Heriot-Watt University, Edinburgh. 292 pp.
MCRJ Special Issue Vol. 4 | No. 2 | 2018 31
FEASIBILITY STUDY ON COMPOSITION AND MECHANICAL PROPERTIES OF PALM OIL FUEL ASH AND QUARRY DUST REPLACEMENT IN SOLIDIFICATION/ STABILIZATION MATRICES Mohd Ikhmal Haqeem Hassan1, 2, Aeslina Abdul Kadir1, 2 and Nur Jannah Abdul Hamid1 1Faculty of Civil and Environmental Engineering, Universiti Tun Hussein Onn Malaysia, 86400 Parit Raja, Batu Pahat Johor, Malaysia 2Micropoluttant Research Centre, Universiti Tun Hussein Onn Malaysia, 86400 Parit Raja, Batu Pahat Johor, Malaysia
Abstract This research was conducted to investigate the suitable waste materials to be used in Solidification/Stabilization (S/S) technique. For that reason, palm oil fuel ash and quarry dust have been selected to be used in S/S matrices. These wastes have national issues in recent years due to the increasing amount caused by population and industrialization growth in Malaysia. In this research, different percentages of Palm Oil Fuel Ash (POFA) and quarry dust (0%, 10%, 20%, 30% and 40%) are used to replace the Portland cement and sand respectively. The investigation included determination of heavy metal concentration and chemical composition of POFA and quarry dust. Other than that, the respective samples were also examined for its mechanical properties such as density and compressive strength. The results indicated that 10% of POFA and 20% of quarry dust are the best percentages to be incorporated in S/S matrices. The 10% replacement of POFA recorded a considerable value of density ranging from 1500 kg/m3 to 1660 kg/m3.Meanwhile the compressive strength 10% of POFA achieved the strength of 22.60 MPa. Besides that, 20% replacement of quarry dust in natural sand recorded a value of density ranging from 2080 kg/m3 to 2147 kg/m3 with the highest strength is 24.91MPa. The results show a possibility of POFA and quarry dust for cement and sand replacements in improving the S/S matrices as a medium to treat wastes. Keywords: Solidification/stabilization; Palm oil fuel ash; Quarry dust; Waste utilization
INTRODUCTION
Solidification/Stabilization (S/S) is a quick and inexpensive technique in treating the
waste by converting immobilizing contaminants into a less soluble or a less toxic form and
encapsulating them by a creation of a durable matrix with high structural integrity (Navarro-
Blasco et al., 2013). S/S is one of the techniques by mixing the wastes with some solid
addictive materials like fly ash, cement, lime, cement kiln dust, sulfur, clay and some
combinations of them (Wright and Noordhuis, 1991). Apart from that, S/S also undergoes in
exchange the waste into easily handled solid with reduced hazards from volatilization,
leaching or spillage. This technique used to prevent or minimize the release of hazardous
compounds from the finished asphalt road base into the environment by producing a solid
mixture, improve handling characteristics, decrease the surface area for contaminant transport
and bonded the contaminate into a non-toxic form (Tuncan et al., 2000).
Among various types of binders, cement-based systems are the most widely used, due to
its relatively low cost, wide availability, and versatility (Galetakis and Soultana, 2016). The
S/S method also offers the possibility to reuse the solidified waste for construction purposes,
such as building blocks and concretes (Johnson et al., 2016; Kadir et al., 2014a; Kadir et al.,
2016). It also provides minimum energy consumption compared to thermal or other methods.
Other advantages provided by the S/S method are the possibility to treat the contaminated

MCRJ Special Issue Vol. 4 | No. 2 | 2018 32
waste in-situ rather than ex-situ especially for the massive quantities of petroleum sludge, thus
eliminate the transportation cost. Also, only simple equipment and materials are needed for
its execution.
The application of binders can increase absorption thus helps in improving their
immobilization and prevent the detrimental effects on binder hydration such as combining the
use of cement and active carbon (Caldwell et al., 2009). Lampris et al. (2009) found that the
Portland cement with the addition of high carbon power plant fly ash (HCFA) significantly
reduced the leaching of PHCs. Besides, an advantage of applying S/S techniques is that some
hazardous heavy metals in wastes can be immobilized into the matrices.
This paper aim is to evaluate the composition and mechanical properties of palm oil fuel
ash and quarry dust in S/S matrices. The present research has been undertaken to investigate
the possibility of using palm oil fuel ash and quarry dust as a partial replacement material for
cement and natural sand respectively. It is envisaged that the outcomes of this research will
enhance the potential use of palm oil fuel ash and quarry dust as a viable alternative material
in the production of S/S matrices.
OVERVIEW OF PALM OIL FUEL ASH AND QUARRY DUST
Palm Oil Fuel Ash (POFA) is a by-product of the palm oil industry produced in massive
amounts approximately 4 million tons per year (Foo and Hameed, 2009). Recently, POFA is
used as a partial replacement for ordinary Portland cement in conventional concrete and the
purpose is to enhance strength and durability of concrete (Tangchirapat et al. 2007; Mazenan
et al., 2017; Abdul Awal and Hussin 2011; Chindaprasirt et al., 2008, Ismail et al., 2011;
Malhotra, 2002). Some works have utilized POFA as supplementary material in mixes with
other alumino-silicate materials to make geo-polymer cement paste or mortars. The reaction
product, formed according to a poly-condensation process, exhibits a network structure that
could evoke that of organic thermoset polymers.
The beneficial effects of POFA as a cement replacement concerning to its mechanical
properties and durability have been widely discussed. For example in a study by Ariffin
(2013) has stated that low calcium fly ash blended with POFA was used to produce geo-
polymer cement and so compressive strength of up to 28 MPa was obtained. Also, a geo-
polymer binder was fabricated from a ternary mix of slag, palm oil fuel ash and rice husk ash;
however, a small content of POFA was used in the binder (Karim, 2013). In other study
presented by Mijarsh et al. (2013), treated POFA was activated to produce the geo-polymer
binder. Supplementary materials such as silica fume, calcium hydroxide and alumina
hydroxide in addition to the alkaline activator were also used to increase the efficiency of
treated POFA in the production of geo-polymer products.
Apart of that, the combination of ultrafine palm oil fuel ash and ground blast furnace slag
(GGBS) was used to investigate the compressive strength and microstructure of geo-polymer
binder. Islam et al. (2014) also examined strength development for a geo-polymeric binder
from ground granulated blast furnace slag and palm oil fuel ash. The study revealed that the
binder with the binary mix of the low content of POFA and GGBS achieved the highest
compressive strength.

MCRJ Special Issue Vol. 4 | No. 2 | 2018 33
A similar observation was made by Tangchirapat et al. (2007) and Chindaprasirt et al.
(2008) who suggested the use of POFA up to 10% of binder mass due to its low pozzolanic
reactivity. Hence, to enhance the pozzolanic reactivity POFA must be ground to produce
smaller particle size. Chindaprasirt et al. (2008) also in his research found that the compressive
strength of POFA-incorporated mortar having a median particle size of 7 µm (3% retained on
a 45 µm sieve) to have higher values than control mortar due to the filler effect of finer particle
size.
On the other hand, the use of adequate industrial or agricultural by-products such as
quarry dust for partial cement replacement is an environmentally friendly method of disposal
of large quantities of materials that would otherwise pollute land, water and air. The granite
cutting industry produces large amounts of wastes which are solids (generated during
extraction) and sludge (generated during transformation processes) (Ho et al. 2002). Granite
fines are often referred to as quarry or rock dust, and this residue represents less than 1% of
aggregate production or between 1% and 2% by mass of the total aggregate crushed in
quarries, according to Abukerh and Fairfield (2011).
A study conducted by Raman et al. (2011) evaluate the suitability of quarry dust as a
partial substitute for sand in high-strength concrete (HSC) containing rice husk ash (RHA).
The findings of the research indicate that even though quarry dust inclusion as partial
replacement of sand results in some minor impacts to the workability of fresh concrete, it can
be compensated by a good mix design and by the use of super-plasticizer. The mixes
containing 20% quarry dust were chosen as the optimum mix design for both grades of
concrete. Incorporation of quarry dust into concrete mixes does improve some workability
properties of the mixes.
Medina et al. (2017) assesses the viability of designing new blended cement in which
10% or 20% of the clinker is replaced with quarry waste by analyzing the effect of its inclusion
on the chemical, rheological, mechanical and microstructure properties of the end product.
The later age change in the pore structure of the new mortars induced by the slow pozzolanic
kinetics of this supplementary cementitious material (SCM) translates into a narrow
difference in the mechanical performance between these and conventional mortars.
On top of that, the quarry industry produces millions of tones of wastes in the form of
quarry dust was increasing yearly (Bashar et al., 2016). These wastes are dumped in the
factory yards and hence reuse of quarry dust might help in reducing the overuse of mining
and quarrying. Hence, the use of these quarry dust could result in significant cost saving in
regions where limestone filler is not available, and it is an efficient use of a material that
would otherwise be a waste product (Schankoski et al., 2017).

MCRJ Special Issue Vol. 4 | No. 2 | 2018 34
MATERIALS AND METHODS
The experimental program presented in this paper was done at Universiti Tun Hussein
Onn Malaysia and Kolej Kemahiran Tinggi Mara located in Batu Pahat, Johor, Malaysia. The
details of the experimental works used are described in the following sections.
Materials
The primary raw materials used in this research were Portland cement type Cem II / B-M
32.5R according to Malaysian standard (MS-EN 197-1, 2014), palm oil fuel ash, quarry dust,
river sand and regular tap water. Also, Portland cement in this research is all-general purpose
use green label cement. It is manufactured by grinding calcium sulphate as a setting regulator
with Portland cement clinker and other carefully selected secondary constituents under careful
and stringent quality standards monitored by Lafarge Malaysia.
Palm oil fuel ash (POFA) was collected from Plantation Company located at Kluang,
Johor, Malaysia (Figure 1). POFA for this research procured from industry is a waste of oil
palm dry biomass which was burnt as a fuel at the temperature of 800 ºC to 1000 ºC. After
procuring the ash, it was oven dried at a temperature of 105 ºC for about 24 hours to remove
moisture and further, it was sieved by using 90 µm sieve to eliminate unburned fibers and to
improve its fineness, as particle size plays a crucial role in pozzolanic reactivity. Hence, to
enhance the pozzolanic reactivity POFA must be ground to produce lower particle size as
suggested by Kroehong et al. (2011). The process involving palm oil fuel ash is summarized
in Figure 2.
Figure 1. Palm oil fuel ash at plantation mill located in Kluang, Malaysia

MCRJ Special Issue Vol. 4 | No. 2 | 2018 35
Figure 2. Palm oil fuel ash process before being used
Using quarry waste as a substitute of sand in construction materials would resolve the
environmental problems caused by the large-scale depletion of the natural sources of river
and mining sands. In addition, quarry waste can be a profitable alternative to the natural sands
when the overall construction cost increases due to the transportation of sands from their
sources. Quarry dust wastes were obtained from Bina Kuari Sdn Bhd located at Kedah,
Malaysia. Upon testing, quarry dust was dry first to make sure it is in a dry condition (Figure
3). The quarry dust waste was dried and placed in the oven at 105oC. After drying, quarry dust
waste was grinded and crushed to make it easier in the sieve process as well as to eliminate
impurities.
Figure 3. Quarry dust waste after grinding process
Mix proportion
Two types of S/S matrices were produced in this research, each of matrices were used to
study both the effect of palm fuel ash replacement in cement and to investigate the effect of
quarry dust replacement in sand. As such, the investigation begins with replacement of palm
oil fuel ash (POFA) to cement with 10%, 20%, 30%, and 40% respectively. The S/S mortar
was tested in comparison to the control mix that had a ratio of 1:2.75 of cement to fine
aggregates. Meanwhile w/c ratio of 0.485 which is in accordance with the ASTM C109
standard for compressive strength testing of hydraulic cement mortars. Next, the same
percentages will be used as a sand replacement by using quarry dust which is 10%, 20%, 30%
and 40% respectively. Mix proportions are shown in Table 1 and Table 2.
Sieved by using 90µm sieves to
eliminate unburned fibers
Oven dried at a temperature of 105
ºC for about 24 hours to remove moisture
Palm oil fuel ash was stored and preserved in secured tank upon
receiving
Collection of palm oil fuel ash from plantation mill

MCRJ Special Issue Vol. 4 | No. 2 | 2018 36
Table 1. Details of mix proportion for palm oil fuel ash replacement
Table 2. Details of mix proportion for quarry dust replacement
During casting process, materials were weighed accordingly to their mix proportions.
Firstly, the dry materials were mixed in a rotating pan mixer for 2 min to avoid segregation.
Tap water was poured gradually to the respective mix samples. After about 5 min, the samples
were transferred into moulds with size 100 × 100 × 100 mm³ for casting. Samples were
compacted layer by layer into the moulds and the top of the surface were flattened evenly.
Test program
Characterization of main composition and heavy metals in raw materials such as palm oil
fuel ash, quarry dust and cement is an important parameter to determine the components exist
in the materials. Chemical composition and heavy metals characterization using X-Ray
Fluorescence (XRF) has been widely used and this method is fast, accurate and non-
destructive with a minimum of sample preparation. To get the result, sample preparation needs
to be done by preparing the pressed pellet. The density of all experimental samples was
conducted according to BS EN 12390-7:2009. Cube samples with size 100 × 100 × 100 mm³
that has been cured for 7, 14, and 28 days were used in this test. Meanwhile, compressive
strength test in this research were in accordance with ASTM-C109 which is a standard test
Samples Percentage of
POFA replacement (%)
Binder (kg) Fine Aggregates (1:2.75 wt binder)
(kg) Water to binder
ratio (%)
Cement POFA Sand Quarry
dust
A (Control) 0 7.893 0 21.706 0 0.485
B 10 7.104 0.789 21.706 0 0.485
C 20 6.314 1.579 21.706 0 0.485
D 30 5.525 2.367 21.706 0 0.485
E 40 4.736 3.157 21.706 0 0.485
Samples
Percentage of quarry dust replacement
(%)
Binder (kg) Fine Aggregates (1:2.75 wt binder)
(kg) Water to binder ratio (%)
Cement POFA Sand Quarry
dust
A (Control) 0 7.893 0 21.706 0 0.485
F 10 7.893 0 19.535 2.171 0.485
G 20 7.893 0 17.365 4.341 0.485
H 30 7.893 0 15.194 6.512 0.485
I 40 7.893 0 13.024 8.682 0.485
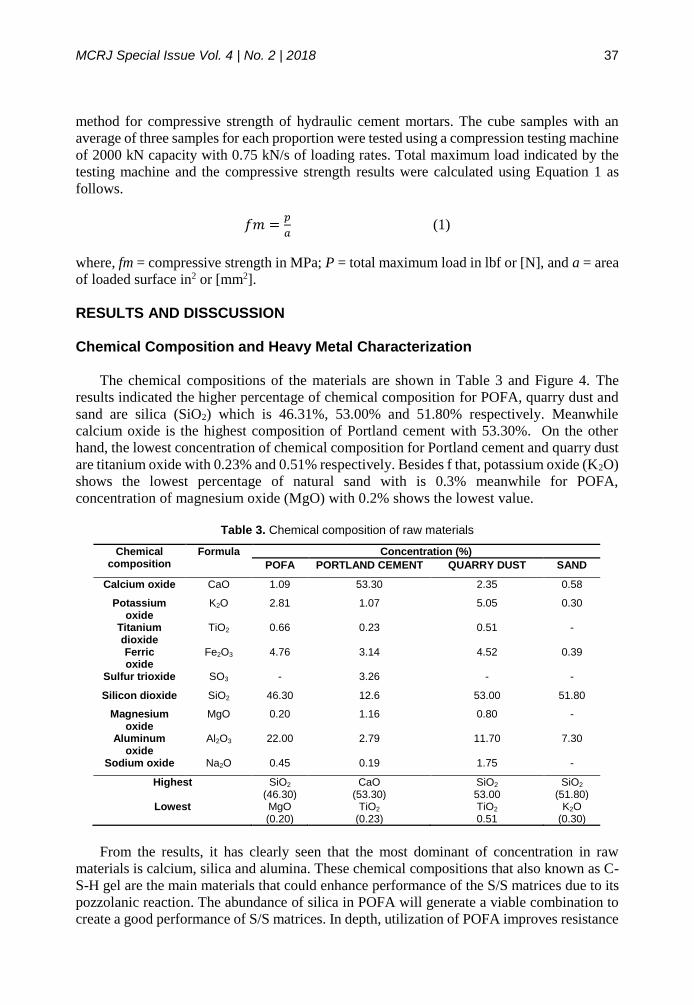
MCRJ Special Issue Vol. 4 | No. 2 | 2018 37
method for compressive strength of hydraulic cement mortars. The cube samples with an
average of three samples for each proportion were tested using a compression testing machine
of 2000 kN capacity with 0.75 kN/s of loading rates. Total maximum load indicated by the
testing machine and the compressive strength results were calculated using Equation 1 as
follows.
𝑓𝑚 =𝑝
𝑎 (1)
where, fm = compressive strength in MPa; P = total maximum load in lbf or [N], and a = area
of loaded surface in2 or [mm2].
RESULTS AND DISSCUSSION Chemical Composition and Heavy Metal Characterization
The chemical compositions of the materials are shown in Table 3 and Figure 4. The
results indicated the higher percentage of chemical composition for POFA, quarry dust and
sand are silica (SiO2) which is 46.31%, 53.00% and 51.80% respectively. Meanwhile
calcium oxide is the highest composition of Portland cement with 53.30%. On the other
hand, the lowest concentration of chemical composition for Portland cement and quarry dust
are titanium oxide with 0.23% and 0.51% respectively. Besides f that, potassium oxide (K2O)
shows the lowest percentage of natural sand with is 0.3% meanwhile for POFA,
concentration of magnesium oxide (MgO) with 0.2% shows the lowest value.
Table 3. Chemical composition of raw materials
From the results, it has clearly seen that the most dominant of concentration in raw
materials is calcium, silica and alumina. These chemical compositions that also known as C-
S-H gel are the main materials that could enhance performance of the S/S matrices due to its
pozzolanic reaction. The abundance of silica in POFA will generate a viable combination to
create a good performance of S/S matrices. In depth, utilization of POFA improves resistance
Chemical composition
Formula Concentration (%)
POFA PORTLAND CEMENT QUARRY DUST SAND
Calcium oxide CaO 1.09 53.30 2.35 0.58
Potassium oxide
K2O 2.81 1.07 5.05 0.30
Titanium dioxide
TiO2 0.66 0.23 0.51 -
Ferric oxide
Fe2O3 4.76 3.14 4.52 0.39
Sulfur trioxide SO3 - 3.26 - -
Silicon dioxide SiO2 46.30 12.6 53.00 51.80
Magnesium oxide
MgO 0.20 1.16 0.80 -
Aluminum oxide
Al2O3 22.00 2.79 11.70 7.30
Sodium oxide Na2O 0.45 0.19 1.75 -
Highest SiO2 (46.30)
CaO (53.30)
SiO2 53.00
SiO2 (51.80)
Lowest MgO (0.20)
TiO2 (0.23)
TiO2
0.51 K2O
(0.30)

MCRJ Special Issue Vol. 4 | No. 2 | 2018 38
to chloride ion penetration (Chindaprasirt et al., 2008; Awal and Hussin 1999) enhances
resistance to acidic environment (Tay, 1990) and sulphate attack (Jaturapitakkul et al., 2007).
Figure 4. Bar chart of raw materials against concentration (%)
Based on Table 4, it shows that there were 11 major elements or heavy metals exist in
materials such as POFA, Portland cement and quarry dust. The highest values for Fe are
recorded highest element recorded in quarry dust (416 ppm) and Portland cement (296 ppm)
respectively. Other than that, Ba recorded the second highest element in quarry dust and
POFA with 389 ppm and 360 ppm respectively. Other than that, elements or heavy metals
such as Cu (12 to 52 ppm), Pb (7 to 62 ppm), Zn (11 to 151 ppm), V (43 to 84 ppm), Ni (4 to
17 ppm), Cr (9 to 69 ppm) and As (6 to 37 ppm) are observed from the raw materials. Besides
that, there were some heavy metals were not detected such Mn (POFA), Ba(Portland cement),
Fe (POFA) and Cd (all raw materials).
Table 4. Heavy metals concentration of raw materials
Heavy metals concentration
Formula Concentration (ppm)
POFA PORTLAND CEMENT
QUARRY DUST SAND
Copper Cu 6 20 12 52
Lead Pb 19 60 62 7
Zinc Zn 34 132 151 11
Manganese Mn - 7 6 -
Vanadium V 60 84 43 -
Nickel Ni 8 17 14 4
Barium Ba 360 - 389 24
Chromium Cr 12 69 16 9
Ferum Fe - 296 416 -
Arsenic As 16 37 6 6
Cadmium Cd - - - -

MCRJ Special Issue Vol. 4 | No. 2 | 2018 39
Effect of density of palm oil fuel ash and quarry dust replacement in S/S matrices
The density values of palm oil fuel ash replacement and quarry dust replacement in S/S
matrices are given in Figure 5 and Figure 6 respectively. The values for control samples are
in the range of 2100 kg/m3 to 2260 kg/m3. From Figure 5, it shows that density of the different
percentages of POFA with10%, 20%, 30% and 40% are much lower than the control samples.
The lowest values of the density are recorded by 40% replacement of POFA ranging from
1380 kg/m3 to 1430 kg/m3. Meanwhile, the 10% replacement of POFA recorded a
considerable value of density ranging from 1500 kg/m3 to 1660 kg/m3 respectively. From the
observation, it shows that higher percentages of POFA replacements will decrease the density
of the S/S samples. This hypothesis supported by Raut and Gomez (2016) that used oil palm
fiber reinforced mortar utilizing palm oil fly ash as a complementary binder. It has been found
that the mortar mix is slightly lower than the control mix due to POFA has lower density
replacing the cement particles.
Figure 5. Density of different percentages of POFA with 0% (control), 10%, 20%, 30% and 40% at
different ages (7, 14 and 28 days)
Similar trends of density are observed from quarry dust replacement in S/S matrices. It
shows that density of the quarry dust samples recorded slightly lower than the control samples.
20% replacement of quarry dust in natural sand recorded a value of density ranging from 2080
kg/m3 to 2147 kg/m3. Meanwhile, the lowest was obtained from 40% of quarry dust
replacement samples with average of 2073 kg/m3 to 2087 kg/m3.

MCRJ Special Issue Vol. 4 | No. 2 | 2018 40
Figure 6. Density of different percentages of quarry dust with 0% (control), 10%, 20%, 30% and 40%
at various ages (7, 14 and 28 days)
Effect of compressive strength of palm oil fuel ash and quarry dust replacement in S/S matrices
The results of compressive strength test of palm oil ash and quarry dust replacement at 7
days, 14 days and 28 days in triplicate samples are shown in Figure 7 and Figure 8. It can be
observed that compressive strength develops over curing time.
By referring to Figure 7, the compressive strength of different percentages of palm oil
fuel ash with 0% (control), 10%, 20%, 30% and 40% of various S/S matrices ages (7, 14 and
28 days) were presented. As expected, control sample without POFA and quarry dust
replacement showed the highest value of compressive strength at each tested days. On 28
days, the highest compressive strength was achieved by control sample with 27.75 MPa
followed by 10% of POFA (22.60 MPa), 20% of POFA (18.13MPa), 30% of POFA (11.62
MPa) and 40% of POFA (9.35 MPa).The development of compressive strength for POFA
replacements was slightly slower than control samples. It can be seen from the difference of
strength at 7 days to 28 days. In comparison to the control sample, the compressive strength
of palm oil fuel ash replacement decreased 21.4%, 36.93%, 59.58% and 67.48% for 10%,
20%, 30% and 40% of POFA respectively. It indicated that higher value of POFA replacement
influences the decreasing on the compressive strength compared to control samples. Addition
of POFA produces tiny voids in between the particles that result in a wide spread of void size
and thus lower the mechanical strength. Tay and Show (1995) suggested using oil palm ash
sieved through a 150 µm sieve to be used as a replacement to cement and discovered that only
a 10% replacement level showed a minor reduction in compressive strength than the control
mix for compressive strength exposed to 1 year of curing indicating the presence of a
pozzolanic reaction. Hence, to increase its pozzolanic reactivity, OPA must be ground to
produce finer particle size material.
Other than that, all the samples were above the landfill disposal limit regulatory which is
higher than 0.34 MPa at 28 days as suggested by Yin et al. (2008). However, only 10% of
POFA replacement in S/S is above comparative mortar limit of 20 MPa on 28 days.

MCRJ Special Issue Vol. 4 | No. 2 | 2018 41
Figure 8 shows the compressive strength of different percentages of quarry dust as a
partial sand material in S/S matrices. The strength at 28 days for quarry dust replacement is
recorded at peak from 20% of replacement with 24.91 MPa followed by 10% of quarry dust
(23.75 MPa), 30% of quarry dust (22.84 MPa) and lastly from 40% of quarry dust (13.80
MPa). It indicated that 20% of quarry dust replacement in sand is the most suitable to imitate
control compressive strength. To be compared to the control sample, the compressive strength
is decreased with by 10.23%, 14.44%, 17.69% and 50.28% for 20%, 10%, 30% and 40% of
quarry dust respectively. These fluctuated of compressive strength are strong because fine
particles may seal voids in the paste and act as precipitation sites for the hydration products,
thus strengthening the paste. This phenomenon is known as filler effect. However, if large
amounts of fines are added in concrete, the bigger aggregate grains are further separated by
the smaller particles and the filler effect is reduced (Vogt, 2010).
Figure 7. Compressive strength of different percentages of palm oil fuel ash with 0% (control), 10%,
20%, 30% and 40% at various ages (7, 14 and 28 days)
Figure 8. Compressive strength of various percentages of quarry dust with 0% (control), 10%, 20%,
30% and 40% at different ages (7, 14 and 28 days)
MCRJ Special Issue Vol. 4 | No. 2 | 2018 42
CONCLUSION
As a conclusion, this research is an attempt to study the feasibility of palm oil fuel ash
and quarry dust replacement in S/S matrices. From the results, it shows that compared to the
control samples, the best percentages of POFA and quarry dust replacement are 10% and 20%
respectively. The results showed that, even though the strength was below than control
samples, the replacement of POFA and quarry dust are still acceptable considering the
replacement criteria such as cost reduction, waste utilization and waste immobilization in S/S
matrices. These findings have been approved according to its composition, the comparable
compressive strength during the curing period and also acceptable density. Replacement
method could decrease the enormous quantities of palm oil and quarry dust disposal towards
the environment. In addition to that, this study provides a sustainable solution by minimizing
the treatment cost by utilizing palm oil ash to replace cement as well as quarry dust replacing
sand providing low cost materials for S/S method that may lead to construction applications.
Thus, a proper sustainable and safe way of reusing such waste materials as in this research is
useful towards the environment and sustainability for development purposes.
ACKNOWLEDGEMENT
This research was supported by the Fundamental Research Grant Scheme of the Ministry of
Higher Education of Malaysia: Enhancement of petroleum sludge waste treatment
performance by using solidification/stabilization (S/S) method with palm oil ash as partial
cement replacement (Grant No.1528). Special thanks to Universiti Tun Hussein Onn Malaysia
for provide financial funding through Postgraduate research grant (Grant No. U793) and
partly sponsored by the Centre for Graduate Studies UTHM.
REFERENCES
Awal, A.S. and Hussin M.W. (2011) Effect of Palm Oil Fuel Ash in Controlling Heat of
Hydration of Concrete. Procedia Engineering, 14:2650-2657.
Awal, A.S. and Hussin M.W. (1999) Durability of High Performance Concrete Containing
Palm Oil Fuel Ash, Eighth International Conference on Durability of Building Materials
and Components. Vancouver, 30 (8):465–474.
Abukersh, S.A. and Fairfield, C.A. (2011) Recycled Aggregate Concrete Produced with Red
Granite Dust as A Partial Cement Replacement. Construction and Building Materials,
25(10):4088-4094.
Ariffin, M.A.M., Bhutta, M.A.R., Hussin, M.W., Tahir, M.M. and Aziah, N. (2013) Sulfuric
Acid Resistance of Blended Ash Geopolymer Concrete. Construction and Building
Materials, 43:80-86.
ASTM C109 / C109M-16a (2016) Standard Test Method for Compressive Strength of
Hydraulic Cement Mortars (Using 2-in. or [50-mm] Cube Specimens). ASTM
International.
Bashar, I.I., Alengaram, U.J., Jumaat, M.Z. and Islam, A. (2016) Development of Sustainable
Geopolymer Mortar using Industrial Waste Materials. Materials Today: Proceedings,
3(2):125-129.
BS EN 12390-7 (2009) Testing hardened concrete. Density of hardened concrete. British
Standard International.

MCRJ Special Issue Vol. 4 | No. 2 | 2018 43
Caldwell, R.J., Cote, P.L. and Chao, C.C. (2009) Investigation of Solidification for the
Immobilization of Trace Organic Contaminants. Hazardous Waste Hazardous Materials,
7(3):273–282.
Chindaprasirt, P., Rukzon, S. and Sirivivatnanon, V. (2008) Resistance to Chloride
Penetration of Blended Portland Cement Mortar Containing Palm Oil Fuel Ash, Rice
Husk Ash and Fly Ash. Construction and Building Materials, 22(5):932-938.
Navarro-Blasco, I., Duran, A., Sirera, R., Fernandez, J.M. and Alvarez, J.I. (2013)
Solidification/stabilization of toxic metals in calcium aluminate cement matrices.
Journal of Hazardous Materials, 260:89–103.
Foo K.Y. and Hameed B.H. (2009) Value-added Utilization of Oil Palm Ash: A Superior
Recycling of the Industrial Agricultural Waste. Journal of Hazardous Materials;172(2–
3):523-531.
Galetakis, M. and Soultana, A. (2016) A Review on the Utilisation of Quarry and Ornamental
Stone Industry Fine By-products in the Construction Sector. Construction and Building
Materials, 102(part 1):769–781.
Ho, D.W.S., Sheinn, A.M.M. and Tam, C.T. (2002) The Use of Quarry Dust for SCC
Application. Cement and Concrete Research, 32(4):505-511.
Islam, A., Alengaram, U.J., Jumaat, M.Z. and Bashar I.I. (2014) The Development of
Compressive Strength Of Ground Granulated Blast Furnace Slag-Palm Oil Fuel Ash-fly
Ash Based Geopolymer Mortar. Materials & Design, 56:833-841.
Ismail, M., Ismail, M.E. and Muhammad, B. (2011) Influence of Elevated Temperatures on
Physical and Compressive Strength Properties of Concrete Containing Palm Oil Fuel
Ash. Construction and Building Materials, 25(5):2358-2364.
Jaturapitakkul, C., Kiattikomol, K., Tangchirapat, W. and Saeting, T. (2007) Evaluation of
the Sulfate Resistance of Concrete Containing Palm Oil Fuel Ash. Construction and
Building Materials, 21(7):1399–1405.
Johnson, O.A., Madzlan, N., Kamaruddin, I. and Oloruntobi, O.O. (2016) Building Blocks
from Petroleum Sludge : Leachability and toxicity studies Building Blocks from
Petroleum Sludge : Leachability and toxicity studies. International Journal of Applied
Engineering Research, 10(24):45479-45481.
Kadir, A. A. and Hassan, M. I. H. (2014a) An Overview of Fly Ash and Bottom Ash
Replacement in Self Compaction Concrete. Key Engineering Materials, 594-595:465-
470.
Kadir, A. A., Hassan, M. I. H., Jamaluddin, N. and Abdullah, M.M.A.B. (2016) Properties
and Leachability of Self-compacting Concrete Incorporated with Fly Ash and Bottom
Ash. IOP Conference Series: Materials Science and Engineering, 133(012039): 1 - 10.
Karim, M.R., Zain, M.F.M., Jamil, M. and Lai, F.C. (2013) Fabrication of A Non-cement
Binder using Slag, Palm Oil Fuel Ash and Rice Husk Ash with Sodium Hydroxide.
Construction and Building Materials, 49:894-902
Kroehong, W., Sinsiri, T. and Jaturapitakkul, C. (2011) Effect of Palm Oil Fuel Ash Fineness
on Packing Effect and Pozzolanic Reaction of Blended Cement Paste. Procedia
Engineering, 14:361-369.
Lampris, C., Stegemann, J.A. and Cheeseman, C.R. (2009) Solidification/stabilisation of Air
Pollution Control Residues using Portland Cement : Physical Properties and Chloride
Leaching. Waste Management, 29(3):1067–1075.
Malaysian Standard (MS EN 197-1, 2004) Cement - Part 1: Composition, specifications and
conformity criteria for common cements.
Malhotra, V.M. (2002) Introduction: Sustainable Development and Concrete Technology.

MCRJ Special Issue Vol. 4 | No. 2 | 2018 44
Concrete International, 24(7).
Mazenan, P.N., Khalid, F.S., Shahidan, S. and Shamsuddin, S.M. (2017) Review of palm oil
fuel ash and ceramic waste in the production of concrete. IOP Conference Series:
Materials Science and Engineering, 271(012043):1-6.
Medina, G., Bosque, I.F.S., Frias, M., Rojas, M.I.S. and Medina, C. (2017) Granite Quarry
Waste as a Future Eco-Efficient Supplementary Cementitious Material (SCM): Scientific
and Technical Considerations. Journal of Cleaner Production, 148:467-476.
Mijarsh, M.J.A., Johari, M.A.M. and Ahmad Z.A. (2014) Synthesis of Geopolymer from
Large Amounts of Treated Palm Oil Fuel Ash: Application of the Taguchi Method in
Investigating the Main Parameters Affecting Compressive Strength. Construction and
Building Materials, 52:473-481.
Raman, S.N., Ngo, T., Mendis, P. and Mahmud, H.B. (2011) High-strength Rice Husk Ash
Concrete Incorporating Quarry Dust as a partial Substitute for Sand. Construction and
Building Materials, 25(7):3123-3130.
Raut, A.N. and Gomez, C.P. (2016) Thermal and Mechanical Performance of Oil Palm Fiber
Reinforced Mortar Utilizing Palm Oil Fly Ash as a Complementary Binder. Construction
and Building Materials, 126:476-483.
Schankoski, R.A., Pilar, R., Prudencio Jr, L.R. and Ferron, R.D. (2017) Evaluation of Fresh
Cement Pastes Containing Quarry By-product Powders. Construction and Building
Materials, 133:234-242.
Tangchirapat, W., Saeting, T., Jaturapitakkul, C., Kiattikomol, K. and Siripanichgorn, A.
(2007) Use Of Waste Ash from Palm Oil Industry in Concrete. Waste Management,
27(1): 81-88.
Tay, J.H. (1990) Ash from Oil-Palm Waste as a Concrete Material. Journal of Materials in
Civil Engineering, 2(2):94-105.
Tay, J. H. and Show, K. Y. (1995) Use of Ash Derived from Oil-palm Waste Incineration as
a Cement Replacement Material. Resources, Conservation and Recycling, 13(1):27-36.
Tuncan, A., Tuncan, M. and Koyuncu H. (2000) Use of Petroleum-contaminated Drilling
Wastes as Sub-base Material for Road Construction, Waste Management & Research,
18(5): 489-505.
Vogt, C. (2010) Ultrafine Particles in Concrete - Influence of Ultrafine Particles on Concrete
Properties and Application to Concrete Mix Design. PhD Thesis, Royal Institute of
Technology, Sweden.
Wright, R.A.D. and Noordhuis, B.R. (1991) The treatment and Disposal of Oily Sludge.
Society of Petroleum Engineering of AIME, Richardson, USA.
Yin, C.Y., Ali, W.S.W. and Lim, Y.P. (2008) Oil Palm Ash as Partial Replacement of Cement
for Solidification/Stabilization of Nickel Hydroxide Sludge. Journal of Hazardous
Materials, 150(2):413-418.

MCRJ Special Issue Vol. 4 | No. 2 | 2018 45
STRENGTH AND PHYSICAL PROPERTIES OF SUSTAINABLE CONCRETE MASONRY AT ELEVATED TEMPERATURE: A REVIEW Nurain Izzati Mohd Yassin1, Suraya Hani Adnan2, Shahiron Shahidan1, Noorwirdawati Ali1, Nurul Amirah Kamarulzaman2, Norwardatun Abd Roni2 1Jamilus Research Centre, Faculty of Civil and Environmental Engineering, Universiti Tun Hussein Onn Malaysia. 2Department of Civil Engineering, Faculty of Engineering Technology, Universiti Tun Hussein Onn Malaysia.
Abstract This paper is an overview of the performance of sustainable concrete masonry containing industrial waste as cement replacement which exposed to high temperature. These industrial waste or also known as pozzolanic materials have been widely used due to their characteristic which could act as the binder in concrete. By replacing cement content in concrete this could make concrete more sustainable due to less carbon content. Based on previous researches, the performance of these sustainable concrete have been investigated in terms of its residual compressive strength and physical properties at elevated temperature. These parameters are important factor that could contribute to the structural stability and valuation of serviceability state of structure. Large numbers of research on pozzolanic concrete at elevated temperature have been conducted. Among pozzolanic materials used were fly ash, palm oil fuel ash, volcanic ash, silica fume, blast slag furnace and etc. As general according to previous research, pozzolanic concrete have better performance than OPC concrete at temperature less than 500oC. In terms of physical properties, surface cracks and discolouration of concrete has been observed. Studies show that, surface cracks on pozzolanic concrete were less than OPC concrete. Meanwhile, for discolouration impact, it was observed that, both OPC and pozzolanic concrete have similar changes in colour where the colour of concrete became lighter as the firing temperature increased. From this review it can be conclude that these industrial wastes are good in enhancing the sustainable environment as well as improving the fire resistance performance of concrete masonry. Keywords: Industrial Waste; Pozzolanic Materials; Concrete Masonry; Elevated Temperature
INTRODUCTION
Sustainability is widely known as the most paramount factor in construction industries all
over the world (Brizga et al., 2014). In UK for instance, the government are forecasting all
the new domestic and commercial building to be zero carbon rated by 2016 and 2020
respectively (Alwan et al., 2015; Khalid et al., 2017). Meanwhile, in Malaysia, the
implementation of sustainable construction and green building has been introduced in the
Malaysia Construction Industry Master Plan (2005-2015).
One of the main concerns in construction industries is the large consumption of cement
in the production of concrete. The usage of cement not only diminishes the natural resources
such as lime stone yet it has contributed to the high emission of carbon dioxide and other
greenhouse gases (GHGs) (Rehan and Nehdi, 2005; Ismail et al., 2016; Ramzi at al., 2016).
According to Rahman et al. (2014), there is scientific report stated that about 7% of world’s
carbon dioxide emission was contributed by the cement production in industries. As well as
stated by United Nation Environment Programme (UNEP) that one third or world carbon
emission contributed by the building sector. Therefore, researchers have investigated the best
alternative to overcome this problem.
MCRJ Special Issue Vol. 4 | No. 2 | 2018 46
Based on several research that have been conducted, researchers have found that large
number of industrial waste such as fly ash (Babu et al., 2006), silica fume (Chen et al., 2010),
bottom ash (Arenas et al., 2011) have good potential as cement replacement. This is because
these industrial wastes have a pozzolanic characteristic which high in amorphous silica
dioxide (SiO2) and aluminium oxide (Al2O3). Pozzolanic characteristic own by this industrial
waste enable these materials to act as the binder in the concrete.
It has been proved that about 10% to 20% replacement of cement by pozzolanic materials
gave better strength than normal concrete (Awal and Hussin 2011; Lim et al., 2013; Rahman
et al.,2014; Kroehong et al., 2011; Islam et al., 2016). Due to this, researchers have extended
their research on fire resistance impact of pozzolanic concrete. This is because fire resistance
is one of the vital parameter in determining the performance of building materials.
The effects of fire towards building materials such as concrete have been widely
investigated. Ordinary Portland Cement (OPC) in the concrete has been proved to be one of
best materials in concrete which could resist the impact of fire towards concrete (Phan, 1996).
However, based on previous research it shows that there are changes in the physical and
mechanical performance of concrete that exposed to elevated temperature. According to
Ranjbar et al. (2014) these changes have been observed when this concrete was exposed to
temperature more than 400oC. This is because, at this stage, one of chemical composition of
OPC which is calcium hydroxide will decompose into calcium oxide and water. The loss in
strength is due to the dehydration of the calcium hydroxide and rehydration of calcium oxide.
Due to this problem, researchers have extended their research on improvisation of the concrete
or masonry unit performance at elevated temperature.
Large number of research on the effects of high temperature towards concrete containing
pozzolanic materials has been conducted. Based on the findings, it shows that pozzolanic
materials in concrete give a significant impact towards the physical and mechanical
performance of concrete at elevated temperature. The following sections present a brief
review of previous research on the pozzolanic concrete at elevated temperature.
EFFECTS ON RESIDUAL COMPRESSIVE STRENGTH
Residual compressive strength is defined as the strength of specimen after being exposed
to heating and cooling process. This parameter has been investigated in order to determine the
performance of specimens towards fire resistance (Ahn et al., 2016). Abundant of research
have shown a significant effect on residual compressive strength of pozzolanic concrete at
elevated temperature. Among pozzolanic materials that have widely used in the concrete are
fly ash, silica fume, blast furnace slag, volcanic ash and palm oil fuel ash. Based on research
conducted by Tanyildizi and Coskun (2008), fly ash has been used as the cement replacement
in the concrete. The percentage of cement replacement was varied from 0% to 30% by weight.
Meanwhile, the temperature exposed was 20oC, 200oC, 400oC and 800oC. From the findings,
it shows that, at 200oC the residual strength of concrete with 10% of fly ash is 98.34% of its
original strength. However, concrete with 0% of fly ash has a residual compressive strength
97.95 of its original strength. This shows that, the existing of fly ash in concrete has helps in
proving the residual compressive strength at elevated temperature. This is due to the formation
of tobermorite which formed at high pressure and temperature.

MCRJ Special Issue Vol. 4 | No. 2 | 2018 47
A year before, similar research has been conducted by Aydin and Baradan (2007), where
they have studied the effects of fly ash concrete when subjected to elevated temperature.
However, in this research, the replacement of fly ash were higher which about 20% to 60%.
As shown in Figure 1, it was observed that, all specimens gained strength when exposed to
300oC. Concurrently, the specimens show slightly decreased in strength when subjected to
600oC. Yet, the strength at this temperature was higher than strength at normal temperature.
They have concluded that, the strength gained was due to strengthened hydrated cement paste
during evaporation process which leads to greater Van der Waal’s forces causes by cement
gel layers which moving closer to each other. In a meantime, a significant fall in strength has
been observed when specimens subjected to 900oC. Nonetheless, a positive effects shown by
concrete containing 60% of fly ash where the residual compressive strength was increased.
This clearly proved that fly ash could improve the fire resistance in the concrete.
Figure 1. Relative residual compressive strength (Aydin and Baradan, 2007)
Earlier research on fly ash concrete was conducted by Xu et al. (2001). The replacement
percentage was 25% and 50%. In this research, it was found that, the strength of fly ash
concrete only increased when subjected to 250oC and the strength started to fall when
subjected to temperature 450oC. This probably because the fly ash used was low-calcium
(class F) fly ash. Therefore, less formation of C-S-H gel were formed.
Based on Awal and Shehu (2015), the performance of concrete containing high volume
of palm oil fuel ash (POFA) exposed to elevated temperature was observed. In their research,
the replacement of cement by POFA was 50%, 60% and 70%. At temperature of 200oC all
POFA concrete shows significant increase in residual compressive strength. On the other
hand, the OPC concrete loss its strength from 44.4Mpa to 42Mpa. Increase in strength
probably due to the increase in the binding properties of calcium-silicate-hydrate (C-H-S) gel
in the concrete. POFA concrete continue in gaining the strength when exposed 400oC this is
due to the formation of extra C-S-H gel. However, there were significant fall in strength which
exposed to temperature more than 600oC. The effect of temperature on residual compressive
strength of concrete is illustrated in Figure 2.

MCRJ Special Issue Vol. 4 | No. 2 | 2018 48
Figure 2. Effect of temperature on residual compressive strength of concrete (Awal and
Shehu, 2015)
In research conducted by Ranjbar et al. (2014), POFA has been used as the replacement
of conventional binder in geopolymer concrete which contains low calcium of fly ash. POFA
was replaced the fly ash from 25% to 100%. All specimens were subjected to temperature up
to 1000oC. According to the findings, it shows that all the residual strength of specimen was
decreased as the percentage of POFA increase. However, despite the decreasing in strength
due to high POFA content, it also shows that the residual strength was increased when all the
specimens were subjected to temperature from 300oC to 500oC. Deterioration of specimen
could be seen after it was subjected to 800oC and 1000oC.
Another research on POFA concrete at elevated temperature has been investigated by
Ismail et al. (2010). Where in this research 20% of POFA has been replaced the OPC. The
temperature range was 100oC to 800oC. At room temperature, the strength of OPC concrete
was 45Mpa and POFA concrete was 41Mpa. Nevertheless, the strength of OPC concrete was
decreased as the temperature increased. The strength of POFA concrete was slightly decreased
at 100oC. However, the specimens keep gaining the strength when subjected to 300oC and
500oC of temperature. There were several factors that probably contributed in the strength
gaining process which are the existence of change in thermal strain, fineness of POFA used
and the hydration of un-hydrated cement. Finally, all the specimens were deteriorated when
subjected to temperature greater than 800oC. In Canada, a research has shown a positive
impact of volcanic ash in concrete at elevated temperature. In this research, the percentage of
volcanic ash used was 5% to 20%. The exposed temperature was 25oC, 200oC, 400oC, 600oC
and 800oC. It was observed that, volcanic ash concrete gained strength at 200oC and the
highest strength gained was 20% volcanic ash concrete where the strength was increased
about 14% from original strength. It was found that, the strength of concrete was decreased
about 4% to 15% of original strength at 400oC. However, volcanic ash concrete has better
performance than OPC concrete. The concrete strength was decreased as the temperature
increased. All specimens were deteriorated at 800oC due to decomposition of C-S-H gel.
Other than that, the loss in strength of concrete exposed to higher temperature probably due
to the coarsening of the pore structure (Khandaker and Hossain, 2006).
For research conducted by Saridemir et al. (2016), two types of pozzolanic materials have
been used in the production of concrete which are ground pumice (GP) and metakaolin (MK).

MCRJ Special Issue Vol. 4 | No. 2 | 2018 49
In this research, they have compared the performance of normal concrete with concrete
containing GP and concrete containing GP and MK. In general, it was found that, all
specimens were lost the strength as the temperature increase. At temperature of 200oC, there
was no significant lost in strength in normal and pozzolanic concrete. In fact, there was
slightly increase in strength for concrete containing 20% of GP. At this temperature, 20%GP
concrete has highest formation of C-S-H gel. The strength continues to lose as the temperature
increase to 500oC. However, it can be seen that, the strength of pozzolanic concrete at this
stage was higher than normal concrete. Meanwhile, at 750oC all specimens show significant
lost in strength due to the disintegration of C-S-H gel and increased in macro cracks.
According to previous research, majority of the research on pozzolanic concrete was
focused on one type of pozzolanic materials. Different research has been conducted by Poon
et al. (2001), where in this research the performance of high strength concrete at elevated
temperature with different types of pozzolanic materials was conducted. Pozzolanic materials
used were silica fume (SF), flay ash (FA) and blast furnace slag (BS). From the results as
shown in Table 1, it shows that, fly ash and blast furnace slag concrete gained strength at
200oC due to the for C-S-H gel. However, strength of silica fume concrete was slightly
decreased. Meanwhile, at 400oC, the strength of fly ash concrete and blast furnace slag were
slightly decreased yet the strength was higher than normal concrete and silica fume concrete.
It was found that, the structure of silica fume concrete was denser compared to other type of
concrete. Denser structure causes splitting of concrete at high temperature. Therefore, this can
be conclude that, silica fume is one of the pozzolanic materials that could not contribute in
fire resistance of concrete.
Table 1. Residual compressive strength of concrete with different types of pozzolanic materials
(Poon et al., 2001)
Mix
Compressive Strength (MPa)
20 200 400 600 800
HS-CC 91.3 88.0 (96%) 81.5 (89%) 53.0 (58%) 21.9 (24%)
HS-SF5 106.1 105.5 (99%) 98.7 (93%) 55.2 (52%) 22.3 (21%)
HS-SF10 119.9 117.7 (98%) 104.3 (87%) 52.8 (44%) 19.2 (16%)
HS-FA20 96.6 110.2 (114%) 92.9 (96%) 59.8 (62%) 27.0 (28%)
HS-FA30 102.8 124.6 (121%) 100.7 (98%) 68.9 (67%) 32.9 (32%)
HS-FA40 107.7 131.5 (122%) 112.2 (104%) 61.4 (57%) 32.3 (30%)
HS-SF+FA 123.9 135.3 (109%) 116.5 (94%) 63.2 (51%) 23.5 (19%)
HS-BS30 111.9 126.7 (113%) 108.5 (97%) 59.3 (53%) 30.2 (27%)
HS-BS40 115.5 133.3 (115%) 114.9 (100%) 70.5 (61%) 33.6 (29%)
EFFECTS ON PHYSICAL CHARACTERISTIC
Physical characteristic of concrete at elevated temperature could be observed by the
formation of crack on the concrete surface and the changes in colour of concrete. Following
section discuss the changes in physical properties of pozzolanic concrete after been exposed
to elevated temperature.

MCRJ Special Issue Vol. 4 | No. 2 | 2018 50
Surface Cracks
Crack will be formed when concrete subjected to high temperature. When concrete
subjected to high temperature, several transformations will be occurred such as moisture
evaporation, internal vapour pressure, aggregates expansion, cement paste contraction and
chemical decomposition (Shahidan et al., 2016). Usually, at the early stage, this
transformation unable to cause any formation of crack except the rate of heating is extremely
high (Peng et al., 2008; Shahidan et al., 2011). Research conducted by Ismail et al. (2010) has
shown the impact of temperature rise on the formation of cracks on POFA concrete. 20% of
POFA has been replaced the OPC content. From the findings, it shows that no formation of
crack was observed on both OPC and POFA concrete at 100oC and 300oC. However, hair-
line cracks were started to appeared at 500oC and became significant at 800oC. Hair-line crack
at 500oC was due to development of adequate vapour pressure and the process of expansion
and contraction which cause cracks in both OPC and POFA concrete. From this research, it
was found that there was no significant different between OPC and POFA concrete. In other
research by Tanyildizi and Coskun (2008), there was significant different in physical
properties of OPC and fly ash concrete at elevated temperature. It was found that, the cracks
started to appeared when subjected to 400oC. It also can be seen that, the formation of cracks
decreased as the percentage of fly ash increased at the same time it was increased as the
temperature increased. Similar observation was found by Ahn et al. (2016) where the addition
of fly ash enables to reduce the formation of cracks. It can be conclude that fly ash could
improve the physical properties of concrete when subjected to high temperature.
As well as fly ash, volcanic ash also has been proved as one of the pozzolanic materials
that could improve the physical properties of concrete at high temperature. According to
Khandaker and Hossain (2006), about 5% to 20% of volcanic ash has been replaced the OPC
in concrete. From the observation, the cracks were started at 300oC. Width of cracks was
increased as temperature increased in a meantime it was decreased as the percentage of
volcanic ash increased. For OPC concrete, it was found that, there was one or two major crack
in the middle of specimen. Meanwhile, for volcanic ash concrete, there were only minor
cracks and no major cracks were observed. Poon et al. (2001) in their research has proved that
silica fume is not good to be used as fire resistance materials. It was found that, at early stage
firing, hairline cracks were formed at silica fume concrete surface. This is because the
structure of silica fume was denser than other concrete which are fly ash and blast slag furnace
concrete. Dense structure was results from vapour pressure formed by the evaporation of
bound water. At final stage of firing, which at 800oC, OPC concrete shows major cracks
however no splitting occurs. For fly ash and blast slag furnace concrete, only minor cracks
were observed and for silica fume, the concrete was splitting. Figure 3 shows all the surface
cracks patterns of different concretes at 800oC.
Figure 3. Surface cracking of concrete at 800oC (Poon et al.,2001)
FA BS SF OPC

MCRJ Special Issue Vol. 4 | No. 2 | 2018 51
However, different outcome has been determined by Saridemir et al. (2016), when
concrete with ground pumice (GP) and metakaolin (MK) did not show any significant changes
on the surface when it was exposed up to 500oC temperature. The crack was observed when
the specimens were exposed to 750oC. In this research, it shows that, the existing of GP and
MK did not contribute any impact towards formation of crack on concrete. It shows that, the
formations of cracks increased as the temperature increased where similar observation has
been made by Akçaözoglu (2013). The formation of cracks was the contributor of reduction
in residual compressive strength. This explained the significant reduction in residual
compressive strength of concrete when exposed to very high temperature.
Discolouration of Concrete
Heating process of concrete could affect the colour of the specimens. The colour of
concrete changed as the temperature increased. The effect of high temperature towards
discolouration of specimens was investigated extensively (Abdulkareem et al., 2014).
According to Ismail et al. (2010), for OPC concrete, the colour was change from normal grey
to whitish-grey as the specimens subjected to elevated temperature. At the same time, for
POFA concrete, the concrete colour was changed from black (at room temperature) to light
grey (at 800oC). The dark colour was started to change when exposed to temperature of
300oC. From this observation, it could benefits in the preliminary assessment of damage
caused by fire hazards. Due to this, the intensity of fire can be figure out.
Another observation on POFA concrete has been made by Awal and Shehu (2014). For
this research high volume of POFA has been used. It was noticed that, the colour of POFA
concrete was change from black to light black at 400oC. As the temperature increase, the
colour keeps changing to light grey and eventually became brownish grey at 800oC. Based on
the observation, they have concluded that, the change in colour could be linked to the chemical
transformation during heating process. Due to high content of Fe2O3 in POFA, this iron oxide
has oxidized when subjected to temperature greater than 250oC. Thus this process has
contributed in colour changes.
Similar observation was identified by Ranjbar et al. (2014) where the colour of POFA
was darker or black before exposed to high temperature. As the POFA content increased,
darker colour was observed. In addition, it also shows that, colour of POFA concrete turned
lighter when subjected to high temperature. The effect of elevated temperature towards
discolouration of concrete is shown in Figure 4.
Figure 4. Effect of temperature on discolouration of concrete (Ranjbar et al., 2014)

MCRJ Special Issue Vol. 4 | No. 2 | 2018 52
For concrete with fly ash as the cement replacement, it was found that, the colour of
concrete did not show any changes up to 200oC. The change in colour started to change at
400oC, where straw yellow was appeared on the surface. Meanwhile, at 800oC the colour
turned to off white (Ismail et al., 2010). The findings of this research was similar to earlier
research conducted by Li et al. (2004) where the stray yellow and off white were appeared on
concrete at 400oC and 800oC respectively.
Parallel to observation by Saridemir et al. (2016), where discolouration of concrete was
observed when specimens were exposed to elevated temperature. The specimens become
lighter as the temperature higher. This is research, normal concrete and pozzolanic concrete
show changes in colour when exposed to temperature 500oC and 750oC. The discolouration
was due to the oxidized zones in the matrix.
CONCLUSION
This paper has reviewed several previous researches on concrete masonry containing
pozzolanic materials at elevated temperature. Among parameters that have been focused are
residual compressive strength and physical properties of concrete after subjected to elevated
temperature. Following are conclusions that could be made based on the review.
Industrial waste has good potential as cement replacement due to their pozzolanic
characteristic which could act as the binder in concrete. Therefore this could minimise the
consumption of cement in production of concrete. It was found that, pozzolanic materials
could improve the residual compressive strength of concrete when subjected to high
temperature. However, it also shows that majority of pozzolanic concrete loss the strength
when subjected to temperature greater than 500oC due to the disintegration of C-S-H gel.
Fly ash has been identified as one of the best pozzolanic materials that could improve fire
resistance performance of concrete or increase the residual compressive strength at elevated
temperature due to the formation of tobermorite. As the percentage of fly ash increased, the
residual compressive strength increased. Meanwhile, silica fume was found to contribute in
reduction of residual compressive strength of concrete due to its dense structure that could
cause splitting of concrete at high temperature.
Pozzolanic also could reduce the formation of cracks on concrete surface. There were no
major cracks were observed on pozzolanic concrete. Discolouration of concrete was observed
when concrete were exposed to higher temperature. Pozzolanic concrete has darker colour
than OPC concrete. It can be seen that, dark colour of pozzolanic concrete turned to lighter
colour as the temperature was increased.
ACKNOWLEGDEMENT
The authors gratefully to acknowledge the Universiti Tun Hussien Onn Malaysia for
providing the financial support through the Fundamental Research Grant Scheme (FRGS) Vot
No 1576 and also this paper was partly sponsored by the Centre for Graduate Studies UTHM.
MCRJ Special Issue Vol. 4 | No. 2 | 2018 53
REFERENCES
Abdulkareem, O. A., Al Bakri, A. M., Kamarudin, H., Nizar, I. K. and Ala’eddin, A. S. (2014)
Effects of Elevated Temperatures on The Thermal Behavior And Mechanical
Performance Of Fly Ash Geopolymer Paste, Mortar And Lightweight Concrete.
Construction and building materials, 50:377-387
Ahn, Y. B., Jang, J. G. and Lee, H. K. (2016) Mechanical Properties of Lightweight Concrete
Made With Coal Ashes After Exposure To Elevated Temperatures. Cement and Concrete
Composites, 72:27-38
Akçaözoğlu, K. (2013) Microstructural Examination of Concrete Exposed To Elevated
Temperature By Using Plane Polarized Transmitted Light Method. Construction and
Building Materials, 48:772-779.
Alwan, Z., Jones, P. and Holgate, P. (2017) Strategic Sustainable Development in The UK
Construction Industry, Through The Framework For Strategic Sustainable Development,
Using Building Information Modelling. Journal of Cleaner Production, 140:349-358.
Arenas, C. G., Marrero, M., Leiva, C., Solís-Guzmán, J. And Arenas, L. F. V. (2011) High
Fire Resistance In Blocks Containing Coal Combustion Fly Ashes And Bottom
Ash. Waste management, 31(8):1783-1789.
Awal, A. A. And Hussin, M. W. (2011) Effect of Palm Oil Fuel Ash In Controlling Heat of
Hydration of Concrete. Procedia Engineering, 14:2650-2657.
Awal, A. A. and Shehu, I. A. (2015) Performance Evaluation of Concrete Containing High
Volume Palm Oil Fuel Ash Exposed To Elevated Temperature. Construction and
Building Materials, 76:214-220.
Aydın, S. and Baradan, B. (2007) Effect of Pumice and Fly Ash Incorporation on High
Temperature Resistance of Cement Based Mortars. Cement and Concrete Research,
37(6):988-995.
Babu, K. G. And Babu, D.S. (2003) Behaviour of Lightweight Expanded Polystyrene
Concrete Containing Silica Fume. Cement Concrete Researh, 33:755–62.
Babu, K. G. and Babu, D. S. (2004) Performance of Fly Ash Concrete Containing Lightweight
EPS aggregates. Cem Concr Compos, 26:605-11.
Babu, D. S., Babu, K. G. And Wee, T. H. (2005) Properties of Lightweight Expanded
Polystyrene Aggregate Concretes Containing Fly ash. Cement Concrete Research,
35:1218–23.
Babu, D. S., Babu, K. G. and Wee, T. H. (2006) Effect of Polystyrene Aggregate Size on The
Strength and Moisture Migration Characteristics of Lightweight Concrete. Cement and
Concrete Composites, 28(6):520-527.
Brizga, J., Mishchuk, Z. and Golubovska-Onisimova, A. (2014) Sustainable Consumption
and Production Governance In Countries In Transition. Journal of Cleaner Production,
63:45-53.
Chen, B., Liu, J. and Chen, L. (2010) Experimental Study of Lightweight Expanded
Polystyrene Aggregates Concrete Containing Silica Fume and Polypropylene. Journal of
Shanghai Jiaotong University (Science), 15:129-13.
Hossain, K. M. A. (2006) High Strength Blended Cement Concrete Incorporating Volcanic
Ash: Performance At High Temperatures. Cement and Concrete Composites, 28(6): 535-
545.
Ismail, M., Ismail, M. E., & Muhammad, B. (2011) Influence of Elevated Temperatures on
Physical and Compressive Strength Properties of Concrete Containing Palm Oil Fuel Ash.
Construction and Building Materials, 25(5):2358-2364.

MCRJ Special Issue Vol. 4 | No. 2 | 2018 54
Ismail, I., Jamaluddin, N., and Shahidan, S. “A Review on Performance of Waste Materials
in Self Compacting Concrete (SCC),” J. Teknol., vol. 5, no. 78, pp. 29–35, 2016.
Islam, M. M. U., Mo, K. H., Alengaram, U. J., & Jumaat, M. Z. (2016) Durability Properties
of Sustainable Concrete Containing High Volume Palm Oil Waste Materials. Journal of
Cleaner Production, 137:167-177.
Katkhuda, H., Hanayneh, B. and Shatarat, N. (2009) Influence of Silica Fume on High
Strength Lightweight Concrete. Engineering and Technology International Journal of
Civil and Environmental Engineering, 3(10):407-414.
Khalid, F.S., Azmi, N.B., Sumandi, K.A.S.M., and Mazenan, P.N. (2017) Mechanical
properties of concrete containing recycled concrete aggregate (RCA) andceramic waste
as coarse aggregate replacement. AIP Conference Proceedings, 1891(020079):1-5.
Kroehong, W., Sinsiri, T., Jaturapitakkul, C. and Chindaprasirt, P. (2011) Effect of Palm Oil
Fuel Ash Fineness on The Microstructure of Blended Cement Paste. Construction and
Building Materials, 25(11):4095-4104.
Li, M., Qian, C. and Sun, W. (2004) Mechanical Properties of High-Strength Concrete After
Fire. Cement and concrete research, 34(6):1001-1005.
Lim, S. K., Tan, C. S., Lim, O. Y. and Lee, Y. L. (2013) Fresh and Hardened Properties of
Lightweight Foamed Concrete with Palm Oil Fuel Ash as Filler. Construction and
Building Materials, 46:39-47.
Peng, G. F., Bian, S. H., Guo, Z. Q., Zhao, J., Peng, X. L. and Jiang, Y. C. (2008) Effect of
Thermal Shock Due to Rapid Cooling on Residual Mechanical Properties of Fiber
Concrete Exposed to High Temperatures. Construction and Building Materials, 22(5):
948-955.
Phan, L. T. (1996) Fire performance of high-strength concrete: A report of the state-of-the
art. US Department of Commerce, Technology Administration, National Institute of
Standards and Technology, Office of Applied Economics, Building and Fire Research
Laboratory.
Poon, C. S., Azhar, S., Anson, M. and Wong, Y. L. (2001) Comparison of The Strength and
Durability Performance of Normal-And High-Strength Pozzolanic Concretes at Elevated
Temperatures. Cement and concrete research, 31(9):1291-1300.
Rahman, M. E., Boon, A. L., Muntohar, A. S., Tanim, M. N. H. and Pakrashi, V. (2014)
Performance of Masonry Blocks Incorporating Palm Oil Fuel Ash. Journal of Cleaner
Production, 78:195-201.
Ramzi, N. I. R., Shahidan, S., Maarof, M. Z., and Ali, N. (2016) Physical and Chemical
Properties of Coal Bottom Ash (CBA) from Tanjung Bin Power Plant,” IOP Conference
Series: Materials Science and Engineering, 2016, 160(1).
Ranjbar, N., Mehrali, M., Alengaram, U. J., Metselaar, H. S. C. and Jumaat, M. Z. (2014)
Compressive Strength and Microstructural Analysis of Fly Ash/Palm Oil Fuel Ash Based
Geopolymer Mortar Under Elevated Temperatures. Construction and building materials,
65:114-121.
Rehan, R. and Nehdi, M. (2005) Carbon Dioxide Emissions and Climate Change: Policy
Implications for The Cement Industry. Environmental Science & Policy, 8(2):105-114.
Saridemir, M., Severcan, M. H., Ciflikli, M., Celikten, S., Ozcan, F. and Atis, C. D. (2016)
The Influence of Elevated Temperature on Strength and Microstructure of High Strength
Concrete Containing Ground Pumice and Metakaolin. Construction and Building
Materials, 124:244-257.

MCRJ Special Issue Vol. 4 | No. 2 | 2018 55
Shahidan, S., Bunnori, N. M., Nor, N. M., and Basri, S. R. (2011) Health Index Evaluation on
Acoustic Emission Signal for Concrete Structure by Intensity Analysis Method, Adv.
Mater. Res. 403–408, 3729–3733.
Shahidan, S., Mohd Zuki, S. S., Rahim, M. A., and Ali, N. (2016) Amplitude Distribution of
Emission Wave for Cracking Process, MATEC Web Conference, 47, 2–8.
Tanyildizi, H. and Coskun, A. (2008) The effect of High Temperature on Compressive
Strength and Splitting Tensile Strength of Structural Lightweight Concrete Containing
Fly Ash. Construction and Building Materials, 22(11):2269-2275.
Xu, Y., Wong, Y. L., Poon, C. S. and Anson, M. (2001) Impact of High Temperature on PFA
Concrete. Cement and Concrete Research, 31(7):1065-1073.

THEME 2:
MATERIAL

MCRJ Special Issue Vol. 4 | No. 2 | 2018 57
SAND CEMENT BRICK CONTAINING COMPOSITE OF RCA AND PET AS SAND AGGREGATE REPLACEMENT Faisal Sheikh Khalid1, Nurul Bazilah Azmi1, Sallehudin Shah Ayop1, Puteri Natasya Mazenan1, Nickholas Anting Anak Guntur1,Shahiron Shahidan1, Alvin John Lim Meng Siang2 1Jamilus Research Center, Faculty of Civil and Environmental Engineering, Universiti Tun Hussein Onn Malaysia, 86400 Parit Raja, Batu Pahat, Johor, Malaysia 2Department of Infrastructure & Geomatic Engineering, Faculty of Civil and Environmental Engineering, Universiti Tun Hussein Onn Malaysia, 86400 Parit Raja, Batu Pahat, Johor, Malaysia
Abstract Brick has become one of the most important materials in the construction industry, which it is used for outer and inner walls of the buildings. As human population increases, the growth of the construction industry also increases to fulfil their living needs and it leads to the depletion of natural resources, environmental degradation and energy consumption. These problems pressure the industries to develop products and materials that are more environmental friendly as a solution. The aim of this study is to establish sustainable material properties for sand cement composite brick containing recycles concrete aggregate (RCA) and polyethylene terephthalate (PET). This study replaces the fine aggregates with 25%, 50% and 75% of recycled concrete aggregate (RCA) and 0.5%, 1.0% and 1.5% of waste PET in the production of brick. The best compressive strength was recorded at 24.9 MPa for brick contains 75% RCA and 0.5% PET. Meanwhile, an increment of RCA contents in brick increased the water absorption and initial rate of suction (IRS) percentages compared to a normal brick. The best mix ratio was the mix design of brick of replacement of 25% RCA and 1.5% PET. In a conclusion, the use of RCA and PET in the production of sand cement composite brick has provided better strength with tolerable results on water absorption and initial rate of suction compared to normal bricks. Keywords: Mortar brick, Concrete block, Concrete aggregate, Plastic fiber
INTRODUCTION
The consumption of natural resources such as sand in brick production resulted in
resource depletion, energy consumption and environmental degradation (Shakir et al., 2013;
Sheikh Khalid et al., 2017; Zamir et al., 2017; Azmi et al., 2017). Currently, an increasing
interest in environmental issues is pressuring industries to develop products and materials that
are more environmentally friendly (Mazenan et al., 2017). Therefore, various attempts were
made to use waste material in brick production. The use of waste polyethylene terephthalate
(PET) and recycled concrete aggregates (RCA) from demolition wastes as a replacement of
fine aggregates in the production of sand cement composite brick has been considered as one
of the most sustainable materials to be added in the brick production (Shahidan et al., 2018).
Therefore, the combination of both materials will promote new sand cement brick market
opportunities, which are also favourable to the environment.
There are several researchers have studied the utilization of RCA wastes in concrete.
According to Mirjana et al. (2010), a test was carried out on recycled aggregate concrete. For
concrete age of 28 days, the authors claimed that the highest value of 100% RCA with water-
cement ratio 0.5 was 45.66 MPa. According to Kou et al. (2012), a test was carried out to
determine the properties of concrete with low strength of grade recycled aggregates. The
results showed that the compressive strength of the concrete containing with low grade

MCRJ Special Issue Vol. 4 | No. 2 | 2018 58
recycled aggregate were lower than that of the natural aggregate. This may be attributed to
high water absorption of low-grade recycled aggregate incorporating with concrete.
Neno et al. (2014) investigated the performance of mortars by replacing natural sand with
fine recycled concrete aggregates. The authors stated that the strength of mortar contains fine
recycled concrete aggregate was higher than control. These results may be caused by some
factors such as the sharp in its edge particles, more porous than sand and concrete particles
have high specific surface. Therefore, the bond with the cement paste of the mix is better
(Neno et al., 2014; Senin et al., 2016). Furthermore, RCA have greater cohesion between
particles and strength due to non-hydrated cement as RCA will complete its hydraulic
reactions and set when in contact with water during mixing.
Based on Ismail and Yaacob (2010), this research aims to discover the potential of
recycled fine aggregate produced from demolition waste as a substitute for natural sand in
brick. The result from the test concluded that the replacement of natural sand at levels of 50%
and 75% by fine recycled aggregates showed good effects on compressive strength. However,
the result is slightly lower in flexural strength as the volume of recycled aggregate exceeds
50% which is due to the high proportion of coarse aggregate in recycled aggregate that make
the bricks more porous. Faisal et al. (2017) conducted an experiment by replacing natural sand
aggregate with recycled concrete aggregate by weight for 55%, 65%, and 75% of production
the sand cement brick. The brick with replacement by recycled concrete aggregate at 55%
replacement provided the highest compressive and flexural strength as compared to other
percentage replacements and control specimens. The authors claimed that, for replacement
more than 55%, the strength of the brick was decreased for compressive and flexural strength,
respectively.
For the experimental tests of concrete by Kou et al. (2012), the difference of RCA volume
in size of less than 50mm was used as a replacement of natural aggregate. It showed that, the
compressive strength of the concrete with 100% of RCA is 35.7% at 28 days which was lower
than the natural aggregate concrete. However, the splitting tensile strengths of concrete made
with 20% and 50% RCA were higher than natural aggregate. On the other hand, PET is a
popular package for food and non-package products that commonly used to package soft
drinks, water, juice, peanut butter, frozen foods and many other products (Leman et al., 2016;
Saika and de Brito, 2012). Plastics consumption nowadays has become an integral part of our
life. However, it is reported a world’s annual consumption of PET drinks covers of
approximately 10 million tons, which represents approximately 250 million bottles (Frigione
et al., 2010; Irwan et al., 2013).
Therefore, some efforts have been made to explore the potential of waste in concrete
besides it gives benefits to the environment. Different studies have been done on the usage of
PET of different tensile strength, volume of fiber and water/cement ratios (Irwan et al., 2013;
Khalid et al. 2017). Batayneh et al. (2007) studied with the ground plastics and glass to replace
up to 20% of sand aggregates in concrete mixes. The author revealed that the ground plastics
and glass waste materials could be reused successfully as partial substitutes for the sand or
coarse aggregates in concrete mixtures. Albano et al. (2009) analysed the influence of content
and particle size of waste PET bottles on the concrete behaviour at different water-cement
ratio. Similar findings were found where the increased volume proportion and particle size of
PET waste decrease the compressive strength, splitting tensile strength and modulus of

MCRJ Special Issue Vol. 4 | No. 2 | 2018 59
elasticity of the concrete composite. The results signified the inclusion that PET reduce the
structure strength and stiffness which give a promising feature where high strength is not
necessary (Irwan et al., 2013).
The use of waste PET particles as the partial substitution of an equivalent 5% weight of
natural sand in concrete was also investigated by Frigione (2010). The substitution however
limited only to the fine aggregate fraction by 5% weight for particles in the fraction of 0.1 to
5mm which possessed similar grading curve to that substituted natural sand. Ramadevi and
Manju (2012), also worked on the research of PET fiber as fine aggregate in concrete and
result got revealed that an increase in compression and tensile strength. In the analysis of tests
done, the compressive strength started to increase and it is been observed till 2% replacement
of fine aggregate by PET bottle fibers and then the compressive strength gradually decreases.
An experimental of addition of irregular PET fibre at 1% and 1.5% of volume fraction
decrease the strength at about 5 to 6.4%, whereas 0.5% volume fraction IPET fibre exhibited
an increment in concrete strength at 0.5%. (Irwan et al., 2014). The authors claimed that high
content PET fibre increase the possibility of fibre balling during mixing and casting.
Akçaözog˘lu et al. (2010) researched on the utilization of shredded waste PET bottle granules
as a lightweight aggregate in the mortar. The authors reported that the compressive strength
of the mixtures containing both sand and PET were higher than the mixtures containing PET
without sand. However, porosity ratio of mixtures containing PET and sand aggregate
together were higher than mixtures containing only PET. It also refers that the use of PET
results in an increase in the shrinkage. Oliveira et al. (2011), carried out research on recycled
PET fiber reinforced mortar, following the experiments of adding fraction of PET bottle in
dry mix mortar about 0%, 0.5%, 1.0% and 1.5%. The authors found that it was significantly
improving the flexural strength of mortars with a major improvement in mortar toughness.
The maximum volume of PET fiber for a desired workability was 1.5%, which is the best
performance of the mortar.
Reis et al. (2011) also reported there was a significant improvement in post-peak flexural
behaviour of mortars using PET waste from beverage containers as partial replacement (by
weight fractions of sand 5%, 10%, 15% and 20%) of sand in mortar. It is also observed that
addition of shredded PET waste decreased the dry density of polymer mortars, fracture
mechanics were altered by shredded PET and materials appeared to be more ductile. In this
study, a series of physical, strength and durability tests were performed to determine the
performance of brick containing RCA and PET as sand replacement materials. The specific
gravity, density, compressive, water absorption and initial rate of suction (IRS) test have been
conducted to determine the best mix proportion of RCA and PET contains.
EXPERIMENTAL
The experimental works are the sequence of operations that has been used for the study
to be completed. This study investigated in terms of physical and mechanical through specific
gravity, density, compressive, water absorption and initial rate of suction (IRS) tests.
Materials used
RCA was produced from the crushing of concrete cubes with a strength class of G30.
RCA was sieved with a maximum size of 5mm after crushing it by a crushing machine. Waste

MCRJ Special Issue Vol. 4 | No. 2 | 2018 60
PET obtained from the PET plastics. The process started by collecting the mineral water
bottles. Then, these bottles were processed in a granulator machine to obtain the standard size
of fine aggregate. The irregular shape waste PET was sieve approximately or less than 5mm
which made it is physically similar to size of fine aggregates. Figure 1 shows the irregular
shape waste. Ordinary Portland Cement (OPC) was used in this study. Natural white sand was
used as fine aggregates and this sand has passed the size sieve of 5mm.
Figure 1. The irregular shape waste PET
Mix proportions
The ratio of 1:3 was used as mix ratio of cement tosand which is in accordance to BS EN
998-2. The ratio was the most suitable mix proportion for mortar and it is stronger than it was
necessary for most uses (Oliveira et al., 2011). The sand cement composite brick was designed
according to the standard in order to exceed the require strength which is 7 MPa (MS
76:1972). The design mix was prepared according to BS 5628-3 design method. The optimum
design mix used to produce sand cement composite brick with 25%, 50% and 75% of RCA
and 0.5%, 1.0%, and 1.5% of PET waste as fine aggregate replacement. The details of mix
proportion are given in Table 1.
Table 1. Mix proportion of sand cement composite brick
Mix Designation
Cement
(kg)
Sand (kg)
RCA (%)
RCA (kg)
PET (%)
PET (kg)
w/c Water
(kg)
Normal
0.463
1.613 0 0 0 0 0.6
0.278
RCA 25-PET 0.5 1.201 25
0.354
0.5 0.0017
0.6 RCA 25-PET 1.0 1.193 25 1.0 0.0035
RCA 25-PET 1.5 1.185 25 1.5 0.0052
RCA 50-PET 0.5 0.798 50
0.709
0.5 0.0017
0.6 RCA 50-PET 1.0 0.790 50 1.0 0.0035
RCA 50-PET 1.5 0.782 50 1.5 0.0052
RCA 75-PET 0.5 0.395 75
1.063
0.5 0.0017
0.6 RCA 75-PET 1.0 0.387 75 1.0 0.0035
RCA 75-PET 1.5 0.379 75 1.5 0.0052
The brick moulds were formed according to the scale from MS 76: 1972 and BS 3921:
1985 which stated 215mm length x 103mm width x 65mm height for 1 unit of normal brick
as illustrated in Figure 2. The curing process was to produce better sand cement composite
brick consist of RCA and PET waste and also to prevent the brick from hydrating. In this

MCRJ Special Issue Vol. 4 | No. 2 | 2018 61
study, the method of curing was aired curing process as shown in Figure 3. This process was
conducted to allow the bricks cure under atmospheric temperature. The duration of the curing
process in this study was 7 and 28 days.
Specific gravity test
Specific gravity test is the ratio of the weight of the unit volume of aggregate to the weight
of an equal volume of distilled water at a stated temperature. The test was conducted on the
RCA, PET and fine aggregate to determine its characteristics. A specific gravity test was
conducted according to ASTM C128.
Compressive strength test
Compressive strength of the specimens was conducted in accordance to BS 6073-1:1981
and the test procedure was carried out using the compression testing machine. Three
specimens of bricks were tested for each test. Control bricks and the brick containing recycled
concrete aggregate and PET were tested for the compressive strength at the age of 7 and 28
days. The collapse load was recorded, which is the strength of the sample and the average
compressive strength of the three specimens were recorded.
Water absorption test
Water absorption test was carried out to measure the ability of brick to allow water to pass
through it. The standard used in this study follows the BS 3921:1985. Water absorption in
percentage by mass after 24 hours immersed in clean water at temperature of 27±2oC (Figure
4) can be calculated using following Equation 1.
Figure 4. Water absorption test
Figure 3. Air curing Figure 2. Size of unit sample

MCRJ Special Issue Vol. 4 | No. 2 | 2018 62
𝑊 =𝑀2−𝑀1
𝑀1 (1)
where:
W = Water absorption in %
M1= weight of dry brick (g)
M2= weight of wet brick (g)
Initial rate of suction (IRS)
IRS test was conducted by measuring the constant mass brick to heating at 105oC for not
less than 48 hours (BS 3921). Then, brick was removed from the oven and cooled at room
temperature. The brick was weighed and dry mass m1 was recorded. After that, 2 steel bars or
rod were placed at the bottom of the container approximately 100mm apart to form a platform
for the brick. The water level inside the container should be about 4mm. The pre-weighted
brick were placed on the bar and the water level was observed closely using measuring gauge
to ensure the depth of immersion was maintained at 3±1mm through 1 minute as shown in
Figure 5. IRS kg/m2 can be calculated using the following Equation 2.
Figure 5. Initial rate of suction test
𝐼𝑛𝑖𝑡𝑖𝑎𝑙 𝑅𝑎𝑡𝑒 𝑜𝑓 𝑆𝑢𝑐𝑡𝑖𝑜𝑛 (𝐼𝑅𝑆) = 1000 (𝑀2−𝑀1)
𝐴 (2)
where:
M1= weight of dry brick (g)
M2= weight of wet brick (g)
A= net area of contact surface of brick with water (mm2)
RESULT AND DISCUSSION
The overall results of material testing of composite brick from the experimental works
are presented, analysed and discussed in detail in this section. The material testing of bricks
are focused on its physical and mechanical properties which are the specific gravity of
materials, density of brick, compressive strength, water absorption and initial rate of suction
(IRS) tests.
Plate
Water
Brick

MCRJ Special Issue Vol. 4 | No. 2 | 2018 63
Specific gravity
Referring to Table 2, it shows that the specific gravity for PET was lower as compared to
RCA and fine aggregate. The specific gravity of fine aggregate was 2.30 while for RCA and
PET were 2.22 and 1.09 respectively. The lower value of specific gravity of PET shows that
PET was lighter than that of natural fine aggregates and recycled concrete aggregate. From
the Table 2, it also indicated that the water absorption materials for recycled concrete
aggregate was higher than PET and fine aggregate. Similar findings on the performance of
recycled aggregate concrete by Shi et al. (2015), the authors founded the water absorption for
RCA was higher than natural fine aggregate. This was due to the large quantity of hydrated
cement paste in the demolished concrete and the migration of water absorbed by the aggregate
to the paste around particles of aggregates, which influence the volume of water and pores in
the paste.
Table 2. Specific gravity and absorption of FA, RCA and PET
Material Weight of aggregate (g) Water absorption
𝑨−𝑩
𝑩 𝑿 𝟏𝟎𝟎 (%)
Average (%)
Specific gravity
SSD (A) Oven Dried (B)
Fine Aggregate
1 500 490 2.04 2.15 2.30
2 500 489 2.25
RCA 1 500 485 3.09
3.20 2.22 2 500 484 3.31
PET 1 500 495 1.01
1.05 1.09 2 500 496 0.81
Bricks density
The density of brick specimens was calculated by dividing the weight with the volume.
Density was calculated to determine the density of hardened composite bricks after 7 and 28
days. The results for all densities of the samples are shown in Table 3.
Table 3. Density data for bricks specimen
No. of Batch
RCA (%)
PET (%)
Weight (kg) Volume
(m3)
Density (kg/m3)
7 Days 28 Days 7 Days 28 Days
1 0 0 2.91 2.88
0.0014
2078.57 2057.14
2
25
0.5 2.88 2.83 2057.14 2021.43
3 1.0 2.83 2.83 2021.43 2028.57
4 1.5 2.86 2.86 2135.71 2085.71
5
50
0.5 2.96 2.92 2150.00 2064.29
6 1.0 2.95 2.94 2085.71 2100.00
7 1.5 2.92 2.88 2107.14 2064.29
8
75
0.5 2.99 2.92 2114.29 2042.86
9 1.0 2.93 2.90 2078.57 2071.43
10 1.5 2.93 2.86 2078.57 2042.86

MCRJ Special Issue Vol. 4 | No. 2 | 2018 64
From Table 3, it shows that a few samples reduced their weight at 28 days. For normal
bricks, the weight differences are about 0.03kg between 7 days and 28 days. For RCA 25%,
the reduction of weight can be seen when the PET volumes is 0.5% and 1.5%. While, the
weight of 1.0% of PET increased about 0.01kg. The huge reduction of weight happened for
the mixture of RCA 50% with PET 0.5% and PET 1.5%. For RCA 75%, the weight slightly
reduced for 0.5%, 1.0% and 1.5% of PET. Each dimension of bricks were calculated and the
average volume obtained is 0.0014m3. Thereafter, the densities were calculated using the
recorded weight for each specimen.
The value of densities is shown graphically in Figure 6. It shows that the density of normal
bricks was 2078.57kg/m3 for 7 days and 2057.14kg/m3 for 28 days. The lowest reduction of
density was the brick content with 25% of RCA and 1.5% of PET slightly reduced by 1.7%
for 7 days and 2.1% for 28 days compared to a normal brick. Meanwhile, the mix designation
brick of 75 % RCA and 0.5% PET indicates an increment of 2.9% (7 days) and 2.1% (28
days) compared to a normal brick. Figure 7 shows that increasing the PET contents as sand
materials replacement reduced the density of brick. The brick contents 1.5%PET presented
the lowest density among the mix designation of brick. The high volume of RCA with lower
content of PET presents higher density compared to normal brick as shown in Figure 7.
However, mix design content high volume of RCA and PET presents significant results to
reduce the density of brick compared to normal brick.
Figure 6. Density of Composite Bricks for 7 and 28 Days
Figure 7. Density of Composite Bricks according to RCA content at 28 Days
1900.00
1950.00
2000.00
2050.00
2100.00
2150.00
2200.00
Normal RCA 25-PET 0.5
RCA 25-PET 1.0
RCA 25-PET 1.5
RCA 50-PET 0.5
RCA 50-PET 1.0
RCA 50-PET 1.5
RCA 75-PET 0.5
RCA 75-PET 1.0
RCA 75-PET 1.5
Den
sity
(kg
/m3)
7 days 28 days
1960
1980
2000
2020
2040
2060
2080
2100
2120
Normal O.5% PET 1.0% PET 1.5% PET
Den
sity
(kg
/m3 )
25% RCA 50% RCA 75% RCA

MCRJ Special Issue Vol. 4 | No. 2 | 2018 65
According to Oliviera et al. (2011), density and moisture content are not significantly
altered by incorporation of PET fibers in volume or size. The hardened mortar density results
showed that the addition of fibers causes a small decrease in density. These means that
partially substituting sand with PET and RCA may produce lighter bricks. However, the
volume content of RCA incorporating in concrete needs to be determined (Lim, 2009).
Compressive strength
Compressive strength of bricks was tested at age 7 and 28 days. The investigation was
done on the twelve (12) types of brick samples which contain 25%, 50% and 75% RCA with
an addition of 0.5%, 1.0% and 1.5% of PET. Consequently, similar findings also agreeable.
The average compressive strength for each percentage of the waste in the bricks is tabulated
in Table 4.
Table 4. Compressive strength of brick specimens
RCA (%)
PET (%)
Compressive Strength (MPa)
7 Days 28 Days
Strength Avg. Standard Deviation
Strength Avg. Standard Deviation
0 0
13.9
13.10 2.16
15.4
14.10 1.30 14.8 12.8
10.7 14.1
25
0.5
7.8
7.17 1.54
10.9
8.70 1.89 8.3 7.9
5.4 7.4
1.0
21.0
17.53 3.08
19.5
19.30 0.82 16.3 20.0
15.3 18.4
1.5
21.3
23.50 2.62
19.8
24.20 3.47 22.8 25.6
26.4 26.0
50
0.5
21.0
20.60 0.85
24.6
22.20 3.76 21.3 17.9
19.7 24.2
1.0
21.1
20.20 1.50
21.9
22.20 0.61 18.5 21.8
21.1 22.9
1.5
21.8
21.60 0.32
22.1
22.20 1.25 21.2 21.0
21.7 23.5
75
0.5
22.8
22.20 0.55
22.0
24.90 2.57 21.9 25.5
21.8 27.0
1.0
19.8
19.60 2.71
21.7
23.70 1.73 16.8 24.6
22.2 24.8
1.5
19.3
19.50 0.67
23.9
23.60 1.87 20.2 25.3
18.9 21.6
From Table 4, a standard deviation was calculated to indicate the improvement of strength
for the composite brick matrix. Also, it clearly can be seen that the value of strength started
to decrease as the ratio of RCA and PET as sand replacement increased at 7 days of curing
age. But, the strength of composite brick on 28 days shows that the strength starts to increase
as the replacement of waste is increasing. For a better understanding, the result is shown
graphically in Figure 8.

MCRJ Special Issue Vol. 4 | No. 2 | 2018 66
Figure 8. Compressive strength for 7 and 28 days
From Figure 8, all the samples achieved the strength more than the minimum strength for
both 7 and 28 days in BS 6073-1:1981 which stated that the compressive strength of bricks
should not be less than 7 N/mm². It obviously shows that some samples for both curing age
achieved high strength from the normal brick. The sample with RCA 25% with PET 1.5%
exhibit the second highest strength whereas RCA 25% with PET 0.5% achieve only 7.17 MPa
which has lower strength rather than a normal brick. Nevertheless, the specimen with RCA of
25%, it shows the strength increased in line with the increment of PET volume for 0.5%, 1.0%
and 1.5%. However, the strength for both curing age started to decrease for bricks containing
50% and the increasing volume of 0.5% and 1.0% of PET also reduced the strength of the
composite brick. In contrast, the drastically reduced of strength was shown above similarly
be drawn in the studies conducted by Poon et al. (2002) which conducted a study on RCA and
reported that the replacement levels of 25% and 50% in bricks and blocks had little effect on
the compressive strength of specimen. However, the authors mentioned that high level of
replacements of these materials reduced the compressive strength significantly.
The increasing pattern of compressive strength is seen in samples containing RCA 75%
for both curing ages of 7 and 28 days. The addition of 0.5% PET and 75% of RCA gave the
highest strength among the other samples. The reduction of strength was shown when the
volume of PET increased from 1.0% to 1.5% for RCA 75%. In addition, the highest
percentages of increment strength for 7 days and 28 days among other samples were 17.30%
and 17.37% respectively for 75% of RCA with a volume of PET for 1.0% and 1.5%. The
overall result showed instability in compressive strength of bricks when RCA and PET were
added. Similar studies have also been conducted by Ismail & Yaacob (2010) that the addition
of recycled fine aggregate can successfully increase the compressive strength of bricks. Even
with 100% of natural sand was replaced with recycled fine aggregate, the obtained results
showed similar strength to bricks with natural sand. Dina et al. (2012) studied the compressive
strength of solid cement bricks containing crushed brick aggregates where the results
indicated that the strength gradually decreased by increasing the content of crushed bricks.
The reduction of strength using recycled concrete as a substitution to the natural sand can be
explained by the parameters of water-cement ratio, water absorption of RCA and ratio of
replacement (Sheikh Khalid et al., 2017). Moreover, the results show in Figure 8 revealed that
0
5
10
15
20
25
30
No
rmal
PET
0.5
%
PET
1.0
%
PET
1.5
%
PET
0.5
%
PET
1.0
%
PET
1.5
%
PET
0.5
%
PET
1.0
%
PET
1.5
%
RCA 25% RCA50% RCA75%
Co
mp
ress
ive
Str
eng
th,
MP
a7 Days 28 Days

MCRJ Special Issue Vol. 4 | No. 2 | 2018 67
only a certain amount of PET fiber increased the strength with an addition of RCA of 25%,
50% and 75%. The trend of this study having the same pattern with the studied conducted by
Irwan et al. (2013) which stated the good bonding between aggregate and binder as increase
in PET content may result a decreasing in the strength of materials. The study also agreed
with the conclusion made by Ismail et al. (2008) where the decreased trends attributed to the
decrease in adhesive strength between the surface of the plastic waste and the cement paste.
Figure 9 illustrates the relative compressive strength of all types of samples for both
curing age. The relative compressive strength, defined as the ratio of the compressive strength
of the composite brick containing RCA and PET as sand replacement to that of the
conventional sand cement brick. From Figure 9, percentage of average compressive strength
for increment is in the range of 33% to 80% for 7 days and 36% to 77%. However, there is a
reduction of ratio for samples with 25% RCA and 0.5% PET from a normal brick for both
curing age.
Figure 9. Relative percentage of compressive strength compared to normal brick
The highest percentage difference from normal brick was the RCA 25% with 1.5% PET
of 79.39% at curing age of 7 days. The relative compressive strength for RCA 25% with PET
0.5% showed a reduction from normal a normal brick where the normal brick achieved a
higher strength rather than the specimen. Based from the overall results obtained, the
replacement of RCA and PET showed higher relative percentages of compressive strength
compared to a normal brick similarly to that of Ismail & Yaacob (2010) which exhibited about
70% difference of brick containing waste of RCA with normal brick.
Water absorption
Figure 10 shows the evolution of water absorption from 7 to 28 days for all mixtures. The
results illustrated that the water absorption increased with the replacement percentage of fine
aggregate by the RCA and PET wastes for all mixtures. The results indicated that the sample
with brick contents of RCA25% was less permeable when compared to brick containing 50%
and 75% of RCA. The highest water absorption coefficients were obtained in sand cement
composite brick with RCA75%PET1.5%. Samples with 75% of RCA absorbed more water
than the samples containing 50% and 25% of RCA. This finding was in agreement with
previous studies conducted by Bravo et al. (2015) and Oliveira et al. (2011) where the addition
-60-40-20
020406080
100
No
rmal
PET
0.5
%
PET
1.0
%
PET
1.5
%
PET
0.5
%
PET
1.0
%
PET
1.5
%
PET
0.5
%
PET
1.0
%
PET
1.5
%
RCA 25% RCA50% RCA75%
Re
lati
ve C
om
pre
ssiv
e S
tre
ngt
h,
% 7 Days
28 Days

MCRJ Special Issue Vol. 4 | No. 2 | 2018 68
of RCA in mixtures increased the percentage of water absorption. The increased in water
absorption was due to the increment in the porosity of the bricks containing RCA and PET
and the poor bonding between cement paste and polymer pellets. The presence of cracks in
the bricks also contributed to the increment in water absorption. It can be summarized that the
water absorption of sand cement composite bricks with recycled fine aggregate and PET
significantly affects the increased water absorption characteristic of bricks. From the results,
only bricks with 25% RCA and 1.5% PET showed less permeable compared to control brick.
Thus, one would expect the density to decrease and the water absorption to increase as the
RCA and PET content is increased.
Figure 10. The average water absorption of sand cement composite bricks with RCA and PET
Initial rate of suction (IRS)
According to the results in Figure 11, brick content of RCA 25% PET 0.5% gives the
lowest value of initial rate with 0.41 kg/m2/min at 7 days. A similar trend was observed for
the bricks containing RCA 25%PET 0.5% at 28 days with 0.45 kg/m2/min. Samples produced
using 75% of RCA showed greater initial surface absorption than did samples containing 50%
of RCA content. Thus, sample with RCA75% were more porous than RCA 50%, therefore
more water penetrated in the sample from their pores, thereby increasing the initial surface
absorption rate. Nevertheless, the initial rate values of RCA and PET mixtures were found to
be satisfactory. As illustrated in Figure 11, the conclusion that was drawn from the test showed
that the initial surface absorption of brick increased with an increment in replacement
contents. As explained previously, this can be attributed by the higher water absorption rate
of RCA compared to the fine aggregate. A higher concentration of RCA results in greater
initial surface absorption. These findings were in agreement with the studies conducted by
Fan et al. (2016). In addition, further study needs to be conducted as the IRS does not have
specific standard for the study of potential fine aggregate to be replaced with RCA and PET
in bricks.
0
1
2
3
4
5
6
Wat
er
Ab
sorp
tio
n (
%)
7 days 28 days

MCRJ Special Issue Vol. 4 | No. 2 | 2018 69
Figure 11. The average initial rate of suction of sand cement composite brick
CONCLUSION
From the results obtained on the physical properties testing, it is clearly shown that the
RCA and PET are suitable to be used as sand replacement in composite brick. It was found
that the specific gravity for sand is much higher than RCA and PET with a value of 2.865 that
can be explained that there is an absence of mortar in sand.
Composite brick shows that there are some samples that increase and reduced their size
which may be influenced by materials content and density of the constituent materials.
However, overall average shows all specimens had a uniform size and surfaces are similar
with natural sand cement brick. Other than that, the density of composite brick exhibits the
higher density than normal brick for both curing age of 7 and 28 days as the RCA contents
increase. It can be discussed that the high percentage of RCA (75%) can increase the strength
of the bricks rather than 25% and 50% of RCA. However, the lower volume fraction of PET
is seen to be suitably added when the volume of RCA is high but whenever the high volume
of PET is used.
The results illustrated that the water absorption and IRS increased with the increases in
replacement percentage of fine aggregate by the RCA and PET content for all mixtures. This
was due to the increase in the porosity of the bricks containing RCA and PET and the poor
bonding between cement paste and polymer. From the results, only brick containing 25%
RCA show less permeable compared to a normal brick. The best mix ratio was the mix design
brick of replacement of 25% RCA and 1.5% PET.
REFERENCES Akcaozoglu, S., Atis, C. D. and Akcaozoglu, K. (2010) An investigation on the use of
shredded waste PET bottles as aggregate in lightweight concrete. Waste Management,
30(2): 285–290.
Albano, C., Camacho, N., Hernandez, M., Matheus, A. and Gutierrez, A. (2009) Influence of
content and particle size of waste pet bottles on concrete behavior at different w/c ratios.
Waste Management, 29: 2707–2716.
00.10.20.30.40.50.60.70.80.9
Con
tro
l
PE
T 0
.5%
PE
T 1
.0%
PE
T 1
.5%
PE
T 0
.5%
PE
T 1
.0%
PE
T 1
.5%
PE
T 0
.5%
PE
T 1
.0%
PE
T 1
.5%
IRS
(k
g/m
²/m
in)
7 Days 28 Days
RCA 25% RCA 50% RCA 75%
MCRJ Special Issue Vol. 4 | No. 2 | 2018 70
ASTM C128-15 (2015) Standard Test Method for Density, Relative Density (Specific
Gravity), and Absorption of Fine Aggregate. West Conshohocken, PA: ASTM
International.
Azmi, N.B., Khalid, F.S., Irwan, J.M., Anting, N., Mazenan, P.N. (2017) A study on the
performance of concrete containing recycled aggregates and ceramic as materials
replacement. IOP Conference Series: Materials Science and Engineering, 271, 012081.
Batayneh, M. Marie, I. and Asi, I. (2007) Use of selected waste materials in concrete mixes.
Waste Management, 27 (12): 1870-1876.
Bravo, M., De Brito J. Pontes, J. and Evangelista, L. (2015) Durability performance of
concrete with recycled aggregates from construction and demolition waste plants.
Construction Building Materials, 77: 357–369.
BS EN 998-2 (2010) Specification for mortar for masonry. Part 2 - Masonry mortar. British
Standard Institution.
BS 3921 (1985) Specification for clay brick. British Standard Institution.
BS 6073-1(1981) Precast concrete masonry units. Specification for precast concrete masonry
units. British Standard Institution.
Dina, M. S. and Mohamed, M. E. (2012) Development of high-performance green concrete
using demolition and industrial wastes for sustainable construction Journal of American
Science, 8(4): 12-131.
Fan, C. C., Huang, R., Hwang, H. & Chao, S. J. (2016) Properties of concrete incorporating
fine recycled aggregates from crushed concrete wastes. Construction and Building
Materials, 112: 708–715.
Frigione, M. (2010) Recycling of PET Bottles as Fine Aggregates in Concrete. Waste
Management, 110(2): 31-35.
Irwan, J.M., Othman, N., Koh, H.B., Asyraf, R.M., Faisal, S.K., Annas, M.M.K., Shahrizan,
A.M. (2013) Development of mix design nomograph for polyethylene terephthalate fiber
concrete. Applied Mechanics and Materials. 253-255(1): 408-416.
Irwan Juki, M., Muhamad, K., Annas Mahamad, M.K., Boon, K.H., Othman, N., Kadir, A.
A., Asyraf Roslan, M and Khalid, F.S. (2013) Development of concrete mix design
nomograph containing polyethylene terephtalate (PET) as fine aggregate. Advanced
Materials Research. 701: 12-16.
Irwan, J.M., Annas, M.M.K., Aeslina, A.K., Asyraf, R.M., Faisal, S.K. (2014) Deflection
behaviour of irregular-shaped Polyethylene Terephthalate fibre reinforced concrete beam.
Advanced Materials Research, 911: 438-442.
Ismail, Z.Z. and Al-Hashmi, E.A. (2008) Use of waste plastic in concrete mixture as aggregate
replacement. Waste Management, 28(11): 2041–2047.
Ismail, S. and Yaacob, Z. (2010) Properties of bricks produced with recycled fine aggregate.
World Academy of Science, Engineering and Technology, (43): 878–882.
Khalid, F.S., Juki, M.I., Othman, N., Ibrahim, M.H.W. (2017) Pull-out strength Of
Polyethylene Terephthalate Bottle Fibre in Concrete Matrix. Malaysian Construction
Research Journal, 21(1): 75-85.
Kou, C.S., Poon, C., S., and Wan, H., W. (2012) Enhancing The Durability Properties of
Concrete Prepared With Coarse Recycled Aggregate. Construction Building Mateials. 35:
69–76.
Leman, A. S., Shahidan, S., Senin, M. S., and Ramzi Hannan, N. I. R. (2016) A Preliminary
Study on Chemical and Physical Properties of Coconut Shell Powder as A Filler in
Concrete,” IOP Conference Series: Materials Science and Engineering, 160(12059).

MCRJ Special Issue Vol. 4 | No. 2 | 2018 71
Lim, J. L. G. (2009) Effects of Recycled Aggregates in Concrete Properties. Degree of Master
of Engineering Thesis, National University of Singapore. 184 pp.
Mirjana, M., Vlastimir, R. and Snežana, M. (2010) Recycled Concrete as Aggregate for
Structural Concrete Production. Sustainability. (2):1204-1225.
Mazenan, P.N., Khalid, F.S., Shahidan, S. and Shamsuddin, S.M. (2017) Review of palm oil
fuel ash and ceramic waste in the production of concrete. IOP Conference Series:
Materials Science and Engineering, 271(012043),1-6.
MS 76 (1972) Specification for brick and block of fired brick earth, clay or shale Part 2.
Malaysia Standard.
Neno, C., de Brito, J. and Veiga, R. (2014) Using Fine Recycled Concrete Aggregate for
Mortar Production. Materials research, 17: 168-177.
Pereira DeOliveira, L. A. and Castro-Gomes, J. P. (2011) Physical and Mechanical Behaviour
of Recycled PET Fibre Reinforced Mortar. Constr. Build. Mater., 25(4): 1712–1717.
Poon, C. S., Kou, S. C., and Lam, L. (2002) Use of Recycled Aggregates in Molded Concrete
Bricks and Blocks. Construction Building Materials, 16(5): 281–289.
Ramadevi, K. and Manju, R. (2012) Experimental Investigation on the Properties of Concrete
With Plastic PET (Bottle) Fibres as Fine Aggregates. Journal of Emerging Technology
and Advanced Engineering, 2(6): 42–46.
Reis, J. M. L., Chianelli-Junior, R., Cardoso, J. M. L. and Marinho, F. J. V. (2011) Effect of
recycle pet in the fracture mechanic of polymer Mortar. Construction and Building
Materials. 25(6): 2799-2804.
Saika, N. and de Brito, J. (2012) Use of plastic waste as aggregate in cement mortar and
concrete preparation: A review. Construction and Building Materials, 34: 385-401
Senin, M.S., Shahidan, S., Leman, A. S. and Ramzi Hannan, N. I. R. (2016) Properties of
Cement Mortar Containing Rubber Ash as Sand Replacement. IOP Conference Series:
Materials Science and Engineering, 160(1).
Shakir, A. A. and Mohammed, A. A. (2013) Manufacturing of bricks in the past, in the present
and in the future: a state of the art review. Int. J. Adv. Appl. Sci., 2(3): 145–156.
Shahidan, S., Ranle, N. A., Mohd Zuki, S. S., Sheikh Khalid, F., Nazri, F. M., and Ridzuan,
A. R. M. “Concrete Incorporated with Optimum Percentages of Recycled Polyethylene
Terephthalate (PET) Bottle Fiber,” Int. J. Integr. Eng., vol. 10, no. 1, pp. 1–8, 2018.
Sheikh Khalid, F., Herman, H.S., Bazilah Azmi, N., and Irwan, J.M. (2017) Sand cement
brick containing recycled concrete aggregate as Fine-Aggregate Replacement. MATEC
Web of Conferences, 103(01016),1-7.
Sheikh Khalid, F., Herman, H.S. and Bazilah Azmi, N. (2017) Properties of sugarcane fiber
on the strength of the normal and lightweight concrete. MATEC Web of Conferences,
103(01021),1-7.
Shia, C., Lib, Y., Zhanga, J., Lia, W., Chonga, L., Xie, Z. (2016) Performance enhancement
of recycled concrete aggregate – A review. Journal of Cleaner Production, 112(1): 466–
472.
Zamir, M.M., Irwan, J.M., Othman, N., Faisal, S.K., Anneza, L.H., Teddy, T., Alshalif, A.F.
(2017) Influence of Ureolytic Bacteria Toward Interlocking Compressed Earth Blocks
(ICEB) in Improving Durability of ICEB. MATEC Web of Conferences, 103(01027),1-7.

MCRJ Special Issue Vol. 4 | No. 2 | 2018 72
THE EFFECT OF USING DIFFERENT SUBSTITUTES OF RUBBER ASH ON COMPRESSIVE STRENGTH OF CEMENT MORTAR
Mohamad Syamir Senin1,2, Shahiron Shahidan1, Nor Hayati Abd Ghafar1, Noorwirdawati Ali1, Alif Syazani Leman1, Nurul Izzati Raihan Ramzi Hannan1, Sharifah Salwa Mohd Zuki1, Mohd Haziman Wan Ibrahim1, F. M Nazri3 1Jamilus Research Center-Sustainable Construction, Faculty of Civil and Environmental Engineering, Universiti Tun Hussein Onn Malaysia. 2Construction Safety Division,Department of Safety and Health Malaysia (DOSH),Level 1, 3, 4 & 5, Block D4, Complex D, Government Administrative Centre,62530 W. P. Putrajaya 3School of Civil Engineering, Engineering Campus, Universiti Sains Malaysia, 14300 Nibong Tebal, Penang, Malaysia
Abstract The utilization of industrial waste products in cement paste has attracted attention both with the energy crisis in the 70s and the rise of environmental consciousness. Most cement paste properties can be improved by incorporating different kinds of industrial wastes. In this study, the changes of the properties for rubber ash cement mortar were investigated with respect to different content of rubber ash as cement and as sand substitution and filler. Rubber ash was produced from the pyrolysis process. The cement paste is postulated to be a potential material especially for construction applications which are subjected to impact such as crash barrier, bridges and roads. Cubic specimens were produced by adding 10% volume rations of rubber as fillers, sand replacement and cement replacement into M30 quality cement mortar. The physical and mechanical tests were conducted at the end of day 7, 14 and 28. Tire rubber ash is more suitable to be used as sand replacement. It also works as an alternative to cement replacement and fillers. The density of the mortar specimen decreased with the presence of rubber ash. The highest reduction in density occurred when tire rubber ash was used as sand replacement. The compressive strength of the mortar specimen reduced when rubber ash was added in the cement mortar. At the early stages, tire rubber ash used as fillers had better compressive strength however at 28 days the use of tire rubber ash as cement replacement had the strongest compressive strength. Keywords: Rubber ash; Pyrolysis; Mortar; Cement; Density, Compressive strength.
INTRODUCTION
Many countries face major environmental issues related to solid waste management
around the world. Previous studies have indicated that waste tires constitute a significant
portion of non-hazardous solid waste materials (Al-Akhras and Smadi, 2004). All over the
world, the amount of waste rubber has gradually increased over recent years because of the
increasing use of rubber products (Topçu and Sarıdemir, 2008). A large number of
automobile, truck and off-road tires are discarded all over the world every year, and only a
small proportion is either retreaded or burned to produce energy. In most countries, the
majority of discarded tires are either shredded and then landfilled or stockpiled (Fattuhi and
Clark, 1996). An estimated 1000 million tires reach the end of their useful lives every year.
The increasing amount of waste tires worldwide make the disposition of tires a relevant
problem to be solved. One of the most crucial environmental issues all around the world is
the disposal of the waste materials. Accumulations of discarded waste tires have been a major
concern because the waste rubber is not easily biodegradable even after a long-period landfill
treatment. However, material and energy are alternatives to disposal of the waste rubber.

MCRJ Special Issue Vol. 4 | No. 2 | 2018 73
Other researcher propose to use it as fuel material or as raw materials of rubber goods
(Sukontasukkul and Tiamlom, 2012; Sheikh Khalid et al., 2017). Recycle of used rubber
conserves valuable natural resources and reduces the amount of rubber entering landfill
(Youssf et al., 2015).
Application of recycled rubber particles as alternative aggregates in concrete have
received significant attention over the last two decades this is due to the massive quantities of
scrap vehicle tires that have already accumulated and the increased annual production
estimated to be one billion tires produced worldwide in 2011 (Hall and Najim, 2014). At
present enormous quantities of tires are already stockpiled (whole tire) or landfilled (shredded
tire), 3000 million inside EU and 1000 million in the US (Pacheco-Torgal et al., 2012). These
stockpiled tires are dangerous because they pose a potential environmental concern such as
fire hazards, and provide breeding grounds for mosquitoes (Gesoğlu and Güneyisi, 2011; Xue
and Shinozuka, 2013; Meddah et al., 2014). The implementation of the Landfill Directive
1999/31/EC and the End of Live Vehicle Directive 2000/53/EC banned the land fill disposal
of waste tires creating the driving force behind the recycling of these wastes (Shahidan et al.,
2011). Tire rubber wastes are already used for paving purposes. However, it can only recycle
a part of these wastes (Vieira et al., 2010). Some research has already been conducted on the
use of waste tires as aggregate replacement in concrete showing that concrete with enhanced
toughness and sound insulation properties can be achieved (Mazenan et al., 2017). The
additional of fibrous rubber to concrete improve shock wave abrasion, reduced heat
conductivity and noise level and increase resistance to acid rain (Noor et al., 2015; Khalid et
al., 2017). Rubber aggregates are obtained from waste tires using two different technologies:
mechanical grinding at ambient temperature or cryogenic grinding at a temperature below the
glass transition temperature. The first method generates chipped rubber to replace coarse
aggregates. As for the second method, crumb rubber is usually produced to replace fine
aggregates (Pacheco-Torgal et al., 2012; Md Nor et al., 2011; Shahidan et al., 2017).
Rubber is used as an additive in concrete to form a composite. When the aggregates are
replaced by crumb rubber, the compressive strength of concrete is reduced significantly
(Moustafa and ElGawady, 2015; Son et al., 2011; Gupta et al., 2015; Xue and Shinozuka,
2013; Atahan and Yücel, 2012; Khalil et al., 2015; Liu et al., 2012; Noor et al., 2016).
However this rubberized concrete have the ability to absorb a large amount of energy under
compressive and tensile loads (Topçu and Avcular, 1997; Li et al., 2004). It is believed that
the increase in impact resistance was derived from the enhanced ability of the material to
absorb energy (Zheng et al., 2008; Topçu, 1995).
In line with these characteristics, rubberized concrete was recommended to be used in
circumstances where vibration damping was required, such as in the highway construction as
a shock absorber or sound barriers and in buildings as an earthquake shock-wave absorber
(Topçu and Avcular, 1997; Fattuhi and Clark, 1996). Adding shredded rubber to concrete
softens the concrete, yielding greater plastic deformation on impact and smaller deceleration
forces(Atahan and Sevim, 2008). Chou et al. (2010) suggested that cement-based mortar and
concrete products, modified with tire rubber as a partial replacement for sand, could be used
in applications where mechanical properties are not of prime importance but high resistance
to chloride ion penetration is required This effect could possibly save lives of vehicle
occupants, while simultaneously preventing rubber from going to landfills or stockpiles.

MCRJ Special Issue Vol. 4 | No. 2 | 2018 74
However, the main disadvantages of utilizing waste tire rubber in concrete is its reduce
the compressive strength and elastic modulus (Khorami and Ganjian, 2011; Thomas and
Chandra Gupta, 2016; Youssf et al., 2016; Hilal, 2017). Eldin and Senouci were first to study
concrete tire aggregate in 1993. Their research consisted on replacing fine (1 mm) and coarse
(6 mm, 19 mm, 25 mm and 38 mm) aggregate. They found that concrete tire aggregate had
lower compressive and tensile strength. They also observed that the loss of compressive
strength increased with the size of the tire aggregate (Bravo and de Brito, 2012). The larger
size of rubber particles added into the concrete the lower concrete strength, however the
smaller size rubber particle the higher concrete strength (Liu et al., 2012; Li et al., 2014). By
referring to the previous research, most of them are basically used waste tire as fine and coarse
aggregate with size 1 mm to 40 mm. There are relative lacks of research area on the waste tire
with size less than 1 mm. Therefore, this research mainly focusing on the uses of fines rubber
crumb and rubber ash (less than 1 mm) as partially replacement fine aggregate in concrete.
Recent study investigated methods for increasing the damping capacity of concrete by
replacing up to 20% of the fine aggregate with shredded rubber. Generally, some researchers
reported an increase in damping and decrease in compressive strength was reported (Moustafa
and ElGawady, 2015). The study on utilizing the waste tire in concrete has been carried by
Bravo et al. (2012), Ismail et al. (2016), Leman (2016) and Shahiron et al. (2016). The
utilizing waste tire rubber in concrete postulate to enhance the concrete characteristic.
However, rubber tire aggregate was not applied in the construction industry due to lack of
supportive data. Therefore, this research was carried out to investigate the opportunity of
utilizing the waste tire in concrete as construction material in construction industry in order
to minimize the waste product in the same time preserve the natural aggregate. This research
was emphasized on the effect of different substitutions of tire rubber ash in cement mortar as
cement replacement, sand replacement and fillers.
Rubber Ash
Rubber ash also known as carbon black is end product of tire went through the pyrolysis
process. The pyrolysis involves subjecting tire to high temperature of 400 to 500°C, in
absence of oxygen. Figure 1 illustrates the pyrolysis process from the waste tires through the
pyrolysis plant to form the rubber ash. From the pyrolysis process the tires are broken down
into their three-basic component which are fuel oil/gas, wire steel and carbon black. From a
single tire, approximately 15% of the weight is steel, 30% becomes carbon black, 45% oil and
final 10% gas as shown in Figure 2.

MCRJ Special Issue Vol. 4 | No. 2 | 2018 75
Figure 1. Pyrolysis process
Figure 2. Pyrolysis product
EXPERIMENTAL WORK
Materials
Ordinary Portland Cement type 1 was used in the study. Only one type of cement used in
this study, there is no other cement was used to avoid any different properties of cement. The
cement was directly used from the original packaging without any alteration. The physical
properties and chemical analysis of the cement are presented in
Table 1 and
Table 2 respectively. Figure 3 shows the scanning electron microscopy (SEM) of the
cement used in this study at 100 times magnification. The median grain size for the cement
was 18m. Cement has fines grain size compared to the sand and rubber ash.
River sand was used as fine aggregate which has a maximum size of 5mm. The sand was
dried using air-dried condition. Figure 4 shows the SEM of the sand used in this study at 100
times magnification. Sand has bigger grain size compared to the rubber ash and cement. The
shape of the sand was angular. Rubber ash was obtained from the pyrolysis industry located
at Gopeng, Perak, Malaysia. The rubber ash has a maximum size of 1mm. Figure 5 shows the

MCRJ Special Issue Vol. 4 | No. 2 | 2018 76
SEM of the rubber ash used in this study at 100 times magnification. Rubber ash has round in
shape. This rubber ash directly used without any alteration. Table 1. Physical properties of Type I cement used in this study
Property Unit Type I cement
Specific gravity - 3.15 Passing grain size % 78 Median grain size m 18
Blaine specific surface m2/kg 300 Initial setting time Min 145 Final setting time Min 270
Table 2. Chemical analysis of Type I cements used in this study
Component (%) Type I cement
SiO2 21.2 Al2O3 5.5 Fe2O3 3.1 CaO 63.7 MgO 1.5 SO3 2.63 Na2O 0.18 K2O 0.71 TiO2 - Cl- - Zn - Loss on ignition 0.96
Figure 3. SEM micrograph for cement at 100x magnification

MCRJ Special Issue Vol. 4 | No. 2 | 2018 77
Figure 4. SEM micrograph for sand at 100x magnification
Figure 5. SEM micrograph for rubber ash at 100x magnification
Preparation of Mortar Specimen
The cement mortar was manually mixed by hand. First the cement, sand and rubber were
dry mixed for 3 minutes. After that water was poured into the mix for another 3 minutes. The
mortar mixture proportions were 1:2:0.55 by volume of the cement, sand and water,
respectively. The rubber ash was added to the mortar mix as 0% for control (CT), 10% of the
total volume as fillers (FIL), 10% of the volume of sand as sand replacement (SR) and 10%
of the volume of cement as cement replacement (CR).
Table 3. Mortar mixture proportions used in the study
Mix Cement (cm3) Sand (cm3) Rubber Ash (cm3) Water (cm3)
1 6000 12000 0 3300 2 5400 12000 600 3300 3 6000 10800 1200 3300 4 6000 12000 1800 3300
Table 3 shows the mortar mixture proportions used in this study. The size of the
specimens for compressive test were 100mm cube. Three mortar specimens were prepared
and tested to obtain an average value for each test condition. Each specimen was cast in three
layers and compacted. After casting, all specimens were left for 24 hours before being

MCRJ Special Issue Vol. 4 | No. 2 | 2018 78
demolded and cured in a curing tank at 232 C until the time of testing (Ramzi Hannan et
al., 2016; Senin et al., 2016).
Test Procedures
The compressive strength test and density test for hardened mortar mixture was conducted
according to ASTM C109-02 and ASTM C948-81. The compressive strength specimens were
tested using a compression machine. The rate of compressive loading was 7kN/s. The rate of
loading remained constant throughout the testing program. RESULT AND DISCUSSION
Density
The addition of rubber ash reduced the density of the mortar specimens. Figure 6 shows
the density of the mortar specimens for CT, CM, SM and FIL at 7, 14 and 28 days. The CT
specimens had the highest density compared to others and SM had the lowest density
compared to others. The density of the mortar specimens had increased over time. The
reduction of density for the mortar specimens compared to CT at 7 days were 2.70%, 4.93%
and 3.82% for CM, SM and FIL respectively. The reduction of density for the mortar
specimens compared to CT at 14 days were 3.00%, 4.89% and 3.47% for CM, SM and FIL
respectively. The reduction of density of the mortar specimens compared to CT at 28 days
were 3.24%, 5.56% and 5.09% for CM, SM and FIL respectively. From the data, it has shown
that the density for the rubber ash lighter than sand.
Nadal Gisbert et al. (2014) explained the increase of the rubber contain in the concrete
reduce the density of the concrete due to the gaps surround the rubber. Gesoğlu et al. (2014a
& 2014b) discovered the lighter weight concrete was produced by adding rubber in to
concrete. The rubberized concrete densities were 2-11% lighter than control concrete
specimens. Gesoğlu et al. (2014b) prepared the lowers density of 1900 kg/m3 while the highest
density is 2240 kg/m3 and found that the fine particles of the rubber the higher the density of
the rubberized concrete. This is due to the fine rubber played the role of fine aggregate and
filled the small gaps among the concrete particles which improve the density and not effected
more the permeability coefficient “K”.

MCRJ Special Issue Vol. 4 | No. 2 | 2018 79
Figure 6. Graph Density of Cement Mortar Against Time
Compressive Strength Figure 7 shows the development of compressive strength with curing period (7, 14 and 28
days) for hardened mortar containing 10% rubber for cement replacement (CR), sand
replacement (SR) and filler (FIL). The rate of compressive strength developed was relatively
high between 7 and 14 days, followed by a slower rate between 14 and 28 days. The rapid
development of compressive strength of mortar containing different rubber replacements
during the early stages of 7 and 14 days indicates rapid hydration during this period. The
development of strength continues even at later stages. The compressive strength depends on
the physical and mechanical properties of the constituent materials. If part of the materials is
replaced by rubber, reduction in strength will occur. The compressive strength of mortar
specimens for FIL indicated a higher value for the 7 days compared to CR and SR. However,
the compressive strength of the cement mortar decreased when the rubber ash was added to
the cement mortar because CT had the highest value among others. The percentage increase
in compressive strength at 14 days was 17.77%, 17.95%, 28.57% and 26.50% for CT, CR, SR
and FILL respectively. The percent increase in compressive strength of mortar specimens at
28 days were 2.31%, 20.03%, 14.07% and 3.16% for CT, CR, SR and FIL respectively. The
percentage decrease in compressive strength of the mortar specimens at 28 days compared to
control specimens were 16.79%, 17.12%, 22.60% for CR, SR and FIL respectively. From the
finding it was in line with the previous study which the rubberized concrete slightly decreased
compared to normal concrete (Chou et al., 2010; Moustafa and ElGawady, 2015). Gupta et
al. (2015) explain the compressive strength of waste rubber tire fibre concrete decreases with
the increase in the replacement level of fine aggregates by rubber fibre however the strength
increases on partial replacement of cement by silica fume.
Al-Akhras and Smadi (2004) observed the increase in compressive strength when the tire
rubber ash was replaced for fine aggregates up to 10%. The increase in compressive strength
of mortar specimens at 90 days were 14%, 21%, 29%, and 45% at tire rubber ash content of
2.5%, 5%, 7.5% and 10% respectively. Rubber ash contains 14.6% zinc oxide that enhances
the mechanical and physical properties of the cement mortar. Other than that rubber ash
(CT) (CM) (SR) (FL)

MCRJ Special Issue Vol. 4 | No. 2 | 2018 80
particle can consider as a nano material because the particle is smaller than 100nm that can
fill all the void in the cement mortar (Senin et al., 2016).
Figure 7. Compressive Strength of Cement Mortar against Time
CONCLUSIONS
This study presents the results of different substitution of tire rubber ash cement mortar
amended with. Based on the results of the study the following conclusions are drawn:
• Tire rubber ash is more suitable to be used as sand replacement. It also works as an
alternative to cement replacement and fillers.
• The density of the mortar specimen decreased with the presence of rubber ash. The
highest reduction in density occurred when tire rubber ash was used as sand
replacement.
• The compressive strength of the mortar specimen reduced when rubber ash was added
in the cement mortar. At the early stages, tire rubber ash used as fillers had better
compressive strength however at 28 days the use of tire rubber ash as cement
replacement had the strongest compressive strength.
REFERENCES Al-Akhras, N.M. and Smadi, M.M. (2004) Properties of Tire Rubber Ash Mortar. Cement
and Concrete Composites, 26(7):821–826.
Atahan, A.O. and Sevim, U.K. (2008) Testing and Comparison of Concrete Barriers
Containing Shredded Waste Tire Chips. Materials Letters, 62(21–22):3754-3757.
Atahan, A.O. and Yücel, A.Ö. (2012) Crumb Rubber in Concrete: Static and Dynamic
Evaluation. Construction and Building Materials, 36:617-622.
Bravo, M. and de Brito, J. (2012) Concrete Made with Used Tyre Aggregate: Durability-
related Performance. Journal of Cleaner Production, 25:42-50.
(CT) (CM) (SR) (FL)

MCRJ Special Issue Vol. 4 | No. 2 | 2018 81
Chou, L.-H., Yang, C-K., Lee, M-T. and Shu C.-C. (2010) Effects of Partial Oxidation of
Crumb Rubber on Properties of Rubberized Mortar. Composites Part B: Engineering,
41(8):613-616.
Eldin, N. N., and Senouci, A. B. (1993) Rubber-tire particles as concrete aggregate. Journal
of Material in Civil Engineering, ASCE, 5(4), 478-496
Fattuhi, N.I. and Clark, L.A. (1996) Cement-based Materials Containing Shredded Scrap
Truck Tyre Rubber. Construction and Building Materials, 10(4):229–236.
Gesoğlu, M., Güneyisi, E., Khoshnaw, G. and Ipek, S. (2014a) Abrasion and Freezing–
thawing Resistance of Pervious Concretes Containing Waste Rubbers. Construction and
Building Materials, 73:19-24.
Gesoğlu, M., Güneyisi, E., Khoshnaw, G. and Ipek, S. (2014b) Investigating Properties of
Pervious Concretes Containing Waste Tire Rubbers. Construction and Building
Materials, 63:206-213.
Gesoğlu, M. and Güneyisi, E. (2011) Permeability Properties of Self-compacting Rubberized
Concretes. Construction and Building Materials, 25(8):3319-3326.
Gupta, T., Chaudhary, S. and Sharma, R.K. (2015) Mechanical and Durability Properties of
Waste Rubber Fiber Concrete with and without Silica Fume. Journal of Cleaner
Production, 112:702-711.
Hall, M.R. and Najim, K.B. (2014) Structural Behaviour and Durability of Steel-Reinforced
Structural Plain/Self-Compacting Rubberised Concrete (PRC/SCRC). Construction and
Building Materials, 73:490-497.
Hilal, N.N. (2017) Hardened Properties of Self-compacting Concrete with Different Crumb
Rubber Size and Content. International Journal of Sustainable Built Environment,
6(1):191-206.
Khalid, F.S., Azmi, N.B., Sumandi, K.A.S.M., and Mazenan, P.N. (2017) Mechanical
properties of concrete containing recycled concrete aggregate (RCA) andceramic waste
as coarse aggregate replacement. AIP Conference Proceedings, 1891(020079):1-6.
Khalil, E., Abd-Elmohsen, M. and Anwar, A.M. (2015) Impact Resistance of Rubberized
Self-Compacting Concrete. Water Science, 29:45-53.
Khorami, M. and Ganjian, E. (2011) Comparing Flexural Behaviour of Fibre–cement
Composites Reinforced Bagasse: Wheat and Eucalyptus. Construction and Building
Materials, 25(9):3661-3667.
Ismail, I., Jamaluddin, N., and Shahidan, S. “A Review on Performance of Waste Materials
in Self Compacting Concrete (SCC),” J. Teknol., vol. 5, no. 78, pp. 29–35, 2016
Leman, A. S., Shahidan, S., Senin, M. S., and Ramzi Hannan, N. I. R. (2016) A Preliminary
Study On Chemical And Physical Properties Of Coconut Shell Powder As A Filler In
Concrete,” IOP Conf. Ser. Mater. Sci. Eng., vol. 160, p. 12059, 2016.
Li, G., Garrick, G., Eggers, J., Abadie, C., Stubblefield, M.A. and Pang, S.-S. (2004) Waste
Tire Fiber Modified Concrete. Composites Part B: Engineering, 35(4):305-312.
Li, L., Ruan, S. and Zeng, L. (2014) Mechanical Properties and Constitutive Equations of
Concrete Containing a Low Volume of Tire Rubber Particles. Construction and Building
Materials, 70:291-308.
Liu, F., Chen, G., Li, L. and Guo, Y. (2012) Study of Impact Performance of Rubber
Reinforced Concrete. Construction and Building Materials, 36:604-616.
Mazenan, P.N., Khalid, F.S., Shahidan, S. And Shamsuddin, S.M. (2017) Review of palm oil
fuel ash and ceramic waste in the production of concrete. IOP Conference Series:
Materials Science and Engineering, 271(012043):1-6.
Meddah, A., Beddar, M. and Bali, A. (2014) Use of Shredded Rubber Tire Aggregates for
MCRJ Special Issue Vol. 4 | No. 2 | 2018 82
Roller Compacted Concrete Pavement. Journal of Cleaner Production, 72:187-192.
Moustafa, A. and ElGawady, M.A. (2015) Mechanical Properties of High Strength Concrete
with Scrap Tire Rubber. Construction and Building Materials, 93:249-256.
Nadal Gisbert, A., Gadea Borrell, J.M., Parres Garcia, F., Sanchis, E.J., Amoros, J.E.C.,
Alcaraz, J.S. and Vicente, F.S. (2014) Analysis Behaviour of Static and Dynamic
Properties of Ethylene-Propylene-Diene-Methylene Crumb Rubber Mortar.
Construction and Building Materials, 50:671-682.
Md Nor, N., Bunnori, N. M., Ibrahim, A., Shahidan, S. and SMat Saliah, S.N. “Relationship
between acoustic emission signal strength and damage evaluation of reinforced concrete
structure: Case studies,” in 2011 IEEE Symposium on Industrial Electronics and
Applications, 2011, pp. 308–313.
Noor, N.M., Hamada, H., Sagawa, Y. and Yamamoto, D. (2015) Effect of Crumb Rubber on
Concrete Strength and Chloride Ion Penetration Resistance. Jurnal Teknologi,
77(32):171-178.
Noor, M.N., Yamamoto, D., Hamada, H. and Sagawa, Y. (2016) Study on Chloride Ion
Penetration Resistance of Rubberized Concrete Under Steady State Condition. MATEC
Web Conferences, 47(01004),1 - 5.
Pacheco-Torgal, F., Ding, Y. and Jalali, S. (2012) Properties and Durability of Concrete
Containing Polymeric Wastes (tyre rubber and polyethylene terephthalate bottles): An
Overview. Construction and Building Materials, 30:714-724.
Ramzi Hannan, N. I. R., Shahidan, S., Maarof, M. Z., and Ali, N. (2016) Physical and
Chemical Properties of Coal Bottom Ash (CBA) from Tanjung Bin Power Plant. IOP
Conference Series: Materials Science and Engineering, 160(1).
Senin, M.S., Shahidan, S., Leman, A.S. and Hannan, N.I.R.R. (2016) Analysis of Physical
Properties and Mineralogical of Pyrolysis Tires Rubber Ash Compared Natural Sand in
Concrete Material. IOP Conference Series: Materials Science and Engineering,
160(012053), 1- 10.
Senin, M. S., S. Shahidan, S., Leman, A. S., and Ramzi Hannan, N. I. R. (2016) Properties
of Cement Mortar Containing Rubber Ash as Sand Replacement. IOP Conference Series:
Materials Science and Engineering, 160(1).
Shahidan, S., Pullin, R., Bunnori, N. M., and S. S. Mohd Zuki, S. S “Active crack evaluation
in concrete beams using statistical analysis of acoustic emission data,” Insight - Non-
Destructive Test. Cond. Monit., vol. 59, no. 1, pp. 24–31, 2017.
Shahidan, S., Mohd Zuki, S. S. Rahim, M. A. and Ali, N. (2016) Amplitude Distribution of
Emission Wave for Cracking Process, MATEC Web Conference, 47, 2–8.
Shahidan, S Bunnori, N. M., Md Nor, N. and Basri, S. R. (2011) Health Index Evaluation on
Acoustic Emission Signal for Concrete Structure by Intensity Analysis Method. Adv.
Mater. Res., 403–408: 3729–3733.
Sheikh Khalid, F., Herman, H.S., and Azmi, N.B. (2017) Properties of Sugarcane Fiber on
the Strength of the Normal and Lightweight Concrete. MATEC Web of Conferences,
103(01021),1-7.
Son, K.S., Hajirasouliha, I. and Pilakoutas, K. (2011) Strength and Deformability of Waste
Tyre Rubber-filled Reinforced Concrete Columns. Construction and Building Materials,
25:218-226.
Sukontasukkul, P. and Tiamlom, K. (2012) Expansion under Water and Drying Shrinkage of
Rubberized Concrete Mixed with Crumb Rubber with Different Size. Construction and
Building Materials, 29:520-526.
Thomas, B.S. and Chandra Gupta, R. (2016) Properties of High Strength Concrete
MCRJ Special Issue Vol. 4 | No. 2 | 2018 83
Containing Scrap Tire Rubber. Journal of Cleaner Production, 113:86-92.
Topçu, l.B. and Avcular, N. (1997a) Analysis of Rubberized Concrete as a Composite
Material. Cement and Concrete Research, 27(8):1135-1139.
Topçu, I.B. and Avcular, N. (1997b) Collision Behaviours of Rubberized Concrete. Cement
and Concrete Research, 27(12):1893-1898.
Topçu, I.B. (1995). The Properties of Rubberized Concretes. Cement and Concrete Research,
25(2):304-310.
Topçu, İ.B. and Sarıdemir, M. (2008) Prediction of Rubberized Concrete Properties using
Artificial Neural Network and Fuzzy Logic. Construction and Building Materials,
22(4):532-540.
Vieira, R.K., Soares, R.C., Pinheiro, S.C., Paiva, O.A., Eleuterio, J.O. and Vasconcelos, R.P.
(2010) Completely Random Experimental Design with Mixture and Process Variables
for Optimization of Rubberized Concrete. Construction and Building Materials,
24(9):1754-1760.
Xue, J. and Shinozuka, M. (2013) Rubberized Concrete: A Green Structural Material with
Enhanced Energy-dissipation Capability. Construction and Building Materials, 42:196-
204.
Youssf, O., ElGawady, M.A. and Mills, J.E. (2015) Experimental Investigation of Crumb
Rubber Concrete Columns under Seismic Loading. Structures, 3:13–27.
Youssf, O., Mills, J.E. and Hassanli, R. (2016) Assessment of the Mechanical Performance
of Crumb Rubber Concrete. Construction and Building Materials, 125:175-183.
Zheng, L., Sharon Huo, X. and Yuan, Y. (2008) Experimental Investigation on Dynamic
Properties of Rubberized Concrete. Construction and Building Materials, 22:939-947.
UTILISATION OF WASTE GLASS POWDER AS A PARTIAL REPLACEMENT OF CEMENT IN SUSTAINABLE MORTAR PRACTICE
Bassam. A. Tayeh1, S. Shahidan2, Ahmed. J. A. El-Kurd1, S. S. Mohd Zuki2, A.R.M. Ridzuan3, M.H. Wan Ibrahim2, F. S. Khalid2 , F. M Nazri4 1 Department of Civil Engineering, Faculty of Engineering, Islamic University of Gaza, Gaza, Palestine 2 Jamilus Reserch Center, Faculty of Civil and Environmental Engineering, Universiti Tun Hussein Onn, 86400, Batu Pahat, Johor, Malaysia. 3 Institute for Infrastructure Engineering and Sustainable Management (IIESM),Faculty of Civil Engineering, Universiti Teknologi MARA 4 School of Civil Engineering, Engineering Campus, Universiti Sains Malaysia, 14300 Nibong Tebal, Penang, Malaysia
Abstract Millions of tonnes of waste glass are being generated annually worldwide. Waste glass, which is often disposed in landfills, causes unsustainability because it does not decompose in the environment. Glass is principally composed of silica. This work investigates the performance of cement mortar containing glass powder (GP) as a partial substitution for cement. Portland cement was partially replaced with 10%, 20% and 30% GP. The unit weight and compressive strength of the cement mortar after a curing period of 7 and 28 days were measured. Although the compressive strength of the cement mortar decreased, its unit weight had no significant change and remained equal to those of the control samples. Therefore, GP can be considered as a viable replacement for cement and is thus an economical construction material. Keywords: Cement mortar; Compressive strength; Replacement of cement; Sustainable mortar; Waste
glass powder
MCRJ Special Issue Vol. 4 | No. 2 | 2018 84
INTRODUCTION
Concrete, which is a mixture of Portland cement, aggregates (including fine and coarse
aggregates) and water with or without admixtures, is the most commonly used construction
material. Replacement of Portland cement with waste materials such as fly ash, bagasse ash,
silica fume and marble powder has been the focus of many studies. Waste glass powder (GP)
can also be used as a binder with the partial replacement of cement and as a filler material.
When ground to a very fine powder, waste glass shows pozzolanic properties because of its
high SiO2 content. Therefore, waste GP, to some extent, can replace cement in concrete and
contribute to strength development.
The production of Portland cement, an essential constituent of concrete, leads to the
release of a significant amount of CO2, a greenhouse gas. One tonne of Portland cement
clinker production generates approximately 1 tonne of CO2 and other greenhouse gases.
As environmental issues are increasingly becoming relevant because of the increasing
awareness regarding the sustainable development of the cement and concrete industry (Naik
and Moriconi, 2005; Shahidan et al., 2011), the incorporation of recycled materials in
construction materials has started to attract considerable attention (Irwan et al., 2013; Ismail
et al., 2016). Owing to population growth, the amount and type of waste materials have
increased accordingly. Many of the nondecaying waste materials remain in the environment
for hundreds or perhaps thousands of years ( Leman et al., 2016; Khalid et al., 2017). The
accumulation of waste, particularly nondecaying waste, is a global problem. Most of these
materials are left as stockpiles and landfill materials or illegally dumped. Thus, in order to
minimise the accumulation of waste materials and the depletion of virgin raw materials,
several methods for recycling waste materials have been introduced (Sheikh Khalid et al.,
2017). For example, some waste materials are currently used in concrete mixtures (Wang et
al., 2004; Senin et al., 2016; Shahidan et al., 2016).
The use of waste materials such as waste glass in the construction industry has
significantly increased in the past few years because they do not have any adverse effects on
the properties of concrete. This provides an effective platform for the disposal of waste
materials in permanent concrete structures.
The amount and composition of solid waste generated vary among countries and
residential areas. Moreover, the amount of household waste differs among households which
may also be correlated with population, national state income and person’s level. The average
typical composition (% by weight) of solid waste consists of organic matter (67.0%), paper
(8%), textiles (2%), plastics (7%), glass (2%), metals (2%), sand (10%) and other materials
(2%) (Abu El Qomboz and Busch, 2010; Shahidan et al., 2018).
In Gaza, solid waste accumulation has become a serious problem because of excessive
waste dumps in the region and insufficient efforts by the authorities in solid waste
management. In 2010, the Ministry of Planning estimated that 1300 tonnes of waste materials
were generated by the Gaza Strip per day. This amount is estimated to reach 2350 tonnes/day
after 20 years.
LITERATURE REVIEW

MCRJ Special Issue Vol. 4 | No. 2 | 2018 85
Millions of tonnes of waste glass are generated annually worldwide. The disposal of glass
in landfills is not sustainable because it is principally composed of silica (Aarthi, 2016) which
does not decompose in the environment.
In 2005, approximately 12.8 million tonnes of waste glass were generated in the US alone,
and only 20% of this amount was recycled (Enviromental Protection Agency, 2006). Thus,
recycling and reusing waste materials have become increasingly relevant owing to inadequate
landfill sites in urban areas and the increasing cost of land filling.
Glass is an amorphous material with high-silica content, making it potentially pozzolanic
when the sizes of its particles measure less than 75 μm. Glass is considered a pozzolanic
material because of its ground silica content and its ability to exhibit properties similar to
other pozzolanic materials. Powdered waste glass can be used as a partial replacement for
cement in concrete. However, when used as aggregates in Portland cement concrete, crushed
glass is susceptible to expansion and cracking due to alkali silica reaction. In the present study,
we prepared concrete mixtures with different proportions of GP ranging from 10% to 30%
with an increment of 10%. The concrete specimens were later tested for compressive strength
after 7 and 28 days of curing (Shekhawat and Aggarwal, 2014; Sharif et al., 2017; Shahidan
et al., 2017).
The main chemical component of waste liquid crystal glass is SiO2. When liquid crystal
glass replaces cement in concrete, the working ability of concrete tends to decrease with the
increase of liquid crystal glass used whereas the compressive strength decreases as the
proportion of the substitute increases (Pereira-de-Oliveira et al. 2012). Due to water
repellence, waste glass can be used in concrete for the reduction of water absorption and
shrinkage (Kumarappan, 2013).
Waste glass is a material generated during glass manufacturing which is possibly
beneficial for resource and energy savings (Lam et al. 2007). In many countries, cullet is
placed into a smelting zinc furnace for the production of substitute materials for silica.
The main aim of this study is to investigate the performance of cement mortar containing
GP as a partial substitution for cement. Portland cement was partially replaced with 10%,
20%, and 30% of GP. The unit weight and the compressive strength of the specimens were
measured after 7 and 28 days of curing in water.
The significance of this study is to determine the performance of mortar made of GP as a
partial replacement of cement. The importance of this work lies in the establishment of the
performance of mortar containing GP and to compare it with ordinary plain concrete. The
study is expected to provide to following:
i. The optimum percentage of GP used to partially replace cement content in mortar that
will directly influence the construction industry economically,
ii. Environmentally friendly usage of waste glass in concrete structures, and
iii. Contribution of waste glass in the strength development and durability of concrete.
EXPERIMENTAL WORK

MCRJ Special Issue Vol. 4 | No. 2 | 2018 86
In this work, 0%, 10%, 20% and 30% of ordinary Portland cement was replaced with GP
in a mortar mix (Leman et al., 2017, Lam et al., 2007). Twenty-four 50 mm × 50 mm × 50
mm specimens were cast for different GP proportions and their properties were compared
with those of a mortar prepared without GP (control mix). The unit weight and compressive
stress tests were performed on the concrete specimens after 7 and 28 days of curing.
Materials
Portland cement (type I), natural sand, water and GP were used in this study.
Cement
Ordinary Portland cement (Grade 42.5R) with a specific gravity of 3.15 was used in the
experiment. The degree of fineness of cement referred to the mean size of the grains. The rate
of hydration and hydrolysis as well as the consequent development of strength depend on the
fineness of the cement. To obtain the same rate of hardening in different brands of cement,
the cement fineness was standardised. Fine cement exhibits quick action with water and gains
early strength as its ultimate strength remains unaffected. However, there would be an
increase in the shrinkage and cracking of cement as the fineness of cement increases (ASTM
C204, 2004) as shown in Equation 1 and 2.
(1)
where S is the specific surface of the test sample (cm2/g), Ss is the specific surface of standard
cement (cm2/g), T is the time interval of the manometer drop for the test sample (s) and Ts is
the time interval of the manometer drop for standard cement (s).
(2)
Water
Tap water, potable without any salts or chemicals, was used in the study. The water source
was the soil and material laboratory in the Islamic University of Gaza.
Natural fine aggregates
As defined in ASTM C33-03, the grades of the fine aggregates were determined according
to sieve grading. Natural fine aggregates were tested for their physical properties. The
absorption was 2.26%, the dry unit weight was 1610.01 kg/m3, the specific gravity of fine
aggregate was 2.50 and the fineness modulus of the fine aggregate was 2.90.
Glass powder
Waste glass was obtained from the recycling glass industry in Portugal, where waste glass
(such as car windscreens) is crushed and sold to the bottle industry. The waste glass was

MCRJ Special Issue Vol. 4 | No. 2 | 2018 87
grounded until it exhibited the same fineness as that of cement. The specific gravity of GP
was 2.45. The glass was ground until it passed a sieve of 75 µm.
The waste glass was prepared in two stages as follows:
Stage I: Glass samples were ground using a Los Angeles machine for 6000 revolutions as
shown in Figure 1.
Figure 1. Stage I of glass preparation
Stage II is passed the sample through a sieve #200 as shown in Figure 2.
Figure 2. Stage II of glass preparation
The fineness of GP was measured using an air permeability test, according to Equation 1.
Mix Proportions
In this study, 0%, 10%, 20% and 30% of ordinary Portland cement was replaced with GP
in a mortar mix. The components of the mortar had the following proportions (Table 1):
cement, 2.75; sand, 0.64 and water as a reference mix. Figure 3 shows the preparation of
mortar cubes and the compression test equipment (ASTM C109-88).

MCRJ Special Issue Vol. 4 | No. 2 | 2018 88
Table 1. Proportions of mix design results Mix 4 Mix 3 Mix 2 Mix 1 Mix Number
glass%
30% 20% 10% 0%
weight(kg) Material
350 400 450 500 cement 1375 1375 1375 1375 sand 150 100 50 0 GP 312 312 312 312 water 0 0 0 0 air content 2187 2187 2187 2187 total
Figure 3. Preparation of mortar cubes and the compression test equipment
Results and analysis for GP cement mortars
Properties of mortar density
Density at 7 days
Table 2 shows the densities of mortar cube samples containing 0%, 10%, 20% or 30%
GP. The overall density of the control samples cured for 7 days was 2.2 tonnes/m3, which was
nearly equal to that of the samples containing 10%, 20% or 30% GP. The test results indicated
no significant reduction in dry density. This result is in agreement with previous studies by
Taha and Nounu (2008, 2009).
Density of GP at 28 days
Table 3 shows the densities of mortar cube samples containing 0%, 10%, 20% or 30%
GP. The overall density of the control samples cured for 28 days was 2.2 tonnes/m3, which
was nearly equal to that of the samples containing 10%, 20% or 30% GP. The test results
indicated no significant reduction in dry density. This result is in agreement with previous
studies by Taha and Nounu (2008) and Kumarappan (2013).
Compressive strength of cement mortars Compressive strength at 7 days
Table 2 shows the average failure load of 23 kN for the control samples at the age of 7
days. The average failure loads of samples containing 10%, 20% and 30% GP were 20.3, 20
and 14 kN, respectively. The GP concrete samples cured for 7 days displayed lower

MCRJ Special Issue Vol. 4 | No. 2 | 2018 89
compressive strength than the control samples. Their compressive strengths tended to
decrease as the proportions of GP increased.
The reduction in compressive strength was 11.74%, 13.04% and 39.1% for samples
containing 10%, 20% and 30% GP, respectively. This inclination may be due to the decrease in
adhesive strength between the surface of the waste GP and the cement paste. In this study, the
particle size of GP was larger than the particle size of cement. Porosity was the main factor
affecting the compressive strength of mortar. This result is in agreement with studies by
Shahidan et al (2017), Sadiqul et al. (2016), Irshad (2015), Idir and Tagnit-Hamou (2011) and
Jain and Narayanan (2010).
Compressive strength at 28 days
Table 3 shows the average failure load of 37.3 kN for the control samples at the age of 28
days. The average failure loads of the samples containing 10%, 20% and 30% GP were 33.9,
31.7 and 25.4 kN, respectively. GP concrete samples at the age of 28 days displayed lower
compressive strength than the control samples. The compressive strength tends to decrease as
the proportions of GP increase.
The reduction in compressive strength was 9.1%, 15.0% and 32.9% for samples
containing 10%, 20% and 30% GP, respectively. This inclination may be due to the decrease
in adhesive strength between the surface of the waste GP and the cement paste. In this study,
the particle size of GP was larger than the particle size of cement. Porosity was the main factor
affecting the mortar’s compressive strength.
The compressive strength obtained in the present study is in agreement with the results
obtained in previous studies which reported that the replacement of cement with glass results
in a decrease in compressive strength. The decreased amount of calcium–silicate–hydrate (C–
S–H) gel was due to the reaction between calcium hydroxide and pozzolanic mineral additions
in the blended cement compositions (Habulat and Saman, 2013; Tayeh et al., 2013; Zeyad et
al., 2016; and Zeyad et al., 2017).
Table 2. Density and compressive strength after a curing period of 7 days
Glass percent
Sample no
Dimension (mm) Weight
(g)
Density Failure Load
(KN) Average
(KN) L W H g/m3
0% 1 50 49 50 265 2.2 22 23 0% 2 50 50 50 270 2.2 24
0% 3 51 50 50 270 2.1 22
10% 1 50 50 50 265 2.1 18 20.3 10% 2 51 51 50 275 2.1 22
10% 3 50 48 50 270 2.3 21
20% 1 50 50 50 275 2.2 21 20 20% 2 50 50 50 270 2.2 19
20% 3 50 50 50 270 2.2 21
30% 1 50 50 50 270 2.2 14 14 30% 2 50 50 50 270 2.2 14
30% 3 50 50 50 270 2.2 13
Table 3. Density and compressive strength after a curing period of 28 days

MCRJ Special Issue Vol. 4 | No. 2 | 2018 90
Glass percent
Sample no
Dimension (mm) Weight (g)
Density Failure Load (KN)
Average (KN) L W H g/m3
0% 1 50 50 50 273 2.2 37.7
37.3 0% 2 50 50 50 270 2.2 39.6 0% 3 50 50 50 269 2.2 34.7
10% 1 50 50 50 280 2.2 32.047
33.9 10% 2 50 50 50 275 2.2 35.243 10% 3 50 50 50 270 2.2 34.617
20% 1 50 50 50 270 2.2 29.252
31.7 20% 2 50 50 50 270 2.2 34.065 20% 3 50 50 50 265 2.1 21.963
30% 1 50 50 50 270 2.2 28.8
25.4 30% 2 50 50 50 270 2.2 26.1 30% 3 50 50 50 275 2.2 21.3
CONCLUSION
The effects of GP on the properties of cement mortar are as follows:
• The overall density of the 7-day control samples was 2.2 tonnes/m3, which was nearly
equal to that of the samples with 10%, 20% and 30% GP.
• The compressive strength of the samples containing GP tended to decrease with the
increase in GP proportions. At the test age of 7 days, the compressive strength reduction
was 11.74%, 13.04% and 39.1% for samples with 10%, 20% and 30% GP respectively.
• The overall density of the control samples cured for 28 days was 2.2 tonnes/m3, which
was nearly equal to that of samples with 10%, 20% and 30% GP.
• The compressive strength of the samples containing GP tended to decrease with the
increase in GP proportions. At the test age of 28 days, the compressive strength reduction
was 9.1%, 15.0% and 32.9% for samples with 10%, 20% and 30% GP respectively. This
inclination may be due to the decrease in adhesive strength between the surface of the
waste GP and cement paste.
• The production of GP cement mortar may potentially result in the reduction of emissions
produced by cement manufacturing industries. Thus, GP is a potential substitute for
cement. From the environmental perspective, GP is an eco-friendly and economical
material. However, the durability of mortar containing different replacement ratios of GP
requires further investigation.
ACKNOWLEDGEMENT
The authors extend their gratitude to the Director and Staff of The Material and Soil
Laboratories at IUG-Gaza for their help and support throughout the study. Special thanks are
also directed to senior civil engineering students Loay Omar Jber, Jehad Abo Mostafa and
Mostafa Mohammed Tabasi for helping the authors in carrying out the experimental program.
REFERENCES
Aarthi, A. (2016) Study on glass powder as particle replacement of Cement of concrete by
using silica fume. International Journal of Advanced Research Trends in Engineering
and Technology, 3(2):298-301.

MCRJ Special Issue Vol. 4 | No. 2 | 2018 91
Abu El Qomboz, Y. D. and Busch, H. G. (2010) Solid Waste Management in Gaza Strip
Problems and Solutions. Retrieve from http://research.iugaza.edu.ps/files/2265.PDF.
ASTM C109-88. Compressive Strength of Hydraulic Cement Mortar, using 50 mm cube
specimens.
ASTM C204-11, (2004). Standard test methods for fineness of hydraulic cement by air-
permeability apparatus.
Enviromental Protection Agency (EPA). (2006). Municipal Solid Waste Generation,
Recycling and Disposal in the United States: Facts and Figures for 2005,
Habulat, A., Saman, H. M., Kamarudin, K. and Omar, M. (2013) Use of bacterial silica
precipitation to enhance strength and permeability of concrete. Malaysian Construction
Research Journal, 13(2): 39-48.
Idir, R, Cyr, M and Tagnit-Hamou, A (2011) Pozzolanic properties of fine and coarse color
mixed glass cullet. Cement and Concrete Composites, 33(1): 19–29.
Irwan, J.M., Othman, N., Koh, H.B., Asyraf, R.M., Faisal, S.K., Annas, M.M.K., Shahrizan,
A.M. (2013) Development of mix design nomograph for polyethylene terephthalate fiber
concrete. Applied Mechanics and Materials. 253-255(1): 408-416.
Ismail, I., Jamaluddin, N., and Shahidan, S. “A Review on Performance of Waste Materials
in Self Compacting Concrete (SCC),” J. Teknol., vol. 5, no. 78, pp. 29–35, 2016
Jain, J. A. and Narayanan, N. (2010) Chloride transport in fly ash and glass powder modified
concretes – influence of test methods on microstructure. Cement and Concrete
Composites, 32(2): 148–156.
Khalid, F.S., Azmi, N.B., Sumandi, K.A.S.M., and Mazenan, P.N. (2017) Mechanical
properties of concrete containing recycled concrete aggregate (RCA) andceramic waste
as coarse aggregate replacement. AIP Conference Proceedings, 1891(020079):1-5.
Kumarappan, N. (2013) Partial Replacement Cement in Concrete Using Waste Glass.
International Journal of Engineering Research & Technology 2(10):1880-1883.
Lam, C. S., Poon, C. S. and Chan, D. (2007) Enhancing the performance of pre-cast concrete
Cement Concrete Composite, 29(8):616– 625.
Leman, A. S., Shahidan, S., Senin, M. S., Shamsuddin, S. M., Anak Guntor, N. A., Mohd
Zuki, S. S., Khalid, F. S., Azhar, A. T. S. and Razak, N. H. S. (2017) Durability of coconut
shell powder (CSP) concrete. IOP Conference Series: Materials Science and
Engineering, 271(12007).
Leman, A. S., Shahidan, S., Senin, M. S., and Ramzi Hannan, N. I. R. (2016) A Preliminary
Study on Chemical And Physical Properties of Coconut Shell Powder as A Filler In
Concrete. IOP Conference Series: Materials Science and Engineering, 160(12059).
Naik, T. R. and Moriconi, G. (2005) Environmental-friendly durable concrete made with
recycled materials for sustainable concrete construction. International Symposium on
Sustainable Development of Cement, Concrete and Concrete Structures. Toronto, 485-
505.
Pereira-de-Oliveira, L. A., Castro-Gomes, J. P. and Santos, P. M. S. (2012) The potential
pozzolanic activity of glass and red-clay ceramic waste as cement mortars components.
Construction and Building Materials, 31:197–203.
Taha, B. and Nounu, G. (2008) Properties of concrete contains mixed colour waste recycled
glass. Construction and Building Materials, 22:713–720.
Taha, B. and Nounu, G. (2009) Utilizing Waste Recycled Glass as Sand/Cement. Journal of
Materials In Civil Engineering, 21(12):0899-1561.

MCRJ Special Issue Vol. 4 | No. 2 | 2018 92
Tayeh, B. A., Abu Bakar, B., Johari, M. A.M. and Zeyad, A. (2013) The Role of Silica Fume
In The Adhesion of Concrete Restoration Systems. Advanced Materials Research,
626:265-269.
Senin, M. S., S. Shahidan, S., Leman, A. S., and Ramzi Hannan, N. I. R. “Properties of
Cement Mortar Containing Rubber Ash as Sand Replacement,” in IOP Conference Series:
Materials Science and Engineering, 2016, vol. 160, no. 1.
Sharif, A. A. M., Shahidan, S., Koh, H. B., Kandash, A. and Mohd Zuki, S. S. (2017) Strength
development of pervious concrete containing engineered biomass aggregate. IOP Conf.
Ser. Mater. Sci. Eng., 271(12002).
Shahidan, S., Pullin, R., Bunnori, N. M., and S. S. Mohd Zuki, S. S “Active crack evaluation
in concrete beams using statistical analysis of acoustic emission data,” Insight - Non-
Destructive Test. Cond. Monit., vol. 59, no. 1, pp. 24–31, 2017.
Shahidan, S., Mohd Zuki, S. S. Rahim, M. A. and Ali, N. (2016) Amplitude Distribution of
Emission Wave for Cracking Process, MATEC Web Conference, 47, 2–8.
Shahidan, S Bunnori, N. M., Md Nor, N. and Basri, S. R. (2011) Health Index Evaluation on
Acoustic Emission Signal for Concrete Structure by Intensity Analysis Method. Adv.
Mater. Res., 403–408: 3729–3733.
Shahidan, S., Ranle, N. A., Mohd Zuki, S. S., Sheikh Khalid, F., Nazri, F. M., and Ridzuan,
A. R. M. “Concrete Incorporated with Optimum Percentages of Recycled Polyethylene
Terephthalate ( PET ) Bottle Fiber,” Int. J. Integr. Eng., vol. 10, no. 1, pp. 1–8, 2018.
Shahidan, S., Aminuddin, E., Mohd Noor, K., Ramzi Hannan, N. I. R. and Saiful Bahari, N.
A. (2017) Potential of Hollow Glass Microsphere as Cement Replacement for
Lightweight Foam Concrete on Thermal Insulation Performance. MATEC Web
Conference, 103(10140.
Sheikh Khalid, F., Herman, H.S., Bazilah Azmi, N., and Irwan, J.M. (2017) Sand cement
brick containing recycled concrete aggregate as Fine-Aggregate Replacement. MATEC
Web of Conferences, 103(01016), 1-7.
Shekhawat, B. S. and Aggarwal, D. V. (2014) Utilisation of Waste Glass Powder in Concrete
– A Literature Review. International Journal of Innovative Research in Science,
Engineering and Technology, 3(7):14822-14826.
Sadiqul, G. M., Rahman, M. H. and Kazi, N. (2016) Waste glass powder as partial
replacement of cement for sustainable concrete practice. International Journal of
Sustainable Built Environment, 6(1):37-44.
Wang, H. Y., Zeng, H. H. and Wu, Y. J. (2004) A study on the macro and micro properties
of concrete with LCD glass. Construction and Building Materials, 50:664–670.
Zeyad, A. M., Johari, M. A. M., Tayeh, B. A. and Yusuf, M. O. (2017) Pozzolanic Reactivity
of Ultrafine Palm Oil Fuel Ash Waste on Strength and Durability Performances Of High
Strength Concrete. Journal of Cleaner Production, 144:511-522.
Zeyad, A., Johari, M. A.M., Tayeh, B.A. and Yusuf, M. O. (2016) Efficiency of Treated and
Untreated Palm Oil Fuel Ash As A Supplementary Binder on Engineering and Fluid
Transport Properties Of High-Strength Concrete. Construction and building materials,
125:1066-1079.

MCRJ Special Issue Vol. 4 | No. 2 | 2018 93
INFLUENCE OF GROUND COAL BOTTOM ASH WITH DIFFERENT GRINDING TIME AS CEMENT REPLACEMENT MATERIAL ON THE STRENGTH OF CONCRETE Mohd Khairy Burhanudin1, Mohd Haziman Wan Ibrahim1, Mohd Syahrul Hisyam Mohd Sani3 , Mohd Irwan Juki1, Norwati Jamaluddin1 , Ramadhansyah Putra Jaya2, Shahiron Shahidan1 , Nurul Fasihah Basirun1, Mohamad Zulhairi Mohd Bosro1 1Jamilus Research Center,Faculty of Civil & Enviromental Engineering, Universiti Tun Hussein Onn Malaysia, 86400 Parit Raja, Batu Pahat, Johor, Malaysia. 2Faculty of Civil Engineering, Universiti Teknologi Malaysia, 81310 Skudai, Johor, Malaysia. 3Faculty of Civil Engineering, Universiti Teknologi Mara Cawangan Pahang, 26400 Bandar Tun Razak, Pahang, Malaysia
Abstract This study was conducted to determine the strength of concrete containing coal bottom ash (CBA) as cement replacement material. The original CBA were sieved passing 150 um sieve size then ground for 20, 30, and 40 hours using ball mill machine. The normal concrete were designed for grade 30 based on Department of Environmental method (DOE). The concrete were produced by replacement level of cement 10%, 20% and 30%. The fresh concrete were tested using slump cone to determine the workability of concrete. It is found that slump height was decrease with increasing the replacement level of CBA. The concrete cubical with size 100 × 100 × 100 mm were prepared and tested to determine the compressive strength. It is shown that, the 20% replacement level of cement with 30 hours grinding time contributed high compressive strength compared to others. The presence of CBA in cement as a binder was improves the strength of concrete. It can be concluding that, CBA can be used as cement replacement material by appropriate replacement level. Keywords: Coal bottom ash; Compressive strength; Workability; Replacement material
INTRODUCTION
In developing country like Malaysia, the coal generation power plant is gaining favour
due to the growing need for energy and the call for a clean technology. In the electricity
industry, gas remains the main fuel source for the generation industry, but coal is still become
favourable because it is only viable fuel option in terms of cost and supply (Abubakar &
Baharudin 2012). Coal bottom ash (CBA) is a waste material that disposed after process of
electricity. According to Cheriaf et al. (1999) mention that, CBA qualifies the requirements
of European standard EN 450 for use in concrete. A study carried out by Ghafoori and Bucholc
(1997) revealed that durable concrete could be made with high-calcium CBA as fine
aggregate. CBA is formed when pulverized coal is burned in a dry bottom boiler. The type of
CBA produced depends on the type of furnace and also the origins of coal. From the burning
process of coal, about 80% of the product were captured and recovered as Fly Ash (FA)
meanwhile, the remaining 20% classified as bottom ash (BA).
CBA collected in water-filled hoppers at the bottom of the furnace is physically coarse,
dark grey, granular and porous. At the wet bottom boiler, the CBA is kept in a molten state
and collected when it falls into the ash hopper. Hence, high-pressure water jets immediately
fractures the molten material into crystallized pellets, and it is referred as Boiler Slag. The

MCRJ Special Issue Vol. 4 | No. 2 | 2018 94
other remaining combustion products go out along the flue gas chimney. Figure 1 shows the
combustion of coal to generate bottom ash in a thermal power plant.
Figure 1. The production of coal combustion by-products in steam generating system
(NETL, 2006)
The application of waste materials in concrete replacement has become popular an
interesting topic in many research works. Concrete comprising three major substitutes which
are cement, fine aggregate and coarse aggregate. Cement plays a vital role in concrete
production. Its production is extremely energy-intensive and leads to excessive pollution,
including SO2 and CO2 emissions (Azmi et al. 2017). The current cement production rate is
approximately 1.2 billion tons/year and expected to grow about 3.5 billion tons/year by 2015
(Adesanya and Raheem, 2009). It is also the heaviest pollution industry and accountable for
the 5–6% releases of CO2, which causes about 4% of global warming (Rodrigues and Joekes,
2011). Such an enormous utilization of concrete calls for higher use of natural aggregates and
cement, thus taking a toll on the environment. At least three-quarters of the total volume of
concrete consist of coarse and fine aggregates (Rafieizonooz et al. 2016). Obviously, natural
resources such as river sand are getting depleted (Aghabaglou, Tuyan and Ramyar, 2015).
The prohibition on mining in some areas and the growing need for natural environment
conservation further exacerbate the problem of river sand availability. Although aggregates
are available at relatively low costs in most locales around the globe, availability is not
universal. Some areas may be devoid of good quality sand and gravel, and a few others lack
sources of crushed stone or rocks that can be mined easily and economically (Ramzi Hannan
et al. 2016; Khalid et al. 2017). Furthermore, aggregates available locally may be unsuitable
for use in construction due to poor quality, potential for chemical reaction and low strength.
Therefore, one of the most promising materials for replacing cement and sand material is
coal bottom ash (CBA). CBA is one of the mineral by-product obtained from the combustion
of coal used for power-generation purposes. CBA collected from electrical power generation
is a dark grey, granular, porous and predominantly sand size material. These porous surfaces
and very rough particle structure of CBA makes this material less durable (Bajare et al., 2013).
Many research done use CBA as fine aggregate replacement as reported by Abidin et al.

MCRJ Special Issue Vol. 4 | No. 2 | 2018 95
(2017) and Torkittikul et al. (2017). Hence, with adequate grinding, CBA with pozzolanic
activity can be used as a replacement material in Portland cement production (Cheriaf et al.,
1999). Although grinding of CBA adds many good properties to concrete, it should be kept
in mind that grinding is an expensive and time consuming process (Őzkan et al. 2007). Besides
that, the quantity of coal bottom ash (CBA) to replace the cement for typical application is
limited to 15-20% by mass of the total cementitious material. The small percentage is
beneficial in optimizing the workability and low cost but it may not improve the durability
(Suhendro, 2014).
The objective of this study is to determine the optimum replacement level of ground CBA
in normal concrete. This study covers the physical properties of ground CBA and compressive
strength of concrete incorporation with ground CBA as cement replacement material. The
finding of these study are for further investigation on the use of ground CBA in different mix
design grade.
MATERIAL AND METHOD
Ordinary Portland Cement (OPC) was used in this study supplied by Tasek Corporation
Berhad and were certified by SIRIM compliance to MS EN 197-1:2014. The cement was
stored in watertight drums to prevent unwanted solidification and humidity. The fine
aggregates were used in this study is uncrushed river sand with 5 mm sieve passing.
Meanwhile the coarse aggregate were sieve passing through 10 mm sieve size. The CBA that
used in this study is a by-product from coal combustion process obtained from Kapar Energy
Ventures power plant located at Kapar, Selangor. The original CBA physically dark grey and
gravelly but after ground, the CBA become finer and the distribution size range is between
0.3 um and 40um.
Mix Proportion Design
The mixed design of concrete is very important to ensure the concrete grade design is
successful. In this study, the mixed proportion were design according to British method of
concrete mix design also called DOE method. The mixtures are specified by the weights of
the different materials contained in a given volume of fully compacted concrete. It is assumed
that the volume of freshly mixed concrete is an equal to the sum of the air content and of the
absolute volumes of its constituent materials. Therefore, the DOE method requires that the
absolute densities of the materials be known in order that their absolute volumes may be
calculated. In DOE method, it is assumed that the strength of a concrete mix depends on free
water/cement ratio, coarse aggregate type and also cement properties. The mix proportion
design for this study was tabulated at Table 1 below. The water cement ratio 0.5 was designed
for this mixture. The specimen were prepared for four different volume fraction (0, 10, 20 and
30 %) of ground CBA with three different grinding time which is 20, 30 and 40 hours. The
concrete cube size 100 × 100 × 100 mm were prepared and cured in wet condition for 7 and
28 days. The workability of fresh concrete were tested using slump cone and the slump value
were recorded.

MCRJ Special Issue Vol. 4 | No. 2 | 2018 96
Table 1. Mix proportion design by British DOE method
Cement (kg/m3) Water (kg/m3) Fine aggregate
(kg/m3) Coarse aggregate (kg/m3)
460 230 958 722
Particle Size Distribution
The particle size of ground CBA were conducted using Fritsch Analysette 22 after
grinding process. The analysis method is laser light scattering technique where measuring
range between 0.01 to 2100 μm. The wet method analysis were carried out where the ground
CBA was dispersed in distilled water on the machine and take 5 to 10 second for measuring
time. The testing has been conducted for all 3 different grinding time which is 20, 30 and 40
hours to identify the change of size after grinding process.
Specific Surface Area
These results of surface area were obtain from testing particle size analyser using Fritsch
Analysette 22. The testing is important to analyse different fineness of ground CBA with
different grinding time. Small amount of ground CBA was placed onto machine and directly
measured.
Compression Test
The concrete cube specimen size (100 ×100 ×100 mm) were tested using 3000 kN
hydraulic compression machine. The testing were conducted according to BS EN 12390-3:
2009. The loading rate during testing was constant within range 0.6 ± 0.2 MPa/s. The testing
were carried out for 7 and 28 days curing period. The maximum load were record in N and
compressive strength were expresse by Equation 1 below.
𝑓𝑐 =𝐹
𝐴𝑐 (1)
where:
𝑓𝑐 compressive strength in MPa (N/mm2)
𝐹 maximum failure load in N
𝐴𝑐 cross sectional area of specimen in mm2
RESULT AND DISCUSSION
Particle Size Distribution
Particle size distribution (PSD) analysis is important when particles have high aspect
ratios. PSD analysis are susceptible to large uncertainties due to measurement the smallest. In
this study, the ground CBA was graded using PSD analyzer. The finer particle will increase
the specific surface area of ground CBA then increased the pozzolanic activity in concrete
(Basirun et al.,2017; Hannan et al. 2017).

MCRJ Special Issue Vol. 4 | No. 2 | 2018 97
Figure 2. PSD analysis result for various grinding time of grinded CBA
Figure 2 shows, the particle size was decreased when the grinding time increases. The
smallest particle size is at 40 hours grinding time, which is 1.819 μm, 11.254 μm and 27.356
μm at D10, D50 and D90 respectively compared to the others. While the narrowest particle is
at 30 hours and coarsest particle are at 20 hours grinding time. The narrowest PSD value for
D10, D50 and D90 is 1.948 μm , 15.036 μm and 29.807 μm respectively. Meanwhile, the
coarsest PSD value for D10, D50 and D90 is 2.467 μm, 19.774 μm, and 37.749 μm
respectively.
In general, pozzolanic reactivity of coal ash is directly related to its fineness. The filler
effect of these fine pozzolanic materials is partly responsible for the increasing strength of
concrete. As reported by Cheriaf et al. (1999), the pozzolanic activity of the CBA can be
improved with adequate grinding. Thus, the strength will increase with decreasing particle
size (Walker and Pavía, 2010). Hence, the finest of CBA having a greater contribution towards
the strength of concrete.
Specific Surface Area
Specific surface areas of ground CBA directly obtained from Fritsch Analysette 22
machine and the results are shown in Table 2. The results shows the specific surface area of
ground CBA become larger when grinding time increased to 30 hours and 40 hours. The
specific surface area of 20 hours, 30 hours and 40 hours grinding time is 9627.76 cm2/cm3 ,
12921.92 cm2/cm3 and 13528.18 cm2/cm3 respectively. The specific surface area ground
CBA for 30 hours increased about 1.34 times while 1.40 times for 40 hours compared to 20
hours. This finding is very important to identify and understand the physical characteristic of
ground CBA after grinding process. This outcome is similar with Khalid et al. (2016) on their
report when they grinded POFA.
Table 2. Specific surface area of ground CBA
Parameter 20 hours 30 hours 40 hours
Specific surface area 9627.76 cm2/cm3 12921.92 cm2/cm3 13528.18cm2/cm3
0.00
5.00
10.00
15.00
20.00
25.00
30.00
35.00
40.00
CBA20H CBA30H CBA40H
Par
ticl
e s
ize
(μ
m)
Grinding time (Hour)
D10
D50
D90

MCRJ Special Issue Vol. 4 | No. 2 | 2018 98
Workability of Concrete
Slump test of fresh concrete was performed to ensure its consistency in that specific batch.
The result for slump were shown in Figure 3. The workability of concrete was decrease with
increasing the replacement level of grinded CBA. Increasing the replacement of grinded CBA
will increase the specific surface area thus required more water demand to become workable.
Kim and Lee (2011) also proved that black spots appeared on the surface of the fresh concrete
with bottom ash due to suction of the water and cement paste by bottom ash. This factor also
contributed towards lowering in slump value.
Figure 3. Slump value for ground CBA replacement in cement
Moreover, the workability of the fresh concrete for 40 hour grinding time is the lowest
among the others. The slump decrease about 33% compared with control sample. As the
grinding time increase, the slump value also linearly decreasing. It indicated that, the fine
particle of the ground CBA are also one of the factor that contributes to decreasing the slump
value. Finer particles require more water to wet their larger specific surface thus resulting in
lowering the slump value. A fixed water cement ratio, the hydration process will result
porosity in concrete occurs due to insufficient water demands. As reported by Abidin et al.
(2014), the decrement of slump is because of the porosity of coal bottom ash, which absorbed
more water with higher content of CBA replacement. Thus, increasing the water cement ratio,
it will drop the strength of the concrete. The water cement ratio give major influence on
designing concrete with CBA (Hamzah et al., 2016).
Compressive Strength
The compressive strength of concrete containing ground CBA as cement replacement
material for 20 hours grinding time are shown in Figure 4. The concrete with 10% replacement
level shows the highest compressive strength (37.90 MPa) compared among others
replacements. Compressive strength start decrease at 20% and 30% replacements level about
1.5% and 4% respectively compared with control sample.
0.00
10.00
20.00
30.00
40.00
50.00
60.00
Control CBA10 CBA20 CBA30
Slu
mp
he
igh
t (m
m)
20 H
30 H
40 H
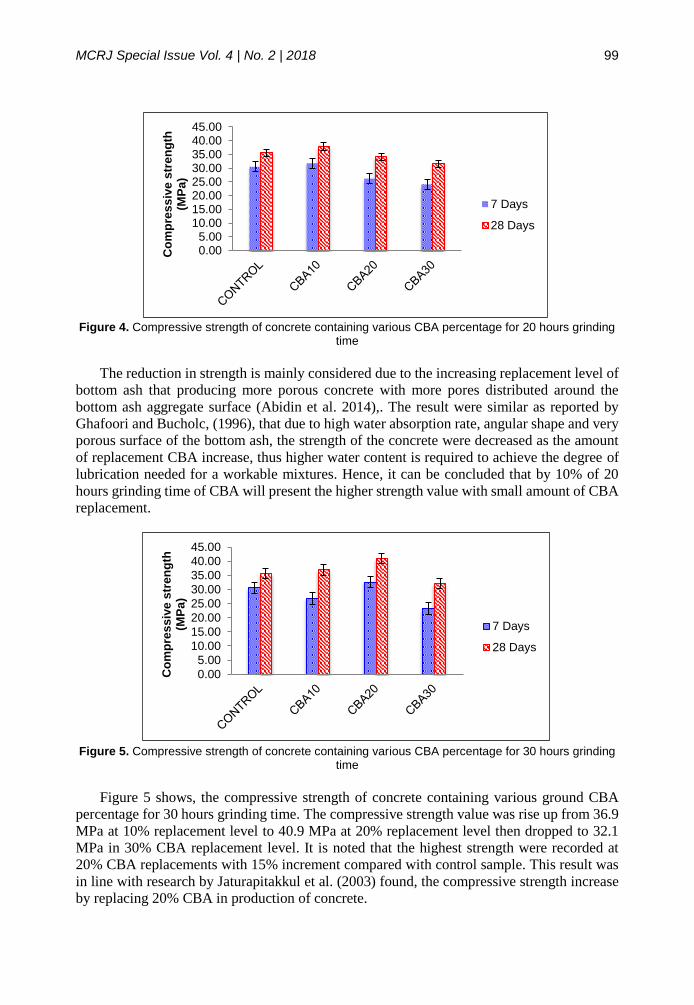
MCRJ Special Issue Vol. 4 | No. 2 | 2018 99
Figure 4. Compressive strength of concrete containing various CBA percentage for 20 hours grinding
time
The reduction in strength is mainly considered due to the increasing replacement level of
bottom ash that producing more porous concrete with more pores distributed around the
bottom ash aggregate surface (Abidin et al. 2014),. The result were similar as reported by
Ghafoori and Bucholc, (1996), that due to high water absorption rate, angular shape and very
porous surface of the bottom ash, the strength of the concrete were decreased as the amount
of replacement CBA increase, thus higher water content is required to achieve the degree of
lubrication needed for a workable mixtures. Hence, it can be concluded that by 10% of 20
hours grinding time of CBA will present the higher strength value with small amount of CBA
replacement.
Figure 5. Compressive strength of concrete containing various CBA percentage for 30 hours grinding
time
Figure 5 shows, the compressive strength of concrete containing various ground CBA
percentage for 30 hours grinding time. The compressive strength value was rise up from 36.9
MPa at 10% replacement level to 40.9 MPa at 20% replacement level then dropped to 32.1
MPa in 30% CBA replacement level. It is noted that the highest strength were recorded at
20% CBA replacements with 15% increment compared with control sample. This result was
in line with research by Jaturapitakkul et al. (2003) found, the compressive strength increase
by replacing 20% CBA in production of concrete.
0.005.00
10.0015.0020.0025.0030.0035.0040.0045.00
Co
mp
res
siv
e s
tre
ng
th
(MP
a)
7 Days
28 Days
0.00
5.00
10.00
15.00
20.00
25.00
30.00
35.00
40.00
45.00
Co
mp
res
siv
e s
tren
gth
(M
Pa
)
7 Days
28 Days

MCRJ Special Issue Vol. 4 | No. 2 | 2018 100
Figure 6. Compressive strength of concrete containing various CBA percentage for 40 hours grinding
time
Figure 6 shows, the compressive strength of concrete containing ground CBA for 40 hours
grinding time. The result shows, highest compressive strength obtained at 10% replacement
level compared with control. Then, the strength was dropped at 20% replacement level and
turn rise up at 30% replacement level. The 10% CBA replacement is the optimum CBA
replacement as expected as it obtained the higher strength value for 40 hours grinding time.
Based on PSD analysis conducted, the sample of CBA subjected to 40 hour grinding time is
the finest particles among the others. The fineness of CBA is important to ensure a dense
microstructure when hardened (Basirun et al., 2017). Chengzhi et al. (1996) have concluded,
the addition of pozzolanic material influences the packing state and decreases the amount of
filling water. This role depends on the fineness of pozzolanic materials.
In addition, finest particles of ground CBA will result high water demand. It can be seen
when the slump height was decrease with increase of ground CBA replacement. This situation
have proven that the CBA absorbed water faster during fresh state. Based on the discussion,
20% CBA of 30 hour grinding time is the selected replacement level as optimum CBA
replacement in cement content. It is due to the high strength concrete grade value obtained
besides minimal grinding time requirements. As mentioned by Pan et al. (2008), annual
cement production in Taiwan is 20 million tons. Hence, by utilizing up to 20% CBA
replacement in their cement production, the amount of cement production will be reduce by
almost 4 million tons per year. Even though the contribution seems small, it is still considered
as sustainability approach in reducing the amount of pollution occurred effect from cement
production industry.
CONCLUSIONS
This paper has been discussed about the influence of fine coal bottom ash as cement
replacement material in normal concrete. There are some conclusions that have been made:
(1) The different grinding time period were changed the physical characterictis of
granular CBA to fineness particle. The size of particle become finness after grinding
process and increase the specific surface area of ground CBA.
(2) The ground CBA have affecting the workability of concrete at fresh state. Workability
of concerete were decreased linearly with increament of grinding time period. It
0.00
5.00
10.00
15.00
20.00
25.00
30.00
35.00
40.00
45.00
CONTROL CBA10 CBA20 CBA30
Co
mp
ress
ive
str
en
gth
(M
Pa)
7 Days
28 Days

MCRJ Special Issue Vol. 4 | No. 2 | 2018 101
related to change of granular CBA to finness particle which specific surface area was
increase and required more water to become workable.
(3) The normal concrete incorporation with ground CBA about 20% replacement level
of cement at 30 hours grinding time shows the highest compressive strength compared
to others. It is because of finness particle of ground CBA can reduce pore structure in
concrete and produce dence packing structure.
(4) Ground CBA is cementitious material that can be used as supplementary cement
material in concrete. The additional finness particle of CBA in concrete will
increasing packing factor which helps minimise the voids and continues pozzolanic
activity in cement matrix.
ACKNOWLEDGMENTS
The authors are acknowledge and thankful to Jamilus Research Center, Faculty of Civil
and Environmental Engineering, University Tun Hussein Onn Malaysia and for permitting us
to used all facilities to complete this study. The authors are also would like to thanks all staff
Department Structural and Material for all support during experimental works.
REFERENCES
Abidin N. E. Z., Jamaluddin, N., Ibrahim, M. H. W., Kamaruddin K. and Hamzah, A. F.
(2017) Slender circular steel tube (CFST) columns filled with self-compacting concrete
incorporating coal bottom ash. Malaysian Construction Research Journal, 21(1):87–95.
Abidin, N. E. Z., Ibrahim, M. H. W., Jamaluddin, N., Kamaruddin, K. and Hamzah A. F.
(2014) The Effect of Bottom Ash on Fresh Characteristic, Compressive Strength and
Water Absorption of Self-Compacting Concrete. Apply Mechanics and Material, 660:
145–151.
Abubakar and Baharudin K. S. (2012) Properties of Concrete Using Tanjung Bin Power.
International Journal of Sustainable Construction Engineering & Technology, 3(2):56-
69.
Adesanya, D. A. and Raheem, A. A. (2009) A study of the workability and compressive
strength characteristics of corn cob ash blended cement concrete. Construction and
Building Materials, 23(1):311–317.
Azmi, N.B., Khalid, F.S., Irwan, J.M., Anting, N., Mazenan, P.N. (2017) A study on the
performance of concrete containing recycled aggregatesand ceramic as materials
replacement. IOP Conference Series: Materials Science and Engineering, 271(012081).
Bajare, D., Bumanis, G. and Upeniece, L. (2013) Coal Combustion Bottom Ash as Microfiller
with Pozzolanic Properties for Traditional Concrete. Procedia Engineering, 57:149–158.
Basirun, N. F., Wan Ibrahim, M. H. and Jamaludin, N. (2017) A Review : The Effect of
Grinded Coal Bottom Ash on Concrete. MATEC Web Conference, 103(01007).
Chenghi, Z., Aiqin, W., Mingshu, T. and Xiaoju, L. (1996) The filling role of pozzolanic
material. Cement and Concrete Research, 26(6): 943–947.
Cheriaf, M., Rocha, J. C. and Pera, J. (1999) Pozzolanic properties of pulverized coal
combustion bottom ash. Cement Concrete Research, 29: 1387–1391.
Ghafoori, N. and Bucholc, J. (1996) Investigation of lignite-based bottom ash for structural
Concrete. Journal Material Civil Engineering, 8 (3):128–137.
Hamzah, A. F., Wan Ibrahim, M. H., Jamaluddin, N., Jaya R. P., Arshad, M. F. and Zainal
Abidin, N. E. (2016) Nomograph of Self-Compacting Concrete Incorporating Coal

MCRJ Special Issue Vol. 4 | No. 2 | 2018 102
Bottom Ash. Journal of Engineering and Applied Sciences, 11 (7):1671-1675.
Hannan, R., N. I. R., Shahidan, S., Ali, N., and Maarof, M. Z. (2017) Comprehensive Review
on the Properties of Coal Bottom Ash in Concrete as Sound Absorption Material. MATEC
Web Conference, 103(01005).
Khalid, F.S., Azmi, N.B., Sumandi, K.A.S.M., and Mazenan, P.N. (2017) Mechanical
properties of concrete containing recycled concrete aggregate (RCA) and ceramic waste
as coarse aggregate replacement. AIP Conference Proceedings, 1891(020079):1-5.
Mardani Aghabaglou, A., Tuyan, M. and Ramyar, K. (2015) Mechanical and durability
performance of concrete incorporating fine recycled concrete and glass aggregates.
Material Structures, 48:2629–2640.
National Energy Technology Laboratory (NETL) (2006) Clean coal technology: Coal
utilization by-products. Report no. 24, Department of Energy Office of Fossil Energy,
Washington DC.
Nur Hafizah A. Khalid, Mohd W. Hussin, Jahangir Mirza, Nur Farhayu Ariffin, Mohamed A.
Ismail, Han-Seung Lee, Azman Mohamed, Ramadhansyah Putra Jaya (2016) Palm oil
fuel ash as potential green micro-filler in polimer concrete. Construction and Building
Materials, 102:950-960.
Őzkan, Őmer, Yűksel, I. and Muratoģlu, Őzgűr (2007) Strength properties of concrete
incorporating coal bottom ash and granulated blast furnace slag. Waste Management,
27(2):161–167.
Pan, J. R., Huang, C., Kuo J. J. and Lin, S. H. (2008) Recycling MSWI bottom and fly ash as
raw materials for Portland cement. Waste Management, 28(7):1113–1118.
Rafieizonooz, M., Mirza, J., Salim, M. R., Hussin, M. W. and Khankhaje, E. (2016)
Investigation of coal bottom ash and fly ash in concrete as replacement for sand and
cement. Construction and Building Materials, 116:15–24.
Ramzi Hannan, N. I. R., Shahidan, S., Maarof, M. Z., and Ali, N. (2016) Physical and
Chemical Properties of Coal Bottom Ash (CBA) from Tanjung Bin Power Plant. IOP
Conference Series: Materials Science and Engineering, 160(1).
Rodrigues, F. A. and Joekes, I. (2011) Cement industry: sustainability, challenges and
perspectives, Environmental Chemistry Letter, 9:151–166.
Suhendro, B. (2014) Toward green concrete for better sustainable environment. Procedia
Engineering, 95:305–320.
Torkittikul, P., Nochaiya, T., Wongkeo, W. and Chaipanich A. (2017) Utilization of coal
bottom ash to improve thermal insulation of construction material. Journal of Material
Cycles and Waste Management, 19(1):305-317.
Walker, R. and Pavía, S. (2010) Behaviour and Properties of Lime-Pozzolan Pastes.
Proceeding of 8th International Masonry Conference, Dresden University of Technology,
Germany, 353-362.

MCRJ Special Issue Vol. 4 | No. 2 | 2018 103
THE EFFECT OF ASPHALT DUST WASTE ON THE RHEOLOGICAL PROPERTIES OF SELF COMPACTING CONCRETE Isham Ismail1, Shahiron Shahidan1, Norwati Jamaluddin1 and Aeslina Abdul Kadir1 1Jamilus Research Center,Faculty of Civil and Environmental Engineering, Universiti Tun Hussein Onn Malaysia, 86400 Batu Pahat, Johor, Malaysia
Abstract Development of Self Compacting Concrete (SCC) is significantly important in the construction industry while it greatly involved in recycled of powder waste material in improving rheological properties. Utilizing powder waste produced from asphalt batching plant so called Asphalt Dust Waste (ADW) was an alternative solution to reduce this waste material that cause pollution to surrounding dumping area. The aims of this study were to evaluate the optimum percentage of ADW as filler in coarse aggregate and the effect of ADW as cement replacement in develops SCC. The investigation focus on rheological performance at fresh state that was subjected to slump flow diameter, J Ring test, L Box and V Funnel test. Meanwhile, the hardened test was subjected to compressive strength and tensile strength at 7 and 28 days only. Difference percentage of ADW are 0%, 10%, 20%, 30%, 40% and 50%, has been incorporated into course aggregate by mass as a filler. The results shows 30% ADW as filler give the best performance on fresh state SCC. Base on 30% ADW filler, the potential of ADW as cement replacement at 0%, 10%, 20%, 30%, 40% and 50% were studied. According to the results obtained, utilizing ADW as filler and cement replacement in develop SCC was benefit for high workability, stability and segregation resistance in fresh state conditions. The results shows that 30% ADW as filler to aggregate content having better fresh performance, 10% ADW as cement replacement having 63 MPa and 50% cement replacement achieves minimum target of compressive strength which is 30 MPa. As conclusion, the utilization of ADW for the production of self compacting concrete is perfectly possible and also potentially reducing amount of cement in concrete mixture with high workability. Keywords: Self compacting concrete; Powder filler; Cement replacement; Asphalt dust waste
INTRODUCTION
Concrete is the most commonly used in construction materials. Normal vibrated concrete
is the common materials used in infra structure and building constructions. However, normal
vibrated concrete create vibration impact to the workers during placing the concrete in long
term effect. This given the importance reason to the industry in search for more efficient
technologies and optimized resources (Mashitah et al., 2009; Ramli and Dawood, 2010;
Martín et al,. 2013; Ibrahim et al., 2015; Ramzi et al., 2016; Senin et al., 2016; Bunnori and
Jamil, 2016; Shahidan et al., 2016; Khalid et al., 2017). Self compacting concrete (SCC) was
the latest technology introduce in 1988 in Japan to achieve durable concrete due to the
shortage of skill workers in placing the concrete at construction site. It is not only provide
durable concrete but also improve rheology properties in term of workability, stability and
segregation resistance (Okamura and Ouchi 2003; EFNARC, 2002; Razak et al., 2008;
Nuruddin et al., 2013; Ernida et al., 2017). The used of SCC have been extended around the
world due the advantages in fresh state and high performance of hardened concrete. In fresh
state condition, this concrete having high workability and stability to flow into the formwork
by it own weight without segregation even in highly reinforce concrete structures. Beside
that it give freedom of design work, reduce construction time and minimize workers on site
that indirectly contribute to benefit overall cost (Silva et al., 2016). This type of concrete

MCRJ Special Issue Vol. 4 | No. 2 | 2018 104
allows the used of waste materials from industrial or construction as a binder or filler. This
is a part of contribution to reduce waste on the environment (Ismail et al., 2016; Tennich et
al., 2017; Da et al., 2017).
There are many type of alternative waste powder in development of SCC. The most
common addition materials are Fly Ash (FA), Silica Fume (SF), ground granular blast
material (GBFS), Lime Stone powder (LS) and Rice Ash (Aruntas, 2014; Rahman et al.,
2014; Saleh Ahari et al., 2015; Zhu et al., 2016; Benjeddou et al., 2017; Mohammed et al.,
2017; Da et al., 2017). Until today, the revolution of utilizing waste powder as filler material
in SCC constantly evolving. Researchers are looking for potential and economic waste
materials that can perform in fresh state and hardened SCC.
Waste production from asphalt premix batching plant especially in sedimentation pond
or wet site disposal is a major issue towards the environmental nowadays. This mineral ash
wastes are come from surface aggregate that have been trapped using water sprinkler during
production of bituminous or asphalt mixture and end up in sediment pond in premix batching
plant area. It is namely call as Asphalt Dust Waste (ADW) as an alternative powder mineral
for further research in development sustainable self compacting concrete. As conclusion, this
mineral powder is not related with a fly ash that was produce from coal burning process in
generator power plant (Acar and Atalay, 2016; Shahidan et al., 2017; Ismail and Shahidan,
2017). In Spain, the similar waste ends up in landfills in large amount. It is estimated about
4% of the asphalt mixture production produce ADW at asphalt mixture batching plant. It is
abundant material that cannot be used for anything. Therefore, the potential of using ADW
were explored and investigated for fresh state and hardened state of SCC by a group of
researchers from Spain. It was found that, the utilization of this mineral powder as a filler
was successful but depending on mix design ratio. Further more, this mineral waste are
mostly a limestone characteristic according X-ray analysis and it is proven utilizing mineral
waste with high incrustations of calcite will present satisfactory results compare with others
commercial filler (Martín et al., 2013). In line with this study, another researchers from
United Kingdom and Cyprus also using similar powder to produce normal vibrated concrete
and not for self compacting concrete. In 2010, it is estimated the amount of powder waste in
Cyprus alone was 230,000 tonnes. It is also being disposed in landfills and ends up create
problem to the environment. Base on X-ray diffraction this dust having characteristic of
limestone powder whish was Calcium Oxide (CaO). This research focuses on potential using
recycled lime stone powder (RCL) as cement replacement ranging from 5% to 20% in mortar
mixture. The increase in cement replacement has reduced the average compressive strength
of each mix. Moreover, the 5% and 8% cement replacement in concrete mixture also shows
reduction in compressive strength (Kanellopoulos et al., 2014). Therefore, the exploration
for development of SCC might be useful to fully utilized amount of ADW to reduce the
environmental impact and produce economic sustainable SCC for better future.
This review give a detailed information on previous research that using almost similar
by product powder waste material generated from process of asphalt premix production in
production of normal vibrated concrete (NVC) and self compacting concrete (SCC).
However, there are very limited researches available on utilizing ADW in self compacting
concrete especially utilizing local ADW in Malaysia. Therefore, the potential of recycled
waste in production SCC such as ADW are need to be explored for the benefit of economic
and environmental issue. The variety of mix design for SCC due to various constituent

MCRJ Special Issue Vol. 4 | No. 2 | 2018 105
materials ratio also one of the reason to continue with this research. Furthermore, the effect
of ADW in fresh properties are also important to be understand in order to set the water
binder ratio in each mixture to avoid bleeding to fresh SCC (Su et al., 2001; Domone, 2006;
Alyamaç & Ince, 2009; Md Nor et al., 2011; Parra et al., 2011; Khaleel & Abdul Razak,
2014; Thanh et al., 2015; Leman et al., 2016)
Therefore, the aim in this study is to simultaneously explore the potential of using local
ADW in SCC as a filler material and cement replacement to archive minimum 600 mm slump
flow. In details, the rheology properties in fresh state have been evaluated according to flow
ability (slump flow diameter, t500), blocking resistance (J Ring test, L Box test) and resistant
to segregation (V Funnel) through out 12 of SCC mixtures. Furthermore, the effect on the
hardened properties focus on compressive strength and tensile strength was also investigated.
As a result, the goal of this study is not only contributes to conforming the combination in
optimization of ADW as filler and cement replacement in SCC but also introduce the
efficiency to indicate the water binder ratio by utilizing ADW powder.
MATERIALS
This study was focus on obtaining a self compacting concrete by utilizing ADW as a
filler material and potential as cement replacement. Local Ordinary Portland cement type 1
according to MS EN 197-1, CEM I 42.5 N was used in all mixtures. The granular materials
are 4 mm passing fine aggregate (natural river sand) and maximum 12 mm course
aggregate as shown in Figure 1. The ADW and 12 mm aggregate are from similar premix
batching plant. The initial water cement ratio was 0.3 and using superplasticizer Sika
ViscoCrete 2044 at 2% by weight from cement content.
Figure 1. Sieve analysis for 4 mm natural river sand and 12 mm aggregate
In Figure 2, SEM image show the morphology of ADW. Obviously, the particles size of
ADW is less than 10 μm and the physical properties almost similar with course aggregate
material that is angular and irregular shape. Theoretically, powder less than 0.125 mm is
suitable for improving packing factor and also influence in flow ability during fresh state of
SCC (Felekoǧlu et al., 2006; Corinaldesi and Moriconi, 2011; Singh et al., 2016; Mohammed
et al., 2017). Therefore, the performance of ADW in fresh state and hardened state are
important to be investigated.

MCRJ Special Issue Vol. 4 | No. 2 | 2018 106
Figure 2. SEM image of ADW
The characteristics and chemical properties of constituent materials are important to be
measured and identified in development of SCC. This information will lead to the expected
outcome of fresh state condition and related to hardened performance. Therefore, the
chemical properties of constituent material are measured using X-ray fluorescence (XRF) as
shown in Table 1. It is clearly shown that ADW was not part of pozzolanic material compare
to OPC cement and limestone powder that was obtain from previous researchers from Spain
and Cyprus (Martín et al., 2013; Kanellopoulos et al., 2014). Eventhough, the powder was
obtained from similar concept by product waste but the characteristics of the powder are
totally depending on the type of the aggregate used in premix batching plant. The local
powder (ADW) is having similar chemical characteristic with 12 mm aggregate used in this
research. This similarity confirmed that the source of ADW was surface dust that was blown
out from the aggregate during production of premix mixture and trapped in retention pond.
As conclusion, this local powder was nothing but it is the dust coated on the aggregate surface
after fractured process during production of aggregate through blasting and crushing at stone
quarry. Since, this local powder was not pozzolanic material, therefore it is part of challenge
in this study to fully utilized this powder as filler and also make it as a paste for cement
replacement.
Table 1. The chemical properties for constituent materials
Properties OPC cement ADW Aggregate River sand
Calcium Oxide, (CaO) 55.60 % 2.98 % 1.85 %
-
Silicon Dioxide, (SiO2) 14.20 % 44.00 %
43.70 %
30.10 %
Aluminum Oxide, (Al2O3) 3.68 % 9.22 % 8.50 %
2.13 %
Iron (III) Oxide, (Fe2O3) 3.49 % 4.24 % 3.38 %
0.30 %
Sulfur Trioxide, (SO3) 3.20 % - - -
Magnesium Oxide, (MgO) 1.48 % 0.62 % 0.49 %
-
Carbon, (C) 1.00 % 1.00 % 1.00 %
1.00 %
Potassium Oxide, (K2O) 0.48 % - - 0.19 %
Zirconium Dioxide, (ZrO2) - - - 0.47 %
Titanium Dioxide, (TiO2) - 0.46 % 0.39 %
0.32 %
METHODS
The main objective of this study was to investigate the potential of ADW as filler material
and cement replacement in SCC. The ADW was collected from dumping area that was taken

MCRJ Special Issue Vol. 4 | No. 2 | 2018 107
out from retention pond at local premix batching plant. The ADW have been dried using
conventional method, which refer to dry under the sun for one day to remove moisture
content. This is very important process to make sure the ADW totally became powder
material with is suitable for development of SCC. Since, there is no special treatment applied
in this process, it make ADW powder are economy and sustainable to be recycled in concrete
material. Besides that, the powder also less than 0.125 mm and make it suitable for paste
material in SCC.
The characteristic for fresh state SCC was refer to (EFNARC, 2002) and cluster
according to (EPG, 2005) as shown in Table 1.
Table 1. Requirement for fresh properties
Fresh test Acceptance criteria
EFNARC EPG
Slump flow 650 – 800 mm 520 – 700 mm / class SF1 640 – 800 mm / class SF2 740 – 900 mm / class SF3
T 500mm slump flow 2 – 5 sec ≤ 2 sec / VS1 > 2 sec / VS2
J Ring 0 – 10 mm -
V Funnel 8 – 12 sec ≤ 8 sec / class VF1 9 – 25 sec / class VF2
V Funnel T 5min 11 – 15 sec -
L Box H2/H1 = 0.8 to 1.0 H2/H1 ≥ 0.75 / class PA1 H2/H1 < 0.75 / class PA2
The dosage of constituent materials was studied from a method suggested by previous
researchers with modifications base on similarity of powder materials used (Okamura and
Ouchi, 2003; Dinakar et al., 2008; Alyamaç and Ince, 2009; Gesoǧlu et al., 2012; Singh et
al., 2016). Local Ordinary Portland cement type 1 according to MS EN 197-1, CEM I 42.5
N was used in all mixtures. The granular materials used are 4 mm passing fine aggregate
(natural river sand) and maximum 12 mm course aggregate. The initial water cement ratio
was at 0.3 and using superplasticizer Sika ViscoCrete 2044 at 2% fix from cement content
by weight.
Figure 3. Stage of experimental works

MCRJ Special Issue Vol. 4 | No. 2 | 2018 108
This experimental work was carried out in three stages as shown in Figure 3. The first
stage was conducted to evaluate the saturated water binder ratio on paste material by
measuring the slump flow diameter and observe bleeding effect. The paste material is
referring to amount of cement and ADW in mixture. The bleeding effect was the indicator
for saturated water binder ratio. This result will be useful to estimate the amount of water
demand in each SCC mixture. The amount of cement was fix to 10 kg in each mixture, 2%
of SP by weight of cement and increase amount of ADW by accumulative 1 kg to the next
mixture as shown in Table 2. The weight ratio (WR%) for cement and ADW will be used to
estimate the water demand and the potential for cement replacement in stage 2 and stage 3.
The second stage consisted of the evaluation of ADW as filler material in course
aggregate. The designation of the mixtures were SCC DA% at weight percentage 0%, 10%,
20%, 30%, 40% and 50% to aggregate content as shown in Table 3. The proportion of ADW
was calculated base on weight percentage of course aggregate in the mixtures. This is to
evaluate the influence of ADW to bond and carry the aggregate and sand in conjunction with
flowability, stability and segregation resistance at fresh state SCC.
Table 2. Mix proportions for paste
Mixtures Cement (kg) ADW (kg) Cement WR%
ADW WR%
2% SP (liters)
P0 10 0 1.0 0 0.2 P10 10 1 0.91 0.09 0.2 P20 10 2 0.83 0.17 0.2 P30 10 3 0.77 0.23 0.2 P40 10 4 0.71 0.29 0.2 P50 10 5 0.67 0.33 0.2
The third stage was continuity from stage two that was using the optimum 30% ADW as
filler in SCC. This intent, 30% ADW in each mixtures as filler to achieve SCC slump flow
base on evaluation from fresh and hardened performances at stage two. The designation of
the mixtures were SCC DA30/CR% at weight percentage 0%, 10%, 20%, 30%, 40% and
50% as shown in Table 4. In this study, the ADW-CR was assumed to be part of cementitious
material. Therefore, the amount of water was consistence even though the amount of cement
was reducing in each mixture. However, the amount of SP is calculating base on amount of
cement only. All mixtures are produced using vertical concrete mixer.
Table 3. Mix proportions for ADW as filler material (SCC DA)
Mixtures Cement
(kg)
Course Aggregate
(kg)
Sand (kg)
ADW as filler (kg)
Water (kg)
2% SP (liters)
SCC DA0
400 785 865
0 120
8
SCC DA10 78.5 143.55
SCC DA20 157 167.1
SCC DA30 235.5 190.65
SCC DA40 314 214.2
SCC DA50 392.5 237.75

MCRJ Special Issue Vol. 4 | No. 2 | 2018 109
Table 4. Mix proportions for ADW as cement replacement (SCC 30DA/CR)
Mixtures Cement
(kg) ADW as CR (kg)
Course Aggregate
(kg)
Sand (kg)
ADW as filler (kg)
Water (kg)
2% SP
(liters)
SCC DA30/CR0 400 0
785 865 235.5 190.65 8
SCC DA30/CR10 360 40
SCC DA30/CR20 320 80
SCC DA30/CR30 280 120
SCC DA30/CR40 240 160
SCC DA30/CR50 200 200
Once the self compactability of the mixes was obtained, the fresh properties of SCC were
measured and evaluated. The details fresh properties test as shown in Figure 4. The slump
flow test measured the slump flow diameter and time to reach 500mm diameter (t500) using
Abraham slump cone apparatus. The J Ring test is similar to slump flow test but it having
ring outside the slump cone to measure segregation resistant and stability of SCC. The V
Funnel test is subjected to stability and also can be used to observe the segregation of SCC.
Finally, the L Box test is to monitor and observe the blockage, stability and segregation
resistance.
Figure 4. Fresh properties test (a) slump flow, (b) J Ring (c) V Funnel and (d) L Box
The compressive strength was measured according to BS EN 12390-3:2009 by means of
100 mm cube and tensile strength according to BS EN 12390-6:2009 by means of 100 mm
diameter cylinder (200 mm high). Both hardened test are measured at 7 and 28 days only.
RESULTS AND DISCUSSION
In the first stage, the evaluation for saturated slump flow was measured in paste study by
increasing w/b ratio into various percentages ADW as shown in Figure 5. The difference w/b
ratios were test to the paste mixture to estimate the saturated w/b ratio for stage 2 and stage
3. As far as the characteristic fresh SCC parameter concerned, the slump flow value must
achieve minimum 550 mm diameter.

MCRJ Special Issue Vol. 4 | No. 2 | 2018 110
Figure 5. Effect of w/b ratio on slump flow in paste study
The slump flow diameter was clustered in three zones to estimate the w/b required before
it turn to bleeding effect. In zone 1, paste using ADW 9% and ADW 16% achieve 550 mm
diameter slump at w/b 0.25. However, these mixtures show high viscosity at low percentage
powder, which is not good for stability of SCC. The time for 500 mm flow was too fast and
less than one second. Therefore, the amount of ADW should be increase in stage 2 and stage
3 for better stability and economy benefit in paste and utilizing ADW as alternative powder
in SCC.
Even though zone 3 shows better value of slump flow in paste study, it is better to
consider saturated w/b ratio as 0.3 for stage 2 and stage 3 SCC. Throughout observation, it
is found that w/b ratio more than 0.3 has clearly shown bleeding effect in all paste. Therefore,
zone 3 can be classified as bleeding zone for 2% SP in various ADW percentages.
As conclusion, the suitable saturated w/b ratio was 0.3 before the paste start showing
bleeding in mixtures using 2% SP. Interestingly, the paste studied shown better stability as
increasing amount of ADW% through observation and fulfill self compactability
requirements. Consequently, it shows potential result to increase ADW percentage in stage
2 and stage 3 studies. The saturated slump flow for Zone 2 was 750 mm diameter for 9% to
16% ADW and 900 mm diameter for ADW more than 20%. However, this saturated slump
flow will reduced in SCC stage 2 and stage 3 due to water absorption from granular material.
According to stage 1, the final mixes were prepared for evaluation ADW as filler in
aggregate for SCC in stage 2. The fresh properties of ADW as filler material are shown in
Table 5. From the observation during fresh state, SCC DA30 have the best performance in
term of filling ability, passing ability and stability (segregation resistance). The SCC DA30
has great flow ability (750 mm diameter), good passing ability as shown from J Ring and L
Box test result. It is subjected to the ability of ADW as a paste binder to carry and transport
the granular materials in gravity flows under their own weight. The shorter time flows
indicated that the SCC DA30 having a low viscosity that makes this mixture easy to flow
and passing the reinforcement without segregation (EFNARC, 2002). The most important
thing, it is also having a good stability in V Funnel test, which mean the granular materials
are not separated while transported in vertical direction and stable with friction effect from

MCRJ Special Issue Vol. 4 | No. 2 | 2018 111
the V Funnel wall. Furthermore, it was confirmed that, there are no segregation to the mixture
after passing the trapdoor and no segregation happened due to the impact of 500 mm vertical
drop from the V Funnel opening trap door to the base floor.
Table 5. Fresh properties for ADW as filler material
Mixtures Slump performance J Ring V Funnel L Box
Flows t500 (sec)
0 sec 5min H2/H1 t20 t40
SCC DA0 450 - - - - - - - SCC DA10 550/SF1 8/VS2 500 15/VF2 18/VF2 0.7/PA1 4 7 SCC DA20 650/SF2 5/VS2 600 10/VF1 12/VF2 0.9/PA1 2 4 SCC DA30 750/SF2 2/VS1 700 6/VF1 7/VF1 1/PA1 1 2 SCC DA40 650/SF2 4/VS2 630 9/VF1 13/VF2 0.9/PA1 2 4 SCC DA50 550/SF1 5/VS2 520 10/VF1 13/VF2 0.9/PA1 2 4
The development of hardened properties for compressive strength and tensile strength
for stage 2 are presented in Figure 6. The increasing percentage of ADW as filler material in
develops SCC has shown significant contribution in fresh and hardened properties. Even
though SCC DA0 having slump flow diameter less than 550 mm but it is very high
workability compare to normal concrete and it is under characteristic of high flow able
(Elyamany et al., 2014). The SCC DA 30 achieves 57.9 MPa compressive strength, 4.03 MPa
splitting tensile strength and meats the entire SCC requirement. Although the SCC DA20
reach higher compressive strength values after 28 days, it has less slump flow diameter and
time flow more than 2 seconds. Furthermore, increasing percentage of ADW to 40% and
50% has shown decreasing of fresh properties especially in slump flow diameter but it is
within acceptable range. As conclusion in stage 2, the 30% ADW was the optimum filler for
maximum slump flow diameter and having better fresh properties in SCC with related to 0.3
w/b ratio and 2% SP to cement content. Therefore, the value 30% from 12 mm course
aggregate content was the best for utilizing ADW as alternative filler material in SCC.
Figure 6. Compressive strength and tensile strength for SCC DA%
In stage 3, the fresh properties of ADW as filler material are shown in Table 6. The ADW
has been maintained 30% as filler to aggregate content for 750 mm diameter slump flow and
ADW was also design as part of cement replacement by weight. The SCC DA30/CR0 in
stage 3 and SCC DA30% in stage 2 was the same proportions. It was found that, the fresh
and hardened state for both mixtures is almost the same even though there are in difference
mix times. This similarity performance has proven consistency of the mix design.

MCRJ Special Issue Vol. 4 | No. 2 | 2018 112
Table 6. Fresh properties for ADW as cement replacement
Mixtures Slump performance J Ring V Funnel L Box
Flows t500 (sec) 0 sec 5min H2/H1 t20 t40
SCC DA30/CR0 750/SF2 2/VS1 650 8/VF1 9/VF1 1/PA1 1 2 SCC DA30/CR10 750/SF2 2/VS1 650 9/VF1 9/VF1 1/PA1 1 2 SCC DA30/CR20 650/SF2 4/VS2 600 10/VF1 11/VF2 1/PA1 2 4 SCC DA30/CR30 650/SF2 5/VS2 600 10/VF1 12/VF2 0.9/PA1 3 5 SCC DA30/CR40 650/SF2 6/VS2 600 11/VF2 13/VF2 09/PA1 4 6 SCC DA30/CR50 650/SF2 6/VS2 600 11/VF2 13/VF2 0.9/PA1 4 6
The development of hardened properties for compressive strength and tensile strength
for stage 3 are presented in Figure 7. The performance of ADW as cement replacement has
drawn back for fresh and hardened state while maintaining w/b ratio 0.3 and 2% of SP from
cementitious component. It has shown reduction of slump flow, compressive strength and
splitting tensile strength proportion to increasing of ADW as cement replacement. However,
the slump flow diameter is above 650 mm for all mixtures in this stage and almost similar
with previous research (Uysal and Sumer, 2011; Vijayalakshmi et al., 2013; Singh et al.,
2015). The reductions of slump flow were due to water demand from ADW in cement
replacement. Base on previous study, increase w/b ratio will increase slump flow, influence
bleeding, reduce compressive strength and reduce others SCC hardened performance
(EFNARC, 2002).
Figure 7. Compressive strength and tensile strength for SCC DA30% CR%
However, utilizing of ADW as cement replacement at low replacement percentage shows
a good performance. Replacement 10% ADW has reduction of strength at 3.2%, saving 10%
of cement content, compressive strength more than 60 MPa, 700 mm slump flow diameter
and passing acceptable fresh properties requirement. Furthermore, 20% replacement was also
benefit to up to 20% saving cement content with all fresh properties in acceptable range and
compressive strength more than 50 MPa. Finally, utilization 30% cement replacement was
also benefit to recycled waste in production of sustainable SCC compared with other recycled
powder (Uysal and Yilmaz, 2011; Vijayalakshmi et al., 2013; Singh et al., 2016).
As conclusion, this result was satisfied when 50% cement replacement achieved 30 MPa
compressive strength and 2.61 MPa splitting tensile strength at 28 days compared with other
researchers (Kanellopoulos et al., 2014; Grabois et al., 2016; Alyhya et al., 2016). It is also
fulfill the requirement for fresh properties with 650 mm diameter and was confirmed easy to

MCRJ Special Issue Vol. 4 | No. 2 | 2018 113
flow and having good stability. In summary, all mixtures in stage 3 are in acceptable range
for fresh properties. Finally, this is part of contribution to economy design for utilizing waste
as filler and also part of cement replacement in production of sustainable SCC
(Vijayalakshmi et al., 2013; Singh et al., 2016).
CONCLUSION
The aim of this work was to utilizing asphalt dust waste (ADW) as filler material into 12
mm course aggregate content and also introducing ADW as cement replacement for
sustainable SCC.
It was found that the 900 mm slump flow of paste study has been reduce to 650 mm to
750 mm diameter in SCC stage 2 and stage 3. This reduction are within 27% to 17%
depending on percentage of ADW in mixtures. The slump flow reduction was due to water
absorption from granular materials during mixing process.
In filler studies, the optimum compressive strength for 28 days was 70.9 Mpa at 20%
ADW with 650 mm slump flow diameter. On the other side of fresh state evaluation, the 30%
ADW was the optimum slump flow for 750 mm diameter and compressive strength was 57.9
Mpa. Utilization 50% ADW as filler in SCC was succesfull achievement for such sustainable
SCC utilizing by product waste.
In cement replacement studies, the 10% cement replacement shows very good potential
in term of low range replacement. It is not only performed in hardened state but also in fresh
state of SCC compared to control SCC DA30/CR0. However, increasing CR percentage will
significantly reduce the hardened strength but it having good quality of fresh properties for
general purpose and application.
ADW can be utilized as filler into aggregate content and also can be used as cement
replacement. The use of powder waste from asphalt premix plant not only reduce
environmental impact but also create cost benefit while ADW were not reused and disposed
to the landfill previously. It is also an alternative and possible option to reduce natural
resources and create economy saving as well.
ACKNOWLEDGEMENT
The authors gratefully acknowledge the Ministry of Higher Education Malaysia (MOHE)
for providing financial support for authors and to Universiti Tun Hussein Onn Malaysia
(UTHM) for providing the resources needed to complete this paper.
REFERENCES
Abidin, N.E.Z., Jamaluddin, N., Ibrahim, M.H.W., and A.F.H. (2017) Slender Circular Steel
Tube (CFST) Columns Filled with Self-Compacting Concrete Incorporating Coal Bottom
Ash. Malaysian Construction Research Journal, 21(1):85-95.
A. B. and Aruntas, H.Y. (2014) Workability and Mechanical Properties of Self-Compacting
Concretes Containing LLFA , GBFS and MC. Constuction and Building Materials.
73:626-635.

MCRJ Special Issue Vol. 4 | No. 2 | 2018 114
Acar, I. and Atalay, M.U. (2016) Recovery Potentials of Cenospheres from Bituminous Coal
Fly Ashes. Fuel, 180:97-105.
Ali Huddin Ibrahim, Choong Kok Keong, Megat Azmi Megat Jahari, R. N. R. and K. S. A.
(2015) Comparative study on chemical composition of coal ash amongs malaysian coal-
fired power plants. Malaysian Construction Research Journal, Vol.17(2):69-78.
Alyamaç, K.E. and Ince, R. (2009) A preliminary concrete mix design for SCC with marble
powders. Construction and Building Materials, 23(3):1201-1210.
Alyhya, W.S., Abo Dhaheer, Al-Rubaye, M. M. and Karihaloo, B. L. (2016) Influence of Mix
Composition and Strength on The Fracture Properties of Self-Compacting Concrete.
Construction and Building Materials, 110:312-322.
Benjeddou, O., Chokri Soussi, Malek Jedidi and Mohamed Benali. (2017) Experimental and
Theoretical Study of The Effect of The Particle Size of Limestone Fillers on The
Rheology of Self-Compacting Concrete. Journal of Building Engineering, 10:32-41.
Bunnori, M.N.M.J. and N.M. (2016) Reuse of Sewage Sludge Ashes in Cement Mortar
Mixtures on Varies Incinerated Temperatures. Malaysian Construction Research Journal,
18(1):91-103.
Corinaldesi, V. and Moriconi, G. (2011) The Role of Industrial By-Products In Self-
Compacting Concrete. Construction and Building Materials, 25(8):3181-3186.
Da Sila Magalhaeas, M., Faleschini, F., Pellegrino, C. and Brunelli, K. (2017) Cementing
Efficiency of Electric Arc Furnace Dust in Mortars. Construction and Building Materials,
157:141-150.
Dawood, M.R. and E.T. (2010) Performance of High Strength Flowing Concrete Containing
Steel Fibre. Malaysian Construction Research Journal, 6(1):29-38.
Dinakar, P., Babu, K.G. and Santhanam, M. (2008) Durability Properties of High Volume Fly
Ash Self Compacting Concretes. Cement and Concrete Composites, 30(10):880-886.
Domone, P.L. (2006) Self-compacting concrete: An Analysis of 11 Years of Case Studies.
Cement and Concrete Composites, 28(2):197-208.
EFNARC. (2002) Specification and Guidelines for Self-Compacting Concrete. United
Kingdom.
Elyamany, H.E., Abd Elmoaty, A.E.M. and Mohamed, B. (2014) Effect of Filler Types on
Physical, Mechanical and Microstructure of Self Compacting Concrete and Flow-able
Concrete. Alexandria Engineering Journal, 53(2):295-307.
EPG. (2005) ERMCO The European Guidelines for Self-Compacting Concrete. The
European Guidelines for Self Compacting Concrete.
Felekoǧlu, B., Tosun, K., Baradan, B., Altun, A. and Ulyugan, B. (2006) The Effect of Fly
Ash and Limestone Fillers on The Viscosity and Compressive Strength of Self-
Compacting Repair Mortars. Cement and Concrete Research, 36(9):1719-1726.
Gesoǧlu, M. et al. (2012) Fresh and hardened characteristics of Self Compacting Concretes
Made With Combined Use of Marble Powder, Limestone Filler And Fly ash.
Construction and Building Materials, 37:160-170.
Grabois, T.M., Cordeiro, G.C. and Toledo Filho, R.D. (2016) Fresh and Hardened-State
Properties of Self-Compacting Lightweight Concrete Reinforced With Steel Fibers.
Construction and Building Materials, 104:284-292.
Hashim Abdul Razak, W.H.S. and C.H.K. (2008) The Potential of Calcined Malaysian Kaolin
as A Pozzolanic Admixture for Concrete. Malaysian Construction Research Journal,
3(2):23-36.
Ismail, I., Jamaluddin, N. and Shahidan, S. (2016) A Review on Performance of Waste
Materials in Self Compacting Concrete (SCC). Journal Teknologi (UTM), 5:29-35.

MCRJ Special Issue Vol. 4 | No. 2 | 2018 115
Ismail, I. and Shahidan, S. (2017) A Preliminary Modified Volumetric Mix Design for Self-
Compacting Concrete ( SCC ) by Utilizing Asphalt Dust Waste ( ADW ). Proceeding of
International Symposium on Civil and Enviromental Engineering, 103:1008.
Kanellopoulos, A., Nicolaides, D. and Petrou, M.F. (2014) Mechanical and Durability
Properties of Concretes Containing Recycled Lime Powder and Recycled Aggregates.
Construction and Building Materials, 53:253-259.
Khaleel, O.R. and Abdul Razak, H. (2014) Mix Design Method for Self Compacting
Metakaolin Concrete with Different Properties of Coarse Aggregate. Materials and
Design, 53:691-700.
Khalid, F.S., Irwan, J. M., Othman, N., And Ibrahim, M.H.W. (2017) Pull-Out Strength of
Polyethylene Terephthalate Bottle Fibre in Concrete Matrix. Malaysian Construction
Research Journal, 21(1):75-85.
Khalid, F.S., Azmi, N.B., Mazenan, P.N., Shahidan, S., Othaman N.H., and Guntor, N.A.A.
(2018) Self-consolidating concretes containing waste PET bottles as sand replacement.
AIP Conference Proceedings, 1930(020034):1-6.
Leman, A. S., Shahidan, S., Senin, M. S., and Ramzi Hannan, N. I. R. (2016) A Preliminary
Study on Chemical and Physical Properties of Coconut Shell Powder as A Filler in
Concrete. IOP Conference Series: Materials Science and Engineering,160(12059).
Martín, J., Montero, J. R., Moreno, F., Piqueras Sala, J. L. and Rubio, M. C. (2013) Feasibility
Analysis of The Reuse of Waste Filler of Bituminous Mixtures for The Production of
Self-Compacting Concrete. Materials and Design, 46:372-380.
Mashitah Mat Don, Wan Nurul Liza Mior Abdullah, Badorul Hisham Abu Bakar, M.Z.M.Z.
(2009) Chemical and Mineralogical Studies of Concrete Based-Waste Materials From
Demolition Sites. Malaysian Construction Research Journal, 5(2):1-9.
Mohammed, B.S., Achara, B. E., Nuruddin, M. F., Yaw, M. and Zulkefli, M. Z. (2017)
Properties of Nano-Silica-Modified Self-Compacting Engineered Cementitious
Composites. Journals of Cleaner Production, 162:1225-1238.
Nuruddin, M.F., Memon, F. A., Samuel Demie, N.S. (2013) Influence of Water to
Geopolymer Solids Ratio and Curing Time on The Properties of Self Compacting
Geopolymer Concrete. Malaysian Construction Research Journal, 13(2):29-38.
Md Nor, N., Bunnori, N. M., Ibrahim, A., Shahidan, S. and SMat Saliah, S.N. “Relationship
between acoustic emission signal strength and damage evaluation of reinforced concrete
structure: Case studies,” in 2011 IEEE Symposium on Industrial Electronics and
Applications, 2011, pp. 308–313.
Okamura, H. and Ouchi, M. (2003) Self-Compacting Concrete. Advanced Concrete
Technology, 1(1):5-15.
Parra, C., Valcuende, M. And Gómez, F. (2011) Splitting Tensile Strength and Modulus of
Elasticity of Self-Compacting Concrete. Construction and Building Materials, 25(1):201-
207.
Rahman, M.E., Muntohar, A. S., Pakrashi, V., Nagaratnam, B. H. and Sujan, D. (2014) Self
Compacting Concrete from Uncontrolled Burning of Rice Husk and Blended Fine
Aggregate. Materials and Design, 55:410-415.
Ramzi Hannan, N. I. R., Shahidan, S., Maarof, M. Z., and Ali, N. (2016) Physical and
Chemical Properties of Coal Bottom Ash (CBA) from Tanjung Bin Power Plant. IOP
Conference Series: Materials Science and Engineering, 160(1).
Saleh Ahari, R., Kemal Erdem, T. & Ramyar, K. (2015) Effect of Various Supplementary
Cementitious Materials on Rheological Properties of Self-Consolidating Concrete.
Construction and Building Materials, 75:89-98.
MCRJ Special Issue Vol. 4 | No. 2 | 2018 116
Senin, M. S., S. Shahidan, S., Leman, A. S., and Ramzi Hannan, N. I. R. (2016) Properties
of Cement Mortar Containing Rubber Ash as Sand Replacement. IOP Conference Series:
Materials Science and Engineering, 160(1).
Shahidan, S., Ismail, I., Zulkarnaian, M. S. S. and Abdul Rahman, N. (2017) Influence of
Asphalt Dust Waste Material in Mix Design for Self-Compacting Concrete, 730:473-478.
Shahidan, S., Mohd Zuki, S. S. Rahim, M. A. and Ali, N. (2016) Amplitude Distribution of
Emission Wave for Cracking Process, MATEC Web Conference, 47, 2–8.
Silva, Y.F., Robayo, R.A., Mattey, P.E. and Delvasto, S. (2016) Properties of Self-
Compacting Concrete on Fresh And Hardened With Residue of Masonry and Recycled
concrete. Construction and Building Materials, 124:639-644.
Singh, S., Nagar, R., Agrawal, V., Rana, A. and Tiwari, A. (2016) Sustainable Utilization of
Granite Cutting Waste In High Strength Concrete. Journal of Cleaner Production,
116:223-235.
Singh, S., Nagar, R. & Agrawal, V. (2015) Performance of Granite Cutting Waste Concrete
Under Adverse Exposure Conditions. Journal Of Cleaner Production, 127:172-182.
Su, N., Hsu, K. C. And Chai, H. W. (2001) A Simple Mix Design Method For Self-
Compacting concrete. Cement and Concrete Research, 31(12):1799-1807.
Tennich, M., Ben, M. and Kallel, A. (2017) Behavior of Self-Compacting Concrete Made
With Marble and Tile Wastes Exposed To External Sulfate Attack. Construction and
Building Materials, 135:335-342.
Thanh, H., Muller, M., Siewert, K. and Ludwig, H. M. (2015) The Mix Design for Self-
Compacting High Performance Concrete Containing Various Mineral Admixtures.
Journal of Materials & Design, 72:51-62.
Uysal, M. and Sumer, M. (2011) Performance of Self-Compacting Concrete Containing
Different Mineral Admixtures. Construction and Building Materials, 25(11):4112-4120.
Uysal, M. and Yilmaz, K. (2011) Effect of Mineral Admixtures on Properties of Self-
Compacting Concrete. Cement and Concrete Composites, 33(7):771–776.
Vijayalakshmi, M., Sekar, A.S.S. and Ganesh Prabhu, G. (2013) Strength and Durability
Properties of Concrete Made With Granite Industry Waste. Construction and Building
Materials, 46:1-7.
Zhu, W., Wei, J., Li, F., Zhang, T., Chen, Y., Hu, J. And Yu, Q. (2016) Understanding
Restraint Effect of Coarse Aggregate on The Drying Shrinkage of Self-Compacting
Concrete. Construction and Building Materials, 114:458-463.

MCRJ Special Issue Vol. 4 | No. 2 | 2018 117
ALKALINE TREATMENTS ON EFB FIBRE: THE EFFECT ON MECHANICAL-PHYSICAL PROPERTIES AND FIBRE-CEMENT HYDRATION RATE Nik Mohd Zaini Nik Soh1, Zainal Abidin Akasah, Hayana Dullah, Astimar Abdul Aziz2, Eeydzah Aminudin3
1Faculty of Civil Engineering, Universiti Tun Hussein Onn Malaysia, 86400 Parit Raja, Johor, Malaysia 2Malaysian Palm Oil Board, Persiaran Institusi, Bandar Baru Bangi, 43000 Kajang Selangor Malaysia 3Faculty of Civil Engineering, Universiti Teknologi Malaysia, 81310 Skudai, Johor
Abstract The natural fibres commonly used to enhance the brittleness of the cement matrix but appropriate fibre should be used for a particular purpose depending upon the type of fibre and characteristics. The Oil Palm Empty Fruit Bunch (EFB) fibre is one of the major crops in Malaysia, which contribute large scale of waste that is durable and make it reasonable for utilization in cement-based product. However, the presence of hemicellulose, lignin and extractive (oil, sugar and starch) affect the performance of EFB fibre and causes an incompatibility of EFB fibre and cement. Hence, this research is been conducted to explore the suitable proportion of Sodium Hydroxide (NaOH) treatment for EFB fibre to increase the compatibility of cement with EFB fibre. The NaOH concentration of 0.2%, 0.4%, 0.6%, 0.8%, 1%, 2%, 3% and 4% were used in this study as a chemical pre-treatment of EFB fibre for surface morphology observation and hydration rate test. Meanwhile for only untreated fibre, fibre treated with 0.4% (low concentration), 1% (medium concentration) and 4% (high concentration) of alkali treatment were tested for tensile strength of single EFB fibre. The fibre treated with NaOH has shown a significant different on the hydration temperature for EFB fibre- cement mixed compared with the untreated fibre. The higher NaOH concentration, the greater hydration temperatures obtain. The Scanning Electron Microscopy (SEM) image show that the increment NaOH concentration applied, the rougher EFB fibre surface is observed with lesser silica body remain. The tensile properties of individual fibre treated with NaOH (0.4%, 1% and 4%) has shown significant increment as compare to the untreated fibre with the highest tensile properties mean value 422.90 N/mm2 at 4% NaOH concentration. Keywords: Empty Fruit Bunch; Alkaline Treatment; Tensile Strength; Hydration Rate; SEM
INTRODUCTION
Recently, the natural fibres have received significant attention to be utilized as an
alternative material for various industrial products. Fibre reinforcement of cementitious
materials still remains an exciting and innovative technology because of the basic engineering
properties of crack resistance, ductility and energy absorption that enhance the infrastructure
construction (Swamy, 2000; Irwan et al., 2014). Nowadays, the researchers are investigating
on new alternative sources of lignocellulose materials to replace previous fibres that are
widely used in construction industry (Sanjay et al., 2016). The researchers has used plant
fibres as an alternative source in composites products such as cement paste and concrete for
increasing its strength properties (Ali, 2012). The natural fibres mainly used to enhance the
physical and mechanical properties of the composite materials but appropriate fibre should be
used for a particular purpose depend upon the type of fibre and characteristics. The oil palm
empty fruit bunch (OPEFB) fibre is one of the major crop in Malaysia with a total plantation
area of 4,304,914 hectar which contribute large scale waste such as dead fronds, empty fruit
bunches (EFB), shells and chopped trunks (Goh et al., 2010). The OPEFB has high cellulose
content which is durable and make it reasonable for utilization in bio-composites materials
(Sreekala et al., 2004). The fresh EFB usually contains 30.5% lignocellulose, 2.5 % oil and

MCRJ Special Issue Vol. 4 | No. 2 | 2018 118
67% water (Ramli et al., 2002). It was noted by Chang (2014) that the component of EFB
typically comprises of cellulose (23.7-65.0 %), hemicellulose (20.58-33.52 %) and lignin
(14.1-30.45 %). The physical characteristics of EFB gives different values in terms of physical
and mechanical properties of the bio-composite material (Shinoj et al., 2011).
The study indicates that the EFB fibre with cement could improve the performance and
quality of the bio-composite materials. Whereas, many supplementary natural fibres, EFB
fibres are naturally occurring composites consisting primarily of rigid, crystalline cellulose
microfibrils which are embedded in a soft, amorphous matrix of hemicelluloses and lignin
(Hassan et al., 2010). Furthermore, according to the Rozman et al. (2001), the oil residue from
lignin contain in EFB fibre may affect the interaction between fibres and the coupling agents.
This issue needs to be considered while using EFB fibre as construction material. The natural
fibre cannot be used directly because of incompatibility between fibre and cement matrix due
to the existence of residual oil that interrupts the penetration of binding agent and affect the
properties of the final EFB-products. From the extensive literature review it was perceived
that many researchers carried a series of tests to improve the compatibility of fibre and cement
by using certain treatments. However, it was found that there is a gape of study on the
treatment for EFB fibre while using as a replacement material with cement composites.
Previous studies were conducted on the surface modification of EFB fibre (Ibrahim et al.
2015) to investigate the effect of NaOH treatment at different level of concentration on the
morphological structure of OPEFB, which proved that chemical treatment using NaOH is the
most appropriate method to remove the carbohydrate contain in the surface of EFB fibre.
Therefore, EFB fibre treated with different concentration of NaOH has been carried out
in this research. To determine the suitable proportion of NaOH concentration for surface
modification of EFB fibre as a replacement material for cement based composite products.
The experimental test for this part consist of hydration rate test, surface morphology
examination and tensile strength for single fibre. The correlation of hydration rate and surface
morphology examination used to determine the suitable range concentration of NaOH for
EFB-CB sampling. The individual EFB fibre that represent untreated fibre (UT), fibre treated
with 0.4% (low concentration), 1% (medium concentration) and 4% (high concentration) of
NaOH has been tested for tensile strength to obtain the correlation with related to hydration
and surface morphology variations.
MATERIALS AND METHODS
The EFB fibre were supplied by Tereh Oil Palm Mill located at Kluang in Johor,
Malaysia. Initially the fibres were treated with NaOH at different concentration by soaked for
the period of 24 hours as suggested by Ibrahim et al. (2015) consequently, hand-washed and
oven dried to obtain 5% fibre moisture contain. Concentrations of NaOH used for treatment
were based on study by Ibrahim et al. (2015) as 0.2%, 0.4%, 0.6%, 0.8% and to provide the
better understanding and establish the finding, additional NaOH concentration as 1%, 2%, 3%
and 4% were introduced in this research.

MCRJ Special Issue Vol. 4 | No. 2 | 2018 119
Chart 1. Research methodology flow
Surface Morphology Examination
In this study, the Scanning Electron Microscope (SEM) has been used to investigate
surface morphology of EFB fibre. The EFB fibre used in this physical investigation consists
of untreated EFB and EFB treated with NaOH with range concentration of 0.2% to 4% (as
discussed in previous section). The SEM observations were conducted in the range of 200 to
500 magnifications to obtain the better view surface characteristic in order to gain deep
understanding of the different effect at various concentration of NaOH. It was also found by
Ibrahim et al. (2015) and Sreekala and Thomas (2003), that the use of SEM image of 200 to
500 magnification is appropriate to make the conclusion through observation changes of EFB
fibre surface morphology due to variation treatment effect.
Heat of Hydration
The previous research has been done on the compatibility test in order to define the effect
of natural fibre treated with NaOH with different concentration to the hydration rate of
cement. This test is essential to determine the amount of NaOH, which can be used for EFB
fibre treatment, the relationship can be judged between the change of surface morphology and
the rate of EFB fibre-cement hydration. The heat of hydration test designed for this research
were based on the method used by previous researchers (Ashori et al., 2011; Hermawan et al.,
2001; Noor Azrieda et al., 2009). Subsequently, the different percentage of 0.2%, 0.4%, 0.6%,
0.8%, 1%, 2%, 3% and 4% NaOH concentration used to treat the EFB fibre. Control sample
consists of cement (OPC type I) and the mixture of untreated EFB fibre with cement.
The Ordinary Portland Cement (OPC) of 300 grams were used in this test mixed with 15
grams of fine EFB fibre, then the mixture added with 130.5 mL of water. The water used for
this test was fixed at 0.4mL/g of cement weight plus 0.7mL/g of EFB fibre weight (oven dry
basis). The tests setup of hydration procedure a shown in the Figure 1. The mixture stirred for
2 minutes in polystyrene cup. After the mixing, thermal couple (type T) was immediately
inserted approximately at the center core of EFB fibre-cement mixture and connected to the
data logger (Midi Logger Graphtec GL220). The mixture then placed in the thermos flask. To

MCRJ Special Issue Vol. 4 | No. 2 | 2018 120
provide better understanding of EFB-cement on hydration temperature and time taken to reach
optimum temperature, the experiments were conducted for 65 hours in ambient room
temperature.
Figure 1. Hydration test setup and recorded
EFB Fibre Tensile Strength
The tensile strength test for EFB fibre was conducted based on the ASTM standard
(ASTM D3379) for single fibre. This test method covers the preparation test specimen (Figure
2), mounting specimen on testing jig, and apply the load to obtain the breaking load henceforth
calculate the tensile value. The Instron Universal Testing Machine with a 10 kN load-cell was
employed in this test. The EFB fibre used in this test were selected based on hydration
temperature category and surface morphological change. There were four categories of EFB
selected for tensile study; untreated EFB (UT) as a control sample and EFB treated with 0.4%,
1% and 4%. The single fiber was glued to a cardboard frame shown in Figure 2. The process
of sticking/glue EFB on cardboard conducted with carefully by placing a small amount of
adhesive (epoxy) at the marks on the mounting cardboard that define the gauge length. The
test specimens were gripped/clamped to the load train so that the test specimen is aligned
axially along the line of action of the test machine.
Figure 2. Schematic sketch of the experimental setup for tensile test

MCRJ Special Issue Vol. 4 | No. 2 | 2018 121
RESULTS AND DISCUSSION
Physical Properties
The scanning electron microscope (SEM) image with various magnification ranges from
200 to 500 was used to observe the change of surface morphology of EFB fibre before and
after pre-treatment. It was found that untreated fibre clearly shown the presence of silica
bodies embedded in great number on EFB fibre strand as shown in Figure 3a and Figure 3b.
The silica attached to circular craters on the EFB fibre surface and spread fairly uniformly
with the rounded spiky size of 10-14 μm. Whereas, the similar results was also obtained by
Ibrahim et al. (2015), furthermore, Law et al. (2007) were also found the presence of silica
bodies on EFB fibre strand with rounded spiky size distribution 10-15 μm.
(a) (b)
Figure 3. Mechanical performance and physical observation of EFB-CB fabricated from different length of EFB fibre
The OPEFB treated with NaOH revealed that the reduction in presence of silica body as
shown in Figure 4a to Figure 4i. The OPEFB treated with NaOH at 0.2% did not show much
different appearance of the silica body. However, after the treatment with NaOH started 0.4%
of concentration, some of the silica body started removed from the EFB strand and leaving
the effect of crater-shaped holes. The increasing concentration of NaOH used, the lower
number of silica body remained as obtained by Ariffin et al. (2008), Ibrahim et al. (2015) and
Sreekala et al. (1997) were found the reduction number of silica body on EFB fibre strand
after treated with NaOH.
Whereas, at 1% NaOH concentration (Figure 4e), it could be seen that the silica body
almost completely removed from the EFB fibre strand. However, the presence of silica bodies
was not fully decomposed and the residues still remain on the fibre strand. When the NaOH
concentrations reach at 2% (Figure 4f), the presence of silica body completely removed and
decomposed. Figure 4g showed that EFB fibre strand that treated with NaOH at 3%
concentration. It is found that, the surface of EFB fibre strand turn more rough and uneven.
Crater-shaped hole on EFB fibre strand started damage and deformed at 4% concentration of
NaOH as shown in Figure 4h. According to Sreekala et al. (1997), the roughness surface of
fibre strand due to alkali treatment could enhance the mechanical interlocking at the interface.
However, the comprehensive discussion related to the EFB fibre treatment and change of
surface morphology to the cement setting very rare to find publish elsewhere.

MCRJ Special Issue Vol. 4 | No. 2 | 2018 122
Figure 4. Scanning Electron Microscope (SEM) image at 250 magnification of Oil Palm Empty Fruit
Bunch (OPEFB) treated with Sodium Hydroxide (NaOH) range 0.2% to 4% concentration
EFB Fibre – Cement Hydration Rate
The cement compatibility with natural fibre is still a major problem in cement bonded
fibreboards production. While adding the certain amount of natural fibre into the cement
composite could significantly reduce the hydration temperature of mixture. Hydration rate of
neat cement and cement-EFB fibre were recorded for the period of 65 hours to observe the
changing of temperature on the mixed material. Based on the Figure 6, the maximum
(d) 0.8% NaOH (c) 0.6% NaOH
(b) 0.4% NaOH (a) 0.2% NaOH
(f) 2% NaOH (e) 1.0% NaOH
(g) 3%NaOH (h) 4%NaOH
NaOH
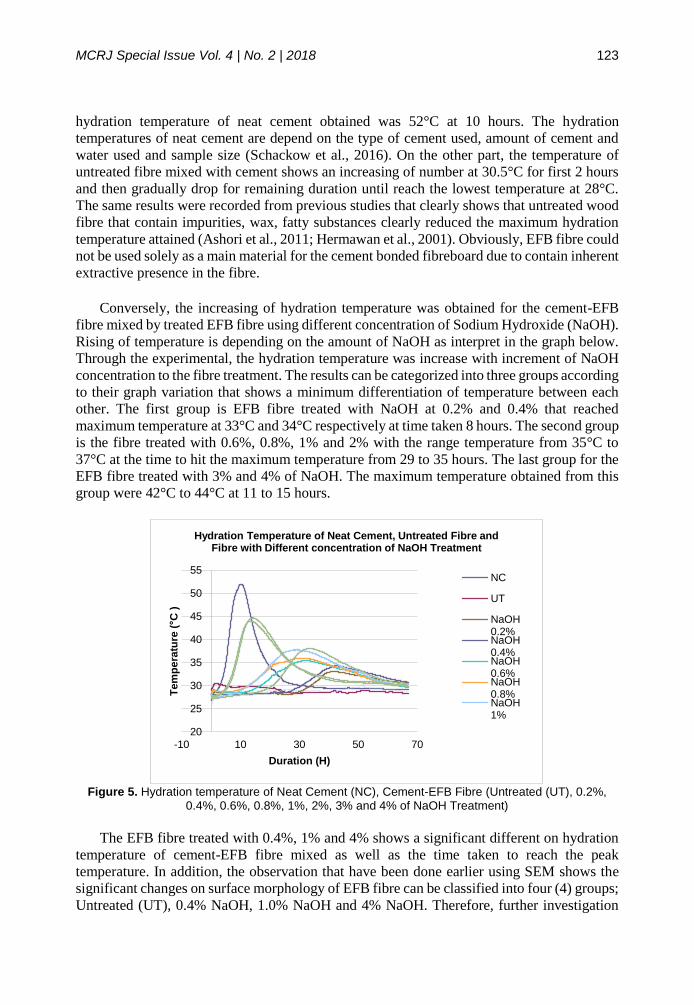
MCRJ Special Issue Vol. 4 | No. 2 | 2018 123
hydration temperature of neat cement obtained was 52°C at 10 hours. The hydration
temperatures of neat cement are depend on the type of cement used, amount of cement and
water used and sample size (Schackow et al., 2016). On the other part, the temperature of
untreated fibre mixed with cement shows an increasing of number at 30.5°C for first 2 hours
and then gradually drop for remaining duration until reach the lowest temperature at 28°C.
The same results were recorded from previous studies that clearly shows that untreated wood
fibre that contain impurities, wax, fatty substances clearly reduced the maximum hydration
temperature attained (Ashori et al., 2011; Hermawan et al., 2001). Obviously, EFB fibre could
not be used solely as a main material for the cement bonded fibreboard due to contain inherent
extractive presence in the fibre.
Conversely, the increasing of hydration temperature was obtained for the cement-EFB
fibre mixed by treated EFB fibre using different concentration of Sodium Hydroxide (NaOH).
Rising of temperature is depending on the amount of NaOH as interpret in the graph below.
Through the experimental, the hydration temperature was increase with increment of NaOH
concentration to the fibre treatment. The results can be categorized into three groups according
to their graph variation that shows a minimum differentiation of temperature between each
other. The first group is EFB fibre treated with NaOH at 0.2% and 0.4% that reached
maximum temperature at 33°C and 34°C respectively at time taken 8 hours. The second group
is the fibre treated with 0.6%, 0.8%, 1% and 2% with the range temperature from 35°C to
37°C at the time to hit the maximum temperature from 29 to 35 hours. The last group for the
EFB fibre treated with 3% and 4% of NaOH. The maximum temperature obtained from this
group were 42°C to 44°C at 11 to 15 hours.
Figure 5. Hydration temperature of Neat Cement (NC), Cement-EFB Fibre (Untreated (UT), 0.2%,
0.4%, 0.6%, 0.8%, 1%, 2%, 3% and 4% of NaOH Treatment)
The EFB fibre treated with 0.4%, 1% and 4% shows a significant different on hydration
temperature of cement-EFB fibre mixed as well as the time taken to reach the peak
temperature. In addition, the observation that have been done earlier using SEM shows the
significant changes on surface morphology of EFB fibre can be classified into four (4) groups;
Untreated (UT), 0.4% NaOH, 1.0% NaOH and 4% NaOH. Therefore, further investigation
20
25
30
35
40
45
50
55
-10 10 30 50 70
Tem
pe
ratu
re (
°C )
Duration (H)
Hydration Temperature of Neat Cement, Untreated Fibre and Fibre with Different concentration of NaOH Treatment
NC
UT
NaOH0.2%NaOH0.4%NaOH0.6%NaOH0.8%NaOH1%

MCRJ Special Issue Vol. 4 | No. 2 | 2018 124
for EFB fibre on tensile strength prepared based on UT (control), 0.4% NaOH (low
concentration), 1.0% (medium concentration) and 4.0% (high concentration).
The Change of EFB Diameter
The physical observation on the changes of EFB fibre diameter have been done for
untreated fibre (control) and fibre treated with 0.4%, 1% and 4% concentration of NaOH. The
average diameter of EFB fibres was measured by using optical observations (Leica optical
microscope) at three different random locations along with the single fibre as recommended
by Fiore et al. (2016) and Norul Izani et al. (2013) since the natural fibre cross section has an
irregular shape. With reference to the Figure 5, mean value of fibre diameters shows a
reduction with increment of NaOH concentration. The average diameter for untreated fibre
was found to be 0.479 mm while for treated fibre it was found to be 0.263 mm (0.4% NaOH),
0.251 mm (1% NaOH) and 0.240 mm (4% NaOH). The results may be due to the alkali
treatment that removed certain amount of hemicellulose and lignin on the fibre surface as
mentioned by Mohanty et al. (2001) thus reduced the diameter of fibre. The reduction of fibre
diameter also discussed by Fiore et al. (2016) after several tested on alkali treatment of fibre.
Figure 6. Diameter (mm) of Untreated Fibre (UT) and fibre treated with 0.4%, 1% and 4%
concentration of NaOH
Tensile Strength of Single EFB Fibre
The mean value of tensile strength of the untreated and treated EFB fibres are presented
in the Figure 7. It was observed that the fibre treatment appeared to significantly increase the
tensile strength of the fibres in relation to the untreated fibres. The results also shows that the
tensile strength of EFB fibers was increased markedly by increment of NaOH concentration.
However, this results was contradict with findings by Nishiyama and Okano (1998) for the
ramie fibre where the tensile strength decreased in alkali treated due to the damage caused by
a chemical structure change such that cellulose in the fibre partially changes from crystalline
cellulose into amorphous cellulose.
The results showed that the tensile strength of EFB fibres was increased markedly by
alkali treatment. This may be due to the increased in crystallinity of fibres by alkali treatment.
The results are in-line with findings by Norul Izani et al. (2013) that evidently stated that the
tensile strength, Young’s modulus, and percent elongation at break of the NaOH soaking

MCRJ Special Issue Vol. 4 | No. 2 | 2018 125
treated fibres are higher than the untreated fibre. As mentioned by Mohanty et al. (2001),
alkali treatment may depolymerize the native cellulose and delignify the fibre excessively,
which can adversely affect the strength of the fibre. It was also mentioned by Cai et al. (2015)
that the NaOH treatment removed binding material on fibre such as hemicellulose and lignin.
Figure 7. Tensile strength of Untreated Fibre (UT) and fibre treated with 0.4%, 1% and 4%
concentration of NaOH
As refer to the Figure 8, the graph pattern shows the increasing of tensile strength when
the diameter of fibre was decrease. The significant changes of EFB fibre diameter were due
to depolymerize of the native cellulose. The results are in-line with the research by Kabir et
al. (2013) which explained the graph pattern that trend downward was observed with the
smaller of fibre diameter shows the increment of tensile strength. The increment amount of
sodium hydroxide (NaOH) concentration affect the outer surface of EFB fibre thus caused the
fibre to shrinkage. The changes of fibre surface due to the removal of silica body as well as
reduced the residual oil in the EFB fibre (Zawawi et al. 2015) could increase the performance
of fibre. However, Cai et al. (2015) and Kabir et al. (2013) was found that, at 10%
concentration of NaOH the fibre became more brittle hence decrease the tensile strength of
fibre.
Figure 8. Tensile strength of EFB fibre againts diameter for untreated and treated fibre
MCRJ Special Issue Vol. 4 | No. 2 | 2018 126
CONCLUSIONS
Based on the result of this research the following conclusion can be drawn:
i. The hydration rate of EFB fibre-cement mix, is significantly decrease for the mixture
containing untreated fibre, while increase with the increasing of NaOH concentration
applied for fibre pre-treatment.
ii. The significant difference from hydration rate of EFB fibre-cement mixed on level of
NaOH concentration which is 0.4%, 1% and 4% of alkali treatment.
iii. Alkaline treatment could depolymerize the native cellulose thus increase the tensile
strength of single EFB fibre up to 4% of NaOH concentration, apart from that the
EFB fibre diameters were decreased with increasing of NaOH concentration.
iv. The utilization of EFB fibre for cement based product could be accepted with
modification surface of EFB fibre by alkali treatment using sodium hydroxide
(NaOH).
ACKNOWLEDGEMENT
The authors are gratefully acknowledging the technical support of Faculty of Civil and
Environmental Engineering and Office for Research, Innovation, Commercialization and
Consultancy Management, Universiti Tun Hussein Onn Malaysia for financial support on
contract grant (U522).
REFERENCES
Ali, M. (2012) Natural Fibres as Construction Materials. Journal of Civil Engineering and
Construction Technology, 3(3):80–89.
Ariffin, H., Hassan, M., Umi Kalsom, M., Abdullah, N., Shirai, Y., Ariffin, H. and Shirai, Y.
(2008) Effect of Physical, Chemical and Thermal Pretreatments on The Enzymatic
Hydrolysis of Oil Palm Empty Fruit Bunch (OPEFB) (Kesan prarawatan fizikal, kimia
dan termal terhadap hidrolisis enzimitik tandan kosong kelapa sawit). J. Trop. Agric. and
Fd. Sc, 36(2):1-10.
Ashori, A., Tabarsa, T., Azizi, K. and Mirzabeygi, R. (2011) Wood–Wool Cement Board
Using Mixture of Eucalypt and Poplar. Industrial Crops and Products, 34(1):1146–1149.
Cai, M., Takagi, H., Nakagaito, A. N., Katoh, M., Ueki, T., Waterhouse, G. I. N. and Li, Y.
(2015) Influence of Alkali Treatment on Internal Microstructure and Tensile Properties
of Abaca Fibers. Industrial Crops & Products, 65:27–35.
Chang, S. H. (2014) An Overview of Empty Fruit Bunch From Oil Palm As Feedstock For
Bio-Oil Production. Biomass and Bioenergy, 62:174–181.
Fiore, V., Scalici, T., Nicoletti, F., Vitale, G., Prestipino, M. and Valenza, A. (2016) A New
Eco-Friendly Chemical Treatment of Natural Fibres: Effect Of Sodium Bicarbonate On
Properties Of Sisal Fibre And Its Epoxy Composites. Composites Part B: Engineering,
85: 150–160.
Goh, C. S., Tan, K. T., Lee, K. T. and Bhatia, S. (2010) Bio-ethanol from Lignocellulose :
Status , Perspectives and Challenges In Malaysia. Bioresource Technology, 101(13):
4834–4841.

MCRJ Special Issue Vol. 4 | No. 2 | 2018 127
Hassan, A., Salema, A. A., Ani, F. N. and Abu Bakar, A. (2010) A review on Oil Palm Empty
Fruit Bunch Fiber-Reinforced Polymer Composite Materials. Polymer Composites,
31(12): 2079–2101.
Hermawan, D., Subiyanto, B. and Kawai, S. (2001) Manufacture and Properties of Oil Palm
Frond Cement-Bonded Board. Journal of Wood Science, 47(3):208–213.
Irwan, J.M., Asyraf, R.M., Othman, N., Koh, H.B., Aeslina, A.K., Annas, M.M.K. and Faisal,
S.K. (2014) Deflection behaviour of irregular-shaped Polyethylene Terephthalate fibre
reinforced concrete beam. Advanced Materials Research, 911: 438-442.
Izani, M. A. N., Paridah, M. T., Anwar, U. M. K., Nor, M. Y. M. and H, P. S. (2013) Effects
of Fiber Treatment on Morphology , Tensile and Thermogravimetric Analysis of Oil Palm
Empty Fruit Bunches Fibers. Composites : Part B, 45(1):1251-1257.
Kabir, M. M., Wang, H., Lau, K. T. and Cardona, F. (2013) Tensile Properties of Chemically
Treated Hemp Fibres as Reinforcement for Composites. Composites Part B: Engineering,
53:362–368.
Law, K. N., Daud, W. R. W. And Ghazali, A. (2007) Morphological and Chemical Nature of
Fiber Strands of Oil Palm Empty-Fruit-Bunch (OPEFB). BioResources, 2(3):351–362.
Mohanty, A. K., Misra, M. and Drzal, L. T. (2001) Surface Modifications of Natural Fibers
And Performance of The Resulting Biocomposites: An Overview. Composite Interfaces,
8(5): 313–343.
Nishiyama, Y. and Okano, T. (1998) Morphological Changes of Ramie Fiber During
Mercerization. Journal of Wood Science, 44(4):310–313.
Noor Azrieda, R., Razali, K., Izran, K., Rahim, S. and Adbul Aziz, M. (2009) Hydration
Permormance of Cement-Bonded Wood Composites: Compatibility Assessment of Six
Pioneer Forest Species. Borneo Science, 25(September):47–58.
Ramli, R., Shaler, S. and Jamaludin, M. A. (2002) Properties of Medium Density Fibreboard
From Oil Palm Empty Fruit Bunch. Journal of Oil Palm Research, 14(2):34–40.
Rozman, H. D., Tay, G. S., Kumar, R. N., Abusamah, A., Ismail, H. And Mohd Ishak, Z. A.
(2001) Polypropylene-Oil Palm Empty Fruit Bunch-Glass Fibre Hybrid Composites : A
Preliminary Study on The Flexural and Tensile Properties. European Polymer Journal,
37(6):1283–1291.
Sanjay, M. R., Arpitha, G. R., Laxmana Naik, L., Gopalakrishna, K. and Yogesha, B. (2016)
Applications of Natural Fibers and Its Composites : An Overview. Natural Resources,
7(3):108–114.
Schackow, A., Effting, C., Gomes, I. R., Patruni, I. Z., Vicenzi, F. And Kramel, C. (2016)
Temperature Variation in Concrete Samples Due To Cement Hydration. Applied Thermal
Engineering, 103:1362–1369.
Shinoj, S., Visvanathan, R., Panigrahi, S. and Kochubabu, M. (2011). Oil palm fiber ( OPF )
and Its Composites : A review. Industrial Crops & Products, 33(1):7–22.
Sreekala, M. S., Kumaran, M. G., Geethakumariamma, M. L. and Thomas, S. (2004)
Environmental Effects in Oil Palm Fiber Reinforced Phenol Formaldehyde Composites:
Studies on Thermal, Biological, Moisture And High Energy Radiation Effects. Advanced
Composite Materials, 13(3–4):171–197.
Sreekala, M. S., Kumaran, M. G. and Thomas, S. (1997) Oil Palm Fibers: Morphology,
Chemical Composition, Surface Modification and Mechanical Properties. Journal of
Applied Polymer Science, 66(5):821–835.

MCRJ Special Issue Vol. 4 | No. 2 | 2018 128
Sreekala, M. S. and Thomas, S. (2003) Effect of Fibre Surface Modification on Water-
Sorption Characteristics of Oil Palm Fibres, 63:861–869.
Swamy, R. N. (2000) FRC for Sustainable Infrastructure Regenaration and Rehabilitation.
Proc. of the Fifth Int. RILEM Symposium on FIbre Reinforced Concrete, BEFIB 2000.
France, 3–18.
Zawawi, I., Astimar, A. A. and Ridzuan, R. (2015) Effect Of Treatment On The Oil Content
And Surface Morphology Of Oil Palm (Elaeis Guineensis) Empty Fruit Bunches (EFB)
Fibres. Wood Research, 60(1):157–166.

MCRJ Special Issue Vol. 4 | No. 2 | 2018 129
BIO-CONCRETE ON CHLORIDE CONDITION: EFFECT ON COMPRESSIVE STRENGTH AND WATER PENETRATION T. Teddy1, J.M. Irwan1, N. Othman2, P. Gani2
1Jamilus Research Centre for Sustainable Construction (JRC), Faculty of Civil and Environmental Engineering, University Tun Hussein Onn, Malaysia, 86400 Parit Raja, Johor, Malaysia. 2MicroPollutant Research Centre (MPRC), Faculty of Civil and Environmental Engineering, University Tun Hussein Onn, Malaysia, 86400 Parit Raja, Johor, Malaysia.
Abstract In recent years, the beneficial effect of sulphate reduction bacteria (SRB) to induce calcium carbonate precipitation on the concrete structure has gradually increase great attention in the industry. In this study, different SRB concentration (0%, 3%, 5% and 7%) and water cement ratio (0.4w/c, 0.5w/c and 0.6w/c) was investigated in term of compressive strength and water penetration. Since the sample curing in saline water, thus, the sample on chloride condition also investigated accordingly. Compressive strength and water penetration test were performed at the stage of 28th, 56th, 90th, 180th and 360th day of curing period. Test results indicated that the best SRB concentration to be mixed in bio-concrete was 5% while 0.5w/c for water cement ratio. Both values enhanced significantly the compressive strength and reduced porosity and water penetration of bio-concrete. The maximum increased of compressive strength in 0.5w/c is 58.6MPa was observed with 5% of SRB on the day 180 of curing time. Meanwhile, the lowest water penetration was recorded on the last day (day 360) of curing with 2.93cm at the 5% and 0.6w/c of SRB concentration and water cement ratio, respectively. These improvements were due to deposition on the SRB cells within the pore of the concrete cube as cured in chloride water. Results of this study demonstrated the role of SRB induced calcium carbonate precipitation in improving the concrete structure cured in extreme condition in term of compressive strength and water penetration. Keywords: Bio-concrete, Calcium carbonate, Chloride attack, Compressive strength, Sulphate
reduction bacteria, Water penetration
INTRODUCTION
In the surrounding area, such as in the archipelago or a long coastal area that surrounded
by sea water concrete structures used to be exposed to extreme conditions such as saline water.
This condition leads to the reduction in durability of the concrete structure due to external
factors or environment-related factors such chemicals, sulfates, chlorides and salts in the sea
area. The deposition of inorganic matter around the concrete structure can threaten the life
span of the concrete. Among the threatening factors like freezing and thawing, abrasion,
corrosion of steel, the chemical attack may deteriorate the concrete significantly (Zivica
and Bajza, 2001; Azmi et al., 2017). Chemical attack can be classified as an acidic attack,
alkali attack, carbonation, chloride attack, leaching and sulphate attack. The threat to
be discussed and investigated in this study is chloride attack.
Chloride is regarded as extremely dangerous in causing the corrosion of prestressing
steel in concrete. Chloride ingress on concrete is one of the most important aspects for
consideration especially in dealing with the durability of concrete. Chloride attack is
particularly important because it primarily causes corrosion of reinforcement. Statistics have
indicated that over 40 per cent of failure of structures is due to corrosion of reinforcement
(Verma et al., 2013). Due to high alkalinity of concrete, a protective oxide film is present on

MCRJ Special Issue Vol. 4 | No. 2 | 2018 130
the surface of steel reinforcement. The protective passivity layer can be lost due to
carbonation. This protective layer also can be lost due to the presence of chloride in the
presence of water and oxygen (Khalid et al., 2018). In reality, the action of chloride in
inducing corrosion of reinforcement is more serious than any other reasons (Darmawan, 2010;
Neville, 1995).
Furthermore, corrosion of reinforcing steel due to chloride ingress is one of the most
common environmental attacks that lead to the deterioration of concrete structures. Corrosion-
related damage to bridge deck overlays, parking garages, marine structures, and
manufacturing plants information about mechanisms of deterioration most studied by the
researcher (Neville et al., 2004). Deterioration of concrete more effect of the
environment of the system in conjunction with the structural requirement to describe the
cause of such deterioration (Suwito and Xi, 2008). Environment factors consist of seasonal
variations freeze thaw cycling, relative humidity, chemicals in the ground, ground water, are
the main degradation agents.
A typical durability-related phenomenon in many concrete constructions is crack
formation. While larger cracks hamper structural integrity, also smaller sub-millimetre sized
cracks may result in durability problems as particularly connected cracks increase matrix
permeability (Jonker et al., 2012; Mazenan et al., 2017). Durable concrete with the biological
approach is called bio-concrete in which microorganisms one of very important to
deterioration in porous materials and sealing concrete cracks (Anneza et al., 2016; Zamer et
al., 2017). However, bacteria are unable to tolerate with all environmental conditions because
there are some factors restricting the growth of bacteria such as temperature, type of growth
medium, extreme pH value and anaerobic conditions and bacteria successfully isolated to
survive in the alkaline environment with anaerobic conditions and was called as sulphate
reduction bacteria (Alshalif et al., 2016).
Theoretically, sulfate reducing bacteria (SRB) require dissolved oxygen to induce the
corrosion cycle and the bacteria are not able to tolerate with extreme pH value. Under the
acidic condition, these bacteria cells hydrolyze or enzyme inactivate. If the surrounding
environment of the SRB is in alkaline condition, the enzymes work very well. The pH value
plays an important role in microbial life that will influence the dissociation and solubility of
many molecules that indirectly influence microorganism research methodologies, especially
those incorporating the biological effect on concrete. The study of sulphate reduction bacteria
isolated from acid mine water the results showed that optimal pH for growth condition is 9.35
(Irwan et al., 2016). The bacteria incorporation in concrete reduces mass variation, volume
variation (higher age) and water absorption (Gandhimathi and Suji, 2015).
Therefore, the objective of this study is to investigate the effect of sulphate reduction
bacteria (SRB) concentrations as influenced by water cement ratio (W/C) regarding the
chloride attack during curing period up to 360 days on the compressive strength profile and
water penetration test.

MCRJ Special Issue Vol. 4 | No. 2 | 2018 131
MATERIALS AND METHODS
Isolation of sulphate reduction bacteria
Sulphate reduction bacteria (SRB) used in this study was collected from acid mire water
located in Sungai Pelepah Kota Tinggi, Johor, Malaysia. Sample isolation and preparation of
the inoculum follows Alshalif et al. (2016). SRB was enriched under special environment to
tolerate the high alkalinity and anaerobic conditions for ensuring self-sustain in the concrete.
In this study, sodium chloride (NaCl) was added to simulate chloride environment during re-
culturing SRB that previously isolated. Therefore as requirements BS EN 13396 :2014, it
increases the durability of concrete as it would prevent water seeping as a culprit in causing
carbonation of steel and end up to threaten the whole building to be less durable. In this study,
reduction of water seeping also minimizing penetration of 3% sodium chloride that already
dissolve in curing water. Chloride is a vital cause in creating corrosion of any steel material
in concrete structure, thus reducing concrete durability (Nosouhian et al. 2015). The
compositions of media in re-culturing SRB process were prepared as follow:
a) Control = 25ml(nutrient broth) + 10 ml ( 3% NaCl) = 35ml
b) SRB sample = 25ml(nutrient broth) + 10ml ( 3% NaCl) + 1 bead of SRB =35ml
Bio-concrete preparation
The bacteria growth curve was plotted based on daily absorbance of the bacteria until the
bacteria reach optimum growth condition. Before fabricating concrete, the bacteria are re-
grown according to the optimum growth day following bacteria growth curve. Bio-concrete
mixture was designed according to DOE. The fabrication of concrete was done according to
BS 1881-125:2013 (British Standard, 2013). Concrete mix proportion was using a different
percentage of SRB concentration as influenced by 0.4 w/c, 0.5 w/c and 0.6 w/c to achieve the
target strength as tabulated in Table 1. Ordinary Portland cement was obtained from local
manufacturer which consist the composition and specification complying with all
requirements defined by BS EN 197-1:2000. The size of fine aggregate was below 5mm while
coarse aggregate was in the range (12-20)mm. Whereas, the required size of aggregate in
concrete used sieve analysis test which conducted according to BS 882:1992. All procedure
in preparation of bio-concrete based according to BS 1881-125:2013 (British Standard, 2013).
Table 1. Mix proportion of bio-concrete with different percentages of SRB prepared for fabrication
Percentage (%) of bacteria
Cement (kg/m3)
Water (kg/m3)
Fine aggregate
(kg/m3)
Coarse aggregate
(kg/m3)
0% 420 210 685 1115
3% 420 207.9 685 1115
5% 420 203.7 685 1115
7% 420 199.5 685 1115
Test procedure
Mechanical properties tests that were performed is compressive strength and water
penetration test. All tests for both compressive strength and water penetration were conducted
in triplicate samples. The cubes molds of 150mm x 150mm x150mm were prepared both with

MCRJ Special Issue Vol. 4 | No. 2 | 2018 132
and without (SRB). In order to simulate chloride condition, concrete specimens were cured in
3% NaCl for 28th , 56th, 90th, 180th and 360th days. Compressive strength test was performed
according to BS EN 12390-3:2009 (British Standard, 2009) and BS EN 12390-8:2009 (British
Standard, 2009) using universal testing machine (UTM). Water penetration test was
conducted according to BS EN 12390-8 in order to determine the increase in resistance
towards water penetration in concrete specimens (British Standard, 2009).
RESULTS AND DISCUSSION Compressive strength test
Results on the compressive strength of bio-concrete specimens prepared with different
SRB percentage (3%, 5% and 7%) as influenced by W/C ratio (0.4, 0.5 and 0.6) are presented
in Figure 1 and Table 2. All specimens had been tested after achieving maturity of concrete
on the day 28, 56, 90, 180 and 360.
As shown in Figure 1A, specimens containing 0.4 W/C ratio with bacterial (SRB) showed
a considerable increase in the compressive strength (MPa) compared to control specimen. On
the day 90, the highest compressive strength occurred at 3% of SRB (64.5 MPa) followed by
5% of SRB (46.97 MPa) and 7% of SRB (34.23 MPa). The drastic reduction had been
observed at 3% of SRB on the day 180 of curing time where the compressive strength reduced
from 64.5 MPa on the day 90 to 46 MPa on the day 180. However, this value still higher than
the minimum requirement of compressive strength of concrete grade 30 (30 MPa) in which
had been simulated in this study. Meanwhile, 5% and 7% of SRB were increasing gradually
in compressive strength on the day 180 of curing time up to 65.57 MPa and 55.5 MPa,
respectively. If compared to control specimen, the compressive strength of bio-concrete in 0.4
W/C ratio on the day 180 of curing time increased up to 12.4%, 38.4% and 27.26% for 3%,
5% and 7% of SRB, respectively. It indicated that 0.4 W/C ratio in concrete mixture highly
influence the strength after 180 days of curing in 5% and 7% of SRB (Figure 1A).
Since the specimens of bio-concrete were tested after reaching the post maturity period,
there was no significant increment of compressive strength for 0.5 W/C ratios (Figure 1B) on
the day 28, 56, 90 and 180 of curing time. Most of the specimens with different SRB
percentage including control specimen showed no major changes in the compressive strength.
Yet in Figure 1B, on the day 180 of curing time, there was a clear trend of increase in
compressive strength for all specimens (3%, 5% and 7% of SRB) including control specimen.
By applying 0.5 W/C ratio, the compressive strength of specimens at 3% of SRB had appeared
as the highest up to 63.9 MPa while for 5% and 7% of SRB was 58.57 MPa and 58.7 MPa,
respectively. This increment was equivalent to 13.1%, 5.2% and 5.4% for 3%, 5% and 7% of
SRB, respectively compared to control specimen (0% of SRB) on the last day of curing time
(180 days).

MCRJ Special Issue Vol. 4 | No. 2 | 2018 133
Figure 1. Compressive strength with different percentage of SRB as influenced by A) 0.4 W/C ratio, B)
0.5 W/C ratio and C) 0.6 W/C ratio

MCRJ Special Issue Vol. 4 | No. 2 | 2018 134
Table 2. Compression test of concrete with different SRB percentage Curing time
(days) W/C ratio
Compression strength, MPa
Control 3% SRB 5% SRB 7% SRB
28 0.4 44.27±1.23 49.33±0.43 45.33±0.47 46.53±1.27 0.5 42.23±1.36 45.50±0.53 46.60±1.21 47.20±0.67 0.6 27.60±0.49 30.77±0.41 23.63±0.32 29.17±1.14
56 0.4 41.03±0.62 49.47±0.65 49.53±0.85 47.57±0.30 0.5 42.23±1.36 49.47±0.65 49.53±0.85 47.57±0.30 0.6 35.97±1.44 34.90±1.87 26.93±0.22 33.00±0.72
90 0.4 47.23±1.41 64.50±0.68 57.43±1.23 46.60±0.72 0.5 43.30±1.27 46.97±1.44 53.87±1.92 48.50±0.29 0.6 34.60±0.47 34.23±0.33 35.03±0.90 28.83±1.01
180 0.4 40.37±0.29 46.00±5.44 65.57±1.23 55.50±1.80 0.5 55.53±1.75 63.90±0.86 58.57±1.53 58.70±1.84 0.6 34.97±0.97 43.10±1.49 37.83±0.90 38.67±0.61
360 0.4 39.83±1.27 63.23±1.72 62.80±1.73 62.80±1.41 0.5 41.23±3.14 46.97±2.15 57.33±2.47 53.37±3.13 0.6 34.87±2.29 42.27±0.23 52.53±2.58 37.00±0.70
Similarly, specimens in 0.6 W/C ratio with different SRB percentage also depicted the
same trends in term of compressive strength. After 56 days of curing, 0.6 W/C ratio specimens
with different SRB percentage showed considerably increase the compressive strength
compared to 28 days of curing (Figure 4.1C). The compressive strength almost constant until
90 day of curing time for all sample, except 5% of SRB. A quick increment in compressive
strength at 5% of SRB specimen was recorded about 35.03 MPa on the day 90. Besides,
fluctuate reading had been observed for 7% of SRB specimen during the curing time.
However, on the day 180, 7% of SRB in 0.6 W/C ratio specimens had increased up to 38.67
MPa while for 3% of SRB was 43.1 MPa and for 5% of SRB was 37.83 MPa. This increment
represents about 18.9%, 7.6%, 9.6% for 3%, 5% and 7% of SRB, respectively compared to
control specimen (0% of SRB).
The current findings enhance the understanding of varies in W/C ratio produce different
compressive strength of bio-concrete as influenced by different SRB percentage (3%, 5% and
7%). Thus, it was found that the higher W/C ratio causes a decrease in the compressive
strength value as on the last day of curing time (Table 4.1). This was probably due to the
excessive water content in the bio-concrete mixture leads to weak in compression strength.
However, individual comparison (0.4, 0.5 and 0.6 W/C ratio) revealed that each W/C ratio
was increased in term of compressive strength during the curing time. In fact, all different
SRB percentage specimens indicated a good compression strength compared to control
specimen. Similar findings had also been reported by another researcher (Babu and Siddiraju,
2016; Balam et al. 2017; Kalhori and Bagherpour, 2017). Babu and Siddiraju (2016) reported
that 5% of bacteria (species not specify) slightly increase the compressive strength (49.5 MPa)
of bio-concrete compared to concrete without bacteria at 28 days of curing time. Thus, this
research contributed to a new finding of simulaed bio-concrete in 3% NaCl that was slightly
different from previous studies.
Theoritically, pores in bio-concrete are partially filled up by material growth with the
addition of bacteria in which leads to increased density of the concrete strength (Babu and
Siddiraju, 2016). Meanwhile, (Balam et al., 2017) used bacteria (Sporosareina pasrearii) for
remediation of lightweight aggregate concrete on compressive strength found that 26%
remarkable increment of specimen tested after 150 days of curing time. Kalhori and
Bagherpour (2017) applied Bacillus subtilis for repairing crack of concrete indicate 30%
increase in the compressive strength of bacteria concrete specimens compared to control
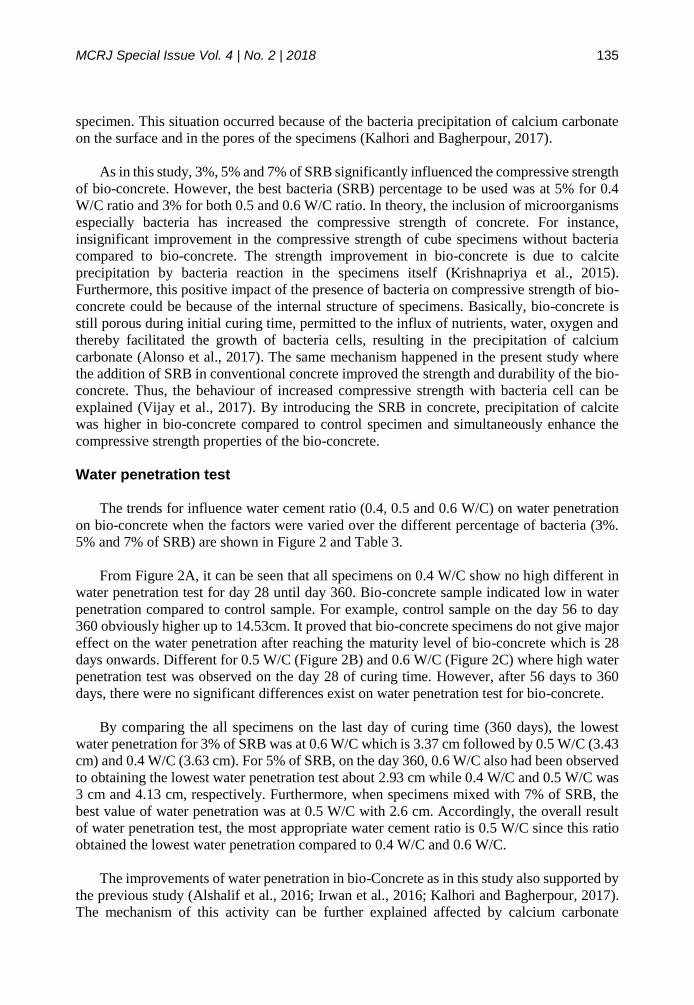
MCRJ Special Issue Vol. 4 | No. 2 | 2018 135
specimen. This situation occurred because of the bacteria precipitation of calcium carbonate
on the surface and in the pores of the specimens (Kalhori and Bagherpour, 2017).
As in this study, 3%, 5% and 7% of SRB significantly influenced the compressive strength
of bio-concrete. However, the best bacteria (SRB) percentage to be used was at 5% for 0.4
W/C ratio and 3% for both 0.5 and 0.6 W/C ratio. In theory, the inclusion of microorganisms
especially bacteria has increased the compressive strength of concrete. For instance,
insignificant improvement in the compressive strength of cube specimens without bacteria
compared to bio-concrete. The strength improvement in bio-concrete is due to calcite
precipitation by bacteria reaction in the specimens itself (Krishnapriya et al., 2015).
Furthermore, this positive impact of the presence of bacteria on compressive strength of bio-
concrete could be because of the internal structure of specimens. Basically, bio-concrete is
still porous during initial curing time, permitted to the influx of nutrients, water, oxygen and
thereby facilitated the growth of bacteria cells, resulting in the precipitation of calcium
carbonate (Alonso et al., 2017). The same mechanism happened in the present study where
the addition of SRB in conventional concrete improved the strength and durability of the bio-
concrete. Thus, the behaviour of increased compressive strength with bacteria cell can be
explained (Vijay et al., 2017). By introducing the SRB in concrete, precipitation of calcite
was higher in bio-concrete compared to control specimen and simultaneously enhance the
compressive strength properties of the bio-concrete.
Water penetration test
The trends for influence water cement ratio (0.4, 0.5 and 0.6 W/C) on water penetration
on bio-concrete when the factors were varied over the different percentage of bacteria (3%.
5% and 7% of SRB) are shown in Figure 2 and Table 3.
From Figure 2A, it can be seen that all specimens on 0.4 W/C show no high different in
water penetration test for day 28 until day 360. Bio-concrete sample indicated low in water
penetration compared to control sample. For example, control sample on the day 56 to day
360 obviously higher up to 14.53cm. It proved that bio-concrete specimens do not give major
effect on the water penetration after reaching the maturity level of bio-concrete which is 28
days onwards. Different for 0.5 W/C (Figure 2B) and 0.6 W/C (Figure 2C) where high water
penetration test was observed on the day 28 of curing time. However, after 56 days to 360
days, there were no significant differences exist on water penetration test for bio-concrete.
By comparing the all specimens on the last day of curing time (360 days), the lowest
water penetration for 3% of SRB was at 0.6 W/C which is 3.37 cm followed by 0.5 W/C (3.43
cm) and 0.4 W/C (3.63 cm). For 5% of SRB, on the day 360, 0.6 W/C also had been observed
to obtaining the lowest water penetration test about 2.93 cm while 0.4 W/C and 0.5 W/C was
3 cm and 4.13 cm, respectively. Furthermore, when specimens mixed with 7% of SRB, the
best value of water penetration was at 0.5 W/C with 2.6 cm. Accordingly, the overall result
of water penetration test, the most appropriate water cement ratio is 0.5 W/C since this ratio
obtained the lowest water penetration compared to 0.4 W/C and 0.6 W/C.
The improvements of water penetration in bio-Concrete as in this study also supported by
the previous study (Alshalif et al., 2016; Irwan et al., 2016; Kalhori and Bagherpour, 2017).
The mechanism of this activity can be further explained affected by calcium carbonate

MCRJ Special Issue Vol. 4 | No. 2 | 2018 136
precipitation in the bio-concrete specimen. Therefore, the addition of bacteria (SRB) into bio-
concrete has improved the concrete water permeability by producing calcium carbonate which
reduces the pores at a faster rate. Since water penetration is a measurement for durability,
concrete structure increase with the reduction of water penetration.
Thus, the potential of steel reinforcement to corrode and deteriorate can be avoided
wisely. In this study, the significant decrease water penetration by bio-concrete compared to
control specimen is due to the precipitation process which calcium carbonate plugs the pores
within the concrete matrix. This plugging of pores decreased the water penetration in the
concrete. Other than that, improvement in water penetration also due to the present of calcium
source acts as a booster to further deposit more calcium carbonate which source apart from
the availability of calcium from cement used. Consequently, once the pores are sealed,
reduction in water ingress is observed. This bacterial action deposition can seal the pores,
voids and microcracks where other sealants are unable to work through it. Therefore, it
increases the durability of concrete as it would prevent water from seeping into concrete to
cause carbonation of steel and chlorination which would jeopardize the strength of the
structure and cause the whole building to be less durable than intended (Chahal et al., 2012).

MCRJ Special Issue Vol. 4 | No. 2 | 2018 137
Figure 2. Water penetration with different percentage of SRB. A) 0.4 W/C ratio, B) 0.5 W/C ratio and
C) 0.6 W/C ratio

MCRJ Special Issue Vol. 4 | No. 2 | 2018 138
Table 3. Water penetration test of concrete with different SRB percentage as influenced by W/C ratio Curing time
(days) W/C ratio
Compression strength, MPa
Control 3% SRB 5% SRB 7% SRB
28 0.4 4.17±0.44 2.83±0.17 2.33±0.17 4.17±0.17 0.5 14.13±0.23 13.33±071 13.00±0.51 12.63±0.47 0.6 12.97±0.28 11.97±0.24 12.67±0.43 12.27±0.50
56 0.4 14.53±0.23 2.27±0.49 2.73±0.43 2.67±0.34 0.5 14.53±0.23 2.27±0.20 2.73±0.43 2.67±0.34 0.6 14.53±0.23 2.57±0.07 2.73±0.43 3.00±0.61
90 0.4 13.30±0.10 3.43±0.07 3.80±0.29 2.37±0.47 0.5 13.30±0.10 3.43±0.07 3.80±0.29 2.37±0.47 0.6 13.30±0.10 3.43±0.12 3.93±0.19 2.37±0.47
180 0.4 13.10±0.46 3.60±0.19 3.53±0.56 2.67±0.23 0.5 12.97±0.19 3.57±0.09 3.97±0.13 2.83±0.15 0.6 12.80±0.26 3.53±0.18 4.23±0.07 2.47±0.44
360 0.4 13.43±0.15 3.63±0.18 3.00±0.06 3.10±0.42 0.5 13.57±0.32 3.43±0.09 4.13±0.15 2.60±0.12 0.6 13.67±0.15 3.37±0.15 2.93±0.27 3.17±0.19
CONCLUSION
The present study was designed to investigate the effect of sulphate reduction bacteria
(SRB) on compressive strength and water penetration as influenced by water cement ratio
(w/c) regarding bio-concrete structure on chloride condition. The results of this investigation
showed that the best water cement ratio is 0.5w/c while the most appropriate concentration of
SRB is 5%. These findings were obtained according to the highest compressive strength
observed during curing period and the lowest water penetration results. More broadly,
research is needed to determine the flexural strength test on the bio-concrete combined with
further investigation in aggressive condition such as chloride attack. Thus, this innovation can
be applied as the newest alternative in construction especially for structures built on coastal
areas.
ACKNOWLEDGEMENT
This study has been granted by the Ministry of Higher Education (MOHE) under
Fundamental Research Grant Scheme (FRGS Vot. 1577) and supported by Universiti Tun
Hussien Onn Malaysia (GPPS Vot. U445).
REFERENCES
Alonso, M. J. C ., Ortiz, C. E. L., Perez, S. O. G., Narayanasamy, R., San Miguel, G. del J.
F., Hernández, H. H. and Balagurusamy, N. (2017) Improved strength and durability of
concrete through metabolic activity of ureolytic bacteria. Environmental Science and
Pollution Research,1-8.
Alshalif, A. F., Irwan, J. M., Othman, N. and Anneza, L. H. (2016) Isolation of sulphate
reduction bacteria (SRB) to improve compress strength and water penetration of bio-
concrete. MATEC Web of Conferences, 47, 1–6.
Anneza, L. H., Irwan, J. M., Othman, N. and Alshalif, A. F. (2016) Identification of Bacteria
and the Effect on Compressive Strength of Concrete. MATEC Web of Conferences,
47,1008.
Babu, N. G. and Siddiraju, S. (2016) An Experimental Study on Strength and Fracture
Properties of Self Healing Concrete. International Journal of Civil Engineering and

MCRJ Special Issue Vol. 4 | No. 2 | 2018 139
Technology, 7(3): 398–406.
Balam, N. H., Mostofinejad, D. and Eftekhar, M. (2017) Effects of bacterial remediation on
compressive strength, water absorption, and chloride permeability of lightweight
aggregate concrete. Construction and Building Materials, 145: 107–116.
BSI EN 12390. Part 3: 2009.Compressive strength of test specimens, London.
BSI 1881. Testing Concrete: Part 125: 2013. Methods for mixing and sampling fresh
concrete in the laboratory. London.
BSI EN 12390, Testing Hardened Concrete: Part 8: 2009. Depth of Penetration of Water
Under Pressure, London.
BSI EN 12390, Part 11: 2015. Determination of the chloride resistance of concrete,
unidirectional diffusion standard by British-Adopted European Standard, London.
Chahal, N., Siddique, R. and Rajor, A. (2012) Influence of bacteria on the compressive
strength, water absorption and rapid chloride permeability of fly ash concrete.
Construction and Building Materials, 28(1): 351–356.
Darmawan, M. S. (2010) Pitting corrosion model for reinforced concrete structures in a
chloride environment. Magazine of Concrete Research, 62(2): 91–101.
Gandhimathi, A. and Suji, D. (2015) Studies on the Development of Eco-friendly Self-healing
Concrete - A Green Building Concept. Nature Environment and Pollution Technology,
14(3): 639–644.
Irwan, J. M., Anneza, L. H., Othman, N. and Alshalif, A. F. (2016) Compressive strength and
water penetration of Concrete with Enterococcus Faecalis and calcium lactate. Key
Engineering Materials, 705: 345–349.
Irwan, J. M., Anneza, L. H., Othman, N., Alshalif, A. F., Zamer, M. M. and Teddy, T. (2017)
Mechanical Properties of Concrete with Enterococcus Faecalis and Calcium Lactate.
Procedia Engineering, 171: 592–597.
Jonker, J. L., von Byern, J., Flammang, P., Klepal, W. and Power, A. M. (2012) Unusual
adhesive production system in the barnacle Lepas anatifera: An ultrastructural and
histochemical investigation. Journal of Morphology, 273(12): 1377–1391.
Kalhori, H. and Bagherpour, R. (2017) Application of carbonate precipitating bacteria for
improving properties and repairing cracks of shotcrete. Construction and Building
Materials, 148: 249–260.
Khalid, F.S., Azmi, N.B., Mazenan, P.N., Shahidan, S., Othaman N.H., and Guntor, N.A.A.
(2018) Self-consolidating concretes containing waste PET bottles as sand replacement.
AIP Conference Proceedings, 1930(020034):1-6.
Krishnapriya, S., Babu, D. L. V. and Arulraj, G. P. (2015) Isolation and identification of
bacteria to improve the strength of concrete. Microbiological Research, 174: 48–55.
Mazenan, P.N., Khalid, F.S., Shahidan, S. and Shamsuddin, S.M. (2017) Review of palm oil
fuel ash and ceramic waste in the production of concrete. IOP Conference Series:
Materials Science and Engineering, 271(012043),1-6.
Neville, A. (1995) Chloride attack of reinforced concrete: an overview. Materials and
Structures, 28(2): 63–70.
Neville, H. A., Oh, E., Spanierman, L. B., Heppner, M. J. and Clark, M. (2004) General and
culturally specific factors influencing black and white rape survivors’ self-esteem.
Psychology of Women Quarterly, 28(1): 83–94. Nosouhian, F., Mostofinejad, D. and Hasheminejad, H. (2015) Concrete Durability
Improvement in a Sulfate Environment Using Bacteria. The Journal of Materials in Civil
Engineering, 28(1).
Suwito, C. and Xi, Y. (2008) The effect of chloride-induced steel corrosion on service life of

MCRJ Special Issue Vol. 4 | No. 2 | 2018 140
reinforced concrete structures. Structure and Infrastructure Engineering, 4(3): 177–192.
Verma, S. K., Bhadauria, S. S. and Akhtar, S. (2013) Evaluating effect of chloride attack and
concrete cover on the probability of corrosion. Frontiers of Structural and Civil
Engineering, 7(4): 379–390.
Vijay, K., Murmu, M. and Deo, S. V. (2017) Bacteria based self healing concrete – A review.
Construction and Building Materials, 152: 1008–1014.
Zamer, M.M., Irwan, J.M., Othman, N., Faisal, S.K., Anneza, L.H., Teddy, T., and Alshalif,
A.F. (2017) Influence of Ureolytic Bacteria Toward Interlocking Compressed Earth
Blocks (ICEB) in Improving Durability of ICEB, MATEC Web of Conferences,
103(01027), 1-7.
Zivica, V. and Bajza, A. (2001) Acidic attack of cement based materials–a review. Part 1.
Principle of acid attack. Construction and Building Materials, 15(8): 331–340.

MCRJ Special Issue Vol. 4 | No. 2 | 2018 141
CHARACTERIZATION OF COAL BOTTOM ASH (CBA) HEAVY METAL ELEMENT AFTER ACID LEACHING TREATMENT A. A.Yahya 1, N. Ali 1 , N. L. Mohd Kamal 2, S. Shahidan 1, S. Beddu 2, M. F. Nuruddin 3, N. Shafiq3
1Repair, Strengthening and Rehabilitation of Structure Focus Group, Jamilus Research Center, Faculty of Civil and Environmental Engineering, Universiti Tun Hussein Onn Malaysia, Malaysia 2Civil Engineering Department, Universiti Tenaga Nasional, Malaysia 3Civil and Environmental Engineering Department, Universiti Teknologi Petronas, Malaysia
Abstract Coal ash is a residue which was produce during the combustion of coal. Coal fly ash (FA), coal bottom ash (CBA) and boiler slag was primarily produced from the combustion process. Unfortunately, the existences of metallic elements in CBA cause the limitation to use CBA in industries. Extensive researches have been carried out to reduce heavy metal element in CBA. From previous studies, the strong acid leaching treatment was carried out to remove metallic impurities in CBA. The usage of strong acid could significantly hazardous to human and environment. In this study, the leaching process was done by replacing the usage of strong acid with citric acid which acted as weaker acid. Experimental result shows that the acid leaching treatment has potential to be used in reducing metallic elements in CBA under optimum solution temperature of 400C with 4% acid concentration at 60 min reaction period. The characteristic of CBA was also determined by comparing the SEM, particle distribution, specific gravity, water content and setting time of raw CBA with treated CBA. Keywords: Coal bottom ash; Heavy metal; Leaching treatment
INTRODUCTION
Combustion of coal in power plant station produces coal bottom ash CBA consisting of
mostly incombustible inorganic and organic matter that is not fully burned. With a growth in
coal burning power station, a huge amount of CBA which considered as hazardous waste
material were conventionally disposed on site without any commerlization purpose. Instead
of dumping, CBA have a huge potential to be used in industries including as fine aggregate
replacement (Cheriaf et al., 1999; Senin et al., 2016) and construction material (Aggarwal and
Siddique, 2014). Reviewed made by (Kim and Lee, 2015) proved that CBA has been
conventionally used as soil replacement, gravel for embankment, structural fill, road
construction and various cement product. Besides, a good pozzolanic reaction between CBA,
OPC and water makes it possible to be used as cement replacement in concrete mixture
(Bajare et al., 2013). The use of industrial by-product as partial replacement material is found
to be significant for the development of alternative construction components as substitution
to the traditional materials (Pahroraji et al., 2016; Shahidan et al., 2016; Sheikh Khalid et al.,
2017; Shahidan et al, 2018).The major problems related to CBA disposal are probably due to
the presence of heavy metals in the residue. The existence of heavy metal elements in CBA
such as Copper (Cu), Nickel (Ni), Chromium (Cr), Zinc (Zn), Lead (Pb), Manganese (Mn),
Ferum (Fe) and Arsenic (As) resulting the classification of CBA in Malaysia under the
Schedule Waste (SW 104) Environmental Quality Act. After the coal burnings process, toxic
pollutants mainly released into the atmosphere which consequently leach out and contaminate
soils, as well as surface water and groundwater (Baba and Kaya, 2004).These elements
contained in the CBA have the ability to leach from them and thus enter the environment
where they can accumulate in the environment. In addition, the existence of those elements in

MCRJ Special Issue Vol. 4 | No. 2 | 2018 142
the ash could pollute the environment and pose a danger to public health and therefore an
effective treatment need to be done to overcome this problem. Leaching treatment is a proper
route to reduce heavy metal element in CBA. Previous researcher have proved the usage of
strong acid such as sodium oxide (NaOH) (Rashidi and Yusup, 2016), Nitric acid (Amfo-Otu
et al., 2015) and ammonium oxide (Augustine et al., 2016) were conventionally used in acid
treatment to reduce heavy metal in CBA. However, these agents is hazardous that may affect
the environment and human health.
MATERIAL: COAL BOTTOM ASH
Tanjung Bin power plant is one of the power plant that using coal to produce electricity.
Previous research reported that, Tanjung Bin power plants need approximately 18, 000
ton/day of coal to generate electricity(Muhardi et al., 2010; Shahidan et al., 2011; Ramzi et
al., 2016). Due to the large usage of coal, a huge amount of waste such as fly ash, bottom ash
and boiler slag will be produced and it is considerable in disposal concern because of the
increasing requirement for an ash storage space (Muhardi et al., 2010), hence, this will
increase the expanse to manage coal waste in large area that could lead to environmental
problem to the future (Faizul et al., 2014).
Table 1. Heavy metal compound in CBA Compound Concentration (%)
Pb 0.0016 Cu 0.0055
Ni 0.0071 Zn 0.0092 Cr 0.0118 As 0.0014 Fe - Mn -
METHODOLOGY: ACID LEACHING TREATMENT
Generally, leaching refers to the disposal of a substance from solid via a liquid extraction
media. The required component diffuses into the solvent from its natural solid form. In the
leaching process, there are three important parameters to be focused which are the
temperature, contact time per area and solvent selection. The concentration and temperature
and temperature of citric acid solution and stirring time were selected as the operating
parameter since the chelate reaction on metal impurities depending on the stated parameters
(Faizul et al., 2013). The temperature can be adjusted to optimize the solubility and mass
transfer throughout leaching process. There are two categories of leaching which are
percolation and dispersed solid. For percolation, the solvent was contacted with solid in a
continuous or batch method. Percolation method normally used for huge amount of solid. In
dispersed solids, the solid usually crushed into solid small pieces before being contacted with
solvent. Previous studies clarified that the heavy metal content in ash can be reduce by
extraction and leaching treatment (Sarode et al., 2010; shahidan et al., 2016). Coal bottom ash
that was collected from Tanjung Bin was used as raw material which contains heavy metal
compound. According to method proposed by several reserchers (Yahya et al., 2017 ; Faizul
et al., 2013), 40g of CBA with mean particle size of 45um was weighted and put into 1000
mL citric acid solution in beaker. The concentration and temperature of citric acid solution
were selected as operating parameter during leaching process while the stirring period was

MCRJ Special Issue Vol. 4 | No. 2 | 2018 143
recorded at 60 min. The acid concentration was gradually controlled from 2% to 5% by
changing the mixing ratio between distilled water and citric acid powder. Then, the beaker
was placed on the hot plate magnetic stirrer and the solution temperature was changed from
300C to 600C. After leaching process was done, water rinsing treatment was carried out in the
distilled water to removes excessive citric acid content from the ash. The treated CBA was
dried in the oven at 600C for 60 min. the material then was combusted at 8000C for 30 min in
furnace. The air flow rate in the combustion was set at 2 ml/s until the combustion process
end.
TESTING
All testing was done by comparing the result of OPC, Raw CBA and Treated CBA. The
characterizations of raw and treated CBA were determined by using Scanning Electron
Microscopy (SEM), Specific gravity, and Particle size distribution test. The specific gravity
of OPC, raw and treated CBA was determine by following the procedure defined in ASTM
D854-98. Particle size distribution was carried out by using particle analyzer (Analizette 22
Micro Tec Fritsch GmbH) on the original software. While the chemical properties of treated
CBA were determined by using XRF analysis. 40 pellet sample of treated CBA were prepared
and compared to the raw CBA sample. Water consistency test, setting time test was done on
cement paste by referring to ASTM C187.
RESULT AND DISCUSSION
Chemical compositions
Effect of Solvent with Acid Concentration
The reaction between solvent and acid concentration is one of the important factor to
achieve good result after leaching treatment. Table 2 shows the chemical composition of CBA
after acid treatment via citric acid solution with controlled concentration of 2, 3, 4 and 5 %.
From the experimental result, the heavy metal concentration of Pb, Cu, Ni and Cr tend to
increase compared to control CBA when 2% of acid concentration was used during leaching
treatment. Expectedly, the acid concentration increase at 3% and 4%, most of heavy metal
concentration decreases including metallic compound of Pb, Cu, Ni and Cr. But the heavy
metal concentration of Pb, Cu, Ni and Cr unexpectedly increase when the acid concentration
increase to 5%. The heavy metal concentration of Zn and As maintain decrease when the acid
concentration increase. Table 2. Concentration of heavy metal elements in CBA after acid leaching treatment with differences
acid concentration
(a) 2% of acid concentration
Compound Heavy metal concentration (%)
Control 2%, 30⁰C 2%, 40⁰C 2%, 50⁰C 2%, 60⁰C 2%, 70⁰C
Lead (Pb) 0.0016 0.0027 0.0028 0.0026 0.0018 0.0017 Copper (Cu) 0.0055 0.0063 0.0062 0.006 0.0058 0.0055 Nickel (Ni) 0.0071 0.0077 0.0131 0.0126 0.0073 0.0082 Zinc (Zn) 0.0092 0.0055 0.0048 0.0047 0.0068 0.0048 Chromium (Cr) 0.0118 0.0090 0.0514 0.0338 0.0450 0.0370 Arsenic (As) 0.0014 0.0009 0.0011 0.0008 0.0011 0.0009 Mangenese (Mn) - - - - - - Ferrum (Fe) - - - - - -

MCRJ Special Issue Vol. 4 | No. 2 | 2018 144
(b) 3% of acid concentration
Compound Heavy metal concentration (%)
Control 3%, 30⁰C 3%, 40⁰C 3%, 50⁰C 3%, 60⁰C 3%, 70⁰C
Lead (Pb) 0.0016 0.0015 0.0013 0.0025 0.0017 0.0018
Copper (Cu) 0.0055 0.0056 0.0054 0.0059 0.0055 0.0052
Nickel (Ni) 0.0071 0.0068 0.0069 0.0118 0.0072 0.0087
Zinc (Zn) 0.0092 0.0062 0.0059 0.0046 0.0066 0.0049
Chromium (Cr) 0.0118 0.0096 0.0171 0.0357 0.0133 0.0099
Arsenic (As) 0.0014 0.0011 0.0012 0.0009 0.0008 0.0011
Mangenese (Mn) - - - - - -
Ferrum (Fe) - - - - - -
(c) 4% of acid concentration
Compound Heavy metal concentration (%)
Control 4%, 30⁰C 4%, 40⁰C 4%, 50⁰C 4%, 60⁰C 4%, 70⁰C
Lead (Pb) 0.0016 0.0015 0.0014 0.0016 0.0019 0.0018
Copper (Cu) 0.0055 0.0056 0.0055 0.0057 0.0053 0.0051
Nickel (Ni) 0.0071 0.007 0.0071 0.0076 0.0078 0.0085
Zinc (Zn) 0.0092 0.0063 0.0057 0.0049 0.0050 0.0048
Chromium (Cr) 0.0118 0.0092 0.0087 0.0094 0.0113 0.0100
Arsenic (As) 0.0014 0.0008 0.0010 0.0010 0.0008 0.0010
Mangenese (Mn) - - - - - -
Ferrum (Fe) - - - - - -
(d) 5% of acid concentration
Compound Heavy metal concentration (%)
Control 5%, 30⁰C 5%, 40⁰C 5%, 50⁰C 5%, 60⁰C 5%, 70⁰C
Lead (Pb) 0.0016 0.0016 0.0018 0.0017 0.0018 0.0017
Copper (Cu) 0.0055 0.0055 0.0054 0.0057 0.0054 0.0052
Nickel (Ni) 0.0071 0.0074 0.0078 0.0073 0.0085 0.0083
Zinc (Zn) 0.0092 0.0053 0.0051 0.0051 0.0050 0.0052
Chromium (Cr) 0.0118 0.0097 0.0109 0.0106 0.0100 0.0111
Arsenic (As) 0.0014 0.0008 0.0010 0.0010 0.0007 0.0008
Mangenese (Mn) - - - - - -
Ferrum (Fe) - - - - - -
Effect of Solution Temperature
Table 3 shows the chemical composition of CBA after leaching treatment was done under
different solution temperature. Some researchers had done leaching treatment under ambient
temperature. The solution temperature highly effects the heavy metal concentration after
leaching treatment especially for heavy metal Pb, Cu and Ni. At 300C, concentration for Cu
shows some increasement but the heavy metal of Pb and Ni decrease at certain acid
concentration. But, the concentration of heavy metal Pb, Cu and Ni continuously show a
higher value compared to control CBA when the solution temperature was changed to 50, 60
and 700C.

MCRJ Special Issue Vol. 4 | No. 2 | 2018 145
Result shows that the use of high temperature can increase the leaching performance but
the use of organic acid with high temperature seems to be limited due to low boiling
temperature and the decomposition of citric acid. The temperature tends to vaporize the acid
and distilled water (Gharabaghi et al., 2010).
Table 3. Concentration of heavy metal elements in CBA after acid leaching treatment with differences
temperature
(a) 30⁰C of solution temperature
Compound Heavy metal concentration (%)
Control 30⁰C, 2% 30⁰C, 3% 30⁰C, 4% 30⁰C, 5%
Lead (Pb) 0.0016 0.0027 0.0015 0.0015 0.0016
Copper (Cu) 0.0055 0.0063 0.0056 0.0056 0.0055
Nickel (Ni) 0.0071 0.0077 0.0068 0.0070 0.0074
Zinc (Zn) 0.0092 0.0055 0.0062 0.0063 0.0053
Chromium (Cr) 0.0118 0.0090 0.0096 0.0092 0.0097
Arsenic (As) 0.0014 0.0009 0.0011 0.0008 0.0008
Mangenese (Mn) - - - - -
Ferrum (Fe) - - - - -
(b) 40⁰C of solution temperature
Compound Heavy metal concentration (%)
Control 40⁰C, 2% 40⁰C, 3% 40⁰C, 4% 40⁰C, 5%
Lead (Pb) 0.0016 0.0028 0.0013 0.0014 0.0018
Copper (Cu) 0.0055 0.0062 0.0054 0.0055 0.0054
Nickel (Ni) 0.0071 0.0131 0.0069 0.0071 0.0078
Zinc (Zn) 0.0092 0.0048 0.0059 0.0057 0.0051
Chromium (Cr) 0.0118 0.0514 0.0171 0.0087 0.0109
Arsenic (As) 0.0014 0.0011 0.0012 0.0010 0.0010
Mangenese (Mn) - - - - -
Ferrum (Fe) - - - - -
(c) 50⁰C of solution temperature
Compound Heavy metal concentration (%)
Control 50⁰C, 2% 50⁰C, 3% 50⁰C, 4% 50⁰C, 5%
Lead (Pb) 0.0016 0.0026 0.0025 0.0016 0.0017
Copper (Cu) 0.0055 0.006 0.0059 0.0057 0.0057
Nickel (Ni) 0.0071 0.0126 0.0118 0.0076 0.0073
Zinc (Zn) 0.0092 0.0047 0.0046 0.0049 0.0051
Chromium (Cr) 0.0118 0.0338 0.0357 0.0094 0.0106
Arsenic (As) 0.0014 0.0008 0.0009 0.0010 0.0010
Mangenese (Mn) - - - - -
Ferrum (Fe) - - - - -

MCRJ Special Issue Vol. 4 | No. 2 | 2018 146
(d) 60⁰C of solution temperature
Compound Heavy metal concentration (%)
Control 60⁰C, 2% 60⁰C, 3% 60⁰C, 4% 60⁰C, 5%
Lead (Pb) 0.0016 0.0018 0.0017 0.0019 0.0018
Copper (Cu) 0.0055 0.0058 0.0055 0.0053 0.0054
Nickel (Ni) 0.0071 0.0073 0.0072 0.0078 0.0085
Zinc (Zn) 0.0092 0.0068 0.0066 0.0050 0.0050
Chromium (Cr) 0.0118 0.0450 0.0133 0.0113 0.0100
Arsenic (As) 0.0014 0.0011 0.0008 0.0008 0.0007
Mangenese (Mn) - - - - -
Ferrum (Fe) - - - - -
(e) 70⁰C of solution temperature
Compound Heavy metal concentration (%)
Control 70⁰C, 2% 70⁰C, 3% 70⁰C, 4% 70⁰C, 5%
Lead (Pb) 0.0016 0.0017 0.0018 0.0018 0.0017
Copper (Cu) 0.0055 0.0055 0.0052 0.0051 0.0052
Nickel (Ni) 0.0071 0.0082 0.0087 0.0085 0.0083
Zinc (Zn) 0.0092 0.0048 0.0049 0.0048 0.0052
Chromium (Cr) 0.0118 0.0370 0.0099 0.0100 0.0111
Arsenic (As) 0.0014 0.0009 0.0011 0.0010 0.0008
Mangenese (Mn) - - - - -
Ferrum (Fe) - - - - -
Characterization of CBA
Scanning Electron Microscope (SEM)
Figure 2 and Figure 3 shows a SEM photomicrograph of Tanjung Bin CBA with mean
particles of 75 µm which was taken at magnification of 500,300 and 50. Result shown in
Figure 1 (a) and Figure 2 (a) shows that, majority of raw CBA particle were irregular,
spherical and angular in term of shape. The ash consists of a series of spherical vitreous
particles of different size with diameters ranging from 20 µm to 100 µm. Bottom ash particles
appeared to be in three type which is fine fraction of shattered bottom ash particle, spherical
particles like fly ash and agglomerates of bonded particles (Muhardi et al., 2010). The
existence of finer particle shows an appearance of metallic lustre and could be the metals
presents in coal bottom ash (Pollock et al.,2000) .Figure 1 (b) shows a lot of finer particle
which were observed on the surface of larger particle compared to the treated CBA on Figure
2 (b). The less existence of finer particle on Figure 2 (b) may be due to the successful of acid
leaching treatment using citric acid that has been done.

MCRJ Special Issue Vol. 4 | No. 2 | 2018 147
Particle Distribution
Figure shows the comparison of particle distribution between raw CBA and treated CBA.
From the graph, the maximum coarse particle ranges between 20 to 50 µm does not show
significant differences where the weight for raw CBA was 35.06% while treated CBA shows
37.56%. Meanwhile, 37.62% of raw CBA and 27.50% of treated CBA was observed with
particle range from 10 to 20 µm. The average value percentage of the particles smaller than
5μm of raw CBA and treated CBA was 17.79% and 16.49 % respectively.
From this test, the results show for raw CBA obtained from Tanjung Bin power plant
contained the least fine particles (5% < 2.439 μm). After the CBA was treated, the least fine
particle decreases to (5% < 2.226 μm) The mass median diameter (MMD) was determined
from the particle diameter at 50% of the cumulative fractions, D50 which is 16.584 μm for
raw CBA and 16.793 μm of the particles
(a) 100 magnification
(b) 1200 magnification Figure 1. SEM image of raw CBA
(a) 100 magnification
(b) 1200 magnification Figure 2. SEM image of treated CBA

MCRJ Special Issue Vol. 4 | No. 2 | 2018 148
Figure 3. Comparison of particle distribution between raw CBA and treated CBA
Specific gravity
The graphical data in Fig 4 shows that, the specific gravity of treated CBA was the lowest
with value 2.28 compared to OPC and raw CBA. While OPC shows the highest specific
gravity with value of 2.82. previous research also shows that the specific gravity of CBA was
lower than OPC (Abubakar and Baharudin, 2012). The lower specific gravity of CBA may
due to the porous structure and pop-corn like particles where it could be easily degraded under
loading compaction. The state of the material at the time it was utilize could affect the specific
gravity since raw CBA was dried using oven and treated CBA was combusted in furnace.
Normally, the specific gravity of coal bottom ash depending on their type, origin, size,
handling and processing technique, boiler size and disposal method and storage method
(Abubakar and Baharudin, 2012). Previous researcher reported that, the wide range in specific
gravity was associated with the chemical composition of CBA. Low iron oxide content
resulting in lower specific gravity and vice versa.
Figure 4. Graphical data for all samples
Water Consistency and setting time
Normal consistency and setting time of OPC, raw CBA and treated CBA are shown in
Table 4. The normal consistency of cement paste was 26.8%. it was proved by previous
research where they found that the water consistency of normal cement paste usually in range
0102030405060708090
100
110100
Pe
rce
nta
ge p
assi
ng
(%
)
Particle size (µm)
RAW CBA
Treated CBA
2.82
2.31 2.28
OPC Raw CBA Treated CBA
Specific Gravity

MCRJ Special Issue Vol. 4 | No. 2 | 2018 149
of 26-33% (Abubakar and Baharudin, 2012). Meanwhile, results in Table 4 shows that the
water consistency for raw CBA and treated CBA were increase with the increase of CBA
replacement. It indicate that the increase of CBA replacement on OPC resulted in higher water
requirement (Chai Jaturapitakkul, 2003). Meantime, it was identified that the addition of CBA
to cement material increase the initial and final setting time in the relation to the reference
mix. It was found that the initial and final setting time for normal cement paste was 80 min
and 180 min. While the setting time for CBA was increase with increasing the percentage of
replacement. The initial setting time for raw CBA was recorded at 90,120 and 180 min the
final setting time was recorded at 235,270 and 300 min for replacement of 10, 20 and 30%
respectively. Result for treated CBA shown at the replacement of 10, 20 and 30%, the initial
setting time was at 80, 12 and 160 min respectively. Meantime, the final setting time was at
220, 240 and 275 min respectively. Although the high water requirement for treated CBA, but
the initial and final setting time much quicker compared to raw CBA. the result obtained by
previous researcher proved that the use of CBA to replace OPC is slightly retarded the setting
time of cement paste (Chai Jaturapitakkul, 2003).
Table 4. Water Consistency and Setting Time of OPC, Raw CBA and Treated CBA
Replacement
(%)
Water Consistency
(%)
Initial Setting Time
(min)
Final Setting Time
(min)
OPC - 26.8 80 180
Raw CBA 10 30 90 235 20 35.8 120 270 30 41.9 180 300
Treated CBA
10 33 80 220
20 37.5 120 240
30 43.5 160 275
CONCLUSION
The experimental study shows that there are possibilities to reduce heavy metal element
in CBA through acid leaching treatment especially for heavy metal Zn, Cr and As. The change
of acid concentration and solution temperature does not affect the percentage value although
there are few state where the percentage value increase compared to control CBA. The heavy
metal of Pb, Cu and Ni was a optimum state where the heavy metal concentration were
increase when 2% and 5% of acid concentration was used while the heavy metal concentration
were decrease when 3% and 4% of acid concentration was applied. When higher temperature
was applied, the percentage of concentration of heavy metal Pb, Cu and Ni was increase. The
comparison of SEM micrograph between raw CBA and treated CBA proved that the heavy
metal content in CBA was reduced. The specific gravity of treated CBA was the recorded as
the lowest due to the complicated sample preparation itself.
ACKNOWLEDGEMENT
This research was supported by Postgraduate Research Grant under Office of Research,
Innovation, Commerlization, Consultancy management (ORRIC), Universiti Tun Hussein
Onn Malaysia (Project Vote No: U444) and Fundamental Research Grant Scheme (FRGS) by
Minister of Higher Education (Grant No. 1576).

MCRJ Special Issue Vol. 4 | No. 2 | 2018 150
REFERENCES
Abubakar, A. U. and Baharudin, K. S. (2012) Potential Use of Malaysia Thermal Power Plants
Coal Bottom Ash in Construction. International Journal of Sustainable Construction
Engineering & Technology, 2(3): 25-37.
Abubakar, A. U. and Baharudin, K. S. (2013) Tanjung Bin Coal Bottom Ash: From Waste to
Concrete Material. Proceeding of International Conference on MEMS and Mechanics
(MEMSM 2013). Wuhan, China, 163-168.
Aggarwal, Y. and Siddique, R. (2014) Microstructure and Properties of Concrete Using
Bottom Ash and Waste Foundry Sand as Partial Replacement of Fine Aggregates. Journal
of Construction and Building Materials, 54: 210-223.
Amfo-Otu, R., Graham K. S., Adu, O. E. and Sadick A. (2015) Comparative Study of Heavy
Metals in Bottom Ash from Incinerators and Open Pit from Healthcare Facilities in
Ghana. Octa Journal of Environmental Research, 3(1): 50–56.
Augustine, Q., Wenyu, X., and Lin Guo, D. W. (2016) Heavy Metal Removal from
Incineration Bottom Ash Through Washing with Rainwater and Seawater. International
Journal of Waste Resources, 1(6): 2-9.
Baba, A. and Kaya, A. (2004) Leaching Characteristics of Solid Wastes from Thermal Power
Plants of Western Turkey and Comparison of Toxicity Methodologies. Journal of
Environmental Management, 3(73): 199-207.
Bajare, D., Bumanis, G. and Upeniece, L. (2013) Coal Combustion Bottom Ash as Microfiller
with Pozzolanic Properties for Traditional Concrete. Journal of Procedia Engineering,
57: 149–158.
Chai Jaturapitakkul, R. C. (2003) Development of Bottom Ash as Pozzolanic Material.
Journal of Material in Civil Engineering, 15(1): 48–53.
Cheriaf, M., Rocha, J. C. and Péra, J. (1999) Pozzolanic Properties of Pulverized Coal
Combustion Bottom Ash. Journal of Cement and Concrete Research, 9(29) :1387–1391.
Faizul, C. P., Abdullah, C. and Fazlul, B. (2014) Extraction of Silica from Palm Ash Using
Organic Acid Leaching Treatment. Proceeding of International Conference on Advance
Material Engineering and Technology (ICAMET 2013), Bandung,Indonesia, 594–595.
Faizul, C. P., Abdullah, C. and Fazlul, B. (2013) Extraction of Silica from Palm Ashvia Citric
Acid Leaching Treatment. Journal of Advances in Environmental Biology. 7(12) :3690-
3695.
Gharabaghi, M., Irannajad, M. and Noaparast, M. (2010) A Review of the Beneficiation of
Calcareous Phosphate Ores Using Organic Acid Leaching. Journal of
Hydrometallurgy.1-4(103) :96-107.
Kim, H. K. and Lee, H. K. (2015) Coal Bottom Ash in Field of Civil Engineering: A Review
of Advanced Applications and Environmental Considerations. KSCE Journal of Civil
Engineering, 19(6):1802–1818.
Muhardi, A., Marto, A., Kassim, K. A., Makhtar, A. M., Wei, L. F., and Lim, Y. S. (2010)
Engineering characteristics of Tanjung Bin coal ash. Electronic Journal of Geotechnical
Engineering.1(15):1117-1129.
Pahroraji, M. E. H. M., Saman, H. M. Rahmat, M. N. and Kamaruddin, K. (2016) The Effect
of Using GGBS and Foam on the Mechanical Properties of Unfired Coal Ash Foam Brick.
Malaysian Construction Research Journal, 19 (2): 85-102.
Pollock, S. M., Goodarzi, F. and Riediger, C. L. (2000) Mineralogical and Elemental
Variation of Coal from Alberta, Canada: An Example from The No. 2 Seam, Genesee
Mine. International Journal of Coal Geology, 1-4 (43): 259-286.

MCRJ Special Issue Vol. 4 | No. 2 | 2018 151
Rashidi, N. A. and Yusup, S. (2016) An Overview on the Potential of Coal- Based Bottom
Ash As Low-Cost Adsorbents. Journal of ACS Sustainable Chemistry & Engineering,
4(4) :1870-1884.
Ramzi Hannan, N. I. R., Shahidan, S., Maarof, M. Z. and Ali, N. (2016) Physical and
Chemical Properties of Coal Bottom Ash (CBA) from Tanjung Bin Power Plant. IOP
Conference Series: Materials Science and Engineering, 160, (1).
Sarode, D. B., Jadhav, R. N., Khatik, V. A., Ingle, S. T. and Attarde, S. B. (2010) Extraction
and Leaching of Heavy Metals from Thermal Power Plant Fly Ash and Its Admixtures.
Polish Journal of Environmental Studies, 6(19): 1325-1330.
Senin, M. S., S. Shahidan, S., Leman, A. S., and Ramzi Hannan, N. I. R. (2016) Properties of
Cement Mortar Containing Rubber Ash as Sand Replacement. IOP Conference Series:
Materials Science and Engineering, 160(1).
Shahidan, S., Pullin, R., Bunnori, N. M., and S. S. Mohd Zuki, S. S. (2017) Active crack
evaluation in concrete beams using statistical analysis of acoustic emission data. Insight
- Non-Destructive Test. Cond. Monit., 59(1): 24–31.
Shahidan, S., Mohd Zuki, S. S. Rahim, M. A. and Ali, N. (2016) Amplitude Distribution of
Emission Wave for Cracking Process, MATEC Web Conference, 47, 2–8.
Shahidan, S Bunnori, N. M., Md Nor, N. and Basri, S. R. (2011) Health Index Evaluation on
Acoustic Emission Signal for Concrete Structure by Intensity Analysis Method. Adv.
Mater. Res., 403–408: 3729–3733.
Shahidan, S., Ranle, N. A., Mohd Zuki, S. S., Sheikh Khalid, F., Nazri, F. M., and Ridzuan,
A. R. M. “Concrete Incorporated with Optimum Percentages of Recycled Polyethylene
Terephthalate ( PET ) Bottle Fiber,” Int. J. Integr. Eng., vol. 10, no. 1, pp. 1–8, 2018
Sheikh Khalid, F., Herman, H.S. and Bazilah Azmi, N. (2017) Properties of sugarcane fiber
on the strength of the normal and lightweight concrete. MATEC Web of Conferences,
103(01021),1-7.
Yahya, A. A., Ali, N., Mohd Kamal, N. L., Shahidan, S., Beddu, S., Nuruddin, M. F. and
Shafiq, N. (2017) Reducing Heavy Metal Element from Coal Bottom Ash by Using Citric
Acid Leaching Treatment. MATEC Web of Conferences, 103(01004),1-7.
MCRJ Special Issue Vol. 4 | No. 2 | 2018 152
IMPROVEMENT OF STRENGTH AND WATER ABSORPTION OF INTERLOCKING COMPRESSED EARTH BRICKS (ICEB) WITH ADDITION OF UREOLYTIC BACTERIA (UB) M.M. Zamer1, J.M. Irwan1, N. Othman2 and F.S Khalid1
1Jamilus Research Centre for Sustainable Construction (JRC), Faculty of Civil and Environmental Engineering, University Tun Hussein Onn, Malaysia, 86400 Parit Raja, Johor,Malaysia 2MicroPollutant Research Centre (MPRC), Faculty of Civil and Environmental Engineering, University Tun Hussein Onn, Malaysia, 86400 Parit Raja, Johor,Malaysia
Abstract Interlocking Compressed Earth Brick (ICEB) are cement stabilized soil bricks that allow for dry stacked construction. This characteristic resulted to faster the process of building walls and requires less skilled labour as the bricks are laid dry and lock into place. However there is plenty room for improving the interlocking bricks by increase its durability. Many studies have been conducted in order to improve the durability of bricks by using environmentally method. One of the methods is by introducing bacteria into bricks. Bacteria in brick induced calcite precipitation (calcite crystals) to cover the voids continuously. Ureolytic Bacteria (UB) was used in this study as a partial replacement of limestone water with percentage of 1%, 3% and 5%. Enrichment process was done in soil condition to ensure the survivability of UB in ICEB environment. This paper evaluates the effect of UB in improving the strength and water absorption properties of ICEB and microstructure analysis. The results show that addition of 5% UB in ICEB indicated positive results in improving the ICEB properties by 15.25% in strength, 14.72% in initial water absorption and 14.68% reduction in water absorption. Precipitation of calcium carbonate (CaCo3) in form of calcite can be distinguish clearly in microstructure analysis. Keywords: Compressive strength, Calcite precipitation, ICEB, ureolytic Bacteria, , Water absorption
INTRODUCTION
Interlocking compressed earth brick (ICEB) masonry has the potential to provide
affordable construction around the world. Comprised of basic, inexpensive materials, such as
soil, the bricks can provide homes and other facilities at low cost (Haron et al., 2009; Sheikh
Khalid et al., 2017). By creating interlocking joints between layers of bricks, ICEBs allow for
the bricks to be dry stacked, without the need for mortar. ICEB is a cost effective and
sustainable construction material. ICEB construction has the potential to bring durable and
affordable homes to developing countries around the world (Laursen et al., 2012). Today,
ICEB construction is becoming increasingly popular in developing countries including
Malaysia.
Despite the advantages, ICEB also has some deficiencies. According to Irwan et al.,
(2016) there are other problems associated with ICEB namely low strength, higher water
absorption, low fire resistance and high porosity. Water absorption is a function of clay and
cement content and usually related with the strength and durability of earth bricks (Riza et al.,
2010). The higher rate of water absorption will results in low compressive strength and
durability (Khalid et al., 2018).

MCRJ Special Issue Vol. 4 | No. 2 | 2018 153
Production ICEBs by factory were coated with chemical substances which is used to
counter erosion due to long periods of high relative humidity. Consequently, the maintenance
costs or even early rebuilding costs of deteriorated ICEBs structures are undesirable and
unsustainable (Riza et al., 2010). Therefore, to achieve sustainable construction,
environmental friendly solution should be implemented to the ICEB.
Previous studies had taken different approach to improve the properties of construction
material by introducing the used of bacteria. The use of bacteria is one of new fundamental
research in improving construction material in order to pursuit sustainable construction.
Researcher such as Muynck et al. (2008) used Bacillus sphaericus, Navdeep et al. (2012) used
Bacillus megaterium, Mukherjee et al. (2013) used Bacillus megaterium and Bernardi et al.,
(2014) used Sporosarcina paseurii. All bacteria used by previous studies resulted in
increasing on compressive strength and reduction on water absorption by comparing control
sample and treated sample with bacteria. Positive results from previous studies indicated that
the successfulness of using bacteria as an environmental friendly solution in improving the
durability of construction material. According to Siddique et al. (2011), bacteria are able to
promote the precipitation of calcium carbonate (CaCO3) in the form of calcite. These calcite
acts as bio-sealant by filling the pores which lead to reduction in water absorption, porosity,
permeability, enhance the strength and prevent water ingression. Hence it will improve the
durability of the material properties.
Even extensive of research incorporated bacteria in construction material, less knowledge
were found on application of bacteria in ICEB. Ureolytic bacteria (UB) was selected for this
study as an approach toward environmental solution in improving the engineering properties
of ICEB. The origin of bacteria used was the same as Irwan et al. (2016b) study which state
that UB origin was from fresh urine. Irwan et al. (2016b) study also reported that UB are able
to improve the construction material properties by bacterial activities to producing calcium
carbonate. Due to availability, locality and positive results from previous research, promote
to the selection of UB toward this study. The understanding on fundamental precipitation
calcium carbonate (CaCO3) had been applied in this research with the use of ureolyric
bactreria (UB) to improve the durability of ICEB.
Therefore, this research hopes that an environmental friendly solution to improve the
durability and properties of ICEB would be produced by introducing the used of bacteria in
ICEB.
EXPERIMENTAL
Optimum growth condition was a first attempt before using the bacteria in ICEB. Optimal
growth need to be measured for ensuring high survival of the bacteria after addition in the
brick. Optimum growth condition was measured throughout enrichment process. The
enrichment process is important in order to simulate the condition for the bacteria to growth
in ICEB environment. This was to ensure the bacteria can acclimatize under ICEB
environment. Two sets of UB enrichment were prepared namely control and treatment
specimen. The composition of the treatment enrichment consists of 300ml nutrient broth
added with 120ml of 40% urea, 1mg of soil substances and lastly 1 cyrogenic bead of ureolytic
bacteria. The differences between the compositions of control were the enrichment was done
without the soil sample. The method of enrichment process follows the previous study (Irwan

MCRJ Special Issue Vol. 4 | No. 2 | 2018 154
et al., 2016 and Othman et al., 2017) by adjusting the pH in alkaline and anaerobic condition
for ensuring the survival of ureolytic bacteria in ICEB environment.
The compressive strength, initial rate of water absorption and water absorption test was
determined by using ICEB (100mm x 125mm x 250mm) specimen and was measured for 7th,
14th and 28th days. The initial rate of water absorption was done to determine the ability of
ICEB to allow the water to pass through it in 1 minute whereas the water absorption test
conducted to determine the saturation coefficient which is defined as the percentage of pore
volume filled in 24-hour of soaking. The test was done in Structure and Material Laboratory,
Universiti Tun Hussein Onn Malaysia (UTHM). There are four set batches of ICEB
represented by 0% (control), 1% UB, 3% UB and 5% UB which was partially replaced of
limestone water during ICEB production. All batches were tested with a total of 10 samples
for each test and batches. The average results are presented and discussed. The test was carried
out according to the BS EN 771-1:2011+A1:2015, which specify for the testing for masonry
units. The microstructure analysis was done in determination of pore size and morphology
precipitation of calcium carbonate (CaCO3) in ICEB. Small fragment of ICEB from the
compressive strength test were taken and analyses using Scanning Electron Microscopy
(SEM) to determine the position, size, shape and characteristics of the UB in depositing calcite
or calcium carbonate in ICEB. The SEM analysis was done for each 0% (control), 1% UB,
3% UB and 5% UB respectively.
RESULT AND DISCUSSION
Compressive strength
Figure 1 shows the results of compressive strength for 7th, 14th and 28th days of testing.
The addition of UB as a liquid culture of 1%, 3% and 5% in ICEB increased the compressive
strength within time compared to control specimen. The patterns of compressive strength
increment are the same for all bacterial ICEB specimen. The highest compressive strength
recorded was 6.35 N/mm2 at the 28th days of testing for 5% addition of UB.
The increment of compressive strength with addition of bacteria agreed with Navdeep et
al. (2013) and Ramachandran et al. (2001) studies which states that compressive strength can
be significantly increased by application of bacteria calcite. Studies from Siddique and Chalal
(2011) have stated in their studies that application of bacterial in material construction would
give higher compressive strength compared to control samples due to bacterial activities in
depositing calcium carbonate. Bacteria in ICEB induced calcite precipitation (calcite crystals)
to cover the cracks continuously. Thus improve the strength. Positive results from the addition
of UB in ICEB showed the enhancement of compressive strength properties. Therefore the
results of compressive strength increment with addition of bacteria are in accordance with
previous research findings.

MCRJ Special Issue Vol. 4 | No. 2 | 2018 155
Figure 1. Compressive strength of control and bacterial ICEB
Initial rate of water absorption
Figure 2 shows the results of initial water absorption for 7th, 14th and 28th days of testing.
The addition of UB as a liquid culture of 1%, 3% and 5% in ICEB reduced the initial water
absorption within time compared to control specimen. The reduction pattern of water
absorption rates are the same for all bacterial ICEB specimens. The addition of 5% UB
indicates the highest reduction of water absorption rates by 14.72% at 28th days compared to
control sample follows with 3% of UB by 11.11% and 1% of UB by 7.5%. The highest
reduction of initial water absorption recorded was 3.07kg/m2.min at the 28th days of testing
for 5% addition of UB.
Significant reduction in the extent of water absorption was seen in bacterial cases which
clearly indicated that the expected result of bacterial calcification, carbonate crystals were
deposited and the pores have reduced within the bricks. However, as a result of the
alkalinization of the environment, heterogeneous precipitation can also occur on the surface
of the pores. This could result in the plugging of smaller pores (Muynck et al., 2008) which
have led to decreased water absorption rates. Muynck et al. (2008) and Achal et al.
(2011) studies also observed decreasing in initial water absorption rate upon treatment with
bacteria.
Figure 2. Initial water absorption of control and bacterial ICEB
2
2.5
3
3.5
4
4.5
5
5.5
6
6.5
7th Days 14 Days 28 Days
Co
mp
ress
ive
str
en
gth
(N
/mm
²)
Control(0%)
1% UB
2.8
2.9
3
3.1
3.2
3.3
3.4
3.5
3.6
7 Days 14 Days 28 Days
Init
ial
ra
te o
f w
ate
r a
bso
prti
on
(kg
/m²)
.min
0%
(Control)1% UB
3% UB

MCRJ Special Issue Vol. 4 | No. 2 | 2018 156
Water absorption by 24-hour soaking
Figure 3 shows the results of water absorption by 24hour soaking for 7th, 14th and 28th
days of testing. The addition of UB as a liquid culture of 1%, 3% and 5% in ICEB reduced
the percentage of water absorption within time compared to control specimens. The reduction
pattern of water absorption rates are the same for all bacterial ICEB specimen. The addition
of 5% UB indicates the highest reduction by 14.68% in water absorption at 28th days compared
to control sample follows with 3% of UB with 11.83% and 1% of UB with 10.73%.
According to Mukherjee et al. (2013), the calcite crystal (calcium carbonate) acts as
biosealent by filling the pores which leads to reduction in water absorption, porosity, and
permeability. The presence of bacteria resulted in a significant decrease in the water
absorption compared to control specimens. The deposition of a layer of calcium carbonate on
the surface and inside pores of the ICEB specimens resulted in a decrease of water absorption
and permeability.
Study was conducted by Nemati and Voordouw, (2003) noticed a decrease in the
permeability after injecting calcium carbonate forming reactants. Therefore, it has similarity
between present study and the study reported that the presence of a layer of carbonate crystals
by bacterial cells has the ability to improve the resistance of penetration of water absorption.
Figure 3. Percentage of water absorption by 24-hour soaking for control and bacterial ICEB
Microstructure analysis
Microstructure analysis shows that UB successful to survive inside the ICEB specimens
in anaerobic condition and also capable to tolerate in alkaline environment. Figure 4 shows
the average results for pore size analyses on control ICEB and bacterial ICEB. Control image
generally showed rough and uneven surface. This porous surface from control samples led to
increase of water absorption ability and hence decrease in strength and durability. In bacterial
ICEB some part of the porous surface has been filled by calcite precipitation, thus resulted in
reducing the pore size. There are also appearances of calcite precipitation which can be seen
as smooth surface of round sphere in bacterial ICEB microstructure image in Figure 5. The
smooth surface of round sphere indicated the bacterial forms of calcium carbonate. The
6
6.5
7
7.5
8
8.5
9
9.5
10
10.5
7 Days 14 Days 28 Days
Wa
ter a
bso
rpti
on
per
cen
tag
e
(%)
0%
(Control)
1% UB

MCRJ Special Issue Vol. 4 | No. 2 | 2018 157
average size of calcite forms was evaluated and compared between control and bacterial
ICEB. Control sample which can be seen without precipitation of bacterial calcite due to 0%
percentage of UB addition. Addition of 3% UB indicate highest average size of bacterial
calcite form which is 12.469m follows with 1% of UB with 9.212m and 5% of UB by
7.815m. The calcium carbonate precipitation was to prove that addition of UB in ICEB
promote to bacterial calcite precipitation.
a) Control: (Average pore size = 0.839 m)
b) 1% UB: (Average pore size = 0.772 m)
c) 3% UB: (Average pore size = 0.650 m)
d) 5% UB: (Average pore size = 0.643 m)
Figure 4. Pore measurement for control and bacterial ICEB
The pores has being filled by bacteria in ICEB and surface for these samples in Figure 4
appear more compact and smooth compared to control which is rough and porous in nature.
Decrement in pore size of bacterial ICEB compared to control ICEB was also observed.
Addition of 5% UB resulted highest reduction in average pore size with 0.643m follows with
3% UB by 0.650m and 1% UB with 0.772m compared to the control specimen which was
0.839m. Addition of 5% UB in ICEB indicated the highest reduction of pore size compared
to the control sample by 23.36%. Therefore, the results from microstructure analysis prove
that by addition of UB in ICEB resulted in reducing the pores and precipitation of bacterial
calcite. The reduction of pores resulted into the improvement of ICEB properties such as
strength, water absorption and durability as the calcite occupied the pores thus, created new
bonding between mixed materials and prevented the water penetration. These findings have
been proved by the engineering properties testing that was done toward ICEB which indicates
that addition of UB improve engineering properties of ICEB compared to control sample.
Pores Pores
Pores
Pores
Calcite Calcite
Calcite

MCRJ Special Issue Vol. 4 | No. 2 | 2018 158
These findings agreed with Navdeep et al. (2012) studies which indicated the improvement
of material engineering properties due to deposition of calcium carbonate.
a) Control: (Average size = 0)
b) 1% UB: (Average size = 9.212 m)
c) 3% UB: (Average size = 12.469 m)
d) 5% UB: (Average size = 7.815 m)
Figure 5. Precipitation of calcium carbonate for control and bacterial ICEB
CONCLUSION
The addition of ureolytic bacteria (UB) significantly improves the strength of ICEB by
10.71% - 15.25% increment compared to control sample. Addition of 5% UB has contributed
to an increased of 15.25% in strength at 28th days compared to control sample. The
compressive strength increased due to microbial activity which precipitated calcium
carbonate, and deposited calcite within the ICEB pores. Evaluation of deposited calcite
precipitation was confirmed through microstructure analysis.
Addition of UB in ICEB has significantly effects the water absorption of ICEB. Overall
result for initial and water absorption testing, the addition of bacteria (UB) indicated that
reduction of water absorption by 7.5% -14.72% of initial absorption and 10.73% -14.68% of
water absorption of 24-hour of soaking compared to control sample. The highest reduction
recorded was with addition of 5% UB for initial water suction and water absorption at 28th
days of testing by 14.72% and 14.68% respectively. The reduction of water absorption was
due to the plugging of pores within ICEB also by the precipitation of calcium carbonate in
form of calcite.
CaCo3
CaCo3
CaCo3

MCRJ Special Issue Vol. 4 | No. 2 | 2018 159
Microstructure analysis showed that the reduction of pore size in bacterial ICEB sample
compared to control sample from average pore of 0.839 to 0.643 (23.36%). Morphology
analysis of calcium carbonate shows that precipitation of calcium carbonate (CaCO3) in
bacterial specimen seen clearly compared to control sample with average size from 0 to
7.815m.
ACKNOWLEDGEMENT
This research was supported by University Tun Hussein Onn Malaysia (UTHM),
Malaysia, The Ministry of Higher Education Malaysia through Fundamental Research Grant
Scheme (FRGS), Vot. 1577 and collaboration with ICEB industry IRYAS INC. (M) Sdn Bhd.
REFERENCES
Achal, V., Mukherjee, A. and Reddy, M. S. (2011) Microbial Concrete: A way to enhance the
Durability of Building Structures. ASCE J. Materials for Civil Engineering, 23(6): 730-
734.
Bernadi, D., Dejong, J. T., Montoya, B. M. and MattineZ, B. C. (2014) Bio-bricks:
Biologically cemented sandstone bricks. Journal of Construction and Building Material,
55: 462-469.
Haron, N. A., Rahman, H. A. and Hamid, M. (2009) A Literature Review of the advantages
and barriers to the implementation of industrialised builing system (IBS) in Construction
Industry. Malaysia Construction Research Journal, 2(1): 10-14.
Irwan, J. M., Zamer, M. M. and Othman, N. (2016a) A review on Interlocking Compressed
Earth blocks (ICEB) with addition of bacteria, MATEC Web Conferences, 47(01017).
Irwan, J. M., Anneza, L. H., Othman, N., Husnul, T. and Alshalif, A.F (2016b) Isolation and
Identification of Concrete Environment bacteria. IOP Conference Series: Materials
Science and Engineering. 136(1), 012088.
Khalid, F.S., Azmi, N.B., Mazenan, P.N., Shahidan, S., Othaman N.H., and Guntor, N.A.A.
(2018) Self-consolidating concretes containing waste PET bottles as sand replacement.
AIP Conference Proceedings, 1930(020034):1-6.
Laursen, P. T., Herskedal, N. A., Jansen, D. C. and Qu, B. (2012) Out-of-plane Structural
Response of Interlocking Compressed Earth Block Walls. Journal of Materials and
Structure, 48(1): 321-336.
Mukherjee, A., Dhami, N. K., Reddy, B.V.V and Reddey, M. S. (2013) Bacterial Calcification
for Enhancing Performance of Low Embodied Energy Soil-Cement Bricks. Journal of
Sustainable Construction Material and Technology, 1: 1-10.
Muynck, W., De, Debrouwer, D., Belie, N. De and Verstraete, W. (2008) Bacterial carbonate
precipitation improves the durability of cementitious materials. Journal of Cement and
Concrete Research, 38(7): 1005-1014. Navdeep, K. D., Sudhakara, M., Reddy, Abhijit, M. (2012) Improvement in strength
properties of ash brics by bacterial calcite. Ecological Engineering, 39:31-35.
Nemati, M. and Voordouw, G. (2003) Modification of porous media permeability, using
calcium carbonate produced enzymatically in situ. Enzyme Microb. Technol. 33: 635–
642.
Othman, N., Irwan, J. M., Zamer, M. M., Anneza, L. H., Tambunan, T. and Faisal Alshalif,
A. (2017) Acclimatization Process of Ureolytic Bacteria (UB) with Soil Condition for

MCRJ Special Issue Vol. 4 | No. 2 | 2018 160
Interlocking Compressed Earth Block (ICEB) in Improving Compressive Strength
Properties. Journal of Advanced Science Letters, 23(5): 4341-4343.
Ramachandran S. K., and Ramkrishnan V. Bang, S. S. (2001) Remediation of concrete using
microorganisms. ACI Materials Journal 98 (1): 3–9. Riza, F.V., Rahman, I. A. and Zaidi, A. M. A. (2010) A brief review of compressed stabilized
earth brick (CSEB). Int. Conference on Science and Social Research, Kuala Lumpur,
Malaysia, 999-1004.
Sheikh Khalid, F., Herman, H.S., Bazilah Azmi, N., and Irwan, J.M. (2017) Sand cement
brick containing recycled concrete aggregate as Fine-Aggregate Replacement. MATEC
Web of Conferences, 103(01016),1-7.
Siddique, R., and Chalal, N. K. (2011) Effect of ureolytic bacteria on concrete properties.
Construction and building materials, 25: 3791-3801.
Zamer, M. M., Irwan, J. M., Othman, N., Faisal, S. K., Anneza, L. H., Teddy, T. and Faisal
Alshalif, A. (2017) Influence of Ureolytic Bacteria Toward Interlocking Compressed
Earth Blocks (ICEB) in Improving Durability of ICEB. MATEC Web of Conferences,
103(01027),1-7.
MCRJ Special Issue Vol. 4 | No. 2 | 2018 161
THE EFFECT OF CEMENT AND BAGASSE ASH ON THE ENGINEERING PROPERTIES OF CONTAMINATED SOIL Mohamad Azim Mohammad Azmi1,2, Saiful Azhar Ahmad Tajudin1,2, Ahmad Tarmizi Abdul Karim1, Shahiron Shahidan1
1Faculty of Civil and Environmental Engineering, Universiti Tun Hussein Onn Malaysia, 86400 Parit Raja, Batu Pahat, Johor, Malaysia. 2Research Centre for Soft Soil, Universiti Tun Hussein Onn Malaysia, 86400 Parit Raja, Batu Pahat, Johor, Malaysia.
Abstract This study was conducted to investigate how the addition of cement and bagasse ash in contaminated landfill soil affect its engineering properties such as the Atterberg limit, specific gravity, linear shrinkage and soil compaction. Tests were conducted on three different groups of soil samples: landfill soil as the control sample, samples which contained cement only (5%, 10%, 15% and 20% of cement) and samples which contained a mixture of cement and bagasse ash (BA) (2.5% cement + 2.5% BA, 5% cement + 5% BA, 7.5% cement + 7.5% BA and 10% cement + 10% BA). The tests were carried out according to BS 1377 (1990). Initial tests revealed that the soil sample was silty clay soil with low plasticity. It was found that the specific gravity of the soil samples increased from 2.49 (control sample) to 2.79 (soil sample with 20% of cement) when cement was added. However, the specific gravity slightly decreased when bagasse ash was added from 2.49 (control sample) to 2.46% (sample containing 10% cement + 10% BA). The liquid limit increased significantly to 48.80% when the soil sample containing 10% cement + 10% BA was used. In contrast, the plastic limit decreased from 21.31% (control sample) to 19.01% (soil sample containing 20% cement) and 17.92% (soil sample containing 10% cement + 10% BA). There was a decrease in linear shrinkage for samples containing 20% cement and samples containing 10% cement + 10% BA respectively. The addition of cement and bagasse ash increased the optimum moisture content and reduced the maximum dry density of soil. To sum up, the use of cement and bagasse ash in this study improved the engineering properties of contaminated landfill soil. Keywords: Landfill Soil Remediation, Engineering Properties, Geo-environmental Engineering
INTRODUCTION
It is a common practice to utilise agricultural waste for soil stabilisation. Due to the
pozzolanic reaction of ash towards cement and lime, agricultural waste ashes have been used
as a partial replacement of cement in concrete (Azhar et al., 2016a). Ash can be obtained
through the combustion of sugarcane bagasse. Sugarcane bagasse ash consists mostly of
silica, followed by other oxides and unburned carbon. Each tonne of crushed sugar cane can
produce up to 0.066 tonnes of ash (Azmi et al., 2016). Malaysia produces large quantities of
bagasse ash every year. A limited quantity of bagasse ash has been used for soil improvement
whereas the rest are usually disposed-off in open landfills. This can lead to environmental
problems. Nowadays, bagasse ash has multiple uses. For example, it can be used in the
production of bricks or concrete (Sheikh Khalid et al., 2017). It may also have the potential
to improve the mechanical properties as well as the durability of concrete (Shahidan et al.,
2017). Using bagasse ash as a replacement for cement in concrete production can also help
create a more sustainable environment by reducing the need for bagasse ash disposal (Sales
and Lima, 2010). In addition, bagasse ash may be effective as a partial cement replacement
as previous studies have shown that plant-based fibers can be incorporated with ordinary
Portland cement (OPC).

MCRJ Special Issue Vol. 4 | No. 2 | 2018 162
Numerous studies have been done on the use of bagasse ash for the stabilisation of
contaminated soil. The studies have shown that bagasse ash has the ability to enhance the
engineering properties of contaminated soil (Cordeiro et al., 2008; Chen et al., 2009; Tajudin
et al., 2016). However, further research is needed in order to obtain a deeper understanding
on the properties of soil incorporated with cement containing bagasse ash. Hence, this study
aims to find out the effect of cement and bagasse ash on the geotechnical properties of
contaminated soil obtained from landfills.
MATERIALS AND EXPERIMENTAL PROGRAM
Collection of Soil Samples
The contaminated soil samples were collected from Bukit Bakri Landfill Site (BBLS),
Muar, Johor. The top of the soil to a depth of 1 meter was removed in order to avoid taking
the humus, waste and plant roots. Then, the soil was placed in polystyrene containers. The
soil samples were later dried in the oven at 105oC for 24 hours at the laboratory. After that,
the dried soil was crushed using a rubber hammer before being decimated into 2 mm in size
using a grinder machine. The soil which passes the 2 mm sieve size was stored in polyethylene
plastic. The location of the soil sample collection at BBLS, Muar, Johor is shown in Figure 1.
Figure 1. Location of soil sample collection at BBLS, Muar, Johor
Cement and Bagasse Ash (BA)
The primary binder reagent used in the stabilisation/solidification (S/S) method is
Ordinary Portland Cement (OPC) type 1. When soft soil is mixed with cement, cement and
water react to form cementitious calcium silicate and aluminate hydrates that bind soil
particles together (Tajudin et al., 2016b; Bolan et al., 2014). This results in the stabilisation
of soil. Sugarcane bagasse ash, which is a type of agricultural waste, was chosen to be
incorporated with Ordinary Portland Cement (OPC) in the S/S technique. Sugarcane bagasse
ash is also known as a mineral additive in cementitious materials (Tajudin et al. 2016b).
Location of soil
sample collection

MCRJ Special Issue Vol. 4 | No. 2 | 2018 163
Furthermore, sugarcane bagasse ash is both cost effective and environmentally friendly (Faria
et al., 2012; Venkaramuthyalu et al., 2012). Raw sugarcane bagasse was first dried naturally
before it was burnt to produce ash. Later, the bagasse ash (BA) was burnt under a controlled
temperature of 650o C for an hour. The carbon content was reduced by at least 4.9% due to
the burning process (Ganesan et al., 2007). The ash was grounded to 90 μm using a grinder
machine after it cooled down.
Production of Soil Samples
The percentage of cement used in the soil samples was partially replaced with bagasse
ash (BA). Each sample was carefully weighed to avoid any material waste (Azhar et al., 2016;
Tajudin et al., 2015). The quantity of each component in the sample is indicated in terms of
percentage in Table 1. Sample batches were triplicated for 3 hydration durations namely 7, 14
and 28 days. To obtain relative homogeneity, the samples were mixed in bulk prior to packing
and storage (Azhar et al., 2016b). The water cement ratio in this research ranged between 0.20
to 0.40 (w/c) depending on the quantity of bagasse ash (BA) added. The ratio was fixed based
on the optimum moisture content (OMC) obtained from the compaction test. The raw
materials were then mixed using a small mixer to ensure the homogeneity of the soil samples.
The stabilised soil samples were compacted in a split mould to form samples measuring 38
mm in diameter and 76 mm in height. The mixture was compacted into 4 layers, 50 blows per
layer, using a miniature hand compacting tool. The extruded specimens were wrapped and
stored for 7, 14 and 28 days respectively before further tests were conducted. The mix design
of the soil samples is presented in Table 1.
Table 1. Mix Design of soil samples
Mixing Type Sample Name Percentage of Binder (%)
Soil OPC BA
Soil only (control) Soil 100 0 0
Cement only
soil + 5% cement soil + 10% cement soil + 15% cement soil + 20% cement
95 90 85 80
5 10 15 20
0 0 0 0
Cement with BA
soil + 2.5% cement + 2.5% BA soil + 5% cement + 5% BA soil + 7.5% cement + 7.5% BA soil + 10% cement + 10% BA
95 90 85 80
2.5 5 7.5 10
2.5 5 7.5 10
RESULTS AND DISCUSSION
Physical and Chemical Characterisation of Raw Materials
At this stage, the physical characteristics of the raw materials used were investigated. The
physical specification tests that were conducted included a moisture content test, loss of
ignition (LOI) test, Atterberg limit test, specific gravity test and particle size distribution test.
The analysis for each test was carried out three times and the results are reported in Table 2.
Table 2. Physical characterisation of raw materials
Test Soil OPC BA Method
Moisture Content (%) 24.25 ND 10.5 – 15.8 BS1377: Part 2: 1990: 4.3
Specific Gravity 2.49 3.17 1.52 BS1377: Part 2: 1990: 8.3
Liquid Limit, LL (%) 47.15 NT NT BS1377: Part 2: 1990: 4.3 Plastic Limit, PL (%) 21.31 NT NT BS1377: Part 2: 1990: 4.3

MCRJ Special Issue Vol. 4 | No. 2 | 2018 164
Test Soil OPC BA Method
Plasticity Index, PI (%) 23.84 NT NT BS1377: Part 2: 1990: 4.3
Standard Proctor test (%) 18.69 NT NT BS 1377: Part 4: 1990: 3.3 LOI (%) 7.33 4.58 13.04 (Banerjee et al. 2012)
*ND – not detected, NT – not tested
The moisture content was obtained to determine the initial water condition of the raw
materials. The moisture content is the mass of pore or free water in a given mass of soil
expressed as a percentage of the mass of the dry soil in solid form after drying in oven at
100oC for 24 hours. Table 2 shows the moisture content for landfill soil and bagasse ash which
was 24.55% and 10.5-15.8% respectively. The moisture content for OPC was not detected
since the value was too small to be measured. This is because OPC is a commercial product
available in a dry condition.
There were two separate tests that were conducted for the Atterberg limit test which
include both liquid limit, (LL) and plastic limit, (PL). The plastic limit of soil is the moisture
content, expressed as a percentage of the weight of the oven dry soil, at the boundary between
the plastic and semisolid states of consistency. Based on the test results obtained from
RECESS, UTHM, the average value of the plastic limit was 21.31%. Thus, the soil sample
was classified as silty clay soil with low plasticity. The plasticity index for clay soil in Bukit
Bakri landfill, Muar, was in the range between 17% and 27%.
The loss of Ignition (LOI) value for some materials at a temperature of 650oC was shown
in Table 1. The loss of Ignition (LOI) of bagasse ash was found to be high. This is because
bagasse ash is an organic material. Furthermore, one of the minerals is calcite (CaCO3) which
is volatile at a temperature of 650oC. From the study, the LOI value for OPC was recorded as
the lowest (4.58) and the results were almost the same as the values reported by Tarmizi et al.
(2012). The LOI content of landfill soil is 7.33 and this soil was found to be almost similar to
the LOI for clay.
The particle size distribution for raw samples of soil, cement and ash is shown in Figure
2. The figure shows that the particle size of bagasse ash (BA) is rougher than cement (OPC).
Figure 2. Particle Size distribution for Soil, Cement and Bagasse Ash
0
10
20
30
40
50
60
70
80
90
100
0.0001 0.001 0.01 0.1 1 10
perc
enta
ge p
assin
g (
%)
size (mm)
Landfill Soil
OPC
BA

MCRJ Special Issue Vol. 4 | No. 2 | 2018 165
The figure also shows that 100% cement, 100% ash and 38% of the soil consisted of silt-
sized particles which are less than 75μm. According to the ordinary Portland cement
standards, they stipulated that 90% of the particles should be able to pass the 90μm sieve.
Therefore, the cement samples used in this study meet the required standards. In the same
way, a study conducted by Ganesan et al. (2007) showed that the cement particles exceeding
50μm were unable to be fully hydrated even after the longest curing period. Since 99% of the
cement particles used in this study were less than 50 μm, they needed to be hydrated properly.
Apart from that, the study showed that soil contains more clay-sized particles.
Due to pH sensitivity during chemical interactions, it was necessary to evaluate the pH of
raw material (Du et al., 2014). The table 3 shows the pH value of raw materials used in this
study. It was observed that the soil was in an acidic condition with a pH of 4.8. The OPC used
in this study was alkaline with a pH of 12.6. The pH of bagasse ash was also slightly alkaline
with a value of 10.5. The conductivity tests show that the soil is classified as a non-saline
material while ash is moderately saline. On the other hand, cement is strongly saline. This
shows that the cement consists of highly soluble solid materials which can affect chemical
reactions (Basha et al., 2005; Yao et al., 2012).
Table 3. pH and conductivity of raw materials
Sample pH Conductivity (mS/cm)
Soil 4.8 0.16
OPC 12.6 15.66
BA 10.5 5.07
The chemical composition of raw material was determined using the X-Ray fluorescence
(XRF) test. Table 4 shows a composition of soil, Ordinary Portland cement (OPC) and
sugarcane bagasse ash (BA) as the raw materials used in this study. Based on the XRF results,
a similarity was found in terms of the chemical composition for OPC and BA. The results
indicated that there are four major elements namely SiO2, Al2O3, Fe2O3 and CaO present in
OPC and BA. According to a study by Antemir et al. (2010) and John et al. (2011), the main
factors which contribute to pozzolanic activities in a binder are silicon dioxide (SiO2),
Aluminium oxide (Al2O3), Iron oxide (Fe2O3) and a small amount of calcium oxide (CaO).
However, the pozzolanic element is often unable to harden on its own. It will harden in the
presence of calcium hydroxide and water. From the table, it can be concluded that BA can be
used as a partial replacement material for OPC due to the presence of raw pozzolanic
elements.
Table 4. Chemical composition of soil, OPC and bagasse ash (BA) (in percentage)
Element Concentration (%)
Soil OPC BA
SiO2 71.7 20.7 20.37
Fe2O3 4.38 3.14 5.63
SO3 - - 3.38
K2O 2.54 1.00 18.78
CaO 0.16 60.8 21.32
Al2O3 12.9 7.10 4.85

MCRJ Special Issue Vol. 4 | No. 2 | 2018 166
Element Concentration (%)
Soil OPC BA
Cl - - 5.3
P2O5 - 0.11 6.80
TiO2 0.64 0.66 0.32
ZrO2 0.16 - -
LOI 7.33 4.58 13.04
Total 99.72 98.09 99.79
Effect on Specific Gravity
According to Figure 3, the specific gravity of the soil in this study is 2.49 (control sample)
which falls within the range of 2.4 and 3.4 as reported by Basha et al., (2005) for lateritic
soils. Adding cement and bagasse ash with a specific gravity of 3.17 and 1.52 respectively to
soil produced mixtures with lower specific gravity. Specific gravity values of 2.37, 2.40, 2.43
and 2.46 were obtained for samples containing 2.5% OPC + 2.5% BA, 5% OPC + 5% BA,
7.5% OPC, + 7.5% BA and 10% OPC + 10% BA respectively. In contrast, the specific gravity
increased significantly for soil samples containing cement only. The specific gravity values
obtained were 2.51, 2.58, 2.63 and 2.79 for samples containing 5%, 10%, 15%, and 20% of
cement respectively. The low specific gravity of bagasse ash may have resulted in reduced
unit weight (Fatahi et al., 2013).
Figure 3. Variation of specific gravity of landfill soil with OPC and BA content
Effect on Atterberg Limits
Atterberg limits are especially useful for controlling soils used in engineered fills. LL is
the measure of water content at which the soil behaves like a liquid while PI indicates the
magnitude of water content range over which the soil remains plastic. To put it simply, the
higher the plasticity index, the higher the potential to shrink due to moisture content
fluctuations in soil (Azhar et al., 2016).
The Atterberg limits of landfill soil as well as mixtures containing varying percentages of
OPC and BA are reported in Figure 4 to Figure 6. It was found that landfill soil progressively
2.0
2.2
2.4
2.6
2.8
3.0
3.2
3.4
0 5 10 15 20
Sp
ecif
ic G
ravit
y
Binder (%)
OPC Only
OPC:BA = 1:1

MCRJ Special Issue Vol. 4 | No. 2 | 2018 167
loses its plasticity when the amount of bagasse ash increases due to cation exchange which
leads to increased interparticle attraction. For the control sample, the consistency test
established the LL as 47.15%. For the soil mixtures containing only cement, the LL values
obtained were 50.23%, 50.90%, 51.12%, and 52.77%, for 5%, 10%, 15%, and 20% of cement
content respectively. For another group of samples, the LL values obtained were 47.90%,
47.90%, 48.32%, and 48.80% for 2.5% OPC + 2.5% BA, 5% OPC + 5% BA, 7.5% OPC, +
7.5% BA and 10% OPC + 10% BA respectively. Similarly, the plastic limit value for all
mixed samples was consistently large enough to increase the plasticity index. Therefore, the
resulting PI increased along with the higher OPC content from 30.22% (5% OPC content)
to 32.51%, 33.09% and 34.85% for soil containing 10%, 15% and 20% of OPC
respectively. In another batch, the plasticity index of samples containing soil mixed with OPC
and BA also increased steadily from 26.40%, 27.77%, 28.43% and 29.79% respectively for
2.5% OPC + 2.5% BA, 5% OPC + 5% BA, 7.5% OPC, + 7.5% BA and 10% OPC + 10% BA.
To sum up, the increment in Atterberg limits of both OPC samples and OPC + BA samples
were small. This may be caused by the calcium ion concentrations in OPC and BA samples
used in this study (Sadeeq et al. 2015).
Figure 4. Variation of liquid limit of landfill soil with OPC and BA content
Figure 5. Variation of liquid limit of landfill soil with OPC and BA content
40
42
44
46
48
50
52
54
56
58
60
0 5 10 15 20
Liq
uid
lim
it (
%)
Binder (%)
OPC only
OPC:BA = 1:1
15
17
19
21
23
25
0 5 10 15 20
Pla
sti
c L
imit
(%
)
Binder (%)
OPC Only
OPC:BA = 1:1

MCRJ Special Issue Vol. 4 | No. 2 | 2018 168
Figure 6. Variation of plasticity index of landfill soil with OPC and BA content
Effect on Linear Shrinkage
A comparison between the linear shrinkage of samples containing only cement and the
linear shrinkage of samples containing cement with bagasse ash as additives after a curing
period of 28 days is shown in Figure 7. The linear shrinkage decreased considerably when
increased quantities of cement and bagasse ash were used. The linear shrinkage values of
landfill soil mixed with cement were 15.71%, 13.57%, 11.43% and 6.43% for 5%, 10%, 15%
and 20% of OPC respectively. These values were significantly lower compared to the
shrinkage value of the control sample (landfill soil only) which was 21.43. Similarly, the
linear shrinkage of samples containing cement with bagasse ash showed significantly
reduction. Linear shrinkage values of 17.86%, 15.71%, 12.14% and 9.29% were obtained for
2.5% OPC + 2.5% BA, 5% OPC + 5% BA, 7.5% OPC, + 7.5% BA and 10% OPC + 10% BA
respectively. The presence of hydrated cement in landfill soil was found to have a more
pronounced effect. For example, when 2.5% cement and 2.5% bagasse was added to the soil
sample, the linear shrinkage value decreased to 17% compared to the linear shrinkage value
of the soil sample containing 5% cement which was 27%. In short, the addition of cement and
bagasse ash to landfill soil produced positive results.
Furthermore, the Atterberg limit is widely linked to soil behavior. The linear shrinkage
reduced considerably when BA content increased as shown in Figure 7. Linear shrinkage
decreased with increasing OPC and OPC + BA content from 21.43% for soil only (control
sample) to 6.43% (20% of OPC) and 12.14% (10% OPC + 10% BA content).
20
25
30
35
40
45
50
0 5 10 15 20
Pla
sti
cit
y I
nd
ex (
%)
Binder (%)
OPC Only
OPC:BA = 1:1

MCRJ Special Issue Vol. 4 | No. 2 | 2018 169
Figure 7. Variation of linear shrinkage of landfill soil with OPC and BA content
Effect on Soil Compactability
The moisture and density at which soil is compacted can influence its geotechnical
properties. In general, the geotechnical parameters of soil can be enhanced if there is a high
level of compaction (Sadeeq et al., 2015). Therefore, it is important to achieve the desired
degree of compaction. The percentage of water present in soil mass at which a specific
compaction force can dry the soil mass to its maximum dry weight is known as optimum
moisture content (OMC) (Hossain et al., 2011) . The OMC and maximum dry density curves
are different according to the type of soil used. In this study, the OMC was obtained via the
standard Proctor compaction test.
Figure 8. Variation of the OMC of landfill soil with OPC and BA content
0
5
10
15
20
25
30
0 5 10 15 20
Lin
ear
Shrin
kage (
%)
Binder (%)
OPC only
OPC:BA = 1:1
15
20
25
30
0 5 10 15 20
Optim
um
Mositure
Conte
nt (%
)
Binder (%)
OPC only
OPC:BA = 1:1

MCRJ Special Issue Vol. 4 | No. 2 | 2018 170
Figure 9. Variation of MDD of landfill soil with OPC and BA content
The effect of the addition of cement alone and the addition of cement with bagasse ash
on the compaction characteristics of landfill soil are shown in Figures 8 and 9. The addition
of cement and bagasse ash increased the OMC and decreased the amount of MDD. The
increase in OMC may be due to the additional water held by the flocculant soil structure
resulting from cement interaction as well as excessive water absorption by bagasse ash due to
its porous properties, as reported in Hossain et al. (2011). Principally, an increase in dry
density indicates improvement. However, both cement and bagasse ash reduce the dry density
of all samples except the sample containing 5% OPC and 5% BA. Tarmizi et al. (2012) stated
that dry density decreases due to the particle size and specific gravity of the soil and binder.
Reduced dry density also indicates that the soil samples need low compactive energy (CE) in
order to attain its MDD (Sadeeq et al., 2015). This helps to reduce the cost of compaction.
CONCLUSION
The findings indicate that the samples containing bagasse ash and cement improved the
engineering properties of soil a little more compared to the samples containing cement alone.
A few conclusions can be made based on this experimental study:
i. Samples containing only cement and samples containing cement and bagasse ash
were able to improve the properties of landfill soil. The plasticity index for soil
containing cement alone was the highest at 34.85% whereas the plasticity index for
soil containing cement and bagasse ash was 29.79%. However, the specific gravity of
soil decreased steadily when cement and bagasse ash were added to it.
ii. The linear shrinkage of stabilised soil decreased in samples containing cement alone
as well as samples containing cement and bagasse ash. A reduction in linear shrinkage
is able to prevent cracks from occurring to concrete structures.
iii. The presence of cement and bagasse ash reduced the maximum dry density of soil.
On the other hand, the presence of cement and bagasse ash increased the optimum
moisture content of soil.
1.3
1.4
1.5
1.6
1.7
1.8
0 5 10 15 20
MD
D (
g/m
^3)
Binder (%)
OPC only
OPC:BA = 1:1

MCRJ Special Issue Vol. 4 | No. 2 | 2018 171
REFERENCES
Antemir, A., Hills, C. D., Carey, P. J., Gardner, K. H., Bates, E. R. and Crumbie, A. K. (2010)
Long-Term Performance of Aged Waste Forms Treated by Stabilization/Solidification.
Journal of Hazardous Materials, 181(1–3):65–73.
Azhar, A. T. S, Azmi, M. A. M, Aziman, M. and Nabila, A. T. A. (2016a) Leachability of
Arsenic (As) Contaminated Landfill Soil Stabilised by Cement and Bagasse Ash. IOP
Conference Series: Materials Science and Engineering, 160(012078), 1-9.
Azhar, A. T. S, Azmi, M. A. M. and Nabila, A. T. A. (2016b) Stabilization/Solidification
Remediation Method for Contaminated Soil: A Review. IOP Conference Series:
Materials Science and Engineering, 136(012043), 1 – 6.
Azmi, M. A. M, Tajudin, S. A. A, Shahidan, S., Masrom, M. A. N. and Nabila, A. T. A.
(2016) Preliminary Study on Remediation of Contaminated Clay Soil using Cement and
Sugarcane Bagasse. MATEC Web of Conferences, 103(07001), 1 – 6.
Basha, E. A., Hashim, R., Mahmud, H. B. and Muntohar, A. S. (2005) Stabilization of
Residual Soil with Rice Husk Ash and Cement. Construction Building Material, 19:
448–453.
Bolan, N., Kunhikrishnan, A., Thangarajan, R., Kumpiene, J., Park, J., Makino, T. and
Scheckel, K. (2014) Remediation of Heavy Metal (Loid)S Contaminated Soils--To
Mobilize or To Immobilize?. Journal of Hazardous Materials, 266: 141–66.
Chen, Q.Y., Tyrer, M., Hills, C.D., Yang, X. M. and Carey, P. (2009) Immobilisation of
Heavy Metal in Cement-Based Solidification/Stabilisation: A Review. Waste
Management, 29: 390–403.
Cordeiro, G. C., Toledo, F. R. D, Tavares, L. M. and Fairbairn, E. M. R. (2008) Pozzolanic
Activity and Filler Effect of Sugar Cane Bagasse Ash in Portland Cement and Lime
Mortars. Cement and Concrete Composites, 30(5): 410–418.
Du, Y. J., Wei, M. L., Reddy, K. R., Liu, Z. P. and Jin, F. (2014) Effect of Acid Rain pH on
Leaching Behavior of Cement Stabilized Lead-Contaminated Soil. Journal of Hazardous
Materials, 271: 131–40.
Faria, K., Gurgel,R. and Holanda, J. (2012) Recycling of Sugarcane Bagasse Ash Waste in
the Production of Clay Bricks. Journal of Environmental Management, 101: 7-12.
Fatahi, B., Le, T. M., Fatahi, B., and Khabbaz, H. (2013) Shrinkage Properties of Soft Clay
Treated with Cement and Geofibers. Geotechnical and Geological Engineering, 31(5):
1421-1435.
Ganesan, K., Rajagopal, K. and Thangavel, K. (2007) Evaluation of Bagasse Ash as
Supplementary Cementitious Material. Cement & Concrete Composites, 29: 515–524.
Hossain, K. M. A. and Mol, L. (2011) Some Engineering Properties of Stabilized Clayey
Soils Incorporating Natural Pozzolans and Industrial Wastes. Construction and Building
Materials, 25: 3495–3501.
John, U. E., Jefferson, I., Boardman, D. I., Ghataora, G. S. and Hills, C. D. (2011) Leaching
Evaluation of Cement Stabilisation / Solidification Treated Kaolin Clay. Engineering
Geology, 123(4): 315-323.
Sadeeq, J. A., Ochepo, J. and Salahudeen, A. B. (2015) Assessment of Bagasse Ash Effect
on the California Bearing Ratio of used Oil Contaminated Lateric Soils. Nigerian Journal
of Technology, 34(2): 223-231.
Sales, A. and Lima, S. A. (2010) Use of Brazilian Sugarcane Bagasse Ash in Concrete as
Sand Replacement. Waste Management, 30(6): 1114-1122.

MCRJ Special Issue Vol. 4 | No. 2 | 2018 172
Shahidan, S., Azmi, M. A. M., Kupusamy, K., Zuki S. S. M and Ali, N. (2017) Utilizing
Construction and Demolition (C&D) Waste as Recycled Aggregates (RA) in Concrete.
Procedia Engineering, 174: 1028–1035.
Sheikh Khalid, F., Herman, H.S., and Bazilah Azmi, N. (2017) Properties of sugarcane fiber
on the strength of the normal and lightweight concrete. MATEC Web of Conferences,
103(01021),1-7.
Tajudin, S. A. A., Azmi, M. A. M., Shahidan, S., Abidin, M. H. Z., Madun, A. (2016a)
Relationship of Physical Parameters in Pb-Contaminated by Stabilization/Solidification
Method. MATEC Web of Conferences, 47(03015), 1-6.
Tajudin, S. A. A., Marto, A., Azmi, M. A. M., Madun, A., Abidin, M. H. Z. (2015) Utilization
of Sugarcane Bagasse Ash for Stabilization/Solidification of Lead-Contaminated Soils.
Jurnal Teknologi 77 (11): 119-125.
Tajudin, S. A. A., Nabila, A. T. A., Nurshuhaila, M. S., Zaidi, E., Azmi, M. A. M and Zahin,
A. M. F. (2016b) Novel Technique to Improve the pH of Acidic Barren Soil using
Electrokinetic-Bioremediation with the Application of Vetiver Grass. IOP Conference
Series: Materials Science and Engineering, 160(012076), 1-9.
Tarmizi, A. K. A., Ismail A. R., Abdul. A. L. A and Mohd R. T. (2012) The Effects of
Strength in Lead Contaminated Residual Soil Solidified / Stabilized with Cement.
International Journal of Civil & Environmental Engineering, 12(6): 8-12.
Venkaramuthyalu, P., Ramu, K., and Prasada, R. G. V. R. (2012) Study on Performance of
Chemically Stabilized Expansive Soil. International Journal of Advances in Engineering
& Technology, 2(1): 139-148.
Yao, Z., Li, J., Xie, H. and Yu, C. (2012) Review on Remediation Technologies of Soil
Contaminated by Heavy Metals. Procedia Environmental Science, 16: 722–729.

THEME 3:
STRUCTURAL ENGINEERING

MCRJ Special Issue Vol. 4 | No. 2 | 2018 174
THE NATURAL FREQUENCY ANALYSIS OF REINFORCED CONCRETE BEAM WITH ADDITIONAL OF LIGHTNING PROTECTION CABLE Mustaqqim Abdul Rahim1,2, Yeap Sook Cheng1, M. Arkam Che Munaaim1, Zuhayr Md Ghazaly1, Abdul Naser Abdul Ghani2, Ahmad Nur Aizat Ahmad3 and Shahiron Shahidan4 1 School of Environmental Engineering, University Malaysia Perlis, 02600, Arau, Perlis, Malaysia 2 School of Housing, Building and Planning, University Sains Malaysia, 11800 Gelugor, Penang, Malaysia 3 Faculty of Technology Management and Business, Universiti Tun Hussein Onn, 86400, Batu Pahat, Johor, Malaysia 4 Faculty of Civil and Enviromental Engineering, Universiti Tun Hussein Onn, 86400, Batu Pahat, Johor, Malaysia
Abstract Lightning is a phenomena that happens naturally typically during thunderstorms. Malaysia is a country which located near to equator with high lightning activites. Lightning protection system (LPS) plays a vital role to protect the structure by dissipate the lightning current to underground safely. New installation method of LPS has implement in Malaysia which to embed the lightning protection cable in a concrete structure. This research study carried out to determine the natural frequecy of additional reinforcement concrete beam by using impact hammer test. This research study involved the strike of electric current into the additional reinforcement concrete beam which indicate the actual lightning current source to evaluate and compare the natural frequency of beam. The results shown that the natural frequency of additional reinforcement concrete beam has slightly decreases after strike of electric current. From the results also found out that the location of lightning protection cable to attach in the concrete beam will influence the natural frequency of concrete beam. Keywords: Lightning Protection System, Natural Frequency, Impact Hammer Test, Strike of Electric
Current, Concrete Beam
INTRODUCTION
Lightning discharge is a natural phenomenon that happens about evert day in the world.
It has been estimated that lightning discharge toward the surface on earth around 100 times
every second (Hassan et al., 2011). There is also another review stated that in every
progressing of 2000 thunderstorms at any time will result in 100 lightning discharges to
surface of earth per second, it is approximately equal to 8 million per day (Ab-Kadir, 2016).
In addition, an observation from space by using Optical Transient Detector (OTD) reveals
that there are nearly 1.4 billion flashes happens annually over the whole world (Christian,
2003). Around 1000 lightning discharges per second or 5000 storms per day happen
throughout the world. In France especially in Spain or Italy, approximately 2 million lightning
discharges to the ground surface annually (Legrand, 2009). According to a Lightning
Protection Guide, it declared that an estimated amount about 1.5 million lightning discharges
over a Germany every year (Dehn, 2014). The thunderstorm days of the whole world and it
noted that the country located at or near to the equator has the higher lightning density. It
reveals that the country that near to equator also has the higher number of lightning. Lightning
discharge is been a riddle to people for hundreds years, it is an ordinary but magnificent
natural phenomena (Soon, 2004). Malaysia is been described as a country which has huge
number of thunderstorm and lightning activities and it is located near to the equator (Abdullah
et al., 2008). Besides, Malaysia is also described as lightning core in Asia and the capital,

MCRJ Special Issue Vol. 4 | No. 2 | 2018 175
Kuala Lumpur rank 5th in the world in respect of lightning density (Zainudin, 2016). Based
on another scholar report, it also stated that Malaysia has been positioned among the main
three in the world, more than some other nations in Asia area with referring to the statistic of
lightning density (Ab-Kadir, 2016). Lately, they are numerous passing of human life and ruin
of electrical equipment aroused by lightning strike had been accounted for.
Lightning strike is a typical occurrence that cannot be hindered, however the safeguard
of building can be ensured by install the lightning protection system (LPS). The
comprehension of the physical nature of vibration occurrence has constantly been vital for
engineer and researchers in industry, considerably more so today as structure are getting to be
distinctly lighter and more adaptable because of increment requests for proficiency, speed,
security and relaxation (Ashory, 1999; Lemat et al., 2016; Ismail et al., 2016; Shahidan, 2017).
To better comprehend the nature of vibration, it comprised the study and analysis of natural
frequency. Lightning protection system can provide a safe path for the electric discharge from
lightning strike to dissipate to earth, it allow the lightning bolt to bypass the component of
building to hinder from damaged. Basically, an entire system of LPS composes of air
termination rod, conductor cable, earthing system, connecting among conductors, surge
protection devices, and any other connectors that necessary to build the entire system (Arif,
2009; Md Nor et al., 2011; Ramzi et al., 2016; Shahidan et al., 2016). According to IEC/EN
62305-3, down conductors can be embedded into components of reinforced concrete structure
such as concrete column (Kokkinos et al., 2006; Shahidan et al., 2011). This method consists
of connection among air termination system and embedded LPS with steel reinforcement bars
in concrete column, ground beam and pad footing to dissipate the lightning into the earth
(Rahim et al., 2016). Embedded system also apply the method of Faraday Cage as the
lightning protection cable is install in every corner of the structure or building. An important
thing to take note for application of this system is the electricity continuity of steelwork in the
reinforced concrete structures in accordance to clause 4.3 in MS IEC 62305-3. The continuity
of electricity in steelwork is important because it allows the lightning current to pass through
and safely transfer to ground. The connection can be achieved by welded, clamped and etc.
referring to the designer of LPS.
There are three types of LPS commonly used in the industry which are Franklin rod, tight
wire and faraday cage method. According to IEC/EN 62305-3, there is also another method
for installation of down conductors which embed the down conductors into reinforced column
of structure (Kokkinos et al., 2006; Senin et al., 2016; Shahidan et al., 2018). There is no
specific name for this method of installation but may found in words of embedded system or
structural bonding. The embedded system of LPS which the lightning protection cable
embedded into the concrete beam is arose due to the unfavourable circumstance of
conventional LPS. Conventionally, LPS is installed externally and being expose to the
environment has led to the degradation and corrosion of down conductor over the time.
Besides, corrosion also occurs gradually as there are existence of galvanized distinct metals
in the similar electrolyte (Ghavamian et al., 2015). Due to the external installation method of
LPS, it is vulnerable for materials theft because the copper cable generally are exposed barely
and accessible on the external of building (Sueta et al., 2007). As a result, extra cost is needed
to replace the materials for continue the service life of LPS. There was a literature shown that
there are an alternatives installation and design to avoid material theft by using the steelwork
frames, foundations and metallic part of the building to be part of the LPS. The embedded
system of LPS has brought up because it can be hinder all the unfavorable circumstance of

MCRJ Special Issue Vol. 4 | No. 2 | 2018 176
conventional LPS. Impact hammer test sometimes also called as modal test. It is a test that
used to determine the modal parameter which natural frequency, modal damping ratios, modal
masses and mode shape of test structure. Impact testing always use for experiments to
determine the forms of vibration of structure as it is a quick and low-priced (Ahmed and
Mohammad, 2015) The objective of this research is to determine, compare and analyze the
natural frequency of additional reinforcement concrete beam by using impact hammer test.
MATERIAL AND METHODS Additional Reinforcement Concrete Beam
There are two samples of concrete beam used in this research and the dimension and
details are shown in Figure 2 and 3. The different between sample 1 and 2 are the location of
lightning protection cable attached to the steel reinforcement bar. For sample 1 the lightning
protection bar ia attached on the top left corner while sample 2 is on bottom left corner. The
lightning protection cable will be attached to the steel reinforcement bar by using U-clamp.
The material of lightning protection cable is Galvanized Iron (GI). The concrete used in this
research are Grade 35. In order to obtain the optimum quality of concrete, ready mix concrete
are used. Total 6 number of additional reinforcement concrete beam are prepared for impact
hammer test. The detailing of additional reinforcement concrete beam are shows in 2 and 3..
Overall, there are two samples of additional reinforcement concrete beam which sample 1 and
2. The difference between both samples are the location of lightning cable to attach with the
steel reinforcement bar; sample 1 is attached at the top left corner while sample 2 is attached
at the bottom left corner. Important thing to be take note is the additional reinforcement should
be install longer than the actual casting length of concrete beams to ensure it can be connect
to the high voltage machine for injection of electric current.
First step of the preparation of sample is the installation of rebar regarding to the detailing
of reinforced concrete beam and the additional cable must be attached to the reinforcement
steel bar by using U-clamp. Next, follow by the installation of formworks and then the rebar
structures are placed inside the formwork and spacers are insert between the rebar and
formwork to ensure the nominal cover of concrete is achieved. Then, RMC are ordered from
the concrete plant for casting of beam. Once the concrete batch reached, slump test and 3
number of concrete cube are made to test for compression strength in 28 days. During the
casting, a vibrator is used to compact the concrete. It is used to eliminate the air bubbles in
the fresh pour concrete by shaking vigorously and also to avoid the formation of honey comb.
After casting, the reinforced concrete beam will be left for at least one day to dry and then the
formwork will be removed. To ease the experiment work, the reinforced concrete beams are
placed outside the lab building of electric engineering for connection to the high voltage
machine.

MCRJ Special Issue Vol. 4 | No. 2 | 2018 177
Figure 2. Sample 1
Figure 3. Sample 2
Lightning Stimulation
Each sample has three beam labelled as Beam A, B and C which will subjected to electric
current with 15 kA, 30 kA and 45 kA. The electric current indicate the actual lightning current
strike to the concrete beam. Thus, the additional reinforcement concrete beam undergo the
impact hammer test twice to obtain the results for before and after strike of electric current.
Impact Hammer Test
The vibration behavior, natural frequency, damping ratio and mode shape of the beams
were determine using impact hammer test. But the main purpose is to measure the different
of the natural frequency value obtained before and after the lightning simulation testing had
conducted. The test had been performed in two stages. The first stage is to obtain the natural
frequency result at normal condition before the lightning simulation test and the second stage
is immediately after the high electric current passed thru the concrete beam. The main idea to
conduct this experimental is to obtain as soon as possible any immediate effect of the lightning
impact to the concrete beam. The beam specimen is excited by using impact hammer to exert
an impact force. The impact hammer struck at two point on the beam as shown in Figure 4.
One is on the quarter of beam and another one is on the mid-span of beam. In Figure 5 shows
the set-up of equipment. Equipment involved are impact hammer, data logger, accelerators,

MCRJ Special Issue Vol. 4 | No. 2 | 2018 178
laptop installed with software and electric current machine. Initially after completed
arrangement of the concrete beam, the procedure was started with surface preparation on top
of the concrete beam. By using electric grinder the specific location that remarked before was
smoothed for the accelerators. This is because the accelerators are too sensitive and the result
is not accurate for uneven surface, therefore this process is essential to be conducted. Basically
the beam was remarks with the permanent ink for two items. The first remarks is for the
location of the hammer points and the secondly remarks for the accelerometers. General
arrangement for the remarks was shown in the Figure. The hammer points at the middle span
o (1/2 length) and at quarter (1/3 length) of the beam. And the accelerometers point at 5
locations, starting from one end of the beam to the others end of the beam at the interval 300
mm each.
Figure 4. Hammer Point for Impact
Figure 5. Equipment Set Up
Data Acquisition
The raw data collected from the impact hammer test are acceleration responses in term of
time domain. Then, the raw data is transfer to the laptop installed with software to convert
into Frequency Response Function (FRF) to extract the modal parameters. The computer-
based software is act as an analyzers and recorders to acquire the data by using curve-fitting
method. Peak picking method is used to obtain the natural frequency from the FRF by
selecting the higher peak of the graph. Raw data is transfer to the laptop installed with software
to convert into frequency domain which typically known as Frequency Response Function
(FRF) to extract the modal parameters. The computer-based software is act as an analyzers
Data
Logger
Electric
Current
Machine
Laptop
Impact Hammer
Earth
Concrete
Beam

MCRJ Special Issue Vol. 4 | No. 2 | 2018 179
and recorders to acquire the data by using curve-fitting method. Then peak picking method is
used to obtain the natural frequency from the FRF by selecting the higher peak of the graph.
The obtained results of additional reinforcement concrete beam will be comparing before and
after injection of electric current. It is to determine the strength of concrete among the two
types of beam. According to Wang et al. (2012), concluded that as the natural frequency of
concrete beams increase, the concrete strength will increases. Thus, when the natural
frequency of concrete beams decrease indicate that the strength of concrete also decrease.
RESULTS AND DISCUSSION
The obtained results for sample 1 are show in Figure 6 to Figure 8 for Beam A, B and C.
For every figure, the FRF in left hand side is the result that obtained before strike of electric
current while the right hand side is the result for after strike of electric current. Beam A is
subjected to 15 kA of electric current. In Figure 6 shows that before strike of electric current,
the natural frequency of beam are 56.1 Hz and 152 Hz while after strike of electric current the
natural frequency of beam have reduce to 55.3 Hz and 150 Hz. There are slightly reduction
in natural frequency which 1.4 % for first mode and 1.3 % for second mode. The results
indicated that the strength of additional reinforced concrete beam reduced when it is subjected
to 15 kA of electric current due to the decreasing in natural frequency.
Figure 6. Natural frequency of beam before and after strike of 15 kA of electric current
Beam B is subjected to 30 kA of electric current. In Figure 7 shows that before strike of
electric current, the natural frequency of beam are 73.5 Hz and 272 Hz while after strike of
electric current the natural frequency of beam have reduce to 71.4 Hz and 254 Hz. There are
slightly reduction in natural frequency which 2.7 % for first mode and 6.6 % for second mode.
The results indicated that the strength of additional reinforced concrete beam reduced when it
is subjected to 30 kA of electric current due to the decreasing in natural frequency.

MCRJ Special Issue Vol. 4 | No. 2 | 2018 180
Figure 7. Natural frequency of beam before and after strike of 30 kA of electric current
Beam C is subjected to 45 kA of electric current. In Figure 8 shows that before strike of
electric current, the natural frequency of beam are 69.6 Hz and 155 Hz while after strike of
electric current the natural frequency of beam have reduce to 68.9 Hz and 155 Hz. There are
slightly reduction in natural frequency which 1.0 % for first mode while for second mode it
remain unchanged. The results indicated that the strength of additional reinforced concrete
beam reduced when it is subjected to 45 kA of electric current due to the decreasing in natural
frequency.
Figure 8. Natural frequency of beam before and after strike of 45 kA of electric current
From the Table 1, it demonstrate that the natural frequency are decrease after strike of
electric current for every sample of beam. It indicate the strength of concrete also decreases
as the natural frequency decreases. But, the reduction of natural frequency for all sample of
beam are in small range which from 1.0 % to 6.6%. Comparing the beam among sample 1,
shows that the reduction of natural frequency is decrease as the higher electric current is strike
into the concrete beam. It means that the embedded lightning protection cable can withstand
the higher electric current without lower the strength of concrete beam. The result shows same
to the beam among sample 2 as the reduction of natural frequency is also decrease as the
higher electric current is strike into the concrete beam. Comparing the natural frequency of
every beam in sample 1 and sample 2, it show that the natural frequency of concrete beam in
sample 2 have greater value than sample 1. It means that the strength of additional
reinforcement concrete beam in sample 2 is greater than sample 1. It conclude that the location
of lightning cable attached in the concrete beam will affect the strength of additional
reinforcement concrete beam.

MCRJ Special Issue Vol. 4 | No. 2 | 2018 181
Table 1. Natural Frequency of Additional Reinforcement Concrete Beam
Test Specimen
Natural Frequency (Hz) Reduction of Natural Frequency in
Percentage (%) Before Strike of Electric
Current After Strike of Electric
Current
Mode 1 Mode 2 Mode 1 Mode 2 Mode 1 Mode 2
Sample 1 Beam A 56.1 152.0 55.3 150.0 1.4 1.3 Beam B 73.5 272.0 71.4 254.0 1.2 6.6 Beam C 69.6 155.0 68.9 155.0 1.0 0
Sample 2 Beam A 74.5 151.0 70.7 151.0 5.1 0 Beam B 97.0 152.0 95.7 150.0 1.3 1.3 Beam C 166.0 243.0 166.0 240.0 0 1.2
CONCLUSIONS
Through the test of impact hammer, it shown that the objectives of this research study had
achieved. From the result of impact hammer test, it shown that the after strike of electric
current the natural frequency of concrete beam only has slightly reduction. The reduction of
natural frequency also can be interpret as the decrease in strength of additional reinforcement
concrete beam. Besides, the comparison of results among the beam of both sample shown that
the natural frequency of concrete beam in sample 2 have greater value than in sample 1. It
reveals that the location of lightning protection cable attached in the concrete beam will affect
the strength of concrete beam. In short, it indicate that the installation method of LPS for
sample 2 is effective than sample 1. Besides, the collected result also compared among beams
between two samples with strike of same amount of electric current. From the results, it
demonstrated that all the concrete beam only has slightly reduction in natural frequency after
strike of electric current as compared with natural frequency before strike of electric current
regardless of beams in sample 1 or sample 2. For Beam A in sample 1 shown the reduction
percentage of natural frequency for mode 1and 2 are 1.4% and 1.3%; Beam B had reduction
percentage of 1.2% and 6.6% while Beam C had 1.0% and 0% consecutively. Next, the
reduction percentage of natural frequency for beam in sample 2 are 5.1% and 0% for Beam
A, 1.3% and 1.3% for Beam B and 0% and 1.2% for Beam C. In addition, when compared
the beams between two samples which strike with same amount of electric current, it shown
that all the reduction percentage of natural frequency of beam in sample 2 are smaller than
beam in sample 1. From the comparison results, it demonstrated that all the beams in both
samples are reduced in the natural frequency after strike of electric current regardless of the
amount of electric current strike. The reduction of natural frequency can be interpret as the
decrease in strength of additional reinforcement concrete beam. Besides, the comparison of
results among the beam of both sample which strike with same amount of electric current
shown that the natural frequency of concrete beam in sample 2 have greater value than in
sample 1. It indicated that the strength of beams in sample 2 higher than strength of beams in
sample 1 after strike of electric current. Thus, the location of additional reinforcement
attached in concrete beam will influence the strength of concrete beam after strike of electric
current. In concluded, additional reinforcement which attached with the bottom reinforcement
in concrete beam will result an effective embedded system of LPS than attached with the top
reinforcement in concrete beam. In this field. Typical LPS has been well recognized but the
recent implementation of embedded system for LPS still has low recognition in Malaysia. It
is due to lack of information and researches for the embedded system. In order to design an
effective embedded system of LPS, more research related to this system are needed. The
following recommendations are offered for research study that related to this field.

MCRJ Special Issue Vol. 4 | No. 2 | 2018 182
ACKNOWLEDGMENTS
This research was funded by Fundamental Research Grant Scheme Phase 2/2014(9003–
00484). The authors wish to extend appreciation to Ministry of High Education Malaysia,
School of Environmental Engineering University Malaysia Perlis, School of Housing
Building & Planning Universiti Sains Malaysia and Universiti Teknologi MARA Pulau
Pinang.
REFERENCES
Ab-Kadir, M. Z. A. (2016) Lightning Severity in Malaysia and Some Parameters of Interest
for Engineering Applications. Thermal Science, 20: S437–S450.
Abdullah, N., Yahaya, M. P., and Hudi, N. S. (2008) Implementation and Use of Lightning
Detection Network in Malaysia. In Proceedings of the IEEE 2nd International Power and
Energy Conference (PECon ’08). Johor Bahru, Malaysia, 383–386.
Ahmed, M. S. and Mohammad, F. A. (2015) Experimental Modal Analysis of Reinforced
Concrete Square Slabs. International Journal of Mechanical, Aerospace, Industrial,
Mechatronic and Manufacturing, 9(3): 448-452.
Arif, M. (2009) Assessment of Lightning Protection System ( LPS ) for Asset Management
Enhancement. Unpublished Bachelor's Degree Dissertation, Universiti Teknologi
Malaysia, Skudai.
Ashory, M. R. (1999) High Quality Modal Testing Methods. PhD Thesis, University of
London.
Christian, H. J. (2003) Global frequency and distribution of lightning as observed from space
by the Optical Transient Detector. Journal of Geophysical Research, 108(D1), 4005.
Dehn. (2014) Lightning Protection Guide (3rd ed.). Germany: DEHN + SÖHNE.
Ghavamian, A., Maghami, M. R., Dehghan, S. and Gomes, C. (2015) Concerns of corrosive
effects with respect to lightning protection systems. Engineering Failure Analysis, 57:
434–443.
Hassan, M. K., Rahman, R. Z. A., Soh, A. C. H. E. and Kadir, M. Z. A. A. B. (2011) Lightning
Strike Mapping for Peninsular Malaysia Using Artificial Intelligence Techniques.
Theoretical and Applied Information Technology, 34(2), 1–14.
Ismail, I., Jamaluddin, N., and Shahidan, S. (2016) A Review on Performance of Waste
Materials in Self Compacting Concrete (SCC). J. Teknol., 5(78): 29–35.
Legrand. (2009) Protection Against Lightning Effects. POWER GUIDE 2009 / BOOK 07.
France.
Leman, A. S., Shahidan, S., Senin, M. S., and Ramzi Hannan, N. I. R. (2016) A Preliminary
Study on Chemical and Physical Properties of Coconut Shell Powder as A Filler in
Concrete. IOP Conference Series: Materials Science and Engineering, 160(12059).
Md Nor, N., Bunnori, N. M., Ibrahim, A., Shahidan, S. and SMat Saliah, S.N. Relationship
between acoustic emission signal strength and damage evaluation of reinforced concrete
structure: Case studies,” in 2011 IEEE Symposium on Industrial Electronics and
Applications, 2011, pp. 308–313.
Kokkinos, D., Kokkinos, N., Koutsoubis, J., Klabana, M. and Triantafillides, A. (2006) Effect
of Direct Lightning Strike in the Down Conductors Embedded into the Reinforcement. In
28th International Conference on Lightning Protection. Kanazawa-Japan, 1304–1309.
Rahim, M. A., Ghani, A. N. A. and Munaaim, M. A. C. (2016) Lightning Protection System
In Malaysia: Materials Selection For Down Conductor. Jurnal Teknologi, 78(5): 7–13.

MCRJ Special Issue Vol. 4 | No. 2 | 2018 183
Ramzi Hannan, N. I. R., Shahidan, S., Maarof, M. Z. and Ali, N. (2016) Physical and
Chemical Properties of Coal Bottom Ash (CBA) from Tanjung Bin Power Plant. IOP
Conference Series: Materials Science and Engineering, 160(1).
Senin, M. S., S. Shahidan, S., Leman, A. S., and Ramzi Hannan, N. I. R. (2016) Properties of
Cement Mortar Containing Rubber Ash as Sand Replacement. IOP Conference Series:
Materials Science and Engineering, 160(1).
Shahidan, S., Pullin, R., Bunnori, N. M., and S. S. Mohd Zuki, S. S (2017) Active crack
evaluation in concrete beams using statistical analysis of acoustic emission data. Insight
- Non-Destructive Test. Cond. Monit., 59(1): 24–31.
Shahidan, S., Mohd Zuki, S. S. Rahim, M. A. and Ali, N. (2016) Amplitude Distribution of
Emission Wave for Cracking Process, MATEC Web Conference., 47, 2–8.
Shahidan, S Bunnori, N. M., Md Nor, N. and Basri, S. R. (2011) Health Index Evaluation on
Acoustic Emission Signal for Concrete Structure by Intensity Analysis Method. Adv.
Mater. Res., 403–408: 3729–3733.
Shahidan, S., Ranle, N. A., Mohd Zuki, S. S., Sheikh Khalid, F., Nazri, F. M. and Ridzuan,
A. R. M. (2018) Concrete Incorporated with Optimum Percentages of Recycled
Polyethylene Terephthalate (PET) Bottle Fiber. Int. J. Integr. Eng., 10(1): 1–8.
Sueta, H.E., Lima, E.A., and Neri, E. (2007) Recommendations And Alternatives For
Lightning Protection Systems Concerning Materials Theft Avoiding. IX International
Symposium on Lightning Protection, Brazil.
Zainudin, M. Z. F. (2016) Analysis Of Lightning Protection System For PRZS and P19A Using
Rolling Sphere Method. Bachelor project, Universiti Teknologi Malaysia.
Soon Y. (2004) Study of the Lightning Protection Zone of the Franklin Rod. Master Thesis,
Mississippi State University.
Wang, H. Q., Kong, Q., Yu, Z. P. and Yang, W. J. (2012) Effects of Ceramsite Concrete
Strength on Natural Frequency Based on ANSYS. In Applied Mechanics and Materials,
204: 4124-4127.

MCRJ Special Issue Vol. 4 | No. 2 | 2018 184
DAMAGE OF REINFORCED CONCRETE BEAMS CONSISTING MODIFIED ARTIFICIAL POLYETHYLENE AGGREGATE (MAPEA) UNDER LOW IMPACT LOAD Shahrul Niza Mokhatar, Sharifah Salwa Mohd Zuki1, Josef Hadipramana2, Ahmad Fahmy Kamarudin1, Mohammad Soffi Md Noh1, Mohamed Muftah Mustafa3, Nurul Shazlin Norshahimi3
1 Jamilus Research Centre, Faculty of Civil & Environmental Engineering, Universiti Tun Hussein Onn Malaysia, 86400 Batu Pahat, Johor, Malaysia. 2 Department of Civil Engineering, Faculty of Engineering, Universitas Muhammadiyah Sumatera Utara, UMSU 20238 Medan North Sumatera, Indonesia. 3 Faculty of Civil & Environmental Engineering, Universiti Tun Hussein Onn Malaysia, 86400 Batu Pahat, Johor, Malaysia.
Abstract The impact damage of reinforced concrete beams subjected to low velocity impact loading at the ultimate load range are explored. In this study, an impact tests is carried out on reinforced concrete beam consisting Modified Artificial Polyethylene Aggregate (MAPEA), where, an approximately 100 kg of impact weight were dropped three times onto the beam specimens until its fails. The waste plastic bags, that encapsulated by glass powder as known as MAPEA were used as the replacement of coarse aggregate. There are twelve beam specimens of size 120 mm x 150 mm x 800 mm are categorized into three groups, where each group consists of 4 specimens. The three groups denoted as normal reinforced concrete (NRC), reinforced concrete with MAPEA concrete block infill (RCAI) and reinforced concrete with 9% of MAPEA as a coarse aggregate (RC9A). All specimens were tested under low velocity impact loads under 0.32 m and 1.54 m (2.5 m/s & 5.5 m/s velocities) drop height of impact weight. The comparisons were made between the three types of beams under the aspect of failure (shear and flexural) and its final displacement. The result of the laboratory test showed that the RC9A beams produced less crack and low value of residual displacement. Keywords: Impact, Low velocity, MAPEA, Polyethylene aggregate, Reinforced Concrete beam.
INTRODUCTION
One of the important considerations for the effective use of structural materials is impact
loading. Generally, an impact loading predominantly one of the accountability focuses for
structural elements both in steel and concrete. In fact, reinforced concrete (RC) structure under
impact loading shows the dissimilar behaviour than statically loaded structures. Thus, this
kind of severe loading is one of the dynamic factors that should be considered in the analysis
and design of structures. The impact loading is related to conservation energy and momentum
law. While, the impactor with mass and velocity strikes the target, it generated the kinetic
energy. When the impactor start to touch the target surface, then the impact force is produced
and the kinetic energy is partially converted to strain energy in the target. The other part of
kinetic energy is converted in any form of energy such as sound, heat, and dissipation through
local plastic deformation of target and/or impactor (Lu and Yu, 2003). The strain energy
propagated away as stress waves in target. The stress waves as a compressive stress is
important role in local damage behaviour of target. If the surface target is unconstrained
condition, then the free surface target transmits the reflection of stress wave in longitudinal
direction to be a tensile and propagates to the point of surface where it loaded by impact force
from the distal face (Beppu et al. 2008; Lu, 2003). If the slab target is brittle and low in tensile,
the reflection as tensile wave produce the fracture and part of materials around surface target
will be separated and fly away or spalling. Along with that, the compression stress wave also

MCRJ Special Issue Vol. 4 | No. 2 | 2018 185
propagate through to rear surface of target or transverse direction. This stress wave will be
“carried” and dissipated by the thickness of target. The transverse compressive stress wave
obtain the flexural and/or shear failure of the target. However, these failure will not occur if
the target is high in tensile (Yankelesvsky, 1997). With regards to this, there has been a
growing interest in the past few decades among the engineering community to understand the
response of RC structures subjected to extreme loads due to impact. Furthermore, the
application of impact tests on concrete had been found in many investigations, such as by
Beppu et al. (2008); Damasceno et al. (2014); Dancygier and Yankelevsky (1996); Haldar
and Hamieh (1984); Hughes (1984); Mokhatar and Abdullah (2012); Yankelevsky (1997);
Zaidi et al. (2014) and Zang et al. (2005).
On the other hand, many countries had issues with waste materials. Generally, the waste
plastic bags are one of the major contributions to the increasing number of solid waste
production in this country, and only 1 to 3 percent are ever recycled (Khalid et al., 2018).
Plastic bags can be a nuisance in the society. It can cause a wastage problem as most plastic
bags are not biodegradable if buried. Use of plastic bags caused an adverse impact on the
environment as well as being a big problem in landfills. Therefore, innovative solutions have
to be developed to solve this problem. One of the considerable/substantial actions is by using
waste plastic bags as artificial aggregates in concrete. However, the strengths and behaviour
of concrete containing polyethylene (PE) aggregates should be extensively investigated in
order to understand the ability of this concrete as a structural material and to ensure that the
concrete structure can carry meaningful load without experiencing severe failures under
impact loads. Mustafa et al. (2011) found that the compressive strength of concrete containing
PE aggregates are lower than normal concrete, however, PE aggregate are suitable for coarse
aggregate replacement in concrete through their physical analysis; thus, it is can be used as
infill block to replace ineffective volume of RC beam. The incorporation of PE aggregate can
significantly improve some properties of concrete because this type of artificial aggregate has
high toughness, good abrasion behaviour, low thermal conductivity and high heat capacity
(Saikia and Brito, 2012; 2013).
The direct applications of PE-concrete as a concrete structure are still uncertain due to its
strength. However, PE-concrete can be used as infill for RC beam. The combination of PE-
concrete infill and normal concrete produces so-called composite-based-concrete-structure
that has advantage due to lighter weight. RC beam is highly designed to carry compression
while steel reinforcements transfer tension stress and loadings. The relationship between
transfer tension stress and strain in normal concrete cross-section is almost linear at small
value of stress (for stresses less than 40% of the compressive concrete strength). In this
condition, the inner part, under neutral axis, only acts as a passive volume that has a small
contribution on the crack and failure resistances (Zainorizuan et al., 2016). In addition, when
an RC structure is subjected to flexural and shear, the concrete volume under neutral axis of
the cross-section is considered ineffective when it is in tension at ultimate limit states.
In this study, modified artificial polyethylene aggregate (MAPEA) is used as the
replacement of coarse aggregate in concrete beam, which is made from waste plastic that
encapsulated by glass. The use of the waste plastic and glass for constructions can reduce the
cost of construction materials and keep the environment clean (Hadipramana et al., 2012).
The waste materials such as plastics and glasses could be used as construction materials
(Liguori and Iucolano, 2014; Patil et al., 2014; Ali and Al-Tersawy, 2012). In addition, the

MCRJ Special Issue Vol. 4 | No. 2 | 2018 186
used of MAPEA results in lighter concrete structure when compared to conventional coarse
aggregates. Thus, the aim of this paper is to presents the experiment results of impact
behaviour of RC beam with MAPEA as a coarse aggregate in concrete and RC beam with
MAPEA concrete block as infill. The details of specimen can be obtained in the following
section.
MATERIALS AND BEAMS Modified Artificial Polyethylene Aggregate (MAPEA)
Most of the products in the world are manufactured from petrochemicals and are non-
biodegradable (Kim and Kim, 2008). This products are significant source of environmental
pollution and waste in nature (Siti et al., 2017; Ismail, 2016). One of the non-biodegradables
materials is the Low Density Polyethylene (LDPE). One of the application of LDPE is in
carrier bags and general packaging. Therefore, it was estimated that 12,000 tons LDPE was
dump into landfills per day with an average of 20 percent of glass waste.
In this research study, MAPEA was produced from waste plastic bags (Figure 1a), where,
the plastic were compacted and heated about 150°C for 20 minutes in oven. Then, the heated
plastic hardened and formed the Artificial Polyethylene Aggregate (APEA), as shown in
Figure 1b. In order to form MAPEA, the APEA was coated with glass powder and paint
(Figure 1c) to produce rough surface. The details of efficiency of glass-covered artificial
aggregate has been extensively discussed by Mohamed et al. 2016. Finally, MAPEA was used
as a coarse aggregate in the concrete mixture of the RC beam specimens.
(a) (b)
(c) (d)
Figure 1. Production of MAPEA: a) compacting the plastic bag b) the plastic bags were heated to form the Artificial Polyethylene Aggregate (APEA) c) APEA encapsulated by glass and paint to
produce MAPEA d) MAPEA ready to use as coarse aggregate

MCRJ Special Issue Vol. 4 | No. 2 | 2018 187
Concrete Mix Design
All the RC beams specimens are designed in accordance to Eurocode 2 (EC2) to achieve
a compressive strength of 25 N/mm2 on day 28. All the beam specimens are prepared with the
same dimensions of 800 mm length, 120 mm width and 150 mm height. The first group of
specimen is normal concrete (NRC) as a control specimen and the second group of specimen
is RCAI, which consists of concrete block with 50 mm width, 70 mm width and 790 mm
utilizing 100% of MAPEA. The third group is RC beam with 9% of MAPEA as a coarse
aggregate replacement (RC9A). The details dimension and volume of each sample are
tabulated in Table 1.
Table 1. Size and volume of sample
Sample Size
(Width x Height x Length) (m3)
Volume (m3)
Cube 0.15 x 0.15 x 0.15 3.375 x 10⁻³
Beam 0.12 x 0.15 x 0.80 0.0144
Block 0.05 x 0.07 x 0.79 0.0027
a. Dimension of NRC and RC9A
b. Dimension of RCAI
Figure 2. Dimension of NRC, RC9A, and RCAI beams
IMPACT TEST
Tests for specimen of NRC, RCAI and RC6A were carried out at Jamilus Research
Centre, University Tun Hussein Onn Malaysia in order to investigate the low-velocity impact
behavior and failure mechanism of the beams. Several measuring devices and testing items
are required for development of impact tests in order to guarantee a reliable method of testing
and their ability to portray the experiments so that it was similar to real conditions as shown
in Figure 3. The test/experiment was individually designed to be able to test beam specimens
under impact condition. This research study focused on two impact velocities; (1) 100 kg of
impactor was dropped onto the mid span of the beam at different height and (2)the beam
specimens were suffered under multiple (3 times) velocity at 2.5 m/s and 5.5 m/s.

MCRJ Special Issue Vol. 4 | No. 2 | 2018 188
Figure 3. Drop weight Impact test equipment
All the specimens were placed on the rigid support and the top surface of the specimens
were unconstrained. During the impact tests, the steel frame structures and support conditions
should be stiff enough to support the load without significant deformation. The vertical
movement of the support conditions during the impact process will affect the displacement
and another measurement value. The final displacement and mode of failure for each beam
specimens were recorded. To ensure that the test performed correctly, the following checks
are carried out:
• Assemble and place the support position in the correct dimension. Set the beam
specimen on the support system and align it from the both directions.
• Ensure that the connections between all the components work properly.
• Lift up the drop weight to the desired height and measure the height, finally, set it to
fall.
RESULT AND ANALYSIS Impact Test Results
Table 2 shows the average displacement for each type of beam specimens according to
their velocity of impact loading. The displacement of the beam was recorded at the mid-span
of the beam as the critical point occurred at this zone. The comparison of the value of
displacement was made between the three types of beams. Based on the result, the lowest
displacement value was observed in RC9A for all 2.5 m/s impact velocity. This indicates that
the MAPEA absorb flexural energy impact for 2.5 m/s impact velocity. Whereas, for bigger
energy impact velocity, RC beam with MAPEA block (RCAI) possessed the lowest
displacement after the first impact. It indicates that the compressive stress wave in transverse
direction was distributed by MAPEA block in RCAI. However, the scabbing and spalling
occurred after the second impact on RCAI compare to others beams (Table 3). This local
failures occurred due to the poor bonding between MAPEA and the cement matrix inside the
beam. This local failures, the so called ‘bell plug shape’ were also observed by other
researchers (Yankelevsky, 1997).

MCRJ Special Issue Vol. 4 | No. 2 | 2018 189
Table 2. Velocity and average displacement
N/A: Not available
Table 3. Local failure of RC Beam
Beam Impact
Velocity (m/s)
Shear Crack
Flexural Crack
Scabbing Spalling Crush
NRC 2.5 √ - - - -
5.5 √ √ - √ √
RCAI 2.5 √ √ - - -
5.5 √ √ √ √ √
RC9A 2.5 √ √ - - -
5.5 √ √ - - -
As can be seen in Figure 4, Figure 5 and Figure 6, shear crack occurred at all beams.
However, RC9A could withstand the scabbing, spalling, and crushing by both impact
velocities (Figures 6a and 6b). In contrast with RCAI and RC9A, the flexural crack did not
occur at NCR, when it was subjected to 2.5 m/s impact loading (Figure 4a). This is due to
elastic stress of NCR where it could overcome the compressive stress wave. Nevertheless, the
5.5 m/s impact velocity was beyond the elastic stress of NCR, therefore the flexural crack was
observed in this beam specimens (Figure 4b).
Figure 5a shows that scabbing and spalling did not occur when RCAI was subjected to
2.5 m/s impact loading. It indicates that the MAPEA block increase the plastic stress of beams
and had overcome the transverse stress wave due to 2.5 m/s impact loading. However, the
plastic stress that generated by MAPEA was not enough to withstand the longitudinal (Lu,
2003) and transverse stress wave that produced by 5.5 m/s impact loading. Hence, the spalling
and scabbing was observed in MAPEA block (Figure 5b).
a) NCR subjected to 2.5 m/s velocity
Beam Velocity (m/s)
Displacement (average) (mm)
1st impact 2nd impact 3rd impact
NRC 2.5 4.71 4.83 6.32
5.5 13.74 27.10 N/A
RCAI 2.5 3.85 5.54 8.86
5.5 11.40 26.17 N/A
RC9A
2.5 2.71 3.45 4.49
5.5 12.36 19.27 N/A
Shear Crack
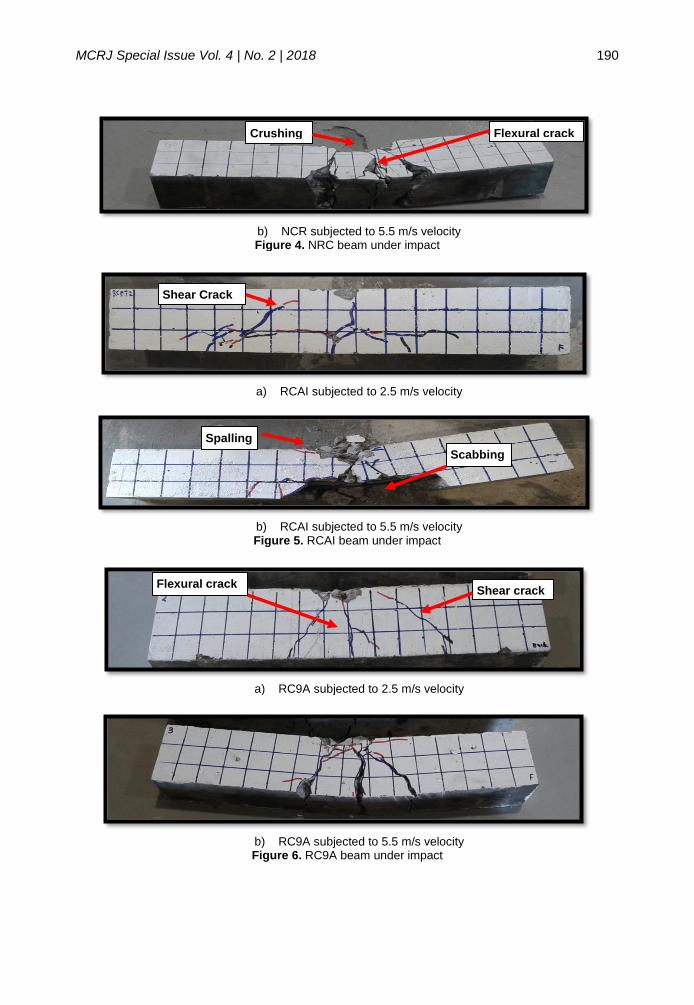
MCRJ Special Issue Vol. 4 | No. 2 | 2018 190
b) NCR subjected to 5.5 m/s velocity Figure 4. NRC beam under impact
a) RCAI subjected to 2.5 m/s velocity
b) RCAI subjected to 5.5 m/s velocity Figure 5. RCAI beam under impact
a) RC9A subjected to 2.5 m/s velocity
b) RC9A subjected to 5.5 m/s velocity Figure 6. RC9A beam under impact
Crushing
Scabbing
Flexural crack
Shear Crack
Spalling
Shear crack Flexural crack

MCRJ Special Issue Vol. 4 | No. 2 | 2018 191
CONCLUSION
The used of MAPEA in RC beam leads to 10% reduction in weight when compared to
traditional RC beams. More research study needed to be done on RCAI beams so that it can
absorb more energy during the impact, thus make it high in strength. As for RC9A beams, it
possessed lowest displacement under the impact load test of velocity 2.5 m/s and 5.5 m/s
compared to RCAI beams. The difference in trend of displacement for beams specimens under
5.5 m/s velocity was due to the difference in effectiveness when there was increased in
velocity.
REFERENCES
Ali, E. E. and Al-Tersawy, S. H. (2012) Recycled Glass as A Partial Replacement for Fine
Aggregate In Self-Compacting Concrete. Construction and Building Materials, 35:785-
791.
Beppu, M., Miwa, K., Itoh, M., Katayama, M. and Ohno, T. (2008) Damage evaluation of
concrete plates by high-velocity impact. International Journal of Impact Engineering,
35(12):1419-1426.
Damasceno, I. I. R., Ferreira, M. P. and Oliveira, R. C. (2014) RC Beams with Steel Fibers
under Impact Loads. Acta Scientiarum. Technology, 36(1):23-31.
Dancygier, A. N. and Yankelevsky, D. Z. (1996) High strength concrete response to hard
projectile impact. International Journal of Impact Engineering, 18(6):583-599.
Hadipramana, J., Samad, A.A.A., Zaidi, A.M.A., Mohammad, N., Wirdawati. (2012)
Influence of Polypropylene Fiber in strength of foamed concrete. Advanced Materials
Research, 488-489:253-257.
Haldar, A. and Hamieh, H. (1984) Local Effect of Solid Missiles on Concrete Structures.
ASCE Journal Structural Division, 110(5):948-60.
Hughes, G. (1984) Hard Missile Impact on Reinforced Concrete. Nuclear Engineering and
Design, 77(1):23-35.
Ismail, I., Jamaluddin, N. and Shahidan, S. (2016) A Review on Performance of Waste
Materials in Self Compacting Concrete (SCC). Journal Teknologi, 5(78):29–35.
Khalid, F.S., Irwan, J.M, Wan Ibrahim, M.H., Othman, N. and Shahidan, S. (2018) Splitting
tensile and pullout behavior of synthetic wastes as fiber-reinforced concrete.
Construction and Building Materials, 171: 54-64.
Kim, S. and Kim, B. (2008) A Laboratory Session Development: Study of Mechanical
Properties of Petroleum-based Plastic Compost Bag and Biodegradable Plastic Compost
Bag. 2008 Annual Conference & Exposition. Pennsylvania, 1-10.
Liguori, B. and Iucolano, F. (2014) Recycled Plastic Aggregates in Manufacturing of
Insulting Mortars. City Energy Safety Journals, (1):93-99.
Lu, G. and Yu, T. (2003) Energy Absorption of Structures and Materials. Abington
Cambridge, England: Woodhead Publishing Limited, 47-52 pp.
Mohamed, M. M., Shahrul, N. M. and Zainorizuan, M. J. (2016) Properties of Different
Artificial Lightweight Aggregates and Their Effect on Concrete Strength. ARPN Journal
of Engineering and Applied Science, 11(6):3726-3730.
Mokhatar, S. N. and Abdullah, R. (2012) Computational Analysis of Reinforced Concrete
Slabs Subjected to Impact Loads. International Journal of Integrated Engineering,
4(2):70-76.

MCRJ Special Issue Vol. 4 | No. 2 | 2018 192
Mustafa Al Bakri, A. M., Che Mohd Ruzaidi, G., Norazian, M. N., Kamarudin, H. and
Mohammad Tarmizi, S. (2011) Effects of HDPE Plastic Waste Aggregate on the
Properties of Concrete. Journal of Asian Scientific Research, 1(7):340-345.
Patil, P. S., Mali, J. R., Tapkire, G. V. and Kumavat, H. R. (2014) Innovative Techniques of
Waste Plastic Used in Concrete Mixture. International Journal of Research in
Engineering and Technology, 3(9):29-32.
Saikia, N. and Brito, J. D. (2012) Use of Plastic Waste Aggregate in Concrete. Construction
and Building Materials, 34:385-401.
Saikia, N. and Brito, J. D. (2013) Waste Polyethylene Terephthalate as an Aggregate in
Concrete. Materials Research, 16(2):341-350.
Siti, R. A., Akhtar, I. R., Abdul Awal, A. S. M. and Zakaria, H. M. (2017) Effect of Rubber
Powder Particle on the Strength of Foamed Concrete. International Journal of
GEOMATE, 13(38):129-134.
Yankelevsky, D. Z. (1997) Local response of concrete slabs to low velocity missile impact.
International Journal of Impact Engineering, 19(4):331-343.
Zaidi, A.M.A., Hadipramana, J., Samad, A.A.A. and Mohamad, N. (2014) Investigation on
Impact Resistance Foamed Concrete Reinforced by Polypropylene Fibre. Key
Engineering Materials, 594-595:24-28.
Zainorizuan, M. J., Koh, H. B., Shahrul, N. M., Ismail, M., Hissyam, H. and Nurul, H. H.
(2016) Structural Behaviour of Short-Span Reinforced Concrete Beams with Foamed
Concrete Infill. ARPN Journal of Engineering & Applied Sciences, 11(16): 9820-9825.
Zhang, M. H., Shim, V. P. W., Lu, G. and Chew, C. W. (2005) Resistance of high-strength
concrete to projectile impact. International Journal of Impact Engineering, 31(7):825-
841.

MCRJ Special Issue Vol. 4 | No. 2 | 2018 193
EXPERIMENTAL STUDY ON THE VIBRATION RESPONSES AND ENERGY DISSIPATION OF FOAMED CONCRETE COMPOSITE SLABS Zainorizuan Mohd Jaini1,2, Rahmat Hidayat Mohammed Rum3, Nor Hayati Abd Ghaffar1, Mohammad Shahrul Aizat Misbah3 and Mohd Shaffiq Md Desa3
1Jamilus Research Center, Universiti Tun Hussein Onn Malaysia, 86400 Parit Raja, Johor, Malaysia 2Civil and Structural Engineering Branch, Department of Public Works, 50582 Jalan Sultan Sallahuddin, Kuala Lumpur, Malaysia 3Faculty of Civil and Environmental Engineering, Universiti Tun Hussein Onn Malaysia, 86400 Parit Raja, Johor, Malaysia
Abstract Composite slab is an efficient replacement of the conventional reinforced concrete slab. It is usually consists of corrugated steel deck and concrete topping. In this experimental study, foamed concrete was introduced as concrete topping to reduce the self-weight of composite slab. More focus was given on the effect of thickness toward the natural frequency, damping ratio and energy dissipation of composite slab. The composite slab was cast with the size of 840mm width, 1800 length and five different thicknesses range between 75mm to 175mm. Foamed concrete was deliberately designed for the density of 1800kg/m3 with the utilization of rice husk ash (RHA) as partially sand replacement and polypropylene mega-mesh (PMM) as fiber reinforcement. Throughout the compression and splitting-tensile tests, foamed concrete achieves a decent quality with value of 35.03MPa and 2.01MPa for the compressive and tensile strengths respectively. It was observed that the natural frequency decreases with the increment of thickness. On the other hand, the damping ratio and energy dissipation indicate a significant increment correspond to the thickness of composite slab. Keywords: Natural frequency; Structural damping; Energy dissipation; Composite slab; Foamed
concrete; Corrugated steel deck
INTRODUCTION
In recent years, composite slab has become one of the important structures in building.
Usually composite slab is used in commercial and industrial buildings, but can also be
extended to the residential and leisure buildings. The motivation for using the composite slab
is mainly due to the time frame of construction and to achieve the required economical aspect.
Composite slab is known as a structure that consists of reinforced concrete on the top of
corrugated steel deck. Therefore, composite slab is widely referred as corrugated steel-
concrete slab. BS EN 1994-1-1 (2005) defined the composite slab as a structure like a slab in
which corrugated steel deck is used initially as permanent shuttering, subsequently combine
structurally with the hardened concrete and act as tensile reinforcement.
In conventional practise, normal concrete is used to give a perfect interaction with
corrugated steel deck. Normal concrete is the mixture of cement, sand, coarse aggregate and
water. The density of normal concrete is around 2400kg/m3 while the compressive strength
can achieve as high as 50MPa. It is widely known that normal concrete contributes to the
weight penalty. Therefore, for an efficient design and casting of composite slab, foamed
concrete is preferable as it can offer lightness and versatility. Foamed concrete comprises of
mortar matrix with minimum 20% of entrapped air-void and can be manufactured easily with
good workability, excellent performance of thermal insulation, fire resistance and absorption
(Narayanan & Ramamurthy, 2000; Jones & McCarthy, 2005; Mydin & Wang, 2012).

MCRJ Special Issue Vol. 4 | No. 2 | 2018 194
However, the utilization of foamed concrete in composite slab is relatively new and
require comprehensive investigations. There is a grave concern that the application of foamed
concrete may cause a greater transient behaviour on composite slab and probably lead to
undesirable vibration responses. Until recently, the literature reviews and past investigations
on the vibration responses are solely limited to the composite slab made of normal concrete.
Therefore, this study aims to investigate the vibration responses of foamed concrete composite
slabs in term of natural frequency, structural damping and energy dissipation. Moreover, the
susceptibility on the vibration responses of foamed concrete composite slab must be tackled
to prevent discomfort and outright structural failure.
COMPOSITE SLAB
Composite slab, as shown in Figure 1, is structurally efficient because it exploits the
tensile resistance of corrugated steel deck and compressive strength of concrete (Zoltan &
Istvan, 1998). It is widely used due to its advantage compared to reinforced concrete slab
where it can reduce size of structural components and increase the resistance of stresses.
According to Rackham et al. (2009), composite slab able to reduce around 30% of weight if
properly associated with the steel frame structures. As a result, the demand on composite slab
increases in construction industry (Lam et al., 2017). However, the interaction between
concrete and corrugated steel deck become paramount important in load transfer, effective
utilization of material, interfacial characteristics and durability of composite slab (Yoshitake
et al., 2012).
Figure 1. Composite slab consists of corrugated steel deck and reinforced concrete
On the other hand, composite slab is regarded as the best diaphragm strengthening method
for the building. Previous experience indicates that this kind of diaphragm generally allows
lower slab thickness, higher load bearing capacity and size reduction for structural
components of beams, columns and foundations (Abbas, 2014). Therefore, composite slab is
very useful for seismic building system. If fully associated with steel beams and infilled steel
columns, it can create high ductility of structural components to resist seismic events.
Chaudhari et al. (2014) stated that after the recent earthquakes in New Zealand, there is wide
acceptance of steel frame structure with composite slab, where the high performance can be
achieved using steel studs welded onto the beam and cast into the concrete slab.
Many investigations were conducted on the design, structural behaviour and performance
of composite slab made of normal concrete. Bayasi et al. (2001), Sanchez et al. (2011), Khalaf

MCRJ Special Issue Vol. 4 | No. 2 | 2018 195
et al. (2013) and Chaudhari et al. (2014) investigated the structural behaviour of composite
slab. On the other hand, Jeong et al. (2009), Cifuentes & Medina (2013), Johnson & Shepherd
(2013), Lakshimikandhan et al. (2013) and Abbas et al. (2014) investigated the interaction
and shear resistance of normal concrete with corrugated steel deck. However, Johnson & Li
(2012) proposed the application of foamed concrete in composite slab and found that the
bearing capacity is identical with counterpart from normal concrete. For the better
performance and durability, foamed concrete can be reinforced using fibers.
The strength of composite slab is fully governed by shear interaction between concrete
and corrugated steel deck, rather than by yielding of the corrugated steel deck. Therefore, the
connection and bond of concrete to corrugated steel deck play a crucial role in creating the
compositeness and to prevent the slip of composite slab. Composite slab is normally used to
span between 3.0m to 4.5m, where the thickness can be varied from100mm to 250mm for
shallow decking and in the range 250mm to 300mm for deep decking (Feldmann et al. 2013).
This type of slab has spanning behaviour for one-way with no account taken on the continuity
offered by reinforcement. That make it more vulnerable to vibration compare to the two-way
span reinforced concrete slab (Silva & David, 2009).
Usually, composite concrete is designed using static method which will not reveal the true
behaviour under dynamic load that induced by vibration. Generally, vibration is a repeated
motion and extensive movement in a period of time (He and Fu, 2001). Acceleration, velocity
and displacement are related matters to vibration. The external source of vibration can be
generated from traffic, ground-borne activities and high localised loads. Meanwhile, the
internal source of vibration is mostly about the human-induced resonant or machine-induced
vibration. The vibration from traffic and seismic are considered the most critical sources of
excitation of high vibration that need major concern (Hao & Cheng, 2001; Pridham, 2009).
Hunaidi (2000) stated that the external sources of vibration are likely to affect structures and
the sensitive equipment that housed in the building.
Varela & Battista (2011), Fahmy & Sidky (2012) and Abeysinghe et al. (2013)
investigated the vibration responses of composite slab made of normal concrete under human-
induced resonant. The consequences of investigations reach a similar outcome that indicate
the occurrence of multi-modal vibration. It was also found that the vibration caused by the
higher harmonics of the frequent activities can also cause discomfort and excessive
deflections. Chaudhari et al. (2014) emphasized that the continuous vibration can increase the
demand on the connection, panel zone and column, hence possibly resulting in some
undesirable inelastic deformation mechanisms. However, a substantial reduction of vibration
can be achieved by controlling the structural stiffness.
Any study on the vibration responses has a close look with the natural frequency and
associated mode shape as structural degrees of freedom. The vibration can be commonly
sorted by the amount of energy that is activated by the oscillation. Therefore, the natural
frequency is that on the lowest energy level and thus the most likely to be activated. Murray
et al. (2003) and Amick & Grodon (2005) proposed the acceptance criteria of vibration for
the specific function of slabs using the correlation of peak acceleration and natural frequency.
On the other hand, Klein & Rianer (1995) recommended that the natural frequency of concrete
slabs to be between 10Hz and 30Hz. According to Feldmann et al. (2013), for the comfort
criteria of composite slab, the natural frequency should be not less than 8Hz.

MCRJ Special Issue Vol. 4 | No. 2 | 2018 196
EXPERIMENTAL STUDY Material preparation
In preparing the materials for the casting of cube and cylinder specimens as well as the
composite slabs, the mix design of foamed concrete was based on the volume rather than the
weight. In addition, the mix design was purposely designed to produce foamed concrete with
targeted density of 1800kg/m3. The materials, as can be seen in Figure 2, include the ordinary
Portland cement (OPC), sand, rice husk ash (RHA), polypropylene mega-mesh 55 (PMM),
foam agent, superplasticizer (SP) and water. A mix design as suggested by Abd Rahman et
al. (2015) and Jaini et al. (2017) was employed in the production of foamed concrete, where
the cement-sand ratio is 0.50, water-cement ratio is 0.55, foam agent-cement ratio is 0.07 and
foam agent-water ratio is 0.05.
a)
b)
c)
d)
f)
g)
Figure 2. Main materials in foamed concrete; a) OPC, b) Sand, c) RHA, d) PMM), f) Foam agent and g) SP
The detail about required quantity of materials can be referred in Table 1. In this
experimental study, foamed concrete was produced using prefoaming method. The preformed
foam was produced by diluting the foam agent with water in an LCM generator. The function
of preformed foam is as a stable substance that added in mortar matrix for the desired density
of foamed concrete. RHA was utilized as partially sand replacement at 40% of volume
fraction. RHA was obtained from the combustion process at 700°C for 6 hours. The
composition of RHA consists of 89.90% SiO2, 0.46% Al2O3, 0.47% Fe2O3, 1.01% CaO,
0.79% MgO, 0.11% Na2O3 and 0.32% LOI, which indicates the presence of highly amorphous
silica. Meanwhile, 9kg/m3 PMM was added in foamed concrete to enhance the mechanical
properties.
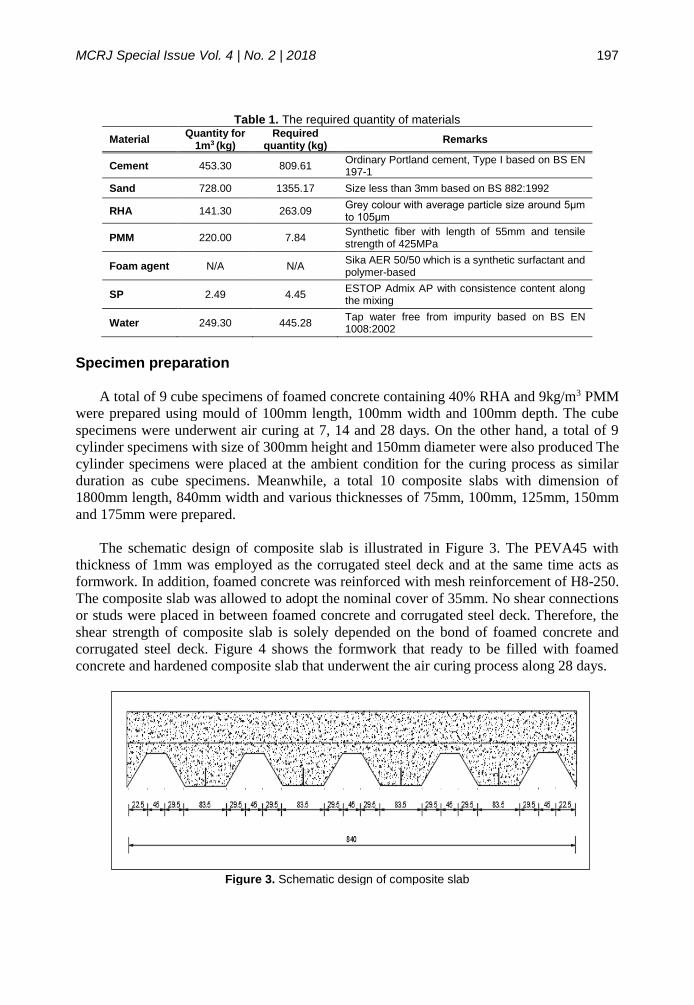
MCRJ Special Issue Vol. 4 | No. 2 | 2018 197
Table 1. The required quantity of materials
Material Quantity for
1m3 (kg)
Required quantity (kg)
Remarks
Cement 453.30 809.61 Ordinary Portland cement, Type I based on BS EN 197-1
Sand 728.00 1355.17 Size less than 3mm based on BS 882:1992
RHA 141.30 263.09 Grey colour with average particle size around 5μm to 105μm
PMM 220.00 7.84 Synthetic fiber with length of 55mm and tensile strength of 425MPa
Foam agent N/A N/A Sika AER 50/50 which is a synthetic surfactant and polymer-based
SP 2.49 4.45 ESTOP Admix AP with consistence content along the mixing
Water 249.30 445.28 Tap water free from impurity based on BS EN 1008:2002
Specimen preparation
A total of 9 cube specimens of foamed concrete containing 40% RHA and 9kg/m3 PMM
were prepared using mould of 100mm length, 100mm width and 100mm depth. The cube
specimens were underwent air curing at 7, 14 and 28 days. On the other hand, a total of 9
cylinder specimens with size of 300mm height and 150mm diameter were also produced The
cylinder specimens were placed at the ambient condition for the curing process as similar
duration as cube specimens. Meanwhile, a total 10 composite slabs with dimension of
1800mm length, 840mm width and various thicknesses of 75mm, 100mm, 125mm, 150mm
and 175mm were prepared.
The schematic design of composite slab is illustrated in Figure 3. The PEVA45 with
thickness of 1mm was employed as the corrugated steel deck and at the same time acts as
formwork. In addition, foamed concrete was reinforced with mesh reinforcement of H8-250.
The composite slab was allowed to adopt the nominal cover of 35mm. No shear connections
or studs were placed in between foamed concrete and corrugated steel deck. Therefore, the
shear strength of composite slab is solely depended on the bond of foamed concrete and
corrugated steel deck. Figure 4 shows the formwork that ready to be filled with foamed
concrete and hardened composite slab that underwent the air curing process along 28 days.
Figure 3. Schematic design of composite slab
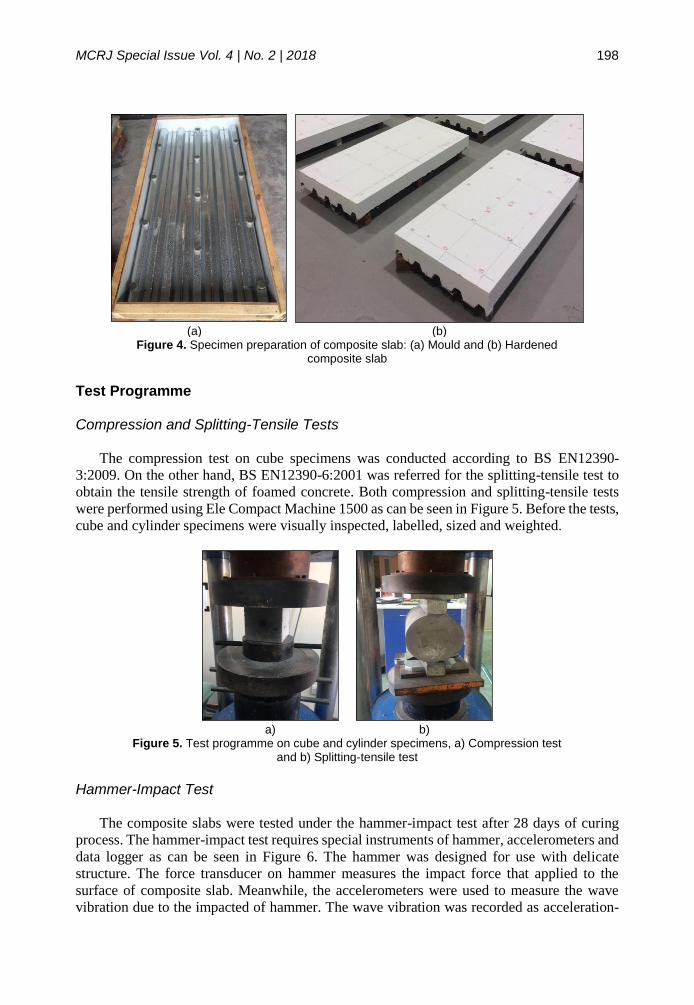
MCRJ Special Issue Vol. 4 | No. 2 | 2018 198
(a)
(b)
Figure 4. Specimen preparation of composite slab: (a) Mould and (b) Hardened composite slab
Test Programme
Compression and Splitting-Tensile Tests
The compression test on cube specimens was conducted according to BS EN12390-
3:2009. On the other hand, BS EN12390-6:2001 was referred for the splitting-tensile test to
obtain the tensile strength of foamed concrete. Both compression and splitting-tensile tests
were performed using Ele Compact Machine 1500 as can be seen in Figure 5. Before the tests,
cube and cylinder specimens were visually inspected, labelled, sized and weighted.
a) b)
Figure 5. Test programme on cube and cylinder specimens, a) Compression test and b) Splitting-tensile test
Hammer-Impact Test
The composite slabs were tested under the hammer-impact test after 28 days of curing
process. The hammer-impact test requires special instruments of hammer, accelerometers and
data logger as can be seen in Figure 6. The hammer was designed for use with delicate
structure. The force transducer on hammer measures the impact force that applied to the
surface of composite slab. Meanwhile, the accelerometers were used to measure the wave
vibration due to the impacted of hammer. The wave vibration was recorded as acceleration-

MCRJ Special Issue Vol. 4 | No. 2 | 2018 199
time history (in relation to location) by data logger and can be displayed in both plot and
digital using QuickDAQ. The set-up of hammer-impact test can be seen in Figure 7.
a) Hammer
b) Accelerometer
c) Data logger
Figure 6. Instrument of hammer-impact test
Figure 7. Test set-up for hammer-impact test
Fifteen points for accelerometers were drawn on top surface of composite slab as shown
in Figure 8. Points of A1, A2, A3, A4 and A5 are classified as Series A, while Series B consists
of B1, B2, B3, B4 and B5. Points for Series C are dictated by C1, C2, C3, C4 and C5. The
hammer was stroked at point X which located at one-third span of composite slab. The
hammer was stroked for ten times for the accuracy of data and the wave vibration at A1, B1
and B2 were simultaneously captured. The processes were repeated for A2, B2 and B3 until
A5, B5 and C5.
Figure 8. The position of the accelerometers during the test
The raw data obtained from the impact hammer test were examined to get the oscillation
of wave propagation and acceleration-time history, consequently the vibration responses and
energy dissipation can be determined. The vibration responses are referred to the natural

MCRJ Special Issue Vol. 4 | No. 2 | 2018 200
frequency and structural damping. In order to determine the natural frequency, the average
time of natural period, T needs to be determined using the following Equation 1:
( )f iT TT
n
−= (1)
where Tf is the final time of last completed sine cycle, Ti is the initial time of first
completed sine cycle and n is the number of completed sine cycle. The natural frequency, f of
composite slab can be easily solved using the following Equation 2:
1f
T= (2)
On the other hand, the empirical approach provides a simple calculation of the natural
frequency, such as Equation 3:
1
2
kf
m= (3)
where k is the structural stiffness while m is the mass of composite slab. The structural
damping, Di can be determined using the following Equation 4:
1ln
2i
ij
aD
n a= (4)
where ai and aj are the accelerations that generated from the hammer-impact test.
Alternatively, the structural damping can be determined using the following Equation 5:
35 2.5i iD fa + (5)
The energy dissipation, Ep can be measured using the following Equation 6:
4p eE f K= (6)
where Ke represents the kinetic energy that can be calculated using the following Equation 7:
11
2 2e e p
TK M a
= (7)
where Me is the effective mass of composite slab, ap is the peak acceleration and T1 is the
corner period for 1 complete cycle of vibration.

MCRJ Special Issue Vol. 4 | No. 2 | 2018 201
RESULTS AND DISCUSSIONS
Compression and Tensile Strengths
The compressive strength of foamed concrete correspond to the curing age is shown in
Figure 9. At 7 days, the compressive strength achieves 26.18MPa that reveal the early strength
development. The compressive strength boost around 19.52% to reach 31.59MPa at 14 days.
Foamed concrete accomplishes a decent quality with the compressive strength of 35.03MPa
at 28 days. This 94.61% increment than conventional foamed concrete surpasses the minimum
requirement as set by the code of practise, in which Eurocode 2 enforces 22MPa. It can be
confirmed that the addition of RHA improves the compressive strength of foamed concrete
as agreed by Bayuaji (2015). Other than that, PMM and SP are also contribute to the better
material properties of foamed concrete (Jaini et al., 2017; Rum et al., 2017).
Figure 9. Compressive strength of foamed concrete containing 40% RHA and 9kg/m3 PMM
Meanwhile, Figure 10 shows the tensile strength of foamed concrete. The tensile strength
was observed to increase throughout the curing age. Foamed concrete developed tensile
strength at 1.46MPa within 7 days. At 14 days, the tensile strength increases around 13.1% to
has value of 1.67MPa. It can be observed that the tensile strength is progressively increased
at 28 days to achieve as high as 2.01MPa.
Figure 10. Tensile strength of foamed concrete containing 40%RHA and 9kg/m3 PMM
0
5
10
15
20
25
30
35
40
0 7 14 21 28
Co
mp
ressiv
e S
tren
gth
,f c
(MP
a)
Curing Age, Ca (Day)
0.0
0.5
1.0
1.5
2.0
2.5
3.0
0 7 14 21 28
Ten
sile S
tren
gth
,f t
(MP
a)
Curing Age, Ca (Day)
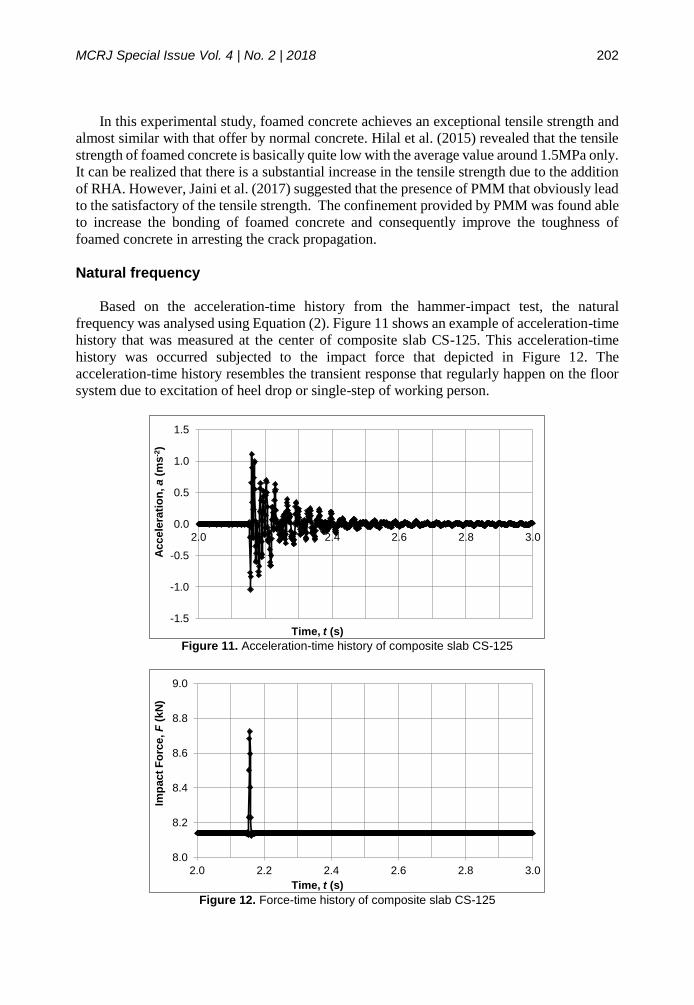
MCRJ Special Issue Vol. 4 | No. 2 | 2018 202
In this experimental study, foamed concrete achieves an exceptional tensile strength and
almost similar with that offer by normal concrete. Hilal et al. (2015) revealed that the tensile
strength of foamed concrete is basically quite low with the average value around 1.5MPa only.
It can be realized that there is a substantial increase in the tensile strength due to the addition
of RHA. However, Jaini et al. (2017) suggested that the presence of PMM that obviously lead
to the satisfactory of the tensile strength. The confinement provided by PMM was found able
to increase the bonding of foamed concrete and consequently improve the toughness of
foamed concrete in arresting the crack propagation.
Natural frequency
Based on the acceleration-time history from the hammer-impact test, the natural
frequency was analysed using Equation (2). Figure 11 shows an example of acceleration-time
history that was measured at the center of composite slab CS-125. This acceleration-time
history was occurred subjected to the impact force that depicted in Figure 12. The
acceleration-time history resembles the transient response that regularly happen on the floor
system due to excitation of heel drop or single-step of working person.
Figure 11. Acceleration-time history of composite slab CS-125
Figure 12. Force-time history of composite slab CS-125
-1.5
-1.0
-0.5
0.0
0.5
1.0
1.5
2.0 2.2 2.4 2.6 2.8 3.0
Accele
rati
on
,a (
ms
-2)
Time, t (s)
8.0
8.2
8.4
8.6
8.8
9.0
2.0 2.2 2.4 2.6 2.8 3.0
Imp
act
Fo
rce,F
(k
N)
Time, t (s)

MCRJ Special Issue Vol. 4 | No. 2 | 2018 203
In the design consideration of composite slab, the thickness of concrete topping plays a
significant role in governing the serviceability. Basically, increasing the thickness will
eventually lead to the better performance and reduce the deflection. In vibration, however,
either the structural stiffness or mass of structure that become a dominant parameter in
influencing the natural frequency. It can be realized that the natural frequency of foamed
concrete composite slab decreases due to the thickness, as displayed in Figure 13. It should
be emphasized here that the natural frequency in this experimental study refers to the first
mode shape of composite slab. According to Khan et al. (2013), increasing the thickness lead
to the higher mass of structure that subsequently decrease the natural frequency. Composite
slab CS-075 recorded the highest natural frequency at 34.98Hz and the change of value over
the thickness is trivially insignificant.
Figure 13. Natural frequency of composite slab at different thicknesses
However, the natural frequency is slightly increased for the composite slab CS-175 in
which a similar behaviour was recorded by Kansinally & Tsavdaridis (2015). Therefore, the
structural stiffness was affirmed as the foremost factor in governing the natural frequency
while the mass of structure is limited within the certain array. A comparison of natural
frequency using the empirical approach, as summarized in Table 2, revealed a contradict
situation with experimental study. By using the empirical approach, the natural frequency was
analysed in the elastic state with no crack effects taken into the account. Further verification
using MEScope shows a very close set of results with a similar pattern of the natural frequency
as obtained through experimental study. In the empirical approach and MEScope, the highest
natural frequency was experienced by the composite slab CS-175.
Table 2. A comparison of natural frequency between experimental, empirical and MEScope
Composite Slab Natural Frequency, f (Hz)
Code Thickness, h (mm)
Experimental Empirical MEScope
CS-075 75 34.98 24.91 32.60 CS-100 100 32.18 33.77 31.70 CS-125 125 30.77 36.54 30.20 CS-150 150 30.17 39.29 33.50 CS-175 175 31.50 41.98 34.10
Meanwhile, the relationship between the natural frequency with the thickness of composite
slab can be translated as Equation 8:
0
10
20
30
40
50
75 100 125 150 175
Na
tura
l F
req
ue
nc
y,f
(Hz)
Thickness, h (mm)

MCRJ Special Issue Vol. 4 | No. 2 | 2018 204
20.0011 0.295 51.306f h h= − + (8)
However, this correlation is merely controlled by the mass of structure based on the
volume of foamed concrete and not reflected by other specifications. In vibration responses,
the serviceability must also be connected with the structural stiffness and span of composite
slab. Moreover, foamed concrete is controlled by its density in favour of strength and hence
must not be ignored. When the natural frequency is plotted against the ratio of span-to-
thickness, the natural frequency can be presented by the best fitted of polynomial form:
2
0.033 0.842 36.145S S
fh h
= − +
(9)
where h is the thickness of composite slab, S is the span and αρ is the multiplying factor related
to the density. Since Equation (9) was developed for foamed concrete with density 1800kg/m3,
hence the multiplying factor can be considered as 1.
Structural Damping
Basically, the structural damping of composite slab fall within the range of 2.0% to 3.0%.
However, composite slab made of foamed concrete has the structural damping around 1.5%
to 5.0% in which it can be considered quite high. Figure 14 shows the structural damping at
different thicknesses of composite slab. It can be observed that the structural damping
increases as the thickness become larger. However, such behaviour only pertinent to the
composite slab with thickness not bigger than 125mm and beyond that the structural damping
is gradually declined.
Figure 14. Structural damping of foamed concrete composite slab at different thicknesses
Although foamed concrete is categorized as lightweight material, but the structural
damping reveals that any dynamic conditions will oscillate or ring the composite slab within
the brief period only. This is an indication that the vibration amplitudes can decay faster and
concurrently make the composite slab achieves a good comfortability. The structural damping
was identified as a dynamic property of the composite slab relevant to the floor response and
hence must not be overlooked. In certain situation where the natural frequency is acceptably
high, the composite slab may experience much greater excitation due to the low structural
damping that less than 1%.
0
2
4
6
8
10
75 100 125 150 175
Str
uc
tura
l Da
mp
ing
,Di(%
)
Thickness, h (mm)

MCRJ Special Issue Vol. 4 | No. 2 | 2018 205
The relationship between the structural damping and thickness of composite slab can be
simplified to the following Equation 10:
20.0011 0.261 12.711iD h h= − + (10)
Ta et al. (2006) suggested that the structural damping has a linear relationship with the
natural frequency. Moreover, Varela & Battista (2011) clarified that the structural damping
increases in parallel with the natural frequency, as an example for composite slab with the
natural frequency of 7.57Hz and 12.21 Hz, the structural damping is 0.25% and 0.64%
respectively. In this experimental study, the relationship between the structural damping and
natural frequency is in linear inverse state as can be expressed by the following Equation 11:
0.725 26.854iD f= − + (11)
However, there is a potential that the structural damping become proportional to the
natural frequency for the composite slab with thickness bigger than 175mm.
Energy dissipation
Figure 15 shows the energy dissipation of composite slab at different thicknesses. It can
be observed that the energy dissipation ranges between 0.10J to 0.55J and the value increase
linearly as correspond to the thickness. However, the change in the energy dissipation due to
the thickness of composite slab is relatively small, around 35%, except for the composite slab
CS-125. When the thickness of composite slab getting bigger from 120mm to 125mm, the
energy dissipation increases as high as 115% from 0.169J to 0.364J.
Figure 15. Energy dissipation of composite slab at difference thicknesses
According to Brownjohn (2001), the energy dissipation of lightweight precast slab is
around 0.1J to 0.2J. Therefore, the energy dissipation obtained in this experimental study can
be considered convincing. Since the energy dissipation was triggered from the first mode
shape, it is the lowest value that can be activated by the composite slab. The relationship
between the energy dissipation and thickness of composite slab can be depicted as Equation
12:
6 20.5 0.006 0.323pE e h h−= − + − (12)
0.0
0.2
0.4
0.6
0.8
1.0
75 100 125 150 175
En
erg
y D
issip
ati
on
,Ep
(J)
Thickness, h (mm)

MCRJ Special Issue Vol. 4 | No. 2 | 2018 206
In general, the energy dissipation of composite slab is mainly depended on the natural
frequency, structural damping and kinetic energy. Foamed concrete itself is well recognized
a good material in the energy absorbing. However, the structural damping was identified as
the crucial factor that associated with the energy dissipation. The structural damping is the
process through which the vibration of composite slab dismisses in amplitude due to the loss
in mechanical energy. The relationship between the energy dissipation and structural damping
can be alleged as a linear, though in actual it can be complicated. The simplified form of
energy dissipation correspond to the structural damping is expressed as the following
Equation 13:
0.063 0.05p iE D= + (13)
CONCLUSIONS
An experimental study on the vibration responses and energy dissipation of foamed
concrete composite slabs was conducted using hammer-impact test. In addition, the
compression and splitting-tensile tests were also performed to determine the compressive and
tensile strengths of foamed concrete containing 40% RHA and 9kg/m3 PMM. The
compressive and tensile strength achieve 35.03MP and 2.01MPa respectively in which
exceeded the expectation and requirement by the code of practise. The presence of high silica
content in RHA and confinement effects from PMM that contribute to the satisfactory of
compressive and tensile strengths. Therefore, foamed concrete can be confidently applied in
composite slab. Meanwhile, the acceleration-time history measured from hammer-impact test
was analysed to determine the natural frequency, structural damping and energy dissipation
of composite slab. The results indicate that the natural frequency decreases throughout the
thickness, but slightly increase when the thickness bigger than 150mm. The structural
damping, however, shows a contradict behaviour in which the value increases for the
thickness up to 125mm before gradually decay. On the other hand, the energy dissipation
increases correspond to the thickness of composite slab. In this experimental study, it can be
observed that the thickness plays a crucial role in governing the vibration responses and
energy dissipation.
In conjunction of that, polynomial equations were proposed for the natural frequency,
structural damping and energy dissipation. Besides the thickness that prompting the structural
stiffness and mass of structure, the span of composite slab and density of foamed concrete are
important parameters that must be taken into the consideration. Therefore, a suitable and
simply equation was proposed to determine the natural frequency that depend on the ratio of
span-to-thickness and multiplying factor of density. Moreover, linear equations were
introduced in correlation between the structural damping ratio with natural frequency and the
energy dissipation with structural damping. However, these equations are limited to the
certain extend and require further verification.
ACKNOWLEDGMENTS
Authors would like to thanks Universiti Tun Hussein Onn Malaysia (UTHM) and
Ministry of Education Malaysia for the continuous supports in term of facilities and financial.
This experimental study was conducted under the Research Acculturation Grant Scheme
(RAGS), Vot. No. R068.

MCRJ Special Issue Vol. 4 | No. 2 | 2018 207
REFERENCES
Abbas, H. S., Bakar, S. A., Ahmadi, M. and Haron, Z. (2014) Experimental Studied on
Corrugated Steel-Concrete Composite Slab. Journal Civil Engineering, 67(3):225-233.
Abd Rahman, N., Jaini, Z. M. and Mohd Zahir, N. N. (2015) Fracture Energy of Foamed
Concrete by Means of the Three-Point Bending Test on Notched Beam Specimens. ARPN
Journal of Engineering and Applied Sciences, 10(15):6562-6570.
Abeysinghe, C. M., David, P. T. and Perera, N. J. (2013) Dynamic Performance
Characteristics of an Innovative Hybrid Composite Floor Plate System Under Human-
Induced Loads. Composite Structures, 96(2):590-600.
Amick, C. H. and Gordon, C. G. (2005) Evolving Criteria for Research Facilities: I-Vibration.
Proceeding of the SPIE Conference 5933: Building for Nanoscale Research and Beyond.
California, 1-13.
Bayasi, Z., Kaiser, H. and Gonzales, M. (2001) Composite Slabs with Corrugated Simcon
Deck as Alternative for Corrugated Metal Sheets. Journal of Structural Engineering,
127(10):1198-1205.
Bayuaji, R. (2015) The Influence of Microwave Incinerated Rice Husk Ash on Foamed
Concrete Workability and Compressive Strength Using Taguchi Method. Jurnal
Teknologi, 75(1):265-274.
Brownjohn, J. M. W. (2001) Energy Dissipation from Vibrating Floor Slabs Due to Human-
Structure Interaction. Shock and Vibration, 8(6):315-323.
BS EN 1994-1-1 (2004) Design of Composite Steel and Concrete Structures Part 1-1: General
Rules and Rules for Buildings. London: British Standard Institution.
Chaudhari, T., Macrae, G., Bull, D., Chase, G. and Hobbs, M. (2014) Composite Slab Effects
on Beam-Column Subassemblies. Proceeding of the International Conference on
Structural and Earthquake Engineering. Chrischurch, 1-9.
Cifuentes, H. and Medina, F. (2013) Experimental Study on Shear Bond Behaviour of
Composite Slabs According to Eurocode 4. Journal of Construction Steel Research,
82(3):99-110.
Fahmy, G. M. and Sidky, A. N. M. (2012) An Experimental Investigation of Composite Floor
Vibration Due to Human Activities. Journal of Housing and Building National Research
Center, 8(3):228-238.
Feldmann, M., Heinemeyer, C. and Volling, B. (2013) Design Guide for Floor Vibrations.
Luxembourg: Arcelor Mittal.
Hao, H. A. and Cheng, S. J. (2001) Building Vibration to Traffic-Induced Ground Motion.
Building and Environment, 36(3):321-226.
He, J. and Fu, Z. (2001) Modal Analysis. Oxford: Butterworth-Heinemann, 304 pp.
Hilal, A. A., Thom, N. H. and Dawson, A. R. (2015) The Use of Additives to Enhance
Properties of Pre-Formed Foamed Concrete. IACSIT International Journal of
Engineering and Technology, 7(4):286-293.
Hunaidi, O. (2000) Traffic Vibrations in Building. Canadian Journal of Civil Engineering,
39(6):120-128.
Jaini, Z. M., Rum, R. H. M. and Boon, K. H. (2017) Strength and Fracture Energy of Foamed
Concrete Incorporating Rice Husk Ash and Polypropylene Mega-Mesh 55. Proceeding of
the International Conference on Structural, Mechanical and Materials Engineering.
Seoul, 1-5.

MCRJ Special Issue Vol. 4 | No. 2 | 2018 208
Jeong, Y. J., Kim, H. Y. and Koo, H. B. (2009) Longitudinal Shear Resistance of Steel-
Concrete Composite Slabs with Perfobond Shear Connectors. Journal of Constructional
Steel Research, 65(1):81-88.
Johnson, E. A. F. and Li, Q. M. (2012) Structural Behaviour of Composite Sandwich Panels
with Plain and Fibre-Reinforced Foamed Concrete Cores and Corrugates Steel Faces.
Composite Structures, 94(5):1555-1563.
Johnson, R. P. and Shepherd, A. J. (2013) Resistance to Longitudinal Shear of Composite
Slabs with Longitudinal Reinforcement. Journal of Construction Steel Research,
82(3):190-194.
Jones, M. R. and McCarthy, A. (2005) Preliminary Views on the Potential of Foamed
Concrete as A Structural Material. Magazine of Concrete Research, 57(1):21-31.
Kansinally, R. and Tsavdaridis, K. D. (2015) Vibration Response of USFB Composite Floors.
Proceeding of the Nordic Steel Construction Conference. Tampere, 1-10.
Khalaf, M., El-Shihy, A., Shehab, H. and Mustafa, S. (2013) Structural Behaviour Analysis
of Two-Ways Composite Slab. Journal of Engineering and Innovative Technology,
2(12):47-54.
Khan, M. R. I., Zafrul, H. K., Raiyan, M. F. and Amanat, K. M. (2013) Minimum Slab
Thickness of RC Slab to Prevent Undesirable Floor Vibration. Proceeding of The World
Congress on Advances in Structural Engineering and Mechanics. Jeju, 1886-1899.
Klein, G. and Rainer, J. H. (1995) Ground Transmitted Vibrations - Vibration Problems in
Structures, Practical Guidelines. Berlin: Birkhauser Science, 247 pp.
Lakshimikandhan, K. N., Sivakumar, P., Ravichandran, R. and Jayachandran, S. A. (2013)
Investigations on Efficiently Interfaced Steel Concrete Composite Deck Slabs. Journal of
Structures, 13(6):1-10.
Lam, D., Dai, X. and Sheehan, T. (2017) Recent Advances and Innovation in Steel-Concreet
Composite Structures. Proceeding of The World Congress on Advances in Structural
Engineering and Mechanics. Seoul, 1-17.
Murray, T., Allen, D. E. and Ungar, E. E. (2003) Steel Design Guide, Floor Vibrations Due
to Human Activities. Chicago: American Institute of Steel Construction, 69 pp.
Mydin, M. A. O. and Wang, Y. C. (2012) Thermal and Mechanical Properties of Lightweight
Foamed Concrete at Elevated Temperatures. Magazine of Concrete Research, 64(3):213-
224.
Narayanan, N. and Ramamurthy, K. (2000) Structure and Properties of Aerated Concrete: A
Review. Cement and Concrete Composites, 22(5): 321-329.
Pridham, B. (2009) Assessment of Ground-Borne Vibration Impacts on Sensitive Facilities.
Proceeding of the Conference on structural Dynamics. Florida, 1-11.
Rackham, J. W., Couchman, G. H. and Hicks, S. J. (2009) Composite Slabs and Beams Using
Steel Decking - Best Practice for Design and Construction. London: The Steel
Construction Institute, 118 pp.
Rum, R. H. M., Jaini, Z. M., Boon, K. H. and Khairuddin S. A. A. (2017) Foamed Concrete
Containing Rice Husk Ash as Sand Replacement: An Experimental Study on
Compressive Strength. Proceeding of Global Congress on Construction, Material and
Structural Engineering. Johor Bahru, 1-8.
Sanchez, T. A., Davis, B. and Murray, T. M. (2011) Floor Vibration Characteristics of Long
Span Composite Slab Systems. Proceeding of Structure Congress. Las Vegas, 360-370.
Silva, S. S. D. and David, P. T. (2009) Dynamic Characteristics of Steel-Deck Composite
Floors Under Human Induced Loads. Computer and Structures, 87(18):1067-1076.

MCRJ Special Issue Vol. 4 | No. 2 | 2018 209
Ta, M. N., Lardies, J. and Marc, B. (2006) Natural Frequencies and Modal Damping Ratios
Identification of Civil Structures from Ambient Vibration. Shock and Vibration,
13(4):429-444
Varela, W. D. and Battista, R. C. (2011) Control of Vibrations Induced by People Walking
on Large Span Composite Floor Decks. Engineering Structures, 33(9):2485-2494.
Yoshitake, I., Ogawa, A., Kim, Y. J. and Mimura, Y. (2012) Development of A New
Composite Slab System Using Carbon Fiber-Blended Cementitious Adhesive. Journal of
Structural Engineering, 138(11):1321-1330.
Zoltan, V. N. and Istvan, S. (1998) Composite Slab Design. Proceeding of the 2nd
International PhD Symposium in Civil Engineering. Budapest, 1-8.

MCRJ Special Issue Vol. 4 | No. 2 | 2018 210
STATE OF THE ART ON PRE-TENSIONING STEEL STRAPS CONFINEMENT: LITERATURE REVIEW Chau-Khun Ma1, Abdullah Zawawi Awang1, Wahid Omar1, Noor Nabilah Sarbini1 and Shahiron Shahidan2 1Department of Structure and Materials, Faculty of Civil Engineering, Universiti Teknologi Malaysia, 81310, Skudai, Johor 2Faculty of Civil and Environmental Engineering, Universiti Tun Hussein Onn Malaysia, 86400 Batu Pahat, Johor, Malaysia
Abstract This paper presents the state-of-the-art of the current research development on pre-tensioning steel straps confinement. Critical review was conducted based on careful selection of references to provide in-depth overview in the development of this confining technique. The paper was started with highlighting the features of such confining technique, then an extensive description of the connection clip systems was presented. The experimental and numerical investigations performed on steel-strapped concrete structures were discussed at length in the paper. The potential usage of pre-tensioning steel straps confinement in increasing the bond properties of confined concrete and as a repairing technique of damaged concrete were also covered in this paper. Keywords: Steel straps; Confinement; High-Strength Concrete; Fibre-reinforced polymer; pre-tensioned
INTRODUCTION
The steel-strapping tensioning technique (SSTT) is a method by using recycled steel
straps to confine concrete structures and secured the strap ends using end-clips (Ma et al.,
2014a, 2014b; Moghaddam et al., 2010). With such confining pressure, the strength and
ductility of concrete can be significantly enhanced (Ma et al., 2017a). High-strength concrete
(HSC) which is brittle in nature can be ductile as a result of restraining action of HSC’s lateral
dilation through this confining technique. The properties especially stress-strain behavior of
concrete can be essentially changed due to such restraining action (Awang, 2013).
The main aim of this review is to provide an up-to-date information of SSTT that covers
different aspects such as the confining technique, the influence of concrete properties, design
approaches and numerical modeling. This paper also provides general insight into the history
and recent development of SSTT. In this review, the literature review process is done
according to a systematic approach as illustrated in Figure 1.
For this confining technique to be efficient, three fundamental design criteria must be
satisfied: (i) the pre-tensioning force exerted by steel straps should be adequate to ensure the
concrete is efficiently confined without snapping of the steel straps during strapping process;
(ii) the connection clip/ end clip must be strong and stiff enough to transfer the pre-tensioned
force; and (iii) extra precaution must be taken to ensure no loss of pre-tensioning force during
the securing of strap ends. The awareness of the behavior and design approaches of SSTT-
confined concrete is also important for this type of construction to penetrate into the
construction and building industry.

MCRJ Special Issue Vol. 4 | No. 2 | 2018 211
Figure 1. Process implemented for literature review
Before the introduction of SSTT confinement, concrete confining technique mainly used
Fiber-reinforced polymer (FRP) as a confining material (Ma et al., 2015a; 2015b; 2015c).
This includes FRP-wrapping of existing columns and concrete encased in FRP tubes for new
column construction. However, as what has been demonstrated during the repair and
rehabilitation works of Kuala Lumpur Middle Ring Road 2 (MRR2) in Malaysia, the
construction cost involving FRP is extremely high. Subsequently, recycled steel straps, which
are commonly used in packaging industry were proposed to replace FRP. Its primary
application was in confining HSC. Its effectiveness, although is lower compared to the FRP
confinement, it provides a low-cost alternative for confining technique.
The steel strap used for the confinement is as shown in Figure 2. It is made of low-cost
recycled steel. Although various sizes of straps are available in the market, the most
commonly used type in confining concrete is the one with nominal thickness and width of 0.5
mm and 15 mm, respectively. Figure 3 shows the typical stress-strain curves of steel straps
and the associated mechanical properties are as listed in Table 1.
Figure 2. Low-cost recycled steel strap (Ma et al. 2017d)
Online Search Keywords
Steel straps
Confinement of high
strength concrete
Fiber-reinforced polymer
confinement
List of relevant references
Collection of information
Discussion on the collected
information
Existing research gap is
identified

MCRJ Special Issue Vol. 4 | No. 2 | 2018 212
CONNECTION CLIPS
In SSTT, clips are utilized to secure the ends of steel straps. Type of clips used will affect
efficiency of the confinement. Type and operational condition of the sealing machine used
also affect the clip efficiency. A manually operated sealing machine tool was used to secure
the straps by punching notches into the clip as shown in Figure 4(a). The lifting of the sealing
tool will result in the reduction of approximately 40 – 50 % of the initial pre-stressing force.
This reduction reduces the effectiveness of confinement. In addition, notches punched into
the clip reduced the effective dimension and ultimate strength of the strap (Garcia et al., 2014).
Table 1. Average mechanical properties of steel straps (Ma et al. 2014a)
Property Average value
Thickness 0.512 mm
Width 15.06 mm
Yield strength, fsy 1,003.3 MPa
Ultimate strength, fu 1,079.4 MPa
Elastic modulus, Es 202.7 GPa
Ultimate strain, 𝛆u 0.096 %
Figure 3. Measured stress-strain curves of steel straps (Ma et al., 2014a)
Recently, new clips and connection were introduced by Awang (2013), which were made
by cutting a steel strap into small piece and bent at both ends (Figure 4(b)). The clips allow
self-regulation between the strapping layers. Preliminary tests indicated that connections with
a single clip were not sufficient and hence double clips as shown in Figure 3(c) were
recommended. The clip made from thicker steel strap and placed in double was used to
provide more bearing and twisting bending resistance to the confining strap. The width of the
clip had a length equal to the width of the steel strap. The height of the clip was designed
based on the thickness of the steel strap and on the number of layers being used (Figure 3(d)).

MCRJ Special Issue Vol. 4 | No. 2 | 2018 213
Figure 4. Connection: (a) conventional clip for box packaging; (b) new clip; (c) elevated view of the connection; (d) schematic diagram of the clip connection
AXIAL COMPRESSIVE BEHAVIOR
Monotonic behavior
SSTT as a confining technique was first attempted on concrete cylinders to confirm its
effectiveness. Awang (2013) performed a series of experimental investigations of
effectiveness using SSTT in confining HSC. The experimental work was performed by testing
cylindrical specimens (100 mm × 200 mm). Concrete compressive strength were fixed at 50,
60 and 80 MPa. Parameters studied including different properties such as spacing of straps,
number of strapping layers and different levels of pre-tensioning stresses. The confined
specimens were tested in compression until failure under monotonic and cyclic loading
conditions. His work confirmed the ability of the technique to improve the ductility and
strength of the concrete, especially HSC, by effectively utilizing the confining material. It was
found that the pre-tensioned steel straps confinement delayed the onset of volumetric
expansion when the concrete is loaded and hence increase the ductility. Subsequently, a stress-
strain model was proposed as Equation 1, 2, and 3:
𝑓′𝑐𝑐 = 𝑓𝑐𝑜 ∙ 2.62(𝜌𝑣)0.4 (1)
𝜀′𝑐𝑐 = 𝜀𝑐𝑜 ∙ 11.60(𝜌𝑣) (2)
𝜀′𝑐𝑢 = 𝜀𝑐𝑜 ∙ (8.9𝜌𝑣 + 0.51) (3)
(a) (b)
(c) (d)
Clip

MCRJ Special Issue Vol. 4 | No. 2 | 2018 214
where f’cc is confined concrete strength; ε’cc is the strain at peak confined concrete strength;
ε’cc is the ultimate confined concrete strain; ρv is the volumetric confinement ratio of steel
straps (ρv=Vsfy/Vcfco, where Vs and Vc are the volumes of straps and confined concrete,
respectively, and fy is the yield strength of the straps); εco is the ultimate strain of unconfined
HSC (assumed equal to 0.004); and ε’cu is the ultimate strain of confined HSC. The
constitutive relationship defined by the above equations was calibrated using data from HSC
cylinders confined with SSTT confinement ratios ranging from 0.076 to 1.50. Note also that
the above equations assume that a minimum amount of straps (at least ρv=0.076) always exist
around the element. The stress-strain relationship was proposed to refer to Popovics (1973),
the concrete stress fci at a given strain εci is defined by Equation 4:
𝑓𝑐𝑖 =𝑓𝑐𝑐
′ 𝑥𝑟
𝑟−1+ 𝑥𝑟 (4)
where x=εcc/ε’cc; εcc is the axial compressive strain of concrete; ε’cc and f’cc are the strain and
concrete strength of confined concrete, respectively; whereas fco is the unconfined concrete
compressive strength. In the above equation, r=Ec/(Ec–E’sec), where Ec is the tangent modulus
of elasticity of concrete and E’sec is the secant modulus of elasticity of the confined concrete
at peak stress.
The effects of lateral confining stresses were investigated by Lee et al. (2014) on 12 HSC
cylinder specimens (100 mm × 200 mm) wrapped with two different confining materials of
different mechanical properties and lateral pre-tensioning stresses. The pre-tensioning stresses
ranging from 1.4 kN to 3.2 kN were applied on these specimens. Results showed that the
specimens with higher confining level performed better as it delayed the strength losses at
post-peak region, resulting in a slower but safer concrete failure. However, the optimum
confining level to the confined HSC was not suggested in this study. It was suggested that
when certain confining level has been exceeded, the performance of such confinement will
either halt or reduce.
The effects of various parameters on strength and ductility of confined concrete were
studied including compressive strength of concrete, mechanical volumetric ratio of confining
straps, post-tensioning force in the strap, number of strapping layers wrapped around the
specimens and details of strap joint were investigated by Moghaddam et al. (2010). Test
results showed significant increase in the strength and ductility of specimens due to active
confinement by steel straps. Ductility of confining material was reported to affect the confined
concrete ductility. This improvement is greatly dependent to the effective mechanical
volumetric ratio of confining straps. It was also observed that the SSTT results in stiffer
confined concrete than the conventional passive confinement, as opposed to Ma et al (2014a,
2015a). It was observed that the strength and ductility of concrete are also dependent on the
shape of specimen cross section. For a constant amount of confining straps, specimens with
circular sections gained more strength and ductility enhancement than those with square
sections due to stress concentration at the corners of square section. The radius of corners
strongly influences the effectiveness of confinement. The application of higher post-
tensioning force to the confining straps increases the concrete strength considerably and
provides stiffer pre-peak behavior, but speeds up the post-peak degradation of concrete
capacity. Applying more post-tensioning force to the confining straps will reduce the ductility
or ultimate strain. The main reason of higher capacity in SSTT-confined concrete is that whilst
the conventional confinement is initiated by the concrete dilation, the SSTT has perfectly

MCRJ Special Issue Vol. 4 | No. 2 | 2018 215
confine the concrete even prior to the load application. Higher the post-tensioning forces in
the straps will result in higher concrete strength. The poorer post-peak behavior of actively
confined specimens is because some portions of the constant toughness of straps have been
consumed in pre-stressing the straps, while the passively confined specimens use this capacity
after the peak point.
Cyclic Behavior
Most recently, Lee et al. (2014) tested 21 HSC specimens (150 mm × 300 mm), confined
with steel straps in different confining ratios, and tested to failure under uniaxial cyclic
loadings (Figure 5). Results indicated that the technique is beneficial in strengthening concrete
subjected to cyclic loading. Findings also shown that the stress deterioration ratio is
independent of confining ratio and loading patterns. The cumulative effects due to repeated
unloading/reloading cycles was observed can cause permanent strain and stress deterioration
of confined HSC.
Figure 5. SSTT-confined specimens tested under cyclic loading (Lee et al. 2014)
TESTS TO FAILURE OF SSTT-CONFINED STRUCTURE ELEMENTS
Reinforced Concrete Columns
Previous experimental tests showed that SSTT can double the ductility of HSC than
unconfined HSC. However, most of the tests performed on SSTT-confinement have focused
on concentrically loaded short specimens. To cover this gap, experiments were carried out to
investigate the slenderness effect of SSTT-confined HSC columns subjected to eccentric loads
(Ma et al. 2014a; 2014b). It was confirmed that SSTT increases both the strength and
deformability of slender HSC columns, although the confining effects are reduced
proportionally with an increase in slenderness ratio.
For slender NSC columns, they was observed to have failed in a more ductile manner
with an increase in slenderness ratio. However, HSC columns were observed to fail in a brittle
and sudden manner but with an increased slenderness ratio and with the use of SSTT, they
failed in a more ductile manner. The beneficial effects of SSTT confinement appear to be
greater for a higher confinement ratio but is less effective in increasing the ultimate load
capacity of slender HSC columns due to its ineffectiveness in improving flexural
rigidity/stiffness.

MCRJ Special Issue Vol. 4 | No. 2 | 2018 216
Later, the same researchers (Ma et al., 2016) extended the experimental tests to
rectangular shape rectangular columns. A total of nine square HSC specimens (six confined
and three unconfined columns) were investigated. It was observed that SSTT is also applicable
to rectangular shape column as significant increase in maximum load was obtained when the
columns were confined. However, the increment in maximum load of HSC columns was
found to decrease with the increase in confinement level, showing no proportional increment
in maximum load with confinement level. A similar observation has been reported by Jiang
and Teng (2012), Ma et al. (2014a) and Johansson (2002), indicating that there is a threshold
strength improvement due to external confinement. In columns with a large eccentricity,
which means a large bending moment, the presence of steel straps produced higher ductility
with the increase in confinement level.
From these, it can be concluded that higher confinement ratio of SSTT can increases both
the strength and ductility of reinforced concrete columns. Higher slenderness ratio of SSTT-
confined HSC columns will result in lower strength improvement by the confinement. The
strength improvement also decreases with the increase of confinement level.
Reinforced Concrete Beams
The applicability of SSTT confinement in strengthening flexural member such as beam
was further performed by Ma et al. (2016b). Twelve over-reinforced HSC beams (fco = 50 or
80 MPa) were designed to fail prematurely by concrete crushing at mid-span as shown in
Figure 6. The mid-span region of eight such beams was confined externally using the SSTT
with different steel strap confinement ratios, the aim of which was to delay concrete crushing.
Results showed that although the unconfined beams failed in a brittle manner with no post-
peak deflection, the steel straps were very effective at enhancing the post-peak deformation
of the SSTT-confined beams by up to 126 %. Moreover, for the beams tested in this study,
the use of the SSTT led to failures after the yielding of the tensile reinforcement.
Figure 6. Final view of a typical HSC beam after strapping using the SSTT (Ma et al. 2016a)
DESIGN APPROACHES
SSTT confinement was found resulted in ‘short’ member to behave like ‘slender’ member
and more susceptible to instability (Ma et al. 2014c; Jiang and Teng, 2012). This instability is
particularly significant in HSC member as it inherent the brittle nature of the material (Galano
and Vignoli, 2008). Hence, an analytical study was carried out by Ma et al. (2014d) in the
view of developing a simple equation in order to determine the slenderness limit for SSTT-
confined columns. Based on the analysis, slenderness limit for SSTT-confined HSC columns,
λlim were proposed as Equation 5:

MCRJ Special Issue Vol. 4 | No. 2 | 2018 217
𝜆𝑙𝑖𝑚 =50
𝑒𝑠𝐷
(1−𝑒𝑖𝑒𝑠
)+24(1.2−𝑒𝑠𝐷
)4
6𝜌𝑣−5.7𝜌𝑣2+0.6
(5)
where ei and es is the first and second eccentricity, respectively.
In designing the SSTT-confined columns, safe and economic are two important aspects.
The designed member should not be too expensive but guarantee minimum safety. Generally,
the effectiveness of confinement became less pronounced as the slenderness of column
increased. This is mainly due to the flexure-dominated behaviour of slender column and the
non-contribution of the confinement to the flexural stiffness of the concrete. Hence, a
numerical analysis was conducted by Ma et al. (2014d) to establish the upper-bound
slenderness limit of SSTT-confined HSC columns. The utilisation of SSTT beyond this limit
is not recommended. The slender SSTT-confined HSC column is considered to reach its
upper-bound slenderness limit when the ductility enhancement is less than 5%. Results from
the numerical modelling on SSTT-confined HSC columns with slenderness ratios ranging
from 10 to 50 showed that the slenderness ratio increased from 10 to 50, the ductility of HSC
columns dropped rapidly from about 380% of equivalent unconfined column to < 5%. When
the slenderness of column reached 48, even higher confinement ratio has insignificant effect.
Once the so-called lower-bound and upper-bound slenderness limits of SSTT-confined
columns were established, a systematic design procedure based on nominal curvature
approach was proposed by Ma et al. (2016c). The proposed design approach is based on
results from segmental analyses of slender SSTT-confined circular columns subjected to
eccentric loads. The results obtained from the analyses are used to determine the variables
governing the design of such columns. The use of the proposed design parameters predicts
conservatively the capacity of small-scale slender HSC circular columns confined using the
SSTT, and can be thus used in the practical design of reinforced concrete (RC) structures.
Existing design codes for RC members use an ‘equivalent stress block’ with uniform
compressive stresses to represent the compressive stress profile of concrete at ultimate
condition. Such equivalent stress block is usually defined by the magnitude of stresses and by
the depth of the stress block. To maintain force balance, the resulting equivalent stress block
and the original stress profile have to resist the same axial force and bending moment. Due to
the steel strap confinement, the equivalent stress block proposed by codes is inappropriate to
assess the ultimate capacity of SSTT-confined HSC columns. Therefore, a parametric study
is carried out to develop an equivalent stress block of SSTT-confined HSC sections. The
equivalent stress block is defined by: 1) A mean stress factor (α1), defined as the ratio of the
uniform stress over the stress block to the compressive strength of SSTT-confined HSC, and
2) A block depth factor, β1, defined as the ratio of the depth of the stress block to that of the
neutral axis. A constant value β1 = 0.90 was suggested for practical design whilst the mean
stress factor α1 (Equation 6) is proposed for design:
𝛼1 = 0.195𝜌𝑣 + 0.85 (6)
The ultimate flexural strength, Nu, and moment, Mu are proposed as Equation 7 and 8 :
𝑁𝑢 = 𝛼1𝛽1𝑓′𝑐𝑐
𝐴 + 𝜎𝑠𝑐𝐴𝑠𝑐 − 𝜎𝑠𝑡𝐴𝑠𝑡 (7)
𝑀𝑢 = 𝛼1𝛽1𝑓′𝑐𝑐
𝐴 (𝐷
2−
𝛽1𝑥𝑛
2) + (𝜎𝑠𝑐𝐴𝑠𝑐 − 𝜎𝑠𝑡𝐴𝑠𝑡) (
𝐷
2− 𝑑) (8)

MCRJ Special Issue Vol. 4 | No. 2 | 2018 218
NUMERICAL MODELING
Alongside with the experimental development in SSTT-confined structures, A theoretical
model was developed by Ma et al. (2014b) to analyse slender SSTT-confined HSC columns.
The developed model simulates the second-order distribution experienced by slender SSTT-
confined HSC column by axial load-moment-curvature path. Similar numerical procedures
were adopted previously by other researchers (Park and Paulay, 1975; Kong and Evan, 1987;
Jiang and Teng, 2012). Ma et al. (2014b) modified the method by incorporating the new stress-
strain model for SSTT-confined concrete. The proposed numerical procedure has reported to
yield close agreement with experimental results from Ma et al. (2014a) and Lei (2012).
OTHER POTENTIAL APPLICATIONS OF SSTT
Another potential application of SSTT confinement is to repair damaged concrete
columns. In a series of tests, Ma et al. (2017a; 2017b; 2017c) confirmed that the SSTT is a
reliable method in restoring the capacity loss in damaged concrete cylinders. The restorability
can be as high as twice the residual capacity of damaged concrete columns, provided the
confining volumetric ratio is high enough. However, the effectiveness is highly dependent on
the damage level of column. Besides, SSTT-confinement was attempted by Sulaiman et al.
(2017) in increasing the bond properties of confined concrete. A series of pull-out tests were
conducted and confirm that the confinement can increase at least 50% of bond strength
compared to unconfined counterparts.
CONCLUSION
In this paper, the state-of-the art on the research of SSTT confinement has been presented.
Several aspects, such as the features of the confining system, the types of end clips developed
the experimental and numerical investigation performed on SSTT-confined concrete
structures have been discussed. From the review, it can be concluded that SSTT has good
potential to be used to strengthen concrete structure, at the same time, increase the ductility
of HSC, which however is greatly hindered by the lack of awareness among potential
industrial users. Although SSTT has been investigated in-depth and adequate knowledge has
been acquired, several issues such as durability, long-term pre-stressing loss and capacity loss
due to exposure to the fire, are yet to be discovered. In addition, the behaviour of such
confined structures under cyclic loading is considered limited and the design procedure for
seismically loaded confined structures is not yet introduced. These research data will be
needed for the implementation of SSTT in practical.
ACKNOWLEDGMENT
This work was funded by Fundamental Research Grant Scheme (FRGS) from Ministry
of Higher Education, Malaysia [R.J130000.7822.4F826] as well as GUP grant
[Q.J130000.2522.15H33].
MCRJ Special Issue Vol. 4 | No. 2 | 2018 219
REFERENCES
Awang, A. Z (2013) Stress–strain Behavior of High-strength Concrete with Lateral Pre-
tensioning Confinement. PhD Thesis, Universiti Teknologi Malaysia.
Ma, C-K., Awang, A.Z., Omar, W. and Liang, M. (2014a) Experimental tests on SSTT-
confined HSC columns. Magazine of Concrete Research, 66(21):1084-1094.
Ma, C-K., Awang, A.Z. and Omar, W. (2014b) New Theoretical Model for SSTT-Confined
HSC Columns. Magazine of Concrete Research, 66(2):1-11.
Ma, C-K., Awang, A.Z. and Omar, W. (2014c) Slenderness Limit of SSTT-confined HSC
Columns. Structural Engineering & Mechanics, 50(2):201-214.
Ma, C-K., Awang, A.Z. and Omar, W. (2014d) Slenderness Effect and Upper-bound
Slenderness Limit of SSTT-confined HSC Column. International Journal of Structural
Engineering, 5(3):279-286.
Ma, C-K., Awang, A.Z., Omar, W., Tahir, M.M., Pilakoutas, K. and Garcia, R. (2015a) Elastic
Design of Slender High-Strength RC Circular Columns Confined with External
Tensioned Steel Straps. Advances in Structural Engineering, 18(9):1487-1499.
Ma, C-K., Awang, A.Z. and Omar, W. (2015b) Load-deformation Behaviour of Eccentrically
Loaded SSTT-confined High Strength Concrete Columns. Jurnal Teknologi, 74(4):45-
50.
Ma, C-K., Awang, A.Z. and Omar, W. (2015c) Flexural Ductility Design of Confined High-
Strength Concrete Columns: Theoretical Modelling. Measurement, 48:42-48.
Ma, C-K., Awang, A.Z., Omar, W., Garcia, R. and Pilakoutas, K. (2016a) Behaviour of Over-
reinforced High-Strength Concrete Beams Confined with Post-Tensioned Steel Straps:
An Experimental Investigation. Structural Concrete, 17(5):768-777.
Ma, C-K., Awang, A.Z., Omar, W., Liang, M., Jaw, S‐W. and Azimi, . (2016b) Flexural
Capacity Enhancement of Rectangular High-strength Concrete Columns Confined with
Post-tensioned Steel Straps: Experimental Investigation and Analytical Modeling.
Structural Concrete, 17(4):668-676.
Ma, C-K., Awang, A.Z., Garcia, R., Omar, W. and Pilakoutas, K. (2016c) Nominal Curvature
Design of Circular HSC Columns Confined with Post-tensioned Steel Straps. Structures,
7:25-32
Ma, C-K., Apandi, N. M., Yung, S. C. S., Hau, N. J., Haur, L. W., Awang, A. Z. and Omar,
W. (2017a) Repair and Rehabilitation of Concrete Structures using Confinement: A
Review. Construction and Building Materials, 133:502-515.
Ma, C-K., Yung, S. C. S., Apandi, N. M., Awang, A.Z. and Omar, W. (2017b) Effects of
Predamaged Level on Confined HSC Columns. MATEC Web of Conferences,
103(02007), 1- 7.
Ma, C-K., Yung, S. C. S., Apandi, N. M., Awang, A.Z. and Omar, W. (2017c) Innovative
Concrete Repairing Technique Using Post Tensioning Steel Straps. MATEC Web of
Conferences, 103(02011), 1 - 6.
Ma, C-K., Awang, A.Z., Sulaiman, M.F., Omar, W., Garcia, R., Pilakoutas, K., Huei, L.Y.
and Mohammad, S. (2017d) Design of Steel-strapped, High-strength Concrete Columns
Subject to Unequal End Moments. ICE Proceedings Structures and Buildings, ahead of
print (in press).
Galano, L. and Vignoli, A. (2008) Strength and Ductility of HSC and SCC Slender Columns
Subjected to Short-term Eccentric Load. ACI Structural Journal, 105(3), 259-69.
Garcia, R., Hajirasouliha, I., Guadagnini, M., Helal, Y., Jemaa, Y., Pilakoutas, K.,
Mongabure, P., Chrysostomou, C., Kyriakides, N., Ilki, A., Budescu, M., Taranu, N.,
MCRJ Special Issue Vol. 4 | No. 2 | 2018 220
Ciupala, M.A., Torres, L., Saiidi, M. (2014) Full-scale Shaking Table Tests on A
Substandard RC Building Repaired and Strengthened with Post-tensioned Metal Straps.
Journal of Earthquake Engineering, 18(2):187–213.
Jiang, T. and Teng, J.G. (2012) Slenderness Limit for Short FRP-confined Circular RC
Columns. Journal of Composite for Construction, 16(6):650 -660.
Johansson, M. (2002) The efficiency of passive confinement in CFT columns. Steel and
Composite Structures, 2(5):379-396.
Kong, F.K. and Evans, R.H. (1987) Reinforced and Prestressed Concrete. 3rd edn. Chapman
& Hall, London, UK.
Lee, H. P., Awang, A.Z. and Omar, W. (2014) Steel Strap Confined High Strength Concrete
under Uniaxial Cyclic Compression. Construction and Building Materials, 72:48-55.
Lei, X. (2012) Shape Modification of Square Reinforced Concrete Columns Confined with
Fibre-reinforced Polymer and Steel Straps. Master Thesis, University of Wollongong,
Australia.
Sulaiman, M.F., Ma, C-K., Apandi, N. M., Yung, S. C. S., Awang, A.Z., Mansur, S.A. and
Omar, W. (2017) A Review on Bond and Anchorage of Confined High-strength Concrete.
Structures, 17:91-109.
Moghaddam, H., Samadi, M., Pilakoutas, K. and Mohebbi, S. (2010) Axial Compressive
Behavior of Concrete Actively Confined by Metal Strips, Part A: Experimental Study.
Materials and Structures, 43(10):1369-1381.
Popovics, S. (1973) A Numerical Approach to The Complete Stress-Strain Curve of
Concrete. Cement and concrete research, 3(5):583-599.
Park, R. and Paulay, T. (1975) Reinforced Concrete Structures. Wiley, New York, NY, USA.

MCRJ Special Issue Vol. 4 | No. 2 | 2018 221
FINITE ELEMENT PROCEDURES DEVELOPMENT FOR NONLINEAR STEEL FRAME ANALYSIS WITH QUASI-STATIC SEMI-RIGID CONNECTION Shahrin Mohammad1, Ahmad Baharuddin Abd Rahman1, Cher Siang Tan2, Chau Khun Ma1, Yee Yong Lee3 and Yeong Huei Lee1 1 Faculty of Civil Engineering, Universiti Teknologi Malaysia, 81310 Johor Bahru, Malaysia. 2 Forensic Engineering Centre, Institute for Smart Infrastructure and Innovative Construction, Universiti Teknologi Malaysia, 81310 Johor Bahru, Malaysia. 3 School of Engineering, Faculty of Engineering, Computing and Science, Swinburne University of Technology Sarawak Campus, 93350, Kuching, Sarawak, Malaysia.
Abstract As the semi-rigid behaviour becomes essential in current design consideration, this paper presents a study on the development of a nonlinear numerical analysis that is capable of simulating the quasi-static semi-rigid behaviour of structural steel frames under variable loadings for reliable design. The beam element shape functions with semi-rigid connections are formulated and the overall stiffness matrix is derived. The theory to solve the nonlinear analysis is also presented. The developed procedures also revealed the complex finite element calculations in order to identify the structural performance of nonlinearity for steel structures. The major modifications that include the revised solution procedure, the variable load pattern capability, the quasi-static connection model, the modification of input data to cater for initial imperfections and the inelastic constitutive model for steel are presented. Validation process has been performed for the developed finite element procedures with loading and unloading behaviour for semi-rigid connections and full-scale frame behaviour. From the results, the modified procedures are capable to predict the behaviour of the structural steel frames under varying loading conditions with various connections configuration and material properties. Keywords: Nonlinear, Inelastic, Finite element analysis, Semi-rigid, Quasi-static, Steel frame
INTRODUCTION
Performance based design for steel frames has been studied for nonlinear plasticity
(Banihashemi et al., 2015). Stepping into a performance based design, consideration of the
nonlinearities and rigidity of connection became important to maintain reliable structural
behaviour. Finite element analysis is capable to solve the complex problems in masonry
structures (Lourenço et al., 2007), stainless steel (Ashraf et al., 2006), composite structures
(Spacone and El-Tawil, 2004), and connections (Díaz et al., 2011). The finite element
computer programs are based on a series of successively more complex enhancements of a
program originally developed by Jones (Jones, 1980). The original version could only
investigate the behaviour of an isolated 2-dimensional beam-column restrained by semi-rigid
connections, which were modelled using cubic B-Splines and attached to infinitely stiff
restraints.
The program was modified by Rifai (1987) to include the effect of beams framing into
the column. The beam-column connections were considered semi-rigid whilst on the other
end of the beams were taken as rigid in nature. SERIFA was then developed by Ahmed (1992)
modifying Rifai’s program to handle the elastic and inelastic analysis of planar steel frames
with semi-rigid connections. The full load-deflection response up to failure is traceable.

MCRJ Special Issue Vol. 4 | No. 2 | 2018 222
Traceably, there are well-developed commercialised computer aided engineering
packages like ABAQUS (Dassault Systèmes, 2014), ANSYS (ANSYS Inc., 2013), NATRAN
(MSC Nastran, 2014) and etc. which have their own benefits in application of structural
analysis. Research investigations with nonlinearities of geometry (Lee et al. 2015a; 2015b),
material and boundary condition, as well as connection flexibility behaviour (Lee et al. 2015c;
2017) have been actively conducted for steel structures, especially cold-formed structures.
With suggested solutions by these packages, engineers may not fully understand on the
methods used. The daily routine works for engineers to analyse structural performance that
may need the knowledge on finite element method in order to obtain reliable models in the
design stage.
As stepping into a new era of engineering design, performance-based design is a reliable
method to be applied in the structural design. Therefore, this paper present a study on the
development of finite element analysis for nonlinear steel frames with semi-rigid connections
which capable to be a reliable design procedures. The procedures of finite element method
have been revealed in order to gain better understanding on the structural analysis. The
nonlinearities (material, geometric and boundary) and inelasticity have been included in the
analysis for more accurate prediction on structural performance until failure loads. The other
features also include variable load pattern capability, the quasi-static connection model, semi-
rigid behaviour, the modification of input data to cater for initial imperfections and the
inelastic constitutive model for steel. Validation of the developed finite element code is
performed with loading and unloading behaviour for semi-rigid connections and full-scale
frame behaviour.
FINITE ELEMENT PROCEDURES DEVELOPMENT
A summary is presented which explains the physical mechanics of the model used in the
procedures. The beam-column elements are represented by two-noded one-dimensional line
elements with three degrees of freedom at each node. This physical beam length is separated
into finite elements connected at nodal points.
The displacements at the nodal points are the unknown parameters and are obtained using
the equation {}=[K]-1{F}, where [K] is the stiffness matrix as in Equation 1 and {F} is the
applied load. Cubic-polynomial interpolation functions are used to define the displacement
within the nodal points. As the displacement can be defined at any point on the cross-section
within the beam-column element, the state of strain can also be obtained by using the strain
equation as in Equation 2. Hence, by applying the constitutive properties of steel, the state of
stress along and across the sectional areas of the member can be calculated.
[K] = [KE] + [KL ] + [KG] (1)
( ) ( )''2''
2
22
2
1 =
2
1 ooo
ooo
N vyvuxd
vdy
xd
vd
dx
du−+
−
+= (2)
An approximate method to determine the sectional properties (flexural rigidities, EI and
axial rigidities, EA) and to monitor the spread of yield was suggested by Nethercot (1974).
These values are required in determining the stiffness matrix. The stresses at any point in the

MCRJ Special Issue Vol. 4 | No. 2 | 2018 223
section can be determined if the strain at that point is known. Therefore the internal force,
{Fi}, i.e. the axial load and moment, {M}, at each node about an axis passing through the mid-
point of the section may be found by integrating over the across the section.
However, due to non-linearity in the geometric, material and boundary conditions, the
equilibrium condition is not satisfied at the nodes. Hence, out-of-balance forces, Fi result
due to the differences between the external, {F} and the internal forces, {Fi}. Therefore,
{Fi} = {F} - {Fi} (3)
To overcome this problem, an approximate Newton-Raphson’s approach discussed later
is employed. The numerical solution is obtained if it converges, i.e. if the out-of-balance force,
Fi becomes very small. The criterion used to check this convergence is given by Equation 4,
limit Tolerance
1
2
1
2
n
n
i
F
F
(4)
The second criterion of the numerical solution consists of a check on displacement
convergence and is given by Equation 5,
( )limit Tolerance
1
22
1
1
2
+
−
n
ii
n
i
(5)
where is the norm vector of the incremental displacements, n is the number of elements
in the vector which corresponds to the number of degrees-of-freedom.
The process continues in load steps until the critical load level is reached; this is when the
structure becomes unstable and this condition is identified when the diagonal terms of the
global stiffness matrix are negative. To ensure that a ‘refined failure load’ is identified, an
automatic step-back procedure is implemented to refine the incremental increase of the
applied load.
Modification in Analysis Stage 1: Initial Stage of The Development and Modification of The Data Input To Cater For Initial Imperfections
In view of the above investigations, a series of procedure developments have been carried
out. The development can be categorised into several stages. Modifications of the input data
are made by adding text and comment statements. In addition to this, a standard routine to
cater for the uniformly distributed load applied along the member is included. This routine is

MCRJ Special Issue Vol. 4 | No. 2 | 2018 224
similar to the routine that has been incorporated earlier into the program to deal with point
loads along the member.
In order to obtain a satisfactory result at the inelastic region, the computer time increases
unnecessarily because a large number of elements are required. It has to be noted that, even
with element reduction modifications, a lot of effort is required to modify all the existing
routines. With these modifications, it is also capable to cater for the irregular steel-frames and
the initial out-of-straightness (geometry) by inputting the data manually. Thus, the problem
of initial geometric imperfections faced earlier is solved. The common value for the
maximum initial lateral deflection of columns is up to one thousandth of the column’s length.
A half sine wave is usually assumed for the initial deflections. By referring to Figure 1, the
initial deflection o at any point along the column is given by L
xao sino =
, where ao is the
initial central deflection and L is the length of the column.
Stage 2: Development of the Non-Linear Solution Procedure
Figure 2 illustrated schematically the non-linear solution procedure of load-displacement
relationships for an arbitrary structure subjected to an applied load {F}. The incremental
displacement vector {i} is calculated using the standard equation {i} = [Ki]-1 {Fi},
where [Ki] is the stiffness matrix of the structure and {Fi} is the out-of-balance force. The
numerical solution is obtained when it converges to point A, when the out-of-balance force,
Fi becomes acceptably small. The criterion used to check this convergence is given by
Equation 4 and Eq 5.
The presence of the out-of-balance force vector, {Fi}, it requires the internal forces,{Fi}
due to the corresponding displacement, id to be evaluated. A technique that taking the
algebraic sum of the shear forces just to the left and just to the right of the applied load is
adopted to find the out-of-balance forces due to a concentrated load.
Summing over all the Gauss points gives the internal force vector,{Fi} and hence the out-
of–balance force, {Fi}, can be calculated using Equatin 3. Once this is obtained, convergence
checks discussed above are carried out. The same procedure is adopted for the next load step
until structural failure occurs.

MCRJ Special Issue Vol. 4 | No. 2 | 2018 225
Figure 1. Modification of the input data to cater for the initial geometric imperfection
Figure 2. Newton-Raphson procedure of load-displacement relationships

MCRJ Special Issue Vol. 4 | No. 2 | 2018 226
Stage 3: Inclusion of the Variable Load Pattern
The inclusion of the variable loading pattern is of prime importance. Each of these
patterns defines the history of the corresponding load i.e whether the load is increasing,
decreasing or remains constant. The routine also defines the rate at which the load is increased
or decreased. A reference load value, Pn for each load is however required in the input data.
The loading process is divided into a number of load stages, (NSTAGE). For each load stage,
each load is divided into Nn load increments. At any load stage, any load may be increased
(+ve sign), decreased (-ve sign) or maintained as it is. At each load stage, the equilibrium
conditions of the non-linear behaviour must be satisfied.
Stage 4: Development of the Connection Model
Over recent years, numerous test data for connections between beams and columns due
to monotonic loading for different type of connections have been made available. At present
a commonly used approach to describe this connection behaviour is to curve-fit the
experimental data with a simple expression. Some of the commonly used models are
polynomials, B-Spline models, power models and exponential models. However, all these
were developed for monotonic conditions.
For the case of slow cyclic or quasi-static loading, only relatively few test data on the
connection behaviour are available. Connections generally exhibit a nonlinear loading and
unloading pattern. Full scale frame and assemblage experiments conducted using the semi-
rigid connections have shown that whilst connections tend to follow the idealised moment-
rotation curve with increasing axial load, the moment at the column head frequently reduces.
This phenomenon is known as moment shedding. Unloading of the connections can also occur
in the case of sway frames due to the application of lateral loads.
Modelling and incorporating these non-linear loading and unloading connections
behaviour into the frame analysis program is difficult. It is also difficult to use curve-fitting
techniques to present the constitutive relation. Unloading is assumed to take place elastically
with the initial stiffness k1. This simplification is shown schematically in Figure 3.
The characteristic starts from zero moment with the elastic stiffness k1 and continues to
load at that stiffness up to a moment of My. If it starts unloading at any point below My, it
would unload elastically. If the load is again reversed, the connection will move up the same
path with stiffness k1 until it reaches My. If the loading continues, a stiffness of k2 is assumed,
until the moment reaches a value of Mpl. If unloading takes place before this point, elastic
unloading with stiffness k1 is assumed until the moments drops by twice the value of My. If
it goes below this, a stiffness of k2 is assigned. A stiffness value of k3 is assumed if unloading
continues past the negative value of Mpl but if loading commences before this point, a stiffness
k1 is assigned.

MCRJ Special Issue Vol. 4 | No. 2 | 2018 227
Figure 3. Analytical connection model response to a general load history
Stage 5: Development of The Non-Linear Inelastic Material Properties of Steel
One of the crucial factors that need to be considered in non-linear inelastic analysis of
steel frames is the modelling of the material properties. Unlike the geometric non-linearity
where it has been incorporated through the formulation of the model described in (Mohammad
et al., 2017), material non-linearity enters this formulation via the constitutive model. These
properties are usually obtained from a tensile test, in which the steel sample is pulled in a
tensile testing machine until it fails. Even if the test procedure is simple, it reveals useful
information on the material strength, stiffness and ductility required for the present analysis.
BS EN ISO 6892-1 (BSI, 2009) provides the guidance on the tensile testing of structural steel
samples.
Analysis Flowchart
An analysis procedure is developed to study the behaviour of frames under variable
loading in ambient temperature using finite element method. The main steps of the procedure
followed in the analysis are shown in Figure 4.

MCRJ Special Issue Vol. 4 | No. 2 | 2018 228
Figure 4. Overall structure of the developed finite element procedures
VALIDATION OF PROPOSED PROCEDURES
It was necessary to verify the validity of the developed procedures with experimental or
other analytical results. This is a process to assess whether or not it adequately represents the
real behaviour of structures.
Loading and Unloading Behaviour for Semi-Rigid Connections
A two bay and a single storey frame with a slender column as shown in Figure 5, is chosen
as a validation example. The 203 × 203 × 86 UC steel columns with an initial geometric
imperfection of L/1000 at mid-height were subjected to two types of loading. During the
analysis, the beams are loaded up to the design load and kept constant, while the column axial
load increased up to failure. In the first analysis, the unloading and the loading connection
elastic behaviour is considered to follow the same path. Then a similar analysis is carried out
but incorporating the slow cyclic loading-unloading connection behaviour. A tri-linear
representation of the moment-rotation connection behaviour is adopted as is shown in Figure
6 so that the manual calculation could be done as a check. A Southwell plot is constructed to
estimate the elastic critical load.
is
|K|>0
?
is load
increment fine enough
?
Input data defining general information,
geometry, loading, boundary conditions,
material properties, etc
Assemble
Load Vectors
Calculate the element
stiffness matrices
Assemble overall
stiffness matrix, K
Step back and reduce
load step
New load step
Print messages
Update strains
Calculate sectional properties
Calculate internal forces, Fi
Calculate out-of-balance forces, Fi
Solve displacements
FK1−
=
has the
solution converged
?
number of
iteration exceeded
?
START
STOP
Print result
A
no
check stability
goto A
noyes
yes
yes
yes
no
next iteration
next load increment
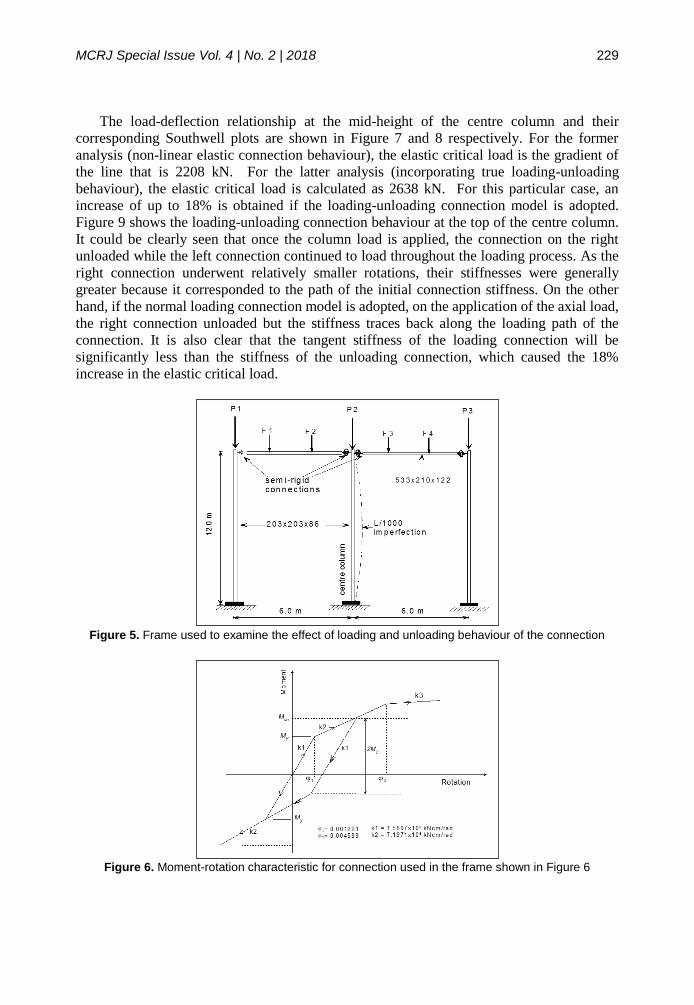
MCRJ Special Issue Vol. 4 | No. 2 | 2018 229
The load-deflection relationship at the mid-height of the centre column and their
corresponding Southwell plots are shown in Figure 7 and 8 respectively. For the former
analysis (non-linear elastic connection behaviour), the elastic critical load is the gradient of
the line that is 2208 kN. For the latter analysis (incorporating true loading-unloading
behaviour), the elastic critical load is calculated as 2638 kN. For this particular case, an
increase of up to 18% is obtained if the loading-unloading connection model is adopted.
Figure 9 shows the loading-unloading connection behaviour at the top of the centre column.
It could be clearly seen that once the column load is applied, the connection on the right
unloaded while the left connection continued to load throughout the loading process. As the
right connection underwent relatively smaller rotations, their stiffnesses were generally
greater because it corresponded to the path of the initial connection stiffness. On the other
hand, if the normal loading connection model is adopted, on the application of the axial load,
the right connection unloaded but the stiffness traces back along the loading path of the
connection. It is also clear that the tangent stiffness of the loading connection will be
significantly less than the stiffness of the unloading connection, which caused the 18%
increase in the elastic critical load.
Figure 5. Frame used to examine the effect of loading and unloading behaviour of the connection
Figure 6. Moment-rotation characteristic for connection used in the frame shown in Figure 6

MCRJ Special Issue Vol. 4 | No. 2 | 2018 230
Figure 7. Load-deflection relationship at mid-height of the centre column
Figure 8. Southwell plot to determine the elastic critical load from results on the frame shown in
Figure 6.
Figure 9. Loading-unloading connection behaviour at the top of the centre column of Figure 19 and 17
In order to validate the results, the same example is analysed using the standard formula
for the elastic critical load of a perfect column with one end pinned and the other end
restrained. The elastic critical load is given by Equation 8,

MCRJ Special Issue Vol. 4 | No. 2 | 2018 231
+=
KPL
K
EI
PL
EI
PLtan
(8)
where, P is the elastic critical load, E is the Young’s modulus, I is the second moment of
area, L is the column length, and K is the spring stiffness.
Similarly, by solving this equation, the elastic critical load for the latter type of connection
model is 2670 kN. The differences between the manual calculations and the Southwell plots
for using the cyclic loading-unloading model and the normal model is 2.4% and 1.1%
respectively. From these results, it can be seen that the manual calculation and the Sothwell
plots compare very well. Furthermore, the behaviour of the connection (as illustrated in Figure
9) is in agreement with the response reported by Gibbons (1990) in his study on the strength
of biaxially loaded columns in flexibly connected steel frames.
Comparison with Full-scale Sub-frame Tests – BRE TEST
The frame test was conducted by British Research Establishment (BRE) and used for
validation. The frame is represented as in Figure 10.
Figure 10. Modelling the BRE test frame for the analysis
Figures 11 and 12 show the load deflection relationships obtained from the test and the
analysis respectively. The curves plotted are with the third point load values against the central
deflection of the beam. The bending moment distributions on Beam 4 and Beam 6 obtained
from developed procedures are compared with the bending moments obtained from the test
results. These are shown in Figures 13 and 14. It can be seen that the predicted responses are

MCRJ Special Issue Vol. 4 | No. 2 | 2018 232
in good agreement with the experimental results. Thus, it can be seen that the developed
procedure is capable of predicting the beam behaviour up to collapse load.
Figure 11. Load-Deflection relationship at the mid-span beam obtained from test results
Figure 12. Load-Deflection relationship at the mid-span beam obtained from the developed analysis
procedures
Figure 13. Total Applied Load against Bending Moment on Beam 4

MCRJ Special Issue Vol. 4 | No. 2 | 2018 233
Figure 14. Total Applied Load against Bending Moment on Beam 6
Comparison with Full-Scale Frame Tests -SUF TEST
SUF1 and SUF2 are two-dimensional major and minor axes frames respectively, using
section 254 × 102 UB22 beams and columns with 152 × 152 UC3 in sizes. The objectives of
these tests were to investigate the overall frame behaviour and, specifically to concentrate on
the capacity of the columns under non-sway conditions and to compare the behaviour of
columns buckling about their major and minor axes. Figures 15 and 16 show the general
arrangement of the frames, SUF1 and SUF2 respectively.
Some of the responses of the beams under the beam loading for the SUF1 tests are given
in Figures 17 and 18. Figure 17 (a-c) shows the load-deflection relationships obtained from
the analysis and the test plotted with the quarter point load values against the central
deflections of beams 2, 3 and 4. Table 1 compares the column test load obtained from strain
gauges and the load obtained from the developed procedures. Similarly, the responses of the
beams under the beam loading for the SUF2 tests are given in Figures 18(a) to 19(f). Table 2
compares the column test loads with the results from the developed finite element procedures.

MCRJ Special Issue Vol. 4 | No. 2 | 2018 234
Figure 15. General arrangement of the frames SUF1
Figure 16. General arrangement of the frames SUF2

MCRJ Special Issue Vol. 4 | No. 2 | 2018 235
Figure 17. Comparison of the beam load-deflection response for SUF 1 at (a) Beam 2 (b) Beam 3 and
(c) Beam 4

MCRJ Special Issue Vol. 4 | No. 2 | 2018 236
Figure 18. Comparison of the beam load-deflection response for SUF 2 of (a) Beam 1 (b) Beam 2 (c)
Beam 3 (d) Beam 4 (e) Beam 5 (f) Beam 6

MCRJ Special Issue Vol. 4 | No. 2 | 2018 237
Table 1. Comparison of test and analysis loads for columns at failure in test SUF1 Column Column Axial Loads at failure (kN) % Difference
Test Results Analysis
4 535.2 539.8 0.8% 5 639.8 624.3 2.4% 6 783.8 741.6 5.3% 7 728.2 680.8 6.5% 8 764.8 707.7 7.5% 9 834.7 766.5 8.0%
Table 2. Comparison of test and analysis loads for columns at failure in test SUF2
Column Column Axial Loads at failure (kN) % Difference
Test Results Analysis
1 501.6 508.1 1.2% 2 546.1 566.8 3.6% 3 626.5 607.0 3.1% 4 521.1 533.7 2.4% 5 615.8 619.6 0.6% 6 813.4 738.8 9.2%
It can be seen that the predicted responses are in good agreement with the experimental
results. The results also show that the developed procedure is also capable of predicting the
frame behaviour under loading and unloading process. As shown in the figures, the
differences in the permanent deflections after being unloaded is marginally small, indicating
the capability of the developed procedures to simulate the inelastic behaviour of the frame.
Both tests also demonstrate the capability of the developed procedures of predicting the
column axial load behaviour especially up to 90% of the column failure load.
CONCLUSION
This paper presents an overall picture of the work carried out to develop the nonlinear
finite element analysis with quasi-static semi-rigid connection model. Moreover, it is also
have highlighted several experimental and analytical tests available as a mean to validate the
proposed finite element procedures.
The results of the comparisons have been examined and it can be concluded that the
present analysis procedures are able to predict the behaviour of the frames under varying
loading conditions, connections, materials properties and mode of buckling. Thus, it is
suitable for structural analysis for steel frames with semi-rigid connections.
ACKNOWLEDGEMENT
The authors would like to acknowledge the supports from Universiti Teknologi Malaysia
(UTM) and Ministry of Higher Education (MOHE). The supports from grants 17H53 and
4F763 are appreciated.
REFERENCES Ahmed, I. (1992) Semi-rigid action in steel frames. Ph.D. Thesis, University of Sheffield,
UK. 317 pp.
ANSYS Inc. (2013) ANSYS Mechanical User’s Guide version 15.0. United States of
America. ANSYS Inc.

MCRJ Special Issue Vol. 4 | No. 2 | 2018 238
Ashraf, M., Gardner L. and Nethercot D. A. (2006) Finite element modelling of structural
stainless steel cross-sections. Thin-Walled Structures, 44(10): 1048-1062.
Banihashemi, M. R., Mirzagoltabar, A. R. and Tavakoli, H. R. (2015) Development of the
performance based plastic design for steel moment resistant frame. International Journal
of Steel Structures, 15(1): 51-62.
BSI. BS EN ISO 6892-1 (2009) Metallic materials – Tensile testing - Part 1: Method of test
at room temperature, British Standards Institution.
Dassault Systèmes (2014) ABAQUS Analysis user's manual version 6.14, United States of
America. ABAQUS Inc.
Davison, J. B. (1987) Strength of beam-column in flexibly connected steel frame. Ph.D.
Thesis, University of Sheffield. 335 pp.
Díaz, C., Martí, P., Victoria M. and Querin O. M. (2011) Review on the modelling of joint
behaviour in steel frames. Journal of Constructional Steel Research, 67(5): 741-758.
Gibbons, C. (1990) The strength of biaxially loaded columns in flexible connected steel
frames, Ph.D Thesis, University of Sheffield, UK. 468 pp.
Jones, S. W. (1980) Semi-rigid connections and their influence on steel column behaviour,
Ph.D. Thesis, University of Sheffield, UK. 273 pp.
Lee, Y. H., Mohammad S. and Lee Y.L. (2015a) Numerical investigation on column flange
thickness for cold-formed steel top-seat flange cleat connection. Applied Mechanics and
Materials, 764-765:1104-1108.
Lee, Y. H., Tan, C. S., Mohammad, S. and Lee, Y. L. (2015) Mechanical properties prediction
for cold-formed steel angle connection with various flange cleat thickness. Jurnal
Teknologi 74(4):52-59.
Lee, Y. H., Tan, C. S., Mohammad, S., Lim, J. B. P. and Johnston, R. (2015c) Numerical
Study of Joint Behaviour for Top-seat Flange Cleat Connection in Cold-formed Steel
Structures. Scientia Iranica Transaction B: Mechanical Engineering, 22(4):1554-1566.
Lee, Y. H., Tan, C. S. and Mohammad, S. (2017) In-plane Sway Behaviour of Slender Cold-
formed Steel Bolted Frames. Thin-Walled Structures, 114:11-21.
Lourenço, P. B., Milani, G., Tralli, A. and Zucchini, A. (2007) Analysis of masonry structures:
review of and recent trends in homogenization techniques. Canadian Journal of Civil
Engineering, 34(11):1443-1457.
Mohammad, S., Rahman, A. B. A., Lee, Y. H., Ma, C. K., Rais, A. Z. and Saad, S. (2017)
Detail Finite Element Formulations for Nonlinear Semi-rigid Steel Frame. International
Conference on Construction and Building Engineering (ICONBUILD) 2017, Palembang,
Indonesia, 14-17 August 2017. Paper ID: SCE-019.
Moncarz, P. D. and Gerstle, K. H. (1981) Steel Frames with Nonlinear Connections. Journal
of the Structural Division, ASCE, 107(ST8):1427-1441.
MSC Nastran (2014) Linear Static Analysis User’s Guide. United States of America. MSC
Software Corporation.
Nethercot, D. A. (1974) Residual Stresses and their Influence upon the Lateral Buckling of
Rolled Steel Beams. The Structural Engineer, 52(3):89-96.
Rifai, A. M. (1987) Behaviour of column in sub-frames with semi-rigid joints. Ph.D. Thesis,
University of Sheffield, UK. 297 pp.
Spacone, E. and El-Tawil, S. (2004) Nonlinear analysis of steel-concrete composite
structures: State of the art. Journal of Structural Engineering, 130(2):159-168.

MCRJ Special Issue Vol. 4 | No. 2 | 2018 239
EFFECTIVENESS OF REPAIR METHOD USING HYBRID FIBER REINFORCED POLYMER FABRIC ON CONCRETE-FILLED DOUBLE SKIN STEEL TUBULAR COLUMNS EXPOSED TO FIRE Sharifah Salwa Mohd Zuki1, Shahiron Shahidan1, Choong Kok Keong2, J.Jayaprakash3 1Jamilus Research Centre, Faculty of Civil and Environmental Engineering, Universiti Tun Hussein Onn Malaysia, 86400 Parit Raja, Batu Pahat Johor, Malaysia. 2School of Civil Engineering, Universiti Sains Malaysia, 14300 Nibung Tebal, Pulau Pinang, Malaysia. 3Department of Civil Engineering, University of Notthingham Malaysia Campus, Jalan Broga 43500 Semenyih, Selangor, Malaysia.
Abstract Concrete-filled double skin steel tubular (CFDST) columns were often used in outdoor construction where fire is not a main concern. Therefore, this series of research deals with behaviour of CFDST columns after fire exposure, residual strength and method of repairing fire-damaged columns. This particular paper focused on the effectiveness of Hybrid Fiber Reinforced Polymer (FRP) repairing method. Total of 42 specimens were casted and 36 of the specimens were exposed to ASTM E-119 until the temperature of 600˚C. After that, the
temperature was kept constant for 60 and 90 minutes. Out of 36 specimens that were exposed to fire, 24 of the specimens were repaired with FRP using hand lay-up method. All of the specimens (control, heated unrepaired and heated repaired) were subjected to concentric axial loading. It was found that by using Hybrid FRP, the ultimate strength at failure of repaired specimens greatly increased when compared to fire-damaged specimens to the extent of exceeding the control specimens. In addition, FRP is also effectively confined thinner outer steel tube than thicker outer steel tube. However, the effectiveness of Hybrid FRP repair method depends on several factor such as thickness of outer steel tube and maximum exposure time. Keywords: Hybrid fiber reinforced polymer, Concrete-filled double skin steel tubular columns, Hybrid
repair, Carbon fiber reinforced polymer, ASTM E-119 time-temperature curve
INTRODUCTION
Concrete-filled double skin steel tubular (CFDST) columns were first introduced by
Shakir-Khalil (1991) in 1990’. After that, CFDST columns were widely used as described in
(Han et al., 2014). However, CFDST columns were mainly used in outdoor construction, such
as bridge pier (Zhao and Grzebieta, 2002) and an electrical pole in China (Han et al. 2014).
Engineers are reluctant to use CFDST columns in an indoor construction due to limited
research on performance of CFDST columns during fire. Unlike CFDST columns, the
performance of concrete-filled steel tubular (CFST) columns during fire were already
established and in depth review on performance of CFST columns during fire can be found in
(Jayaprakash et al. 2012).
Another main concern when dealing with fire is residual strength of CFDST columns.
Residual strength of damaged columns needs to be determined in order to predict the
approximate strength gained after retrofitting the damaged columns. For structural steel, the
main concerns were deformation and distortions of the steel structural member. As for
concrete, it’s mechanical properties depends on several factors such as maximum temperature
of the concrete during fire and fire exposure time (Han et al. 2005). Both steel and concrete

MCRJ Special Issue Vol. 4 | No. 2 | 2018 240
acted differently in CFDST columns after fire. Thus, these need to be studied first before fire-
damaged CFDST columns can be repaired effectively with Fiber Reinforced Polymer (FRP).
To author knowledge, limited research can be found on repairing of CFDST columns with
FRP. However, research on repairing CFST columns using Carbon FRP have been conducted
by Tao and Han (2007); Tao et al. (2007; 2008). All the aforementioned research used either
one layer or multiple layer of CFRP. According to Hu et al. (2011), the effect of galvanic
corrosion occurred when steel and carbon were in contact for a long period of time. Due to
this reason, Glass FRP (GFRP) was used as first layer in Hybrid FRP repairing scheme. In
addition, GFRP possess high ultimate tensile strain that proved to be beneficial during failure
as reported in Shahidan et al. (2016).
As a part of this research study, a total of 102 specimens were casted, heated and repaired
with single layer and Hybrid layer of FRP. Details of this research studies can be found in
Mohd Zuki et al. (2017); Shahidan et al. (2016); Zuki et al. (2015a; 2015b). This paper will
focused on the effectiveness of using Hybrid FRP as a repair method on fire-damaged CFDST
columns.
MATERIALS PREPARATION
Total of 42 specimens were casted in an upright position. Prior to filling in the concrete,
steel tubes were wire brushed and air blown in order to cleanse the tubes from dust and debris.
The concrete was filled in between two steel tube by layers and were vibrated using poker
vibrator. All the specimens were left to cure at Concrete Laboratory at room temperature until
the day of heating and testing. Six concrete cubes of 100 × 100 × 100 mm were casted and
cured in similar condition as CFDST specimens. The cubes were tested after 7 and 28 days.
The compressive strength of concrete after 7 and 28 days is shown in Table 4. The preparation
and testing of compressive strength of concrete cube is carried out in accordance with BS EN
12390 Part 1 (British Standards Institution BSI, 2012), BS EN 12390 Part 2 (British Standards
Institution BSI, 2009) and BS EN 12390 Part 3 (British Standard, 2009). Three steel coupons
were cut from steel tubes and tested for tensile strength and tensile strain at failure. The
test was conducted according to ASTM E8/E8M-11 (ASTM, 2011). The result is shown in
Table 5.
Table 4. Compressive strength of concrete
Batches 7 days 28 days
C1 38 41 C2 34 40 C3 34 41 C4 40 44 C5 41 43 C6 40 41 C7 29 35
Table 5. Parameter and material properties of steel
Diameter (mm) Thickness (mm) Ultimate Tensile Strength (N/mm2)
Tensile Strain (%)
101.6 2 566 16.1 152.4 3 409 14.8 152.4 4 430 14.8

MCRJ Special Issue Vol. 4 | No. 2 | 2018 241
The properties of FRP were obtained through series of tensile test on FRP coupons. The
nominal thickness of FRP is 0.17 mm. These coupons were cut out from the same FRP sheets
that were used to wrap the specimens. The coupons were cut into desired length, wetted with
epoxy and rolled to make sure there are no air bubbles in between layers, similar to the
condition when it was used to wrap specimens. These so called witness panels are practiced
in the field particularly during repair or rehabilitation program of structures using FRP.
Witness panels for Hybrid FRP, GFRP and CFRP is shown in Figure 8. Witness panels were
used as indicator of quality when hand lay-up method was used. The coupons were cured for
a minimum of seven days before testing. Balaguru et al. (2009) suggested that witness panel
or/and repaired structures needed to be cured for at least 3 days before it can be fully loaded.
The data obtained from these tests are average tensile strength and average tensile strain at
failure of six FRP coupons. The result of FRP tensile test is summarized in Table 6. The test
is carried out in accordance with ASTM D3039/D3039M – 08 (ASTM, 2014).
Figure 8. Witness panel for Hybrid FRP, GFRP and CFRP
Table 6. Result of tensile test for CFRP, GFRP and Hybrid FRP
Carbon Fiber Reinforced Polymer (CFRP)
Glass Fiber Reinforced Polymer (GFRP)
Hybrid Fiber Reinforced Polymer (Hybrid FRP)
Tensile Stress [MPa] 2924 2499 4269
Tensile Strain [%] 1.41 2.06 1.53
The specimens were divided into two categories based on the thickness of outer steel tube,
𝑡𝑜 as shown in Table 7. Apart from 𝑡𝑜, exposure time and condition of heated specimens were
varied. Exposure time were varied into 60 and 90 minutes based on previous research on
CFST columns where maximum exposure time were 180 minutes. Since CFDST columns
possess void in the middle of the columns, the maximum exposure time were reduced to 60
and 90 minutes. As for the repairing scheme, two repairing schemes were adopted which is
one layer of CFRP and Hybrid layer of FRP. Hybrid FRP is the combination of two FRP,
GFRP as the first layer and CFRP as second layer. Diameter of outer steel tube (152.4 mm),
diameter of inner steel tube (101.6 mm), thickness of inner steel tube (2 mm) and length (600
mm) of the specimens were kept constant.
Hybrid FRP GFRP CFRP

MCRJ Special Issue Vol. 4 | No. 2 | 2018 242
Table 7. Test specimens
FIRE TEST
All of the specimens, except six specimens that were labels control, were heated in
accordance with ASTM E119 – 11 (ASTM, 2010). The specimens were heated in fire furnace
available at Universiti Sains Malaysia (USM) Concrete Laboratory. The time-temperature
curve is shown in Figure 9. ASTM E-119 time-temperature curve was chosen over ISO-834
time-temperature curve due to ASTM-E119 curve gave more severe result to the exposed
specimens for the first 1.5 hours of exposure compared to ISO-834: Fire Resistance Test
Elements of Building Construction (Harmathy et al., 1987). After 1.5 hour, both curves gave
similar severity to each other thus, it can be neglected.
The specimens were heated following ASTM E-119 curve until the temperature reached
600˚C. Afterwards, the temperature was kept constant until the end of the test where the
furnace will automatically shut down when reaching pre-program exposure time i.e., 60
minutes and 90 minutes. According to ASTM E-119, the critical temperature for structural
steel is 538˚C. If the structural steel was exposed to this temperature for less than 20 minutes,
the strength of the structural steel is unaffected. Hence, 600˚C was chosen in this research
study. During casting process, thermocouple was inserted into the concrete up to 300 mm
from the top of the specimens. The thermocouple used was Type-K Thermocouple with 1000
mm length and 3 mm in diameter. At the end of thermocouple, there was a 1000 mm cable
which is attached to data logger for the temperature recording during the fire test.
Diameter of outer tube
[mm]
Thickness of outer tube
[mm]
Diameter of inner tube
[mm]
Thickness of inner tube
[mm]
Exposure time [min]
Condition No. of specimens
152.4
4
101.6
2
0 Control 3
60 Un-repair 3 Repair CFRP 3 Repair Hybrid 3
90
Un-Repair 3 Repair CFRP 3 Repair Hybrid 3
3
0 Control 3
60 Un-repair 3 Repair CFRP 3 Repair Hybrid 3
90
Un-Repair 3 Repair CFRP 3 Repair Hybrid 3
Total 42

MCRJ Special Issue Vol. 4 | No. 2 | 2018 243
Figure 9. ASTM E-119 time-temperature curve
The specimen was put upright during heating process as shown in Figure 10. In addition,
ceramic wool was stuffed inside the specimen void in order to minimize the heat transfer by
means of convection and radiation. This is also to portray the real situation where the CFDST
column was protected against heat transfer through connection to other structural members,
i.e., beams. Only one specimen was heated per session. Four ceramic thermocouples were
attached to the wall of the furnace to measure furnace temperature during heating process.
The furnace was connected to control panel where the data was recorded. Using
thermocouples type K, the temperatures of inner steel tubes as well as in the concrete core
was recorded for the entire fire exposure duration. After the targeted exposure time was
achieved, the furnace was shut down. Then the furnace lid was opened and the specimens
were left to cool down inside the furnace naturally.
Figure 10. Fire furnace and CFDST column inside fire furnace

MCRJ Special Issue Vol. 4 | No. 2 | 2018 244
REPAIR SCHEME
The specimens were left to cool down to ambient temperature before repairing process
started. There were two types of repairing scheme in this research study. The first one was by
using only one type of FRP which was CFRP. This type of repair was addressed as one layer
of CFRP repairing scheme. Second repairing scheme was called Hybrid FRP repairing
scheme. Hybrid FRP consisted of two layer of FRP and used of different type of FRP i.e.,
GFRP as the first layer and CFRP as a second layer. GFRP and CFRP was cut out to it desired
length with additional 100 mm. This extra length is to allow for the overlapping in the
wrapping process. The FRP were wrapped using hand lay-up method. For Hybrid FRP, the
second layers were done while the epoxy was still wet and the lapping between layers were
carefully chosen to make sure it was perpendicular to each other. This was done in order to
make sure the stress was evenly distributed throughout the column. Prior to the wrapping
process, the columns were wire brushed and air blown to make sure the contact surface is
clear from any dust and debris. The repaired columns are shown in Figure 11. The epoxy used
in this wrapping process is two part MBrace Saturant. Its materials properties as provided by
manufactures is shown in Table 8. The epoxy was hardened after 24 hour of curing. However,
as suggested by (Balaguru et al., 2009), the curing process is at least 72 hour before any
structures or members can be fully loaded. In this research study, the specimens were cured
for a minimum of 7 days before testing.
Figure 11. CFDST columns after repair
Table 8. Material properties of epoxy (as provided by manufacturer - MBrace)
MBrace Primer MBrace Saturant
Compressive strength [MPa] 73 50
Tensile strength [MPa] 35 39
Flexural strength [MPa] 55 62
Tensile modulus [MPa] 2097 2400
Compressive modulus [MPa] 2320 2006

MCRJ Special Issue Vol. 4 | No. 2 | 2018 245
RESULT AND DISCUSSION
All specimens, (control, heated unrepair and heated repair) were subjected to monotonic
axial compression test. The test was conducted at Construction Research Institute of Malaysia
(CREAM), Kuala Lumpur, Malaysia. The loading rate used was 1 mm/minute. The load was
applied until the load dropped to about 80 percent of maximum load. Four 10 mm electrical
strain gauges were used to measure longitudinal and lateral displacement of the specimens.
Two set of strain gauges were placed at mid-height of the specimen opposite of each other.
Vertical displacement of the specimens was recorded by Universal Testing Machine (UTM).
Table 6 shows the result of tested CFDST columns. The values in the table were the
average of three specimens. The notation S3-C4/C3 under specimens name indicate series that
the specimens belongs to and thickness of outer steel tube, 𝑡𝑜, respectively. The number 3
refers to 𝑡𝑜 = 3 𝑚𝑚 and number 4 refers to 𝑡𝑜 = 4 𝑚𝑚. Control, 60 and 90 indicates the
condition of the specimens, where control refers to unheated specimens. Control specimens
were tested as a reference specimens in order to compare the before and after fire exposure.
60 and 90 refers to maximum exposure time, 60 minutes and 90 minutes of fire exposure time,
respectively. Finally, R and RH refers to repair with one layer of FRP and repair with Hybrid
FRP, respectively.
Table 9. Result of tested concrete-filled double skin steel tubular columns
Diameter of Outer
Steel Tube [mm]
Specimens Ultimate Load [kN]
Displacement at Ultimate
Load [mm]
Residual Strength
Index [%]
Strength Enhancement
Index [%]
Secant Stiffness [kN/mm]
Ductility Index
152.4
S3-C3-Control
1125 4.48 0 -
251 1.40
S3-C3-60 951 7.29 15 - 131 1.31 S3-C3-60-R 1124 10.10 0 18 111 1.14 S3-C3-60-RH 1157 10.24 -3 22 113 1.13 S3-C3-90 881 8.64 22 - 102 1.26 S3-C3-90-R 996 10.28 11 13 97 1.13 S3-C3-90-RH 1098 10.48 2 25 105 1.20
152.4
S3-C4-Control
1402 6.98 0 -
201 1.49
S3-C4-60 1292 7.22 8 - 179 1.56 S3-C4-60-R 1428 11.69 -2 11 122 1.17 S3-C4-60-RH 1494 11.57 -7 16 129 1.18 S3-C4-90 1199 9.26 15 - 129 1.80 S3-C4-90-R 1401 12.39 0 17 113 1.27 S3-C4-90-RH 1386 10.90 1 16 127 1.18
Details discussion on maximum temperature of concrete and inner steel tube after fire as
well as discussion on failure pattern, ultimate load, Residual Strength Index (RSI), secant
stiffness and Ductility Index (DI) after fire can be found in Mohd Zuki et al. (2017), Shahidan
et al. (2016) and Zuki et al. (2015a; 2015b). This paper is only focusing on effectiveness of
single and Hybrid FRP repair method.
Figure 5 and Figure 6 shows the ultimate load at failure and Strength Enhancement Index
(RSI) of fire-damaged CFDST columns after being repaired with single and Hybrid FRP.
Ultimate load and SEI increased as layer of FRP increased from single to Hybrid FRP. The
SEI were as low as 11% and as high as 25% for S3-C4-60 and S3-C3-90, respectively.
Overall, wrapping fire damaged specimens with single and Hybrid FRP was proven to be able

MCRJ Special Issue Vol. 4 | No. 2 | 2018 246
to restore the ultimate load. The enhancement in both ultimate load and SEI is higher for
specimen repaired with Hybrid FRP than those repaired with single FRP due to double
confinement provided by Hybrid FRP.
From Figure 13, the highest SEI for specimen repair with Hybrid FRP was observed in
specimens with 𝑡𝑜 = 3 mm for both 60 and 90 minutes of fire exposure time. Therefore,
Hybrid FRP is also proven to be able to effectively confine thinner 𝑡0 than thicker 𝑡0. For
𝑡𝑜 = 3 mm, the increment of SEI for 60 minutes and 90 minutes of fire exposure time were
4% and 12%, respectively from single to Hybrid layer of FRP; whereas for 𝑡𝑜 = 4 mm, the
increment in SEI from single to Hybrid FRP for 60 minutes of fire exposure time was 5%.
However, for 90 minutes of fire exposure time, there is no significant difference when the
fire-damaged specimens are repaired with single and Hybrid FRP. This proves that the
effectiveness of repair using FRP is affected by the 𝑡0.
Figure 12. Effects of single and hybrid layer of FRP wrapped on ultimate load
Figure 13. Strength Enhancement Index of repaired fire-damaged CFDST columns
The secant stiffness of specimen repaired with FRP increased with increase in layer of
FRP as shown in Figure 14. The increment in secant stiffness was observed in both cases of
𝑡0 (𝑡0 = 3𝑚𝑚 and 𝑡0 = 4 𝑚𝑚) and fire exposure time (60 and 90 minutes). However, the
increment in secant stiffness is still not sufficient to fully restore the secant stiffness up to
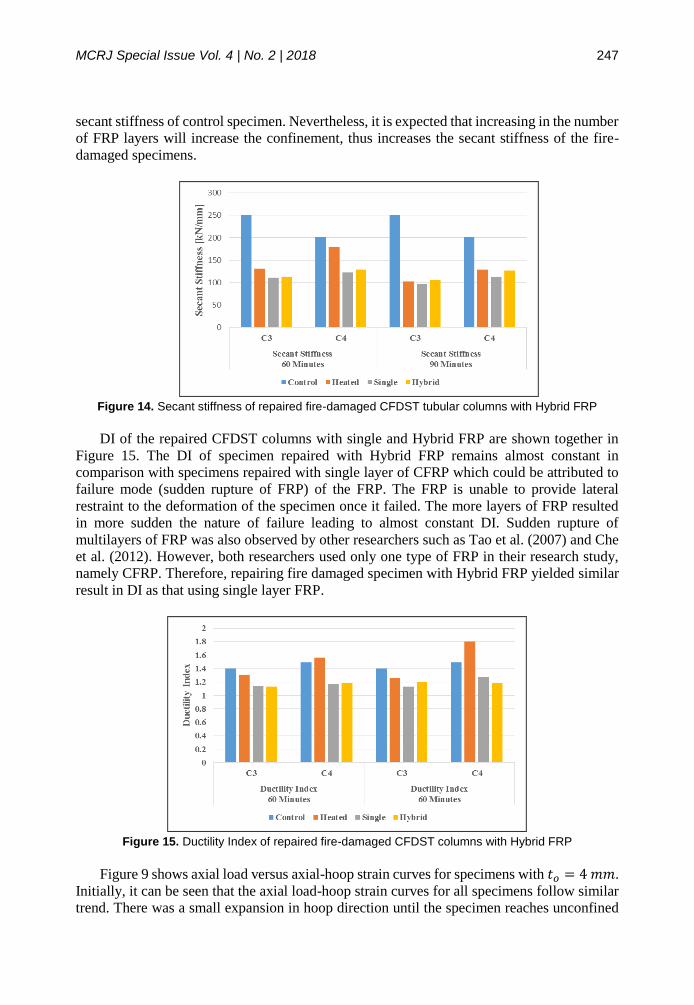
MCRJ Special Issue Vol. 4 | No. 2 | 2018 247
secant stiffness of control specimen. Nevertheless, it is expected that increasing in the number
of FRP layers will increase the confinement, thus increases the secant stiffness of the fire-
damaged specimens.
Figure 14. Secant stiffness of repaired fire-damaged CFDST tubular columns with Hybrid FRP
DI of the repaired CFDST columns with single and Hybrid FRP are shown together in
Figure 15. The DI of specimen repaired with Hybrid FRP remains almost constant in
comparison with specimens repaired with single layer of CFRP which could be attributed to
failure mode (sudden rupture of FRP) of the FRP. The FRP is unable to provide lateral
restraint to the deformation of the specimen once it failed. The more layers of FRP resulted
in more sudden the nature of failure leading to almost constant DI. Sudden rupture of
multilayers of FRP was also observed by other researchers such as Tao et al. (2007) and Che
et al. (2012). However, both researchers used only one type of FRP in their research study,
namely CFRP. Therefore, repairing fire damaged specimen with Hybrid FRP yielded similar
result in DI as that using single layer FRP.
Figure 15. Ductility Index of repaired fire-damaged CFDST columns with Hybrid FRP
Figure 9 shows axial load versus axial-hoop strain curves for specimens with 𝑡𝑜 = 4 𝑚𝑚.
Initially, it can be seen that the axial load-hoop strain curves for all specimens follow similar
trend. There was a small expansion in hoop direction until the specimen reaches unconfined

MCRJ Special Issue Vol. 4 | No. 2 | 2018 248
strength of the specimen. This expansion occurred in control and heated specimens. The
expansion is due to the expansion of steel and concrete under increased axial load. Soon after
this point, there is significant increase in hoop strain. With increased hoop strain, both control
and heated specimen experienced gradual decrement or in some cases constant axial load.
This can be attributed to the occurrence of local buckling of the specimens. This is also
associated with the steel tube losing its confinement ability due to expansion of concrete.
Axial load-hoop strain curves of repaired specimens have no expansion in hoop direction
as in control and heated specimens as illustrated in Figure 17. After the first portion of graph,
both axial load and hoop strain increased steadily. During this stage, the CFRP effectively
confined the steel tube. The presence of FRP delayed the occurrence of local buckling due to
the confinement provided by the FRP wrapped. In addition, the specimens are able to carry
more loads until failure of FRP. The failure of FRP is associated with sudden drop in axial
load. During this stage, the additional strength provided by FRP confinement is no longer
available thus resulting in sudden drop in load.
Based on the observation and from the axial load-hoop strain curves, wrapping with single
layer of FRP on fire-damaged specimen is proven to be able to delay the occurrence of local
buckling. Besides, the confinement provided by FRP further improved the load carrying
capacity of fire-damaged specimens.
Figure 16. Axial load versus axial-hoop strain curves of Series 3 with t0 = 4 mm
0
200
400
600
800
1000
1200
1400
1600
-15000 -10000 -5000 0 5000 10000 15000
Axi
al L
oad
[kN
]
Axial-Hoop Strain
S3-C4-Control 02 S3-C4-Control 02 S3-C4-60-03
S3-C4-60-03 S3-C4-90-02 S3-C4-90-02
small expansion in

MCRJ Special Issue Vol. 4 | No. 2 | 2018 249
Figure 17. Confinement effect of single layer CFRP for 60 and 90 minutes of fire exposure time
CONCLUSION
Repairing of fire-damaged specimens with Hybrid layer of FRP resulted in strength
enhancement exceeding the strength of control specimen. However, 𝑡0 as well as fire exposure
time of the specimens needs to be considered. If the specimens are exposed to fire for less
than 60 minutes and the 𝑡0 is thin, the use of single layer FRP is able to restore the strength
of the specimen up to the strength of control specimen. Nevertheless, if the specimens are
exposed to more than 60 minutes of fire, Hybrid FRP is the most suitable repairing scheme
that should be adopted.
In addition, wrapping CFDST columns with FRP can delayed the occurrence of local
buckling based on observation made during experimental test as well as result shown in Figure
9 and Figure 10.
ACKNOWLEDGEMENT
Authors would like to thanks Universiti Tun Hussein Onn Malaysia (UTHM) and
Universiti Sains Malaysia (USM) for both technical and financial support.
REFERENCES ASTM 2010. (2010) ASTM E119-11: Standard Test Methods for Fire Tests of Building
Construction and Materials.
ASTM 2011. (2011) ASTM E8/E8M-11: Standard Test Methods for Tension Testing of
Metallic Materials.
ASTM D3039/D3039M-14. (2014) ASTM D3039/D3039M. Annual Book of ASTM
Standards, 1–13.
Balaguru, P., Nanni, A., and Giancaspro, J. (2009) FRP Composites for Reinforced and
Prestressed Concrete Structures. New York: Taylor & Francis.
British Standards. (2009) BS EN 12390-3:2009-Testing Hardened Concrete-Part 3:
Compressive Strength of Test Specimens. European Committee For Standardization.

MCRJ Special Issue Vol. 4 | No. 2 | 2018 250
British Standards Institution BSI. (2009) Testing Hardened Concrete - Part 2: Making and
Curing Specimens for Strength Tests. BS En 12390-2:2009, 1–12.
British Standards Institution BSI. (2012) Testing Hardened Concrete - Part 1: Shape,
Dimensions and Other Requirements for Specimens and Moulds. BS En 12390-1:2012,
1–18.
Che, Y., Wang, Q. and Shao, Y. (2012) Compressive Peformance of the Concrete Filled
Circular CFRP-Steel Tube(C-CFRP-Steel). Advanced Steel Constrcution, 8(4):331-358.
Han, L. ., Huo, J. S. and Wang, Y. C. (2005) Compressive and Flexural Behaviour of Concrete
Filled Steel Tubes after Exposure to Standard Fire. Journal of Constructional Steel
Research, 61(7):882-901.
Han, L. H., Li, W. and Bjorhovde, R. (2014) Developments and Advanced Applications of
Concrete-filled Steel Tubular (CFST) Structures: Members. Journal of Constructional
Steel Research, 100:211-228.
Harmathy, T. Z., Sultan, M. A. and MacLaurin, J. (1987) Comparison of Severity of Exposure
in ASTM E 119 and ISO 834 Fire Resistance Tests. Journal of Testing and Evaluation,
15(6):371-375.
Hu, Y. M., Yu, T. and Teng, J. G. (2011) FRP-Confined Circular Concrete-Filled Thin Steel
Tubes under Axial Compression. Journal of Composites for Construction, 15:850-860.
Jayaprakash, J, Zuki, S. S. M. and Choong, K. K. (2012) Performance of Concrete-Filled Steel
Tubular ( CFST ) Columns under Fire – A Review Research Scholar , Universiti Sains
Malaysia , Penang , Malaysia. Awam International Conference on Civil Engineering
(AICCE 12) & Geohazard Information Zonation (GIZ 12), Malaysia, 1-8.
Mohd Zuki, S. S., Shahidan, S., Keong, C. K., Jayaprakash, J. and Ali, N. (2017) Concrete-
Filled Double Skin Steel Tubular Columns Exposed to ASTM E-119 Fire Curve for 60
and 90 Minutes of Fire. MATEC Web of Conferences, 103(02009),1 - 10.
Shahidan, S., Salwa, S., Zuki, M., Keong, C. K. and Jayaprakash, J. (2016) Repaired of Fire-
Damaged Concrete-Filled Double Skin Steel Tubular (CFDST) Columns With Fiber
Reinforced Polymer (FRP). ARPN Journal of Engineering and Applied Sciences,
11(6):3718-3725.
Shakir-Khalil, H. (1991). Composite Columns of Double-skinned Shells. Journal of
Constructional Steel Research, 19(2):133-152.
Tao, Z. and Han, L.-H. (2007) Behaviour of Fire-exposed Concrete-filled Steel Tubular Beam
Columns Repaired with CFRP Wraps. Thin-Walled Structures, 45(1):63-76.
Tao, Z., Han, L.-H. and Wang, L.-L. (2007) Compressive and Flexural Behaviour of CFRP-
repaired Concrete-filled Steel Tubes after Exposure to Fire. Journal of Constructional
Steel Research, 63(8):1116-1126.
Tao, Z., Han, L.-H. and Zhuang, J.-P. (2008) Cyclic Performance of Fire-Damaged Concrete-
Filled Steel Tubular Beam–Columns Repaired with CFRP Wraps. Journal of
Constructional Steel Research, 64(1):37-50.
Zhao, X.-L. and Grzebieta, R. (2002) Strength and Ductility of Concrete Filled Double Skin
(SHS Inner and SHS Outer) Tubes. Thin-Walled Structures, 40(2):199-213.
Zuki, S. S. M., Choong, K. K., Jayaprakash, J. and Shahidan, S. (2015a) Behavior of Fire
Exposed Concrete-Filled Double Skin Steel Tubular ( CFDST ) Columns under
Concentric Axial Loads. Applied Mechanics and Materials, 773–774:938-942.
Zuki, S. S. M., Choong, K. K., Jayaprakash, J. and Shahidan, S. (2015b) Effect of Diameter
on Fire Exposed Concrete-Filled Double Skin Steel Tubular (CFDST) Columns under
Concentric Axial Loads. Applied Mechanics and Materials, 802:130-135.

MCRJ Special Issue Vol. 4 | No. 2 | 2018