malaria parasite detection in thick blood smear
TRANSCRIPT
Malaria parasite detection in thick blood smear microscopic images using modified YOLOV3 and YOLOV4 modelsFetulhak Abdurahman1* , Kinde Anlay Fante1 and Mohammed Aliy2
Abstract
Background: Manual microscopic examination of Leishman/Giemsa stained thin and thick blood smear is still the “gold standard” for malaria diagnosis. One of the draw-backs of this method is that its accuracy, consistency, and diagnosis speed depend on microscopists’ diagnostic and technical skills. It is difficult to get highly skilled micros-copists in remote areas of developing countries. To alleviate this problem, in this paper, we propose to investigate state-of-the-art one-stage and two-stage object detection algorithms for automated malaria parasite screening from microscopic image of thick blood slides.
Results: YOLOV3 and YOLOV4 models, which are state-of-the-art object detectors in accuracy and speed, are not optimized for detecting small objects such as malaria par-asites in microscopic images. We modify these models by increasing feature scale and adding more detection layers to enhance their capability of detecting small objects without notably decreasing detection speed. We propose one modified YOLOV4 model, called YOLOV4-MOD and two modified models of YOLOV3, which are called YOLOV3-MOD1 and YOLOV3-MOD2. Besides, new anchor box sizes are generated using K-means clustering algorithm to exploit the potential of these models in small object detection. The performance of the modified YOLOV3 and YOLOV4 models were evalu-ated on a publicly available malaria dataset. These models have achieved state-of-the-art accuracy by exceeding performance of their original versions, Faster R-CNN, and SSD in terms of mean average precision (mAP), recall, precision, F1 score, and average IOU. YOLOV4-MOD has achieved the best detection accuracy among all the other mod-els with a mAP of 96.32%. YOLOV3-MOD2 and YOLOV3-MOD1 have achieved mAP of 96.14% and 95.46%, respectively.
Conclusions: The experimental results of this study demonstrate that performance of modified YOLOV3 and YOLOV4 models are highly promising for detecting malaria para-sites from images captured by a smartphone camera over the microscope eyepiece. The proposed system is suitable for deployment in low-resource setting areas.
Keywords: Malaria, Plasmodium falciparum, Thick blood smear, Deep learning, Object detection, YOLOV3, YOLOV4, Feature map
Open Access
© The Author(s) 2021. Open Access This article is licensed under a Creative Commons Attribution 4.0 International License, which permits use, sharing, adaptation, distribution and reproduction in any medium or format, as long as you give appropriate credit to the original author(s) and the source, provide a link to the Creative Commons licence, and indicate if changes were made. The images or other third party material in this article are included in the article’s Creative Commons licence, unless indicated otherwise in a credit line to the mate-rial. If material is not included in the article’s Creative Commons licence and your intended use is not permitted by statutory regulation or exceeds the permitted use, you will need to obtain permission directly from the copyright holder. To view a copy of this licence, visit http://creat iveco mmons .org/licen ses/by/4.0/. The Creative Commons Public Domain Dedication waiver (http://creat iveco mmons .org/publi cdoma in/zero/1.0/) applies to the data made available in this article, unless otherwise stated in a credit line to the data.
RESEARCH ARTICLE
Abdurahman et al. BMC Bioinformatics (2021) 22:112 https://doi.org/10.1186/s12859-021-04036-4
*Correspondence: [email protected] 1 Faculty of Electrical and Computer Engineering, Jimma Institute of Technology, Jimma University, 378, Jimma, EthiopiaFull list of author information is available at the end of the article
Page 2 of 17Abdurahman et al. BMC Bioinformatics (2021) 22:112
BackgroundMalaria is one of the leading public health burdens. Its prevalence is too high in low-income countries. In 2018 only, an estimated 228 million cases were recorded world-wide, and most of the cases were in Africa (comprising 93%), followed by South-East Asia region (3.4%). Malaria is caused by a unicellular parasite called plasmodium. It is transmitted from infected person to healthy through bites of female anopheles mos-quito. Generally, there are five different species of plasmodium (P. falciparum, P. vivax, P. ovale, P. malariae, and P. knowlesi), of which P. falciparum is the most common, fol-lowed by P. vivax. Depending on the severity of infection, all the species pass through four life stages: ring, trophozoite, schizont, and gametocyte [1].
Malaria is a curable disease, but a lack of prompt and correct diagnosis and treatment can cause serious health complications, which can even lead to death. Microscopy-based visual examination of stained thick and thin blood slides is the golden standard for malaria diagnosis [2]. However, the accuracy of microscopy-based diagnosis heav-ily depends on individual’s slide reading experience and attentiveness during diagnosis procedure. Besides, shortage of well-trained personnel imposes discrepancies on the effectiveness of microscopy-based diagnosis results in malaria-endemic and resource-constrained areas, especially in rural parts of Africa. Inaccurate diagnosis result leads to morbidity, socio-economic problems within society and poor decision making and plan-ning in malaria prevention programs.
An alternative low cost, fast and accurate computer-aided diagnosis system is required to overcome the drawbacks of manual microscopy-based diagnosis. Recent advance-ments in computer vision, especially in deep learning algorithms, have shown promis-ing results for detecting malaria parasites and, in general, for detecting abnormalities in medical images.
For the past 2 decades, a substantial number of studies have been conducted to detect pathogens, including malaria parasites from microscopic images. The three most com-monly used methods to detect or classify malaria parasites in microscopic images of thick and thin blood film are traditional image processing algorithms, classical machine learning, and deep learning method. The traditional image processing techniques mainly use rule-based classifiers and manually designed low-level features such as texture, color and shape using computationally complex image processing methods. The performance of these methods is low since manual design of optimal feature extractor and classifier is difficult [3–7].
Classical machine learning approaches, which use manually extracted features as inputs, were proposed for malaria parasite classification and detection in [8–12]. The proposed classifiers include support vector machine (SVM) [8], linear discriminant clas-sification (LDC), k-nearest neighbor (KNN) and linear regression (LR) [5], Bayesian learning and support vector machine (SVM) [13], KNN classifier [9], hybrid machine learning classifier [10], modified K-means clustering algorithm [14, 15], feed-forward neural networks [6], deep belief network (DBN) [16]. The limitation of classical machine learning-based techniques is their inability to cope-up with inherent variability of images from different domains since manually designed feature extractor is sub-optimal. Machine learning models based on hand-crafted features achieve poor generalization capability in classification tasks.
Page 3 of 17Abdurahman et al. BMC Bioinformatics (2021) 22:112
In recent years, deep learning based object detection and classification techniques have gained popularity because of their ability to overcome the limitations of tra-ditional image processing techniques, including classical machine learning algo-rithms. Deep learning algorithms can be applied to classify objects by taking image patches cropped from an input image using different prepossessing techniques such as segmentation or sliding window technique. These techniques are computationally expensive due to massive numbers of patches generated and the application of con-volution operation for all patches to detect or classify malaria-infected cells [17, 18]. The methods in [19, 20] used features extracted from patch-based CNN and classi-fies them using classical machine learning models, such as SVM, for malaria para-site identification. Patch-based CNN models for the identification of malaria parasites from thick blood smear microscopic images were proposed by [21–24]. The studies by [25–27] demonstrated the applicability of patch based CNN models to classify malaria parasites from segmented thin blood smear images. Sivaramakrishnan et al. [28] discussed advantage of visualizing extracted features using deep learning mod-els to better understand their learning strategy for classification of malaria parasites. Delahunt et al. [29] proposed a patient-level evaluation results using two different CNN architectures to detect ring and late-stage malaria parasites.
Lately, state of the art one-stage and two-stage object detection algorithms are widely used in diverse applications of medical image analysis including detection of cancer [30–33], detection of organs and their abnormalities [34–37], detection of pul-monary diseases [38–40], detection and segmentation of intracranial hemorrhages [41], classification and segmentation of microscopy images [35, 42, 43].
Despite their success in several applications, state-of-the-art deep learning-based one-stage and two-stage object detection algorithms have not been extensively stud-ied to detect malaria parasites in microscopic images. The work reported in [44] uses a modified YOLOv3 architecture to detect P. falciparum parasites in thick blood smear microscopic images taken with a digital microscope and smartphone camera. An automated P.vivax detection system in microscopic images of thin blood smear was reported in [45]. A pre-trained Faster RCNN model was applied to classify red blood cells (RBCs) and other non-RBC objects [46].
This study aims to investigate the applicability of state-of-the-art one-stage and two-stage object detection algorithms for detecting malaria parasites in microscopic images captured using a smartphone camera. We propose malaria parasite detec-tion in thick blood smear microscopic images using modified YOLOV3 and YOLOV4 models in this work. The contributions of this study are as follows:
1. We have modified YOLOV3 and YOLOV4 models to improve their capability to detect small objects by extending feature scales and adding more detection layers. The modified models have higher small object detection capabilities than the original models.
2. We have conducted comprehensive experiments to evaluate performance of the orig-inal and modified models of YOLOV3 and YOLOV4 using publicly available malaria dataset.
Page 4 of 17Abdurahman et al. BMC Bioinformatics (2021) 22:112
3. We have also carried out a comprehensive comparative study to evaluate the perfor-mance of state of the art two-stage and one-stage object detection algorithms such as Faster RCNN [47], SSD [48], YOLOV3 [49], and YOLOV4 [50] to detect malaria parasites.
ResultsIn this study, we have conducted experiments to evaluate the performance of state-of-the-art one-stage and two-stage deep learning-based object detectors for detecting P. falciparum in thick blood smear microscopic images captured using a smartphone cam-era. Performance evaluations of the proposed models, using mean average precision (mAP), precision, recall, F1 score, average IOU and inference time in frames per second (FPS), are done at object-level.
Performance analysis of modified YOLOV3 and YOLOV4 models
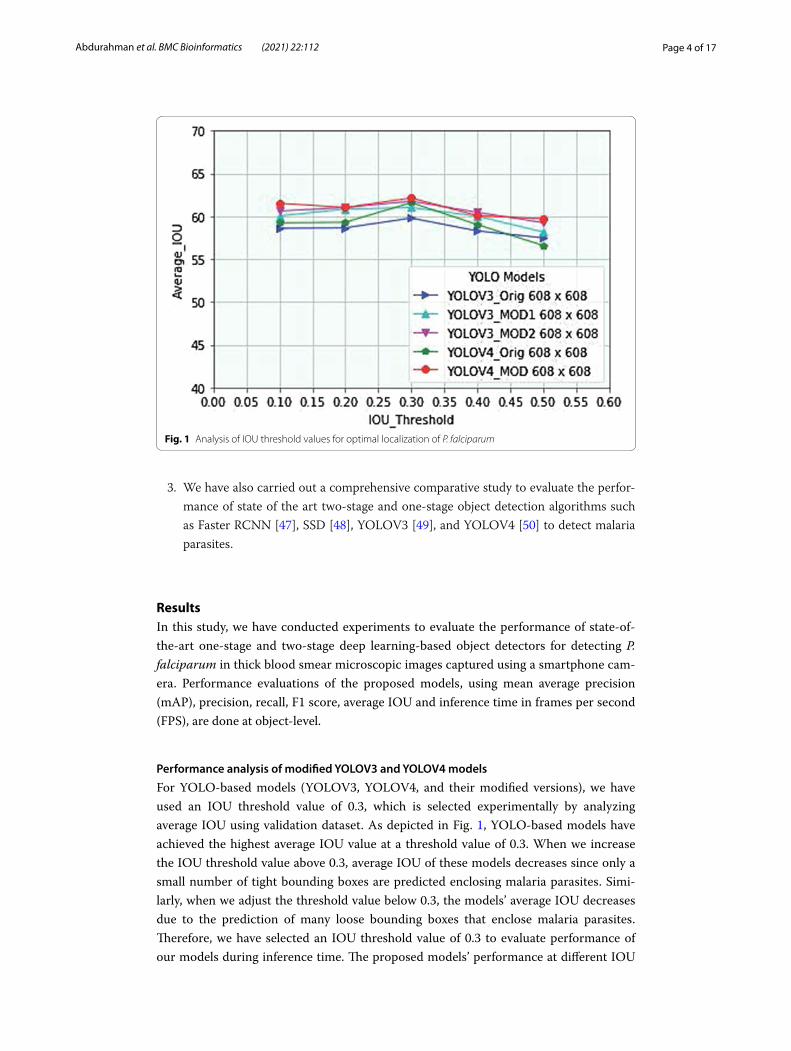
For YOLO-based models (YOLOV3, YOLOV4, and their modified versions), we have used an IOU threshold value of 0.3, which is selected experimentally by analyzing average IOU using validation dataset. As depicted in Fig. 1, YOLO-based models have achieved the highest average IOU value at a threshold value of 0.3. When we increase the IOU threshold value above 0.3, average IOU of these models decreases since only a small number of tight bounding boxes are predicted enclosing malaria parasites. Simi-larly, when we adjust the threshold value below 0.3, the models’ average IOU decreases due to the prediction of many loose bounding boxes that enclose malaria parasites. Therefore, we have selected an IOU threshold value of 0.3 to evaluate performance of our models during inference time. The proposed models’ performance at different IOU
Fig. 1 Analysis of IOU threshold values for optimal localization of P. falciparum
Page 5 of 17Abdurahman et al. BMC Bioinformatics (2021) 22:112
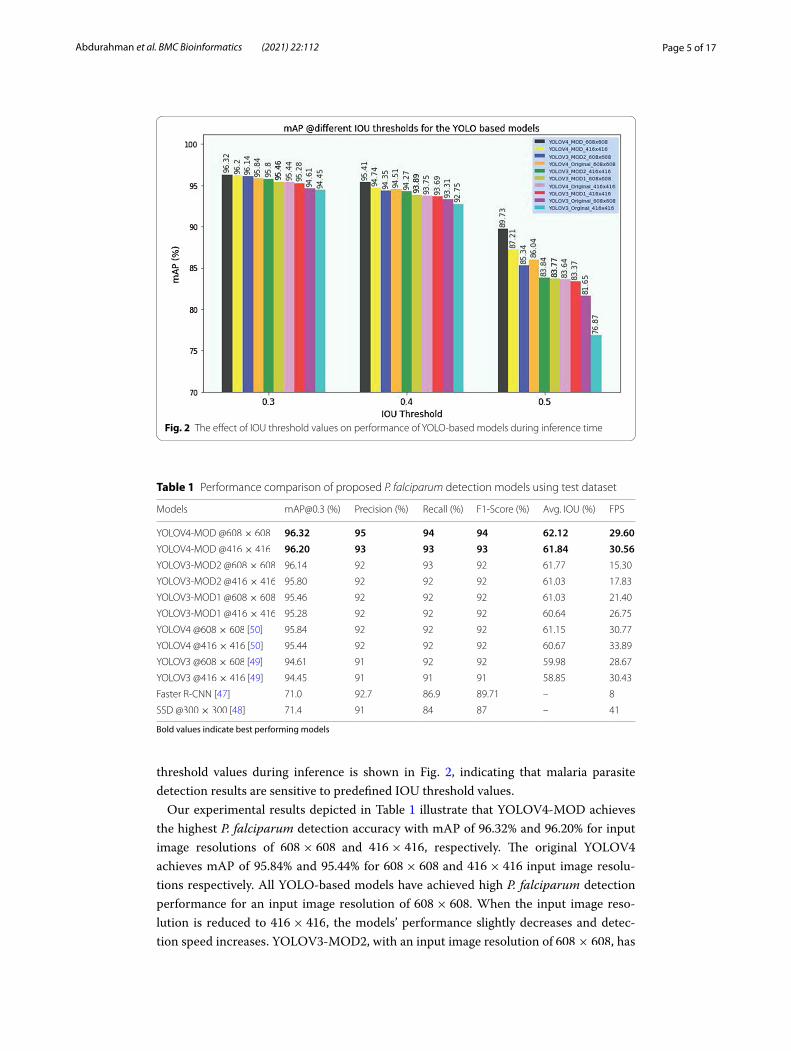
threshold values during inference is shown in Fig. 2, indicating that malaria parasite detection results are sensitive to predefined IOU threshold values.
Our experimental results depicted in Table 1 illustrate that YOLOV4-MOD achieves the highest P. falciparum detection accuracy with mAP of 96.32% and 96.20% for input image resolutions of 608× 608 and 416× 416 , respectively. The original YOLOV4 achieves mAP of 95.84% and 95.44% for 608× 608 and 416× 416 input image resolu-tions respectively. All YOLO-based models have achieved high P. falciparum detection performance for an input image resolution of 608× 608 . When the input image reso-lution is reduced to 416× 416 , the models’ performance slightly decreases and detec-tion speed increases. YOLOV3-MOD2, with an input image resolution of 608× 608 , has
Fig. 2 The effect of IOU threshold values on performance of YOLO-based models during inference time
Table 1 Performance comparison of proposed P. falciparum detection models using test dataset
Bold values indicate best performing models
Models [email protected] (%) Precision (%) Recall (%) F1-Score (%) Avg. IOU (%) FPS
YOLOV4-MOD @ 608× 608 96.32 95 94 94 62.12 29.60YOLOV4-MOD @ 416× 416 96.20 93 93 93 61.84 30.56YOLOV3-MOD2 @ 608× 608 96.14 92 93 92 61.77 15.30
YOLOV3-MOD2 @ 416× 416 95.80 92 92 92 61.03 17.83
YOLOV3-MOD1 @ 608× 608 95.46 92 92 92 61.03 21.40
YOLOV3-MOD1 @ 416× 416 95.28 92 92 92 60.64 26.75
YOLOV4 @ 608× 608 [50] 95.84 92 92 92 61.15 30.77
YOLOV4 @ 416× 416 [50] 95.44 92 92 92 60.67 33.89
YOLOV3 @ 608× 608 [49] 94.61 91 92 92 59.98 28.67
YOLOV3 @ 416× 416 [49] 94.45 91 91 91 58.85 30.43
Faster R-CNN [47] 71.0 92.7 86.9 89.71 – 8
SSD @ 300× 300 [48] 71.4 91 84 87 – 41

Page 6 of 17Abdurahman et al. BMC Bioinformatics (2021) 22:112
achieved the third rank, with a mAP of 96.14%, compared to other YOLO-based models, and it is best performing model among YOLOV3-based models. It also has a balanced precision (92%) and recall (93%) rate indicating that it can discriminate well artifacts from malaria parasites. YOLOV3-MOD1 has achieved mAP of 95.46% and 95.28% for input image resolution of 608× 608 and 416× 416 , respectively. YOLOV3- MOD1 has achieved lower detection performance than YOLOV3-MOD2, but it still has a higher performance compared to the original YOLOV3 model to detect malaria parasites. Overall, YOLOV4-MOD is the best performing model in terms of mAP, precision (95%), recall (94%) and F1-score (94%) on our test dataset.
Besides, average IOU values of different models indicate their ability for precise localization of malaria parasites during inference time. Table 1 shows that the modi-fied YOLOV3 and YOLOV4 models have achieved higher average IOU values than their original counterparts. The detection speed comparison of different models during infer-ence time is also shown in Table 1, represented by frames per second (FPS). As shown in the table, YOLOV4-MOD has a slightly lower P. falciparum detection speed than its original version at inference time. Inference time P. falciparum detection speed of YOLOV3-MOD2 is also less than its original version. This is due to high computational complexity of convolution operation at shallow feature maps with a large feature scale in YOLOV3-MOD2.
DiscussionIn general, YOLOV4 models have achieved better P. falciparum detection performance than YOLOV3 models in both their original and modified models. YOLOV4-MOD is the best model for P. falciparum detection among all YOLO-based models. Our modi-fied YOLOV3 and YOLOV4 models, with fine-grained features at high-resolution fea-ture maps, have achieved better detection performance compared with their original versions for small object detection, such as P. falciparum. This implies that the modified network structures learn more robust geometric and semantic information to discern small objects than their original versions.
Comparative analysis of modified YOLOV3 and YOLOV4 models with existing methods
Performance comparison of modified YOLOV3 and YOLOV4 models with recent state-of-the-art one-stage detector SSD and two-stage detector Faster R-CNN is shown in Table 1. As shown in the table, YOLO-based models, both modified and original ver-sions, have achieved considerably higher P. falciparum detection performance than Faster R-CNN and SSD models. Faster R-CNN has achieved 71.0% mAP while SSD has achieved a mAP of 71.4%. The SSD model has the highest P. falciparum detection speed, in frames per second, among all the other models, but it has worst detection accuracy. Faster R-CNN model is the slowest in its detection speed, and its detection accuracy is comparable to that of the SSD model.
The performance of our modified YOLO-based malaria parasite detection models is also compared with existing related works. Chibuta and Acar [44] proposed a modi-fied YOLOV3 model to detect malaria parasites using the same dataset as that of this work. Their model achieved a mAP of 90.2%, which is lower than the performance of all three modified YOLO-based models proposed in this work, where YOLOV4-MOD
Page 7 of 17Abdurahman et al. BMC Bioinformatics (2021) 22:112
has achieved a mAP of 96.32 %. Their model detection computation time was measured in CPU time, which is 0.42 s per image, whereas our best performing model has a com-putation time of 0.034 s per image measured in GPU time. Another method proposed by authors of [45] used a cascade of YOLOV2 and transferred AlexNet and achieved a mAP of 79.22%, which is significantly lower than our models’ performance. Hung et al. [46] reported a 98% of accuracy using Faster R-CNN in cascade with AlexNet to identify P.vivax. Their model’s reported performance outperforms our best perform-ing (YOLOV4-MOD) model, which has an accuracy of 94.36%. However, Hung et al. [46] used thin blood sample microscopic images in which parasitic objects are bigger than the ones in thick blood samples, and small object detection is more challenging than large object detection in images. The cascaded Faster R-CNN with AlexNet model is computationally expensive due to its two-stage architecture and additional AlexNet component. The datasets used in [45, 46] are not the same as ours.
Visual analysis of test results
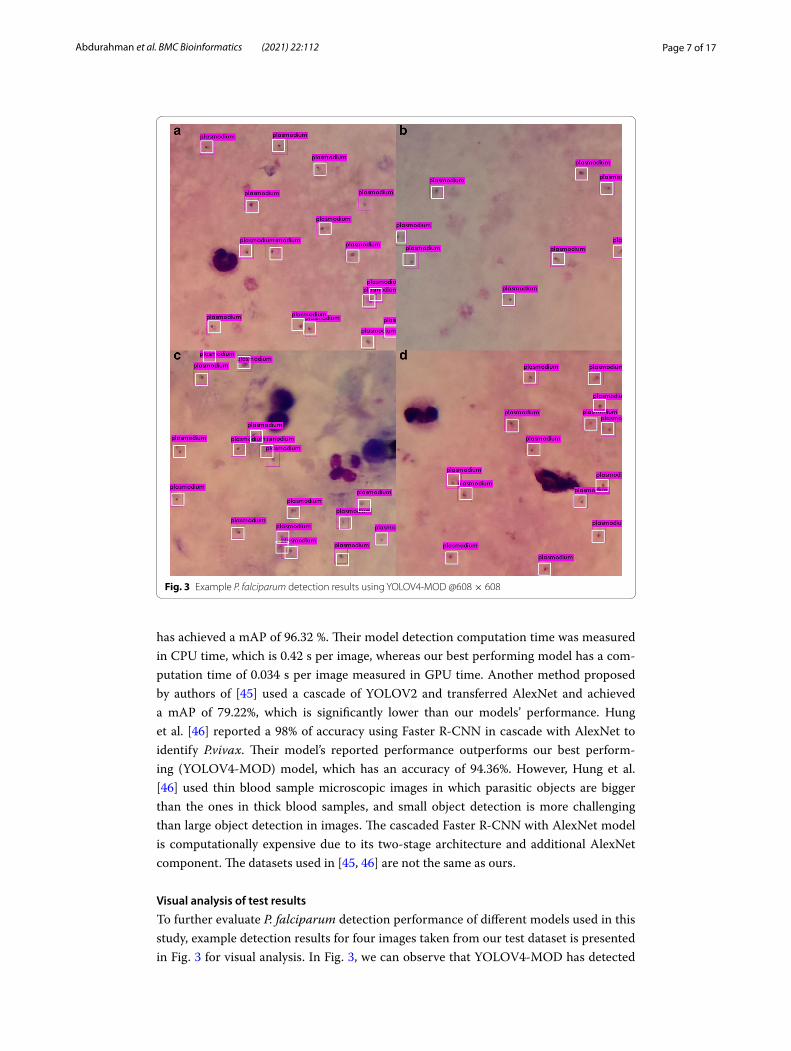
To further evaluate P. falciparum detection performance of different models used in this study, example detection results for four images taken from our test dataset is presented in Fig. 3 for visual analysis. In Fig. 3, we can observe that YOLOV4-MOD has detected
Fig. 3 Example P. falciparum detection results using YOLOV4-MOD @ 608× 608
Page 8 of 17Abdurahman et al. BMC Bioinformatics (2021) 22:112
all parasites with only one false positive case in the first image. Similarly, it has correctly detected all parasites in the third image except for one false negative and one false posi-tive predictions. The ground truth and predicted bounding boxes are shown in white and violet colors, respectively. For the remaining models, examples are provided as a supplementary file (see Additional file 1). For visual analysis of malaria parasite detec-tion results, we have used 608× 608 input image resolution. In general, from the visual analysis of detection results, we can see that the modified YOLOV3 and YOLOV4 mod-els’ malaria parasite detection performance is better than that of other models with good localization accuracy.
ConclusionsIn this paper, performances of state-of-the-art deep learning based object detection algorithms are thoroughly investigated for malaria parasite detection in thick blood smear microscopic images. We have modified YOLOV3 and YOLOV4 network architec-tures to enhance their performance for small object detection task. Several experiments are conducted to compare performance of our modified YOLOV3 and YOLOV4 based models with existing models such as SSD and Faster R-CNN. YOLOV4-MOD has out-performed all the other models with a mAP of 96.32% for 608× 608 input image resolu-tion. Similarly, YOLOV3-MOD2 and YOLOV3-MOD1 have achieved a mAP of 96.14% and 95.46% for the same input image resolution, respectively. The proposed models outperform their original versions, Faster R-CNN and SSD models in terms of mean average precision (mAP), recall, precision, F1 score, average IOU and speed of object detection. We have demonstrated the feasibility and effectiveness of proposed YOLOV-based architectures for P. falciparum detection in microscopic images captured using a smartphone camera. Our future work will investigate the applicability of these algo-rithms for detection of various plasmodium species and stages both in thin and thick blood smear microscopic images. The reliability of these algorithms will also be studied in our future work.
MethodsTo improve small object detection accuracy of YOLOV3 and YOLOV4 models, we have modified these network architectures by including more fine-grained features from low-resolution feature maps. The performance of proposed algorithms, in terms of detection speed and accuracy, have been investigated for detection of P. falciparum using micro-scopic images taken using a smartphone camera.
Dataset
We used publicly available malaria dataset [23]1 for the analysis presented in this study. It was collected using a smartphone camera attached to a microscope’s eyepiece using a special attachment device developed for this purpose. The dataset contains 1182 color microscopic images of thick blood smear malaria slides, which were stained with Field stain at x1000 magnification level, and all the images have a resolution of 750× 750 pixels. It contains 948 malaria-infected images with 7628 P. falciparum parasites and
1 http://air.ug/downl oads/plasm odium -phone camer a.zip.
Page 9 of 17Abdurahman et al. BMC Bioinformatics (2021) 22:112
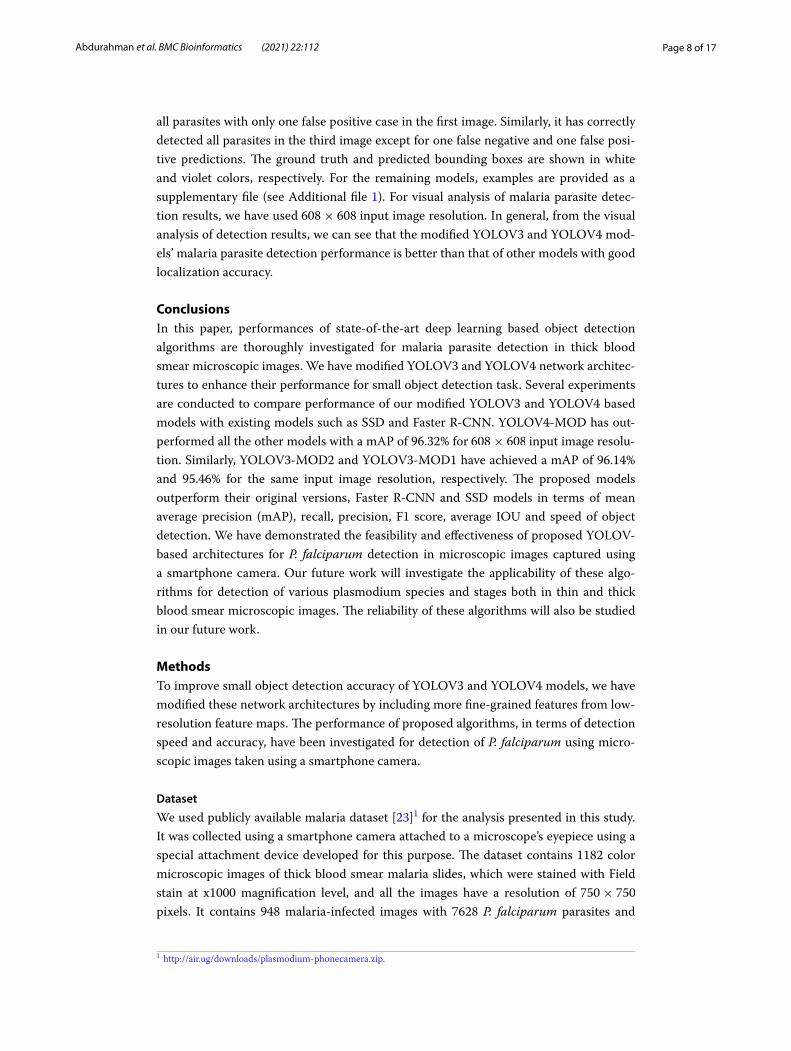
234 normal images with artifacts due to impurities. Since the dataset consists of only P. falciparum, our models were trained only to detect this malaria parasite species. All malaria parasite detection models in this study were trained using 90% of the dataset, among which we took 10% of it for validation. The remaining 10% of the dataset was used to test performance of P. falciparum detection models. Figure 4 shows examples of malaria-infected (positive) and normal (negative) microscopic images from our dataset and corresponding bounding box locations of P. falciparum. Detail description of images in training, validation and testing data sets is listed in Table 2. The images were anno-tated by expert laboratory technicians. No additional patient-level information is given in the dataset, such as the number field of views taken for a single patient. Thus, we have evaluated performance of proposed models at parasite level.
Malaria parasite detection architectures
YOLOV3 [49] is one of the most potent single-stage object detection algorithms used in various application areas. It remarkably improves object detection accuracy, object bounding box localization and speed of detection compared with its previous versions; YOLOV1 [51] and YOLOV2 [52]. The network structure of YOLOV3 is modeled as a single regression problem having one backbone CNN and three object detection heads known as yolo layers. These three detection heads divide an input image into three dif-ferent grids of size S × S. Each grid cell is responsible for detecting objects whose center falls on that grid cell. In YOLOV3 model with an input image resolution of 416× 416 , the feature map size is 13× 13, 26× 26 , and 52× 52 for the first, second and third detec-tion layers, respectively.
Fig. 4 Sample negative (right) and positive (left) microscopic images with ground truth bounding box P. falciparum locations
Table 2 Detail descriptions of malaria dataset used in this study
Training Validation Testing Total
Number of images 966 109 107 1182
Negative samples 191 23 20 234
Positive samples 775 86 87 948
Number of parasites 5695 924 1009 7628
Page 10 of 17Abdurahman et al. BMC Bioinformatics (2021) 22:112
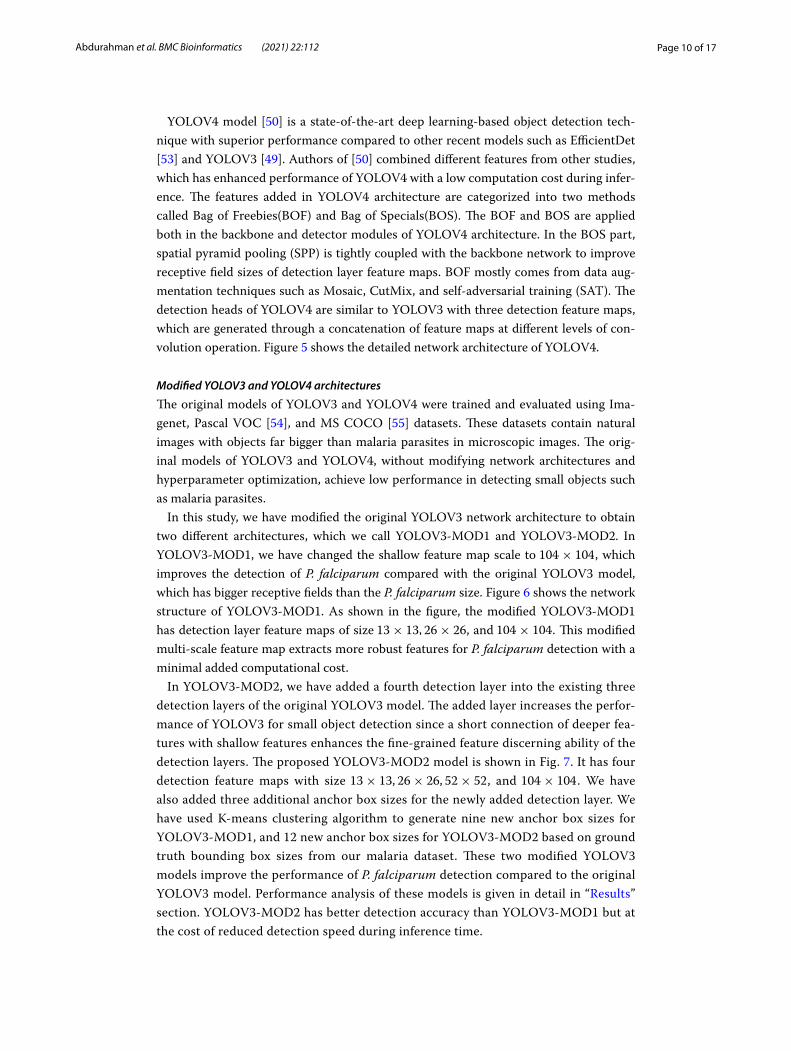
YOLOV4 model [50] is a state-of-the-art deep learning-based object detection tech-nique with superior performance compared to other recent models such as EfficientDet [53] and YOLOV3 [49]. Authors of [50] combined different features from other studies, which has enhanced performance of YOLOV4 with a low computation cost during infer-ence. The features added in YOLOV4 architecture are categorized into two methods called Bag of Freebies(BOF) and Bag of Specials(BOS). The BOF and BOS are applied both in the backbone and detector modules of YOLOV4 architecture. In the BOS part, spatial pyramid pooling (SPP) is tightly coupled with the backbone network to improve receptive field sizes of detection layer feature maps. BOF mostly comes from data aug-mentation techniques such as Mosaic, CutMix, and self-adversarial training (SAT). The detection heads of YOLOV4 are similar to YOLOV3 with three detection feature maps, which are generated through a concatenation of feature maps at different levels of con-volution operation. Figure 5 shows the detailed network architecture of YOLOV4.
Modified YOLOV3 and YOLOV4 architectures
The original models of YOLOV3 and YOLOV4 were trained and evaluated using Ima-genet, Pascal VOC [54], and MS COCO [55] datasets. These datasets contain natural images with objects far bigger than malaria parasites in microscopic images. The orig-inal models of YOLOV3 and YOLOV4, without modifying network architectures and hyperparameter optimization, achieve low performance in detecting small objects such as malaria parasites.
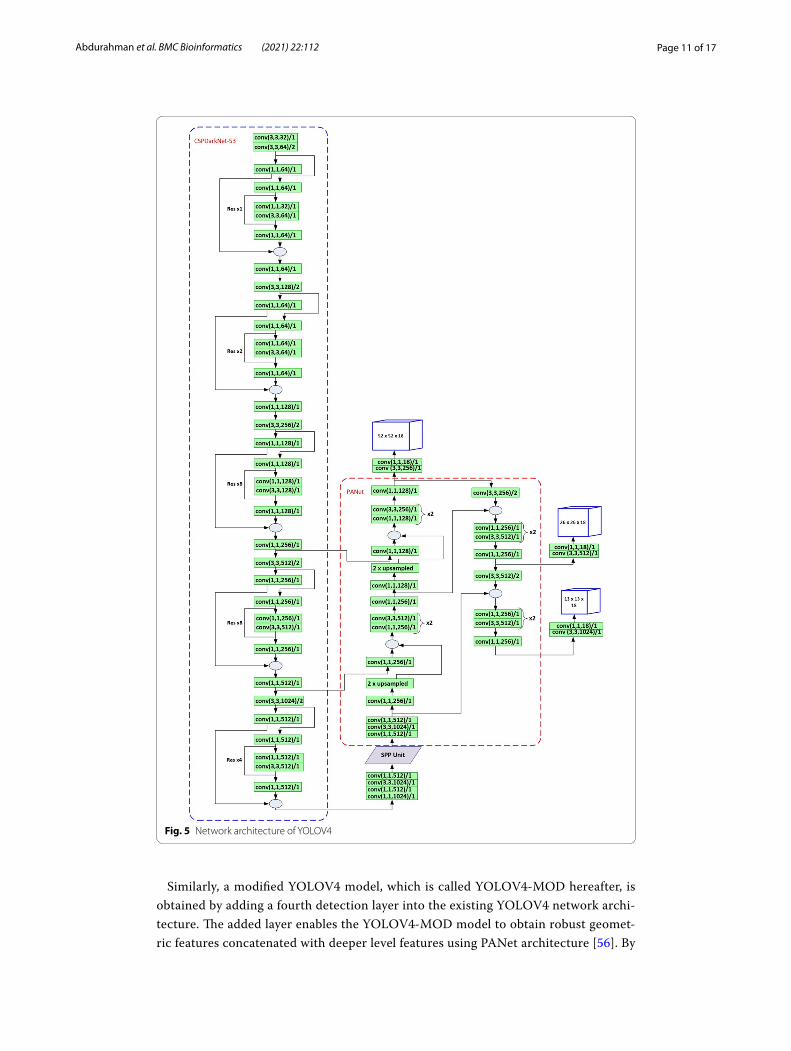
In this study, we have modified the original YOLOV3 network architecture to obtain two different architectures, which we call YOLOV3-MOD1 and YOLOV3-MOD2. In YOLOV3-MOD1, we have changed the shallow feature map scale to 104 × 104 , which improves the detection of P. falciparum compared with the original YOLOV3 model, which has bigger receptive fields than the P. falciparum size. Figure 6 shows the network structure of YOLOV3-MOD1. As shown in the figure, the modified YOLOV3-MOD1 has detection layer feature maps of size 13× 13, 26× 26 , and 104 × 104 . This modified multi-scale feature map extracts more robust features for P. falciparum detection with a minimal added computational cost.
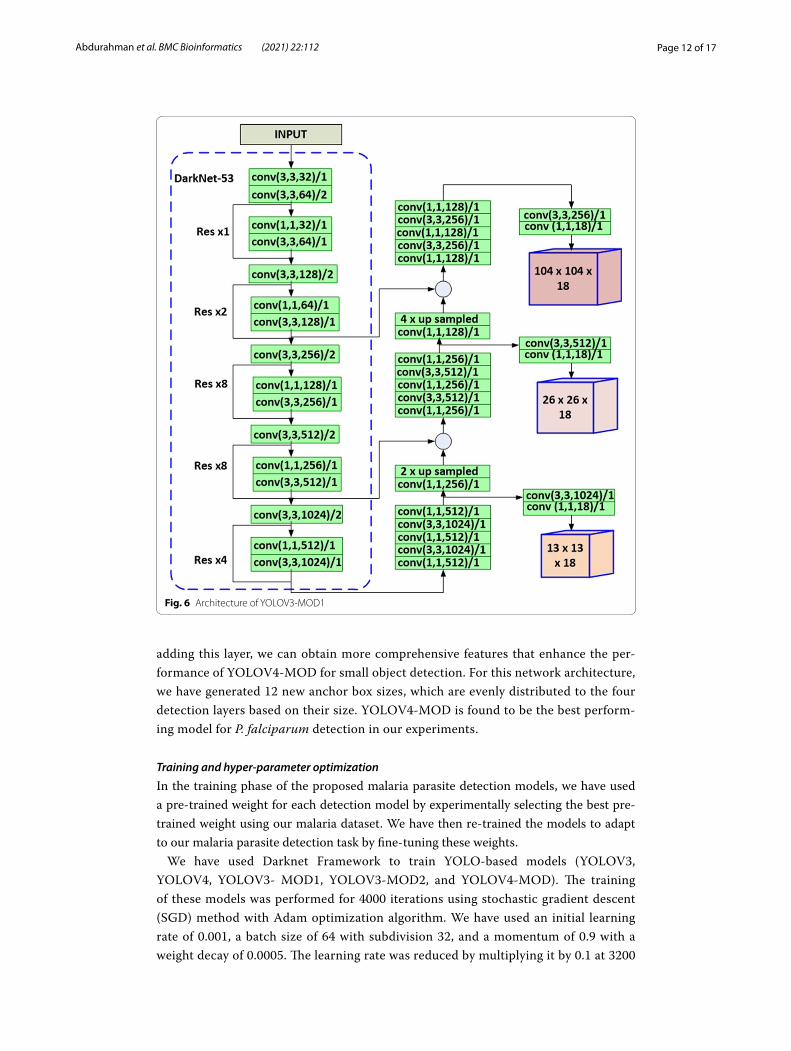
In YOLOV3-MOD2, we have added a fourth detection layer into the existing three detection layers of the original YOLOV3 model. The added layer increases the perfor-mance of YOLOV3 for small object detection since a short connection of deeper fea-tures with shallow features enhances the fine-grained feature discerning ability of the detection layers. The proposed YOLOV3-MOD2 model is shown in Fig. 7. It has four detection feature maps with size 13× 13, 26× 26, 52× 52 , and 104 × 104 . We have also added three additional anchor box sizes for the newly added detection layer. We have used K-means clustering algorithm to generate nine new anchor box sizes for YOLOV3-MOD1, and 12 new anchor box sizes for YOLOV3-MOD2 based on ground truth bounding box sizes from our malaria dataset. These two modified YOLOV3 models improve the performance of P. falciparum detection compared to the original YOLOV3 model. Performance analysis of these models is given in detail in “Results” section. YOLOV3-MOD2 has better detection accuracy than YOLOV3-MOD1 but at the cost of reduced detection speed during inference time.
Page 11 of 17Abdurahman et al. BMC Bioinformatics (2021) 22:112
Similarly, a modified YOLOV4 model, which is called YOLOV4-MOD hereafter, is obtained by adding a fourth detection layer into the existing YOLOV4 network archi-tecture. The added layer enables the YOLOV4-MOD model to obtain robust geomet-ric features concatenated with deeper level features using PANet architecture [56]. By
Fig. 5 Network architecture of YOLOV4
Page 12 of 17Abdurahman et al. BMC Bioinformatics (2021) 22:112
adding this layer, we can obtain more comprehensive features that enhance the per-formance of YOLOV4-MOD for small object detection. For this network architecture, we have generated 12 new anchor box sizes, which are evenly distributed to the four detection layers based on their size. YOLOV4-MOD is found to be the best perform-ing model for P. falciparum detection in our experiments.
Training and hyper‑parameter optimization
In the training phase of the proposed malaria parasite detection models, we have used a pre-trained weight for each detection model by experimentally selecting the best pre-trained weight using our malaria dataset. We have then re-trained the models to adapt to our malaria parasite detection task by fine-tuning these weights.
We have used Darknet Framework to train YOLO-based models (YOLOV3, YOLOV4, YOLOV3- MOD1, YOLOV3-MOD2, and YOLOV4-MOD). The training of these models was performed for 4000 iterations using stochastic gradient descent (SGD) method with Adam optimization algorithm. We have used an initial learning rate of 0.001, a batch size of 64 with subdivision 32, and a momentum of 0.9 with a weight decay of 0.0005. The learning rate was reduced by multiplying it by 0.1 at 3200
Fig. 6 Architecture of YOLOV3-MOD1

Page 13 of 17Abdurahman et al. BMC Bioinformatics (2021) 22:112
and 3600 training iterations. Pre-trained weight files using ImageNet and MS COCO [55] data sets were fine-tuned using our malaria dataset for YOLOV3 and YOLOV4 based models, respectively. We have trained YOLO-based models using input image sizes of 416× 416 and 608× 608 . During the training phase of these models, multi-scale training was enabled by changing the input resolution in the range (320× 320) to ( 896× 896) every ten training iterations on the fly. This enables YOLO-based mod-els to detect objects at different image resolutions. We have used modified anchor box sizes generated using K-means clustering algorithms based on ground truth bounding box sizes obtained from our malaria dataset. For YOLOV3, YOLOV4, and YOLOV3-MOD1 models, we have used nine new anchor box sizes. Similarly, for
Fig. 7 Architecture of YOLOV3-MOD2
Page 14 of 17Abdurahman et al. BMC Bioinformatics (2021) 22:112
YOLOV3-MOD2 and YOLOV4-MOD models, we have generated 12 new anchor box sizes which are evenly distributed to detection layers as per their size.
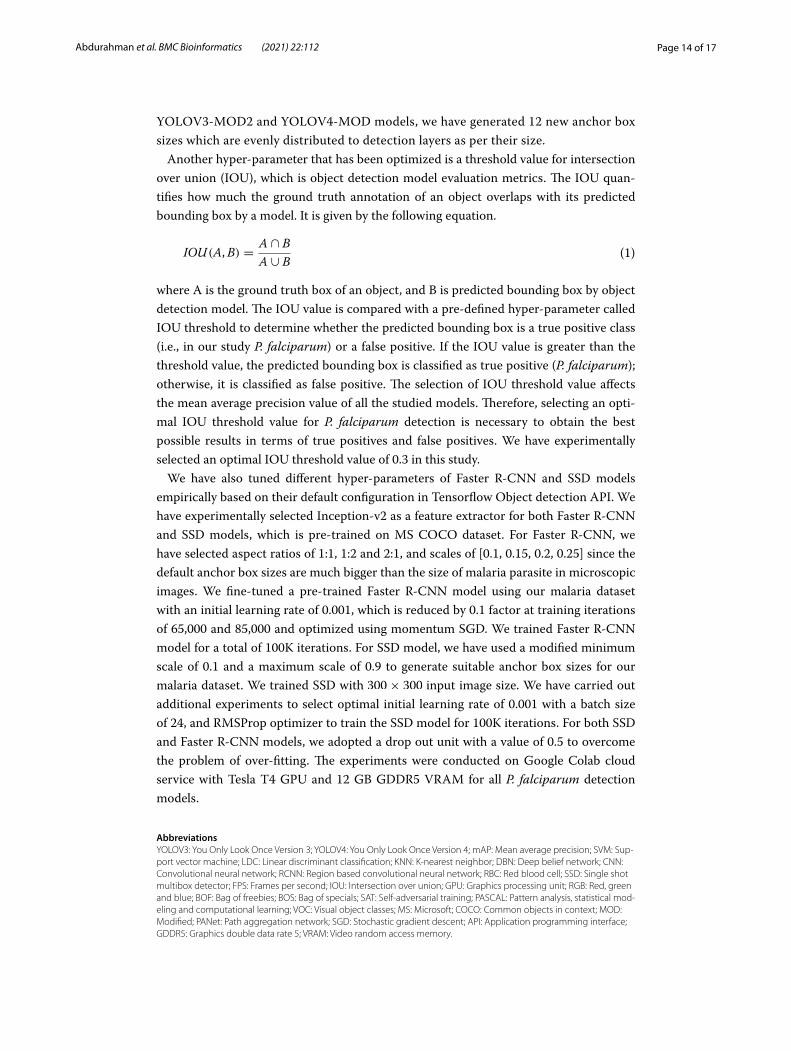
Another hyper-parameter that has been optimized is a threshold value for intersection over union (IOU), which is object detection model evaluation metrics. The IOU quan-tifies how much the ground truth annotation of an object overlaps with its predicted bounding box by a model. It is given by the following equation.
where A is the ground truth box of an object, and B is predicted bounding box by object detection model. The IOU value is compared with a pre-defined hyper-parameter called IOU threshold to determine whether the predicted bounding box is a true positive class (i.e., in our study P. falciparum) or a false positive. If the IOU value is greater than the threshold value, the predicted bounding box is classified as true positive (P. falciparum); otherwise, it is classified as false positive. The selection of IOU threshold value affects the mean average precision value of all the studied models. Therefore, selecting an opti-mal IOU threshold value for P. falciparum detection is necessary to obtain the best possible results in terms of true positives and false positives. We have experimentally selected an optimal IOU threshold value of 0.3 in this study.
We have also tuned different hyper-parameters of Faster R-CNN and SSD models empirically based on their default configuration in Tensorflow Object detection API. We have experimentally selected Inception-v2 as a feature extractor for both Faster R-CNN and SSD models, which is pre-trained on MS COCO dataset. For Faster R-CNN, we have selected aspect ratios of 1:1, 1:2 and 2:1, and scales of [0.1, 0.15, 0.2, 0.25] since the default anchor box sizes are much bigger than the size of malaria parasite in microscopic images. We fine-tuned a pre-trained Faster R-CNN model using our malaria dataset with an initial learning rate of 0.001, which is reduced by 0.1 factor at training iterations of 65,000 and 85,000 and optimized using momentum SGD. We trained Faster R-CNN model for a total of 100K iterations. For SSD model, we have used a modified minimum scale of 0.1 and a maximum scale of 0.9 to generate suitable anchor box sizes for our malaria dataset. We trained SSD with 300× 300 input image size. We have carried out additional experiments to select optimal initial learning rate of 0.001 with a batch size of 24, and RMSProp optimizer to train the SSD model for 100K iterations. For both SSD and Faster R-CNN models, we adopted a drop out unit with a value of 0.5 to overcome the problem of over-fitting. The experiments were conducted on Google Colab cloud service with Tesla T4 GPU and 12 GB GDDR5 VRAM for all P. falciparum detection models.
AbbreviationsYOLOV3: You Only Look Once Version 3; YOLOV4: You Only Look Once Version 4; mAP: Mean average precision; SVM: Sup-port vector machine; LDC: Linear discriminant classification; KNN: K-nearest neighbor; DBN: Deep belief network; CNN: Convolutional neural network; RCNN: Region based convolutional neural network; RBC: Red blood cell; SSD: Single shot multibox detector; FPS: Frames per second; IOU: Intersection over union; GPU: Graphics processing unit; RGB: Red, green and blue; BOF: Bag of freebies; BOS: Bag of specials; SAT: Self-adversarial training; PASCAL: Pattern analysis, statistical mod-eling and computational learning; VOC: Visual object classes; MS: Microsoft; COCO: Common objects in context; MOD: Modified; PANet: Path aggregation network; SGD: Stochastic gradient descent; API: Application programming interface; GDDR5: Graphics double data rate 5; VRAM: Video random access memory.
(1)IOU(A,B) =A ∩ B
A ∪ B
Page 15 of 17Abdurahman et al. BMC Bioinformatics (2021) 22:112
Supplementary InformationThe online version supplementary material available at https ://doi.org/10.1186/s1285 9-021-04036 -4.
Additional file 1. Examples of malaria parasite detection results using different detection models.
AcknowledgementsNot applicable.
Authors’ contributionsFA: Conceptualization of the study, methodology, experimental design and analysis, wrote and revised the manuscript. KAF: Methodology, writing result and discussion, revision of the manuscript. MA: Data analysis and revision of the docu-ment. All the authors read and approved the final manuscript.
FundingNot applicable.
Availability of data and materialsThe dataset used during the current study is available online at http://air.ug/downl oads/plasm odium -phone camer a.zip [23].
Declarations
Ethics approval and consent to participateNot applicable.
Consent for publicationNot applicable.
Competing interestsThe authors declare that they have no competing interests.
Author details1 Faculty of Electrical and Computer Engineering, Jimma Institute of Technology, Jimma University, 378, Jimma, Ethiopia. 2 School of Biomedical Engineering, Jimma Institute of Technology, Jimma University, 378, Jimma, Ethiopia.
Received: 30 September 2020 Accepted: 18 February 2021
References 1. WHO. World malaria report 2019. Geneva: World Health Organization; 2019. Licence: CC BY-NC-SA 3.0 IGO. 2019.
https ://www.who.int/publi catio ns-detai l/world -malar ia-repor t-2019. Accessed 12 Feb 2020. 2. O’Meara W, Barcus M, Wongsrichanalai C, Sinuon M, Maguire J, Jordan R, Prescott W, McKenzie F. Reader technique
as a source of variability in determining malaria parasite density by microscopy. Malar J. 2006;5:118. https ://doi.org/10.1186/1475-2875-5-118.
3. Poostchi M, Ersoy I, McMenamin K, Gordon E, Palaniappan N, Pierce S, Maude RJ, Bansal A, Srinivasan P, Miller L, Pala-niappan K, Thoma G, Jaeger S. Malaria parasite detection and cell counting for human and mouse using thin blood smear microscopy. J Med Imaging. 2018;5(4):1–13. https ://doi.org/10.1117/1.JMI.5.4.04450 6.
4. Kaewkamnerd S, Uthaipibull C, Intarapanich A, Pannarut M, Chaotheing S, Tongsima S. An automatic device for detection and classification of malaria parasite species in thick blood film. BMC Bioinform. 2012;13:12. https ://doi.org/10.1186/1471-2105-13-S17-S18.
5. Park HS, Rinehart MT, Walzer KA, Chi J-TA, Wax A. Automated detection of P. falciparum using machine learning algorithms with quantitative phase images of unstained cells. PLoS ONE. 2016;11(9):1–19. https ://doi.org/10.1371/journ al.pone.01630 45.
6. Ross NE, Pritchard CJ, Rubin DM, Dusé AG. Automated image processing method for the diagnosis and classification of malaria on thin blood smears. Med Biol Eng Comput. 2006;44(5):427–36. https ://doi.org/10.1007/s1151 7-006-0044-2. ISSN 1741-0444.
7. David M, Belen F, Dan C, Sara F, Vicente M, Javier G, Zeev Z. Novel image processing approach to detect malaria. Opt Commun. 2015;350:13–8. https ://doi.org/10.1016/j.optco m.2015.03.064. ISSN 0030-4018.
8. Rosado Luís, Correia da Costa José M, Elias Dirk, Cardoso Jaime S, Automated detection of malaria parasites on thick blood smears via mobile devices. Procedia Comput Sci. 2016;90:138–44. ISSN 1877-0509. https ://doi.org/10.1016/j.procs .2016.07.024. http://www.scien cedir ect.com/scien ce/artic le/pii/S1877 05091 63120 29. 20th Conference on Medical Image Understanding and Analysis (MIUA 2016).
9. Boray TF, Dempster AG, Kale I. Parasite detection and identification for automated thin blood film malaria diagnosis. Comput Vis Image Underst. 2010;114(1):21–32. https ://doi.org/10.1016/j.cviu.2009.08.003. ISSN 1077-3142.
10. Devi SS, Laskar RH, Sheikh SA. Hybrid classifier based life cycle stages analysis for malaria-infected erythrocyte using thin blood smear images. Neural Comput Appl. 2018;29(8):217–35. https ://doi.org/10.1007/s0052 1-017-2937-4. ISSN 1433-3058.

Page 16 of 17Abdurahman et al. BMC Bioinformatics (2021) 22:112
11. Devi SS, Singh NH, Laskar RH. Performance analysis of various feature sets for malaria-infected erythrocyte detection. In: Das KN, Bansal JC, Deep K, Nagar AK, Pathipooranam P, Naidu RC, editors. Soft computing for problem solving. Singapore: Springer; 2019. p. 275–83. ISBN 978-981-15-0184-5.
12. Loddo A, Di Ruberto C, Kocher M. Recent advances of malaria parasites detection systems based on mathemati-cal morphology. Sensors (Basel, Switzerland). 2018;18:02. https ://doi.org/10.3390/s1802 0513.
13. Das DK, Ghosh M, Pal M, Maiti AK, Chakraborty C. Machine learning approach for automated screening of malaria parasite using light microscopic images. Micron. 2013;45:97–106. https ://doi.org/10.1016/j.micro n.2012.11.002. ISSN 0968-4328.
14. Purwar Y, Shah S, Clarke G, Almugairi A, Muehlenbachs A. Automated and unsupervised detection of malaria parasites in microscopic images. Malar J. 2011;10:364. https ://doi.org/10.1186/1475-2875-10-364.
15. Abdul Nasir AS, Mashor MY, Mohamed Z. Segmentation based approach for detection of malaria parasites using moving k-means clustering. In: 2012 IEEE-EMBS conference on biomedical engineering and sciences, pp 653–658. 2012. https ://doi.org/10.1109/IECBE S.2012.r6498 073.
16. Bibin D, Nair MS, Punitha P. Malaria parasite detection from peripheral blood smear images using deep belief networks. IEEE Access. 2017;5:9099–108.
17. Dong Y, Jiang Z, Shen H, David Pan W, Williams LA, Reddy VVB, Benjamin WH, Bryan AW. Evaluations of deep con-volutional neural networks for automatic identification of malaria infected cells. In: 2017 IEEE EMBS international conference on biomedical health informatics (BHI); 2017. p. 101–4
18. Rajaraman S, Antani SK, Poostchi M, Silamut K, Hossain MA, Maude RJ, Jaeger S, Thoma GR. Pre-trained convo-lutional neural networks as feature extractors toward improved malaria parasite detection in thin blood smear images. PeerJ. 2018;6:e4568. https ://doi.org/10.7717/peerj .4568. ISSN 2167-8359.
19. Gopakumar GP, Swetha M, Siva GS, Subrahmanyam GRKS. Convolutional neural network-based malaria diagno-sis from focus stack of blood smear images acquired using custom-built slide scanner. J Biophotonics. 2018;11:3.
20. Vijayalakshmi KR. Deep learning approach to detect malaria from microscopic images. Multimed Tools Appl. 2019;. https ://doi.org/10.1007/s1104 2-019-7162-y. ISSN 1573-7721.
21. Torres K, Bachman CM, Delahunt CB, Baldeon JA, Alava F, Vilela DG, Proux S, Mehanian C, McGuire SK, Thompson CM, Ostbye T, Hu L, Jaiswal MS, Hunt VM, Bell D. Automated microscopy for routine malaria diagnosis: a field comparison on giemsa-stained blood films in Peru. Malar J. 2018;17(1):339. https ://doi.org/10.1186/s1293 6-018-2493-0. ISSN 1475-2875.
22. Yang F, Poostchi M, Yu H, Zhou Z, Silamut K, Yu J, Maude RJ, Jaeger S, Antani S. Deep learning for smartphone-based malaria parasite detection in thick blood smears. IEEE J Biomed Health Inform. 2019;. https ://doi.org/10.1109/JBHI.2019.29391 21. ISSN 2168-2208.
23. Quinn J, Andama A, Munabi I, Kiwanuka F. Automated blood smear analysis for mobile malaria diagnosis; 2014. p. 115–132. ISBN 978-1-4665-8929-2.
24. Yang F, Poostchi M, Yu H, Zhou Z, Silamut K, Yu J, Maude R, Jaeger S, Antani S. Deep learning for smartphone-based malaria parasite detection in thick blood smears. IEEE J Biomed Health Inform. 2019;. https ://doi.org/10.1109/JBHI.2019.29391 21.
25. Liang Z, Powell A, Ersoy I, Poostchi M, Silamut K, Palaniappan K, Guo P, Hossain MA, Sameer A, Maude RJ, Huang JX, Jaeger S, Thoma GR. CNN-based image analysis for malaria diagnosis. In: 2016 IEEE international conference on bioinformatics and biomedicine (BIBM), 2016; p. 493–6.
26. Rahman A, Zunair H, Rahman MS, Yuki JQ, Biswas S, Alam MA, Alam NB, Mahdy MRC. Improving malaria parasite detection from red blood cell using deep convolutional neural networks; 2019. ArXiv, arXiv :1907.10418 .
27. David PW, Dong Y, Wu D. Classification of malaria-infected cells using deep convolutional neural networks. In: Farhadi H, editor. Machine learning, chapter 8. Rijeka: IntechOpen; 2018. https ://doi.org/10.5772/intec hopen .72426 .
28. Sivaramakrishnan R, Antani S, Jaeger S. Visualizing deep learning activations for improved malaria cell clas-sification. In S Fodeh, DS Raicu, editors, Proceedings of the first workshop medical informatics and healthcare held with the 23rd SIGKDD conference on knowledge discovery and data mining, volume 69 of Proceedings of machine learning research; 2017. p. 40–7. PMLR. http://proce eding s.mlr.press /v69/sivar amakr ishna n17a.html.
29. Delahunt CB, Jaiswal MS, Horning MP, Janko S, Thompson CM, Kulhare S, Hu L, Ostbye T, Yun G, Gebrehiwot R, Wilson BK, Long E, Proux S, Gamboa D, Chiodini P, Carter J, Dhorda M, Isaboke D, Ogutu B, Oyibo W, Villasis E, Tun KM, Bachman C, Bell D, Mehanian C. Fully-automated patient-level malaria assessment on field-prepared thin blood film microscopy images, including supplementary information. 2019. CoRR, arXiv :1908.01901 .
30. van Rijthoven M, Swiderska-Chadaj Z, Seeliger K, van der Laak J, Ciompi F. You only look on lymphocytes once. 2018.
31. Liu M, Jiang J, Wang Z. Colonic polyp detection in endoscopic videos with single shot detection based deep convolutional neural network. IEEE Access. 2019;7:75058–66. https ://doi.org/10.1109/ACCES S.2019.29210 27. ISSN 2169-3536.
32. Murat Ünver H, Ayan E. Skin lesion segmentation in dermoscopic images with combination of yolo and grabcut algorithm. In: Diagnostics, 2019.
33. Ezhilarasi R, Varalakshmi P. Tumor detection in the brain using faster r-cnn. In: 2018 2nd international conference on I-SMAC (IoT in Social, Mobile, Analytics and Cloud) (I-SMAC); 2018. p. 388–392. https ://doi.org/10.1109/I-SMAC.2018.86537 05.
34. Lemay A. Kidney recognition in CT using yolov3; 2019. ArXiv, arXiv :1910.01268 . 35. El-Melegy M, Mohamed D, ElMelegy T. Automatic detection of tuberculosis bacilli from microscopic sputum
smear images using faster r-cnn, transfer learning and augmentation. In: Morales A, Fierrez J, Sánchez JS, Ribeiro B, editors. Pattern recognition and image analysis. Cham: Springer International Publishing; 2019. p. 270–8. ISBN 978-3-030-31332-6.
36. Liu W, Cheng L, Meng D. Brain slices microscopic detection using simplified ssd with cycle-gan data augmentation. In: Long C, Andrew CSL, Seiichi O, editors. Neural information processing. Cham: Springer International Publishing; 2018. p. 454–63. ISBN 978-3-030-04212-7.
Page 17 of 17Abdurahman et al. BMC Bioinformatics (2021) 22:112
• fast, convenient online submission
•
thorough peer review by experienced researchers in your field
• rapid publication on acceptance
• support for research data, including large and complex data types
•
gold Open Access which fosters wider collaboration and increased citations
maximum visibility for your research: over 100M website views per year •
At BMC, research is always in progress.
Learn more biomedcentral.com/submissions
Ready to submit your researchReady to submit your research ? Choose BMC and benefit from: ? Choose BMC and benefit from:
37. Tang W, Zou D, Yang S, Shi J. DSL: automatic liver segmentation with faster r-cnn and deeplab. In: Věra K, Yannis M, Barbara H, Lazaros I, Ilias M, editors. Artificial neural networks and machine learning–ICANN 2018. Cham: Springer International Publishing; 2018. p. 137–47. ISBN 978-3-030-01421-6. 2018.
38. Ma J, Li X, Li H, Menze BH, Liang S, Zhang R, Zheng W-S. Group-attention single-shot detector (ga-ssd): finding pulmonary nodules in large-scale ct images. In: Jorge Cardoso M, Feragen A, Glocker B, Konukoglu E, Oguz I, Unal G, Vercauteren T, editors, Proceedings of The 2nd international conference on medical imaging with deep learning, volume 102 of Proceedings of machine learning research, p. 358–369, London, United Kingdom, 08–10 Jul 2019. PMLR. http://proce eding s.mlr.press /v102/ma19a .html.
39. Xiao J, Zhang Y, Bian K, Zhou G, Yan W. Denxfpn: pulmonary pathologies detection based on dense feature pyramid networks. In: ICASSP 2019–2019 IEEE international conference on acoustics, speech and signal processing (ICASSP); 2019. p. 1234–1238. https ://doi.org/10.1109/ICASS P.2019.86830 21.
40. Sirazitdinov I, Kholiavchenko M, Mustafaev T, Yixuan Y, Kuleev R, Ibragimov B. Deep neural network ensemble for pneumonia localization from a large-scale chest X-ray database. Comput Electr Eng. 2019;78:388–99. https ://doi.org/10.1016/j.compe lecen g.2019.08.004. ISSN 0045-7906.
41. Chang PD, Kuoy E, Jack Grinband, Weinberg BD, Thompson M, Homo R, Chen J, Abcede H, Shafie M, Sugrue LP, Filippi CG, Su M-Y, Yu W, Hess CP, Chow DS. Hybrid 3d/2d convolutional neural network for hemorrhage evaluation on head ct. Am J Neuroradiol. 2018;39(9):1609–16.
42. Kutlu Hüseyin AE, Özyurt F. White blood cells detection and classification based on regional convolutional neural networks. Med Hypotheses. 2020;135:109472. https ://doi.org/10.1016/j.mehy.2019.10947 2. ISSN 0306-9877ISSN 0306-9877.
43. Lo Y-C, Juang C-F, Chung I-F, Guo S-N, Huang M-L, Wen M-C, Lin C-J, Lin H-Y. Glomerulus detection on light micro-scopic images of renal pathology with the faster r-cnn. In: Long C, Andrew CSL, Seiichi O, editors. Neural information processing. Cham: Springer International Publishing; 2018. p. 369–77. ISBN 978-3-030-04239-4.
44. Chibuta S, Acar AC. Real-time malaria parasite screening in thick blood smears for low-resource setting. J Dig Imag-ing. 2020;1–13.
45. Yang FC, Quizon N, Silamut K, Maude RJ, Jäger S, Antani SK. Cascading yolo: automated malaria parasite detection for plasmodium vivax in thin blood smears; 2019.
46. Hung J, Goodman A, Lopes S, Rangel G, Ravel D, Costa F, Duraisingh MT, Marti M, Carpenter AE. Applying faster r-cnn for object detection on malaria images; 2017. ArXiv, arXiv :1804.09548 .
47. Ren S, He K, Girshick R, Sun J. Faster r-cnn: towards real-time object detection with region proposal networks. IEEE Trans Pattern Anal Mach Intell. 2017;39(6):1137–49.
48. Liu W, Anguelov D, Erhan D, Szegedy C, Reed S, Fu C-Y, Berg AC. SSD: Single shot multibox detector. In: Bastian L, Jiri M, Nicu S, Max W, editors. Computer vision–ECCV 2016. Cham: Springer International Publishing; 2016. p. 21–37. ISBN 978-3-319-46448-0.
49. Redmon J, Farhadi A. Yolov3: an incremental improvement; 2018. CoRR, arXiv :1804.02767 . 50. Bochkovskiy A, Wang C-Y, Liao H-YM. Yolov4: optimal speed and accuracy of object detection; 2020. ArXiv, arXiv
:2004.10934 . 51. Redmon J, Divvala S, Girshick R, Farhadi A. You only look once: unified, real-time object detection. In: 2016 IEEE
conference on computer vision and pattern recognition (CVPR); 2016. p. 779–88. 52. Redmon J, Farhadi A. YOLO9000: better, faster, stronger; 2016. CoRR, arXiv :1612.08242 . 53. Tan M, Pang R, Le QV. Efficientdet: scalable and efficient object detection; 2019. ArXiv, arXiv :1911.09070 . 54. Deng J, Dong W, Socher R, Li L, Li Kai, Fei-Fei Li. Imagenet: a large-scale hierarchical image database. In: 2009 IEEE
conference on computer vision and pattern recognition; 2009. p. 248–55. Accessed 16 Feb 2020. 55. Lin T-Y, Maire M, Belongie S, Hays J, Perona P, Ramanan D, Dollár P, Lawrence ZC. Microsoft coco: common objects in
context. In: David F, Tomas P, Bernt S, Tinne T, editors. Computer Vision—ECCV 2014. Cham: Springer International Publishing; 2014. p. 740–55. ISBN 978-3-319-10602-1.
56. Liu S, Qi L, Qin H, Shi J, Jia J (2018) Path aggregation network for instance segmentation; 2018. CoRR, arXiv :1803.01534 .
Publisher’s noteSpringer Nature remains neutral with regard to jurisdictional claims in published maps and institutional affiliations.