malacca researchmalaccaresearch.com/wp-content/uploads/2017/04/power-root-valuation-4.2.17.pdfapr...
TRANSCRIPT

Published on 2 April 2017
1
MALACCA RESEARCH
*The following analysis is based on a review of Power Root’s annual reports and press reports. We have not previously analyzed this company and do not hold any investment or trading positions in its stock. Readers should not make investment decisions based on this report and should understand our target price is a byproduct of our assumptions and valuation approach, which could be flawed. Finally, readers should note we are publishing this paper at the end of Power Root’s fiscal year 2017, but the company’s FY2017 data is not yet released and therefore is estimated in our valuation. Company: Power Root Berhad Industry: Consumer Headquarters: Malaysia Exchange: Kuala Lumpur Stock Exchange Stock Code: 7237 Price per share (Malaysian Ringgit, MYR): 2.33 Price per share (US Dollar, USD): 0.531 Shares outstanding: 314,409,205 Market capitalization: MYR 732,573,448 Target price: MYR 2.65 *Data is of 31 March 2017 OVERVIEW Power Root Berhad (Bhd), formerly known as Natural Bio Resources Bhd, is a Malaysia-based beverage provider that specializes in herbal energy drinks and instant coffee. The company was founded in 1999 in Johor Bahru, Malaysia, and is headquartered in Kuala Lumpur, the country’s capital. Power Root has ten subsidiaries based in Malaysia that mostly support the company’s energy drink and coffee sales, and it has five international subsidiaries that support Power Root’s international sales. In 2016, domestic sales accounted for approximately 61% of revenues and international sales contributed 39%, most of which were from the Middle East. Power Root is building a production facility in the United Arab Emirates to drive its growth in the Middle East and North Africa, and it expects the facility to be complete by 2018. BOARD OF DIRECTORS AND MANAGEMENT Power Root’s board as of July 2016 consisted of six members. Four of the board members were appointed to their seats in 2007, one in 2008, and another in 2014, and two of the six directors are identified as independent. None of the board members have a familial relationship with
1 This implies a conversion rate of MYR 4.4 to USD 1. We apply this rate to all other MYR to USD conversions.

Published on 2 April 2017
2
MALACCA RESEARCH
any director or substantial shareholder of the Company, according to the company’s 2016 Annual Report. Three of Power Root’s board members have at least 16 years experience in the food and beverage industry—these three people also co-founded the company—which provides the company a solid base of knowledge in which to guide decision making. The three board members without previous experience in the food and beverage industry have experience in accounting and banking. INDUSTRY AND COMPETITION Instant Coffee In 2016, the instant coffee market consumed 21.5 million 60 kilogram bags of coffee, which represents a 3.6% compound annual growth rate from 2009-2016, according to Research and Markets, a market research firm. The total market value for the instant coffee market in 2016 was USD 28 billion and should increase to USD 36 billion to 2020, according to Euromonitor International. Instant coffee is most popular in emerging markets, particularly Eastern Europe, the Middle East, Africa, and Asia-Pacific, according to Euromonitor International. We infer that the instant coffee market represents approximately 13.8% of overall coffee consumption, based on an International Coffee Organization’s (ICO) 2016 report that stated the world consumed 155.7 million 60 kilogram bags of coffee in 2016. Over the last three years, world coffee consumption expanded 1.9% per year, according to the same ICO report. Instant coffee’s 3.6% compound annual growth rate during this same period exceeds the compound annual growth of 1.9% in the overall consumption of coffee, which suggests coffee drinkers increasingly are choosing instant coffee. In Malaysia, the instant coffee market is crowded and there are numerous brands available. Nestle’s Nescafe is the leading instant coffee brand, taking 48% of the market in 2016 and earning MYR 775 million, or USD 176 million, in revenue, according to Euromonitor International. We use Nescafe’s market share and revenue to infer the total instant coffee market size in Malaysia to be MYR 1,615 million, or USD 367 million. If we assume instant coffee generates 80% of Power Root’s domestic revenue and 80% of its export revenue,2 we can infer the company’s sales of instant coffee in Malaysia in 2016 generated MYR 179 million, giving it 11% market share of instant coffee sales in Malaysia.
2 We have little basis for this estimation other than Power Root’s coffee line is more robust than its energy drink product line and because we assess the primary location of its exports—the Middle East—suggests instant coffee comprises most of its exports. We note, however, that our estimates are reasonable because they lead to values that are consonant with the market share of the respective market leaders for each product line.
Published on 2 April 2017
3
MALACCA RESEARCH
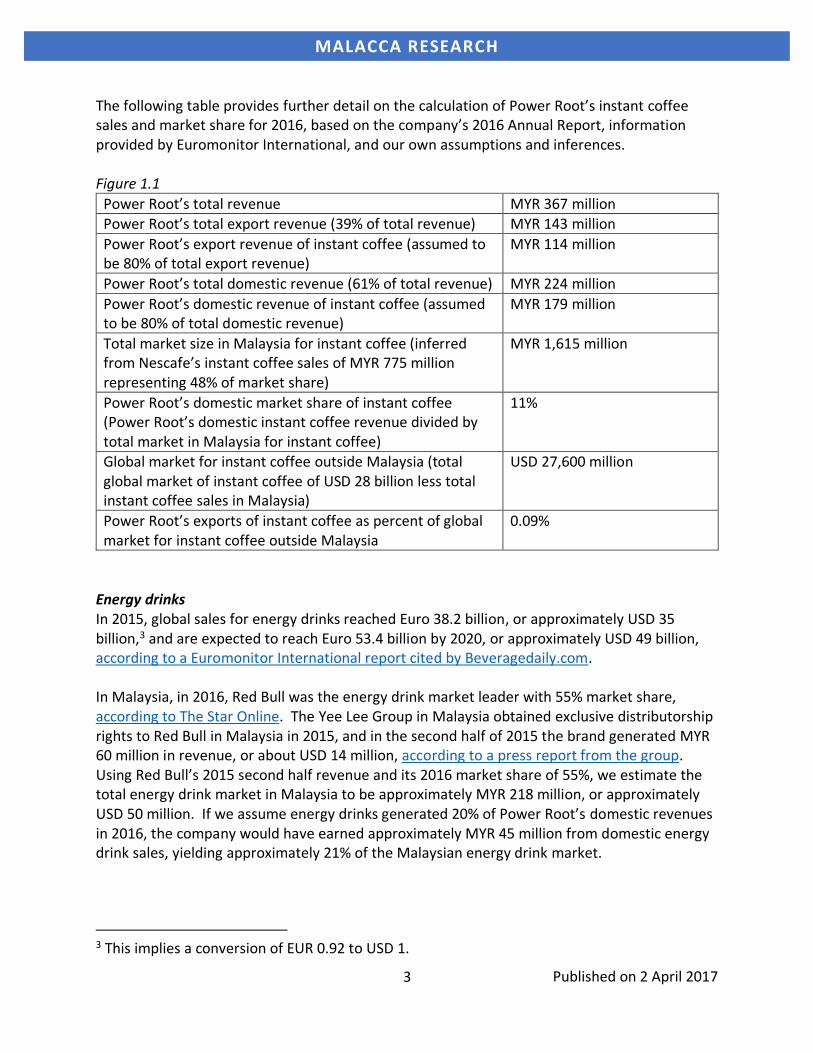
The following table provides further detail on the calculation of Power Root’s instant coffee sales and market share for 2016, based on the company’s 2016 Annual Report, information provided by Euromonitor International, and our own assumptions and inferences. Figure 1.1
Power Root’s total revenue MYR 367 million Power Root’s total export revenue (39% of total revenue) MYR 143 million
Power Root’s export revenue of instant coffee (assumed to be 80% of total export revenue)
MYR 114 million
Power Root’s total domestic revenue (61% of total revenue) MYR 224 million
Power Root’s domestic revenue of instant coffee (assumed to be 80% of total domestic revenue)
MYR 179 million
Total market size in Malaysia for instant coffee (inferred from Nescafe’s instant coffee sales of MYR 775 million representing 48% of market share)
MYR 1,615 million
Power Root’s domestic market share of instant coffee (Power Root’s domestic instant coffee revenue divided by total market in Malaysia for instant coffee)
11%
Global market for instant coffee outside Malaysia (total global market of instant coffee of USD 28 billion less total instant coffee sales in Malaysia)
USD 27,600 million
Power Root’s exports of instant coffee as percent of global market for instant coffee outside Malaysia
0.09%
Energy drinks In 2015, global sales for energy drinks reached Euro 38.2 billion, or approximately USD 35 billion,3 and are expected to reach Euro 53.4 billion by 2020, or approximately USD 49 billion, according to a Euromonitor International report cited by Beveragedaily.com. In Malaysia, in 2016, Red Bull was the energy drink market leader with 55% market share, according to The Star Online. The Yee Lee Group in Malaysia obtained exclusive distributorship rights to Red Bull in Malaysia in 2015, and in the second half of 2015 the brand generated MYR 60 million in revenue, or about USD 14 million, according to a press report from the group. Using Red Bull’s 2015 second half revenue and its 2016 market share of 55%, we estimate the total energy drink market in Malaysia to be approximately MYR 218 million, or approximately USD 50 million. If we assume energy drinks generated 20% of Power Root’s domestic revenues in 2016, the company would have earned approximately MYR 45 million from domestic energy drink sales, yielding approximately 21% of the Malaysian energy drink market.
3 This implies a conversion of EUR 0.92 to USD 1.

Published on 2 April 2017
4
MALACCA RESEARCH
The following table provides further detail on the calculation of Power Root’s energy drink sales and market share for 2016, based on the company’s 2016 Annual Report, information provided by Euromonitor International, and our own assumptions and inferences. Figure 1.2
Power Root’s total revenue MYR 367 million Power Root’s total export revenue (39% of total revenue) MYR 143 million
Power Root’s export revenue of energy drinks (assumed to be 20% of total export revenue)
MYR 29 million
Power Root’s total domestic revenue (61% of total revenue) MYR 224 million
Power Root’s domestic revenue of energy drinks (assumed to be 20% of total domestic revenue)
MYR 45 million
Total market size in Malaysia for energy drinks (inferred from Red Bull Malaysia’s assumed annual sales of MYR 120 million representing 55% of market share)
MYR 218 million
Power Root’s domestic market share of energy drinks (Power Root’s domestic energy drink revenue divided by total market in Malaysia for energy drinks)
21%
Global market for energy drinks outside Malaysia (total global market for energy drinks of USD 35 billion less total energy drink sales in Malaysia)
USD 34,950 million
Power Root’s exports of energy drinks as percent of global market for energy drinks outside Malaysia
0.02%
COMPETITIVE ADVANTAGE Power Root primary differentiates its coffee and energy drinks by promoting their natural ingredients, specifically Tongkat Ali and Kacip Fatimah. Tongkat Ali, which the scientific community calls Eurycoma Longifolia, is a tall, evergreen shrub-tree found in Southeast Asia that possibly can increase male fertility, according to WebMD. Tongkat Ali also is alleged to have other myriad health benefits, to include increased athletic performance and treatment for various illnesses, but these benefits are inconclusive, according to WebMD. In addition to its possible health benefits, Tongkat Ali sometimes is used to enhance the taste of Power Root’s drinks because it is bitter, according to the company’s website. The other natural ingredient in Power Root’s products, Kacip Fatimah, which also is called Labisia Pumilia, is an herb found in the Malaysian rainforest that provides various female health benefits, according to Power Root’s website. WebMD did not contain information on this herb. In addition to promoting the use of natural ingredients, Power Root attempts to differentiate its products by partnering with various Malaysian celebrities. In 2016, the company signed Mixed Martial Arts fighter Peter Davis as an ambassador for its energy drinks. Also in 2016, the

Published on 2 April 2017
5
MALACCA RESEARCH
company partnered with Malaysian radio DJ and TV host Faizal Ismail as an ambassador for its Alicafe Tongkat Ali and ginseng products, according to the company’s 2016 Annual Report. SHARE PERFORMANCE Since March 2012, Power Root’s share price has appreciated approximately 380%, a gain that significantly outperforms its local competitors Nestle (Malaysia) and Old Town White Coffee, as well as the Kuala Lumpur Composite Index (KLCI). Although not included in the below chart, we also note that Super Group Ltd, the Singapore company that trades on the Singapore Stock Exchange and is the largest coffee manufacturer in Malaysia, has appreciated approximately 50% over this same period.
*chart current as of 22 March 2017 GROWTH CATALYSTS We assess Power Root’s future production facility in the United Arab Emirates, which is expected to be completed in 2018, will increase revenues, particularly for the company’s instant coffee—this is because of the strong demand for coffee in the Middle East, where the company sends most of its exports. This facility also will increase the efficiency of the company’s distributorship, which will lead to decreased costs. The competitiveness of the
-100%
0%
100%
200%
300%
400%
500%
Mar-12 Mar-13 Mar-14 Mar-15 Mar-16 Mar-17
Five Year Performance, 2012-2017
Old Town Nestle Power Root KLCI

Published on 2 April 2017
6
MALACCA RESEARCH
Middle Eastern coffee market, however, will require Power Root to maintain elevated marketing costs, which will enervate the gains in distributorship efficiency and increased sales. In Malaysia, and Southeast Asia in general, we expect instant coffee sales to grow as these populations continue to expand and increasingly choose instant coffee as their drink of choice. Power Root’s use of local celebrities to promote its coffee and energy drinks also should lead to increased revenues, particularly in Malaysia. Power Root also will benefit greatly from Malaysia’s Pioneer Status Tax Incentive (PSTI), which the government developed to encourage reinvestment in beverages containing edible plants and herbal extracts. Kuala Lumpur in 2013 awarded this tax benefit to Power Root (M) Sdn Bhd, a subsidiary of Power Root Bhd, exempting the subsidiary from 70% of its income taxes from 2015 through 2019, according to the company’s 2015 and 2016 annual reports. We view this subsidiary as the company’s primary source of revenue and therefore assign the full tax benefit to the overall company. Aside from the PSTI, we currently do not assess that Power Root’s use of natural ingredients, particularly Tongkat Ali and Kacip Fatimah, independently will serve as a further catalyst for growth. Future data that speaks to Malaysian and global consumers’ desire for products incorporating these ingredients would cause us to reevaluate our assessment. RISKS Power Root faces unique risk in its instant coffee and energy drink business. In the near term, the company faces execution risks as it increasingly focuses on exports to drive its revenues. For instance, delays in the company’s production facility in the United Arab Emirates will lead to increased costs and reduced revenues. Long term, the company’s ability to differentiate itself through its natural ingredients will suffer if Tongkat Ali and Kacip Fatimah are perceived to have few, if any, health benefits. Power Root aggressively markets these health benefits in its packaging and through its celebrity sponsors, suggesting the brand would be setback were consumers to devalue the benefits of these natural ingredients. Power Root also faces near term industry risk in its coffee and energy drink sales. Weak consumer sentiment in Malaysia and a retail sector challenged by higher raw material prices, according to The Edge Markets, a leading financial publication in Malaysia, probably will lead to slower sales growth and increased costs for Power Root in 2017. Long term, Power Root’s instant coffee and energy drinks face risks that could significantly impact their respective revenues. The instant coffee market is threatened by the potential for consumers to prefer premium coffee, a development that has taken root in Western markets, according to Euromonitor International. Power Root probably will need to at least maintain its research and development expenses—the company does not identify these expenses, but we assume they are included in its “other expenses”—to remain competitive, or it risks losing sales.
Published on 2 April 2017
7
MALACCA RESEARCH
Power Root’s energy drink line is at risk of consumers eschewing sugar-laden products, as they recently have with soda. From 2007-2013, daily soda consumption by US teenagers—a primary target for marketers of sugary drinks, according to a 2014 Yale University study reported in the Hartford Courant—dropped by 24%, with the rest of the US population reducing their daily soda consumption by 20%, according to The New York Times. Governments also might attempt to ban energy drinks, as they have with soft drinks. In 2016, The Food Research Collaboration, an initiative of the Centre for Food Policy at City University London, published a report that recommended local and national government restrict the sales and marketing of energy drinks to young people, according to The Guardian. In mid-2016, the Government of Saudi Arabia as part of an effort to promote healthier drink choices announced plans to fine restaurants who serve energy drinks, according to a Euromonitor International report cited by Foodnavigator.com. Although restaurants comprise only three percent of energy drink sales, according to the same article, we assess Riyadh probably will extend a version of this penalty to off-trade venues. VALUATION Thesis Power Root competes in the competitive instant coffee and energy drink market and differentiates itself by incorporating natural ingredients into its products. The company will continue to use Malaysian celebrities to promote its coffee and energy drinks and stress their use of natural ingredients, which will increase revenues, although not significantly. Domestic sales also will benefit from an increasing population. Internationally, Power Root’s instant coffee sales, which primarily come from the Middle East, will increase with the completion of the company’s United Arab Emirates (UAE)-based production facility. However, the intense competition within the instant coffee market will require sustained marketing expenses and research and development to improve its product, which collectively will temper these revenue gains. The production facility initially will lead to an increase in energy drink exports to the Middle East, but concerns over sugar-saturated drinks will lead to a decrease in the revenue growth of energy drink exports by 2021, as governments in the Middle East and around the globe institute restrictions on these products. Forecast drivers Revenue: We break down Power Root’s revenues into four components: domestic instant coffee, domestic energy drink, international instant coffee, and international energy drink. In 2016, domestic sales accounted for 61% of the company’s revenues and international sales accounted for 39%. We then estimate that instant coffee accounted for 80% of both domestic and international sales, although as stated in footnote two we have little basis for this assessment.

Published on 2 April 2017
8
MALACCA RESEARCH
We estimate the year-over-year percent change in domestic revenues for both Power Root’s instant coffee and energy drinks to gain a tenth of a percent per year, increasing from 11.34% in 2016 to 11.84% in 2021. These revenue gains reflect the company’s marketing efforts and the overall population increase in Malaysia. For international sales, in 2017, we forecast the year-over-year percent change in export revenues of both instant coffee and energy drinks to mirror their year-over-year change in 2016; this is because the production facility will not yet be operational. For 2018, we estimate a quarter percent year-over-year increase in sales because the production facility will become operational. For 2019, we expect the facility to be fully operational and produce a half percent increase in year-over-year sales for both instant coffee and energy drinks. In 2020 and 2021, however, our expectations for instant coffee and energy drink exports diverge, with instant coffee continuing to see a half percent year-over-year gain in sales but energy drinks experiencing a half percent year-over-year decline. This decline in energy drink sales is because we expect consumers to eschew sugary drinks and governments to broaden restrictions on its consumption. Expenses: Power Root’s production facility in the UAE will lead to a decrease in the cost of goods sold (COGS). For 2017, we estimate COGS as a percent of total revenue will be the median over the prior five years. In 2018, when the facility becomes on-line, COGS as a percent of revenue will decrease a quarter percent, and then half a percent per annum through 2021. Power Root will benefit significantly from Malaysia’s Pioneer Status Tax incentive, which will exempt 70% of revenues from the company’s primary subsidiary because its products incorporate natural ingredients. We view this subsidiary as the company’s primary source of revenue and therefore assign the full tax benefit to the overall company. The company will enjoy this tax benefit through 2019, at which point it will return to paying Malaysia’s normal 24% corporate tax rate. We expect Power Root’s marketing and staff expenses through 2021 to hold at their respective median percent of revenue over the prior five years. The company does not break down its “other expenses,” but we assume this includes research and development. Therefore, we hold constant the company’s 2016 “other expense” to the forecasted years through 2021.

Published on 2 April 2017
9
MALACCA RESEARCH
Cost of Capital and Target Price Beta 1.73
Risk free rate 2.976%
Market premium 5.5%
Total debt MYR 10,897,412
Total equity MYR 732,573,448 Weighted average cost of capital 12.34%
Terminal growth 3%
Target price MYR 2.65
Beta: To calculate Power Root’s beta, we run a regression on Power Root’s monthly returns over the last five years against those same returns in the Kuala Lumpur Composite Index. This yields a beta of 1.73. Risk free rate: To calculate the risk-free rate, we take the 10 year US treasury rate as of 31 March, which was 2.386%, according to the Wall Street Journal, and add the average difference from 2006-2015 in consumer price inflation in the United States and Malaysia, which is 0.59%. This brings our risk-free rate to 2.976%. Market premium: For the market premium, we simply apply 5.5%, which is at the high-end of the market premium range recommended by McKinsey & Company in the fourth edition of their book titled, “Valuation.” Total debt and equity: To determine the company’s weight of debt, we used the debt identified on Power Root’s 2016 Annual Report, which is MYR 10,897,412. For the company’s weight of equity, we calculated the company’s market value using the number of diluted shares outstanding identified in the company’s 2016 Annual Report—314,409,205—and the price per share on 31 March—MYR 2.33—which produces a market value of MYR 732,573,448. This results in Power Root’s debt representing 1.47% of the company’s capital structure and equity representing 98.53%. Weighted average cost of capital4: Based on the above calculations, we determine the company’s weighted average cost of capital to be 12.34%. Terminal growth: We assume a terminal growth rate of 3%. Target price: Based on our revenue and expense assumptions, and our calculation for the cost of capital, we arrive at a target price of MYR 2.65, which is 13.7% higher than the closing share price on 31 March of MYR 2.33. Our target price implies an EBITDA multiple of 6.00x.
4 We do not account for inflation in our weighted average cost of capital calculation, given the relatively modest inflation that Malaysia has experienced over the past decade. Based on data provided by The World Bank, Malaysia’s average inflation from 2004-2015 was 2.50%. Malaysia Inflation – Consumer Prices, 2004-2015
2015 2014 2013 2012 2011 2010 2009 2008 2007 2006 2005 2004
2.10% 3.14% 2.11% 1.66% 3.20% 1.71% 0.58% 5.44% 2.03% 3.61% 2.96% 1.52%
Source: The World Bank

Published on 2 April 2017
10
MALACCA RESEARCH
INCOME STATEMENT (Malaysian Ringgit)
2012A 2013A 2014A 2015A 2016A 2017E 2018E 2019E 2020E 2021E
2/28/12 2/28/13 2/28/14 3/1/14-
3/31/2015 3/31/16 3/31/17 3/31/18 3/31/19 3/31/20 3/31/21
Total Revenue 217,036,013 279,354,884 306,852,297 326,966,057 367,531,629 413,416,669 465,749,827 525,993,070 595,097,556 674,523,419
Cost of sales (103,561,926) (124,567,022) (130,870,540) (138,827,854) (164,584,803) (184,346,458) (206,517,940) (230,600,407) (257,920,988) (288,972,302)
Gross Profit 113,474,087 154,787,862 175,981,757 188,138,203 202,946,826 229,070,211 259,231,887 295,392,664 337,176,568 385,551,117
Other operating inc. 1,389,467 4,992,854 4,238,671 4,888,018 12,549,523 4,888,018 4,888,018 4,888,018 4,888,018 4,888,018
Operating Expenses
Depreciation & amort. (6,410,980) (6,044,835) (5,420,964) (6,316,919) (6,418,435) (7,296,514) (7,776,539) (8,281,592) (8,803,207) (9,336,341)
Staff costs (21,978,277) (27,667,915) (31,975,291) (37,935,453) (37,568,921) (42,259,270) (47,608,742) (53,766,780) (60,830,610) (68,949,486)
Marketing (33,478,229) (47,964,286) (53,941,325) (73,023,915) (68,569,857) (72,674,193) (81,873,797) (92,463,910) (104,611,733) (118,573,944)
Other Expense (33,302,698) (36,185,613) (38,747,836) (44,279,900) (60,082,334) (60,082,334) (60,082,334) (60,082,334) (60,082,334) (60,082,334)
Operating profit 19,693,370 41,918,067 50,135,012 31,470,034 42,856,802 51,645,919 66,778,493 85,686,066 107,736,702 133,497,030
Nonoperating Expenses
Interest Income 0 686,709 607,978 1,398,758 1,387,139 1,571,725 1,615,082 1,691,001 1,714,315 1,763,760
Interest expense (304,388) (490,357) (689,353) (756,359) (455,534) (455,534) (455,534) (455,534) (455,534) (455,534)
Other income / (exp.) (16,453) (153,905) (50,954) 19,632,741 592,502 0 0 0 0 0
Pretax profit 19,372,529 41,960,514 50,002,683 51,745,174 44,380,909 52,762,110 67,938,041 86,921,533 108,995,483 134,805,256
Pioneer tax incentive 0 0 0 0 0 36,933,477 47,556,629 60,845,073 0 0
Taxable income 19,372,529 41,960,514 50,002,683 51,745,174 44,380,909 15,828,633 20,381,412 26,076,460 108,995,483 134,805,256
Tax income / (expense) (2,683,246) (6,684,529) (10,323,990) (5,411,071) 832,551 (3,798,872) (4,891,539) (6,258,350) (26,158,916) (32,353,261)
Net income 16,689,283 35,275,985 39,678,693 46,334,103 45,213,460 48,963,238 63,046,502 80,663,182 82,836,567 102,451,995
Less: Noncontrolling int 375,889 893,649 865,381 2,909,100 1,765,018 0 0 0 0 0
Net Income to Owners 16,313,394 34,382,336 38,813,312 43,425,003 43,448,442 48,963,238 63,046,502 80,663,182 82,836,567 102,451,995
Basic shares outstanding 300,000,000 300,000,000 300,525,968 301,008,931 298,618,618 298,234,168 297,776,559 297,235,342 296,721,556 296,134,142
Impact of dilutive securities 0 7,668,045 16,756,848 14,250,478 15,790,587 15,790,587 15,790,587 15,790,587 15,790,587 15,790,587
Diluted shares outstanding 300,000,000 307,668,045 317,282,816 315,259,409 314,409,205 314,024,755 313,567,146 313,025,929 312,512,143 311,924,729
Basic EPS 0.054 0.115 0.129 0.144 0.145 0.164 0.212 0.271 0.279 0.346
Diluted EPS 0.054 0.112 0.122 0.138 0.138 0.156 0.201 0.258 0.265 0.328
Published on 2 April 2017
11
MALACCA RESEARCH
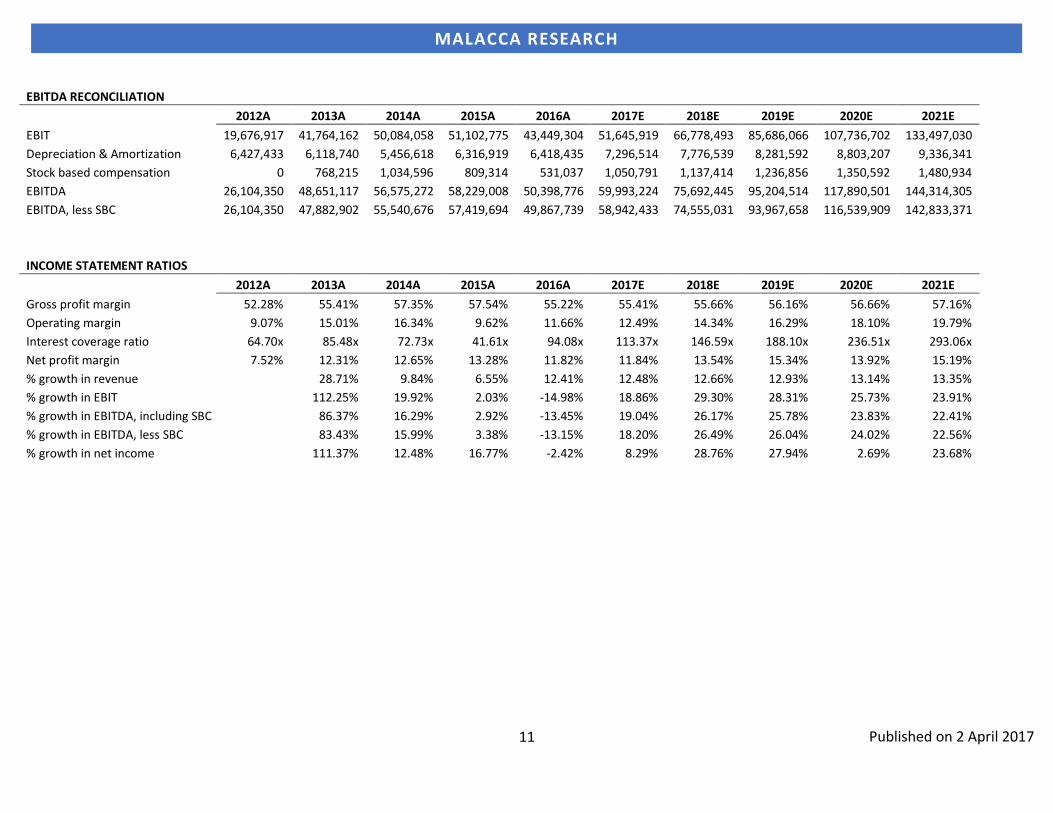
EBITDA RECONCILIATION
2012A 2013A 2014A 2015A 2016A 2017E 2018E 2019E 2020E 2021E
EBIT 19,676,917 41,764,162 50,084,058 51,102,775 43,449,304 51,645,919 66,778,493 85,686,066 107,736,702 133,497,030
Depreciation & Amortization 6,427,433 6,118,740 5,456,618 6,316,919 6,418,435 7,296,514 7,776,539 8,281,592 8,803,207 9,336,341
Stock based compensation 0 768,215 1,034,596 809,314 531,037 1,050,791 1,137,414 1,236,856 1,350,592 1,480,934
EBITDA 26,104,350 48,651,117 56,575,272 58,229,008 50,398,776 59,993,224 75,692,445 95,204,514 117,890,501 144,314,305
EBITDA, less SBC 26,104,350 47,882,902 55,540,676 57,419,694 49,867,739 58,942,433 74,555,031 93,967,658 116,539,909 142,833,371
INCOME STATEMENT RATIOS
2012A 2013A 2014A 2015A 2016A 2017E 2018E 2019E 2020E 2021E
Gross profit margin 52.28% 55.41% 57.35% 57.54% 55.22% 55.41% 55.66% 56.16% 56.66% 57.16%
Operating margin 9.07% 15.01% 16.34% 9.62% 11.66% 12.49% 14.34% 16.29% 18.10% 19.79%
Interest coverage ratio 64.70x 85.48x 72.73x 41.61x 94.08x 113.37x 146.59x 188.10x 236.51x 293.06x
Net profit margin 7.52% 12.31% 12.65% 13.28% 11.82% 11.84% 13.54% 15.34% 13.92% 15.19%
% growth in revenue 28.71% 9.84% 6.55% 12.41% 12.48% 12.66% 12.93% 13.14% 13.35%
% growth in EBIT 112.25% 19.92% 2.03% -14.98% 18.86% 29.30% 28.31% 25.73% 23.91%
% growth in EBITDA, including SBC 86.37% 16.29% 2.92% -13.45% 19.04% 26.17% 25.78% 23.83% 22.41%
% growth in EBITDA, less SBC 83.43% 15.99% 3.38% -13.15% 18.20% 26.49% 26.04% 24.02% 22.56%
% growth in net income 111.37% 12.48% 16.77% -2.42% 8.29% 28.76% 27.94% 2.69% 23.68%

Published on 2 April 2017
12
MALACCA RESEARCH
DCF VALUATION
2012A 2013A 2014A 2015A 2016A 2017E 2018E 2019E 2020E 2021E
EBITDA 26,104,350 47,882,902 55,540,676 57,419,694 49,867,739 58,942,433 74,555,031 93,967,658 116,539,909 142,833,371
Less: D&A 6,427,433 6,118,740 5,456,618 6,316,919 6,418,435 7,296,514 7,776,539 8,281,592 8,803,207 9,336,341
EBIT 19,676,917 41,764,162 50,084,058 51,102,775 43,449,304 51,645,919 66,778,493 85,686,066 107,736,702 133,497,030
Less: Taxes* 24% 24% 24% (5,411,071) 832,551 (3,798,872) (4,891,539) (6,258,350) 24% 24%
Tax-adjusted EBIT (NOPAT) 14,954,457 31,740,763 38,063,884 45,691,704 44,281,855 47,847,047 61,886,954 79,427,716 81,879,893 101,457,743
Plus: D&A 6,427,433 6,118,740 5,456,618 6,316,919 6,418,435 7,296,514 7,776,539 8,281,592 8,803,207 9,336,341
Less: Capital Expenditures 3,768,020 10,847,630 5,823,034 10,740,335 4,863,743 7,845,271 8,838,380 9,981,596 11,292,968 12,800,207
Less: Change in working capital 11,459,578 18,567,682 6,580,431 (14,264,217) 1,420,018 11,398,899 13,060,302 15,267,860 17,562,948 20,242,855
Unlevered Free Cash Flow 6,154,292 8,444,191 31,117,037 55,532,505 44,416,529 35,899,391 47,764,811 62,459,852 61,827,184 77,751,023
*raw figures account for tax incentive
Discount factor 0 1 2 3 4
Weighted Average Cost of capital 12.34% 12.34% 12.34% 12.34% 12.34%
Present value 35,899,391 42,517,638 49,490,641 43,607,648 48,814,672
Perpetuity Approach EBITDA-multiple Approach
Sum of stage 1 present value 220,329,990 Sum of stage 1 present value 220,329,990
Unlevered CF in last forecast per. 77,751,023 Terminal year EBITDA 142,833,371
Terminal growth rate 3% Terminal value EBITDA multiple 6.00x
UFCF (t+1) 80,083,553 Terminal value 857,000,227
Terminal value 857,318,431 Present value of terminal value 538,053,177
Present value of terminal value 538,252,956
Enterprise value 758,582,946 Enterprise value 758,383,168
Less: Net debt (75,346,578) Less: Net debt (75,346,578)
Equity value 833,929,524 Equity Value 833,729,746
Diluted shares 314,409,205 Diluted shares 314,409,205
Price per share 2.65 Price per share 2.65