making value chains work better for the poor
TRANSCRIPT


2
About the authors (authors in alphabetic order) Michael van den Berg Currently Michael works as a ‘Market Access for the Poor’ advisor with SNV (www.snvworld.org) in Ninh Binh province, Vietnam. He is involved in implementing a program focusing at improving the competitiveness of handicraft value chains. He has a background in finance and management consulting and has been working in Europe and South East Asia. Marije Boomsma After having worked as management consultant in the Netherlands and market development consultant in Northern Laos, Marije Boomsma started working as a free-lance consultant in Vietnam in 2005. Since then she has worked for several international organizations in Central and Northern Vietnam, amongst others on conducting market scans, selecting economic sectors with pro-poor potential, facilitating value chain analysis and developing business development services. Ivan Cucco Ivan is a PhD candidate at the Institute for International Studies, University of Technology Sydney. His current research project investigates the development of Farmers' Professional Associations in China and Vietnam. Ivan is applying network analysis and complex systems theories to study the emergence of collective action in the agricultural sector after de-collectivization. Luigi Cuna Luigi Cuna is a development economist. He has worked with IFAD, ADB and UNOPS on rural development projects dealing with private sector development, agricultural lending for micro and primary producers, agri-business and value chain development, infrastructure development and agricultural marketing. Nico Janssen Nico is working as an advisor on agro-value chain development for SNV in Son La province, North West Vietnam. Son La province is one of the poorest provinces in Vietnam with a population that is mainly composed of ethnic minority groups. He has a long experience of working with local extension service providers and strengthening their capacity to work more client and market oriented. Paule Moustier Paule Moustier is a food market specialist of CIRAD, the French research center specialized in tropical agriculture. She has been based in Vietnam for the last four years to coordinate a research group called Malica (Markets and Agriculture Linkages for Cities in Asia- (see www.malica-asia.org). In her past fifteen years experience in Africa and Asia, she has been involved in research and training in the areas of food marketing, peri-urban agriculture and institutional economics applied to commodity chain analysis. Laura Prota Laura is a PhD candidate in economics at Macquarie University in Sydney. Her PhD thesis focuses on how exchange networks can favor or restrict markets access in the process of Vietnamese rural development. She has recently conducted a study, funded by Market for Poor project, looking at how land, labor and commodity exchange networks impact the poor in three fast growing provinces of Vietnam – An Giang, Tra Vinh and Ha Tay. Laura has been working on different studies and projects related to the Vietnamese agricultural sector since 2003, when she first came to Vietnam as intern for Agrifood Consulting International. Tim Purcell

3
Tim is a director of Agrifood Consulting International and currently works as the Country Manager for ACI in Cambodia. He has carried out numerous value chain studies for various donors and clients, including the World Bank, Asian Development Bank, ItalCoop, and FAO. Dominic Smith Dominic Smith is a director of Agrifood Consulting International (www.agrifoodconsulting.com), and has 15 yeas of experience in development work in Asia, including Philippines, Indonesia, China and Vietnam. Dominic is currently working as the Value Chain Specialist for the Making Markets Work Better for the Poor Project (www.markets4poor.org) Siebe Van Wijk Siebe is a managing partner of Fresh Studio Innovations Asia.Fresh Studio is a consulting, research and development (R&D) company offering expertise and creativity for all processes in fresh produce value chains (www.freshstudio.biz). Fresh Studio has offices in the Philippines, Vietnam and the Netherlands. Siebe has been working the past ten years in the horticulture sector in East Africa and South East Asia focusing on linking smallholders to markets.

4
Introduction Acknowledgements The first draft of the theoretical section of this toolbook was initially developed by Luigi Cuna and Dominic Smith. Subsequent revisions of the toolbook were undertaken by a working group of authors whose names appear on the previous page. The working group of authors would like to gratefully acknowledge the support of the many people who contributed to the conception and preparation of this toolbook. These include Alan Johnson from the Making Markets Work Better for the Poor Project, Thomas Finkel and the staff of the GTZ-SME promotion project, Kees Van Der Ree, Bas Rozemuller and Inrgid Hultqvist of the ILO-PRISED project. Purpose of the Toolbook The toolbook is designed as a concise document aimed to provide value chain practitioners with an easy to follow set of tools for value chain analysis, focused on poverty reduction. Whilst there are a number of handbooks on Value Chain analysis already in existence the aim of this toolbook is to bridge the gap between value chain analysis and pro-poor development. Hence the tools that are presented here are similar to those presented in other handbooks, but the main special feature of the toolbook is that within each of the tools there is a clear focus on how to apply the tool in order to analyze the impact of the value chain from the point of view of the poor. The toolbook is organized in 2 main sections. The first section gives a theoretic background to value chains and also explains the pro-poor entry points for Value Chain analysis described in this toolbook. The second section contains a set of 8 value chain analysis tools, the first four of which are considered to be “Core Tools” that should be undertaken to form a minimum pro-poor value chain analysis. The next 4 tools are” advanced tools” which can be undertaken in order to provide a more comprehensive picture of some pro-poor dimensions of the value chain. Table 1 shows the various dimensions of pro-poor value chain analysis and the tools that could be utilized to analyze those dimensions. The greater the number of ticks, the more relevant the tool is for analyzing that particular dimension.

Table 1: Tools for analyzing various dimensions of the value chain CORE TOOLS ADVANCED TOOLS Tool 1 Tool 2 Tool 3 Tool 4 Tool 5 Tool 6 Tool 7 Tool 8 Dimension Value Chain
IdentificationMapping Margin/
Cost T+K+U Income
Distribution Employment Distribution
Governance and services
Linkages
Participation of the poor
√ √ √ √√√ √√√ √ √√
Employment + working environment
√ √ √ √√ √ √√√ √
Wages + Income
√ √ √√ √√√ √ √
Access to assets
√ √ √ √√√ √
Access to info + tech
√ √ √ √√√ √√√ √√
Access to infrastructure
√ √ √ √ √√
Access to services
√ √ √√ √√
Security and vulnerability
√ √ √ √ √√ √√√ √√
Empowerment √ √ √√ √√√

6
PART ONE – CONCEPTS

7
1. Definition The idea of value chain is quite intuitive. Value chain refers to the full range of activities that are required to bring a product (or a service) from conception, through the different phases of production, to delivery to final consumers and disposal after use (Kaplinsky 1999, pg. 121; Kaplinsky and Morris 2001, pg. 4). Further, a value chain exists when all the stakeholders in the chain operate in the way to maximize the generation of value along the chain. This definition can be interpreted in a narrow or in a broad sense. In the narrow meaning, a value chain includes the range of activities performed within a firm to produce a certain output. This might include: the conception and design stage, the process of acquisition of input, the production, the marketing and distribution activities, the performance of after-sale services, etc. All these activities constitute the ‘chain’ which link producers to consumers. On the other hand, each activity adds ‘value’ to the final product. For example, the availability of post-sale assistance and repair services for a mobile phone company increases the overall value of the product. In other words, a consumer may be willing to pay a higher price for a mobile phone which has a good after-sale service. The same holds for an innovative design or for a highly controlled production. For agribusiness enterprises, an appropriate system of storing fresh raw materials (e.g. fruits) positively impact on the quality of the final product and, consequently, increases its value. The ‘broad’ approach to value chain looks at the complex range of activities implemented by various actors (primary producers, processors, traders, service providers, etc) to bring a raw material to the retail of the final product. The ‘broad’ value chain starts from the production system of the raw materials and will move along the linkages with other enterprises engaged in trading, assembling, processing, etc. The broad approach does not only look at the activities implemented by a single enterprise. Rather, it includes all its backward and forward linkages, until the level in which the raw material is produced will be linked to the final consumers. In the remaining part of this handbook, the label of ‘value chain’ will be exclusively utilized to refer to this broad definition. The concept of value chain encompasses the issues of organization and coordination, the strategies and the power relationship of the different actors in the chain. These and other relevant issues will be discussed in this handbook. For now it is important to understand that conducting a value chain analysis requires a thorough approach on what is going on among the actors in a chain, on what keeps these actors together, on what information is shared, on how the relationship among actors is evolving, etc. In addition, the idea of value chain is associated with the concept of governance which is of key importance for those researchers interested in the social or environmental facets of value chain analysis. The establishment (or the evolution) of value chains may create pressure on the natural resources (such as water, land) which may produces degradation of the soil, loss of biodiversity or pollution. Additionally, the development of value chain might affect social ties and traditional norms, for example because the power relationships within households or communities are modified or because vulnerable or poorest population groups are negatively affected by the operation of value chain participants. These concerns are very relevant for agricultural value chains. This is because agricultural value chains crucially depend on the utilization of environmental resources. Also, the agricultural sector is often characterized by the prevalence of traditional social norms. Finally, due to the high incidence of the poor in the agricultural sector, the value chain framework can be used to draw conclusions on the participation of the poor and the potential impact of value chain development on poverty reduction.

8
2. Value Chain main concepts This part provides an overview of the main concepts of value chain from an academic perspective. First of all, this serves to clarify the concept; second, the concise literature review presented here is used to introduce some of the main issues related to value chain analysis. As conceptual categorization, three main research streams in the value chain literature are distinguished: (i) the filière approach, (ii) the conceptual framework elaborated by Porter (1985) and (iii) the global approach proposed by Kaplinsky (1999), Gereffi (1994; 1999; 2003) and Gereffi, and Korzeniewicz (1994). Filière The ‘filière’ (filière means thread, chain) approach includes various school of thoughts and research traditions. Initially, the approach was used to analyze the agricultural system of developing countries under the French colonial system. The analysis mainly served as a tool to study the ways in which the agricultural production systems (especially rubber, cotton, coffee and cocoa) were organized in the context of developing countries. In this contexts, the filière framework paid special attention on how local production systems are linked to processing industry, trade, export and final consumption. The concept of filière has therefore always encompassed a strong empirical perspective which was used to map the flow of commodities and to identify agents and activities. The rationale of the filière is quite similar to the broader concept of value chain presented above. However, the filière mainly focused on issues of physical and quantitative technical relationships, summarized in flow-charts of commodities and mapping of transformation relationship. There are two strands of filière approach which share some insights with value chain analysis: - the economic and financial evaluation of filières (presented in Duruflé, Fabre and Yung, 1988, and used in a number of French-funded development projects in the 1980s and 1990s), focuses on income generation and distribution in the commodity chain, and disaggregates costs and incomes between local and internationally-traded components to analyse the spillovers of the chain on the national economy and its contribution to GDP along the “effect method” (“méthode des effets”) - the strategy-focused analysis of filière, especially used in the university of Paris-Nanterre, some research institutes e.g. CIRAD and INRA and NGOs e.g. IRAM working on agricultural development, researching in a systemic way the interplay of objectives, constraints and results of each type of stakeholders in the chain; individual and collective strategies are analysed, as well as patterns of regulations, for which Hugon (1985) defines four main types as regards commodity chains in Africa: domestic regulation, market regulation, state regulation and international agri-business regulation. Moustier and Leplaideur (1989) have provided an analytical framework on the organization of the commodity chains (mapping, individual and collective strategies, and its performance in terms of price and income generation, taking account African food farmers’ and traders specialization versus diversification strategies. Porter’s Framework The second research stream refers to the work on Porter (1985) on competitive advantages. Porter has utilized the framework of value chains to assess how a firm should position itself in the market and in the relationship with suppliers, buyers and competitors. The idea of competitive advantage of an enterprise can be summarized as follows: how can a firm provide to customers a certain good (or service) of equivalent value compared to competitors but at lower cost (strategy of cost reduction)? Alternatively, how an enterprise can produce a good such as customers are willing to pay a higher price for getting such product (strategy of differentiation)?

9
In this context, the concept of value chain is utilized as a conceptual framework that enterprises can use to detect their source (actual or potential) of competitive advantage. In particular, Porter argued that the sources of competitive advantage cannot be detected by looking at the firm as a whole. Rather, the firm should be disaggregated in a series of activities and competitive advantage found into one (or more) of such activities. Porter distinguishes between primary activities, which directly contribute to add value to the production of the good (or services) and support activities, which instead have an indirect effect on the final value of the product. In the framework of Porter, the concept of value chain does not coincide with the idea of physical transformation. Porter introduced the idea that a firm’s competitiveness does not exclusively relate to the production process. Enterprise competitiveness can be analyzed by looking at the value chain which includes product design, input procurement, logistics, outbound logistics, marketing, sales, after-sale and support services such as strategic planning, the management of human resources management, research activities, etc. In the framework of Porter, the concept of value chain has therefore a strict business application. Consequently, value chain analysis mainly aims at supporting management decision and executive strategies. For example, a value chain analysis of a supermarket in Europe can point out that the competitive advantage of such supermarket against competitors is the availability of exotic vegetables. Detecting the source of competitive advantage is valuable information for business purposes. Following on such finding, the supermarket enterprise is likely to increase the strengthening of the relationship with producers of exotic fruits and the advertisement campaign will pay special attention to such issues.
Figure 1 Porter’s Value Chain An alternative way of approaching to the search of competitive advantage is based on the concept of a ‘value system’. The idea is the following: instead of limiting the analysis of competitive advantage to a single firm, one can think at the firm activities as a part of a larger stream of activities, which Porter terms ‘the value system’. A value system includes the activities implemented by all the firms involved in the production of a good or service, starting from basic row materials to those engaged in the delivery to the final consumers. The concept of value system is therefore broader compared to the one of ‘enterprise value chain’ and resemble what this handbook refers to when we deal with value chain (broader approach). However, it is important to point out that in the framework of Porter, the concept of value system is mostly a tool for assisting executive management in strategic decisions.

10
Figure 2 The Value System The Global Approach Most recently, the concept of value chains has been applied to the analysis of globalization (Gereffi and Korzeniewicz 1994; Kaplinsky 1999). This literature utilized the framework of value chain to examine the ways in which firms and countries are globally integrated and to assess the determinants of global income distribution. Kaplinsky and Morris (2001) observe that in the course of globalization, there has been a perception (in most of the cases well-justified) that the gap in incomes within and between countries has increased. They argue that value chain analysis can help to explain this process, particularly in a dynamic perspective. First, by mapping the range of activities along a chain, a value chain analysis consents to decompose total value chain earnings into the rewards that are achieved by different parties in the chain. This method will be introduced in the second part of this handbook. For understanding the distribution of earnings, value chain analysis is the only way of getting such information. Other ways of viewing global distributional patterns provide only partial insights into these phenomena. For example, trade statistics only provide data on aggregate, gross returns rather than on net earnings, and branch-specific analyses (agriculture, industry, services) only capture part of the story. Secondly, a value chain analysis can shed light on how firms, regions and countries are linked to the global economy. This mode of insertion will determine to a large extent the distributional outcomes of global production systems and the capacity which individual producers have to upgrade their operations and thus to launch themselves onto a path of sustainable income growth. In the value chain framework, the international trade relations are considered part of networks of producers, exporters, importers, and retailers, whereby knowledge and relationships are developed to gain access to markets and suppliers. In this context, the success of developing countries and market actors in developing country lies in the ability of accessing these networks.
3. A Pro-Poor Entry Point into Value Chain Analysis As shown in section 2 above, value chain analysis is reasonably flexible and the value chain could be analyzed from the point of view of any one of a large number of participants in the chain. Value chain analysis as presented above can form the basis for the formulation of projects and programs to provide support to a value chain or set of value chains in order to achieve a desired development outcome. Examples of desired development outcomes could include: increasing the level of exports, generating maximum employment, benefiting a particular group in society, utilizing locally produced raw materials or concentrating development benefits in underdeveloped or disadvantaged regions of a country. The entry point, and the concentration of the value chain analysis is directly related to the desired development outcome from supporting the value chain. The entry point and orientation of value chain analysis in this Toolbook is Making Value Chains Work Better for the Poor. Hence the tools used in the analysis are oriented toward analyzing the
Supplier's Value Chain
Firm’s Value Chain
Buyer’s Value Chain

11
value chain from the point of view of the poor. The ultimate objective of improving value chains for the poor is two-fold. Firstly, to increase the total amount and value of products that the poor sell in the value chain. This results in higher absolute incomes for the poor as well as for the other actors in the value chain. This is shown in Figure 3 as T=1, where the whole pie grows. The second objective is to sustain the share of the poor in the sector or increase the margins per product, so that the poor do not only gain more absolute income but also relative income compared to the other actors in the value chain. In this case also the piece of the pie hold by the poor grows and the poor get less poor compared to the rest of the actors in the chain! This is shown as T=2 and can be defined as Pro-poor Growth.
Figure 3: Pro-poor growth
The value chain approach is mainly a descriptive tool to look at the interactions between different actors. As a descriptive tool it has various advantages in so far it forces the analyst at considering both the micro and macro aspects involved in the production and exchange activities. The commodity-based analysis can provide better insights into the organizational structures and strategies of different actors and an understanding of economic processes which are often studied only at the global level (often ignoring local differentiation of processes) or at the national/local levels (often downplaying the larger forces that shape socio-economic change and policy making). Kaplinsky and Morris (2001) stress that there is no “correct” way to conduct a value-chain analysis; rather, the approach taken fundamentally rests upon the research question that is being answered. Nonetheless, four aspects of value-chain analysis as applied to agriculture are particularly noteworthy. Firstly, at its most basic level, a value-chain analysis systematically maps the actors participating in the production, distribution, marketing, and sales of a particular product (or products). This mapping assesses the characteristics of actors, profit and cost structures, flows of goods throughout the chain, employment characteristics, and the destination and volumes of domestic and foreign sales (Kaplinsky and Morris 2001). Such details can be gathered from a combination of primary survey work, focus groups, PRAs, informal interviews, and secondary data. Second, value-chain analysis can play a key role in identifying the distribution of benefits of actors in the chain. That is, through the analysis of margins and profits within the chain, one can determine who benefits from participation in the chain and which actors could benefit from increased support or organization. This is particularly important in the context of developing countries (and agriculture in particular), given concerns that the poor in particular are vulnerable to the process of globalization (Kaplinsky and Morris 2001). One can supplement this analysis by
T = 1 Economic growth: pie grows
T = 2 Poverty reduction: piece stays same or grows
Poor
Sector X Sector X
Poor
Sector X
Poor
T = 0

12
determining the nature of participation within the chain to understand the characteristics of its participants. Third, value-chain analysis can be used to examine the role of upgrading within the chain. Upgrading can involve improvements in quality and product design that enable producers to gain higher-value or through diversification in the product lines served. An analysis of the upgrading process includes an assessment of the profitability of actors within the chain as well as information on constraints that are currently present. Governance issues play a key role in defining how such upgrading occurs. In addition, the structure of regulations, entry barriers, trade restrictions, and standards can further shape and influence the environment in which upgrading can take place. Finally, value-chain analysis can highlights the role of governance in the value-chain. Governance in a value-chain refers the structure of relationships and coordination mechanisms that exist between actors in the value-chain. Governance is important from a policy perspective by identifying the institutional arrangements that may need to be targeted to improve capabilities in the value-chain, remedy distributional distortions, and increase value-added in the sector. Figure 4 illustrates the methodology used in value-chain analysis. At the heart of the analysis is the mapping of sectors and key linkages. The value-added of the value-chain approach, however, comes from assessing these intra- and inter-actor linkages through the lens of issues of governance, upgrading, and distributional considerations. By systematically understanding these linkages within a network, one can better prescribe policy recommendations and, moreover, further understand their reverberations throughout the chain.
A hypothetical value-chain in agriculture
-Governance-Upgrading-Distributional Issues
-Governance-Upgrading-Distributional Issues
Retailers Traders
Foreign Retailers
Foreign Distributors
Foreign Traders
Exporters End-users
Processors
Assemblers/Traders
Farmers/Producers
Governance Upgrading
Distributional Issues Source: (Rich 2004)
Figure 4 A Schematic of a Value-Chain Analysis
Value chains are complex, and particularly in the middle tiers, individual firms may feed into a variety of chains. Which chain – or chains – is/are the subject of enquiry therefore very much depends on the point of entry for the research inquiry. Table 2 lists some possible points of entry. In each case, the point of entry will define which links and which activities in the chain are the subject of special enquiry. For example, if the focal point of the enquiry is in the design and branding activities in the chain, then the point of entry might be on design houses, or the branding function in key global marketing companies. This will require the research to go backwards into a

13
number of value chains which feed into a common brand name (for example, the different suppliers to Nestle). At the other end of the scale, a concern with small and medium sized firms, which feed into a number of value chains, might require the research to focus on final markets, buyers and their buyers in a number of sectors, and on a variety of input providers. The key entry point that will be utilized in this handbook is the impact of the development and operation of value chains on the poor. This entry point will be incorporated into each of the tools described in the handbook. Whilst the tools contained in the handbook are essentially a standard set of tools for Value Chain analysis, the main distinguishing point about the tools presented in the next section are that they are explicitly slanted toward the analysis of how the value chain is “working for the poor”.

14
Table 2 Some Examples of Different Points of Entry into Value Chain Research
Primary area of research
interest Point of entry What to map Examples
The global distribution of income
The final consumer (and recycling) in a sector
Backwards down whole chain to retailers, buyers and producers
In furniture, begin with groups of customers of department and specialist stores in rich countries
Role of retailers Supermarkets or retail chains
Forwards to type of customer, backwards though buyers, producers and their suppliers
In food, begin with supermarkets
The role of independent buyers
Independent buyers, wholesalers
Backwards to producers and their suppliers in same chain, forwards to retailers
In shoes, begin with specialist buyers, in fruit and vegetables with category buyers
Design
Independent design houses, advertising agencies or large firms with global brands
Forwards to retailers in various final markets, backwards to variety of producers and their suppliers
In clothing, begin with Prada and the GAP in the volume markets and to Gucci in Haute Couture markets
Role of key producers
Large OEMs assembling final products
Forwards to retailing, backwards to suppliers and their suppliers
In autos, Ford; in consumer electronics, Sony
First tier suppliers
Large firms providing subassemblies to OEMs
Forwards to OEMs and their customers, perhaps in more than one sector; backwards to suppliers and their suppliers
In autos, Magna and Delphi; in computers, with motherboard and monitor manufacturers
2nd and 3rd tier suppliers Generally small firms
Forwards to customers in a variety of sectors, backwards to suppliers and their suppliers
In food, to firms printing packaging materials; in banking to providers of software modules
Commodity producers Generally large firms
Forwards to producers, buyers and final markets and backwards to machinery and input suppliers
In copper, to major buyers at London Metal Exchange and to suppliers to the telecoms sector
Agricultural producers Farms
Forwards to processors, buyers and their customers, backwards to input suppliers
Fresh vegetables to salad packers and category buyers in final markets
Small firms and farms
Small farms, industrial SMEs
Buyers in a range of value chains, input suppliers
Handicraft suppliers to exporters, small farms to processing plants
Informal economy producers and traders
Home based workers, street traders
Forwards to processors, assemblers or third party organizers/distributors, backwards to retailers
Outsourcing in clothing and shoes, recycling cardboard cartons to mills, street based tourist handicrafts
Gender, age and ethnicity
Female labor Use of female labor throughout value chain
In clothing, women in cotton farms, factories, export agents, design houses, advertising agencies, retail stores
Source: (Kaplinsky and Morris 2001)
15
PART TWO – VALUE CHAIN TOOLS

16
Tool 1 – Prioritising Value Chains for Analysis
Objectives Prior to undertaking a value chain analysis a decision needs to be made on which sub-sectors, products or commodities should be prioritised for analysis. As resources for undertaking analyses will invariably be limited, a method needs to be devised to select a limited number value chains to be analysed amongst the numerous choices available.
Key Questions What are the key criteria on which to base the selection of value chains to be analysed? What are the potential value chains that could be analysed? After applying the selection criteria, what are the value chains that are most appropriate to analyse?
Steps The prioritising process follows 4 main steps that are common to processes of making allocation choices under a situation of scarce resources. The four steps involve determining a set of criteria to be used to prioritise the value chains, weighting the relative importance of those criteria, determining the potential sub-sectors, products or commodities that could be considered and then constructing a matrix to enable ranking of the products according to the criteria. The final priority can be determined on the basis of the ranking obtained. Step 1: Determine criteria Value chain analysis starts with the selection of a value chain. The decision about which value chain to analyse can depend of the criteria utilised to select the value chain. The first step to make the prioritisation of value chains is to decide what criteria to utilise to make the ranking. The choice of criteria is strongly related to the Entry Point described in the previous section. If the entry point is the potential of the commodity to generate foreign exchange earnings (for example), then one of the key criteria that could be utilised would be “potential for export”. In another example, if a main point of entry was rehabilitation of desertified areas, then a key criteria would be that the “crop produced had positive environmental benefits for arid areas”. As the key entry point of the value chain analyses proposed in this handbook is poverty alleviation and achieving pro-poor outcomes, the criteria selected would reflect this entry point. Some potential criteria that are suitable for potentially achieving pro-poor outcomes are listed below: • Present integration of the poor in the market (what are they producing, selling, employment) • Growth potential of certain products/activities • Possibility for scaling up • Potential for leveraging public investment with private investment • Potential of the product/activity for poverty reduction • Potential for Labour Intensive Technology • Low barriers to entry for the poor (capital, knowledge) • Low risk • Involves a large number of people • Poverty incidence and/or absolute poverty figures • Social inclusion • Environmental sustainability • Within Framework of National and Regional Strategies The selection of the stakeholders with whom the selection and the ranking is done will have a large influence on the outcome of the exercise. We would certainly recommend to have a broad spectrum of stakeholders involved which include local policy and decision makers, farmers, private sector actors, service providers, development organisations and community representation groups

17
Take Note
These are not the only criteria that could give a pro-poor outcome. The criteria utilized will vary according to the local conditions and situation. The list above should be viewed as a starting point for deciding on what criteria could be utilized.
Step 2: Weighting of Criteria It is unlikely that all of the criteria selected will be considered to be of equal importance in the decision of what value chains to analyze. Some criteria will be considered to have a higher level of importance in the decision making process and therefore should have a greater influence on the ranking of value chains. The way to achieve this is through a system of weighting, where different criteria are assigned a different numeric value to be utilized during the ranking process. The differing numeric values assigned reflect the relative importance of the criteria. Weightings are commonly assigned in two main ways:
(a) simple numeric assignment – for example, 1, 2, 3 or 4 - where the relative importance of criteria is in direct proportion to the numeric weighting. This means that a criteria with a weighting of 4 is considered to be twice as important as a criteria with a weighting of 2, and 4 times as important as a weighting of 1.
(b) Proportional assignment, where all of the criteria utilised are judged to have a combined weighting of 100 percent, and the relative importance of each criteria is reflected in the proportion of the total weighting that is assigned to that criteria. This means that (for example) if there are 3 criteria, then they could be weighted as Criteria 1 (50%); Criteria 2 (30%) and Criteria 3 (20%).
Take Note
Regardless of which weighting system is utilised, a general rule of thumb is that the more pro-poor you wish the selection of value chain to be, the higher the weighting that should be given to the criteria that emphasize pro-poor characteristics.
Step 3: List potential products/activities Once the criteria for selection of value chain for analysis have been identified and weighted, the next step is to determine a list of all the potential value chains/products/commodities that could be considered in the geographic area under consideration. This list could be developed in a participatory manner with stakeholders. The stakeholders could be the same as the stakeholders who developed the criteria in Step 1, or could be different. The value chains identified are usually based on products that are already produced in the area, products which it is technically feasible to produce in the area, products for which there is judged to be a good market (being it a local, regional, national or international market) etc. Box 1: Example of potential value chain listing in Son La, Vietnam
The range of value chains identified could be quite broad. In a value chain exercise conducted by the SNV Market Access for the Poor Program in Son La Province, Viet Nam identified the following value chains as having potential: Mushroom Longan Mong apple Local rice Pumpkin Village pig Bamboo shoots Medicinal plants Honey Handicrafts Maize
18
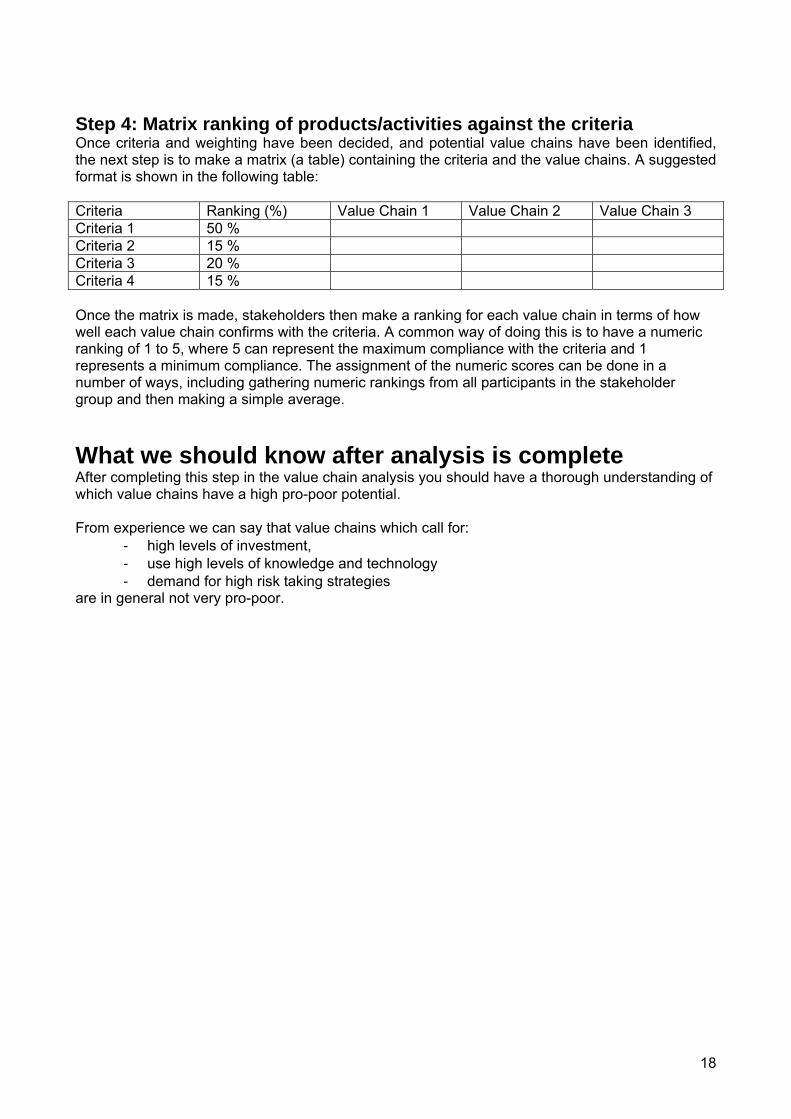
Step 4: Matrix ranking of products/activities against the criteria Once criteria and weighting have been decided, and potential value chains have been identified, the next step is to make a matrix (a table) containing the criteria and the value chains. A suggested format is shown in the following table: Criteria Ranking (%) Value Chain 1 Value Chain 2 Value Chain 3 Criteria 1 50 % Criteria 2 15 % Criteria 3 20 % Criteria 4 15 % Once the matrix is made, stakeholders then make a ranking for each value chain in terms of how well each value chain confirms with the criteria. A common way of doing this is to have a numeric ranking of 1 to 5, where 5 can represent the maximum compliance with the criteria and 1 represents a minimum compliance. The assignment of the numeric scores can be done in a number of ways, including gathering numeric rankings from all participants in the stakeholder group and then making a simple average.
What we should know after analysis is complete After completing this step in the value chain analysis you should have a thorough understanding of which value chains have a high pro-poor potential. From experience we can say that value chains which call for:
- high levels of investment, - use high levels of knowledge and technology - demand for high risk taking strategies
are in general not very pro-poor.

19
Box 2:Value Chain Selection in Thailand by the National Economic Social Development Board
A participatory priority setting exercise was carried out with NESDB staff and the NEED (North-East Economic Development Project) steering committee. The 6 commodities; rice, cassava, rubber, beef, silk, and broilers were evaluated against 13 criteria; 5 criteria capturing the dimension of poverty alleviation and sustainability against the backdrop of the national strategies, and 8 criteria capturing the dimension of the value chain structure. Once the criteria were defined by the Steering Committee, the commodities were ranked against each criterion; a score of 1 meaning that the particular commodity best met that criterion, and a score of 5 meaning that the commodity did not meet that criterion (ranked against all the other commodities). The evaluation of each criterion was done through consensus of the steering committee. Once each criterion was evaluated, a simple average score was calculated, and the commodities ranked accordingly. Commodities with a lower score were ranked higher, see the table below. The results of the priority setting exercise indicated that Silk and Rice were the two commodities most appropriate for study under the pilot project.
Table 3 Participatory Commodity Priority Setting Exercise Results Type of Impact Rice Cassava Rubber Beef Silk Broilers
Availability of Natural Resources, Sustainable Development
3 6 5 2 1 4
Within Framework of National and Regional Strategies (Clusters, OTOP etc.)
3 5 2 6 1 4
Potential for Labor Intensive Technology 3 4 2 6 1 5
Number of People Involved in Industry (Poor People) 1 2 6 5 3 4
Future Potential 4 5 1 6 2 3
Poverty and Sustainability
Sub-Total Poverty and Sustainability 2.8 4.4 3.2 5 1.6 4
Extent of Value Adding Potential (Profitability, Stability)
4 5 2 6 1 3
Number of Different Products Produced 5 2 3 6 1 4
Length of Marketing Chain, Number of Intermediaries 6 2 3 4 1 5
Maturity of Industry in Region 2 3 6 5 1 4 Marketing Potential 3 5 4 6 1 2 Lack of Previous Research 6 3 2 1 4 5 Data Availability 1 3 6 5 4 2 Potential for “Lessons Learned” / Replication of Mechanisms
2 4 5 6 1 3
Structure of Chain
Sub-Total Chain Structure 3.6 3.4 3.9 4.9 1.8 3.5 Ranking 3.3 3.8 3.6 4.9 1.7 3.7

20
Tool 2 – Mapping the value chain
Introduction To understand the value chain we want to analyse, we can use models, tables, figures, diagrams and the likes to capture and visualize the essence. ‘One picture says more than a thousand words’ is what we aim at. Making a value chain map is one way of making what we see and encounter more comprehensible. This chapter provides the tools and examples on how to capture the different dimensions of a value chain.
Objectives Mapping the value chain has three main objectives: • Visualise networks in order to get a better understanding of connections between actors and
processes in a value chain. • Demonstrate interdependency between actors and processes in the value chain • Create awareness of stakeholders to look beyond their own involvement in the value chain.
Key Questions There is no such thing as a comprehensive, all-encompassing value chain map. Deciding what to map depends for instance on your available resources, the scope and objective of your research and the mandate of your organization. A value chain, not unlike reality, has many dimensions: the actual product flow, the number of actors, the accrued value etc. It is therefore crucial to choose which dimensions you wish to map. The following questions can guide what dimensions to map: • What are the different (core) processes in the value chain? • Who are the actors involved in these processes and what do they actually do? • What are the flows of product, information and knowledge in the value chain? • What is the volume of products, the number of actors, jobs? • Where does the product (or service) originate from and where does it go? • How does the value change throughout the chain? • What types of relationships and linkages exist? • What types of (business) services are feeding into the chain? These questions will be used to provide the basis for the steps described this chapter. Take Note
Many topics covered in this chapter will also be dealt with in other chapters in this book. The difference lies in the depth of the analysis. This chapter will mainly provide examples of how to map and visualize value chains; the following chapters will give tools on how to measure or analyze the dimensions covered here.
In all dimensions that need to be mapped, the practitioner should look at the position and role of the poor. This is not an additional dimension, that can be mapped separately. It is an intrinsic part of all other dimensions. It will be dealt with as such in this chapter.
Steps Step 1: Mapping the core processes in the value chain The first question that needs to be asked in any value chain analysis is as follows: What are the different (core) processes in the value chain?

21
The first step is to find the core processes in your value chain. As a rule of thumb, try to distinguish maximum 6-7 major processes that the raw material goes through before it reaches the final consumption stage. These core processes will be different, depending on the characteristics of the chain you are mapping: industrial products undergo different phases than agro products or services.
Box 3: Example of mapping core processes Source: Sedge handicrafts in Ninh Binh, SNV 2005 Take Note
Vertical or horizontal? A flow can be visualized sideways, up- or downwards. Depending on the context, a choice needs to be made. There is no right or wrong. Regardless of which choice is made, be consistent throughout the analysis. In this Chapter we will depict value chains horizontally.
Step 2: Identifying and mapping the main actors involved in these processes Now that the main processes are mapped, we can move on to the actors. The second main question deals with this step: Who are the actors involved in these processes and what do they actually do? How to distinguish between actors depends on the level of sophistication the mapping exercise is trying to reach. The most straightforward distinction would be to categorize actors according to their main occupation, for instance, collectors are involved in collection, producers are the ones that produce. This would be a starting point, but will not give sufficient information. An addition would be to categorize according to different typologies, such as: • Legal status or ownership (government, registered enterprise, cooperative, household, etc.) • Size or scale (number of people involved, micro-small-medium sized enterprise, etc.) • Poverty ranking • Location (commune, district, province, country, etc.) Warning
In many value chains, especially in small or weaker markets, there is no such thing as specialization. One actor will take on different roles. For instance, a rice miller will also collect rice and act as input provider. Try to find out what the main occupation of this actor is and categorize accordingly.
One of the main products in Ninh Binh province, Vietnam is handicrafts made of sedge or seagrass. Typically, boxes or baskets are produced for export markets. As an example, the core processes in the basket export chain are as follows. Input
provision Cultivation Collection Production Export Import
Retail

22
Box 4: Example of Mapping actors
Source: A. Springer-Heinze, GTZ,2005 The result of the mapping so far is still quite general. In order to find out more, we try and break down the core processes into specific activities, as undertaken by the different actors that we have distinguished. Every value chain has its own core processes and its own specific activities. Again, to what extent you want to break down specific activities depends on your own judgement. Eventually, it should result in an understanding of where there are gaps or overlapping activities, if there is a potential for upgrading, or simply a better understanding of reality.
Box 5: Example of mapping of specific activities from core processes Source: Sedge handicrafts in Ninh Binh, SNV 2005 The following example, rice export from Cambodia, shows that some core processes can be broken down in many different activities as undertaken by different actors. Source: Sedge handicrafts in Ninh Binh, SNV 2005 What we see in this example is that the specific activities are not yet broken down completely. For instance, the Export Process entails more than only transporting. In this case, it was not regarded as crucial to break down the export process in a more detailed way. Take Note
Breaking down core processes into specific activities is useful when we turn to analyzing costs, revenues and margins (see Chapter XX). The activities can be seen as the cost- or profit centres of actors.
Step 3: Mapping flows of products, information and knowledge
An example about mapping actors comes from the Mexican value chain of consumption honey from the Calakmul region to the domestic market. This map distinguishes actors, based on legal status and scale.
IndividualBeekeepers
Collectors
Beekeeperassociations
Cooperatives
Inter-mediaries Honey
traders
Whole-salers
Retailers
Consu-mers
SpecificInputs
Consumption
Production Collection Intermediarytrade
Wholesaleand retailmarketing
IndividualBeekeepers
Collectors
Beekeeperassociations
Cooperatives
Inter-mediaries Honey
traders
Whole-salers
Retailers
Consu-mers
IndividualBeekeepers
Collectors
Beekeeperassociations
Cooperatives
Inter-mediaries Honey
traders
Whole-salers
Retailers
Consu-mers
SpecificInputs
Consumption
Production Collection Intermediarytrade
Wholesaleand retailmarketing
SpecificInputs
Consumption
Production Collection Intermediarytrade
Wholesaleand retailmarketing
SpecificInputs
Consumption
Production Collection Intermediarytrade
Wholesaleand retailmarketing
We turn again to the example of sedge handicraft in Vietnam.
Input provision
Cultivation Collection Production Export Import
Retail
Provide: Seedlings Fertilizer Pesticides
Grow Harvest Cut Dry Split
Collect Categorize Store Transport
Categorize Dry Weave Mold prevention Store
Collect Quality control Store Transport
Quality control Store Transport
Store Sell

23
The processes, actors and specific activities are mapped. The reason for the existence of a value chain is that goods, services or information is passed on between different actors. To find out more about this topic is the aim of the following core question: What are the flows of products, information and knowledge in the value chain? Different flows go through every value chain. These flows can be both tangible and intangible: products, goods, money, information, services etc. Finding out what flows there are is one of the main objectives of any value chain analysis. Mapping these flows can be quite straightforward when it comes to products: you simply follow the stages that the tangible product goes through, from raw material to final product. This is especially relevant when we try to find out what components are used to come to a final product. Other - intangible – flows, like information and knowledge, might be more complicated to capture in a visual map. Be aware that these flows are often going both directions, for instance: a trader tells a farmer about product requirements; a farmer gives the trader information about product availability. In Chapter 4 (Knowledge, Technology and Upgrading), tools are provided that help to track down what kind of knowledge or information flows through a value chain. The role and position of the poor is crucial in this part of the mapping: do the poor participate in the exchange of knowledge?
Box 6 Example of mapping knowledge
Source: GTZ RDMA, Soybean markets in northern Laos, 2005 Step 4: Mapping the volume of products, numbers of actors and jobs Some dimensions in value chain mapping can be quantified. Besides the monetary dimension, other dimensions can also be captured in numbers: What is the volume of products, the number actors, jobs?
One of the cashcrops cultivated in Northern Laos is soybean. Mainly, these soybeans are exported to China to be processed into animal feed or for cooking oil. One of the crucial issues, as mentioned by all actors throughout the value chain, was the inconsistent quality of the soybeans. Mapping the knowledge proved to be a useful tool in this case. After having interviewed farmers, collectors and intermediairy traders (all based in Laos), it became clear that the involved actors had conflicting views on what quality requirements there actually were. The problem was that no one really knew what ‘quality’ meant. Another, related issue, was that the actual buyers (Chinese processing companies) had never met any of the actors on the Lao side of the border. The map looked as follows: What are the quality requirements for ‘good’ soybeans? Farmer Collector Intermediary
Trader
- Color: black-grey - Size: unknown, but round shape - Oil content: ?
- Color: black - Size: Unknown, round shape - Oil content: ?
- Color: black - Size: even - Oil content: measured by Chinese trader, but how is unknown - Other: dried properly

24
The first part, the volume of products, is closely related to mapping the product flow. We add the dimension of volume to tracking down the product throughout the value chain. The purpose of finding out about this dimension is to have an overview of the size of the different channels within the value chain. The following example maps the volume as a proportion of the total volume of the whole sub-sector.
Box 7 Example of mapping volumes
Two more dimensions that are quantifiable (and are closely related) are the number of actors and the employment opportunities they offer. Once you have established a classification of actors (farmers, cooperatives, state owned companies, etc.), establishing the actual number of these actors within the value chain is a next step. The number of poor, being a part of the actors in the different steps is a dimension that can be covered in this stage of the analysis. Warning
Measuring employment is more difficult than might seem at first glance. Especially when (part of) the value chain is in the informal sector. What to do with part time employment? What constitutes full time employment? The chapter on Employment distributions will deal with these and other matters.
Customers Market 2
Customers Market 1
Retailers A
Retailers B
Industrial SMEs
Importers
Large processing companies 20%
50%
30% 60%
20%
20%
60%
20%Small Primary Producers
Medium Primary Producers
25
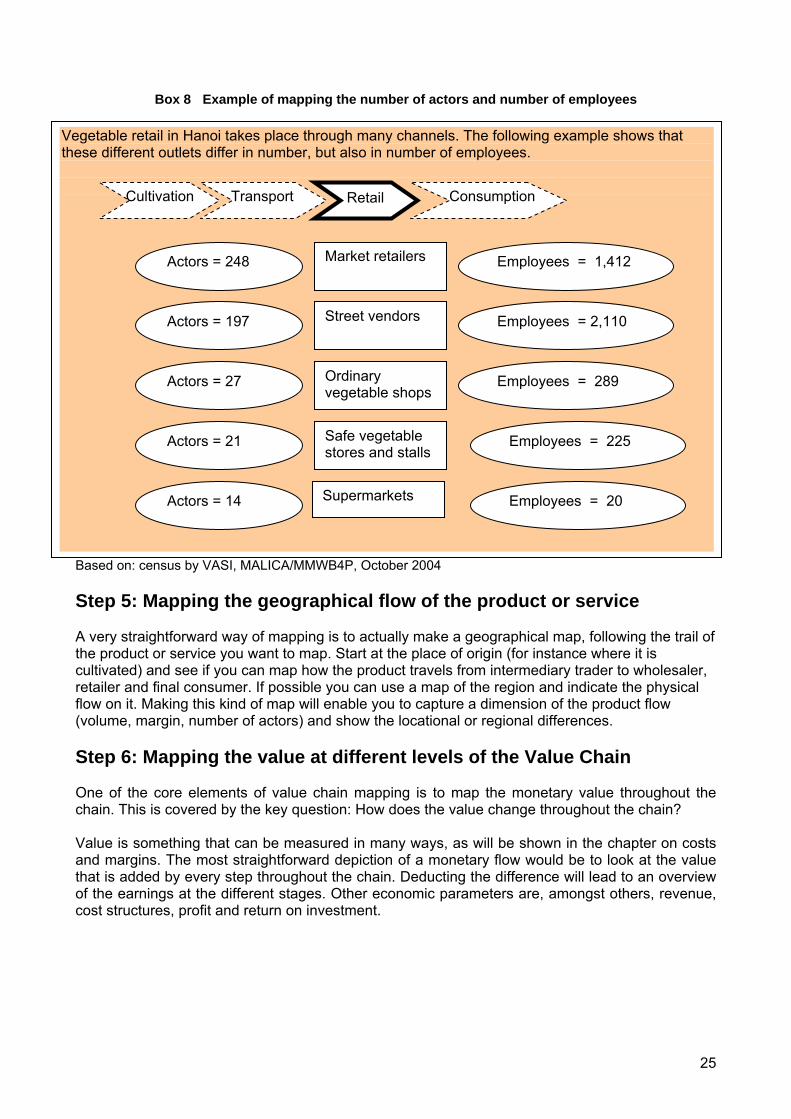
Box 8 Example of mapping the number of actors and number of employees
Based on: census by VASI, MALICA/MMWB4P, October 2004 Step 5: Mapping the geographical flow of the product or service A very straightforward way of mapping is to actually make a geographical map, following the trail of the product or service you want to map. Start at the place of origin (for instance where it is cultivated) and see if you can map how the product travels from intermediary trader to wholesaler, retailer and final consumer. If possible you can use a map of the region and indicate the physical flow on it. Making this kind of map will enable you to capture a dimension of the product flow (volume, margin, number of actors) and show the locational or regional differences. Step 6: Mapping the value at different levels of the Value Chain One of the core elements of value chain mapping is to map the monetary value throughout the chain. This is covered by the key question: How does the value change throughout the chain? Value is something that can be measured in many ways, as will be shown in the chapter on costs and margins. The most straightforward depiction of a monetary flow would be to look at the value that is added by every step throughout the chain. Deducting the difference will lead to an overview of the earnings at the different stages. Other economic parameters are, amongst others, revenue, cost structures, profit and return on investment.
Vegetable retail in Hanoi takes place through many channels. The following example shows that these different outlets differ in number, but also in number of employees.
Retail Cultivation Consumption Transport
Market retailers
Street vendors
Ordinary vegetable shops
Safe vegetable stores and stalls
Supermarkets
Actors = 248 Employees = 1,412
Actors = 197
Actors = 27
Actors = 21
Actors = 14
Employees = 2,110
Employees = 289
Employees = 225
Employees = 20

26
Box 9: Example of mapping value added throughout the chain
Source: See Padmanand V, and Patel V.G., 2004
Step 7: Mapping relationships and linkages between value chain actors Mapping linkages between value chain actors starts with making an overview of the actors. A next step is to analyse what kind of relationship actors have. This is covered by the following core question: What types of relationships and linkages exist? Relationships can exist between different process steps (producer and trader) and within the same process (farmers to farmer). The relationships between different actors can best be mapped in the part on finding a typology of actors, as covered by the second core question. Relationships or linkages between similar actors can be mapped according to basically 3 typologies: 1. Spot market relations These are relations that are created ‘on the spot’, that means that actors make a transaction (including negotiations on price, volume and other requirements) with the duration and scope of that specific transaction. This is typical for transactions made on a fresh vegetables marketplace: buyer and seller meet, come to an agreement (or not) and break up the relationship. In related literature, these are also categorized as ‘arm’s length relationships’. 2. Persistent network relations When actors have a preference for transacting with each other time and time again, we can speak of a persistent network relation. This comes with a higher level of trust and some level of interdependence. This relation can be formalized by contracts, but this is not a necessary. 3. Horizontal integration This actually goes beyond the definition of a ‘relationship’, since both actors share the same (legal) ownership. One and the same organization (this can be an enterprise, or a cooperative) deals with different processes throughout the value chain. The ownership structure can be partial or full.
In India, saris (women’s dress) are made with handlooms. The following example is a map of the value chain in this sub-sector. The value is the price at which the sari is sold to the next actor in the chain. Input provision
Value
Value added Rs. 138.4 Rs. 12.45 Rs. 13.65
Production Trade Retail Consume
Rs. 110.5 Rs. 248.90 Rs. 261.35 Rs. 275
What the example shows is that producers (weavers) actually add the most value, both absolutely (138.4 Rupees) and relatively (125%value addition). This tells us nothing about the profitability of the producers. To assess that parameter, an analysis of costs should be made (see the chapter on costs and margins).

27
In order to map these types of relationships, we use different lines and arrows. The following example clarifies this.
Box 10 Example of Mapping relationships and linkages
Source: Sedge handicrafts in Ninh Binh, SNV 2005 Step 8: Mapping Business Services that feed into the value chain A potential risk with value chain analysis is that the world surrounding the value chain is not taken into account. Crucial information might be found in the rules and regulations that are governing (parts of) the value chain or in business services that are feeding into the chain. Mapping these services will give an overview of the potential for interventions outside the value chain itself. This is covered by the question: What types of (business) services are feeding into the chain?
Box 11 Example of mapping business services
One of the major constraints of the sedge value chain in this example is the lack of business services, especially in the first steps in the value chain. Input
provision Cultivation Collection Production Export Import
Retail
The sources and payment procedures of these business services are different: embedded, fee based or for free (subsidized). A separate map can be drawn to make this visible.
Training on cultivation
Management training
Design info
Export/ import info
The following example is based on the sedge handicraft sub-sector in Vietnam. Most linkages are persistent and returning. Except for the linkage between individual farmers and the sedge enterprises, which is a spot market realtionship. This example is representative for sectors in which high quality requirements and differentiation (design of handicrafts) are crucial.
Sedge farmers
Cooperatives
Collectors
Sedge enterprise
Householdproducer
Exporters
Wholesale Retailers
Wholesalers
Persistent relationship
Spot market relationship

28
What we should know after analysis is complete This chapter has given an overview of the different dimensions that can be mapped. Also, it has offered suggestions on how to map dimensions. The following chapters will provide tools that will help you to analyze the dimensions that you wish to map.

29
Tool 3: Costs and Margins
Introduction After having mapped the value chain, the next step is to study certain aspects of a value chain in-depth. There is a wide choice of aspects that can be further elaborated upon. One of these is costs and margins, or more simply said, the money that an actor in the value chain contributes (his/her costs) and the money that an actor in the value chain receives (his/her margins). Measuring costs and margins enables the researcher to determine how pro-poor a value chain is. Studying actual costs and margins should be considered when a researcher aims to find out whether a value chain is a good source of income for the poor and, secondly, whether a value chain is accessible for the poor. Historic costs and margins, on the other hand, enable a researcher to find out what the financial trends have been in the value chain and whether the chain has potential to grow in the future. Take note
There are two types of growth. The first one is called economic growth. This type of growth potentially results in higher absolute incomes for all actors in a chain, the poor as well as other actors. The second type is called pro-poor growth. This type of growth causes relatively larger margins for the poor. Hence in this case growth benefits the poor relatively more than it does to other actors in the chain.
Objectives Knowledge on costs and margins of actors in a chain enables the researcher to: 1. identify how operational and investment costs are currently distributed over the actors in the value chain in order to conclude whether it is possible for the poor to enter a chain: if operational costs or investment costs for starting up a business are high it may be a problem for the poor to join a chain; 2. identify how revenues and margins are currently distributed over the actors in the value chain in order to conclude whether actors and particularly the poor can increase margins in a value chain. In other words is it possible to upgrade the position of the poor in the chain by making the chain more efficient (decrease costs) and effective (increase value); 3. see how costs and margins in a chain are changing over time in order to predict future growth or decline of the chain. Some costs and margins increase or decrease, for instance petrol costs. Hence, a sector that might seem to be profitable now is not necessarily profitable next year! 4. compare profits of one chain with profits in another chain and thus to see whether it may be worthwhile to switch from one chain to another; 5. compare the practice in your value chain to an industry standard or a best practice in order to improve the effectiveness and efficiency of your chain. In other words you try to find out why in area A the same value chain as in area B, is less profitable and draw lessons from it. If you have time you could also study success factors of value chains in other sectors. This process is called benchmarking;
30
Take note
The main goal of studying costs and margins is to increase the margin per product unit. This however is not a guarantee to reduce poverty, because a poor farmer can increase its profit margin per unit, but if he sells less products his absolute income may decrease. Therefore researchers should always combine cost and margin analysis with analyzing total revenues or income per actor. More information on income is presented in Chapter 5 Analyzing incomes in value chains.
Key questions The key questions that need to be answered by the researcher in order to achieve this section’s objectives are:
1. What are each actor’s costs, both fixed and variable costs, and what are required
investments for entering a value chain? 2. What are each actor’s revenues in the value chain? In other words what are each actors
sales volumes and selling prices?
3. What are each actor’s net profit, margins and break even point? 4. How are investments, costs, revenues, profits and margins changing over time?
5. How are investments, costs, revenues, profits and margins divided over the actors in the
value chain? 6. Are the costs and margins of this value chain lower or higher compared to other product
value chains? In other words what are the opportunity costs of employing production resources for this particular value chain?
7. Are the costs and margins of this value chain lower or higher compared to similar value
chains in other places? 8. What are underlying causes of the division of costs and margins in a value chain?
Steps Step 1: Identifying costs and required investments The first step is to identify what the operational costs and required investments of an actor’s activities are. Operational costs can be divided in two cost types: A. variable costs and B. fixed costs: A. Variable costs, or costs of goods sold, are costs that change according to the production size. For instance, in case of cattle raising variable costs are amongst others food and vaccinations. If a farmer has 10 cows and decides to raise 2 more cows he needs proportionally more food and vaccinations for the 2 new cows. Most variable costs are easy to calculate as they change with the same proportion as the output. There are some exceptions though that have to be kept in mind, for instance transportation costs. These do not always change in proportion with the volume traded. In fact in Vietnam many trucks are overloaded. A 25 tons truck can, for instance, transport 25 tons of bamboo, but also 10 tons and, over short distances, even 40 tons. Transportation costs per ton bamboo therefore vary

31
depending on the total amount of bamboo that is transported. If real costs are not exactly known a researcher needs to make assumptions on the average costs. How to calculate transport costs is explained in Box 1.
Box 1. Example of calculating transport costs
Assume that there are 40 m3 of space available in a truck and that it costs $500 to hire the truck. A container of 0.2 m3 holds 8 kg of tomatoes and a container of 0.4 m3 holds 10 kg of green peppers. Then the transport cost for tomatoes per container and per kilogram is ... $500 ÷ (40 m3 ÷ 0.2 m3) = $2.50 per container and $2.50 ÷ 8 kg = $0.3125 per kilogram While the transport cost for green peppers per container and per kilogram is ... $500 ÷ (40 m3 ÷ 0.4 m3) = $5.00 per container and $5.00 ÷ 10 kg = $0.50 per kilogram Source: NESDB. 2004. Training Course on Integrating Value Chain Analysis and Methodologies into Policy Analysis: Value Chains Development Training Project. Prepared for the Northeastern Region Economic and Social Development Office, National Economic and Social Development Board of Thailand, by Agrifood Consulting International. Khon Kaen, Thailand. December 2004 Another cost that is often ignored is the costs of losses. Particularly if products are perishable, such as many fresh products, a certain amount of the traded products usually is lost. Box 2 shows how losses should be calculated.
Box 2. Calculating costs on losses Assume that, at 10 percent loss levels, 1 kg of tomatoes purchased by the trader from the farmer results in 900 grams (0.9 kg.) available for sale to consumers. The trader buys tomatoes from the farmer at $5 per kilogram and marketing costs are $2 per kilogram for the tomatoes originally purchased. The selling price of tomatoes is $8 per kilogram.
Then the costs are ...
1 kg purchased at $5 per kg = $5.00
1 kg packed and transported at $2 per kg = 2.00 _________________________________________
Total Costs = $7.00 Sales Revenue or $8 x 0.9 kg = 7.20 Thus the margin to the trader = $0.20
Below is an example of the more usual, and wrong, method of calculation.
1 kg purchased at $5 per kg = $5.00
1 kg packed and transported at $2 per kg = 2.00 10 percent losses or $5 x 0.1 = 0.50
__________________________________________ Total Costs = $7.50
Sales Revenue or $8 x 1 kg = 8.00 Thus the margin to the trader = $0.50
The second calculation is clearly wrong because here the trader is seen to be obtaining revenue from
produce which has already been "lost".
Source: NESDB. 2004. Training Course on Integrating Value Chain Analysis and Methodologies into Policy Analysis: Value Chains Development Training Project. Prepared for the Northeastern Region Economic and Social Development Office, National Economic and Social Development Board of Thailand, by Agrifood Consulting International. Khon Kaen, Thailand. December 2004.
32
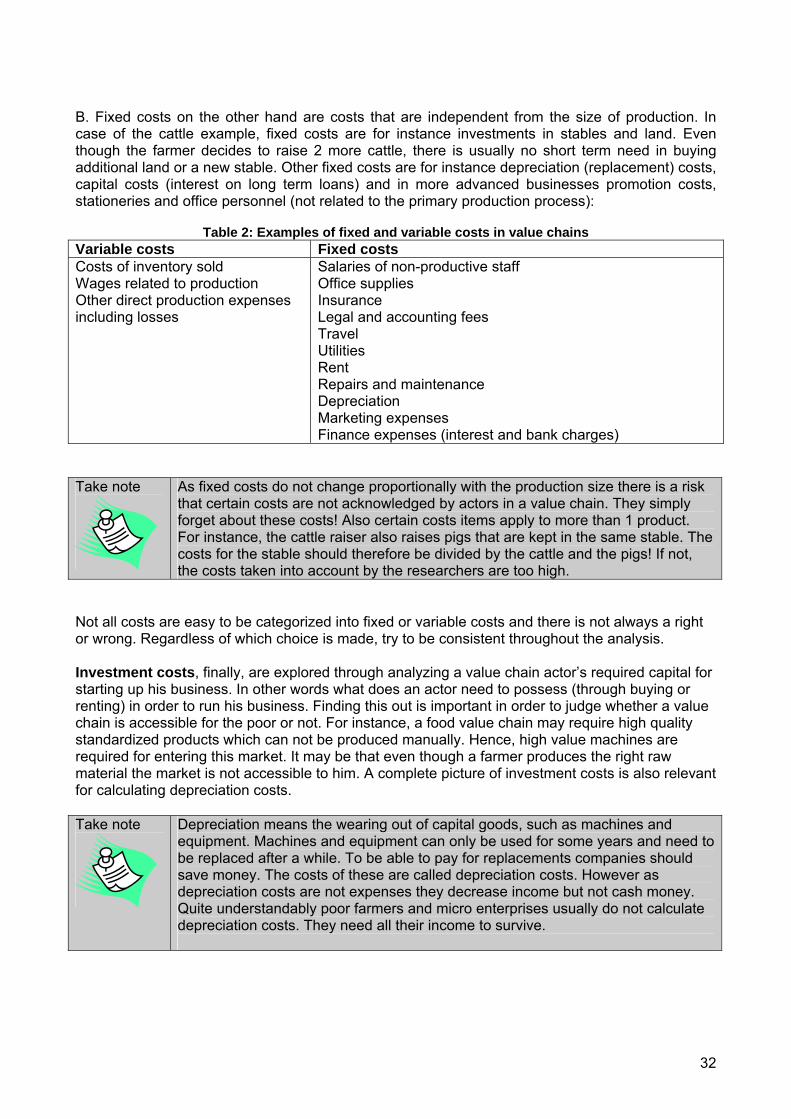
B. Fixed costs on the other hand are costs that are independent from the size of production. In case of the cattle example, fixed costs are for instance investments in stables and land. Even though the farmer decides to raise 2 more cattle, there is usually no short term need in buying additional land or a new stable. Other fixed costs are for instance depreciation (replacement) costs, capital costs (interest on long term loans) and in more advanced businesses promotion costs, stationeries and office personnel (not related to the primary production process):
Table 2: Examples of fixed and variable costs in value chains
Variable costs Fixed costs Costs of inventory sold Wages related to production Other direct production expenses including losses
Salaries of non-productive staff Office supplies Insurance Legal and accounting fees Travel Utilities Rent Repairs and maintenance Depreciation Marketing expenses Finance expenses (interest and bank charges)
Take note
As fixed costs do not change proportionally with the production size there is a risk that certain costs are not acknowledged by actors in a value chain. They simply forget about these costs! Also certain costs items apply to more than 1 product. For instance, the cattle raiser also raises pigs that are kept in the same stable. The costs for the stable should therefore be divided by the cattle and the pigs! If not, the costs taken into account by the researchers are too high.
Not all costs are easy to be categorized into fixed or variable costs and there is not always a right or wrong. Regardless of which choice is made, try to be consistent throughout the analysis. Investment costs, finally, are explored through analyzing a value chain actor’s required capital for starting up his business. In other words what does an actor need to possess (through buying or renting) in order to run his business. Finding this out is important in order to judge whether a value chain is accessible for the poor or not. For instance, a food value chain may require high quality standardized products which can not be produced manually. Hence, high value machines are required for entering this market. It may be that even though a farmer produces the right raw material the market is not accessible to him. A complete picture of investment costs is also relevant for calculating depreciation costs. Take note
Depreciation means the wearing out of capital goods, such as machines and equipment. Machines and equipment can only be used for some years and need to be replaced after a while. To be able to pay for replacements companies should save money. The costs of these are called depreciation costs. However as depreciation costs are not expenses they decrease income but not cash money. Quite understandably poor farmers and micro enterprises usually do not calculate depreciation costs. They need all their income to survive.

33
Step 2: Calculating revenues per actor After the costs per actor have been calculated, the revenues need to be identified. Revenues are calculated by multiplying the volume sold (Q) with the selling price (P) and, subsequently, by adding additional sources of income, such as revenues of selling the production waste of a product. The latter for instance happens in the bamboo sector where leftovers are used for producing paper pulp or fuel. Revenues = (Q * P) + other sources of income Prices differ per marketing channel or per market segment and sometimes per grade or per quantity sold. Also prices sometimes change over the season. Prices can even vary during one single day, like in many fresh vegetables markets. Therefore questionnaires should include questions related to what the prices in different markets, for different products and during the different seasons are. For calculating average prices, these should be weighted. An example of how to do this is provided in Box 2.
Box 3. An example of calculating the weighted average selling price Assume an example involving a consignment of 100 kg of tomatoes as follows ... 50 kg sold at $2.00 = $100 20 kg sold at $1.40 = 28 20 kg sold at $1.00 = 20 5 kg sold at $0.40 = 2 (5 kg which cannot be sold) __________________________________________ Total Revenue = $150 The average selling price per kilogram is $2.00 + $1.40 + $1.00 + $0.40 + $0.00 = $0.96, while the weighted average selling price is $150 ÷ 100 kg = $1.50 When studying a market over a longer period of time, - for example over a 10 year period - it is necessary to incorporate inflation and deflation rates. Hereto a base year against which all prices are adapted needs to be chosen. If this is too complicated a researcher should at least mention that there had been inflation or deflation in order to make a reader aware of the situation. Take note
During interviews it can happen that many different cost and price units are used. For instance, handicrafts producers sometimes refer to their production volume in pieces, sometimes in tons and sometimes in containers. This can particularly be confusing when the study is conducted by more than 1 person. It is therefore important to either agree upon which unit of measurement is used or it should become clear how many units fit into 1 container or ton.
Step 3: Calculating financial ratios Now that the investments, variable and fixed costs, and revenues are known the financial position of the value chain actors can be analyzed. Several ratios can be looked at, such as: A. Net income Net income, or profit, is calculated by deducting total costs (both variable and fixed costs!) from revenues. Net income = revenues – variable - fixed costs For instance, in the hypothetical case of a shoes manufacturer who sells 10,000 pairs of shoes (Q) per month for 100,000 VND (P) per pair revenues would be: 10,000 (P)* 100,000 (Q) =

34
1,000,000,000 VND. As the total costs for material, labour, rent, depreciation on the machines and tax are 800,000,000 VND per month his net income would be 200,000,000 VND per month. B. Net margin Net margin: a margin on a product is the net income per product. This is calculated by dividing the net income of the manufacturer by the total number of products sold (Q). Margin = Net income / Q In the case of the shoes manufacturer the margin per product would be 200,000,000 VND net income / 10,000 shoes = 20,000 VND per pair of shoes. Of course this is a simplified example and in reality there may be other costs. An example of a rice farmer’s costs, revenues and margins is presented in Table 3. C. Break Even Point The break even point shows how much an actor has to sell before he starts making profit. In other words the point at which his revenues start exceeding his costs. Break even point = Fixed costs / (P-Variable Costs) = the number of units For instance, if the total fixed costs of the shoes manufacturer are 500,000,000 VND per month, one pair of shoes is sold for 100,000 VND (P) per pair of shoes and variable costs per pair of shoes are 60,000 VND, the shoes manufacturer has to sell 12,500 pairs of shoes per month in order to break even: 500,000,000 / (100,000-60,000) = 12,500 Table 3 : An Example of Costs, revenues and margins of rice farming
Summer-Autumn Crop - IR64, Can Tho Province, 2001 Farmer Practice Improved Practice Input Units Quantity Unit Price Amount Quantity Unit Price Amount
Seed Kg 200 2,000 400,000 100 2,000 200,000 Urea Kg 150 2,200 330,000 100 2,200 220,000 DAP Kg 100 3,000 300,000 100 3,000 300,000 Fertilizer Phosphorous Kg 50 2,300 115,000 50 2,300 115,000
Insecticide VND 1 350,000 350,000 1 200,000 200,000 Diesel Liter 60 5,500 330,000 60 5,500 330,000 Fuel Lubricant Liter 3 10,000 30,000 3 10,000 30,000
Irrigation VND 1 50,000 50,000 1 50,000 50,000 Soil Work VND 1 320,000 320,000 1 320,000 320,000 Threshing VND 1 320,000 320,000 1 320,000 320,000 Other Facilities VND 1 160,000 160,000 1 160,000 160,000
Cleaning Field Person 10 20,000 200,000 10 20,000 200,000 Sowing Person 5 20,000 100,000 5 20,000 100,000 Weeding Person 30 20,000 600,000 25 20,000 500,000 Fertilizing Person 6 20,000 120,000 5 20,000 100,000 Spraying Insecticide Person 6 20,000 120,000 4 20,000 80,000
Labor
Pumping Water Person 13 20,000 260,000 13 20,000 260,000 Cutting Person 18 20,000 360,000 18 20,000 360,000 Transporting Person 8 20,000 160,000 9 20,000 180,000 Harvesting Drying Person 8 20,000 160,000 8 20,000 160,000
Other Labor Person 12 20,000 240,000 12 20,000 240,000 Credit 1% @ 4 months VND 4 50,250 201,000 4 29,250 117,000
Materials VND 2,705,000 2,245,000 Labor VND 2,320,000 2,180,000 Total Cost Total VND 5,226,000 4,542,000
Yield Kg 3900 1,350 5,265,000 4000 1,400 5,600,000 Cost VND/kg 1,340 1,136 Gross Margin VND/ha 39,000 1,058,000 Percent Profit 0.74% 18.89% Source: Data provided by USDA FAS – HCMC, Authorship unknown. (Agrifood Consulting International 2002b)

35
Step 4. Changes over time All the above aspects should be considered over time. What may look like a valuable value chain today may be invaluable next year. In other words a researcher should study the trends of a value chain and consider the implications of these trends for the future. For example, to date Vietnamese traders who trade on a small scale have small margins on the products they sell. Over the past few years the cost for petrol has however increased and margins of small scale traders have been decreasing. The future therefore does not look bright for small scale traders and they better increase the scale of their business or find another source of income. Another example derives from the commodity product market. Usually, when a country develops and people earn higher incomes, the demand for and hence revenues from commodity products, such as rice and maize, increase rapidly. As a consequence many farmers start growing these products or already existing farmers intensify their production. The demand however only grows up to the point that people have sufficient food, as people can only eat a certain amount of rice and maize. After that point, when supply exceeds demand, prices and hence revenues go down, and farmers may need to diversify their production. Step 5. Relative financial position of actors in the value chain In this step the division of investments, costs, revenues, net income (or profit) and margins among the actors in a chain are considered. The aim of this step is to conclude about the financial position of an actor compared to other actors in a chain. There are several ways to present the financial position of actors in a value chain, for instance in a table or through a diagram: Table 4: Example of presentation of calculation of Value Chain Margins
Costs Profits Margins Chain Actor
Unit Total Cost
Added Unit Cost
% Added Cost
Unit Price
Unit Profit
% Total Profits
Unit Margin
% Retail Price
Farmer 20,000 20,000 29% 25,000 5,000 9% 25,000 20% Assembler 32,100 7,100 10% 37,500 5,400 10% 12,500 10% Trader 39,185 1,685 2% 50,000 10,815 19% 12,500 10% Processor / Retailer 89,873 39,873 58% 125,000 35,127 62% 75,000 60%
68,658 56,342 125,000 Source: NESDB. 2004. Training Course on Integrating Value Chain Analysis and Methodologies into Policy Analysis: Value Chains Development Training Project. Prepared for the Northeastern Region Economic and Social Development Office, National Economic and Social Development Board of Thailand, by Agrifood Consulting International. Khon Kaen, Thailand. December 2004

36
Figure 5: An example of diagrammatic presentation of cost, profit and margin by categories
0%
20%
40%
60%
80%
100%
% Cost % Profits % Margin
Farmer Assembler Trader Processor
Source: NESDB. 2004. Training Course on Integrating Value Chain Analysis and Methodologies into Policy Analysis: Value Chains Development Training Project. Prepared for the Northeastern Region Economic and Social Development Office, National Economic and Social Development Board of Thailand, by Agrifood Consulting International. Khon Kaen, Thailand. December 2004 A visual way to show the division of costs and margins is to include the cost and margin data in the value chain map (see Box 12). A similar map can be also drawn up for presenting the investments per actors Box 12: Revenues, costs and profit per unit in the value chain of 1 liter fish sauce (quality 2)
Source: ILO/PRISED, Marije Boomsma, Fish processing in Quang Ngai province Value chain analysis of dried fish and fish sauce After data has been presented a researcher can start the analysis. In Figure 1, for instance, it may be evident that the farmer shares high costs and has little profits, while the trader has little costs and relatively high profits! This may be a sign that costs and margins are shared unequally in a chain and could be an intervention point for a project: scaling up the business of an actor in a chain in order to make the business more attractive for the actor. A good example provides the bamboo sector in Vietnam. Currently most bamboo growers sell bamboo culms as a whole to amongst others paper, chopsticks and bamboo flooring enterprises. These enterprises cut the bamboo culms and subsequently use part of the culms for processing. Leftovers are usually used as waste or in some cases as fuel. By already cutting the trees at farmer’s level and selling the different parts to more than 1 industry, farmers could get higher profit margins.
Input supply Trade Retail
Sales price 10,000 – 12,000 VND 7,999 VND 3,001 VND 30.8% 26%
Fisherman Semi processor
Trader Retailer Processor
Production Consumption
Cost Profit % Profit % Added Costs
5,025 VND 4,250 VND 775 VND 18% 40%
5,728 VND 5,185 VND 543 VND 10% 9%
11,000 VND 10,833 VND 167 VND 2% n.a.
12,000 – 14,000 VND 10,300 – 11,000 VND 1,700 – 3,000 VND 17-27% 25%
37
Instead of cost per unit, presenting the total costs, revenues and profits per actor per year shows the scale of an actor’s business. This is important as in some cases when considering the profit per unit, it may look like an actor doesn’t have a fair share as it only makes little profit per unit, while when considering this actor’s total profit per year it turns out that the actor actually earns a decent income. This is often the case with commodity products, such as corn. Commodities have low profit margins per unit, but as they are sold in large quantities the total profit per year is still financially attractive. Step 6. Calculating opportunity costs Before people decide to enter a new market or a new business they first need to figure out which business is the most profitable for them. In other words they need to estimate opportunity costs. This is particularly important for poor people who have limited resources and hence can not afford to choose the wrong market or sector. Revenues, costs and margins of value chains should therefore be compared (both different marketing channels and different product chains), but also the potential for scaling up and the required investments should be investigated. Terminology
Opportunity costs: opportunity costs are the costs of employing production resources (labour, capital, land) in a particular way and thus not having the satisfaction of the best alternative. A good example is provided by Laotian farmers in Viengkham district, Luang Prabang province, that borders with Vietnam. Farmers in this area were used to monoculture and were cultivating rice only once a year. Since the demand for other crops was growing farmers became interested in crop diversification and growing a second product. The farmers could choose from growing maize, soybeans or sesame. To be able to make the right decision farmers had to consider how much money they would loose (the opportunity costs) by choosing, one crop, for instance maize, instead of the other 2 crops, in this case sesame or soybeans (the best alternative). To help the farmers a simple costs/benefits analysis was executed. The conclusion was that on average farmers would get the highest returns on soya beans, 2.7 million Kip per Ha versus 2.6 million Kip per Ha for sesame and only 0.5 million Kip per Ha for maize (labour, mostly family labour, was not included in this analysis). Aside from the use of land, farmers also have to consider the employment of other production sources such as labour and capital.
Source: Industrial Crops Market Rapid Appraisal Viengkham District, Micro Projects Development through Local Communities (MPDLC), February 2005 Step 7: Benchmarking Comparing similar value chains in different regions will provide information on the potential for efficiency gains. For instance, rice farmers in Northern Vietnam spend 1 million VND on inputs per Ha, while their counterparts in the central highlands only spend 500,000 VND. This could mean that prices for inputs are different (an opportunity for market entrants) or that farmers use too many inputs. Maybe they can learn from each others production techniques! Again, make sure that all units are the same before making comparisons! Step 8: Going beyond the quantitative data The final step in the costs and margins section is to try to go beyond the quantitative data and explore why certain actors in the chain have higher margins and lower costs than others. Is this, for instance, only caused by the fact one actor invests more in a chain than another? Or, can it be explained by the governance of a chain and is power unequally distributed between actors (see Chapter 7). An additional reason could be that one actor has better access to market information because it has better linkages to the market than another actor. In any case always try to think out of the box and never take things for granted!

38
What we should know after analysis is complete After having followed all the steps related to costs and margins the financial situation of actors involved in the chain should be clear and strengths and weaknesses related to costs and margins of an actor and / or a chain can be summarised. After that constraints and needs of a value chain can be identified and interventions can be designed.

39
Tool 4 – Analysing technology, knowledge and upgrading
Introduction With this tool the technology and knowledge present and used in the value chain will be analysed. The second part of the tool will look at opportunities and possibilities to upgrade the technology and knowledge in use. The basic assumptions are that the correspondence of quality produced with the requirements of demand determine which technology should be used and knowledge levels required. Important pro-poor aspects in the technology and knowledge analysis will be:
• Can the poor do it? In other words do they have the required knowledge levels to understand the technology and to implement or operate it?
• Can the poor afford it? Is the investment requirement for the technology within reach of the poor?
• Can the poor copy-cat it? When the technology is introduced to a select audience is it easy to copy? For instance to local construction workers have the capacity to build it or are seeds available?
• Can the poor have access to it? This is especially in the case of the poor being labourers on the fields of larger farms or in enterprises.
Take Note:
With technology we mean all types of technology ranging from so called traditional technology (often self developed by the users based on experiences) to high tech technology developed through extensive R&D) without making a judgement on the value of this technology. In a pro-poor technology analysis special attention should be paid to the existing levels of traditional technology and its effectiveness.
Objectives The objectives of this tool are: 1. To analyse the efficiency & effectiveness of technology in use within the Value Chain 2. To undertake a typology of current & required technology in the Value Chain 3. To analyse the appropriateness of technology (affordability, suitability, accessibility, replicability
and fungibility) matched with skills of technology at different levels of the Value Chain 4. To analyse upgrading options within the Value Chain that provide the required quality of output 5. To analyse the impact of external investments in knowledge and technology (innovation +
R&D)
Key Questions Key questions to answer in the analysis will be:
• What is the effectiveness and effectiveness of technology • What is the typology of current technology in use in the Value Chain (per processes, actors,
poor & non-poor)? • What indigenous + other knowledge is being used in the Value Chain? • Does the Knowledge & Technology produce the required output? • Cost / margins of technology (refer also to tool 3)? • Who determines orientation and investment in Knowledge & Technology in the Value
Chain? • What upgrading options are available? • Does investment in upgrading pay off? Does it bring enough added value to the poor? • Who has access to knowledge and who provides knowledge (example the role of
extension)

40
Important pro-poor aspect in the upgrading of technology and knowledge will be the impact on the poor in terms of:
• Producers; Will the upgraded technology and knowledge be in reach of poor producers? Will they be asked to take unnecessary high risks?
• Labourers; Will the upgraded technology be labour saving (and thus less poor will have access) or will the upgraded technology be labour intensive so more poor can be absorbed?
• Consumers; Will the upgrading of technology and knowledge in the value chain lead to an increased access for the poor to products at a better affordable price? Will production inputs needed for the upgrading (often seeds and breeds) be available to the poor so they can also benefit from the technology upgrading?
Steps Step 1. Map the variation / differences in Knowledge and Technology in the separate processes in the Value Chain. In this first step the different uses and users of the current technologies in the value chain will be analysed. For each process in the value chain the levels of knowledge and technology being used is mapped for the different users, focussing especially on poor and non-poor users. For each process that is identified in the mapping exercise, a matrix should be made that shows the position of the process in terms of poor and non-poor users. The table below gives an example of the type of matrix that could be constructed. Table 5 Example of K+T matrix - Cassava production & cassava processing Knowledge Technology Knowledge Technology Poor Indigenous
knowledge on upland growing conditions
Local varieties
Poor Indigenous knowledge on chip making and drying
Open air drying and home storage in bags
Non-poor Upgraded knowledge from extension training
Hybrid varieties from China
Non-poor Knowledge from formal studies
High tech starch processing
In order to determine the types of knowledge and technologies utilised by actors at different levels of the value chain, it is important to observe the types of technology, and to ask questions of actors that are designed to gather useful information about knowledge levels and the appropriateness of technology being utilized. The table below gives from examples of questions that could be asked to value chain actors, and the types of information that could be determined from asking those questions.

41
Table 6 Examples of questions that can be asked to the different actors in the value chain Question Details to look for What is the technology you are using to produce your output?
Get a clear description of the technology that is used. Primary production: • Varieties in use • Inputs • Tools / machinery • Post harvest treatment / storage Processing: • Home based drying • Small scale factory • Large enterprises Transport: • Foot / horseback • Motorbikes / bicycles • Cars / trucks Packaging / labelling • Bulk (more than 10 kg) • Bags • Packs • Etc
Where did you learn about this technology?
Is the knowledge on the technology passed • from generation to generation • from other people in the neighbourhood • by extension (or other) services • through the media (radio / TV) • through formal education (yourself or family members)
Since when have you been using this technology?
Date that the technology was first introduced and the modifications that have taken place
Who has paid for the initial cost of the technology
• paid by the user • introduced with outside subsidy (for instance an extension
model • introduced as part of a business deal (free training with a
seed purchase) What investments (capital, labour, land etc) have you made in the technology and knowledge?
Capital Investments: • Initial amounts • Maintenance / modifications • Cost to operate the technology Labour • Amount of time needed to operate the technology Land • Amount of space required for the technology
For what purpose can the technology be used?
Can the technology be used for other purposes? Examples: Cassava can be used to feed the own animals or sell to the starch factory. A longan drying oven can also be used in other seasons to dry mushrooms.
Take Note:
A useful technique when looking at technology is to use a timeline to describe the changes in technology and knowledge and their impacts.

42
Step 2 Identify distinct market chains based on Knowledge and Technology In the second step the analysis will continue by looking at the different results and outputs from different technologies and knowledge levels. In many value chains there are distinct market channels, often with regard to value and end-consumers using the products. (See also box 5 in Tool 2) By analysing these different channels and the technology and knowledge used in these channels we can get a clear picture of the activities the poor are involved in and we can make an assessment what their best options are if they would like to upgrade technology to a new level. Take Note:
During the analysis, it will be good to support your investigations with photo materials, especially to demonstrate and show different technologies that are being used.
For each market channel that is identified in the mapping exercise, a matrix should be made that shows the position of the process in terms of poor and non-poor users, type of technology used and type of output. The table below gives an example of the type of matrix that could be constructed. Table 7: Matrix for Market Channel Analysis of Poultry Market channel Technology Used Type of Output Poor Local Market / Self
Consumption Home Yard Growing Eggs
Live Chickens Medium District / Provincial
Markets Open Shed Farming for 50 – 150 animals
Eggs Live Chickens
Non-Poor Supermarkets Industrial chicken production and processing
Eggs Pre-processed frozen chicken
It is important to analyse which technology is used in each market channel but also to analyse from the consumer towards the producers to understand customer demand and to translate that into the correct use of technology. In the below box on longan processing an example is given how technology was developed to be able to go from low quality processing to medium quality processing for a different market channel in which different margins can be earned.
43
Box 13: An example of technology development - Longan drying technology development
Step 3 Identify and quantify gaps in Knowledge & Technology that hinder upgrading between market chains In the third step of the analysis the possible upgrading solutions will be analysed and why they are not being applied or in other words what are the limitations of these options, especially for the poor, to be put into practice. Terminology Upgrading
- Process upgrading. Process upgrading refers to the efficiency of production. Can costs be reduced? Can speed of delivery be increased? For instance can a farmer reduce the use of fertilisers while maintaining the same production levels? Or can a transporter use stronger boxes to reduce losses?
- Product upgrading: Product upgrading refers to the introduction of new products or improving old products. For instance can a processor use a better drying oven to produce higher quality dried longan? Or can a tea processor introduce small tea bags instead of 1kg loose tea boxes?
- Functional upgrading: Functional upgrading refers to the basic question which activities the actor in the chain should concentrate on. Should a farmer be both producer, processor and transporter or can concentration on one or two steps add more value. Can outsourcing of other activities improve added value? For instance can a group of small farmers bring their pigs together to the market in one small truck or should they all travel individually with the pigs on the back of their motorbikes?
In the search for upgrading possibilities it is important to look not only at one actor but also at the effect of the upgrading in the whole chain. The introduction of a new variety for the producer can mean that the processor also has to change technology or that different requirements have to be placed on transport.
In Son La province, North-West Vietnam, farmers are growing longan (a tropical fresh fruit). Most of the fruit is processed into dried longan. This is partly due to the fact that there is an oversupply of fresh fruit in the season combined with infrastructure constraints to transport the fresh fruit timely to the end consumers. Present technology was deemed to produce an inappropriate quality of output in the eyes of end consumers. An analysis of technology in use demonstrated that there were a number of weaknesses that determined this inappropriate quality. These were related to: temperature control, hygiene and energy efficiency. The department of agriculture has introduced new technology which was not adopted by small scale processors in the value chain because of high cost for the technology, complexity of the technology and the high running cost (energy input) of the technology. Development of technology, suitable to investment levels of the local processors and technologically appropriate, was facilitated by an outside development organisation. An analysis was done with potential investors (processors) to determine the financial limitations. Based on this information a design was made which was subsequently constructed and tested with a local training institute for demonstration and dissemination purposes.

44
Construct a matrix as shown in the table below, and for each level of the value chain, identify potential product, process and functional upgrading possibilities. It may not be possible to identify all three types of upgrading strategy for each level of the chain. In the case that no possibility can be identified, leave that cell blank. Table 8: Example - Upgrading possibilities matrix Producer Processor Trader Wholesaler Retailer Product Process Functional Box 14: An Example of Upgrading Possibilities - the Cassava Value Chain
Step 4 Analyse which options are within reach of the poor (in terms of knowledge level, investment, use etc) In the fourth step of the analysis the focus will shift to which of the upgrading options are within reach of the poor. There are many aspects to consider when deciding if an upgrading option is within reach of the poor. These should be considered when making an analysis of these options.
Example – Factors influencing upgrading in the cassava value chain The case of farmers that experience some sort of upgrading in the cassava value chain is very limited. The production of dry chip rather than fresh cassava can be considered a form of upgrading. Dry chips have 4 major advantages: (i) it creates more employment and value-added for cassava producers; (ii) farmers can keep dry chips as savings and speculate for higher prices; (iii) dry chip can be used as animal feed, hence it give more choices to farmers against market risk; (iv) the dry chip is lighter, hence saving transportation cost. The production of dry chips does not require a big capital investment (a basic dry-chip processing technology costs about 400,000 – 500,000 VND). This is an affordable investment also for poor farmers. However, the production of dry chips is associated with high requirement of labor. At the same time, dry chips are processed for the purpose of animal feed, so farmers are willing to participate in dry chip production only if the volume of cassava output is large enough. For these reasons, poorest or small holding farmers, under limited land and cassava output and overall cash shortage, prefer to sell fresh cassava roots. A final reason relates to the characteristics of cassava buyers (namely starch industry). In particular, fresh roots are preferred by starch processing enterprises. This type of production in fact requires the utilization of fresh cassava rather than dry chips. In contrast dry chips are favored by buyers engaged in animal feed processing. It can therefore be concluded that in the North and Central Vietnam, which are characterized by a scarcely diversified cassava processing sector, the potential for utilization of dry chips is limited. In contrast, in the South of Vietnam, where important animal feed processing factories operate, market opportunities for dry chips are much higher.

45
Table 9: Example on different technology options available for household production related to investment levels. Bamboo House Semi-Fixed Concrete Permanent Concrete Short description A bamboo shed
covered with roof from plant materials Earth Floor Bamboo woven walls
Concrete floor and concrete poles. Walls from plastic sheets Roof from plastic sheets or cement roof slabs
Concrete and stone building (like a normal house)
Advantages Easy to construct Cheap
Better climate control inside the house Easier to keep insects out Lower maintenance
Good climate control possible for all year production Good hygiene Low maintenance
Disadvantages High maintenance (labour) Not easy to keep insects out
Relatively high investment costs
High investment costs
Costs Only labour days Medium Cash Cost High Cash cost Some of the important aspects to consider in this step of the analysis are summarized in the table below. Table 10: Important aspects to look at when selecting the best potential upgrading options for the poor Issue Details to look for Capacity to react to changes in demand (fashion)
Consumer demand is often changing. The success of a value chain is mostly determined by the capacity to react as quick as possible to these changes. Upgraded technology should ideally have the capacity to deal with this without making a lot of extra changes or investments.
Bottleneck analysis to determine at what level to invest
In order to improve the performance of the whole value chain it is important to analyse at what level in the chain the upgrading should be done in terms of efficiency and effectiveness. Especially when at more than one place in the value chain upgrading should take place it is important to look where this will have best impact on the poor.
Prioritise options Based on the bottleneck analysis a prioritisation should be made at what level in the chain the first interventions should take place to upgrade the whole chain but also in terms of direct impact on the poor.
Incentives that stimulate investments in Knowledge Technology / lack of incentives and barriers that limit the poor from upgrading
In poverty situations there is often a lack of technology and knowledge development and thus also in subsequent upgrading in the value chain. It is important to analyse what the incentives or lack of incentives for investment are. • Why do people invest in new technology? Or • Why do people not invest in new technology? • Why do people gather new knowledge? Or • Why do people not look for new knowledge? • Are there factors that hinder the poor from investing in technology of
knowledge? Role of local institutes / organisations in R&D and innovation
An often seen, limitation to technology upgrading is the “distance of the researchers to the local situation.” Technologies developed in location A do not suit to the circumstances in location B. In the analysis it is necessary to look at: • What local institutions / organisations are there that are involved in
R&D and innovation? • What have been their past contributions to technology development? • Can they play a role in the current value chain upgrading?

46
Policy environment for pro-poor technology development
What are the policies for technology development and value chain upgrading in place? (R&D, dissemination, credit & investment) Do these policies favour pro-poor technology development? Are people aware of these policies?
Information flows trickle down of R&D information & bottom up flows of indigenous knowledge
Dissemination Low-tech feasible technology can disseminate itself based on reputation and often do not need expensive promotion campaigns
Take Note:
Innovations in knowledge and technology often come from outside service providers (public or private). In many agricultural value chains the lack of these service providers often forms a large bottleneck to the possibility to upgrade a value chain. The presence of these service providers (extension, vocational training, knowledge providers etc) needs to be carefully looked. Their presence alone is not enough of course. You will also have to analyse whether the poor have an equal access to them to improve their knowledge and technology and if the service offers are suitable to the capacity level of the poor.
What we should know after analysis is complete After having followed all the steps related to technology and knowledge, the position of actors involved in the chain relative to technology and knowledge as tools for upgrading should be clear, and a set of upgrading strategies with positive impacts on the poor can be designed. The role of external service providers in this process is often crucial and should not be overlooked.

47
Tool 5 – Analysing Incomes in the Value Chain
Objectives 1. To analyze the impact of participation in value chains on the distribution of incomes within and
between various levels of the value chain at the level of the individual stakeholder. 2. To analyze the impact of different value chain governance systems on income distribution and
on final product price. 3. To describe the impact of income distribution on the poor and other disadvantaged groups and
the potential for poverty alleviation from different value chains.
Key Questions • Are there differences in incomes within and between different levels of the value chain? • What is the impact of various governance systems on income distribution between and within
various levels of the value chain? • What are the impacts of the distributional outcomes of the value chain on the poor and other
disadvantaged groups, both currently and into the future? • What are the changes in incomes that result from the development of various types of value
chains? • What is the variability of incomes and risks to livelihoods within and between various levels of
the value chain? Terminology
Income is defined as the earnings accruing to an economic unit during a given period of time. The farmers’ income is equivalent to farm profit when the farmer is the owner and manager of the farm business. The gross value added is defined as the money received from sale of goods plus the value of self-consumed output minus the cost of inputs. The income is the gross value added minus the depreciation costs, the interest rate costs, and the taxes. Cash income can be distinguished from non cash income.
Steps Step 1: Define Typology Defining a typology of stakeholders at each level of the value chains according to major structural characteristics having potential impact on income, especially for farmers, where size and income differences are quite important relative to more homogeneous groups e.g. packagers. This typology should include a distinction between poor and non-poor actors as a starting point for analysis of incomes. Step 2: Calculate Profits Profit calculation at each level is determined utilizing the tools outlined in Chapter 2: Analyzing Costs and Margins Step 3: Calculate the net income at each level of the value chain

48
This is undertaken by multiplying the unit profit at each level by the average level of sales at each level. Comparing the distribution of net income across each level of the value chain enables a comparison of benefits accruing to actors at various levels of the chain. This is complementary to the analysis of the margins and the profits accruing at each level of the chain. However, an analysis of the income gives a more accurate picture of the true distribution of benefits at each level of the value chain, as it reflects the often vastly different volumes handled by players at each level of the chain. The average net income level accruing to actors at each level of the chain should be benchmarked (compared with) the official poverty line and a subsistence level of expenditure to determine if the income level generated by the activity at that level of the value chain is sufficient to maintain or improve livelihoods. Utilizing the benchmark level of poverty, and the margin and income information, a calculation can be made to determine how much of a particular activity would need to be undertaken in order to generate an income higher than the poverty line. Examples could include: how many hectares of rice cropped or how many tons of fruit traded. Step 4: Calculate the wage income distribution Separate the wage components in the partial budget calculations for margins. The value of costs at each level represented by wages multiplied by the value of sales at each level will give the level of wage income at each level of the value chain. The comparison of wage incomes over different levels of the chain, combined with the typology undertaken in Step 1 of this process, gives a picture of the distribution of benefits to individuals within the framework of enterprises at each level of the value chain. Wage costs can be especially high for large-scale farms, as well as processing companies. Table 11: A virtual example of calculation of total wage costs is presented in the following table, for a farmer to processor value chain. Item $/kilo Nr of kilos/actor Nr of actors Total ($) Farmers’ input costs 1 Farmers’ wage costs 0,5 500 100 25,000 Farmers’ other costs (depreciation, taxes, interest rates)
0,5
Farmers’ total costs 2 Farmers’ price 3 Farmers’ profit 1 500 100 50,000 Processors’ input costs 2 Processors’ wage costs
3 3000 10 90,000
Processor’s other costs 3 Processors’ total costs 8 Processors’ price 10 Processors’ profit 2 3000 10 60,000 Total farmers and processors’ profits
3 110,000
Total farmers’ and processors’ wage costs
3,5 115,000

49
In this example, total wage costs, as paid by farmers and processors, equate a little more than farmers’ and processors’ profits. If all profits and wages are used as household incomes (which means that some of the profits are not used for investments), it can be concluded that the chain generates 225,000 $ in terms of incomes. In the analysis of income distribution, care should be take to differentiate between paid labor and unpaid family labor. Although unpaid family labor does not incur a cash cost, it does incur an opportunity cost, frequently proxied by the local paid labor rate. This should be taken into consideration when making comparative analyses such as those in the boxes below. Due to income diversification strategies, the income brought by one value chain may be only a small fraction of the total income of a household. The share of income represented by the value chain should be calculated in order to accurately model livelihoods and livelihood responses.

50
Box 15: Differences between the distribution of unit profits and incomes along the value chain
Malica (2006)1 assessed the distribution of costs and profits between the different stakeholders of the following off-season tomato chains in Northern vietnam:
- among the different chain stakeholders, it is the collectors and wholesalers selling vegetables of Moc Chau who get the highest incomes, due to the big quantities traded – although their profits per kilo are smaller than other actors, e.g., 19-5 and Van Tri cooperatives (for tomato, 105 t/year for collectors, 132 t/year for wholesaler, 6 t/year for Bao Ha, 13 t/year for 19-5, 12 t/year for Van Tri). It will be worth investigating the reasons of these differences in quantities traded, maybe a function of the number of years in the business, or the fact that the cooperatives prefer the reliability of their suppliers in terms of product quality rather than the number of suppliers and their large scale.
- compared with the other actors, supermarkets get relatively low margins (less than 20% of final price, while farmer’s margin is more than 25%);
- selling to supermarkets does not bring more income to farmers than selling to safe vegetable shops, even though the retail price is 20% higher, the price difference is distributed into increased profits for the assembling and distribution cooperatives (Van Tri, Van Noi) and company (Bao Ha), and into the supermarket margin. Compared with safe vegetable shops, supermarkets represent more constraints for their suppliers, in particular as regards the possibility of returned products.
Estimation of incomes of various actors of the vegetable chains (USD) Tomato All commodities Profit/kg Qty/year Income/year Qty/year Income/year Farmers Moc Chau inside coop 0,06 3340 203,18 9200 559,67 Collectors Moc Chau (local) 0,02 2100 42,94 13440 274,83 19-5 cooperative 0,01 12600 129,23 500000 5128,21 Van Tri cooperative 0,04 11900 530,16 612000 27265,38 Farmers Moc Chau ouside coop 0,06 8400 474,38 15000 847,12 Collector Moc Chau (to Hanoi) 0,02 105000 2147,12 105000 2147,12 Wholesaler Hadong 0,02 132000 3206,92 148000 3595,64 Farmer Soc Son 0,14 2374 322,77 8700 1182,87 Collector Soc Son 0,04 20130 771,65 82500 3162,50 Company Bao Ha 0,03 5610 150,32 132000 3536,92 Safe vegetable shop 0,02 3400 78,24 40800 938,92
Note: in this calculation, we assume that the actors get the same profit per kilo for all vegetables traded; hence the figures of total incomes should rather be taken for comparison rather than in absolute terms. * Profits = Sales revenue – Cash costs - Depreciation. Please see Chapter X (Analysing Costs and Margin).
1 THE PARTICIPATION OF THE POOR IN SUPERMARKETS AND OTHER FOOD DISTRIBUTION VALUE CHAINS IN VIETNAM The participation of the poor in off-season vegetable value chains to Hanoi Ho Thanh Son (VASI), Vu Trong Binh (VASI), Paule Moustier (CIRAD) January 2006, Hanoi, Malica/M4P report.

51
Box 16: An Example of Unit profits and incomes along the value chain for onions
The analysis of distribution of incomes among onion stakeholders in the chain from Niger to Ivory Coast in 1995 shows that incomes are by far the larger for urban wholesalers, and the lower for producers and retailers, even though the retail stage has the highest profit per kilo. A significant part of wholesalers’ incomes is actually distributed to other actors of the chain in the form of gifts, in kind and cash, to help them in difficult times. Distribution of incomes from onion production in Niger to retail sale in Abidjan in 1995
Tons/ Profit/kilo/ Number of stakeholders stakeholder
Sale price (USD/kilo)
Costs/kilo (apart from purchase price)
stakeholder Total income/stakeholder/year (USD)
Producers 6950 4 0.14 0.04 0.10 400 Assemblers 15 1565 0.16 0.01 0.01 12520 Mobile wholesalers
30 703 0.30 0.13 0.01 8436
Urban wholesalers
10 1984 0.38 0.02 0.07 134912
Semi-wholesalers
175 113 0.53 0.02 0.13 14238
Retailers 11200 2 0.95 0.04 0.37 744 Source: David (1999); Moustier and Zebus (2002) David, O. Les réseaux marchands africains face à l’approvisionnement d’Abidjan. Thèse de troisième cycle, Paris, Université de Paris X Nanterre, 525 p. et annexes. 1999. Moustier, P., Zebus, 2002. The effects of produce properties on the organisation of vegetable commodity systems supplying selected African cities. Montpellier, INRA/MOISA, working paper n°11 Step 5: Calculate Income variability over time Seasonality in income is important to model, as substantial variations can occur. Value chain investigations which only obtain single estimates of income at a particular point in time may result in biased estimates of income. Variability in income increases risk of production and affects stakeholders’ decisions to invest in particular activities. The table below gives an example of a simple survey instrument designed to determine seasonal levels of cash constraint. This is particularly important for farmers who grow staple crops (such as rice). Overall, cash becomes the most constrained in the period just prior to harvest. After a large harvest, households often have sufficient cash for their needs before planting begins and inputs need to be purchased. There may be large differences between households in different locations. This is a function of market access as households in those remoter areas have to rely on their own resources to make ends meet during the lean months. There also may be significant differences between the cash constraint profiles of poor, average, and better-off households. Box 17: Example of Survey Question to Examine Seasonal Cash Constraints We want to find out what are the seasonal cash constraints for the farmers. Get the farmer to place a or a ⌧ in the appropriate row for each month.
Jan Feb Mar Apr May Jun Jul Aug Sep Oct Nov Dec Surplus Cash Enough Cash Lack of Cash
Source: ACI 2005

52
Figure 6 Monthly Cash Constraint by Wealth Category
1
2
3
January February March April May June July August September October November December
Month
Poor Average Better Off Total/ Overall
Lack of Cash
Surplus Cash
Enough Cash
Source: UNDP/NERI Farm Family Income Survey 2005. Step 6 – Appraising the place of income in livelihood strategies Benchmarking incomes relative to the poverty line is a first way to consider the involvement of the poor in the value chain. In the supermarket study (Mousier and al, 2006), after comparing street vendors’ incomes with the 2005 poverty threshold in Hanoi, i.e., 500,000 VND/month, we found that 18% of street vendors are poor, while no poor households is found in the formal markets, nor in the shops or supermarkets. Comparing income with subsistence level expenses is another way to appraise the role of the participation in the value chain in livelihood strategies. For instance, the incomes of peri-urban vegetable commercial farmers in different African cities have been compared with the income necessary for subsistence (Moustier and Danso, 2006)2. In Brazzaville and Bangui, at the time of surveys, market gardening yielded enough income to provide for the basic food requirements of the family, plus housing, clothing and schooling expenses (see Table 12). Hence, even if the total number of farms is small as compared with total urban population, their functioning demonstrate that urban agriculture is one of the – too few - sources of stable income that should be protected and considered in a kind of portfolio of other cash-earning activities with limited initial capital requirements. Table 12-Estimates of family commercial farmers’ incomes compared with subsistence income City (year) (source) Number Estimation of average
monthly income $ Estimation of minimum subsistence food expenditures $
1000 producers 150 Brazzaville (1989) (Moustier, 1996) 1700 retailers 120
100
300 producers 280 Bangui (1991) (David, 1992) 300 wholesalers 290
60
2000 producers Ne Ne Yaoundé (2002) 2500 retailers ne Ne
2 P. Moustier and G. Danso, 2006, Local economic development and marketing of urban produced food in R. Veenhuizen (ed) Cities farming for the future, IDRC, Ottawa (on line).

53
It is also important to consider the place of incomes generated by the value chain in the total household incomes. In the previous example of street vendors in Hanoi and peri-urban agriculture in Africa, the business represented more than 90% of cash income of the household, which means that an improvement of the income generated by the value chain will have significant impact on the family incomes, and that the participants in the value chain will be particularly willing to invest their energy in the upgrading of the value chain, which may not be the case if the commodity had more minor contribution to the household income. Step 7 – Comparing incomes across different value chains The comparison of incomes generated by different value chains characterized by different governance structures or different upgrading strategies (the two being often related) enables to recommend the promotion of governance and upgrading which generates the highest incomes and/or the most balanced ones across different stakeholders. For instance the flavoured-rice value chain study3 shows that the association-driven chain, with the labeling of flavoured rice by a farmers’ association and sales to supermarkets, generates more income to the farmers than the traditional chain. Comparing the incomes in the value chains before and after upgrading is also a good way to assess the economic impact of value chain upgrading. Yet it is often difficult and time-consuming to carry out “before” and “after” evaluation, and comparing “with” and “without” situation at the same period of time, for different stakeholders, is generally more feasible.
What we should know after analysis is complete After having followed all the steps, the key questions outlined below should be able to be answered: • Are there differences in incomes within and between different levels of the value chain? • What is the impact of various governance systems on income distribution between and within
various levels of the value chain? • What are the impacts of the distributional outcomes of the value chain on the poor and other
disadvantaged groups, both currently and into the future? • What are the changes in incomes that result from the development of various types of value
chains? • What is the variability of incomes and risks to livelihoods within and between various levels of
the value chain?
3 Vu Trong Binh, Dao Duc Huan, Pham Trung Tuyen. 2005. Assessing poor consumers’ access in DVCs: the case of fragrant tam xoan rice from hai Hau, MALICA/M4P, Hanoi, 38 p.

54
Tool 6 – Analysing Employment in the Value Chain
Objectives 1. To analyze the impact of value chain on the distribution of employment within and between
various levels of the value chain at the level of the individual stakeholders. 2. To describe distribution of employment along the value chain and amongst the different wealth
classes and how the poor and other disadvantaged groups participate in the chain. 3. To describe the dynamics of employment within and along the value chain and the inclusion
and exclusion of the poor and other disadvantaged groups. 4. To analyze the impact of different value chain governance systems on employment distribution. 5. To analyze the impact of different value chain upgrading strategies on employment distribution.
Key Questions • What are the differences in employment within and between different levels of the value chain? • What are the impacts of the distributional outcomes of the value chain on the poor and other
disadvantaged groups, both currently and into the future? • What are the changes in employment that result from the development of various types of
value chains? • What is the variability of employment and risks to livelihoods within and between various levels
of the value chain? • What is the impact of various governance systems on employment distribution between and
within various levels of the value chain? • What is the impact of various value chain upgrading strategies on employment distribution
between and within various levels of the value chain?
Steps Step 1: Define the Typology of Actors Define a typology for each major actor at each stage of the value chains according to structural characteristics. There can be different types of farmers, collectors, wholesalers and retailers. As was the case with defining the typology for income levels along a value chain, the most important categorization for pro-poor Value Chain analysis is a typology based on income levels or categories. For example for flower retailers in Hanoi (Vietnam) there are at least three different broad categories: hawkers, retailers in wet markets and retailers with their own flower shop. These retailer categories ar very much related to different wealth levels, with hawkers being the poorest. Examples of other categories which could be used are: Skills – unskilled, low-skilled, high-skilled Gender – male, female Ethnicity – different ethnic types

55
Business Type – micro, small, medium, large Period – day labor, temporary labor, permanent labor Status - Family, Hired
Origin - Temporary migrant, permanent migrant, locally hired Step 2: Determine Employment at Each Level Employment at each level of the value chain can be determined in different ways:
1. Wholesalers: Normally conducting a census among wholesalers is not so time consuming. One should only be aware of the seasonal variations. In the off season the number of wholesalers is much smaller than in the main season.
2. Retailers: Based on the total traded volume of a product in a value chain and the daily
turnover of a retailer one can calculate how many retailers are involved. But if the researchers have some additional time available one can also count all retailers in a sample area (e.g. wet market retailers) and then upscaling the figures to the total area. For example, count the total number of wet markets in a city (fe. 130) and then take a random sample of various wet markets (f.e. 15). Visit these wet markets, count the number of retailers on these wet markets or ask the market administrator (if present) how much booths he rents out. Calculate the average number of retailers per wet market and multiply with 130 to get a crude estimate.
3. Transporters: Estimate the total volume of sales, and the typical volume per transport unit
(trucks, motorbike, carts, boats, etc.). Then estimate number of people required per transport unit, the time required to transport, and number of FTEs this generates.
4. Processors: Identify the number of processors in an area from official sources (e.g.
registration certificates), identify number of informal processors from key informant interviews.
5. Collectors: Interviews with village leaders / communes. Number of collectors under each
trader/wholesaler. Estimate the total volume of sales, and the typical volume per transport unit (trucks, motorbike, carts, boats, etc.). Then estimate number of people required per transport unit, the time required to transport, and number of FTEs this generates.
6. Farmers: Estimate number of farmers based on hectarage under each crop and yields
(related to traded volumes). Cross check with district authorities for official figures. Sales of key inputs sold by input providers at bottleneck points (e.g. seed). Need to distinguish between smallholders and commercial farmers.
7. Hired Laborers: estimate from partial budgets and scale up.
A fast way to get an idea of the number of people involved within a value chain is to carry out interviews with wholesalers. Wholesalers are often located in just a few locations and there are normally just a small number of wholesalers compared with the number of farmers, collector or retailers. Through a combination of census counts (counting the total number of wholesalers in a certain location) and interviews with a number of wholesalers one can get a good estimated of the total traded volume of a product in the value chain (f.e. tons of avocados, or number of roses). If one then conducts some interviews with the other actors in the chain to estimate their typical turnover one can caluclate how much actors are involved (see example xx). As many actors in agricultural value chain are only involved seasonally, it could be useful to convert the collected employment data into a standardized indicator. This allows comparisons among various value chains. One could use for example the Full Time Equivalent (FTE) as main indicator for the employment created by a certain value chain. One just simply defines or agrees on how much labour days per year are considered 1 FTE, for example 240 days..If someone only

56
works for 120 days, this is accounted as a ½ FTE. It is also important to consider both direct and indirect employment – in administration and ancillary services, farmers can hire labor to work on lower valued crops while they concentrate their own labour on higher valued crops. Due to employment diversification strategies, the employment in one value chain may be only a small fraction of the total employment of a household; especially for service activities all along the chain. The share of employment represented by the value chain should be calculated in order to accurately model livelihoods and livelihood responses. Take Note
For a quick insight in the employment generation by a value chain focus resources on the use of participatory analysis tools with WHOLESALERS and TRANSPORTERS. They are often concentrated in just a few locations (saves time in visiting) and have a very good overview of traded volumes and the various upstream and downstream channels.
Step 3: Calculate the employment distribution by levels of the value chain Conduct field surveys to give an indication of the different dimensions of employment at each level of the chain according to the typology. These surveys can be short and simple, just to get some idea of turnover volumes per actor (e.g. mean harvested number of roses per farmer per year, average annual traded volume per collector per day/month/season/year etc.), income levels, number of hired labourers etc. Comparison of employment over different stages in the chain, should be undertaken according to the various typologies developed in Step 1. This gives a picture of the distribution of benefits to individuals within the framework of enterprises at each level of the value chain. Step 4: Analysis of the employment distribution contribution Comparing the distribution of employment across each level of the value chain enables a comparison of benefits accruing to actors at various levels of the chain. This is complementary to the analysis of the margins and the profits accruing at each level of the chain. However, an analysis of the employment gives a more accurate picture of the true distribution of benefits at each level of the value chain, as it reflects the often vastly different number of players at each level of the chain. A matrix should be developed that shows the numbers of actors by typology at each level of the chain (see example below).
Table 13: Example of analyzing the number of actors at each level of the chain
Farmer Collector Trader Wholesaler Poor Average
Number of People
Better-off Poor Average
Volume of sales
Better-off Unskilled Low-Skilled
Number of people
High-Skilled …
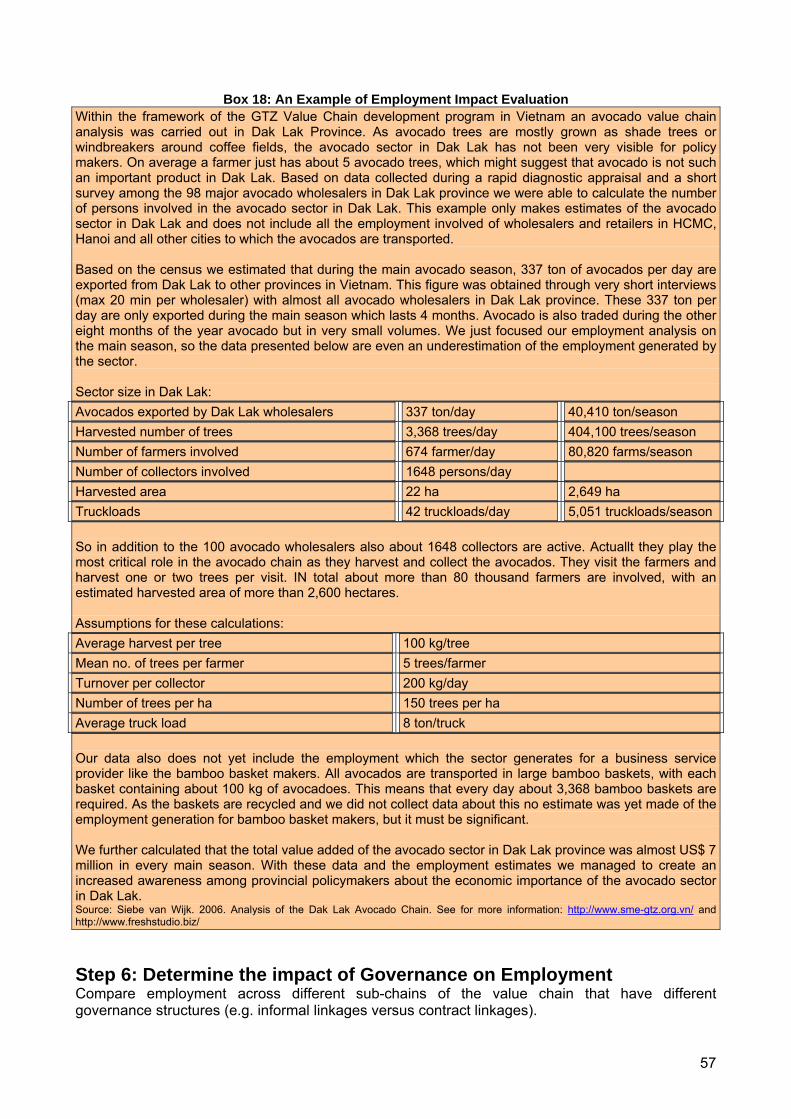
57
Box 18: An Example of Employment Impact Evaluation
Within the framework of the GTZ Value Chain development program in Vietnam an avocado value chain analysis was carried out in Dak Lak Province. As avocado trees are mostly grown as shade trees or windbreakers around coffee fields, the avocado sector in Dak Lak has not been very visible for policy makers. On average a farmer just has about 5 avocado trees, which might suggest that avocado is not such an important product in Dak Lak. Based on data collected during a rapid diagnostic appraisal and a short survey among the 98 major avocado wholesalers in Dak Lak province we were able to calculate the number of persons involved in the avocado sector in Dak Lak. This example only makes estimates of the avocado sector in Dak Lak and does not include all the employment involved of wholesalers and retailers in HCMC, Hanoi and all other cities to which the avocados are transported. Based on the census we estimated that during the main avocado season, 337 ton of avocados per day are exported from Dak Lak to other provinces in Vietnam. This figure was obtained through very short interviews (max 20 min per wholesaler) with almost all avocado wholesalers in Dak Lak province. These 337 ton per day are only exported during the main season which lasts 4 months. Avocado is also traded during the other eight months of the year avocado but in very small volumes. We just focused our employment analysis on the main season, so the data presented below are even an underestimation of the employment generated by the sector. Sector size in Dak Lak: Avocados exported by Dak Lak wholesalers 337 ton/day 40,410 ton/season Harvested number of trees 3,368 trees/day 404,100 trees/season Number of farmers involved 674 farmer/day 80,820 farms/season Number of collectors involved 1648 persons/day Harvested area 22 ha 2,649 ha Truckloads 42 truckloads/day 5,051 truckloads/season So in addition to the 100 avocado wholesalers also about 1648 collectors are active. Actuallt they play the most critical role in the avocado chain as they harvest and collect the avocados. They visit the farmers and harvest one or two trees per visit. IN total about more than 80 thousand farmers are involved, with an estimated harvested area of more than 2,600 hectares. Assumptions for these calculations: Average harvest per tree 100 kg/tree Mean no. of trees per farmer 5 trees/farmer Turnover per collector 200 kg/day Number of trees per ha 150 trees per ha Average truck load 8 ton/truck Our data also does not yet include the employment which the sector generates for a business service provider like the bamboo basket makers. All avocados are transported in large bamboo baskets, with each basket containing about 100 kg of avocadoes. This means that every day about 3,368 bamboo baskets are required. As the baskets are recycled and we did not collect data about this no estimate was yet made of the employment generation for bamboo basket makers, but it must be significant. We further calculated that the total value added of the avocado sector in Dak Lak province was almost US$ 7 million in every main season. With these data and the employment estimates we managed to create an increased awareness among provincial policymakers about the economic importance of the avocado sector in Dak Lak. Source: Siebe van Wijk. 2006. Analysis of the Dak Lak Avocado Chain. See for more information: http://www.sme-gtz.org.vn/ and http://www.freshstudio.biz/ Step 6: Determine the impact of Governance on Employment Compare employment across different sub-chains of the value chain that have different governance structures (e.g. informal linkages versus contract linkages).

58
Step 7: Determine the impact of Technology Structures on employment Comparing employment across different sub-chains of the value chain that have different technology structures (e.g. supermarket chains versus traditional retailing chains, village rice mills versus commercial rice mills, smallholders versus commercial farms). For instance, the supermarket development is expected to come together with reduction of employment of the poor, due to the use of capital-intensive versus labour-intensive technology in supermarket distribution. To reach poverty alleviation objectives, the diversity of retail distribution, including distribution by small-scale markets, should be maintained.
Step 8: Determine the Employment Variability over time Look at the changes in employment over time, both within the year (seasonality), as well as between years. Timelines of changes in employment across different sub-chains over a long period (e.g. 5 years)
What we should know after analysis is complete After having followed all the steps, the key questions outlined below should be able to be answered:
1. What are the differences in employment within and between different levels of the value chain?
2. What are the impacts of the distributional outcomes of the value chain on the poor and other disadvantaged groups, both currently and into the future?
3. What are the changes in employment that result from the development of various types (f.e. vegetable trade through traditional wet markets versus modern supermarkets) of value chains?
4. What is the variability of employment and risks to livelihoods within and between various levels of the value chain?
5. What is the impact of various governance systems on employment distribution between and within various levels of the value chain?
6. What is the impact of various value chain technologies on employment distribution between and within various levels of the value chain?

59
Tool 7 –Governance and Services Introduction The analysis of governance and services aims at investigating the rules operating in a value chain, and at assessing the distribution of power among different actors. Governance is a broad concept, which encompasses the system of coordination, organization and control that preserves and enhances the generation of value along a chain. Governance implies that interactions between actors in the value chain are not random, but are organized in a system that allows meeting specific requirements in terms of products, processes, and logistics. For example, access to international markets often depends on compliance with international rules and standards; an effective governance system ensures that the required standards can be met by all the nodes in the chain. Governance and services analysis can help identifying levers for interventions aimed at increasing the overall efficiency of the value chain. Rules may be inadequately set and weakly maintained, decreasing the potential for value generation. Analyzing governance and services can also help assessing the advantages and disadvantage of the rules for different groups, thus reveal systemic constraints affecting weaker participants (poor population strata, micro-enterprises etc). Value chain actors may have limited access to services and other forms of support required for meeting value chain standards; insufficient support can hamper their possibility to actively participate in higher-value segments of the chain. Furthermore, the balance between formalized and informal agreements should be matched by adequate institutional arrangements. Weak institutional setting (or institutional setting that are not suitable for the specific value chain context) can result in an underdevelopment of vital linkages, and can constitute barriers to the integration of the poor. Governance and services analysis can help understanding important issues related to the integration of the poor into value chains. First of all it is important to use the governance analysis to define whether the poor have access to resources or whether there are structural barriers to access the value chain. For example, when resources are controlled by a limited number of powerful actors related by friendship and trust relationships it is likely that new actor willing to enter the chain will encounter social and economic barriers. In a value chain dominated by few central actors, the poor are likely to always be at a disadvantage.

60
Box 19 Example of power imbalance - The shrimp export industry in Bangladesh In 1997, the fourth leading export item in Bangladesh was frozen shrimp and fish, with a 7.3 percent share of the total export market. The major importers at the time were the European Union (EU), accounting for 34–50 percent of Bangladesh’s exports, the United States at 23–38 percent, and Japan at 15–26 percent, depending on the year. At that time, the value per kilogram of Bangladesh’s frozen shrimp was lower than average for the Asian region. Bangladesh had a reputation for producing seafood that sometimes did not meet minimum international standards as specified by the Codex Alimentarius Commission. With a low percentage of the world market, a lower-valued product, and a negative reputation in quality, Bangladesh has been a price-taker rather than a price-setter. THE EU BAN On July 30, 1997, the EU banned imports of fishery products from Bangladesh, as a result of inspections of Bangladesh’s seafood processing plants. Inspections found serious deficiencies in the infrastructure and hygiene in processing establishments and insufficient guarantees of quality control by Bangladeshi government inspectors. The ban was estimated to cost the Bangladesh shrimp-processing sector nearly US$15 million in lost revenues from August to December 1997. The impact on both the industry and the economy of Bangladesh was substantial. The only way Bangladesh could strengthen its export position in the shrimp market was to improve the safety and quality of its exports. Over the last two decades, with a major effort in the late 1990s, safety improvements have been made by the industry and government, with the technical assistance of bilateral and multilateral agencies. While the short-term loss in foreign currency from the EU ban was high for a developing country, the ban did increase the commitment by industry and government to raise product quality to meet international standards. Both exporters and government made major investments in plant infrastructure and personnel training in order to achieve international technical and sanitary standards. This included new employee acquisition and training, sanitation audits, plant repair and modification, new equipment, new laboratories and other costs. INVESTING IN SAFETY Some upgrades were in progress at the time of the EU ban. By 1997, the Bangladesh shrimp processing industry had invested $17.6 million in plant upgrades, the government had invested $382,000 in laboratory and personnel upgrades, and outside partners had invested $72,000 in training programs in Bangladesh. Unfortunately, these improvements were not enough to prevent the ban. The total fixed investment cost of $18 million was only slightly higher than the nearly $15 million in lost revenue from the ban over a period of five months. These improvements would have almost been paid for, had they been implemented in time to make the ban unnecessary. Research has also determined that the annual recurring costs to maintain HACCP programs and meet international standards would be $2.2 million for industry and $225,000 for government. Subsequent inspections by the EU determined that some plant improvements meet EU standards. Subject to certain provisions, the EU ban was lifted for six approved establishments for products prepared and processed after December 31, 1997. By July 1998, a total of 11 plants had been approved for export to the EU. Collective efforts by the industry, the Bangladesh Department of Fisheries, and the Bangladesh Frozen Food Exporters Association have continued to strengthen the export-processing sector. By 2002, out of 65 plants licensed for export by the government, 48 plants had EU approval. Source: (Cato and Subasinge 2003)
The analysis of value chain governance and services is best approached by separating three dimensions: Rules and Regulations, Enforcement and Services.
Rules and Regulations: there are generally a set of rules and regulations that value chain actors must abide to, in order to participate in the chain. Rules and regulations can be either formal (with official legislative backing) or informal; at the same time, rules can be set by actors within and outside the value chain. In the past, rules were largely concerned with meeting basic cost parameters and guaranteeing supply; they usually involved agreement between buyers and suppliers within the chain.
Enforcement: Enforcement includes the methods and tools used to check compliance with the rules, and the system of sanctions used to promote observance of the rules. Without effective enforcement, rules may be set - but not kept. The first aspect of enforcement is monitoring at different stages of the chain and the second aspect is the sanctioning system; it can include both sanctions (aimed at punishing defectors) and incentives (to encourage observance of the rules). Services: services define the ways in which actors within and outside the chain provide assistance to other value chain participants, to help them meeting the requirements of rules and regulations.

61
Services can be provided by actors within the chain, as in the case of leading buyers (or their buying agents) that directly help their suppliers achieve quality standards. Alternatively, services can be provided by actors outside the chain.
Objectives The main objectives of governance and services analysis are the following:
• Analyse how actors in the value chain coordinate their actions through formal and informal rules
• Understand how compliance to the rule is monitored, and which sanctions and incentives are available to promote the implementation of the rules
• Analyse how different groups of value chain participants receive (or lack access to) adequate forms of support that can help them achieve the required standards
• Assess the impact of the rules on different sets of actors, particularly on disadvantaged groups
• Understand whether a value chain is mostly based on formalized arrangements (contracts, for example) or on trust-based, informal agreements
Key Questions • Which are the formal and informal rules that regulate the actions of value chain participants? • Who establishes the rules? • Who monitors the enforcement of the rules? What makes the rules effective? • Why are the rules needed? What are the advantages and disadvantages of the existing rules
for each category of actors within the value chain? • Are there effective services to support participants in meeting the rules and requirements of the
value chain?
Steps
It is difficult to capture all of the governance and services issues in a fixed-format questionnaire. Most of the data needed for analyzing governance is of qualitative and un-quantifiable nature. For this reason it is recommended to use open-format and intensive interviews with value chain participants and key informants; this is particularly true when approaching an unfamiliar value chain. (See also the mapping Tool 2 for some tips on how to visualise it) Semi-structured or open interviews should always be used during the first rounds of data collection, when the main aim is the generation of a list of the rules operating in the value chain, and of the actors that establish, monitor and enforce them (Steps 1 and 2). Once a comprehensive list of actors and rules has been built, some structured sections and coded answers can be added to the questionnaire. Step 1: Map stakeholders Generate a list of all the stakeholders (within and outside the value chain) that are potentially able to influence the governance structure. Use the Mapping tool to identify all the relevant actors within the value chain. Identify other external organizations and institutions through interviews with key actors in the chain. To build a more comprehensive list, both desk research and qualitative interviews with key actors in the chain are advised. Since knowledge of wider rules might not reach down to lower levels of the chain, interviews should primarily be held with major players, particularly with final links that interact directly with international markets. Once the list is complete, it can be further disaggregated for each level of the value chain based on different categories including wealth (poor, average, better off); business type and scale (micro, small, medium, large); ethnicity; gender. Particularly when pro-poor analysis is involved, separating actors according to wealth and scale is of the upmost importance. The categories can prove useful

62
to analyze the impact of the governance structure on different groups, assess the level of information asymmetries along the chain etc. List all stakeholders in a table and arrange them on a chart. Step 2: Identify Rules and Regulations This step is mainly concerned with the following issues: generating a list of all the rules that govern actors in the value chain; identifying the actors that set the rules; understanding the reasons behind the rules (why are the rules necessary?); assessing how the rules affect different categories of actors within the value chain; understanding how much different actors know about the rules; and assessing the rate of change of the rules. Rules and regulation identification should be started by interviewing key actors in the chain (major processors, exporters etc), as they should be more aware of these issues. After the initial interviews, other actors can be interviewed following backward linkages in the chain. Initial information could be gathered utilizing semi-structured interviews. During the first round of semi-structured or open interviews with key actors, a questionnaire could be developed based on the following guidelines. Different sections can be chosen depending on the desired focus of the research:
• Ask the informant to list all the rules and regulations (formal and informal) that they are required to abide to in order to operate in their market segment. Ask the informant to clearly explain how the rules are translated in detailed sets of instructions related to cost, quality, processes, delivery times etc. Also, take note of additional sources of information you might later consult if you need to know more about the requirements of each regulation (websites, statutes, legal documents etc).
• List all the rules and regulations that the informants require their suppliers to abide to. Ask them to list all the actors (or categories of actors) with whom they directly stipulate arrangements (contracts, informal agreements) according to each rule. Again, ask them to explain how the rules are codified in specific sets of instructions (quality specifications, costs, delivery time, inputs, equipment and processes to be used for production etc)
• For each rule / regulation (both upstream and downstream), ask the informant to explain which are the main advantages and disadvantages. Examples of advantages might be: expanded market access; possibility to implement a reliable quality management system; efficient production plans etc. Disadvantages might include: high costs / decreased margins; demanding requirements in terms of processes, technology, scale; difficulties in finding local suppliers or skilled workers that can match the requirements etc.
• For each rule / regulation, ask the informant to explain why it is necessary, and in which way it helps maximize the efficiency and the level of coordination within the value chain
• For each rule / regulation, ask the informant to explain how the rules have been set, who set them, when the rule was set. Also, try to understand if there have been major changes in the rules over time, and how the changes have affected the business.
• Ask the informant to explain you how and in which degree she/he has been consulted during the rules-setting process, both at the time of original formulation and when major changes have been undertaken. The informant should report which of her/his requests and suggestions have been incorporated into the rules, and which have instead been ignored. Also ask which interventions the informant suggests for improving the rules.
• For poor participants in the value chain, pay particular attention to whether they poor participants can understand the rules, particularly when formalized. For example, if there is a written contract, can the poor understand the terms.
At this point, there should be enough information to generate a matrix of actors and regulations. A matrix can be used to sum up the results of the analysis, and also offers a tool for structuring some sections of the questionnaire, which can supplement the qualitative analysis during the next rounds of interviews.

63
Table 14: Example of Matrix for actors and regulations Rule 1 Rule 2 Rule 3 Rule 4 Rule 5 Rule 6 … European Union Government Industry association Exporters Assemblers Buying agents Preprocessors Local traders Producers … Data summarized in the matrix can also be used to generate a graphical illustration of the different sets of rules operating in the chain and of their field of validity. They can be overlapped to the mapping of the value chain, as shown in the figure below.
Figure 7: Example of field of validity of different rules
Rule maps can also help to identify the barriers that prevent specific groups of participants in accessing sub-value chains that are regulated by very demanding specifications. As in many cases entry barriers can take the form of specific equipments and technology, rule maps can prove valid instruments to be integrated in the analysis of Knowledge and Technology.

64
Try this idea Comparing results across different categories of actors
Important information can emerge from the comparison of tables, maps and indicators aggregated for different categories of actors (poor farmers, small-scale processors etc). For example, try to compare the rules map that emerge from each group of actors, as these will give you an idea of how different groups perceive the overall structure of the value chain. It is likely that strong information asymmetries will emerge from the comparison.
Step 3: Analyze Enforcement This step is mainly concerned with the following issues: identification of who monitors compliance to the rules; identification of the system of sanctions available to punish defectors, and the system of incentives used to promote the application of the rules; and assessment of the effectiveness of the sanction / incentives system. First, produce a list of the actors involved in the enforcement system. Two separate sets of matrixes can be generated, one of monitoring actors / monitoring tools, another of sanctioning actors / sanctioning tools. In the case of enforcement, it is particularly important to collect data regarding the frequency of inspections received by each actor from the different monitoring agents. Also, it is important to record the frequency with which each actor has been subject to specific forms of sanctions. It can also be important to compare maps and tables across different categories of actors (poor / non-poor). It is important to assess the level of transparency in monitoring and enforcing the rules. For example: are quality requirements clearly set in contracts, and translated in an explicit set of parameters that cannot be subject to discretional interpretations? Are independent parties involved in the monitoring process, or is it totally managed by powerful actors? Discretional quality controls coupled with power asymmetries can in fact result in a monitoring system that disadvantages the poor. Furthermore, discretional rules can give room to corruption. Step 4: Analyze Support Services The main focus of service analysis is to understand by whom (and through which means) value chain participants are supported in achieving compliance to the rules, and to assess whether the level of support is adequate to the requirements of the value chain. The main questions to be addressed are the following: who provides assistance to value chain participants; which forms of assistance are available for different categories of value chain actors; which is the degree of satisfaction of different categories of actors with the services and assistance provided; and which linkages / services should be improved. Whilst specific requirements set in the legislative sphere can represent a barrier to the poor, improving executive governance can become an important pro-poor lever. Poor participants in the value chain can be expected to face significant barriers in accessing demanding value chains, in term of technology, skills, scale, investments. It is therefore important to assess the level of services and support the poor receive from other actors within the value chain (for example, leading firms or buyers) and from external organizations. Particular attention should be given to understanding the ways in which actors within or outside the value chain are providing assistance to weaker participants in meeting the rules. As executive governance can be exercised by actors within and outside the chain, also in this case be sure to include all external actors. An example of major parties involved in service provision are shown in the following table (Kaplinsky and Morris 2001).

65
Table 15: external actors assisting firms to meet chain rules
Change agents Sources of data
External to the chain
• Consulting firms • Learning networks • Government
agents
• Interviews with consultants; • CEO or production control in firms CEO or production control
in firms; • Business Associations CEO or production control in firms; • interviews with government officers (local and national)
responsible for industrial policy Internal to the chain
• Rule-setting firm • Buying agent of
rule setting firm • First-tier suppliers,
or other leading suppliers to rule-setting firm
• Supply chain management or purchasing function in purchasing firms: CEO or production control in supplying firms
• Interviews with agent and CEO of recipient firms; supply chain management operations
• Supply chain management or purchasing function in purchasing firms; CEO or production control in supplying firms
Source: (Kaplinsky and Morris 2001)
What we should know after analysis is complete After having followed all the steps, the key questions outlined below should be able to be answered: • Which are the formal and informal rules that regulate the actions of value chain participants? • Who establishes the rules? • Who monitors the enforcement of the rules? Which are the sanctions and incentives used to
make the rules effective? • Why are the rules needed? What are the advantages and disadvantages of the existing rules
for each category of actors within the value chain? • Are there effective systems to support participants in meeting the rules and requirements of the
value chain?
66
Tool 8 - Linkages
Introduction Trust and linkages are inextricably linked within a value chain. Organizations without linkages have little reason to “trust” each other, even if they do not “distrust” the other party. Conversely, organizations with linkages may not need to have trust in order to do business if there are some enforcement mechanisms in place to ensure compliance with a given set of rules governing their relationship (for example, contracts and other legal regulations). However, in the absence of an effective mechanism of enforcement, linkages without trust are invariably weak. Linkages analysis involves not only identifying which organizations and actors are linked with one another, but identifying the reasons for those linkages and whether the linkages are beneficial or not. Actors in the value chain link with one another because they purportedly obtain benefit from those linkages. An identification of the benefits (or lack of them) goes a long way to identifying the constraints in increasing linkages and trust amongst value chain participants. Strengthening the linkages between the different stakeholders in the marketing system will lay the groundwork for improvements in the other constraints; establishment of a contract regime, improvements in post-harvest and transportation systems, improvements in quality, and the effective use of market information. From a pro-poor perspective it is
Objectives 1. To describe the linkages between different actors in the value chain and their linkages with
other actors ancillary to the value chain. 2. To describe the linkages between stakeholders by poor and non-poor actors and the
implications for pro-poor development.
Key Questions
1. Dimensions of analysis: • Do linkages exist? • How important are linkages? • How many different actors are involved? • What is the frequency of contact? • What is the level of formality? • What are the reasons for linkages, reasons for no linkages? • What are the relative Benefit/Costs of linkage? • What is the level of trust?
2. Temporal Dimensions • How long have these linkages existed? • How has the formality of the linkages changed or evolved? • What is the rate of expansion of linkages over time?
Steps Step 1: Map Respondents and Create Typology When interviewing, separate out into different categories of respondents in order to analyze later the differences in linkages between the different categories

67
Possible typology of respondents: Wealth – poor, average, better-off
Skills – unskilled, low-skilled, high-skilled Gender – male, female Ethnicity – different ethnic types
Business Type – micro, small, medium, large Period – day labor, temporary labor, permanent labor Status - Family, Hired Origin - Temporary migrant, permanent migrant, locally hired Step 2: Identify Dimensions Identify relevant dimensions of linkages to investigate. Dimensions of analysis could include the following: • Existence of linkages (Yes/No) • Number of different actors (Number of different people in each organization grouping) • Frequency of contact (Number of times per year met) • Level of formality (Informal/Verbal Agreement/Written Contract) • Reason for linkages / Reason for no linkages • Relative Benefit/Costs of linkage (Benefits>Costs / Benefits=Costs / Benefits < Costs) • Level of trust (distrust / no trust / little trust / some trust / fully trust) Step 3: Survey Stakeholders Conduct survey interviews with relevant value chain stakeholders to identify their linkages with other stakeholders in the chain. For example, interview farmers, traders, processors, etc. First a list of relevant value chain stakeholders is enumerated. Secondly a set of questions on trust are developed and used in a survey instrument. (see example in Table 16)
Table 16 Extract from Survey Questionnaire on Value Chain Linkages in the Bangladesh Shrimp Industry
Business Linkages with Other Organizations
Linkage How Many Different Individuals/Groups/Organizations
Did Your Business Meet With During Year
Average Frequency of Meeting
(times per year) Linkage
Organization Yes No 0 1 2 3 4 5 6-10
11-20
21-50
51-100
101-200
200-500 >500 ≤1
2-3
4-6
7-12 >12
Farmer Farmer Group Farmer Cooperative/ Association ……..
If Linkage = YES, then Typical Nature of Linkage
(From Informal to Formal Written Contract) If Linkage = YES, then
How Much Do You Trust These Individuals/Groups/Organizations? Linkage Organization
Informal Verbal Arrangement
Formal Written Contract Distrust No
Trust A Little Trust
Some Trust
Fully Trust
Farmer Farmer Group Farmer Cooperative/Association ….
Source: (Agrico, ANZDEC et al. 2004) Step 4: Analyze the results of the survey. The results of the survey can then be analyzed in tabular format as well as graphically. The results of the questionnaire can be analyzed in table format or graphically, for example using “Radar

68
Charts” in Excel. Qualitative indicators can be transformed into quantitative indicators by assigning numerical levels – e.g. Levels of Trust (distrust, no trust, little trust, some trust, fully trust = -1, 0, 1, 2, 3). Averages can be calculated to aggregate across individual respondents. An example is shown in Figure 8.

69
Figure 8 Linkages with Different Organizations by Farm Family Respondents
Linkages with Organizations by Farmers
0
20
40
60
80
100Farmer
Farmer GroupFarmer Cooperative/ Association
Trade and Industry Associations
Input Trader
Collector/Output Trader
Private Processors
Private Exporters
Private Wholesaler
Private Retailer
State Owned Enterprise Processor
State Owned Enterprise Exporter
State Owned Enterprise Wholesaler
State Owned Enterprise RetailerPrivate Seed/Hatchery/ Breeding Companies
Private Feed/Medicine/ Fertilizer/ PesticideCompanies
Private Machinery and Equipment CompaniesSOE Input Companies
National Government Commercial Banks
Private Commercial Banks
Microfinance Institutions
Moneylenders
National and International NGOs
Local NGOs
Research Stations and Organizations
Government Extension Agencies
Government Agencies
Provincial Level Government Administration
District Level Government AdministrationMass Organizations
PoorBetter-Off
Source: UNDP/NERI Farm Family Income Survey 2005. (ACI 2005) Percent of Respondents

70
Step 5: Identification of Power Distribution The issue of power is complex and still highly debated in the value chain literature. For the practical purposes of this handbook, power will defined as directly related to the level of concentration and access to key assets in the hands of a limited number of actors. Key assets can be both physical resources (capitals, land, credit, etc) and intangible resources (market information, knowledge, personal relationships, reputation, etc). Actors who have exclusive access to key assets and resources can be thought as more powerful and have the capacity to influence others in the chain. There are a number of indicators which can be taken into consideration in order to measure the power of actors operating in the chain; they are presented in Table 17 below. Most of the indicators are indexes of concentration (share) and can be combined together in order to understand the overall control exerted on the key resources by specific actors in the chain. Table 17: how to identify the key governors in the chain Indicators Strengths and weaknesses Source of data
Share of chain sales Not a strong indicator as may only be a reseller of bought-in materials and may lack influence
Balance sheets
Share of chain value added
A better indicator for measuring size since it reflects the share of the chain’s activities Firm-level interviews
Share of chain profits
May be a good reflection of chain power, but may also arise from monopoly control over scarce raw materials (e.g. platinum) and may have little influence over downstream processing
Balance sheets, but it is likely that this data will only be available for publicly owned companies
Rate of profit A poor indicator since minor players in the chain may be relatively profitable but have little influence
Balance sheets, but it is likely that this data will only be available for publicly owned companies
Share of chain buying power
A good indicator of power, particularly if there are asymmetries, that is its dependence on its suppliers is less than their dependence on the lead firm
Firm-level interviews
Control over a key technology (e.g. drive- train in autos) and holder of distinctive competence
A good indicator in producer-driven chains (autos, for example), since this defines the distinctive competence of a chain (BMW’s image as a quality, refined car) while the smaller firms ‘fill in the gaps’ in the chain.
Firm level interviews
Holder of chain “market identity” (e.g. brand name)
May be critical in markets where brand image is very important
Firm-level interviews; studies of market share of brands in final markets
Source: (Kaplinsky and Morris 2001) Indicators have to be selected according to the focus of the analysis and the availability of data.. The number of market partners available to each party and the stability of the exchange relationship (captured in the analysis of contracts) can represent, for instance, easy indicators to understand the vulnerability and the dependence of one actor from the other. As it is often the case, small producers may only have access to a limited number of stable channels through which to sell their production; therefore their ability to bargain the price can be limited. Once all the relevant indicators have been chosen, it is possible to calculate a concentration index for each of them. The concentration index can give an idea of how a particular indicator is allocated among the top 5 or 10 actors in the chain. Below is a practical example of how to calculate a concentration index; the example is built on the indicator number two in the table above, the share of the value added in the chain.

71
Box 20: Example of building a concentration index - value added in the chain
1. Rank all the stakeholders in decreasing order according to the indicator. Start from the one that presents the highest share of value added in the chain, to the one that shows the lowest share. Put all the actors in an excel table.
2. The second step involves defining the cutting point suitable to calculate the concentration level: for example among the top 5 actors, among the top five percent, and so on. This is a sensitive step, as by choosing a cutting point instead of another results can drastically change. It is therefore advised to choose more then one cutting point and compare the results in the subsequent analysis.
3. The third step requires dividing the total value added retained by the top actors (as defined in the step two) by the total value added produced by the entire chain. By using this simple methodology, it is possible to understand how key resources or assets are concentrated among actors.
4. Repeat steps 1-3 for all the indicators useful for the analysis and check how often the same actors happen to be among the top actors. For example, the same five actors in a chain can turn to be not only to ones to have the highest percentage of value added and profit, but also the ones how control key technologies and information in the chain.
Step 6: Analyze Trust Table 18 lists some key features that characterize exchange relationships based on low or high levels of trust. Table 18 : differences between chains characterized by low and high levels of trust Low Trust Chain High Trust Chain Length of trading relationship
Short term Long term
Ordering procedure Open bidding for orders. Prices negotiated and agreed before order commissioned.
Bidding may not take place. Price settled after the contract is awarded.
Contractual Relationship
Supplier only starts production on receipt of written order.
Supplier more flexible about instruction. They would start production without written order.
Inspection Inspection on delivery Little or no inspection. Degree of dependence
Supplier has many customers. Customer has multiple procurement sources
Few customers for supplier. Single or dual sourcing by customer
Technical Assistance Expertise rarely pooled. Assistance given only when paid for.
Extensive unilateral or bilateral technology transfer over time
Communication Infrequent and through formal channels.
Frequent and often informal.
Price Determination Adversarial, with hiding of information Non-adversarial. Credit Extended Punitive or no-credit extended Easy access, longer payback period,
easy terms. Outsourcing payment terms
Long delays in paying agents and informal economy producers
Payment on receipt of finished goods.
Source: Morris and Kaplinsky (2002) The analysis of trust can be based on key questions derived by the above table, such as
1. How long the treading relationship has lasted
2. When and how the prices are set
3. Whether there are controls and inspections procedures

72
4. Whether there is a contract or an oral arrangement
5. High degree of dependence and high level of information sharing.
An index of trust can be easily built by scoring and weighting all these characteristics. For economy of time and other practical considerations, sometimes it can be also useful to directly ask the respondent about her/his level of trust with regard of a list of other actors in the value chain. The level of trust should be ranked according to a scale (for example: (-1) distrust; (0) no trust; (1) little trust; (2) some trust; (3) complete trust). The data on trust from various value chain actors can then be inserted in a matrix as shown in the example below: Table 19: Example of matrix of trust levels between stakeholders Farmers Traders Processor Moneylenders Farmers 0 2 1 0 Traders 3 0 2 0 Processor 1 2 0 2 Moneylenders 2 0 0 0 From Table 19, it is possible to understand which actors trust the others, and to check whether trust is reciprocal. If it is true that informal arrangements are the results of trust, it has also to be considered that informality makes it more difficult to understand the terms of the arrangement. The issue of reciprocity in trust can be particularly important to understand the position of the poor, as it gives us a rough idea of the extent to which an agreement is based on trust or whether it is the mere result of dependency (no other alternative partners available). In the example above, farmers have some trust in traders while traders have complete trust in farmers; the exchange is therefore almost reciprocated.
What we should know after analysis is complete After having followed all the steps, the key questions outlined below should be able to be answered: • Do linkages exist? • How important are linkages? • How many different actors are involved? • What is the frequency of contact? • What is the level of formality? • What are the reasons for linkages, reasons for no linkages? • What are the relative Benefit/Costs of linkage? • What is the level of trust? • How long have these linkages existed? • How has the formality of the linkages changed or evolved? • What is the rate of expansion of linkages over time?

73
REFERENCES Duruflé, G., Fabre, R. & Yung, J. M., 1988. Les effets sociaux et économiques des projets de développement rural. Série Méthodologie, Ministère de la Coopération. La Documentation Française. Eaton, C. and A. W. Shepherd (2001). Contract Farming: Partnerships for Growth. A Guide. FAO Agricultural Services Bulletin No. 145. Rome, Food and Agriculture Organization of the United Nations. Gereffi, G. (1994). The Organization of Buyer-Driven Global Commodity Chains: How U. S. Retailers Shape Overseas Production Networks. Commodity Chains and Global Capitalism. G. Gereffi and M. Korzeniewicz. London, Praeger. Gereffi, G. (1999). A Commodity Chains Framework for Analysing Global Industries. Workshop on Spreading the Gains from Globalisation, University of Sussex, Institute of Development Studies. Gereffi, G., J. Humphrey, et al. (2003). The Governance of Global Value Chains: An Analytical Framework. January. Gereffi, G. and M. Korzeniewicz, Eds. (1994). Commodity Chains and Global Capitalism. London, Praeger. Goletti, F. (2005). Agricultural Commercialization, Value Chains, and Poverty Reduction. Discussion Paper No. 7. January. Ha Noi, Viet Nam, Making Markets Work Better for the Poor Project, Asian Development Bank. Goletti, F., T. D. Purcell, et al. (2003). Concepts of Commercialization and Development. Agrifood Discussion Paper Series. Bethesda, MD. M. Griffon (ed). 1989. Economie des filières en régions chaudes. Formation des prix et échanges agricoles. Actes du Xè séminaire d’économie et de sociologie, Montpellier, CIRAD, 887 p. Hugon, P., 1985. "Le miroir sans tain. Dépendance alimentaire et urbanisation en Afrique: un essai d'analyse mésodynamique en termes de filières", in Altersial, CERED & M.S.A. (eds.), Nourrir les villes, L'Harmattan, pp. 9 46. Kaplinsky, R. (1999). "Globalisation and Unequalization: What Can Be Learned from Value Chain Analysis." Journal of Development Studies 37(2): 117-146. Kaplinsky, R. and M. Morris (2001). A Handbook for Value Chain Research. Brighton, United Kingdom, Institute of Development Studies, University of Sussex. Lauret, F. 1983. Sur les études de filières agro- alimentaires. Economies et Sociétés, 17 (5). Moustier, P ., Leplaideur, A. 1999. Cadre d’analyse des acteurs du commerce vivrier africain. Montpellier, CIRAD, Série « Urbanisation, alimentation et filières vivrières », Volume n°4, 42 p.

74
NESDB. 2004. Training Course on Integrating Value Chain Analysis and Methodologies into Policy Analysis: Value Chains Development Training Project. Prepared for the Northeastern Region Economic and Social Development Office, National Economic and Social Development Board of Thailand, by Agrifood Consulting International. Khon Kaen, Thailand. December 2004 Porter, M. E. (1985). Competitive Advantage. New York, The Free Press. Raikes, P., Friis, M. and Ponte, S. 2000. Global commodity chain analysis and the French Filière approach: comparison and critique. CDR working paper series, 00.3. Rich, K. M. (2004). A Discussion Note on Value-Chain Analysis in Agriculture: Methodology, Application, and Opportunities. Discussion Paper for the Asian Development Bank Project on Making Markets Work Better for the Poor. Ha Noi, Viet Nam, Agrifood Consulting International. Scott, G. et Griffon, D. (eds). Prix, produits et acteurs. Méthodes pour analyser la commercialisation agricole dans les pays en développement. CIRAD-CIP-Karthala, 498 p. Soufflet, Jean-Francois. La Filière et l'analyse de filière: recherche sur les fondements du concept et de la methode, et leurs rapports avec l'economie industrielle et la mésoanalyse. Dijon (FRA), INRA, 1986: 150 p.