making the sun shine at night: comparing the cost of
TRANSCRIPT

Making the sun shine at night: comparing the cost of dispatchable concentrating solar power and photovoltaics with storageFranziska Schöniger a, Richard Thonig b, Gustav Resch a, and Johan Lilliestam b,c
aEnergy Economics Group, Institute of Energy Systems and Electrical Drives, TU Wien, Vienna, Austria; bInstitute for Advanced Sustainability Studies (IASS), Potsdam, Germany; cFaculty of Economics and Social Sciences, University of Potsdam, Potsdam, Germany
ABSTRACTSustainable electricity systems need renewable and dispatchable energy sources. Solar energy is an abundant source of renewable energy globally which is, though, by nature only available during the day, and especially in clear weather conditions. We compare three technology configurations able to provide dispatchable solar power at times without sunshine: Photovoltaics (PV) combined with battery (BESS) or thermal energy storage (TES) and concentrating solar power (CSP) with TES. Modeling different periods with-out sunshine, we find that PV+BESS is competitive for shorter storage dura-tions while CSP+TES gains economic advantages for longer storage periods (also over PV+TES). The corresponding tipping points lie at 2–3 hours (cur-rent cost), and 4–10 hours if expectations on future cost developments are taken into consideration. PV+TES becomes only more competitive than CSP +TES with immense additional cost reductions of PV. Hence, there remain distinct niches for two technologies: PV+BESS for short storage durations and CSP+TES for longer ones.
KEYWORDS Concentrating solar power (CSP); dispatchable renewable electricity; thermal energy storage; photovoltaics; utility-scale batteries; flexibility; energy system modeling
1. Introduction
Driven by dedicated support policies, electricity from solar photovoltaics (PV) and wind turbines has become much cheaper in the last decade and has reached grid-parity in many electricity markets around the globe. The global weighted-average total installed cost of utility-scale solar PV projects commissioned in 2019 was USD 995/kW (IRENA 2020). The LCOE was USD 0.068/kWh with an estimated learning rate of about 36% between 2010 and 2019 (IRENA 2020). With expected invest-ment costs as low as e.g. USD 350/kW for utility-scale PV installations in 2050 (NREL 2019), cheap renewable electricity from solar and also wind power will play a big role in decarbonizing power systems (European Commission 2020) and will be the cheapest power source for new power gen-erators in most places (Nayak et al. 2019). These technologies are, however, not sufficient to assure that supply meets demand at all times as their power generation follows the intermittent nature of its resource and not the demand profile. While the deployment of PV and wind is continuously growing research now aims to understand and develop technologies to accompany intermittent generators making renewable electricity available in times when solar and wind resources are scarce. There are different technologies suggested to balance supply and demand on different time scales, from seconds to seasonal variations.
Power systems rich in PV generators typically have abundant power supply during the day. In such systems, the main challenge is to be able to meet supply in a cost-efficient way when there is no sunshine, for example during the night and during cloudy day-time conditions (Denholm, O’Connell,
CONTACT Franziska Schöniger [email protected] Energy Economics Group, Institute of Energy Systems and Electrical Drives, TU Wien, Vienna AT-1040.
ENERGY SOURCES, PART B: ECONOMICS, PLANNING, AND POLICY https://doi.org/10.1080/15567249.2020.1843565
© 2020 The Author(s). Published with license by Taylor & Francis Group, LLC. This is an Open Access article distributed under the terms of the Creative Commons Attribution License (http://creativecommons.org/licenses/by/4.0/), which permits unrestricted use, distribution, and reproduction in any medium, provided the original work is properly cited.

and Brinkman 2015). Finding solutions for this is a central solar power problem for the future, and there are several options. First, adding a battery energy storage system (BESS) extends the operating time of a PV system, and thus also increases both the dispatchability and market value of PV installations (Denholm, Margolis, and Eichman 2017). Second, concentrating solar thermal power (CSP) has the inherent capability to make its power output dispatchable and offers a fully developed and commercialized solution to supply solar power at night by including thermal energy storage (TES) (Lunz et al. 2016; Yagi, Sioshansi, and Denholm 2019). Third, it is also possible to connect PV with TES, as is now implemented at utility-scale in the 800 MW solar hybrid Midelt project in Morocco (SolarPACES 2020) and the 400 MW SolarReserve Australia II project (1414 degrees 2019).
This leaves us with three apparent technological solutions for providing (in principle) solar electricity during times when no or little sunlight is available for several hours, especially at night. The question is which technology combination can provide the least-cost solution for this solar power niche in times of no sunshine today and toward the 2050 horizon when power systems need to become fully decarbonized.
In this paper, we compare these three technology configurations: CSP with TES (two-tank molten- salt TES), and PV combined either with BESS (utility-scale Li-Ion batteries) or with a TES using an electric heater. As previous analyses suggest, one of the key parameters that determine competitiveness between these options is the required storage time (i.e. hours of electricity output from storage at nameplate capacity) (Lovegrove et al. 2018). We investigate the relative competitiveness of each of the three options as a function of current and future investment costs and the desired storage duration. We show how the break-even point between CSP+TES, PV+BESS, and PV+TES changes as technol-ogy costs shift.
In our analysis, we assume that a continuous load of 100 MW has to be delivered from storage for a certain pre-specified period, varying from 1 to 24 hours after sunset (with no additional solar energy collection, i.e. 0.1 GWh to 2.4 GWh of electricity storage) within a simplified model environment representing a location with Spanish solar radiation profile. We conduct a model-based investment and dispatch optimization to calculate the necessary electricity generation (solar field and power block for CSP, and PV modules) and storage capacities (TES and utility-scale BESS). This enables us to evaluate the specific cost for demand coverage under the given assumptions and to compare the resulting annualized costs for the three technology combinations CSP+TES, PV+BESS, and PV+TES.
2. Background: recent developments of PV, CSP, and storage
Recently, PV with storage (PVS) has seen increasing adaptation in residential and utility-scale applications. In the US, 2.6 GWac battery capacity with storage duration between 2–5 hours has been built in 2018 (Bolinger, Seel, and Robson 2019). As with PV, the cost of battery storage exhibits a strong downwards trend especially for lithium-ion batteries that are projected to reach investment costs below USD 100 per kWh before 2050 (Lazard 2018). The literature offers quite different assessments of the cost to be expected in the next decade as different factors from spending on research and development (R&D) resulting in material and manufacturing improvements to the costs of resources all impact the expected cost in the future (Kittner, Lill, and Kammen 2017; Schmidt et al. 2019). With the ongoing development of battery-electric vehicles and consumer electronics further spill-overs decreasing the cost not only for mobility applications but also for grid-scale battery storage in the power sector are expected (Malhotra, Schmidt, and Huenteler 2019; Stephan et al. 2019).
In the case of the CSP technology, thermal storage capacities have been a central part of the technology already for a longer time. However, a trend toward increasing storage sizes is observable. In the last 5 years (2016–2020), most CSP stations are either parabolic trough power plants (10 of 22) or solar towers (9). Almost all new stations (19 of 22) employ two-tank TES with molten salt, usually a mixture of 60% sodium nitrate and 40% potassium nitrate; these stations have on average 9.3 hours of TES, allowing these stations to resume power generation also after sundown or during adverse weather for at least this number of hours (CSP.guru 2020). The biggest storage yet – totaling 1.9
2 F. SCHÖNIGER ET AL.

GWh – will be commissioned in the Cerro Dominador project in Chile scheduled for completion in 2020. It will be able to generate 110 MW of electricity for up to 17.5 hours from stored heat and together with the co-located 100 MW PV plant. The complex is designed to provide around the clock solar energy. Currently, deployed TES systems are much larger than deployed battery systems; for example, the TES of Cerro Dominador is 15 times larger than the world’s largest lithium-ion battery system, the 100 MW/129 MWh storage system at Hornsdale, Australia (Hornsdale Power Reserve 2020). Hence, the addition of TES can make CSP fully dispatchable, allowing it to shift the generation to the night hours (Mehos et al. 2016; Murphy et al. 2019; Pfenninger et al. 2014). Because storage increases the utilization of components, especially the power block, the Levelized Cost of CSP electricity decreases with larger storage as long as the load factor increases (Wang 2019).
Deployment policies have significantly reduced the cost of CSP in the last decade with further decreases expected if further investments in new power plant capacities are undertaken (CSP.guru 2020; Lilliestam et al. 2018, 2017).
The diffusion speed of CSP and PV has exhibited very different dynamics (see Figure 1). While PV has reached a cumulative global installed capacity of 580 GW in 2019, CSP remained almost 100 times smaller at just over 6 GW (IRENA 2020). Since the year 2000 when global installed capacity stood at less than 1 GW, the cumulative global PV fleet has grown by up to 80% per year, and still today, although the fleet is very large, it grows by more than 20% per year. The geographical diversity of the market has also increased with 10 countries adding more than 1 GW of PV in 2018 alone (IEA 2019). For CSP, capacity additions were only partly comparable to the success of PV in the five years between 2009 and 2014, when market growth, measured at the increase of yearly capacity additions, stood at on average about 30%, driven by expansion programs in Spain and the US (CSP.guru 2020). This boom led to the creation of a CSP industry still active globally today (Lilliestam et al. 2020). Market growth of CSP has however slowed down considerably and has only increased temporarily with the emergence of a support program in China. In relative terms, CSP has been losing ground on PV since 2014, and the future market outlook is mixed with little actual policy support schemes open for new projects (Lilliestam et al. 2020).
Figure 1. Yearly growth of cumulative installed capacity (own elaboration based on IRENA (2019a) and CSP.guru (2020)).
ENERGY SOURCES, PART B: ECONOMICS, PLANNING, AND POLICY 3

The strong deployment and related technological development of PV have led to a technological shift from CSP to PV. This is reflected also on the project level for utility-scale solar projects in the US, where several planned CSP projects were transformed into PV stations (Bolinger and Seel 2018; Mehos et al. 2016). In both the US and Europe, driven to a large extent by the tremendous cost reduction of PV, CSP support and construction has stopped completely. The progress in PV and battery technol-ogies opens the question if the solar field component of CSP will still be needed in the future and to which extent the storage-niche for times without sunshine will be dominated by PVS or whether TES will play a role, in combination with a CSP solar field or a PV array.
To our knowledge, no thorough peer-reviewed analysis of the expected comparative development of these three technologies CSP+TES, PV+BESS, and PV+TES exists that considers current expected technological and corresponding cost developments and includes the explicit technology combination PV+TES. Lovegrove et al. (2018) compare various technology combinations with storage at a more general level, looking at the dispatchability of renewables from an integrated system perspective using generic learning rates. Payaro et al. (2018) compare PV+BESS and CSP+TES for different capacity factor objectives taking into account also cost projections, while Jorgenson, Mehos, and Denholm (2016) additionally evaluate the option PV + gas turbine and Zurita et al. (2018) include a hybrid configuration of CSP+TES and PV+BESS in their studies.
3. Method and data
3.1. Conceptualizing dispatchable solar power
The operational and economic characteristics of power plants are different according to whether they address peak or baseload demand. Peaker plants will only run for a short time at a relatively high price level whereas baseload is required for more than 12 hours when electricity prices are usually lower. In theory, PV+BESS, PV+TES as well as CSP+TES can cover peak or baseload demand based on their configuration. We investigate the specific cost of these technology combinations for different required storage hours to enable a comparison of a broad range of use cases. To understand the competitiveness of CSP+TES and PVS, we compare them for different hours of load delivered after sunset and see how relative specific cost change with the expected technological developments.
3.1.1. Characteristics of CSP with TES and PVSCSP plants consist of three independent but closely interrelated components with different character-istics: the solar field, the TES, and the electricity-producing unit, i.e. power block. A CSP system has two energy conversion steps. In the collection step, sunlight is concentrated by the means of mirrors in the form of thermal energy in a heat transfer fluid (HTF). CSP plants utilize direct normal radiation (DNI) as one specific component of solar radiation. Second, the thermal energy is transformed into alternating current (AC) electricity using a conventional steam power block. Storage is possible between thermal and power generation in the form of thermal energy. All of these components can be sized differently and require different assumptions regarding their techno-economic parameters. Depending on the technology concept, the amount of thermal energy output is determined by the size of the solar field and the amount of solar irradiance. Varying the size of the solar field has an impact on the capacity factor of the electricity generating unit. This is, however, a complex interplay of solar field size, storage capacity, and electricity generation capacity. The size of the solar field can either be expressed in terms of actually covered land or by using the concept of a solar multiple. The solar multiple is a key metric in designing a CSP plant. It is the ratio of the thermal energy collected by the receiver at the reference point to the amount of thermal energy required to generate the rated turbine gross power (Kariuki, Machinda, and Chowdhury 2012). Increasing the solar multiple and storage allows for increased capacity factors but increases also the investment costs. The concept of the three modeled technology combinations and their interactions is shown in Figure 2.
4 F. SCHÖNIGER ET AL.

PV, on the other hand, uses the photoelectric effect to generate direct current (DC) electricity utilizing the solar global horizontal irradiation (GHI). DC power then needs to be converted through an inverter to AC-electricity in a second conversion step. Battery storage can be integrated before or after the solar inverter and stores the energy in the form of chemical energy. Consequently, Feldman et al. (2016) point out that the inverter functions much like the turbine in the case of a CSP plant. The Inverter Loading Ratio (ILR), fulfills the same function as changing the solar multiple in the case of a CSP turbine. Alternatively, the electricity generated by PV can be stored in the form of thermal energy in a TES utilizing an electric heater and a power block for the conversion from electricity to heat and back. Usage of TES as a long-term standalone power storage option detached from CSP plants is in principle possible and has been suggested in practice (1414 degrees 2019; IEA-ETSAP 2013 & IRENA 2013; SolarPACES 2020;. This option is characterized by a significantly lower round trip efficiency than PV+BESS (see section 3.4). However, if PV+TES can be combined at a lower cost than CSP+TES that would eliminate the need for the solar component of CSP plants while offering the same dispatchability from the TES to the grid.
In general, there are several conversion steps (see Figure 3) necessary beginning from the collection of the solar radiation in form of the solar field and receiver system or the photovoltaic panels over the conversion to storable energy in the battery system or the TES to the final conversion to provide grid- connected AC electricity.
Figure 2. Conceptualization of PV combined with battery storage and CSP (solar field, receiver, thermal energy storage, and power block). Power flow in direct current (DC) and alternating current (AC). Solar radiation components global horizontal irradiation (GHI) and direct normal irradiation (DNI). Own illustration using graphical content created by Arthur Shlain (2019) from Noun Project.
Figure 3. Conversion process from the collection of solar radiation to the final conversion to AC electricity and relevant cost parameters. Own illustration based on Lovegrove (2018).
ENERGY SOURCES, PART B: ECONOMICS, PLANNING, AND POLICY 5

3.1.2. Solar radiationThe following model-based analysis is conducted for a representative location in Spain, using solar data for the location of the CSP plant Andasol 1 in the Sierra Nevada in Spain1 (EU Science Hub 2019). The solar radiation data represents a typical meteorological year (TMY) based on actual data for the years 2007–2016 and is split up in its radiation components. For the analysis, the solar radiation profile of a typical summer day was chosen (day 1 in week 29) to visualize the power plant and storage operations (see Figure 4).
Since we model a full year, the FLH for the CSP solar field as well as for the PV panels are calculated using the TMY data for the whole year (see Equations (1) and (2)), not only this one specific day. This means, the calculated yearly electricity generation and resulting specific cost represent a typical, average meteorological year at this specific location. In this way, also cloudy days and seasonal differences are represented in the resulting annual electricity generation and, therefore, also in the annualized costs we evaluate. For CSP, the DNI, and for PV, the GHI is used for the calculation of FLH.
FLHCSP solar field ¼Total annual DNI=m2
1000W=m2 DNI¼ 2118 (1)
FLHPV ¼Total annual GHI=m2
1000W=m2 GHI¼ 1843 (2)
3.1.3. Net solar-to-electricity efficiency of CSPIn general, the thermal input for either the TES or the CSP power block and the overall CSP system depends on the net efficiency of a solar field and receiver system (IRENA 2012; Jamil and Ali 2016). Typical annual net solar-to-electricity efficiencies2 are reported in the ranges of 8–25% (Müller- Steinhagen and Trieb 2004), 15–20% (Heath and Burkhardt 2011), and 7–20% for solar towers and
Figure 4. Solar profiles (GHI and DNI) for the modeled day and location in the Sierra Nevada in Spain. Day 1 in week 29 of a typical meteorological year based on the years 2007–2016.
1Coordinates: 37.23078611, −3.0705777782For the theoretical background on the solar-to-electricity efficiency, c.f. Appendix.
6 F. SCHÖNIGER ET AL.

11–16% for parabolic trough systems (IRENA 2012). We assume ηCSP ¼ 0:2 in our model. For the power block efficiency, ηpower block ¼ 0:42 (COBRA 2019) is assumed.
3.2. Modeling specific cost with Balmorel
For the modeling task of this paper, we use the energy system model Balmorel (Balmorel 2019). Balmorel (the BALtic Model for Regional Electricity Liberalization) is an open-source, partial equili-brium model, analyzing the electricity and district heat sector. Balmorel uses linear programming in GAMS to minimize the annualized cost of the energy system (electricity and heat). It can be classified as a deterministic bottom-up energy system model that can co-optimize energy dispatch and invest-ments. Balmorel has been used and adapted for energy system analyses on various scopes from regional case studies only in the electricity sector (e.g. Barragán-Beaud et al. 2018; Fedato et al. 2019) to integrated studies comprising electricity, heat, and transport sector for several countries (e.g. Hedegaard and Balyk 2013; Jensen et al. 2020). We use the modeling framework for evaluating annualized investment and dispatch cost as well as storage operations in a closed model setup designed for the designated research question of competitiveness of different dispatchable solar power tech-nologies. The modeled technologies are specified in terms of primary fuel type, input/output effi-ciency, operation and maintenance costs, and investment costs for new capacity. The data inputs most relevant for this analysis are techno-economic parameters of the solar power and storage technologies (cf. Section 3.3 and 3.4), and the resource potentials in the form of solar hourly variations (cf. Section 3.1).
The theoretical background of Balmorel is described in depth by Ravn (2001) and Wiese et al. (2018). While in general, the electricity and district heating sector are modeled in Balmorel, we focus on the model basics for the power system here since this is the focus of our analysis. The model’s objective function (Equation (3)) minimizes the costs Ci associated with the modeled power units ei;t in a perfect foresight model: investment costs, operation and maintenance (O&M) costs, and fuel costs (which are not relevant for solar power) (Fedato et al. 2019).
minei;t;r ¼XT
t¼1
XI
i¼1
XR
r¼1Ci ei;t;r� �
(3)
s:t:giðei;t;rÞ � 0 (4)
The optimization is constrained by a set of linear relations (Equation (4)) imposed to reflect the characteristics of the power units ei;t , such as capacity, energy and operational constraints of genera-tion units and storage. The electricity demand Et;r (Equation (5) has to be covered in every region (r ɛ R), for every time step (t ɛ T) by the set of technologies (i ɛ I).
XT
t¼1
XI
i¼1ei;t;r ¼ Et;r (5)
As an output of the optimization which is minimizing the annualized cost of the energy system, we get the hourly electricity and heat generation of all technology components, the installed generation capacities, and the overall system cost per year (considering the discount rate and economic lifetime). Since the case study in this paper analyzes a down-scaled closed system we do not model any grid conditions or further aspects of the electricity system in this stylized model setup. On the one hand, this allows for a direct comparison of the generation and storage capacities without distortion from solar radiation levels, network constraints or losses, or other external influences in the electricity system. On the other side, this means also that the calculated specific cost cannot be seen as LCOE in a real system. They are rather an indicator visualizing in a very comprehensive way the impact of
ENERGY SOURCES, PART B: ECONOMICS, PLANNING, AND POLICY 7

technology cost developments and storage hours on the competitiveness of the technology options CSP and PVS.
3.2.1. Cost calculationThe cost calculated in this case study are the investment costs and variable and fixed O&M costs necessary to cover the continuous electricity load of 100 MW for the modeled range of hours between 1 and 24 hours. The period of delivery starts after sunset and has to be covered by the storage system without any additional solar radiation coming in. In the model-based investment and dispatch optimization, the necessary electricity generation (solar field and power block for CSP, and PV panels) and storage capacities (Li-Ion battery and TES) are calculated. As a result, we get the specific cost for demand coverage under the specific assumptions. In the case of one storage hour, this means that only one hour of load after sunset (=100 MWel) has to be covered every day but all costs are also allocated to only 100 MWh. Accordingly, the increased overall system cost in the case when 24 hours of electricity have to be delivered are apportioned among 2400 MWh/day.
To illustrate the modeled process, Figure 5 shows the electricity generation in the case of four hours of continuous load (100 MWel) covered by PV+BESS after sunset. During the day, the PV modules generate electricity which is stored in the Li-Ion battery system. The energy content of the battery is during the same time continuously increasing. After sunset, the required electricity delivery period starts and the battery provides electricity to the grid and depletes at the same time. The process looks identical for CSP+TES with the solar field heat generation corresponding to the PV generation, the power block electricity generation corresponding to the battery output, and the TES content corre-sponding to the battery content. In the case of PV+TES, the PV modules linked to an electric heater correspond to the solar field heat generation of CSP.
3.3. Assumptions on technology cost development
One of the most crucial parts of modeling technology developments are the underlying cost assump-tions. However, many factors like innovative disruptions or raw material availability are very hard to
Figure 5. Electricity generation [MWel] by PV and the battery system and storage content [MWhel].
8 F. SCHÖNIGER ET AL.
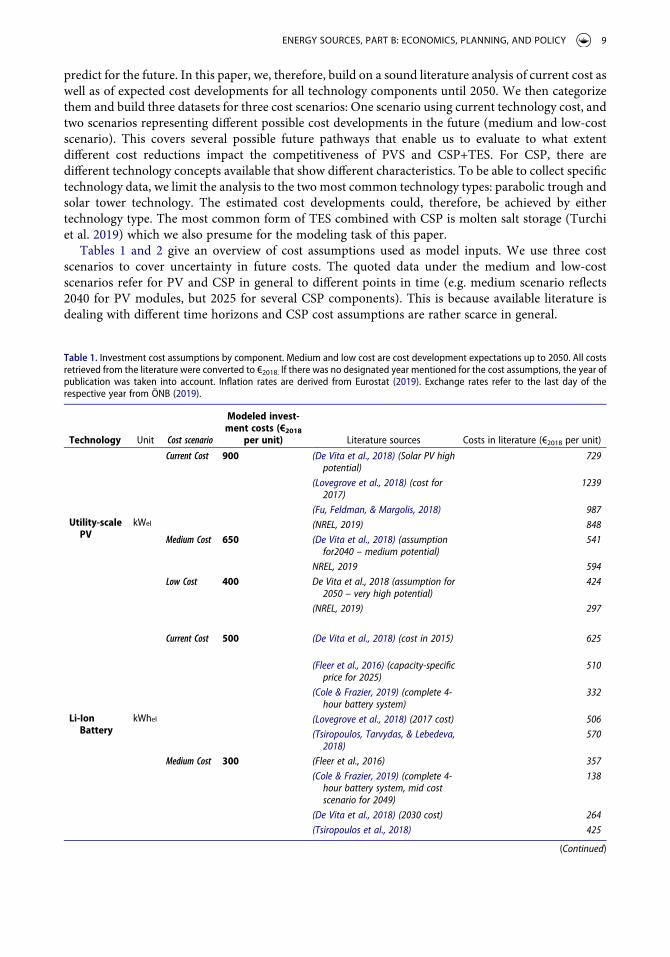
predict for the future. In this paper, we, therefore, build on a sound literature analysis of current cost as well as of expected cost developments for all technology components until 2050. We then categorize them and build three datasets for three cost scenarios: One scenario using current technology cost, and two scenarios representing different possible cost developments in the future (medium and low-cost scenario). This covers several possible future pathways that enable us to evaluate to what extent different cost reductions impact the competitiveness of PVS and CSP+TES. For CSP, there are different technology concepts available that show different characteristics. To be able to collect specific technology data, we limit the analysis to the two most common technology types: parabolic trough and solar tower technology. The estimated cost developments could, therefore, be achieved by either technology type. The most common form of TES combined with CSP is molten salt storage (Turchi et al. 2019) which we also presume for the modeling task of this paper.
Tables 1 and 2 give an overview of cost assumptions used as model inputs. We use three cost scenarios to cover uncertainty in future costs. The quoted data under the medium and low-cost scenarios refer for PV and CSP in general to different points in time (e.g. medium scenario reflects 2040 for PV modules, but 2025 for several CSP components). This is because available literature is dealing with different time horizons and CSP cost assumptions are rather scarce in general.
Table 1. Investment cost assumptions by component. Medium and low cost are cost development expectations up to 2050. All costs retrieved from the literature were converted to €2018. If there was no designated year mentioned for the cost assumptions, the year of publication was taken into account. Inflation rates are derived from Eurostat (2019). Exchange rates refer to the last day of the respective year from ÖNB (2019).
Technology Unit Cost scenario
Modeled invest-ment costs (€2018
per unit) Literature sources Costs in literature (€2018 per unit)
Utility-scale PV
kWel
Current Cost 900 (De Vita et al., 2018) (Solar PV high potential)
729
(Lovegrove et al., 2018) (cost for 2017)
1239
(Fu, Feldman, & Margolis, 2018) 987
(NREL, 2019) 848
Medium Cost 650 (De Vita et al., 2018) (assumption for2040 – medium potential)
541
NREL, 2019 594
Low Cost 400 De Vita et al., 2018 (assumption for 2050 – very high potential)
424
(NREL, 2019) 297
Li-Ion Battery
kWhel
Current Cost 500 (De Vita et al., 2018) (cost in 2015) 625
(Fleer et al., 2016) (capacity-specific price for 2025)
510
(Cole & Frazier, 2019) (complete 4- hour battery system)
332
(Lovegrove et al., 2018) (2017 cost) 506
(Tsiropoulos, Tarvydas, & Lebedeva, 2018)
570
Medium Cost 300 (Fleer et al., 2016) 357
(Cole & Frazier, 2019) (complete 4- hour battery system, mid cost scenario for 2049)
138
(De Vita et al., 2018) (2030 cost) 264
(Tsiropoulos et al., 2018) 425
(Continued)
ENERGY SOURCES, PART B: ECONOMICS, PLANNING, AND POLICY 9

Table 1. (Continued).
Technology Unit Cost scenario
Modeled invest-ment costs (€2018
per unit) Literature sources Costs in literature (€2018 per unit)
Low Cost 100 (Cole & Frazier, 2019) (complete 4- hour battery system, low cost scenario for 2049)
68
(De Vita et al., 2018) (ultimate cost) 234
(Tsiropoulos et al., 2018) 250
Solar field & receiver system
m²
Current Cost 300 (Turchi et al., 2019) 183
(Dieckmann et al., 2017) (2015 cost - parabolic trough incl. receiver)
196
(Mehos et al., 2016) (2015 cost) 324
(ESTELA, DCSP, & Protermosolar, 2015) (2015 cost)
209
Medium Cost 225 (Dieckmann et al., 2017) (2025 cost - parabolic trough incl. receiver)
150
(ESTELA et al., 2015) (2025 cost) 133
Low Cost 150 (Turchi et al., 2019) (solar field for tower plant 75 USD/m2 + 150 USD/kWth receiver)
149
Thermal energy storage
kWhth
Current Cost 40 (Turchi et al., 2019) (parabolic trough)
54
(Turchi et al., 2019) (power tower) 19
(Mehos et al., 2016) 53
(Wang, 2019) 44
(Dieckmann et al., 2017) (2015 cost - trough)
36
(Dieckmann et al., 2017) (2015 cost - tower)
22
(ESTELA et al., 2015) (cost for 2015) 29
Medium Cost 25 (Wang, 2019) 22
(Dieckmann et al., 2017) (2025 cost - trough)
22
(Dieckmann et al., 2017) (2025 cost - tower)
19
(ESTELA et al., 2015) (2025 cost) 20
Low Cost 10 (Mehos et al., 2016) 15
(Wang, 2019) 11
Power block kWel
Current Cost 1000 (Kurup & Turchi, 2015) 1115
(Turchi et al., 2019) (Power tower) 882
(Turchi et al., 2019) (Parabolic trough)
772
Medium Cost 900 (Dieckmann et al., 2017) (2025 cost) 933
Low Cost 800 (ESTELA et al., 2015) (2025 cost) 760
Electric heater
kWth
Current, Medium, and Low Cost
347 (De Vita et al., 2018) 347
10 F. SCHÖNIGER ET AL.

3.3.1. CSP and storage costConcerning CSP, we assume a slight cost reduction for the power block from 1000 (current cost) to 800 €2018/kWel (low cost). From historic development, we cannot see a significant cost reduction in CSP turbines using steam. However, Turchi et al. (2019) state that the increasing global installed capacity is expected to help decrease turbine cost as e.g. new Chinese turbine manufacturers come into the market.
Storage cost is based on extensive storage needs being projected for the future which are themselves driven by increasing flexibility needs in the electricity system and additional demand from e.g. electric mobility. A source of high uncertainty here is how resource prices may develop and this is especially central to the technologies which are dependent on critical raw materials coming from globally concentrated production sites.
Since the cost for the solar field is usually given in €/m2, an additional calculation is necessary to obtain the model input in €/kWth. Using the data for the location of Andasol 1, we calculate the annual DNI per m2. To get the thermal output of the solar field, the solar-to-steam efficiency has to be obtained. Based on the assumed ηCSP and ηpower block, we obtain a solar-to-steam efficiency of 0.48. By applying the specific FLH for this location, we obtain solar field and receiver cost of 630, 473, and 315 €2018/kWth corresponding to the €2018/m2 literature values presented above.
The costs for the battery system comprise a capacity specific (e.g. battery cells, cell housing, cell connectors, and battery management system, cooling) and a power specific part (e.g. power electro-nics, inverter, transformers, contactors, fuses, and control systems). For the modeling, the investment costs for the utility-scale batteries are given capacity specifically [€/MWh] as input data, meaning that the power-specific costs have to be converted into capacity specific costs as well. The power specific costs are relatively smaller for larger storage hours and relatively higher for lower storage hours since e.g. the inverter has the same size (100 MW output) for all storage hours. Since most of the sources we used for the collection of cost data define “utility-scale” in the case of batteries as 4 hours of storage, we take these storage hours as default and adapt the capacity specific costs for the other hours. This results in relatively higher capacity-specific battery costs for storage hours shorter than 4 hours and lower
Table 2. Fixed operation and maintenance costs, annually by component. Medium and low cost are cost development expectations up to 2050.
Technology Cost scenarioModeled fix O&M costs (€2018 /kW) Literature sources Costs in literature (€2018 /kW)
Utility- scale PV
Current Cost 19 (De Vita et al., 2018) (Solar PV high potential) 14
(NREL, 2019) 17
(Bolinger & Seel, 2018) 27
Medium Cost 13 (De Vita et al., 2018) (Solar PV high potential) 12
(NREL, 2019) 7
Low Cost 7 (De Vita et al., 2018) (Solar PV high potential) 11
(NREL, 2019) 3
Li-Ion Battery
Current Cost 50 (De Vita et al., 2018) (2015 costs) 42
(Lovegrove et al., 2018) (2017 costs) 62
Medium Cost 32.5 (De Vita et al., 2018) (2030 costs) 16
Low Cost 15 (De Vita et al., 2018) (ultimate costs) 14
(Continued)
3The 500, 300, and 100 €/kWhel (see Table 1) were used as input data for the 4 hours storage case and different shares of these values were calculated for the other storage hours: 1 hour (123%), 2 hours (108%), 8 hours (96%), 12 hours (95%), 16, 20 and 24 hours (94%).
ENERGY SOURCES, PART B: ECONOMICS, PLANNING, AND POLICY 11

capacity-specific costs for storage durations longer than 4 hours. The exact values were calculated using the ratio of capacity and power specific cost data from Fu et al. (2018) and Fleer et al. (2016) for the modeled storage hours. The share of the power specific cost components increases more with lower storage hours than it decreases with higher storage hours since the overarching part of the investment costs is related to the capacity of the battery for long storage durations.3
3.3.2. Electric heater costIn addition to the analyzed technology combinations PV+BESS and CSP+TES, another recently proposed option is the combination of PV with TES. In this case, electricity is transformed into heat via an electric heater almost without losses. However, to make thermal storage for electricity storage competitive, the efficiency loss of energy transformation from electricity to heat and back has to be compensated by the cost advantages of the TES and the PV modules. To model the technology combination PV+TES, the additional technology component electric boiler for transforming the electricity generated by the PV modules to thermal energy being stored into the TES. The costs are assumed to stay constant in all scenarios; variable O&M Costs are 0.5 €2013/MWhth and the efficiency for the electricity-to-heat conversion 1 (De Vita et al. 2018).
Since the fixed O&M costs for CSP are commonly provided in literature for all components together, this has to be split up. For the power block, the annual O&M costs are assumed to be 25.6 €2013/kWel and to stay constant (De Vita et al. 2018). The remaining fixed O&M costs are attributed to the solar field and receiver. That means that the cost reductions in fixed O&M costs are also entirely attributed to the solar field plus receiver.
3.4. Further techno-economic assumptions
For all components except for the Li-Ion battery, an economic lifetime of 25 years is assumed (for batteries 15 years according to Cole and Frazier 2019). It is possible that in parallel to the development cost reductions also lifetime extensions are realized. However, for this analysis, we chose to keep the lifetime assumptions constant in all cost scenarios to not distort the effect of the price reductions. The round-trip efficiency for the battery is assumed to be 85% (Cole and Frazier 2019), for the TES 99%, and the net power block efficiency 42% (COBRA 2019). The round-trip-efficiency for the storage stays the same for all storage hours. Dynamic losses are not considered. As a limitation of our analysis, this means that we do not consider the effect of the frequency of loading and unloading cycles on the
Table 2. (Continued).
Technology Cost scenarioModeled fix O&M costs (€2018 /kW) Literature sources Costs in literature (€2018 /kW)
CSP
Current Cost 75 (Bolinger & Seel, 2018) (just solar collector field, thus maybe not fully representative)
52
(Turchi et al., 2019) 58
(De Vita et al., 2018) 126
(ESTELA et al., 2015) 51
Medium Cost 60 (De Vita et al., 2018) 103
(ESTELA et al., 2015) 48
Low Cost 45 (De Vita et al., 2018) 80
(ESTELA et al., 2015) 46
Electric heater
Current, Medium, and Low Cost
5.2 (De Vita et al., 2018) 5.2
12 F. SCHÖNIGER ET AL.

efficiency for different storage sizes. The discount rate is assumed to be 5%. For all technology components besides the electric heater no variable O&M costs are assumed (De Vita et al. 2018).
4. Results
Our results show that PV+BESS is cheaper than CSP+TES for short storage durations up to 2–3 hours, regardless of the cost development. CSP+TES is and remains cheapest for more than 4 hours storage except in the low-cost PV+BESS case where very strong PV+BESS learning is assumed and the tipping point moves to 10 storage hours. Hence, under most conditions, an economically beneficial nighttime solar power market will be split between PV+BESS for short durations and CSP+TES for longer ones. When PV is combined with a TES and a power block instead of the battery, the system can take advantage of the decreasing specific cost with increasing storage hours and the lower specific storage cost for TES. However, PV+TES is more expensive than CSP+TES in all cost scenarios (see Figure 6). The results depend mainly on the learning of PV and especially BESS, whereas they are robust for CSP+TES learning. If PV+BESS costs decrease strongly, they capture most of the CSP niche even if CSP also progresses fast. For all segments, either PV+BESS or CSP+TES provide electricity at the lowest cost in all three cost scenarios.
4.1. Costs as a function of learning and storage size
While the cost for PV+BESS scale almost linearly, the specific costs for CSP/PV+TES decrease with increasing storage hours. Depending on the cost scenario, there is an intersection of the price curves of CSP+TES and PV+BESS. For the current cost assumptions, this is between 2–3 storage hours, for the medium-cost assumptions at around 4 hours, and for the low-cost assumptions at around 10 storage hours. PV+TES is cheaper than PV+BESS for more than 4 storage hours (current cost), 8 hours (medium cost), or never (low cost) but always more expensive than CSP+TES. These findings are highly dependent on the relative cost development of all technology components. For example, if very strong learning is assumed for PV (low-cost scenario) and CSP costs stay at current levels, PV+TES
Figure 6. Specific cost for increasing storage hours for PV+BESS, CSP+TES and PV+TES for three cost scenarios. PV+BESS is always the most economic solution for short storage times. CSP+TES becomes competitive after 2–3 h (current cost) and 4–10 h (future cost projections).
ENERGY SOURCES, PART B: ECONOMICS, PLANNING, AND POLICY 13

covers the niche for longer storage durations. For PV+TES, learning is the key parameter, stronger than storage duration. However, learning rates for PV are rather expected to flatten and TES cost reductions apply to CSP+TES and PV+TES equally. In general, we encourage the reader to look at the price ranges instead of single points since we are dealing with cost projections.
4.2. Technical details on the different configurations
All technology components except for the power block are increasing linearly with increasing storage hours (see Table 3). The CSP+TES unit and the power block are uncoupled – i.e. the power block is in terms of size (i.e. the required 100 MWel) and costs identical for all assessed storage hours while the cost of the CSP field and the corresponding TES increases linearly with rising storage period. Installed capacities are the same for all cost assumptions for PV+BESS and CSP+TES. In the case of PV+TES (results for the medium-cost scenario are shown here), capacities for PV and the electric heater vary slightly between the scenarios because with decreasing PV costs, slightly more PV and less electric boiler capacity is deployed.
Table 3. Installed capacities for all technology components depending on the storage hours.
Storage hours [h] 1 2 4 8 12 16 20 24
PV+BESS (all scenarios)PV [MWel] 12 23 46 93 139 186 232 279Battery [MWhel] 100 199 399 798 1197 1596 1995 2393
CSP+TES (all scenarios)
Solar receiver [MWth] 21 41 82 165 247 330 412 495
Thermal storage [MWhth] 239 478 957 1914 2871 3828 4785 5742Power block [MWel] 100 100 100 100 100 100 100 100
PV+TES (medium cost scenario)
Thermal storage [MWhth] 239 478 957 1914 2871 3828 4785 5742PV [MWel] 24 49 97 195 292 390 487 585
Electric heater [MWth] 26 53 106 212 318 424 530 635Power block [MWel] 100 100 100 100 100 100 100 100
Figure 7. Shares of overall CSP investment costs for the components solar field + receiver, TES, and power block depending on the storage hours. Current cost (left bar), medium cost (middle bar), and low cost (right bar) scenario. The share of the power block decreases significantly with increasing storage hours.
14 F. SCHÖNIGER ET AL.

The larger the ratio of the required amount of energy to the power output capacity, the cheaper the power block gets specifically because FLH are increased. This means that the share of the power block cost on the cost of the overall system decreases with increasing storage hours. Under current cost assumptions, it declines from 82% in the case of one storage hour to 16% in the case of 24 hours of stored energy (see Figure 7). In the case of CSP, the power block cost share is getting larger with decreasing overall investment cost as expected for future years since innovations are rather expected for the solar field, receiver, and thermal storage components.
In contrast, the cost split between PV and the Li-Ion battery storage remains almost constant for all storage durations (see Figure 8) because the share of power-related costs in the investment costs is much smaller than the share of power block costs for CSP. We observe the same downwards trend for increasing storage hours for PV+BESS as for CSP, however, it is much less distinct. Since there is a stronger relative cost reduction expected for the Li-Ion battery than for the PV modules, the share of the PV module cost in overall investment cost becomes larger in the medium and low-cost scenario.
5. Discussion and policy implications
The results of our analysis show that the competitiveness of CSP combined with TES in comparison to PVS in future fully decarbonized electricity systems is highly dependent on the required storage size. We find that PV+BESS is most competitive for short storage durations, even without learning, and CSP+TES is more economic for longer storage periods unless there is much stronger learning for PV +BESS than for CSP+TES. The tipping point of storage hours when PV+TES becomes more compe-titive than PV+BESS strongly depends on the price development of the technology components. The corresponding tipping points lie between 2–3 hours (current cost) today, and in the future at around 4 hours, assuming the medium cost reduction scenarios. If both sets of technologies reduce cost strongly, the tipping point will move to about 10 hours; if CSP+TES costs do not decrease as envisioned but PV+BESS costs decrease strongly, then it is conceivable that PV+BESS is cheaper
Figure 8. Shares of overall investment costs for the components PV and BESS depending on the storage hours. Current cost (left bar), medium cost (middle bar), and low cost (right bar) scenario. In contrast to CSP+TES, the ratio between the two components PV and battery stays almost the same for all storage hours.
ENERGY SOURCES, PART B: ECONOMICS, PLANNING, AND POLICY 15

than CSP+TES for the entire nighttime storage niche up to 24 hours storage time. At the same, if PV costs decrease very strongly compared to CSP costs, PV+TES might be able to cover longer storage durations at lower cost than CSP+TES. The competitive advantage of CSP/PV+TES for longer storage periods is driven by the fact that the CSP power block is decoupled from the other technology components, and that its size does not increase linearly with the storage hours in contrast to PV +BESS. Also, there is very much learning potential in BESS compared to the other technology components and this greatly impacts the competitiveness of PV+BESS. The competitiveness of PV +TES, however, strongly depends on the learning rates of PV since the cost reductions of TES apply to CSP+TES as well. For the competitiveness of CSP+TES compared to PV+BESS, the impact of storage duration is stronger than the impact of learning in CSP or TES.
These results are in line with Feldman et al. (2016) who find that for three hours of storage PV +BESS tends to produce a lower projected LCOE than CSP+TES whereas, for nine storage hours, it is the opposite. Lovegrove et al. (2018) find CSP+TES being competitive for six storage hours and more, whereas PV+BESS is only considered competitive for shorter storage durations. Payaro et al. (2018) also find that for a capacity factor of 85%, CSP+TES is more competitive than PV+BESS in any cost scenario, whereas it depends on the learning for a 50% capacity factor. We add to these findings by adding updated technology costs and showing what these tipping points depend on, i.e. the learning rates in CSP and BESS technologies.
There are some limitations to our study. In our analysis, we looked at an isolated system providing electricity at full capacity for various durations after sunset. A real-world power system would likely not demand such power, but rather allow for generation also during sun hours, and it may not require baseload generation but rather (residual) load-following operation of the flexible power fleet. Operational behavior and economics (e.g. part-load operation, additional revenues in balancing markets, economies of scale) will look differently in a real electricity system where additional electricity to the analyzed storage hours could be sold on the market, and other factors like the availability of alternative generation assets might come into play that influence the competitiveness of all technology options. Contrary to what is reflected in our model setup, the storage options could provide different ancillary services and BESS or TES in combination with an electric heater could make use of additional arbitrage opportunities by charging additional electricity from the grid. On the other hand, grid constraints and integration cost play a role in the expansion of renewable energy sources. For further considerations, when comparing different renewable energy options and their ability to dispatch their electricity generation they should be taken into account (Mehos et al. 2016). Also, CSP and PV use different components of solar radiation to produce energy. The required continuous electricity generation from storage up to 24 hours in this study is more probable for CSP than PV because cloudy days without any DNI are possible whereas 24 hours without any GHI are a rather theoretic setting.
Our findings have important policy implications. Since CSP+TES and PV+BESS are competitive for certain storage requirements, it is important to continue the development of all technology combina-tions toward the 2050 horizon. As fossil generators are phased out over time, this need will arise, and dispatchable renewable options must be available when needed in the future. Having different technological options ready allows us to take advantage of optimal solutions for different demand profiles and can contribute to minimizing the overall system cost. In the end, policy decisions on electricity market design will decide which degree of solar dispatchability is required and rewarded. As the system value for short- and long-term storage is not the same, revenues from these segments might also be different and yet, technologies to serve both segments will be needed.
In Morocco, the Noor Midelt hybrid solar plant (800 MW) will be the first solar project in the world to combine PV as well as CSP with TES instead of the initial project plan to include PV+BESS. With PV prices decreasing faster than expected, this combination was found to be the optimal mix to deliver electricity for the day and five hours after sunset at 0.07 USD/kWh (SolarPACES, 2020). To gain ground sustainably in the electricity sector, CSP needs to keep up with the expected steep cost reductions expected for PV (Jorgenson, Mehos, and Denholm 2016). In terms of cost reductions, the advantage of CSP is that the globally installed capacity is much smaller than the PV capacity,
16 F. SCHÖNIGER ET AL.

meaning that, following the concept of technological learning, cost reductions can be achieved with relatively low capacity additions in absolute terms. Although CSP learning rates have not been as high as for PV, observed learning has been in some periods up to 18% (Lilliestam et al. 2017), and CSP has shown the largest year-on-year electricity cost decrease of all renewable electricity technologies (26% for 2017–2018) (IRENA 2019b). To achieve the medium cost reductions assumed in this analysis, the investment cost for the solar field and receiver system of CSP must decrease by 25% in total. With 5.8 GW of CSP projects being operational worldwide (SolarPACES 2019) and a learning rate of 20%, CSP has to add around 7 GW of global capacity to achieve this medium cost scenario. This seems feasible for a large country or world region, like the EU (and Spain), China, the US, or a group of MENA countries that have already collected experience with CSP. If one of these regions chose to establish support policies explicitly for CSP, then they will have several, competitive technology options – including TES which can be combined with PV as well – available to provide dispatchable solar power. PV+BESS is suited for short evening or morning peaks whereas CSP+TES can deliver baseload if need be for the whole night. Thus, the two options can complement each other to fulfil the specific demand profiles in different locations. To enable future electricity systems to cover short-term as well as long- term flexibility needs, it is advisable to further develop PVS as well as CSP+TES and support deployment of both options in the electricity market: both configurations have a role to play in a future fully decarbonized, renewable power system. This way, the optimal technology combinations will be available for the different applications and time-scales and help to provide dispatchable renewable electricity for deeply decarbonized power systems.
Availability of data
The data that support the findings of this study are openly available via Zenodo at https://doi.org/10.5281/zenodo. 3939412.
Funding
This work was supported by the European Union’s Horizon 2020 research and innovation programme (Grant agree-ment 764626, MUSTEC project). The authors acknowledge the TU Wien University Library for financial support through its Open Access Funding Program.
ORCID
Franziska Schöniger http://orcid.org/0000-0002-1402-5781Richard Thonig http://orcid.org/0000-0002-3736-257XGustav Resch http://orcid.org/0000-0001-6122-4081Johan Lilliestam http://orcid.org/0000-0001-6913-5956
References
1414 degrees. (2019, November 29). 1414 degrees acquiring Aurora Project near Port Augusta. Company Website. https://1414degrees.com.au/acquiring-aurora-project/
Balmorel. (2019). Balmorel model provided by the Balmorel Community on Github. Accessed April 1, 2019. https:// github.com/balmorelcommunity/Balmorel
Barragán-Beaud, C., A. Pizarro-Alonso, M. Xylia, S. Syri, and S. Silveira. 2018. Carbon tax or emissions trading? An analysis of economic and political feasibility of policy mechanisms for greenhouse gas emissions reduction in the Mexican power sector. Energy Policy 122 (August):287–99. doi:10.1016/j.enpol.2018.07.010.
Bolinger, M., and J. Seel. (2018). Utility-scale solar: Empirical trends in project technology, cost, performance, and PPA pricing in the United States - 2018 Edition. https://emp.lbl.gov/sites/default/files/lbnl_utility_scale_solar_2018_edi tion_report.pdf%0Ahttps://emp.lbl.gov/utility-scale-solar
Bolinger, M., J. Seel, and D. Robson. (2019). Utility-scale solar: Empirical trends in project technology, cost, perfor-mance, and PPA pricing in the United States – 2019 Edition. http://eta-publications.lbl.gov/sites/default/files/lbnl_ utility_scale_solar_2018_edition_report.pdf
ENERGY SOURCES, PART B: ECONOMICS, PLANNING, AND POLICY 17

COBRA. (2019). CSP industry’s data.Cole, W., and A. W. Frazier (2019). Cost projections for utility-scale battery storage. Technical Report NREL/TP-6A20-
73222. www.nrel.gov/publications.CSP.guru. (2020). CSP.guru (Version 2020-01-01) [Data set]. https://doi.org/https://zenodo.org/record/3909229De Vita, A., I. Kielichowska, P. Mandatowa, P. Capros, E. Dimopoulou, S. Evangelopoulou, and G. Dekelver (2018).
Technology pathways in decarbonisation scenarios. https://ec.europa.eu/energy/sites/ener/files/documents/2018_06_ 27_technology_pathways_-_finalreportmain2.pdf
Denholm, P., R. Margolis, and J. Eichman (2017). Evaluating the technical and economic performance of PV plus storage power plants. doi:10.2172/1376049
Denholm, P., M. O’Connell, and G. Brinkman. 2015. Overgeneration from solar energy in California: A field guide to the duck chart. Golden, CO: National Renewable EnergyLaboratory.
Dieckmann, S., J. Dersch, S. Giuliano, M. Puppe, E. Lüpfert, K. Hennecke, . . . P. Ralon (2017). LCOE reduction potential of parabolic trough and solar tower CSP technology until 2025. AIP Conference Proceedings, Abu Dhabi, United Arab Emirates, 1850 (June). doi:10.1063/1.4984538.
ESTELA, DCSP, & Protermosolar. (2015). Understanding the costs of solar thermal electricity plants. doi:10.1590/1807- 1929/agriambi.v20n6p525-532.
EU Science Hub. (2019). Photovoltaic Geographical Information System. Accessed October 2, 2019. https://re.jrc.ec. europa.eu/pvg_tools/en/tools.html#TMY
European Commission. (2020). Going climate-neutral by 2050: A strategic long-term vision for a prosperous, modern, competitive and climate-neutral EU economy. https://ec.europa.eu/clima/sites/clima/files/long_term_strategy_bro chure_en.pdf
Eurostat. (2019). HICP - inflation rate. Annual average ratio of change (%). EU (28 countries). Accessed December 2, 2019. https://ec.europa.eu/eurostat/tgm/table.do?tab=table&init=1&plugin=1&language=en&pcode=tec00118%0A
Fedato, E., M. Baldini, A. Dalla Riva, D. F. Mora Alvarez, A. K. Wiuff, J. Hethey, . . . J. M. Estebaranz. 2019. Feasibility analysis of GRIDSOL technology in Fuerteventura: A case study. The Journal of Engineering (2019 (18):5208–13. doi:10.1049/joe.2018.9285.
Feldman, D., R. Margolis, J. Stekli, D. Feldman, R. Margolis, and J. Stekli (2016). Exploring the potential competitiveness of utility-scale photovoltaics plus batteries with concentrating solar power, 2015 – 2030.
Fleer, J., S. Zurmühlen, J. Badeda, P. Stenzel, J. F. Hake, and D. U. Sauer. 2016. Model-based economic assessment of stationary battery systems providing primary control reserve. Energy Procedia 99 (March):11–24. doi:10.1016/j. egypro.2016.10.093.
Fu, R., D. Feldman, and R. Margolis (2018). U.S. Solar Photovoltaic System Cost Benchmark: Q1 2018. In NREL/ PR-6A20-72133. doi:10.7799/1325002.
Fu, R., T. Remo, R. Margolis, R. Fu, T. Remo, and R. Margolis (2018). 2018 U. S. Utility-scale photovoltaics- plus-energy storage system costs benchmark. National Renewable Energy Laboratory, (November), 32. https://www.nrel.gov/ docs/fy19osti/71714.pdf.%0Ahttps://www.nrel.gov/docs/fy19osti/71714.pdf
Heath, G. A., and J. J. Burkhardt III. 2011. Meta-analysis of estimates of life cycle greenhouse gas emissions from concentrating solar power preprint. In NREL/CP-6A20-52191, Vol. 16560. http://www.osti.gov/bridge
Hedegaard, K., and O. Balyk. 2013. Energy system investment model incorporating heat pumps with thermal storage in buildings and buffer tanks. Energy 63:356–65. doi:10.1016/j.energy.2013.09.061.
Hornsdale Power Reserve. (2020). Overview of hornsdale power reserve. Accessed June 26, 2020. https://hornsdalepo werreserve.com.au/overview/
IEA. 2019. IEA PVPS - Task 1 Strategy PV Analysis and Outreach. Paris: International Energy Agency. http://www.iea- pvps.org/?id=266.
IEA-ETSAP, & IRENA. (2013). Thermal energy storage. In IEA-ETSAP and IRENA Technology Brief E17.IRENA. (2012). Concentrating solar power. doi:10.1016/B978-0-12-812959-3.00012-5.IRENA. 2019a. Renewable electricity capacity and generation statistics. Masdar, UAE: International Renewable Energy
Agency [Online]. http://resourceirena.irena.org.IRENA. 2019b. Renewable power generation costs in 2018. Abu Dhabi: International Renewable Energy Agency.IRENA. (2020). Renewable power generation costs in 2019. https://www.irena.org/-/media/Files/IRENA/Agency/
Publication/2020/Jun/IRENA_Power_Generation_Costs_2019.pdfJamil, U., and W. Ali (2016). Performance tests and efficiency analysis of Solar Invictus 53S - A parabolic dish solar
collector for direct steam generation. AIP Conference Proceedings, Cape Town, South Africa, 1734 (May 2016). doi:10.1063/1.4949165.
Jensen, I. G., F. Wiese, R. Bramstoft, and M. Münster. 2020. Potential role of renewable gas in the transition of electricity and district heating systems. Energy Strategy Reviews 27 (November 2019):100446. doi:10.1016/j.esr.2019.100446.
Jorgenson, J., M. Mehos, and P. Denholm (2016). Comparing the net cost of CSP-TES to PV deployed with battery storage. AIP Conference Proceedings, Cape Town, South Africa, 1734(May 2016). doi:10.1063/1.4949183.
Kariuki, S. K., G. T. Machinda, and S. Chowdhury (2012). Solar multiple optimization and dispatch analysis of a potential parabolic CSP plant in Kenya. Proceedings of the IEEE Power Engineering Society Transmission and Distribution Conference, Orlando, Florida, 1–6. doi:10.1109/TDC.2012.6281594.
18 F. SCHÖNIGER ET AL.

Kittner, N., F. Lill, and D. M. Kammen. 2017. Energy storage deployment and innovation for the clean energy transition. Nature Energy 2 (9):17125. doi:10.1038/nenergy.2017.125.
Kurup, P., and C. S. Turchi (2015). Parabolic Trough Collector Cost Update for the System Advisor Model (SAM). In Technical Report NREL/TP-6A20-65228 National Renewable Energy Laboratory. http://www.nrel.gov/docs/fy16osti/ 65228.pdf
Lazard. (2018). Levelized Cost of Energy and Levelized Cost of Storage 2018. https://www.lazard.com/perspective/ levelized-cost-of-energy-and-levelized-cost-of-storage-2018/.
Lilliestam, J., T. Barradi, N. Caldés, M. Gomez, S. Hanger, J. Kern, and A. Patt. 2018. Policies to keep and expand the option of concentrating solar power for dispatchable renewable electricity. Energy Policy 116 (February):193–97. doi:10.1016/j.enpol.2018.02.014.
Lilliestam, J., M. Labordena, A. Patt, and S. Pfenninger. 2017. Empirically observed learning rates for concentrating solar power and their responses to regime change. Nature Energy 2:17094. doi:10.1038/nenergy.2017.94.
Lilliestam, J., L. Ollier, M. Labordena, S. Pfenninger, and R. Thonig. 2020. The near- to mid-term outlook for concentrating solar power: Mostly cloudy, chance of sun. Energy Sources Part B. doi:10.1080/15567249.2020.1773580.
Lovegrove, K., G. James, D. Leitch, M. A. Ngo, J. Rutovitz, M. Watt, and J. Wyder (2018). Comparison of dispatchable renewable electricity options. In Technologies for an Orderly Transition. https://arena.gov.au/assets/2018/10/ Comparison-Of-Dispatchable-Renewable-Electricity-Options-ITP-et-al-for-ARENA-2018.pdf
Lunz, B., P. Stöcker, R. Pitz-Paal, and D. U. Sauer. 2016. Evaluating the value of concentrated solar power in electricity systems with fluctuating energy sources. 1734:160010. doi:10.1063/1.4949251.
Malhotra, A., T. S. Schmidt, and J. Huenteler. 2019. The role of inter-sectoral learning in knowledge development and diffusion: Case studies on three clean energy technologies. Technological Forecasting and Social Change 146:464–87. doi:10.1016/j.techfore.2019.04.018.
Mehos, M., C. Turchi, J. Jorgenson, P. Denholm, C. K. Ho, and K. Armijo (2016). On the Path to SunShot: Advancing Concentrating Solar Power Technology, Performance, and Dispatchability. CO: National Renewable Energy Laboratory. NREL/TP-5500-65688, (May), 1–66. doi:10.1016/B978-0-08-087872-0.00319-X.
Müller-Steinhagen, H., and F. Trieb. 2004. Concentrating solar power - A review of the technology. In Future Energy. doi:10.1016/B978-0-08-054808-1.00010-7.
Murphy, C., Y. Sun, W. Cole, G. Maclaurin, C. Turchi, and M. Mehos (2019). The potential role of concentrating solar power within the context of DOE’s 2030 solar cost targets. In NREL Technical Report - NREL/TP-6A20-71912.
Nayak, P. K., S. Mahesh, H. J. Snaith, and D. Cahen. 2019. Photovoltaic solar cell technologies: Analysing the state of the art. Nature Reviews Materials 4 (4):269–85. doi:10.1038/s41578-019-0097-0.
NREL. (2019). Annual Technology Baseline: Electricity. Utility-Scale PV. Accessed December 6, 2019. https://atb.nrel. gov/electricity/2019/index.html?t=su
ÖNB. (2019). Euro Time Series. Accessed August 13, 2019. https://www.oenb.at/zinssaetzewechselkurse/zinssaetzewech selkurse?lang=en&mode=zeitreihenzumeuro
Payaro, A., A. A. Naik, R. Guedez, and B. Laumert (2018). Identification of required cost reductions for CSP to retain its competitive advantage as most economically viable solar-dispatchable technology. AIP Conference Proceedings, Santiago, Chile, 2033. doi:10.1063/1.5067064.
Pfenninger, S., P. Gauché, J. Lilliestam, K. Damerau, F. Wagner, and A. Patt. 2014. Potential for concentrating solar power to provide baseload and dispatchable power. Nature Climate Change 4:689–92. doi:10.1038/nclimate2276.
Ravn, H. F. (2001). The Bamorel Model: Theoretical background. http://www.balmorel.com/images/downloads/the- balmorel-model-theoretical-background.pdf
Schmidt, O., S. Melchior, A. Hawkes, and I. Staffell. 2019. Projecting the future levelized cost of electricity storage technologies. Joule 3 (1):81–100. doi:10.1016/j.joule.2018.12.008.
Shlain, A. (2019). The noun project. Accessed December 13, 2019. https://thenounproject.com/search/?q=transmission +tower&i=304344
SolarPACES. (2019). CSP projects around the world. Accessed December 13, 2019. https://www.solarpaces.org/csp- technologies/csp-projects-around-the-world/
SolarPACES. (2020). Morocco Pioneers PV with Thermal Storage at 800 MW Midelt CSP Project. Retrieved July 9, 2020from CSP News & Analysis website:. https://www.solarpaces.org/morocco-pioneers-pv-to-thermal-storage-at- 800-mw-midelt-csp-project/
Stephan, A., C. R. Bening, T. S. Schmidt, M. Schwarz, and V. H. Hoffmann. 2019. The role of inter-sectoral knowledge spillovers in technological innovations: The case of lithium-ion batteries. Technological Forecasting and Social Change 148:119718. doi:10.1016/j.techfore.2019.119718.
Tsiropoulos, I., D. Tarvydas, and N. Lebedeva (2018). Li-ion batteries for mobility and stationary storage applications - Scenarios for costs and market growth. doi:10.2760/87175.
Turchi, C. S., M. Boyd, D. Kesseli, P. Kurup, M. Mehos, T. Neises, and T. Wendelin (2019). CSP systems analysis - Final project report CSP systems analysis - final project report.
Wang, Z. 2019. Chapter 6 - Thermal storage systems. In Design of solar thermal power plants, ed. Z. Wang, 387–415. Academic Press. doi:10.1016/B978-0-12-815613-1.00006-7.
ENERGY SOURCES, PART B: ECONOMICS, PLANNING, AND POLICY 19

Wiese, F., R. Bramstoft, H. Koduvere, A. Pizarro Alonso, O. Balyk, J. G. Kirkerud, and H. Ravn. 2018. Balmorel open source energy system model. Energy Strategy Reviews 20:26–34. doi:10.1016/j.esr.2018.01.003.
Yagi, K., R. Sioshansi, and P. Denholm. 2019. Evaluating a concentrating solar power plant as an extended-duration peaking resource. Solar Energy 191 (September):686–96. doi:10.1016/j.solener.2019.08.008.
Zurita, A., C. Mata-Torres, C. Valenzuela, C. Felbol, J. M. Cardemil, A. M. Guzmán, and R. A. Escobar. 2018. Techno- economic evaluation of a hybrid CSP + PV plant integrated with thermal energy storage and a large-scale battery energy storage system for base generation. Solar Energy 173 (January):1262–77. doi:10.1016/j.solener.2018.08.061.
AppendixTheoretical background on the solar-to-electricity efficiency of CSPThe optical efficiency ηoptical is the optical efficiency of the mirrors and receiver. The thermal efficiency describes the
thermal efficiency of the receiver system including the HTF ηthermal; receiver . The optical efficiency is the optical energy entering the projected area of the receiver Aprojected divided by the incident solar radiation in terms of DNI to the solar field.
Qoptical ¼ DNI � Aprojected � ηoptical (6)
The thermal efficiency of the receiver ηthermal; receiver is then obtained as the share of thermal energy Qfluid transferred to the HTF and finally to the power block.
ηthermal; receiver ¼Qfluid
Qoptical(7)
Net solar-to-steam efficiency ηsteam of the system is the product of thermal and optical efficiency.
ηsteam ¼ ηoptical � ηthermal; receiver (8)
Annual net solar-to-electricity efficiency ηCSP which is the overall yearly net power generation divided by the incident DNI on the solar field is the product of the power block efficiency ηpower block and the net solar-to-steam efficiency ηsteam.
ηCSP ¼ ηsteam � ηpower block (9)
20 F. SCHÖNIGER ET AL.