making the complex less complicated: an introduction to social network analysis
TRANSCRIPT

Centre forResearch inAmplifiedPractice

Image: CC-BY-NC-ND the_forgotten_nomadhttps://flic.kr/p/kubCDA

Making the complex less complicated:An introduction to network analysis
Martin Hawksey
@mhawksey
#iltaedtech17
http://go.alt.ac.uk/iltaedtech17-networksThis work is licensed under a
Creative Commons Attribution 4.0. CC-BY
mhawksey

Image: CC-BY m.hawksey https://flic.kr/p/qbMRze© RAND Corporation 1964
On Distributed Communications: 1. Introduction to Distributed Communications Network

Volume of data pre 2015 Volume of data since 2015

CC-BY-NC katie wheelerhttps://flic.kr/p/jmiuEG

alt.ac.uk
Moreno (1934) Who Shall Survive?Copyright: Nervous and Mental Disease Publishing Co.
Origins
@mhawksey
alt.ac.uk
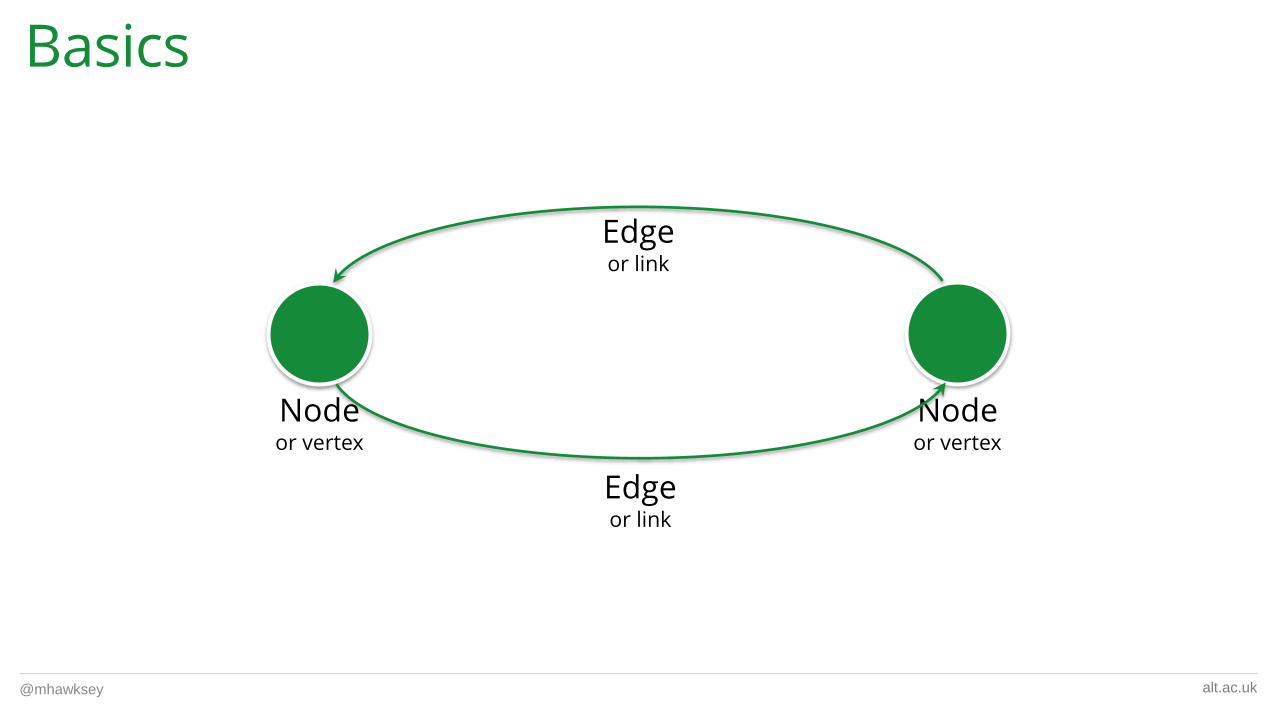
Nodeor vertex
Nodeor vertex
Edgeor link
Edgeor link
Basics
@mhawksey
alt.ac.uk
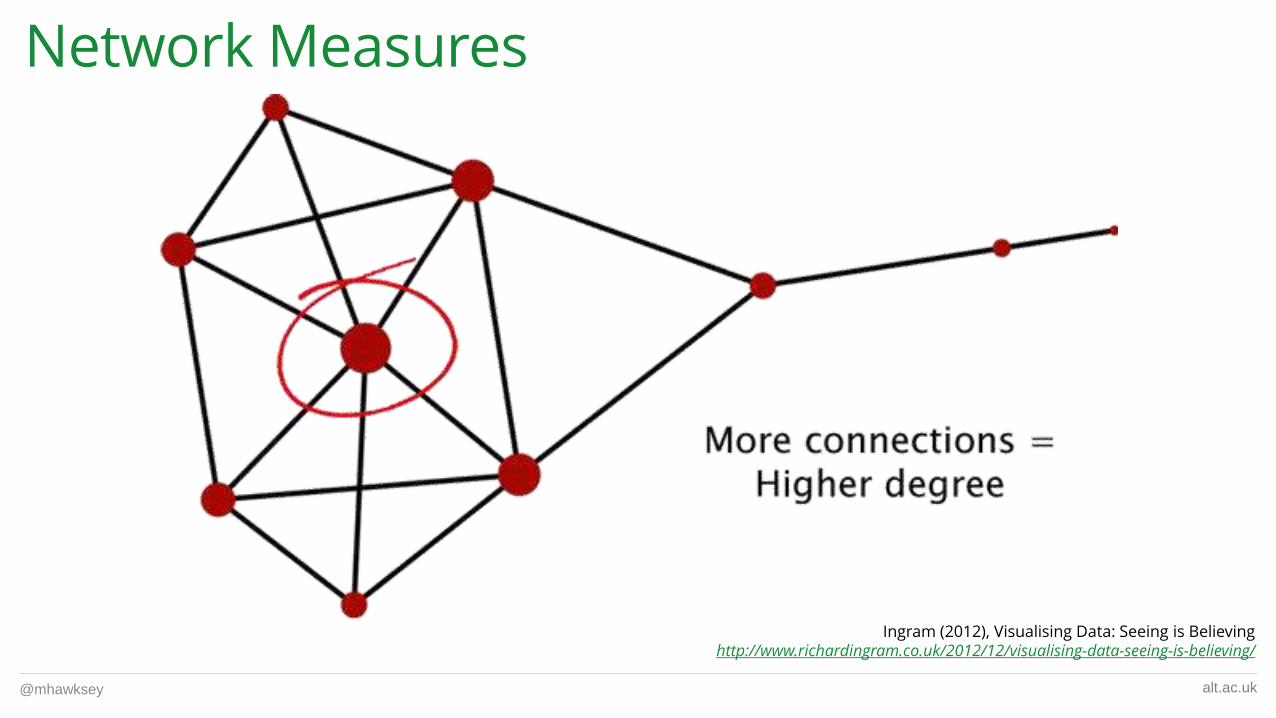
Ingram (2012), Visualising Data: Seeing is Believinghttp://www.richardingram.co.uk/2012/12/visualising-data-seeing-is-believing/
Network Measures
@mhawksey

alt.ac.uk
Ingram (2012), Visualising Data: Seeing is Believinghttp://www.richardingram.co.uk/2012/12/visualising-data-seeing-is-believing/
Network Measures
@mhawksey

alt.ac.uk
PageRank
Image Public Domainhttps://commons.wikimedia.org/wiki/File:PageRanks-Example.svg
@mhawksey

alt.ac.uk
Making networks
@mhawksey

alt.ac.uk
Examples
Bakharia and Dawson (2011) SNAPP: A Bird’s-eye View of Temporal Participant Interaction https://www.slideshare.net/aneeshabakharia/snapp-learning-analytics-and-knowledge-conference-2011
Learner Isolation Facilitator Centric
@mhawksey

alt.ac.uk
Examples
Bakharia and Dawson (2011) SNAPP: A Bird’s-eye View of Temporal Participant Interaction https://www.slideshare.net/aneeshabakharia/snapp-learning-analytics-and-knowledge-conference-2011
Non Interacting Groups Facilitator Bias
@mhawksey

CC-BY Magnus Bråthhttps://flic.kr/p/9doZ1j
Fur Ball

alt.ac.uk
ExamplesSituational Awareness
@mhawksey
#ukoer hashtag community 2010CC-BY psychemedia https://flic.kr/p/8JBzAo
“
alt.ac.uk
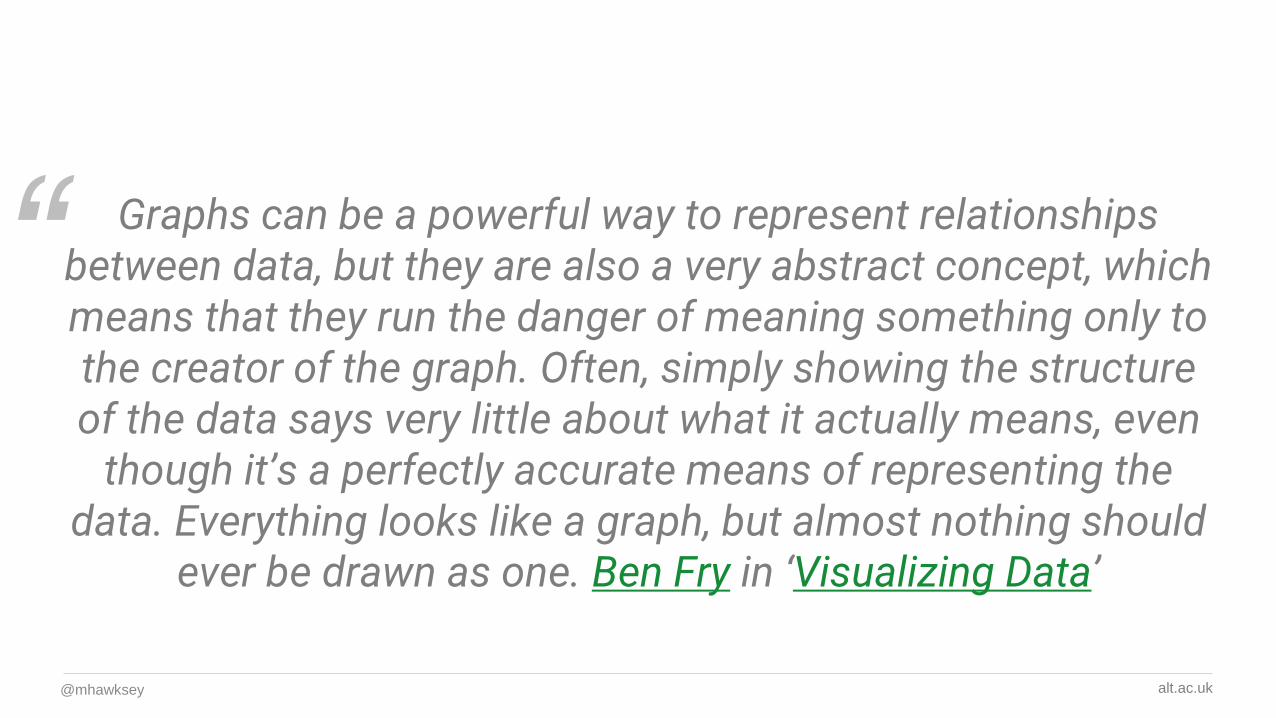
Graphs can be a powerful way to represent relationships between data, but they are also a very abstract concept, which means that they run the danger of meaning something only to the creator of the graph. Often, simply showing the structure of the data says very little about what it actually means, even
though it’s a perfectly accurate means of representing the data. Everything looks like a graph, but almost nothing should
ever be drawn as one. Ben Fry in ‘Visualizing Data’
@mhawksey

alt.ac.uk
CC-BY-SA miss Murasakihttps://flic.kr/p/bCafgG
Paws

alt.ac.ukEric Berlow: Simplifying complexity
https://www.ted.com/talks/eric_berlow_how_complexity_leads_to_simplicity@mhawksey

alt.ac.ukEric Berlow: Simplifying complexity
https://www.ted.com/talks/eric_berlow_how_complexity_leads_to_simplicity@mhawksey

alt.ac.ukEric Berlow: Simplifying complexity
https://www.ted.com/talks/eric_berlow_how_complexity_leads_to_simplicity@mhawksey

T A G S . H A W K S E Y . I N F Ogo.alt.ac.uk/iltaedtech17-tags
alt.ac.uk
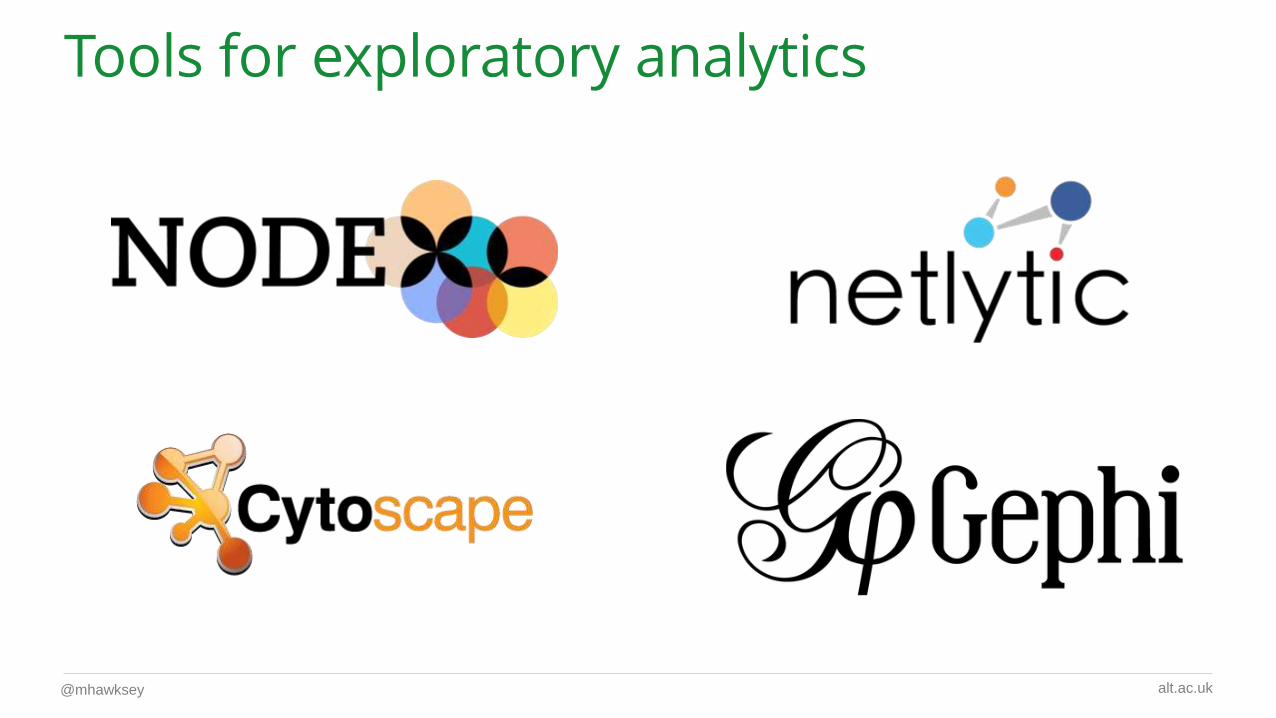
Tools for exploratory analytics
@mhawksey

alt.ac.uk
Key points
◊ Getting to this and you are over
80% or the way
◊ There are a lot of very
knowledgeable people in the
community willing to help
◊ Go explore … and have fun
@mhawksey

alt.ac.uk
Getting Social Network Data
◊ Using Twitter as a data source: an overview of
social media research tools (updated for 2017)
◊ Twitter: How to archive event hashtags and create
an interactive visualization of the conversation
@mhawksey

alt.ac.uk
Thank you!
@mhawksey+MartinHawksey
http://go.alt.ac.uk/iltaedtech17-networks
@mhawksey

Association for Learning Technology
Registered charity number: 11600399
www.alt.ac.uk @A_L_T