making presentations good design and planning does wonders but - practice makes perfect!
TRANSCRIPT

Making presentations
Good design and planning does wonders
but -
practice makes perfect!
• Analyze your audience - limit your topic accordingly
• Determine your primary purpose - the main point you want to get across
• Select effective supporting information
• Choose an appropriate pattern of organization
• Prepare an outline - keep it brief, main points/supporting points only
• Analyze your audience– Expertise – Hierarchical position (pupil or principal?)– Age– Educational level– Occupation– Attitudes - positive, negative, or neutral to your
message
• Select the appropriate visual aids
• Overheads (text, pictures, tables, graphs etc.)
• Slides (PowerPoint)
• Flip charts
• Chalkboard
• Handouts (remember PowerPoint notes!)
• Use three dimensional objects
Computer screen projections
• Powerpoint with TV or beamer
• Use URLs
• (make web pages)
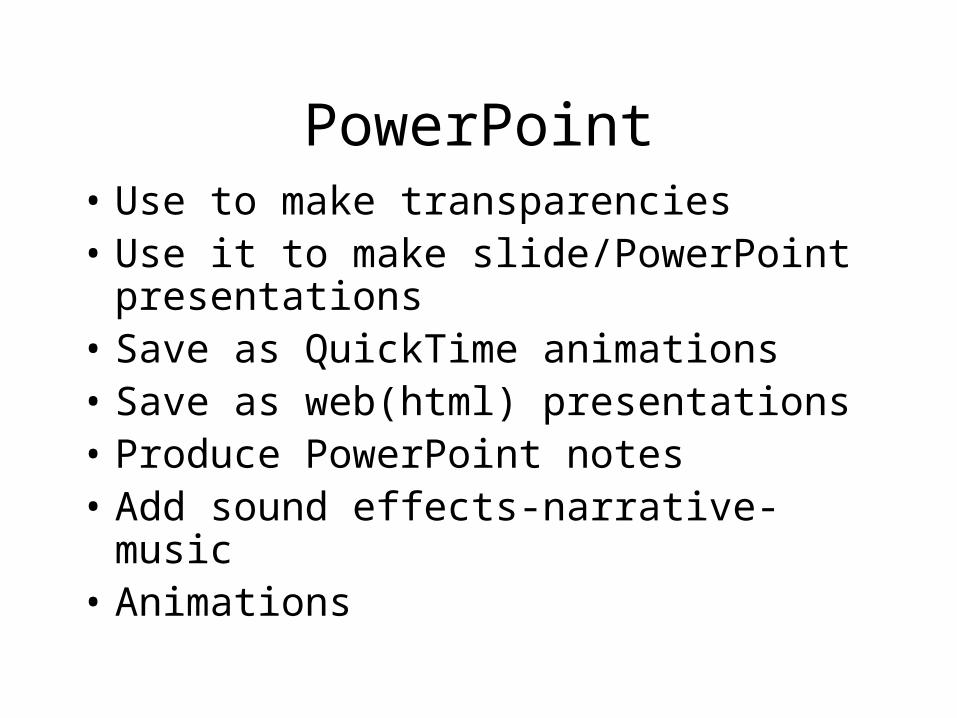
PowerPoint• Use to make transparencies• Use it to make slide/PowerPoint
presentations• Save as QuickTime animations• Save as web(html) presentations• Produce PowerPoint notes• Add sound effects-narrative-music• Animations

Slide notes
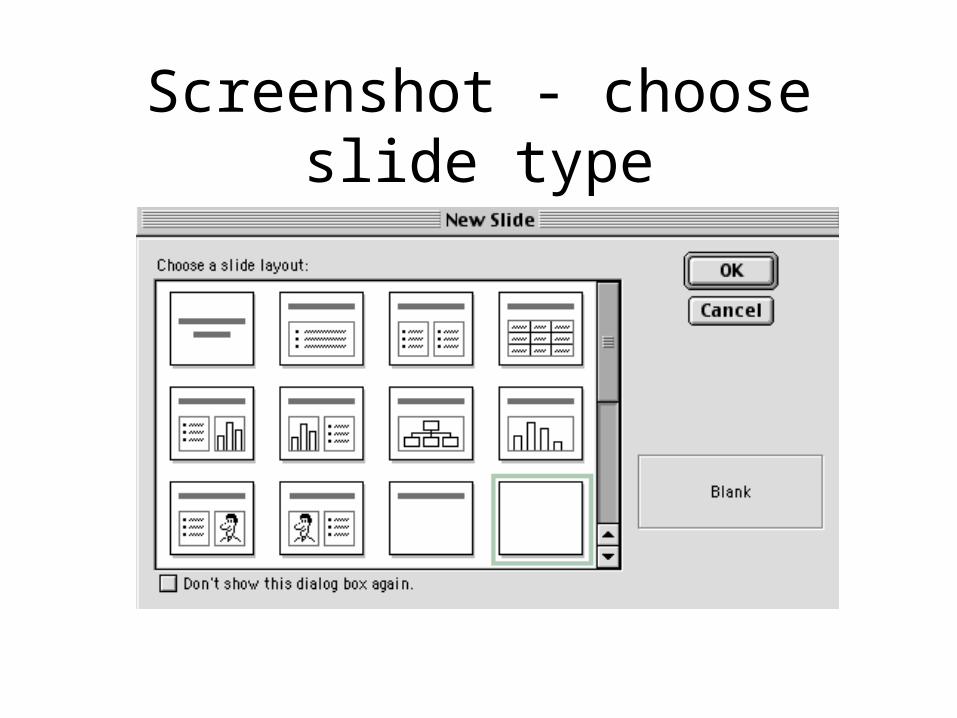
Screenshot - choose slide type
Standard mistakes?
1. -
2. -
3. -
4. -
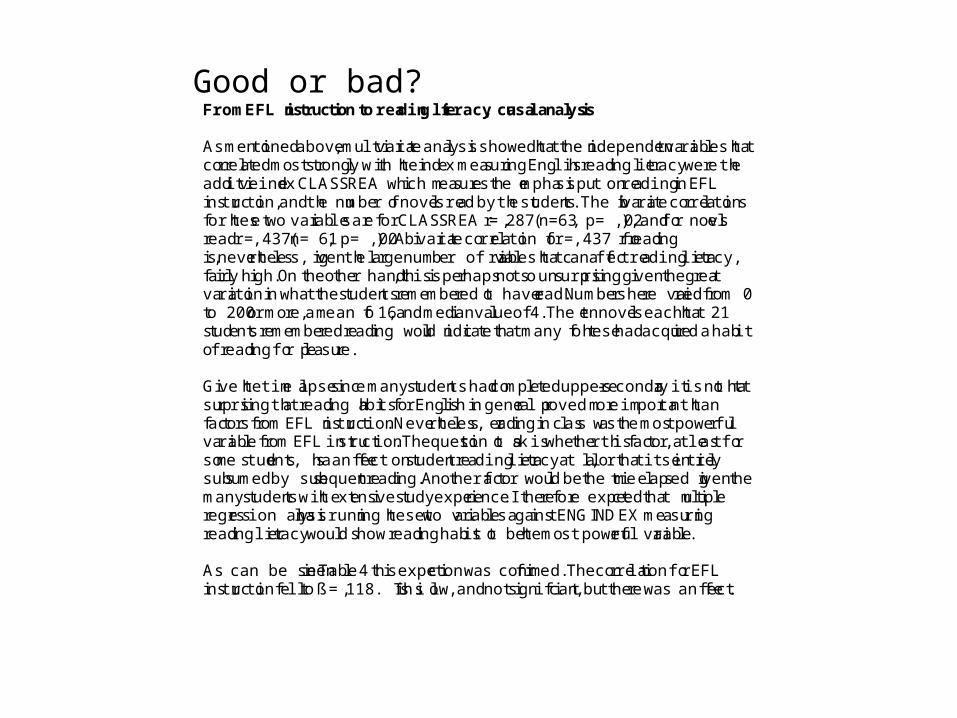
From EFL instruction to reading literacy, causal analysis
As mentioned above, multivariate analysis showed that the independent variables thatcorrelated most strongly with the index measuring English reading literacy were theadditive index CLASSREA which measures the emphasis put on reading in EFLinstruction, and the number of novels read by the students. The bivariate correlationsfor these two variables are for CLASSREA r= ,287 (n=63, p= ,02), and for novelsread r= ,437 (n= 61, p= ,00). A bivariate correlation of r =,437 for readingis,nevertheless, given the large number of variables that can affect reading literacy,fairly high. On the other hand, this is perhaps not so unsurprising given the greatvariation in what the students remembered to have read. Numbers here varied from 0to 200 or more, a mean of 16, and median value of 4. The ten novels each that 21students remembered reading would indicate that many of these had acquired a habitof reading for pleasure.
Give the time lapse since many students had completed upper-secondary it is not thatsurprising that reading habits for English in general proved more important thanfactors from EFL instruction. Nevertheless, reading in class was the most powerfulvariable from EFL instruction. The question to ask is whether this factor, at least forsome students, has an effect on student reading literacy at all, or that it is entirelysubsumed by subsequent reading. Another factor would be the time elapsed given themany students with extensive study experience. I therefore expected that multipleregression analysis running these two variables against ENGINDEX measuringreading literacy would show reading habits to be the most powerful variable.
As can be seen in Table 4 this expection was confirmed. The correlation for EFLinstruction fell to ß = ,118. This is low, and not significant, but there was an effect.
Good or bad?
Whether slide or transparency-less is better
• Text - font 20-22 or larger 32 or 44 for titles
• Light backgrounds for transparencies,dark text
• Dark for onscreen documents (light text)
• Do not clutter pages with too much information/changes/items
• Use the minimum number of foils/slides
Whether slide or transparency-less is better (Slide color scheme)
• Text - font 20-22 or larger 32 or 44 for titles
• Light backgrounds for transparencies,dark text
• Dark for onscreen documents (light text)
• Do not clutter pages with too much information/changes/items
• Use the minimum number of foils/slides
Visual aids - Picture 1
• Clip art
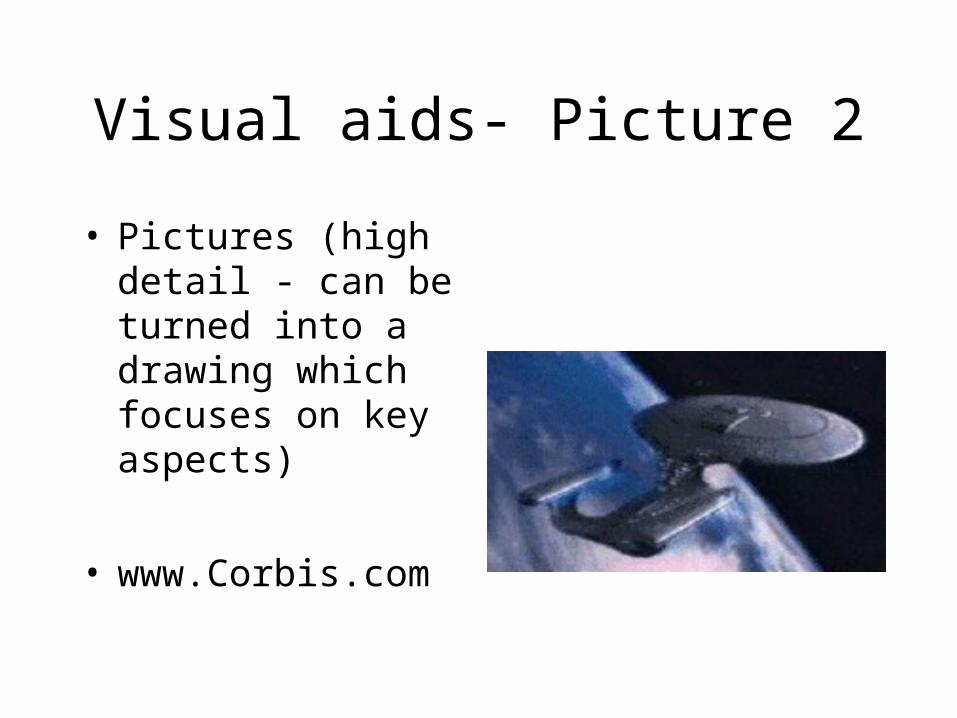
Visual aids- Picture 2
• Pictures (high detail - can be turned into a drawing which focuses on key aspects)
• www.Corbis.com
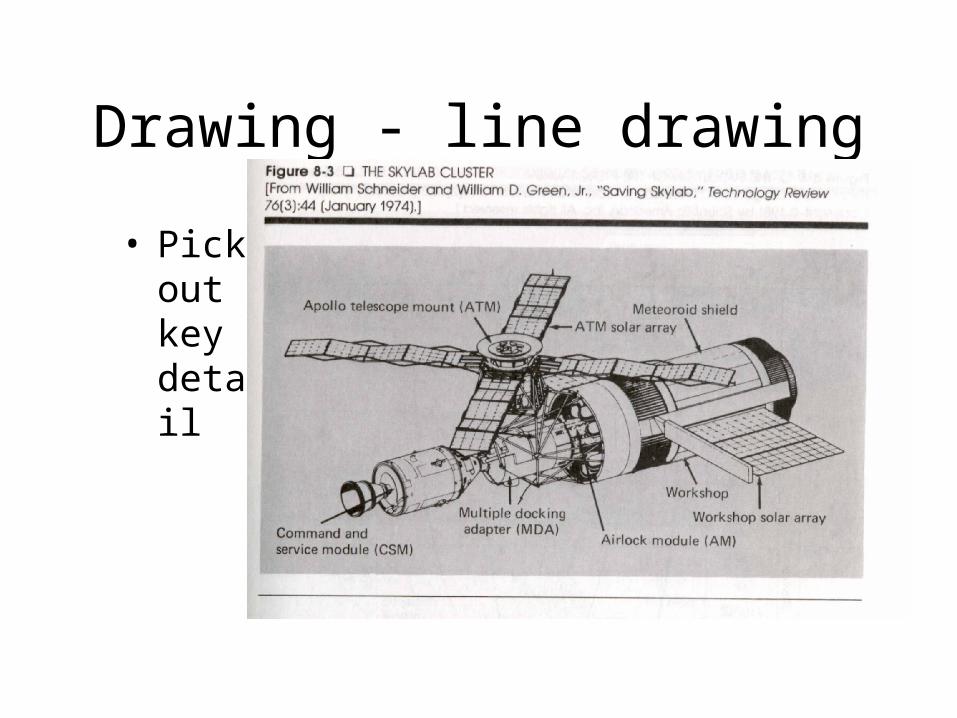
Drawing - line drawing
• Pick out key detail
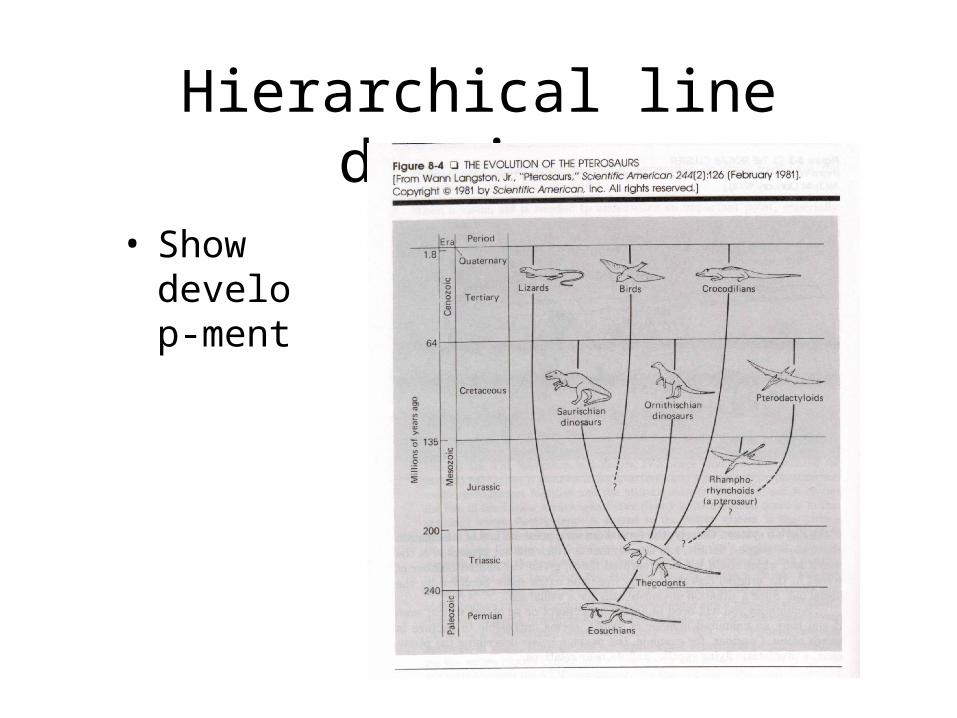
Hierarchical line drawing
• Show develop-ment

Blow-up
• Show detail
Graphs
• Line graphs
• Bar graphs
• Pie diagrams
• Tables
• Flow charts
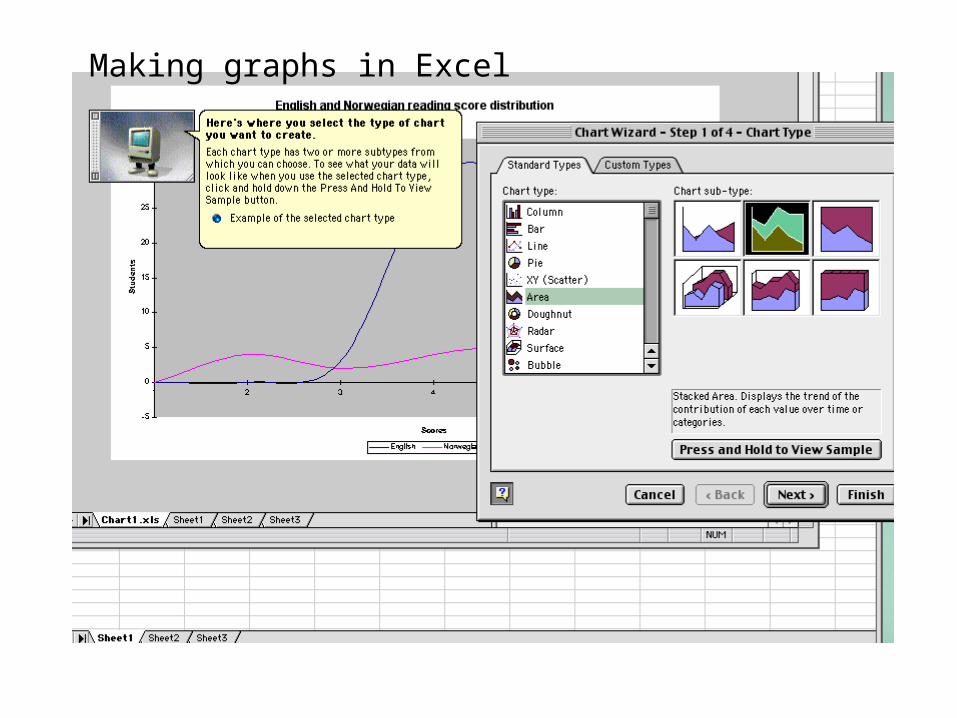
Making graphs in Excel
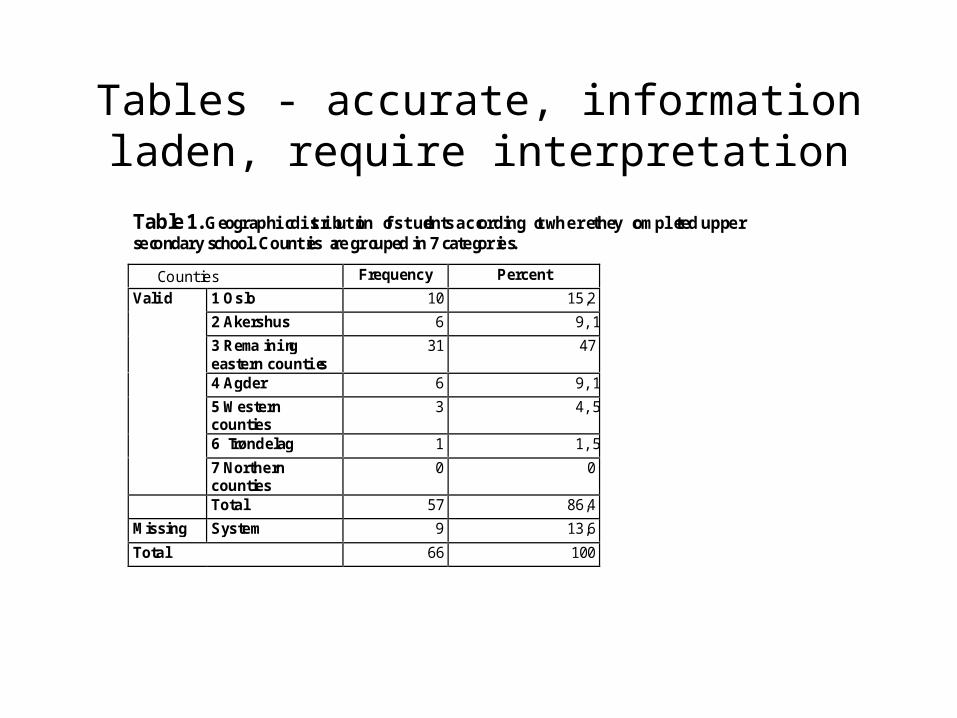
Tables - accurate, information laden, require interpretation
Table 1. Geographic distribution of students according to where they completed uppersecondary school. Counties are grouped in 7 categories.
Counties Frequency Percent
Valid 1 Oslo 10 15,2
2 Akershus 6 9,1
3 Remainingeastern counties
31 47
4 Agder 6 9,1
5 Westerncounties
3 4,5
6 Trøndelag 1 1,5
7 Northerncounties
0 0
Total 57 86,4
Missing System 9 13,6
Total 66 100
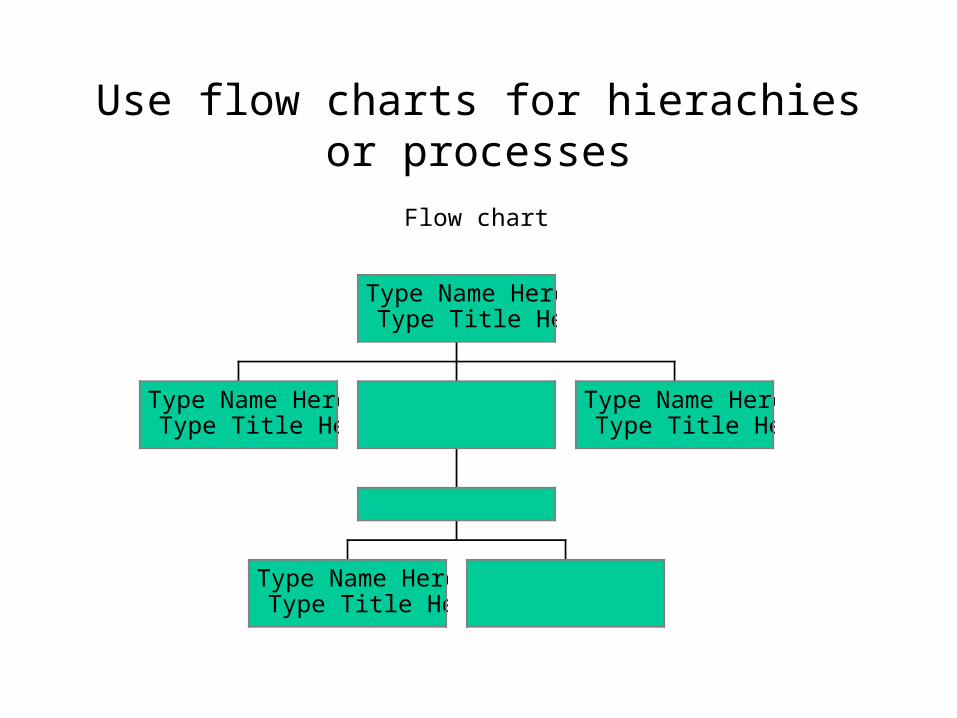
Use flow charts for hierachies or processes
Flow chart
Type Name HereType Title Here
Type Name HereType Title Here
Type Name HereType Title Here
Type Name HereType Title Here

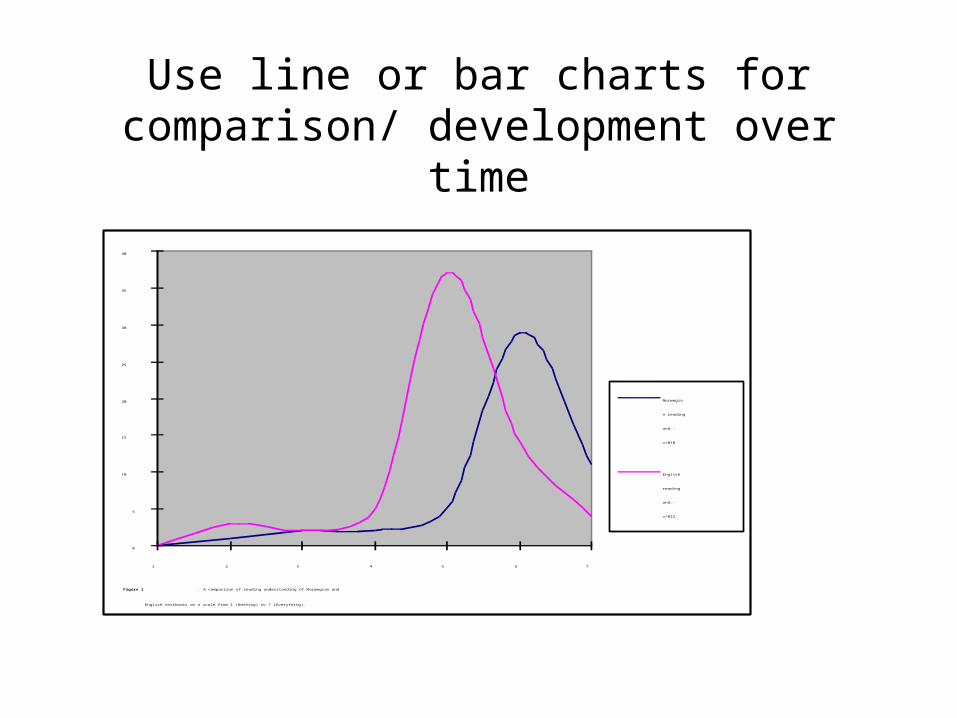
Use line or bar charts for comparison/ development over time
Use line or bar charts for comparison/ development over time
0
5
10
15
20
25
30
35
40
1 2 3 4 5 6 7
Norwegia
n reading
und.-
v/010
English
reading
und.-
v/012
Figure 1 . A comparison of reading understanding of Norwegian and
English textbooks on a scale from 1 (Nothing) to 7 (Everything).
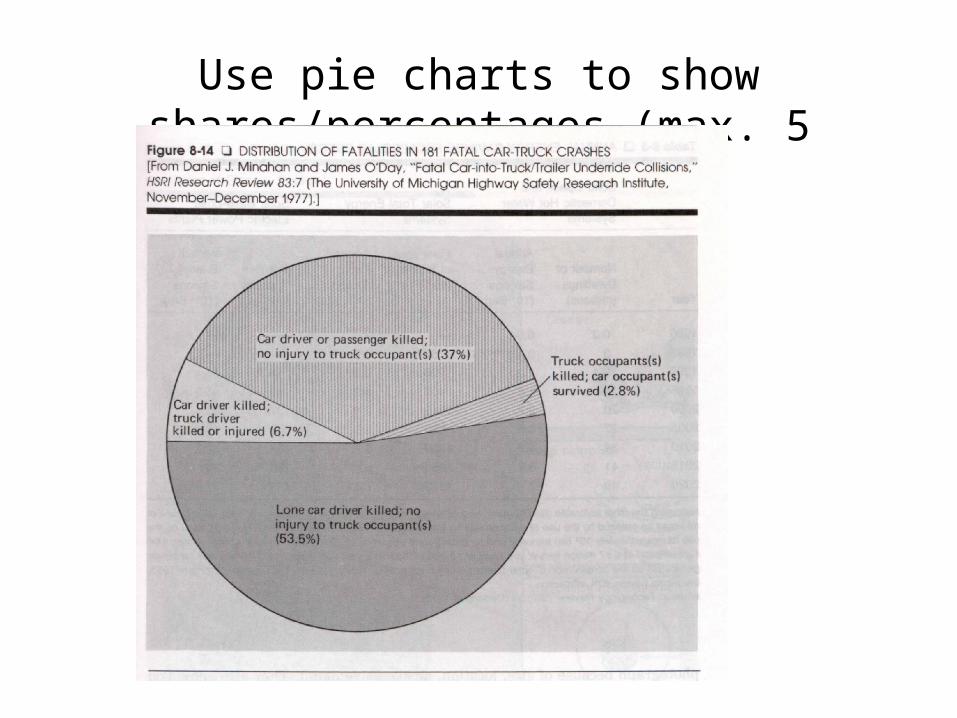
Use pie charts to show shares/percentages (max. 5 items)
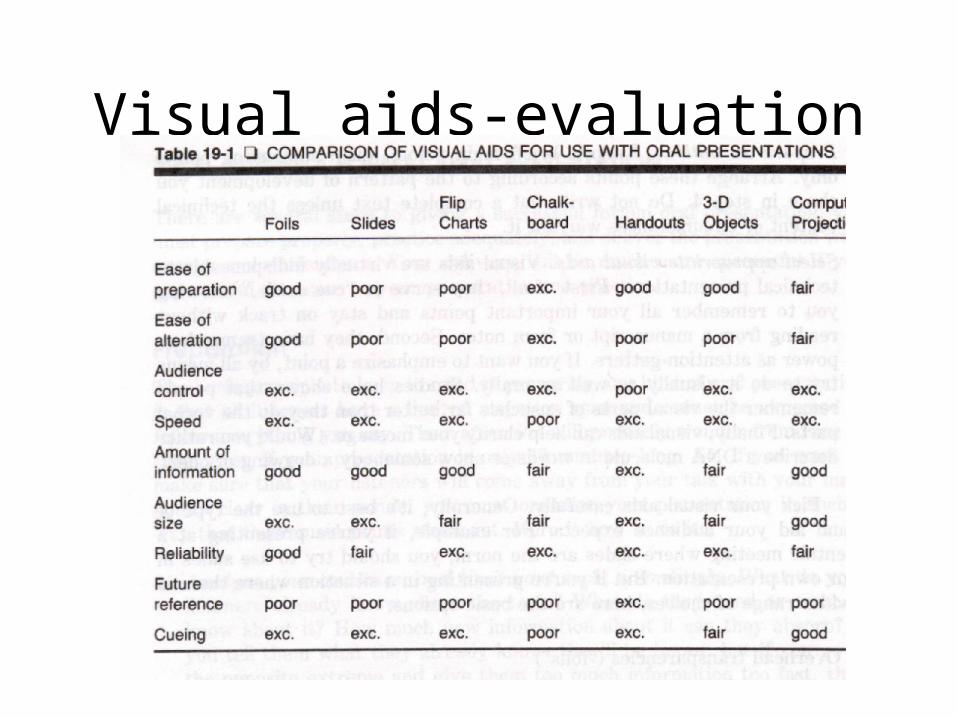
Visual aids-evaluation
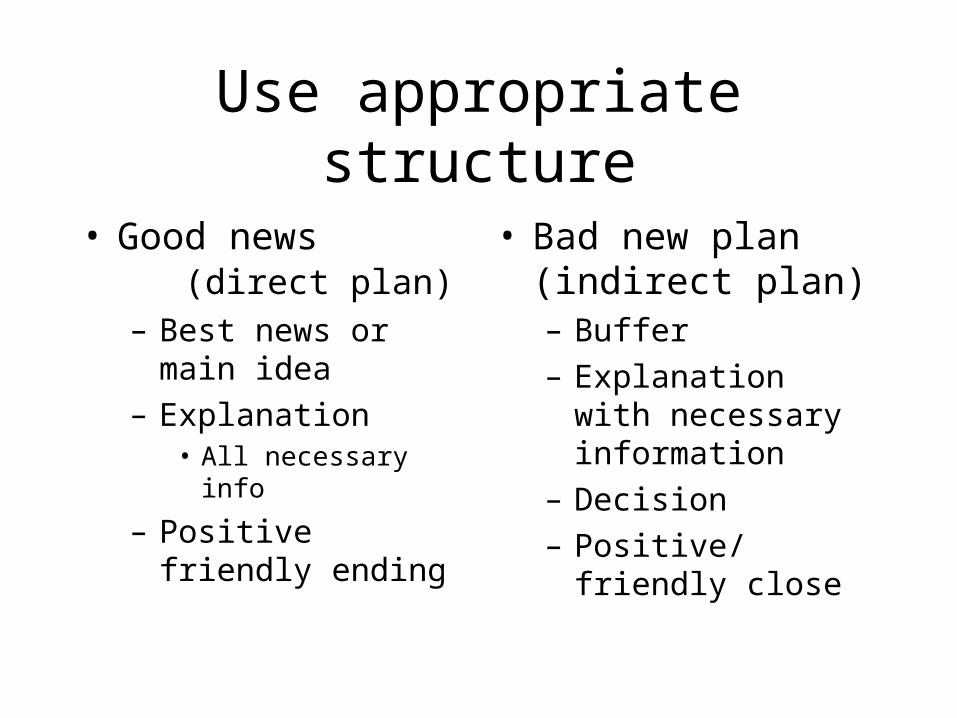
Use appropriate structure
• Good news (direct plan)– Best news or main idea
– Explanation• All necessary info
– Positive friendly ending
• Bad new plan (indirect plan)– Buffer
– Explanation with necessary information
– Decision
– Positive/friendly close
Persuasive - (used for selling etc.)
• Attention
• Interest
• Decision
• Action
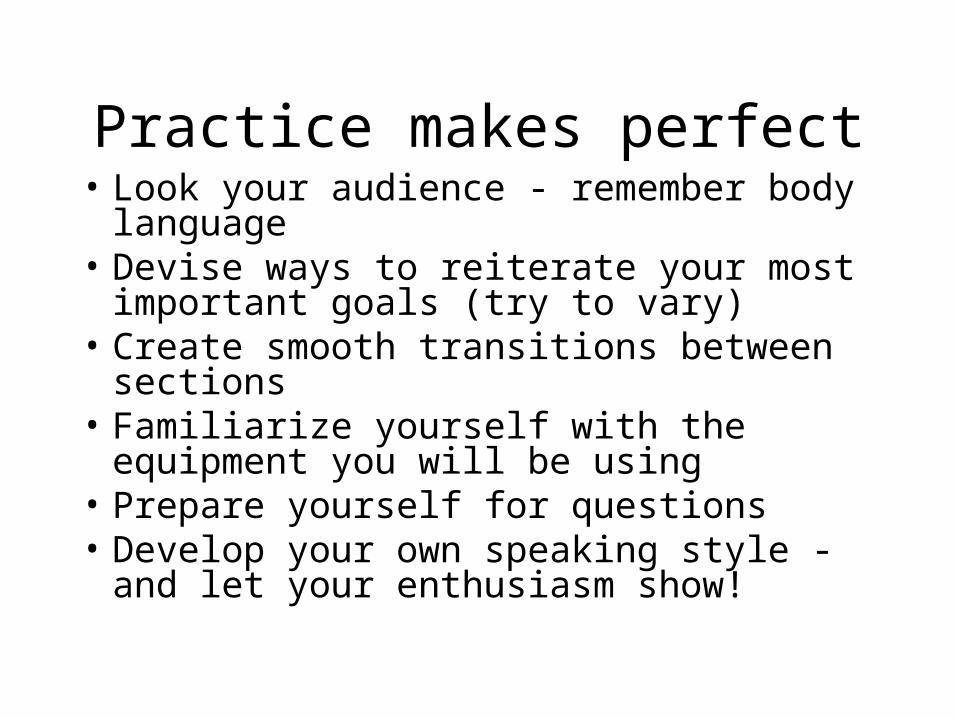
Practice makes perfect• Look your audience - remember body
language• Devise ways to reiterate your most
important goals (try to vary)• Create smooth transitions between sections• Familiarize yourself with the equipment
you will be using• Prepare yourself for questions• Develop your own speaking style - and let
your enthusiasm show!
Practice really makes perfect!!
• If you read from a manuscript - use a lively intonation - but I wouldn’t recommend reading :-(
• Prepare a suitable introduction– A catchy question– Suitable background knowledge– Definitions– What the issue is
Rehearse, get feedback, and do it again!
• Prepare a closing summary
• Attention increases towards the end (say you are ending off!) the last words are remembered best of all
• Get feedback from friends/an instructor/expert, revise it, and do it again
PowerPoint
Is available in the ubiqituous Microsoft Office
Need a computer, scanner, picture editor, beamer/TV• Makes “good” transparencies• Make slide shows/beamer presentation• Large text, graphs, pictures, tables,• Animations, sounds• But - you make the presentation - be professional!
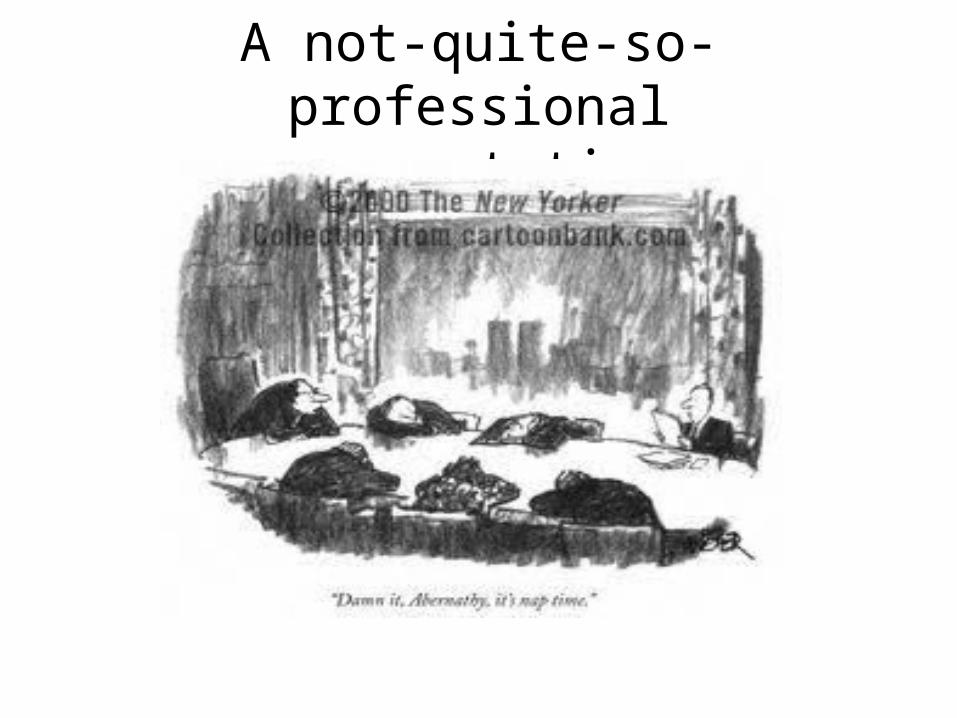
A not-quite-so-professional presentation