making police reform real: the rajasthan experiment · the schedule and system of duty assignments...
TRANSCRIPT

1
Making Police Reform Real:
The Rajasthan Experiment
A Collaboration between the Rajasthan Police and
the Abdul Latif Jameel Poverty Action Lab, MIT, USA
Abhijit Banerjee, Esther Duflo, Daniel Keniston, Nina Singh
Police reform has long been a contentious subject in India. Experts, activists and several
police commissions have called for the police to become more effective and accountable to the
needs of citizens in a modern democratic society, yet few reform proposals have had much impact
on the ground. Broad, systemic initiatives advocating fundamental changes to the institution of
policing have been only incompletely implemented, while other local projects have been imple-
mented on a small scale but have proven difficult or impossible to sustain and replicate. As a re-
sult, the Indian police are not nearly as effective as they could be: problems such as inefficiency,
corruption, and an insular police culture adversely affect police performance and create negative
public perceptions.
This paper documents an attempt to overcome the challenges of police reform in the In-
dian state of Rajasthan, evaluated through a series of RCT (Randomized Control Trials). Four
reform interventions were implemented in a randomly selected group of 162 police stations across
11 districts of the state: (1) weekly duty rosters with a guaranteed rotating day off per week; (2) a
freeze on transfers of police staff; (3) in-service training to update skills; and (4) placing communi-
ty observers in police stations. To evaluate these reforms, data was collected through two rounds
of surveys (before and after the intervention) including police interviews, decoy visits to police
stations, and a large scale crime survey—the first of its kind in India. The results suggest that two
of the interventions, the freeze on transfers and the training, do have the potential to improve the

2
police effectiveness and public image. The other reforms showed no robust effects, an outcome
that may be due to their incomplete implementation.
Background of Police Reform in India
Like many other developing countries, independent India inherited a police force initially
designed to protect the interests of the colonial power. The British authority established an Indian
police force in which senior officers were recruited through a competitive examination held in
London that was initially open only to the British citizens. Local constables formed the main inter-
face between the public and the police, but they were accountable only to the British colonial es-
tablishment they served. Fraternization with the public was discouraged.
The onset of democracy after independence did little to change the colonial organization,
while the social, economic and political dynamics of the society have transformed dramatically.
The Police Act of 1861 remains in effect, and so do the constraints and handicaps of an outmoded
system. In 1977 the National Police Commission (NPC) was formed to provide recommendations
for improving the effectiveness, accountability and public image of the police in view of the dem-
ocratic aspirations of people of independent India. The Commission pointed out several anoma-
lies and recommended progressive suggestions, but few of its recommendations have been put
into practice. Subsequently there have been a series of commissions aimed at reforming various
facets of policing, but essentially none of their recommendations have been implemented by the
successive governments.
Most recently, in 2005, the Government of India convened the Soli Sorabjee Committee to
draft a new Model Police Act to guide the states in view of the changing role of police in Indian
democracy. Following the Model act, a few states have drafted new police legislation, but none
have fully implemented them. In 2006, the Supreme Court of India in its judgment in Prakash
Singh vs Union of India directed the state governments to constitute institutions and draft me-
chanisms for improving the effectiveness and accountability of police. Here too, there has been
little implementation. Thus, so far the history of police reform in India is that of a series of dreams
but little on the ground changes.
3
In response to lack of systematic reform and the perceived need for change on the ground,
individual officers have taken initiatives at the local level. In Punjab, Sidhu (2004) implemented
weekly day off of the police personnel to reduce their level of stress and improve productivity in
districts. Similarly in 2002, the Rajasthan Police introduced a community policing program (Jan-
sahbhagita), to build police public partnership in resolving petty disputes and foster mutual un-
derstanding. However, these programs are often dependent on the support and enthusiasm of a
single individual or administration, and cease operation after their exit. The lack of broad support
may be due to the absence of any objective, substantial data on success; there is little basis to com-
pare the claims of the supporters and detractors of such initiatives.
Objective of the Rajasthan Police Experiment
Against this background, the leadership of Rajasthan Police conceived an innovative ap-
proach of police reforms that would depart from the past in two key areas: First, the interventions
would be simple and cost effective enough to be implemented in any police station in India, and
would not require fundamental changes in the policing legislations or cause extra financial bur-
den to the state. Second, they would be evaluated scientifically and quantitatively, providing
tangible data for future policy decisions. To assist in the evaluation aspect, the Rajasthan Police
partnered with J-PAL, a research institute based out of the Massachusetts Institute of Technology,
USA and the Institute for Financial Management and Research in Chennai, with a long experience
of conducting randomized evaluations of economic and social projects in developing countries,
and in particular in India. The Rajasthan Police Program aimed at:
1. Assessing the current state of (a) service delivery by Rajasthan Police and (b) police public
relations in Rajasthan, with the help of household survey.
2. Identifying means of advancing police efficiency, effectiveness and professionalism
through internal police management restructuring.
3. Suggesting measures to develop proper police attitude and communications with citizens.
4. Advising on improving public perception of the police and to secure citizens' willing and
active cooperation in all areas of police working.
4
Selection of Interventions
Preliminary interviews, focus groups, and review of the existing literature indicated four
problems that were both serious, and had the potential to be addressed through this the types of
reforms described above: First, extremely rapid transfers were causing dissatisfaction among the
police ranks and adversely affecting their performance. Second, members of the police felt that
the schedule and system of duty assignments within the police station was unfair and overwhel-
mingly stressful. Third, there seemed to be a major disconnect between the police self image as
overworked and unappreciated and the public’s perception of the police as high-handed and un-
responsive. Finally, many respondents within the police attributed poor performance to lack of
police training, both on professional and behavioral dimensions.
These issues have long been plaguing the police system. The National Police Commission
(NPC) in 1979 observed that ‚the threat of transfer is the most potent weapon in the hands of poli-
ticians to bend down the police to his will‛. (15.14) It is both a source of corruption as police offic-
ers pay bribes to politicians and senior officers to retain a good posting (Verma, 2003: Transparen-
cy International, 2005) as well as a barrier to law enforcement as officers may be reluctant to take
action in politically sensitive cases. As a result, many have suggested regularizing posting pe-
riods or a more transparent, systematic posting procedure.
Irrational use of manpower in the police station has been another area of concern directly
affecting the productivity and welfare of the personnel (NPC 1979, Sidhu 2004). The staff at the
police station has no fixed rest periods and theoretically remains on duty for twenty four hours a
day, seven days a week. The provision of a weekly day off for all staff has been advocated by the
NPC (3.19). Several states have implemented the weekly day off, including the neighboring states
of Gujarat and Punjab.
The allocation of different duties among the staff of police station by the Station House Of-
ficers (SHO) have also been found lacking transparency. Often, the complaints of partiality in as-
signing duties caused resentment and disinterest among the staff, ultimately hampering their
overall performance.

5
A third pressing issue has been the negative image of police, exacerbated by the lack of ac-
countability and communication to the public. NPC recommended the constitution of State Secu-
rity Commissions to promote efficiency and accountability. It also emphasized the need to com-
municate to the public a ‚clear understanding of the limitations and constraints within which the
police has to function‛ (61.46) CHRI (2005). Verma (1994, 2005, 2006) suggested the creation of
‚citizens’ boards‛ with extensive powers to investigate complaints against police personnel, and
evaluate their performance at the district level. Such experiences have been tried in several devel-
oped countries, as well as the ex-Soviet States (Capari and Marenin, 2005) and South Africa (Bruce
and Neild, 2005).
Another factors contributing the negative public image has been the lack of skills; both
‘professional’ (investigation methods, etc.) and ‘soft’ skills (mediation, communication) have fre-
quently been recognized as significant barriers to effective policing. While many have empha-
sized the need for emphasis on scientific investigation skills (Verma, 2004), the traditional colonial
attitudes of the police are also inadequate to command public trust in changed environment. The
NPC stated that ‚It is considered basic and fundamental…that every police officer develops an
attitude of courtesy and consideration combined with sympathy and understanding towards any
member of the public who comes to him seeking help.” (41.09)
In addition to the specific issues identified above, there is a general concern about the re-
liability of police data on crime. While Indian crime statistics are based exclusively on police sta-
tion crime registration, there have been serious allegations of non-reporting of crimes. The report-
ing rate may be low precisely because people are afraid of the police and expect them to be unres-
ponsive. Moreover, the police may actively discourage the reporting of crimes in order to make
their record look better. The NPC went to the extent of stating, ‚The unreliability of crime statis-
tics in India is well known….Whenever a genuine effort was made to register all crime…the fig-
ures showed such fantastic jumps as were impossible with any normal increase in one year‛
(62.10) . Precisely because registration rates are not a reliable source for crime statistics, most
countries, including the US, most European countries, and many developing countries, use crimes
statistics based on crime victimization surveys (household surveys conducted by independent

6
agency) to measure crime. Better statistics on crime would give the police a greater understanding
of where to put in effort in fighting it, and would provide the basis for a more reasoned allocation
of resources and manpower.
Four Interventions of Rajasthan Experiment
The following four interventions, implemented in 162 police stations across 11 districts of
Rajasthan for a period of one and half years were designed to address some of the difficulties
mentioned above:
(i) Freezing of transfers: All administrative transfers of personnel posted in these police stations
for less than two years were prohibited during the program period. Exceptions could be made for
well documented cases of police misconduct requiring transfer.
(ii) Weekly day off and Duty roster system: The entire staff in selected police stations (except the
SHO) received one day off every eight days. In smaller police stations, where the shortage of
manpower might be more acute, the SHO had the option of extending the rotation period up to 15
days.
In addition, the various police station level duties, such as writing general diary and other paper-
work, night patrolling, sentry duty, court liaison, serving summons, etc., were allocated to staff on
a rotating basis. The goal was to create a transparent and fair system of work allocation that
would lead to lower stress, more flexibility, reduced corruption, better informed constabulary and
higher overall productivity.
(iii) Community Observers: Introduced for the first time in Rajasthan, the community observers
were local volunteers chosen to sit in the police station for approximately three hours during its
peak operating hours. The observers’ sole task was to watch the activities within the police sta-
tion and become familiar with the duties, procedures and challenges faced by the police. Their
comments could be placed in a suggestion box, which could only be opened by a district-level of-
ficer. Each selected police station compiled a list of up to 100 community observers, each of
whom was to visit the police station only once or twice before suggesting a replacement.
7
The objectives of the community observer program were twofold: first, to give a group of
citizens firsthand experience with the police in a positive setting and encourage them to share
their experience with others, and second to provide community oversight in the police station.
The presence of the observer might have encouraged the police to treat complainants with more
sympathy and patience: the hours at which the observer was in the station were publicly posted,
and potential complainants could thus decide to visit the police stations during those times.
(iv) In-Service training program: The training had two modules:
Professional/Investigation Skills: After random selection process, 292 investigation offic-
ers (Inspectors, Sub Inspectors and ASIs) were trained for 6 days at the Rajasthan Police
Academy with inputs on improving investigation procedures, such as field techniques and
documentation, with emphasis on scientific techniques.
Soft skills: 1540 randomly selected police personnel of all ranks were trained for three
days on improving public relations with inputs on ‘soft skills’ such as communication,
mediation, stress management, motivation, team building, leadership, attitudinal change
etc.
The eleven districts included Ajmer, Alwar, Barmer, Chittorgarh, Dholpur, Hanumangarh,
Jaipur City East, Kota City, Nagaur, Pratapgarh, and Udaipur.
Evaluation Strategy
A central component of this project was the randomized choice of police stations in which
the reform interventions was conducted, which made rigorous evaluation possible. Police stations
were randomly assigned to different reform strategies, using stratification to ensure a balanced
sample of the state in terms of size, criminality and population. Error! Reference source not
found. Table 1 describes how the police stations were allocated to each evaluation group. Similar-
ly, staff were randomly selected for the training intervention. To measure the spillover effects of
training, the percentage of staff trained within each police station is randomized at 0%, 25%, 50%
and 100%. This allows us to detect whether the effects of training are different when few or al-
most all the officers are trained.

8
Table 1: Program Design
Group
Number of Police Stations
Program elements
Community observer
Weekly off and
duty rotation
No Transfer
Training
1. All Interventions
35 Yes Yes Yes Between 0 and 100%
of staff
2. Community Observer + No Transfer
25 Yes No Yes Between 0 and 100%
of staff
3. Weekly Off / Duty Rotation + No Transfer 25 No Yes Yes
Between 0 and 100%
of staff
4. No Transfer 40 No No Yes
Between 0 and 100%
of staff
5. Control 25 No No No
Between 0 and 100%
of staff
To address concerns of the Hawthorne effect—the possibility that the police stations par-
ticipating in the program might change their responses or behavior simply because they are being
observed by outside evaluators- an additional group of police stations, the ‘Special controls’ was
also randomly selected. These police stations were not informed of the project, or visited by in-
vestigators, until the final end-line survey, at which point they were surveyed like all other sta-
tions. No staff members from the special control stations were trained. The Hawthorne effect can
be seen in the contrast between the control and special control groups.
Note that wherever the community observer or weekly off/duty roster interventions were
attempted, transfers were also frozen. This was done for two reasons: first, because long tenure of
staff is considered necessary to get acquainted with the area and people of the police station juris-
diction and see if this has any effect on their performance and second, due to concerns about attri-
tion.
Implementation and Monitoring

9
The primary implementation of the reforms was performed through the police hierarchy,
with general supervision done at the level of State Police Headquarters. The District Superinten-
dents of Police supervised the overall implementation in their respective districts, and police sta-
tion chiefs were responsible for carrying out the reforms in their stations. Simultaneously, re-
searchers from J-PAL conducted a series of surveys and interviews to monitor the effectiveness of
the police implementation, including conducting random, unannounced visits to all police sta-
tions to collect an independent opinion regarding the status of implementation.
Surveys
The surveys covered both public as well as police staff (all ranks posted in the police sta-
tion) and were carried out in two stages: baseline and end-line. Respondents for the surveys were
chosen randomly (the public from voter lists, the police from administrative staff lists) in order to
avoid biasing the results by selecting only those favorably or unfavorably disposed towards the
police.
Public Surveys
The public image of the police is both one of the most important outcome of the project
and the most difficult to measure, since impression are subjective and tenuous. These issues,
combined with the fact that extremely few citizens actually interact with the police, necessitated a
household survey that would be both in depth—to capture the various aspects of public percep-
tion—and large enough to detect a small change in opinion. In total 5,895 households were inter-
viewed: 2,451 in the spring of 2007 then the households that could be re-located were re-
interviewed along with 3,443 newly chosen households the autumn of 2008. Within each house-
hold, three modules were administered:
A general crime screener questionnaire administered to the head of the household, inquir-
ing whether any member of the household had been a victim of a crime in the previous
year.
10
A crime victim survey, administered to each individual crime victim in the household.
This survey ascertained greater factual detail about the crime and the victim’s satisfaction
with police actions.
An opinion survey, administered to a randomly chosen adult in the household. The indi-
vidual was asked about his or her contact with the police, and perceptions of police per-
formance and integrity.
The crime-related surveys were broadly based upon the UNICRI’s International Crime and
Victimization Survey (ICVS), customized to the Indian context in order to make their results com-
parable with the crime categories of the Indian Penal Code. Like any crime victimization survey,
these questionnaires do not capture ‚victimless crimes‛ such as gambling or drug use. Also no
attempt is made to measure the incidence of domestic violence because of concerns about the ac-
curacy of reporting and the possibility of decreased respondent cooperation.
Police Surveys
To measure the effects of the interventions on the police performance, a survey was con-
ducted of the police staff. One half of the staff of all ranks (in total 2367) in treatment and control
police stations was randomly selected to be interviewed by surveyors. They were interviewed on
the following aspects:
A. Level of Job Satisfaction
B. Knowledge of police duties
C. Impact of training
D. Complaints with the police system
Case File Reviews of Investigations
Reviews of the case files of investigation were done to ascertain the impact of professional
training on the Investigating Officers (IOs). A total of 982 case files were randomly selected from
the project police stations and sent to a group of retired senior police officers for grading in two
rounds, half before the training and half post training. The retired officers filled out a detailed re-

11
port about each case in which they graded the performance of the officer on both his actions at the
crime scene, whether scientific techniques were used, and the care with which the evidence was
collected and documents in the case file were prepared.
Visit of Decoys
To provide an alternative indicator of police performance, a ‚decoy‛ surveyor program
was developed in which surveyors visited police stations in the treatment and control groups and
attempted to register cases for various types of crimes. These visits were unannounced and the
surveyor did not disclose his identity except in case it seemed that the police would actually regis-
ter the case, or if the situation otherwise required that the surveyor disclose his identity, for in-
stance if the police threatened to prosecute him for filing a false case. Immediately after the visit
to the police station, the surveyor completed a short form recording his success or failure in regis-
tration, the attitudes and actions of the police, and other details such as the total time taken and
the names of the officers with whom he interacted.
Status of Service Delivery: Base line Results
One of the prime objectives of the program was to assess the current status of service deli-
very of the police. This was done with the rigorous quantitative analysis of baseline survey re-
sults:
Public Perception of Police
The following highlights the key results on police perception at the baseline:
(i) Interaction with Police
The most striking aspect of the public opinion data is how few respondents actually have
experience with the police or ever interacted with them. Only 11% of those surveyed have actual-
ly had an interaction with the police in their lives, and only 5% of women have ever spoken with a
police officer. Even in urban areas, only 24% of male respondents ever reported interacting with
the police.
12
In the absence of personal experience, 71% of those surveyed claimed that they had
formed their opinions based on word of mouth conversations with other citizens, with 12% stating
that they based their opinions on television and print news sources.
(ii) Perception of Police Conduct
The opinions of the police conduct were very mixed. On the one hand most citizens felt
that the police was generally cooperative: 71% responded that the police were mostly or always
helpful, and 65% replied that the police were always or mostly courteous. Yet these positive im-
pressions were balanced by negative perceptions of other aspects of police behavior: 53% of res-
pondents thought that the police work less hard than the average citizen, in sharp contrast with
police staff’s self-perception of being overworked. Furthermore, 53% of the respondents stated
that law abiding citizens fear the police, while 44% of the population believed that the police are
always or usually cruel to those in custody.
(iii) Perception regarding Police Resources
While police officers unanimously called for more funding, manpower, and equipment, for
better services, the citizens of Rajasthan do not perceive this shortage of resources: of those inter-
viewed, 61% replied that the police had sufficient personnel, and 68% replied that the police had
sufficient money and other resources.
(iv) Reporting of Crime by citizens
Another striking revelation of the survey is the fact that most crime victims never report
their incidents to the police. Only 29% of the crime victims we surveyed stated that they had vi-
sited a police station to report the crime, and even among those who attempted to report their
crimes, 19% did not succeed in registering a case.
While the biggest reason for not reporting a crime was lack of importance perceived by the
victim (28%), substantial numbers of crime victims did not go to the police because they thought
that the police were incapable of helping (20%) or unwilling to help (17%). Important cases such
as motorcycle theft and assault were registered relatively more frequently (75% and 61%) than

13
theft (12%) and vandalism (17%). It is important to note that the ‚lack of importance‛ may reflect
the perception that the police would not treat the case seriously even if reported (and may refuse
to register it).
(v) Victim Satisfaction
Figure 1 reveals a very lukewarm picture in the baseline data on public satisfaction with
the police work during investigations: 38% of the victims are completely unsatisfied, and 24% are
unsatisfied. Less than a quarter of the victims were either completely satisfied or satisfied .
Figure 1
The reasons for victim dissatisfaction are clear: there is a strong perception among crime
victims that police are not truly interested in helping them or resolving their case. A total of 50%
of victims stated that they were unsatisfied because the police ‚didn’t do anything special‛ or
‚didn’t take interest‛ in their case. In contrast, only 6% complained of police corruption, and
another 6% complained of discourtesy.
These results suggest that the responsiveness of police is the deciding factor of public per-
ception. The probability that the victims expressed satisfaction with the police was 10% higher
when the police simply contacted him or her again after the crime, 23% higher when the police
14
made an arrest, and 51% higher when the police recovered property. Not surprisingly, a demand
for bribes by the police reduced the level of satisfaction by 19%. (All these differences are signifi-
cant at the 97% or higher level.)
Victims of extortion and hurt or grievous hurt were more satisfied with police work, while
victims of eve-teasing and vandalism were less satisfied. Wealthier victims (vehicle owners) were
less likely to be satisfied with police efforts than agricultural laborers, who would tend to occupy
a lower economic class in society. The gender of the victim (16% of crime victims are women)
seems to have no effect on the level of satisfaction.
Police Performance and Morale
Perhaps the most direct means to measure police morale is the simple question, ‚How sa-
tisfied are you with your job as a policeman?‛ However, when we asked this question at the base-
line, an unbelievable 82% of police respondents claimed they could not be more satisfied—a 10
out of 10. Responses at the endline were more varied, with average rating of 7.6 and only 28%
claiming to be completely satisfied.
(i) Police Staff Complaints
There was substantial variation in the issues cited by the police staff as the worst aspects of
their job. When asked by the surveyors to list what they perceived as the worst aspects of their
job, their responses are categorized in the displayed in Figure 2.

15
0 0.2 0.4 0.6 0.8
Long working hours
No day off
Low pay
Poor housing quarters
Unsteady/unpredictable postings
Postings far away from home
No potential for promotion
No reward for hard work
Poor treatment/disrespect from superiors
Poor treatment/disrespect from public
Boring work
Percentage of respondents who mentioned issue
Worst Aspects of Policing
Figure 2: Police Complaints
Many of these issues, for instance problems with low pay; low quality housing or poor
promotional avenues were outside the scope of the police reform project. However the two most
common complaints, long working hours and no day off, were specifically addressed by the
project as were problems related to frequent transfers.
(ii) Use of Scientific aids in Investigation
Use of scientific aid and collection of evidence is crucial to criminal investigations in all
countries. In India it is more important because of two factors: First, plea bargaining is not per-
missible under the law and most cases are decided on the basis of evidence and witness testimo-
ny. Second, during the long period of trial, witnesses often turn hostile and retract their state-
ments, thereby making physical evidence all the more important. However, the use of scientific
evidence is far from universal in criminal investigations in Rajasthan. Only 19% of cases investi-
16
gated in Rajasthan during 2006-2007 made any use of scientific investigation, and most of these
were accident cases.
Results of Decoy Survey
The decoy survey provides a complementary source of data on police treatment of crime
victims. Its main advantage lies in the fact that choice of reporting a crime is influenced by both
the quality of services of the local police and the characteristics of the victim. Crime victims who
choose to report their cases are thus an endogenously selected group, which may bias their re-
ports in multiple ways. The crimes themselves are selected to be ‚important‛ by the victims, as we
saw, which makes it more likely that they will be reported. Furthermore, the recollections of those
victims who did register FIRs may be imperfect, and they may selectively recall certain elements
and not others. Data from the decoy surveyor visits, presented in Error! Reference source not
found., do not suffer from these problems and may thus present a more accurate picture of police
performance.
Figure 3: Decoy Survey Results
Overall, police were willing to register FIRs only 54% of the time from the decoy sur-
veyors. However, this rate was quite variable across types of crimes, with more serious and veri-
fiable cases reported registered significantly more frequently. While the rate at which FIR are in-
17
deed filed is quite low, the decoy surveyors' reports on police attitudes towards them corroborate
the generally positive opinions from the public opinion survey. In 65% of all decoy visits the sur-
veyor’s complaint was immediately addressed by the police staff and less than 5% of the time was
the waiting period greater than 15 minutes.
Surveyors also compared the behavior of police staff to the ‚normally polite‛ attitude they
might expect from the staff in a private bank. They found that 69% of the time the police were po-
lite, and 11% of the time they were ‚extremely polite‛. While 60% of surveyors were addressed as
‚aap‛ the polite Hindi word, in 14% of cases did the police address ‚Shrimanji‛ or ‚Sir?
Impact Evaluation of the interventions
We now turn to a description of the effects of the interventions. The results suggest signifi-
cant effects of the training and the freezing of transfers on the perception of the police by citizens,
and no effects for the other two interventions.
Public Perception of Police
Since the public opinion survey covered a broad range of qualitative indicators, the four-
teen major questions on police performance are aggregated into four broad categories in order to
simplify the interpretation and guard against false positive results:
A. Responsiveness of police to citizens
B. Fear of police
C. Corruption
D. Adequacy of police resources1
1 The questions incorporated into the categories were as follows:
Responsiveness of police to citizens: ‚How do the police behave with normal citizens?‛ ‚Do the police help citizens
when required?‛ ‚How quick is the police response to distress calls by citizens?‛
Fear of police: ‚Do you think that citizens like you are afraid of the police?‛ ‚Are law‐abiding citizens afraid of the
police?‛ and how the population thinks of the police, whether ‚They fear them‛?
Corruption: “Would you say that the police in your area are generally honest or generally corrupt?‛ ‚Is it necessary to
pay the police some money in order to get them do their job?‛ and ‚Do policemen themselves violate the law than the
average citizen?‛
18
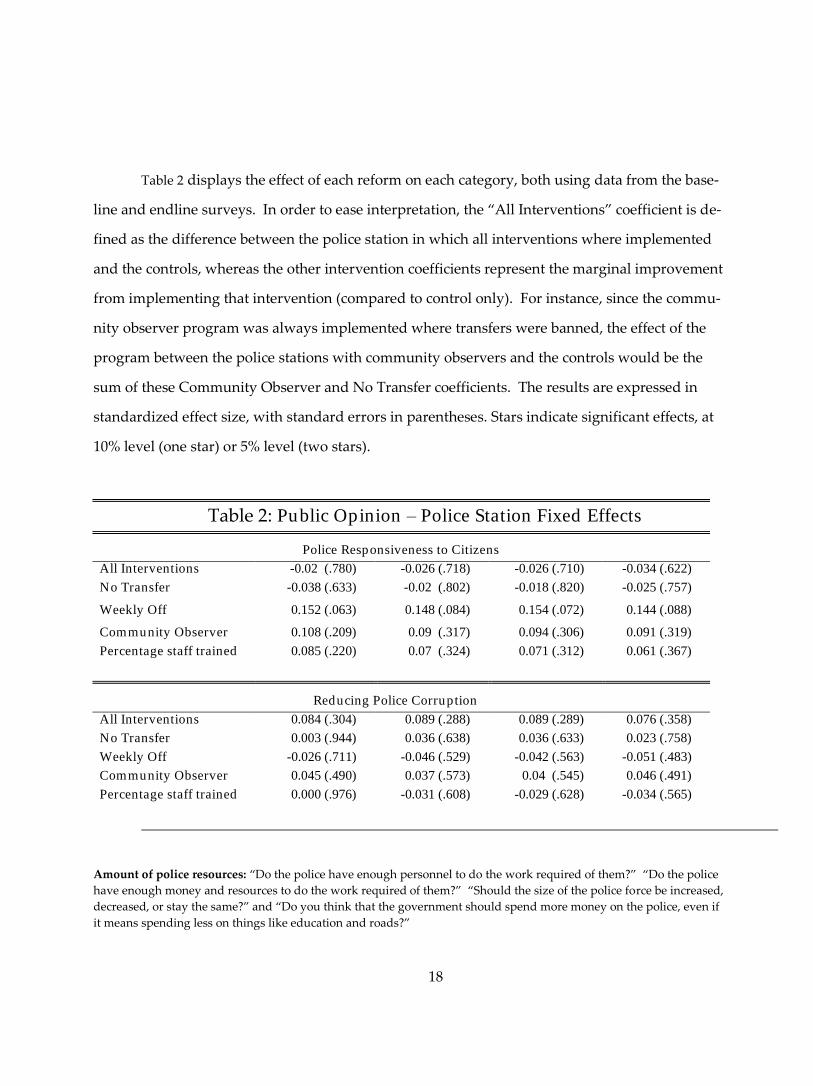
Table 2 displays the effect of each reform on each category, both using data from the base-
line and endline surveys. In order to ease interpretation, the ‚All Interventions‛ coefficient is de-
fined as the difference between the police station in which all interventions where implemented
and the controls, whereas the other intervention coefficients represent the marginal improvement
from implementing that intervention (compared to control only). For instance, since the commu-
nity observer program was always implemented where transfers were banned, the effect of the
program between the police stations with community observers and the controls would be the
sum of these Community Observer and No Transfer coefficients. The results are expressed in
standardized effect size, with standard errors in parentheses. Stars indicate significant effects, at
10% level (one star) or 5% level (two stars).
Table 2: Public Opinion – Police Station Fixed Effects
Police Responsiveness to Citizens
All Interventions -0.02 (.780) -0.026 (.718) -0.026 (.710) -0.034 (.622)
No Transfer -0.038 (.633) -0.02 (.802) -0.018 (.820) -0.025 (.757)
Weekly Off 0.152 (.063) 0.148 (.084) 0.154 (.072) 0.144 (.088)
Community Observer 0.108 (.209) 0.09 (.317) 0.094 (.306) 0.091 (.319)
Percentage staff trained 0.085 (.220) 0.07 (.324) 0.071 (.312) 0.061 (.367)
Reducing Police Corruption
All Interventions 0.084 (.304) 0.089 (.288) 0.089 (.289) 0.076 (.358)
No Transfer 0.003 (.944) 0.036 (.638) 0.036 (.633) 0.023 (.758)
Weekly Off -0.026 (.711) -0.046 (.529) -0.042 (.563) -0.051 (.483)
Community Observer 0.045 (.490) 0.037 (.573) 0.04 (.545) 0.046 (.491)
Percentage staff trained 0.000 (.976) -0.031 (.608) -0.029 (.628) -0.034 (.565)
Amount of police resources: ‚Do the police have enough personnel to do the work required of them?‛ ‚Do the police
have enough money and resources to do the work required of them?‛ ‚Should the size of the police force be increased,
decreased, or stay the same?‛ and ‚Do you think that the government should spend more money on the police, even if
it means spending less on things like education and roads?‛

19
Lack of Fear of Police
All Interventions 0.195 (.071) 0.215* (.048) 0.215* (.046) 0.216* (.045)
No Transfer 0.183 (.063) 0.233* (.020) 0.233* (.020) 0.231* (.020)
Weekly Off -0.187* (.015) -0.205** (.007) -0.204** (.007) -0.202** (.006)
Community Observer 0.000 (.977) -0.021 (.795) -0.021 (.799) -0.022 (.793)
Percentage staff trained -0.059 (.459) -0.073 (.369) -0.072 (.368) -0.073 (.364)
Increase Police Resources
All Interventions 0.010 (.888) -0.026 (.662) -0.028 (.646) -0.021 (.722)
No Transfer -0.039 (.612) -0.045 (.463) -0.046 (.456) -0.035 (.565)
Weekly Off -0.096 (.238) -0.03 (.563) -0.035 (.509) -0.033 (.536)
Community Observer -0.066 (.479) -0.024 (.682) -0.026 (.656) -0.031 (.585)
Percentage staff trained 0.086 (.255) 0.037 (.479) 0.04 (.45) 0.042 (.422)
Controls
Police Station Fixed Effects Yes Yes Yes Yes
HH Characteristics No Yes Yes Yes
HH has been victim of crime or arrested No No Yes Yes
Source of HH inform a-tion about police No No No Yes
Of the 4 categories, the project shows a robustly significant effect at the 95% level only in
the ‚Fear of Police‛ category. Here, where all interventions were implemented together, there was
a significant reduction in the fear of the police. Unpacking the effects of the different interven-
tions, we see that two interventions seem to have had an effect, but going in opposite direction:
First, the freezing of transfers seems to have had a substantial positive effect on increasing public
trust. And second, this effect appears to be undone by the weekly off and duty rotation program
(recall that stations that had the weekly off programs also had the freezing of transfers: so the sta-
tion that had both just these programs were similar to the control station, while stations that had
the transfer frozen, and any of the other program, or the stations that had all the programs, had a
lower fear of police).
The effect of the freeze on transfers might work through a variety of mechanisms. Perhaps
due to less frequent transfers the public became more familiar with the same police staff and
20
hence came to trust them more and fear them less. Alternatively, it is possible that once the police
staff remained in a posting for a longer period of time, their behavior changed with respect to the
inhabitants of that area and they became more approachable and less intimidating to the popula-
tion. Many have written about the importance for the police of knowing their ‚beat‛
A possible explanation for the negative interaction with the weekly off/duty rotation might
be that the duty rotation, by moving staff from post to post within the police station, prevents the
development of public/police familiarity that is the means by which the freeze on transfers reduc-
es fear of police.
Victim Satisfaction with Police
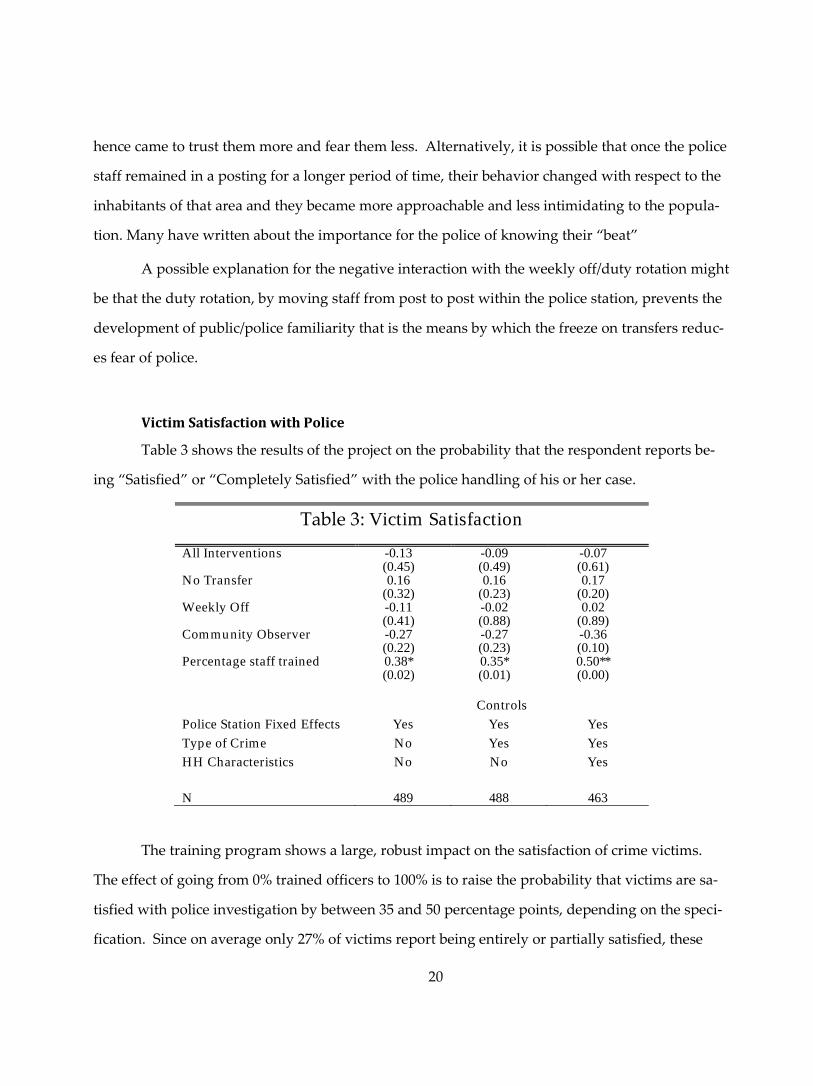
Table 3 shows the results of the project on the probability that the respondent reports be-
ing ‚Satisfied‛ or ‚Completely Satisfied‛ with the police handling of his or her case.
Table 3: Victim Satisfaction
All Interventions -0.13 (0.45)
-0.09 (0.49)
-0.07 (0.61)
No Transfer 0.16 (0.32)
0.16 (0.23)
0.17 (0.20)
Weekly Off -0.11 (0.41)
-0.02 (0.88)
0.02 (0.89)
Community Observer -0.27 (0.22)
-0.27 (0.23)
-0.36 (0.10)
Percentage staff trained 0.38* (0.02)
0.35* (0.01)
0.50** (0.00)
Controls
Police Station Fixed Effects Yes Yes Yes
Type of Crime No Yes Yes
HH Characteristics No No Yes
N 489 488 463
The training program shows a large, robust impact on the satisfaction of crime victims.
The effect of going from 0% trained officers to 100% is to raise the probability that victims are sa-
tisfied with police investigation by between 35 and 50 percentage points, depending on the speci-
fication. Since on average only 27% of victims report being entirely or partially satisfied, these
21
changes represent a more than twofold increase in satisfaction. Consistent with the positive find-
ings from the public opinion survey, the estimate of the effect of freezing of is also large and posi-
tive, although the relatively small sample size implies that it is only marginally significant.
To unpack the effect of the training on victim satisfaction, we investigate the impact of the
training on what the victim reported about police behavior following the complaint. For instance,
the investigation training may have led officers to make more arrests, or to carry out more follow-
up visits to the victims. We find a significant impact of the training program on the probability
that the police make an arrest: going from 0% to 100% training in a police station increases the
probability of making an arrest by 26% (statistically significant at the 5% level). Furthermore,
when we generate an index for whether the victim saw police take any positive action at all after
the crime, including arrest, property recovery, collecting evidence, interviewing witnesses, etc.,
the effect of the training on police action increases to 30% (significant at 3% level), or 22% if we
don’t include arrest as a possible action. Nevertheless, when we do control for these differences,
we continue to find a significant effect of the training on victim satisfaction.
Thus it appears that the training programs had two effects on police performance: First, it
encouraged the police into more active investigation of crimes, and second that it made crime vic-
tims more satisfied with the performance of the police, regardless of whether the police took ac-
tion or were successful in arresting a suspect or recovering property. This is likely to be due to
better treatment of the crime victims by the police.
These regressions assume that the effect of the fraction of police officers who are trained is
linear in the fraction trained, i.e. that when training 50% of officers, the effect is twice as large as
when training 25%. In reality, the effect could have been non-linear: for example, it may be neces-
sary to train everyone to see any effect, or it may be sufficient to train a few agents of change. Our
design allows us to answer this question, since the fraction of officers trained varied from station
to station. Interestingly, we find quite strong evidence that the effect is indeed linear: it seems that
what matters is the fraction of police officers who are trained and that spillovers across trained
officers are not substantial.
22
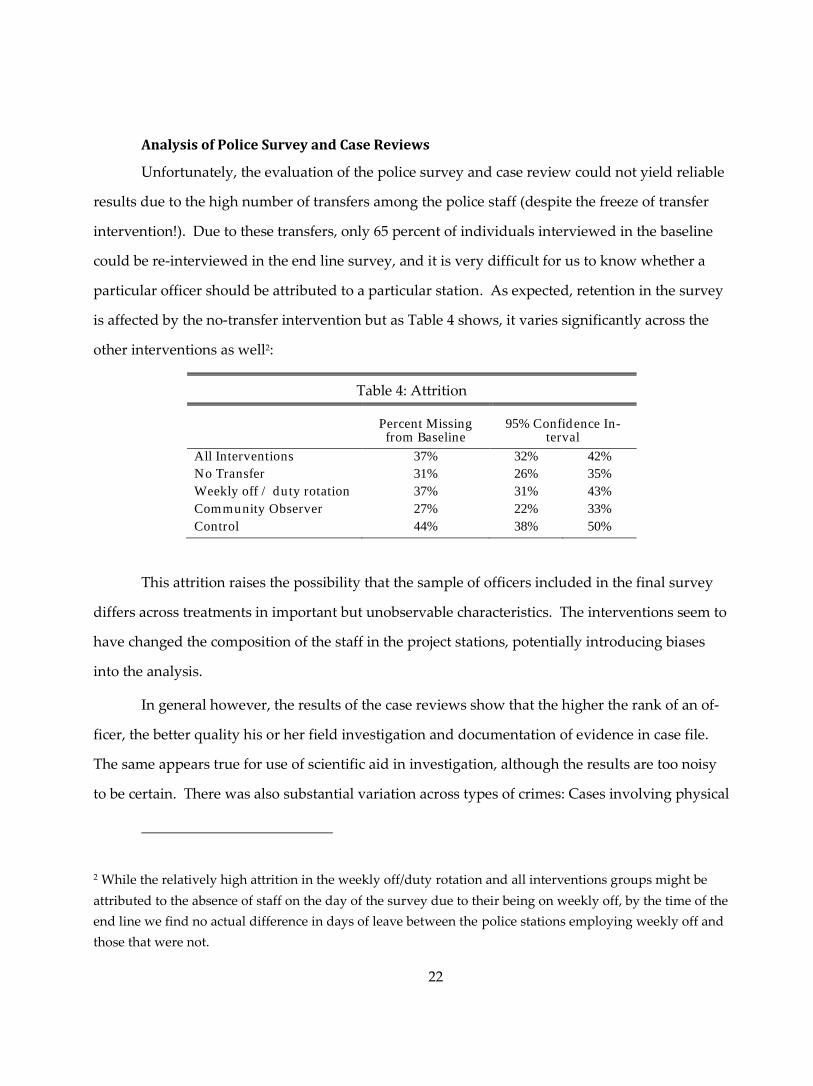
Analysis of Police Survey and Case Reviews
Unfortunately, the evaluation of the police survey and case review could not yield reliable
results due to the high number of transfers among the police staff (despite the freeze of transfer
intervention!). Due to these transfers, only 65 percent of individuals interviewed in the baseline
could be re-interviewed in the end line survey, and it is very difficult for us to know whether a
particular officer should be attributed to a particular station. As expected, retention in the survey
is affected by the no-transfer intervention but as Table 4 shows, it varies significantly across the
other interventions as well2:
Table 4: Attrition
Percent Missing
from Baseline 95% Confidence In-
terval
All Interventions 37% 32% 42%
No Transfer 31% 26% 35%
Weekly off / duty rotation 37% 31% 43%
Community Observer 27% 22% 33%
Control 44% 38% 50%
This attrition raises the possibility that the sample of officers included in the final survey
differs across treatments in important but unobservable characteristics. The interventions seem to
have changed the composition of the staff in the project stations, potentially introducing biases
into the analysis.
In general however, the results of the case reviews show that the higher the rank of an of-
ficer, the better quality his or her field investigation and documentation of evidence in case file.
The same appears true for use of scientific aid in investigation, although the results are too noisy
to be certain. There was also substantial variation across types of crimes: Cases involving physical
2 While the relatively high attrition in the weekly off/duty rotation and all interventions groups might be
attributed to the absence of staff on the day of the survey due to their being on weekly off, by the time of the
end line we find no actual difference in days of leave between the police stations employing weekly off and
those that were not.

23
violence tended to be graded higher: Murder(S 302 IPC), Hurt/Grievous Hurt (S 324/338 IPC),
preparation for committing dacoity (S 399 IPC) and the Arms Act, all scored significantly higher
than other cases on both field investigation and documentation. Scientific investigation was used
more in serious cases, particularly rape (S 376 IPC), and also in cases of tampering with evidence
(S 201 IPC).
Analysis of Decoy Survey
Table 5 shows the effect of the various program components on the probability that the
FIR brought by a decoy surveyor is registered. The first two columns show the effects of the dif-
ferent interventions on the percentage of cases that were registered by the police, and the second
two columns show the impact on whether the police were rated as ‚extremely polite‛ with the
decoy.
Table 5: Decoy Survey Outcomes
FIR Registration Politeness of Police
All Interventions -0.18 (0.38)
-0.16 (0.39)
-0.20 (0.06)
-0.15 (0.29)
No Transfer -0.06 (0.32)
-0.04 (0.37)
-0.04 (0.36)
-0.01 (0.68)
Weekly Off 0.04 (0.46)
0.04 (0.42)
0.03 (0.35)
0.04 (0.20)
Community Observer 0.05 (0.42)
0.05 (0.45)
0.00 (0.92)
-0.01 (0.84)
In Project -0.14 (0.48)
-0.13 (0.46)
-0.15 (0.13)
-0.11 (0.44)
Percentage staff trained 0.00 (0.93)
0.00 (0.98)
0.02 (0.43)
0.02 (0.53)
Number of previous decoy visits to police station
0.06 (0.11)
0.07 (0.06)
0.04 (0.06)
0.03 (0.22)
Time (in months) 0.02 (0.59)
0.02 (0.54)
-0.03* (0.03)
-0.03 (0.14)
Controls Crime story used , whether staff suspected decoy, surveyor name
No Yes No Yes
N 837 834 832 829
24
The decoy program itself appears to have a substantial impact. The decoy surveyors al-
most always informed the police that they were being tested, and this knowledge increases the
probability of FIR registration by an average of 6 or 7 percent per visit. Though the effect of each
extra visit is only marginally significant, there is a significant difference in the probability of FIR
registration in stations that had gotten at least 4 decoys (69.4%), versus those for which it was the
first decoy (44.6%, P=0.000). Similarly, in the columns examining the impact on politeness, no in-
tervention shows any positive effect except for that of the decoy visits themselves, which appear
to increase politeness.
Thus, the decoy survey program had a substantial effect on both FIR registration and be-
havior of the police. This is despite the fact that the program was quite explicitly un-linked to any
possible sanction: the police officers were warned that decoys could take place, but that the results
would not be communicated to their superiors. None of the other interventions were effective.
Given the importance of accurate registration of crimes, this suggests that a policy of allowing
some organizations to conduct decoys may actually be promising.
Need of an independent Crime Survey
The low rate of registration in the decoys, plus the fact that many crime victim do not ac-
tually bother to report the crime, suggests that using crimes registered in police stations as meas-
ure of crime rate is profoundly misleading. Indeed, the analysis of the data of household crime
survey conducted during the course of the program reflects public perception of crime better than
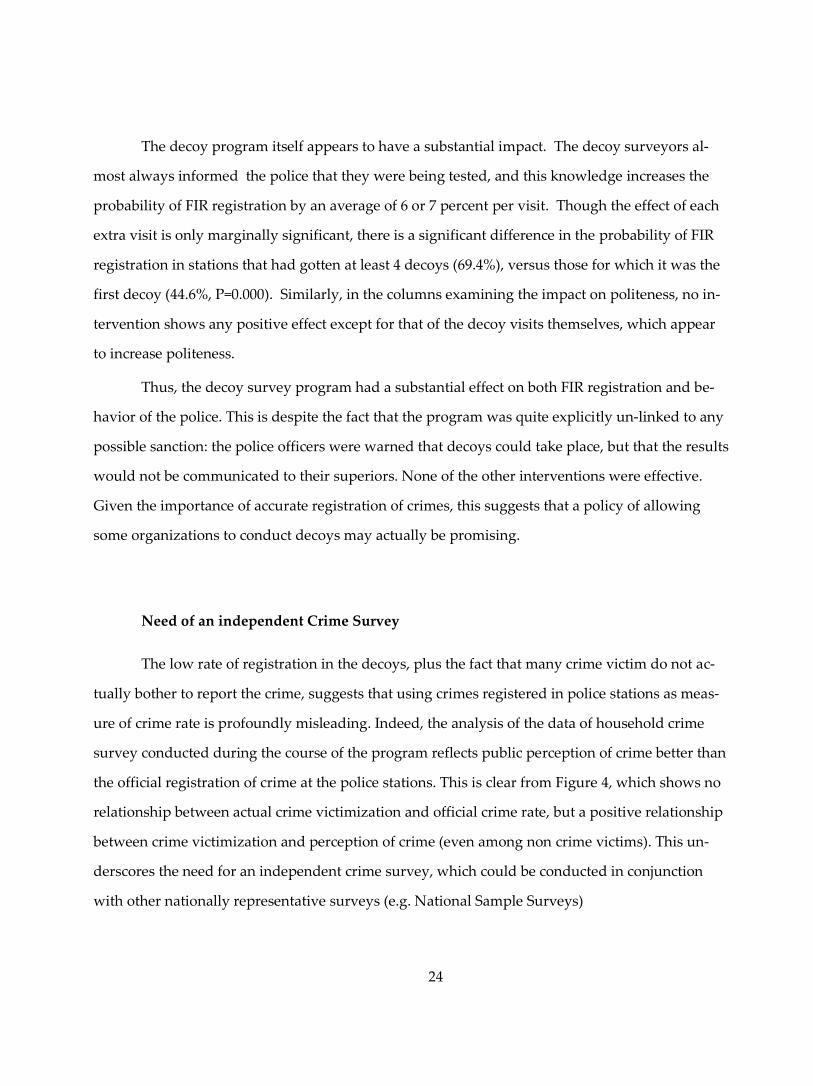
the official registration of crime at the police stations. This is clear from Figure 4, which shows no
relationship between actual crime victimization and official crime rate, but a positive relationship
between crime victimization and perception of crime (even among non crime victims). This un-
derscores the need for an independent crime survey, which could be conducted in conjunction
with other nationally representative surveys (e.g. National Sample Surveys)
25
Challenges in Implementation
The program showed some significant outcomes in the short span of 18 months, yet failed
to generate robust effect on a broad change in either police performance or public perception of
the police. Two of the interventions seemed to have had no effects. Some of the possible reasons
stem from difficulty encountered during the implementation of the project, and are a useful warn-
ings for future programs.
Despite the interest and commitment of senior police leadership of the state, the lack of in-
terest on the part of Station House Officers (chief of police stations) was evident. The reasons may
be manifold: no direct benefit to SHOs from the intervention, lack of manpower and other re-
sources, unforeseen externalities e.g. the violent ethnic agitation in the state, series of terror blasts
in Jaipur, etc. Consequently, we present evidence below that as time passed the police stations did
not sustain these interventions.
Community Observer
A simple and revealing indicator of the implementation of the community observer pro-
gram was whether surveyors encountered a community observer while visiting the police sta-
tions. Each police station in the program designated a specific time during which the observer
-100
0
100
200
300
Cha
ng
e in
re
gis
tratio
n b
etw
ee
n 2
00
6 a
nd 2
007
.2 .4 .6 .8 1Fraction of respondents reporting rise in crime
Perception of Crime vs. Change in Registration
-10
12
Cha
ng
e in
% c
rim
e v
ictim
s in
hou
seh
old
surv
ey
.2 .4 .6 .8 1Fraction of non-victim respondents reporting rise in crime
Perception of Crime vs. Household Survey Results
Figure 4: Registered vs. Survey Crime Reports
26
was available on each day. Ideally surveyors would have met them during their visits. However,
in actuality, observers were present only 10.29% of the time. Moreover, the observers did not
seem to respect the planned time schedule: surveyors met community observers approximately
10% of the time regardless of whether they visited during the official times or not.
A more detailed record of the presence of community observers can be found in logbooks
of observer visits and comments maintained by each police station. These reports varied widely:
certain districts appeared to maintain the community observer program at full strength through-
out the project while others seem to have given up entirely by the last 3 months. However, these
logbook reports need to be taken with a grain of salts: surveyors found that 74% of the visitor log-
books were always or often in the same handwriting, and in 40% of the time the comments
seemed to have been written by the police themselves.
Overall, it appears that the community observer interventions was not implemented in a
sustained and complete way.
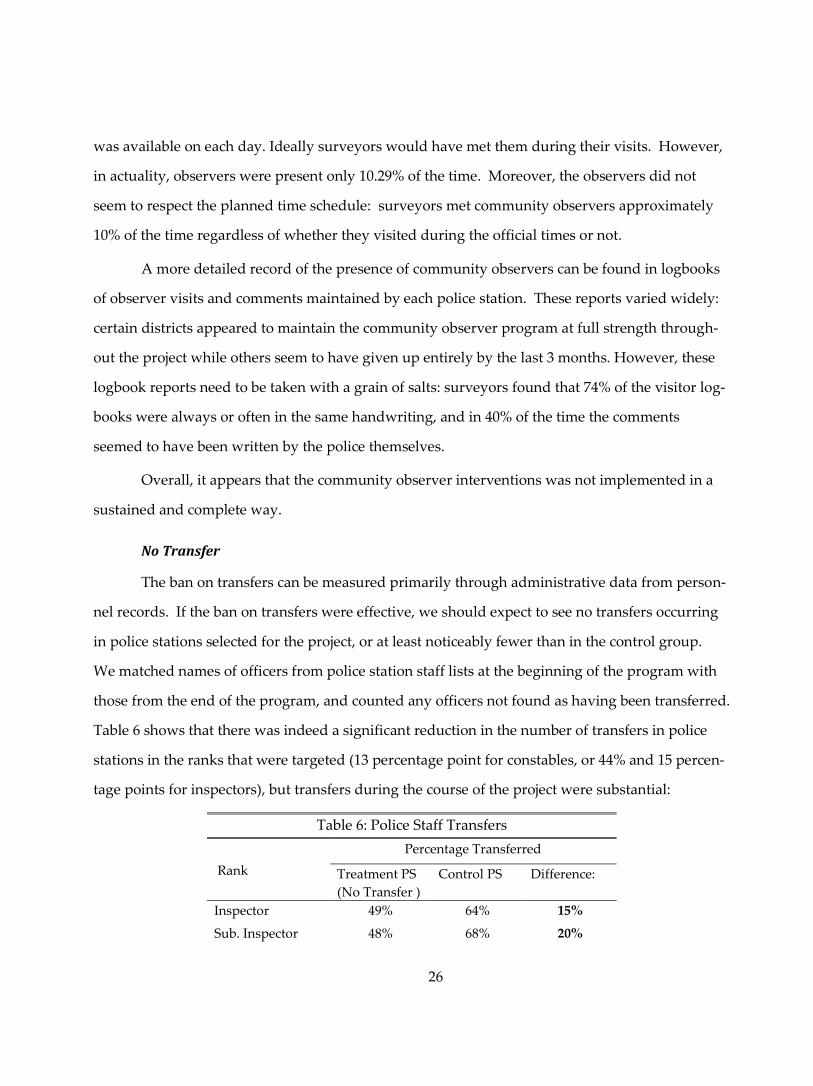
No Transfer
The ban on transfers can be measured primarily through administrative data from person-
nel records. If the ban on transfers were effective, we should expect to see no transfers occurring
in police stations selected for the project, or at least noticeably fewer than in the control group.
We matched names of officers from police station staff lists at the beginning of the program with
those from the end of the program, and counted any officers not found as having been transferred.
Table 6 shows that there was indeed a significant reduction in the number of transfers in police
stations in the ranks that were targeted (13 percentage point for constables, or 44% and 15 percen-
tage points for inspectors), but transfers during the course of the project were substantial:
Table 6: Police Staff Transfers
Rank
Percentage Transferred
Treatment PS
(No Transfer )
Control PS Difference:
Inspector 49% 64% 15%
Sub. Inspector 48% 68% 20%

27
Asst. Sub. Insp. 28% 30% 2%
Head Constable 28% 34% 6%
Constable 17% 30% 13%
All Ranks 21% 33% 12%
The ban on transfers, while somewhat effective for certain ranks, was substantially less
than a complete freeze. For the more politically sensitive ranks, Inspectors and Sub-Inspectors,
the project made the greatest difference and came furthest from achieving its goal. Yet, we have
seen that even this relatively small reduction in transfers produced significant increase in citizens’
satisfaction. This is encouraging, and suggest that a stronger commitment to the no-transfer policy
could produce even larger improvement.
Weekly off
On paper the implementation of the weekly off program was much better than the other
interventions: 84% of treatment police stations reported executing some type of rotating day off,
whereas only 34% of control police stations reported having any scheduled day off. In keeping
with program implementation guidelines that allowed a longer rotation period for smaller police
stations, the regular day off was not always weekly: 60% of police stations in the project has rota-
tion terms longer than 8 days. In fact, the size of the police station mattered little for the rotation
period of the weekly off: police stations with 15 or less staff had an average period of 13.8 days,
whereas larger police stations had a period of 11.7 days.
In order to verify that the police station chief was in fact giving days off to his staff, sur-
veyors randomly selected two constables from the staff and interviewed them separately. Sur-
veyors asked the constables to recall the last time that they had had a day off for any reason, in-
cluding both the weekly off program and any other days off. The results, presented in Table 7,
show that the weekly off program did succeed in shortening the time since the last day off by an
average of 4.87 days, going from an overall average of 30.03 days in control stations to 25.16 days
in treatment stations. However, this difference seems to decrease over the course of the program,
eventually disappearing by round 5, our last visit:

28
Table 7: Weekly Off Implementation
Police Station type: Round 1 Round 2 Round 3 Round 4 Round 5
Panel A: Days since last off:
No weekly off 29 32 28 31 30
Weekly off 21 22 25 26 32
Difference: 8 11 3 5 -2
Panel B: Percentage of staff who had a day off in last 8 days:
No weekly off 25% 22% 22% 23% 23%
Weekly off 46% 31% 36% 29% 27%
Difference: 21% 9% 14% 6% 4%
Since the program was designed to give a day off every 8 days, we can inspect this out-
come directly in Panel B. Once again, the project seems to have been operating in the original
rounds, albeit not at full implementation or as well as the police records would suggest. Over
time implementation decreased until, at the end of the program period, there is no statistically de-
tectable difference between treatment and control.
Duty Roster
Since the duty roster was implemented in the same police stations as the weekly off, the
results might be expected to be similar. Here too, implementation on paper was close to complete,
with 91% of SHOs of treatment police stations able to produce a duty roster when asked. Howev-
er, only 58% of program police stations posted the duty roster on the wall as stipulated by the im-
plementation guidelines, as opposed to 39% of control police stations that had independently
created duty rosters.
When surveyors asked constables about the duty rotation, these major differences between
treatment and control police stations almost disappeared. Table 8 shows the responses over time
to questions about the rapidity of changing duties and the amount of knowledge constables have
of their future duties:
Table 8 : Implementation of Duty Roster:
Police Station type: Round 1 Round 2 Round 3 Round 4 Round 5
Panel A: Number of days constable has been doing current duty:
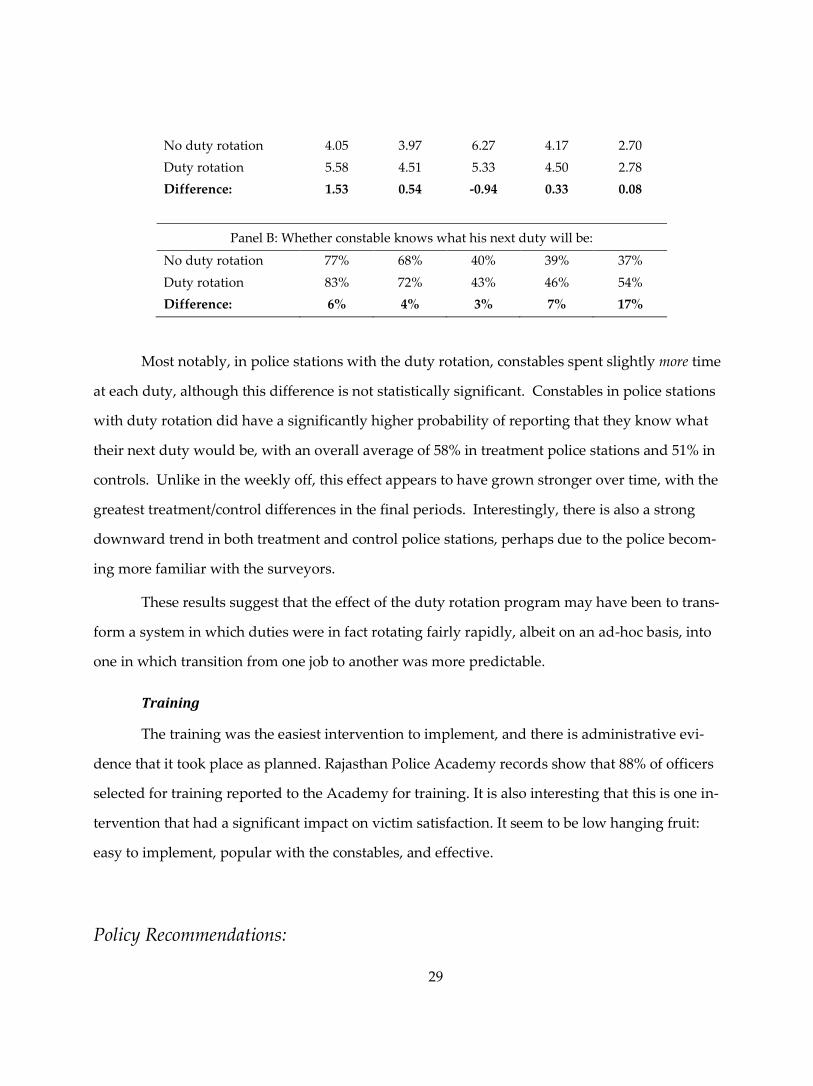
29
No duty rotation 4.05 3.97 6.27 4.17 2.70
Duty rotation 5.58 4.51 5.33 4.50 2.78
Difference: 1.53 0.54 -0.94 0.33 0.08
Panel B: Whether constable knows what his next duty will be:
No duty rotation 77% 68% 40% 39% 37%
Duty rotation 83% 72% 43% 46% 54%
Difference: 6% 4% 3% 7% 17%
Most notably, in police stations with the duty rotation, constables spent slightly more time
at each duty, although this difference is not statistically significant. Constables in police stations
with duty rotation did have a significantly higher probability of reporting that they know what
their next duty would be, with an overall average of 58% in treatment police stations and 51% in
controls. Unlike in the weekly off, this effect appears to have grown stronger over time, with the
greatest treatment/control differences in the final periods. Interestingly, there is also a strong
downward trend in both treatment and control police stations, perhaps due to the police becom-
ing more familiar with the surveyors.
These results suggest that the effect of the duty rotation program may have been to trans-
form a system in which duties were in fact rotating fairly rapidly, albeit on an ad-hoc basis, into
one in which transition from one job to another was more predictable.
Training
The training was the easiest intervention to implement, and there is administrative evi-
dence that it took place as planned. Rajasthan Police Academy records show that 88% of officers
selected for training reported to the Academy for training. It is also interesting that this is one in-
tervention that had a significant impact on victim satisfaction. It seem to be low hanging fruit:
easy to implement, popular with the constables, and effective.
Policy Recommendations:

30
The fundamental conclusions of the Rajasthan Police Reform Program fall into two major
categories: First, several of the interventions demonstrate that it is possible to affect the public im-
age of the police in a relatively short period of time, using an affordable and simple set of inter-
ventions. Decoy visits were effective in getting the police to register more crimes. Reducing trans-
fers decreased citizens’ fear of the police and increased the satisfaction of crime victims. Training
police staff in investigation techniques and public relations skill (soft skills) also increased the sa-
tisfaction of crime victims. Furthermore, it appears to have a real impact on the actions of the in-
vestigating officers, causing them to arrest more suspects and take more actions subsequent to the
registration of an FIR (at least according to the victim’s perception). These results suggest that the
police system is not completely resistant to change, and that public opinion can be affected in the
short term—that practical police reform is possible.
Second, the lack of effectiveness of the program on other dimensions carries lessons for the
design and implementation of future government sector reform projects. At some level the cause
of failure cannot be identified—we cannot see whether the programs that showed little impact
would have been successful had they been implemented more rigorously or whether they were
flawed in conception. As already discussed, this program was conceived to be executed within the
framework of existing condition of police, incentives for the implementation of reforms was not
incorporated into the design. Therefore, while the senior police leadership consistently supported
the reforms and gave orders for their implementation, police station staff gradually ceased to car-
ry out the program elements, perhaps even going so far as to falsify the community observer
records. Since the long term, system-wide benefits perceived by the police leadership were not
internalized by the police station SHOs, who only experience the short term costs, the reform
project gradually ceased to function over 18 months. This did not affect the training, which was
easy to monitor and implement, or the decoy programs, which was run by an outside organiza-
tion committed to the program. But this was a key limitation for the community observer program
and for the weekly off. Future interventions should either not need to rely on the continuing col-
laboration of the SHO, or make sure it is in their interest to carry them out.

31
Overall, on the basis of evidence generated by the program in Rajasthan, the following pol-
icy recommendations are suggested to improve the police performance and public perception:
1. National Crime Victimization Survey: The police reform project of Rajasthan strongly
recommends a national crime survey conducted periodically by an independent agency. This will
help in identifying problem areas in terms of incidence and nature of crime as well as eliminate
perverse incentives for FIR non-registration. The household survey of this program provides a
template for how this can be done.
2. Freezing of Transfers: Increasing transfer time appears to have significant impact on ef-
fectiveness, public relations, as well as decreasing staff grievances. Although this is often pre-
sented as a politically difficult reform, this project has shown that it is both feasible and beneficial
and as such is recommended as a permanent goal.
3. Training: The training of police officers and staff showed positive effects on public satis-
faction and affected actions taken during crime investigations. These interventions are
straightforward to scale up and should be extended to the remaining Rajasthan Police staff. 3
More research is needed on how the weekly day off can be implemented in a more sus-
tained way, and whether this would result in improvement in performance (the results are not
encouraging so far). The community observer interventions, as designed, does not seem effective
as a way to provide accountability to the public. However, the large impact of the decoy visits
suggest that an interventions that would provide regular feedback to the public on whether the
police serve their basic need (registering a complaint) could do a lot to change their behavior. This
3 Encouraged by the results of these trainings, the Bureau of Police Research and Devel-
opment (BPRD), Government of India granted special sanction to the Rajasthan Police to expand
these trainings to the rest of the staff.
32
intervention would need to be designed and tested before any more recommendation can be
made, however.
On the whole, the Rajasthan Police Reform Program has shown that simple and cost effec-
tive interventions at cutting edge level can improve police performance in terms of effectiveness
and efficiency. It has further reaffirmed that improving the efficiency of police has the potential to
create positive public image, so very essential in contemporary policing. Police has to overcome
its stubborn and traditional attitudes and beliefs by creating a positive synergy among stakehold-
ers.

33
BIBLIOGRAPHY
Alvazzi del Frate, Anna, Zvekic, Ugljesa, Dijk, Jan J.M. van (editors)(1993) ʹUnderstanding
Crime, Experiences of Crime and Crime Control, Acts of the International Conferenceʹ. Rome,
18‐20 November 1992. UN publication No.49.
Bertrand , Djankov, Hanna, Mullainatha ‚Does Corruption Produce Unsafe Drivers‛ MI-
MEO, Harvard, 2006
Bruce, D., and Neild, R., 2005, ʺThe Police that we want: A handbook for oversight of po-
lice in South Africaʺ, Center for the study of Violence and Reconciliation, Johannesburg
Call, Charles, 2003, ʺChallenges in Police Reform: Promoting Effectiveness and Accounta-
bilityʺ, International Peace Academy Policy Report
Capari, M., and Marenin, O., 2005, ʺCrime, Insecurity and Police Reform in Post‐Socialist
CEEʺ, The Journal of Power Institutions in Post‐Soviet Societies, Issue 2, 2005
Chodosh, Hiram E., 2003, ʺMediating Mediation in Indiaʺ, paper presented at International
Conference on ADR and Case Management, May 3‐4, 2004, New Delhi
Commonwealth Human Rights Initiative (CHRI), 2005, Police Accountability: Too Impor-
tant to Neglect, Too Urgent to Delay, CHRI, New Delhi
Devrajan, M.K., 2006, ʺPolice‐Public relations in Rajasthanʺ, dissertation submitted for
M.Phil in Sociology at Rajasthan University, Jaipur, Rajasthan.
Drèze, J., and Sen, A.(2002), India: Development and Participation, (Oxford: Oxford Press)
Government of India, 1979, Report of National Police Commission, Volumes 1‐8.
International Association of Chiefs of Police, 1999, ʺPolice Leadership in the 21st Century:
Achieving and Sustaining Executive Successʺ, Recommendations from the Presidentʹs first leader-
ship council, May 1999
Levitt, Steven, 1998, ‚The Relationship Between Crime Reporting and Police: Implications
for the Use of Uniform Crime Reports‛, Journal of Quantitative Criminology Vol. 13, No. 1,
34
Rao, M. Jagannadha, 2003, ʺWould Conciliation and Mediation succeed in our courts?ʺ pa-
per presented at International Conference on ADR and Case Management, May 3‐4, 2004, New
Delhi
Sidhu, H. S., 2004, ʺManagement of Reforms in Police – A Study at District Levelʺ disserta-
tion submitted for M. Phil in Police Administration at Guru Nanak Dev University, Amritsar,
Punjab
Transparency International (TI) India, 2005, ʺ India Corruption Study 2005; Volume 9: Corrup-
tion in the Police Departmentʺ , implemented by Center for Media Studies, New Delhi.
www.cmsindia.org/cms/events/policedepartment.pdf
Verma, Arvind, 2003, ʺ Rescuing the Police Forceʺ , India Together, December 2003,
http://indiatogether.org/2003/dec/opi‐police.htm
Verma, Arvind, 2004, ʺ A Uniform Betrayalʺ , India Together, June 2004,
http://indiatogether.org/2004/jun/gov‐betray.htm
Verma, Arvind, 2004, ʺ Reporting the Crimeʺ , India Together, January 2004,
http://indiatogether.org/2004/jan/gov‐policefir.htm
Verma, Arvind, 2005 The Indian Police: A Critical Evaluation Regency Publications, New
Delhi
Verma, Arvind, 2006, ʺ To serve and Protectʺ , India Together, January 2006,
http://indiatogether.org/2006/jan/gov‐policeact.htm
Wade, Robert, 1985, ʺ The Market for Public Office: Why the Indian State is Not Better at De-
velopment,ʺ World Development 13, 4