make money trading - traders' librarys_make_money_trading/... · foreword by toni turner ix...
TRANSCRIPT


Make Money Trading How to Build a Winning Trading Business
Jean Folger & Lee Leibfarth
Marketplace Books Columbia, Maryland
Copyright © 2007 Jean Folger and Lee Leibfarth
Published by Marketplace Books, Inc.
All rights reserved.
Reproduction or translation of any part of this work beyond that permitted by section 107 or 108 of the 1976 United States Copyright Act without the permission of the copy-right owner is unlawful. Requests for permission or further information should be ad-dressed to the Permissions Department at Marketplace Books, 9002 Red Branch Road, Columbia, MD 21045, (410) 964-0026, fax (410) 964-0027.
This publication is designed to provide accurate and authoritative information in re-gard to the subject matter covered. While best efforts were utilized in the preparation of this book, neither the publisher nor the author make representations or warranties with respect to the accuracy or completeness of the contents of this book and specifically disclaim any implied warranties of merchantability or fitness for a particular purpose. This book is sold with the understanding that neither the publisher nor the author is engaged in rendering legal, accounting, or other professional service. If legal advice or other expert assistance is required, the services of a competent professional should be sought. Neither the publisher nor author shall be liable for any loss of profit or any other commercial damages, including but not limited to special, incidental, consequential, or other damage.
This book, along with other books, is available at discounts that make it realistic to pro-vide them as gifts to your customers, clients, and staff. For more information on these long lasting, cost effective premiums, please call us at (800) 272-2855 or you may email us at [email protected].
Library of Congress Cataloging-in-Publication DataFolger, Jean. Making money trading : how to build a winning trading business / Jean Folger and Lee Leibfarth. p. cm. ISBN-13: 978-1-59280-308-8 ISBN-10: 1-59280-308-3 1. Portfolio management. 2. Investment analysis. 3. Speculation. I. Leibfarth, Lee. II. Title. HG4529.5.F65 2007332.6068’1--dc22 2007031154
ISBN: 1-59280-308-3
ISBN 13: 978-1-59280-308-8
Printed in the United States of America.
1 2 3 4 5 6 7 8 9 0

This book is dedicated to my parents, Ralph and
Carol, for their enduring support.
L.L.
To my parents, Tom and Linda, for their
encouragement; and to my daughter Evy who
is a constant source of inspiration.
J.F.


Table Of Contents
Foreword by Toni Turner ix
Introduction: What it Means to be an Independent Trader xv
Chapter 1: The Fundamental Concepts of Trading 1
Trading vs. Investing 2Styles of Trading 5
Understanding Risk 8Positive Expectancy 14
Optimal Risk 18
Chapter 2: The Business of Trading 23
Protecting Capital 27Getting an Education 31
Researching the Business 37
Building a Strategic Plan 42

Chapter 3: Getting to Know the Market 47
The Stock Market 48The Futures Market 60The Forex Markets 67
Chapter 4: The Tools of the Trade 73
Technology as a Tool 73Setting up a Trading Desk 77
Purchasing/Leasing Trading Software 81Choosing a Broker 87
Setting up a Trading Account 91
Chapter 5: Charting the Market 97
Chart Types 98Support and Resistance 106
Technical Indicators 120Data Indicators 134
Chart Setups for Trading 138
Chapter 6: Placing Trades 145
Trade Dynamics 145Order Types 151
Trade Examples 161Trade Automation 167

Chapter 7: Developing a Trading Plan 175
The Importance of Using a Trading Plan 175Asset Allocation and Position Sizing 180
Trade Entries 188Trade Exits 190
Strategy Types 195
Chapter 8: Evaluating and Comparing Trading Plans 209
Defining Important Performance Metrics 212
Risk Measurements 218
Slippage and Commission 224
Optimizing and Over-Optimization (Curve Fitting) 225
Using In-Sample and Out-of-Sample Historical Data 227
Forward Performance Testing (Paper Trading) 230
Chapter 9: Live Trading 233
Preparation 234
Staying Mentally Focused 241
Using a Trading Journal 244
Trade Automation 247
Trusting your Trading Plan 248

Chapter 10: Evaluating Live Performance 251
Reviewing Trading Journals 252Number Crunching 254
The Real Equity Curve 256When to Abandon a Trading Plan 262
Chapter 11: Record Keeping 265
Staying Organized 266Creating a Trading Binder 268
Taxes for Traders 270
Chapter 12: Top 10 Rules of Successful Trading 273
Appendix A: Sample Trading Plan 281
Appendix B: EasyLanguage Code for Sample
Indicators and Strategies 287
Appendix C: 299Trader Worksheets
Glossary 305
Index 323

What makes a book worth reading? As a writer myself, I look for com-
pelling, timely, and well-organized material presented in a reader-friendly
style. As a trader and student of the financial markets, I look for valuable
information that will make my journey in this arena a richer and more
profitable experience.
To my delight, I’ve found that Make Money-Trading: How to Build a
Winning Trading Business, has fulfilled my demands and expectations. Jean
Folger and Lee Leibfarth have written an excellent and enjoyable book that
offers a significant ROI (return on investment) in exchange for the time
spent absorbing its high-quality content.
When I first started trading back in the mid-1990s, it was a free-for-all!
The stock market exploded into a riotous bull market that hadn’t been
ForewordBy Toni Turner

x Make Money Trading
seen before. The budding Internet spewed forth stock information, and
discount brokerages popped onto the landscape, offering low-priced com-
missions. From housewives to grandmas, from taxi drivers to CEOs, from
auto mechanics to heart surgeons—everyone who could grab a few thou-
sand dollars and open an online trading account became a “day trader.”
Most of us who jumped headlong into the markets spent all our time
looking for the next “hot stock.” Risk-management was an unknown (un-
wanted?) term back then, as were any of the accompanying terms such as
“risk-reward analysis,” and “asset allocation.”
And, although many of us spent huge blocks of time of time immers-
ing ourselves in the markets, studying charts and executing trades, few of
us took the time to treat our pastime as a real business. We just wanted to
make big bucks.
Oh, the losses that could have been averted, and the profits that could
have been generated, if traders could have read the common-sense con-
cepts set forth in Folger and Leibfarth’s pages back then!
Nonetheless, we are fortunate to have this book accessible to us now,
and its pages are chock full of advice and strategic planning that when ap-
propriately applied, can contribute to our success as traders and investors.
The subhead for this book, How to Build a Winning Trading Business,
says it all. The content fulfills its promise by giving you a step-by-step plan
for creating a trading career that can develops into a successful and profit-
able business.
This is not a “how to get rich by this Friday morning, early” book.
In fact—and rightly so—the writers acknowledge that building an income-
generating business through trading in the financial market can appear
“daunting” (although attainable).
I heartily agree with their no-nonsense approach to this subject. Trad-
ing can be a difficult business, and the market takes no prisoners. The

Foreword by Toni Turner xi
rewards, however, can be satisfying and are based on the willingness of the
trader to educate him or herself, apply unwavering discipline, and use the
best technology available.
Folger and Liebfarth also say that as with any worthwhile undertaking,
those who want to develop a successful trading business need to realize that
it demands a commitment of time: time for studying the markets, for study-
ing the nature of risk, for implementing a business plan, for learning the
tools of the trade, for developing a viable trading plan, for executing trades
efficiently, and so forth. In other words, “learn before you burn.” Amen.
Once the authors move through overall considerations and require-
ments, they approach trading as a business by first exploring its most
formidable and perennially present enemy: risk.
The statement is sobering, but an entirely truthful one—as traders we
will always be exposed to risk and we will always experience losses. It’s the
nature of the game.
Anyone who cannot stomach watching their account shrink in value
may want to take up another occupation. To the degree that risk is under-
stood, however, and to the extent that a disciplined trading plan is imple-
mented, an account that’s experienced a reasonable drawdown should
easily bounce back to profitability.
To the authors’ credit, they do not leave the subject of evaluating
risk behind in the book’s early chapters. They thread references to risk
throughout the remainder of the text and apply it each aspect of trading.
Make Money Trading establishes another ongoing theme: that capital
preservation should remain first and foremost in every trader’s and inves-
tor’s mind.
I often tell my students to ask themselves before entering each trade:
Am I protecting my capital? If for any reason the answer is no, (think: lack
of, or avoidance of, a protective stop, chasing a stock, overtrading, greed-

xii Make Money Trading
driven share size), then the trader should remove his hand from his mouse
and be grateful that what might have been a costly “joyride” was aborted.
When delving into more details of trading as a business, Folger and
Leibfarth offer a wonderful analogy that brings our view of trading capi-
tal to a grassroots level: our trading capital is our inventory. Of course,
if we protect our inventory from harm, and I would add—make sure our
insurance policies (protective stop orders) are in good standing—then our
inventory will grow over time and our business will flourish.
Make Money Trading moves forward in a logical and well-organized
progression, from establishing overall trading business goals and defin-
ing objectives, to an evaluation process that includes historical modeling,
forward performance testing, and live market testing. The trader’s research
and work in these areas, using the guidelines described in the book’s chap-
ters, should culminate in a fully developed trading plan. Of course, the
plan’s success will be put to the ultimate test in a live trading scenario that
finalizes in a profit/loss statement.
Again, this book is all about the business of trading. It is up to the
reader to explore and expand his or her knowledge of certain components
of the process, such as candlestick trading technology, chart indicators
and oscillators, volume signals and the interpretations of price patterns.
The challenge of coming to the end of a really good book is where to
start—how to put all the great ideas in the pages into action. Even though
I’ve been a trader and investor for more than sixteen years, I continue to
learn from others. I will go back through this book’s pages and revisit all
the highlighted sentences and sections that drew my attention. Then I’ll
plan new strategies based on those ideas.
Was this book worth reading? Absolutely! Compelling, timely, well-or-
ganized and reader-friendly? For sure! I am confident that whether you’re
a trader or investor—novice or more experienced market veteran—Make

Foreword by Toni Turner xiii
Money Trading will act as a valuable tool to help you develop your trading
career into a successful—and winning—business!
Toni TurnerPresident, ToniTurner.com
AuthorA Beginner’s Guide to Day Trading Online A Beginner’s Guide to Short-Term Trading
Short-Term Trading in the New Stock Market


IntroductionWhat it Means to be an Independent Trader
Every weekday morning at 9:30 sharp (Eastern Standard Time) the US
financial markets come alive. While many of these markets have already
been trading for hours on electronic and foreign exchanges, this is the
time when market liquidity and volatility are at their peak. This is when
the professional money managers and institutional traders who work at
the exchanges get down to business. As independent traders, we do not see
this action from the busy exchange floor, but from our computer moni-
tors. We are screen based, independent traders.
Trading for a living has obvious appeal: working from home, being
your own boss, and great profit potential. Many traders who make it over
the hump —from struggling greenhorn to profitable business owner—find
a great deal more than the obvious appealing. To some, the challenge

xvi Make Money Trading
of trading turns out to be one of the most appealing aspects of
the business.
You are working typically by yourself, for yourself, against a lot of
people doing the same thing. With such great autonomy comes great
responsibility. You are responsible for everything that happens in your
business, from deciding which markets to trade to actually pulling the
trigger, and beyond. You have to plan well if you expect to make steady
profits from trading.
Being a successful trader requires two steps: approaching trading as
a business, and maximizing the available technology to your benefit. If
you do these two things, you will greatly increase your chances of making
it through another year of trading, and, eventually, becoming a self-suf-
ficient, profitable trader.
Approaching trading as a business is integral to success because trad-
ing is a business. You wouldn’t expect to become a pro golfer by reading
a couple golfing magazines, and you shouldn’t expect to become a good
trader just because you read a few books or watched an infomercial on late-
night television. A successful trading business requires a strategic plan that
encompasses your actual business, and that includes your actual trading.
Your business plan includes things like short- and long-term goals, the
amount of capital you will make available for the business, and what com-
puter setup you will need. Your trading plan includes things like what instru-
ments you will trade and how you will effectively trade them. Your trading
plan needs to be absolutely specific and objective. Your plan should be so
well laid out and comprehensive that you could hand it over to someone
else and they could make a reasonable attempt at trading the plan.
In addition, it is important to understand that a good trading plan
isn’t just a set of rules that you think will work in trading, or a list of
setups that you are fond of, or someone else’s plan. A good trading plan

What it Means to be an Independent Trader xvii
has been researched, tested on historical data, tested in live markets, and
evaluated at regular intervals—all by you.
You should expect to devote a significant amount of time to devel-
oping a viable trading plan. Most people don’t have the requisite skills
handy; they must be learned. Time will have to be dedicated to learning
and understanding the market(s) that you wish to trade. You’ll need to
read about, apply and watch in a live market, different market indicators to
discover which ones are most suited to your trading style and personality.
You’ll need to research technology, and find out how you can best use it to
your advantage. You’ll have to study the different methods of placing or-
ders in the market, and practice placing orders so that it becomes second
nature. You’ll have to learn how to effectively backtest a trading strategy
so that you can discover the potential merits (or lack thereof) of a system.
You’ll need to learn to accurately evaluate and compare trading plans so
that you’ll end up trading the best one. You’ll have to know what to do,
ahead of time, if you are in the middle of a trade and you lose your Inter-
net connection. You’ll need to know how to stay organized so that you are
prepared for tax time. These are just a few of the things that you will have
to learn in order to develop a profitable trading plan, and business.
All of this may sound daunting, but it is realistic. And it is certainly
attainable. All of the technology available to today’s traders greatly reduces
the amount of time is takes to develop a profitable trading system—just
imagine (not that many years ago) charting the market by hand. The key
is to plan well, and to utilize and maximize technology to meet the goals
of your business.


Make Money Trading How to Build a Winning Trading Business


Chapter 1The Fundamental Concepts of Trading
An advertisement that ran in financial magazines posed the question,
“A yacht or a surfboard, which will your investing get you?” While
the intent of the ad is clear, my first inclination has always been to surf
out on the waves rather than ride as a passenger on the yacht. This is not a
reflection on my preference for adventure sports, but a metaphor for how
active traders should view their place in the markets.
Let me explain; owning a large yacht requires a hefty bank account,
with the owner and its passengers relying on the skill of the crew to safely
navigate the waters. In most cases, this boat takes a significant amount
of time to change course and must avoid shallow reefs, bad weather, and
rough seas. This is comparable to handing an account to a money manager
and sitting back as they take you on a ride. In some cases, a navigational

2 Make Money Trading
error could cause serious damage to the expensive boat, much to the dis-
tress of the helpless owner.
The surfer on the other hand, thrives in the conditions that the yacht
typically avoids. In sharp contrast to the yacht, anyone can own a surf-
board; the challenge is becoming proficient at using it. The surfer must
rely on his or her own skill, strength, and precision to navigate the rough
waters and receives personal reward from the experience of “catching a
great wave.” Much like active trading, the surfer’s passion and intensity
will dictate the level of his or her ultimate success. While a yacht owner
sits back and allows the crew to make navigational decisions, the surfer is
responsible for his or her own performance. For those of us who have in
interest in taking a more active role in managing our money…grab your
board, the surf ’s up!
Trading vs. InvestingFor most of us, our first experience in the markets is through invest-
ing. The goal of investing, often referred to as buy-and-hold investing, is to
build wealth over extended periods of time. This is typically accomplished
through the buying and holding of a stock, or a basket of stocks, and al-
lowing the price to fluctuate over time. After a period of years or decades,
the investment will, in most cases, increase in value. These long-term prof-
its may be further enhanced through compounding, or reinvesting the
profits and dividends in additional shares of stock.
Trading involves the more frequent buying and selling of stocks or
commodities with the goal of generating returns that outperform buy-
and-hold investing. Trading profits are typically generated through buying
at a low price and profiting from the subsequent sale at a higher price,

The Fundamental Concepts of Trading 3
all within a relatively short period of time. Figure 1.1 shows two price
charts that compare the potential of trading versus buy-and-hold investing
over the same time period. Notice that as the market fluctuates, the buy-
and-hold investment may show significant losses (or drawdowns), such as
the time period between 2000 and 2003. Conversely, a good trader will
not only exit the market during these drawdown periods, but may take
an opposing short position (described in Chapter 6—Placing Trades) that
will allow profits from the descending price movement. It can be noted
that any one of the nine individual trades shown on the bottom chart
outperformed the buy-and-hold investment for the same time period. A
FIGURE 1.1
compares the results of buy-and-hold investing to the potential of 9 individual trades for the same time period.

4 Make Money Trading
standard measure of the effectiveness of an investment or trading system is
a comparison to the Standard and Poor’s 500 Index, commonly referred to
as the S&P. Effective trading plans are expected to consistently outperform
the buy-and-hold performance of the S&P; performance is commonly ex-
pressed as a percentage gain or loss.
It is important to understand that trading is not investing. Trading
and investing are two completely different animals. Successful traders have
very defined, short-term profit goals and, as a result, must have a much
more disciplined approach to the market. For some investors, a 10% an-
nual return on their capital is deemed very acceptable, while a good trader
may seek to gain a 10% return per month. In order to accomplish this,
it is imperative that traders maintain tight control over potential losses
by limiting their exposure to the market. Even if the market turns and
goes against them, traders should not be in the market long enough to be
significantly affected. In general, trading requires much greater precision
than investing.
Trading also requires a different set of tools than investing. While
investors can wait out less profitable positions, traders make profits (or
take losses) within a shorter, predetermined amount of time. Traders fo-
cus mostly on the technical aspects of the markets, such as volume and
relative price action, while investors tend to be more concerned with the
fundamentals of the market, such as a company’s profitability and earn-
ings outlook. Trading requires close attention to the markets as well as a
high degree of discipline and training. Trading is a business that requires
an effective strategic plan.

The Fundamental Concepts of Trading 5
Styles of TradingDetermining a trading style is the first step in building a trading plan.
Trading style simply refers to the time frame or holding period in which
stocks, commodities, or other trading instruments are bought and sold.
Trading may take place over a wide variety of time frames, ranging from
many years to just a few seconds. Trading styles are commonly broken
down into four categories: position trading, swing trading, day trading, and
scalping. Figure 1.2 compares these different trading styles. A trader must
choose his or her trading style based on factors that include:
• Leveloftradingexperience
• Timethatcanbededicatedtotrading
• Risktolerance
• Amountofcapitalizationoraccountsize
• Personality
Trading Style Time Frame Holding Period
Position Trading Long term Months to years
Swing Trading Short term Days to weeks
Day Trading Short term Day only—no overnight positions
Scalp Trading Extreme short term Seconds to minutes— no overnight positions
Trading styles may be defined by the holding period or timeframe in which positions are opened and closed.
FIGURE 1.2

6 Make Money Trading
Position trading refers to a relaxed style of trading in which trades
are taken over a period of months to years. This style of trading attempts
to identify technical trends in markets where large price movements are
likely to occur. Position traders anticipate big price fluctuations or price
breakouts over a relatively long time horizon. While position trading is
a long-term type of trading most comparable to investing, all others are
considered short-term methods.
Swing trading is the general category that defines the majority of active
traders. This trading style involves taking trades (or positions) that last a few
days or weeks, where a profit objective is often defined before the trade is
entered. Swing traders will close a trade either after the profit objective is
met, after a set amount of time, or if the trade is not moving in the intended
direction. Although this style of trading involves greater precision than posi-
tion trading, it does not necessarily require constant, minute-by-minute at-
tention to the markets. Traders who do not have the ability to monitor their
trades all day long often choose this type of trading.
Day trading refers to a style of trading in which all positions are closed
by the end of the day. Unlike position or swing traders, day traders do not
hold any trades overnight. In short, day traders attempt to profit from in-
traday price fluctuations and minimize risk through limiting their market
exposure. Day traders often trade in relatively high volume, requiring them
to borrow from their brokers (known as margin and explained in Chapter
4—The Tools of the Trade). Day trading requires actively monitoring the
markets and managing trades throughout the day. While many longer-term
traders consider this style of trading risky, responsible day trading can be
a lucrative form of trading.
Scalp trading is an extremely active form of day trading that involves
frequent buying and selling throughout the day. Scalpers typically trade
in very large volume, and this requires a high level of market intuition and

The Fundamental Concepts of Trading 7
accuracy in placing trades. Scalp trades target the smallest intraday price
movements and take place within seconds or minutes. Due to the level
of precision that is required for this style of trading, it offers the greatest
amount of risk and requires constant attention to the markets.
Generally speaking, as the holding period of a trading style decreases,
the level of necessary precision and market awareness increase. The mar-
kets can be thought of as fractals since price fluctuations occur in all
This chart compares top-performing commercially available trading systems for different time frames.
—source: Attain Capital Management—
FIGURE 1.3
Trading Style
System Name
Percent Winning Trades
2006 Annual Return
Initial Capital
Required (000’s)
AnnualReturn
on $60,000 Account*
Position Trading NDX Shadrach 53 127.5% $50 $63,750.00
Position Trading Trend Shark 53 90.1% $50 $45,050.00
Position Trading NDX Apednego 59 35.2% $50 $17,600.00
Swing Trading SeasonalST ERL 53.8 44.4% $20 $66,600.00
Swing Trading TZAR ES 61 40.1% $30 $40,100.00
Swing Trading MESA Notes 64.2 24.3% $30 $24,300.00
Day Trading Bounce EMD 57 48.5% $10 $145,500.00
Day Trading Bounce ERL 67.6 43.9% $10 $131,700.00
Day Trading Impetus eRL 58.3 12.4% $10 $37,200.00
* Adjusted to apply the maximum amount of initial captial

8 Make Money Trading
timeframes anywhere from monthly intervals to one-minute intervals. Fig-
ure 1.3 compares the annual trading performance of several commercially
available trading systems and serves as a reference for the potential of
different trading styles. Although the price movement of individual trades
tends to be greater over longer timeframes, the greater frequency of trades
in short-term trading creates plenty of profit potential.
In order for any style of trading to be successful, traders must find
markets that offer the potential to make a reasonable profit. The two
key elements that allow for successful trading are liquidity and volatility.
Liquidity refers to the ability to easily enter and exit trades, while volatil-
ity refers to the amount of price fluctuation. As you can imagine, if you
want to buy a stock but no one is willing to sell it, trading is not possible.
Likewise, if you buy a stock and the price does not change, it will be
difficult to make a profit. The trading instruments that we look for typi-
cally trade in high volume and make significant price swings. While many
equate these markets with higher risk, these are simply the conditions that
are needed for successful trading. Risk will be minimized in these markets
using other tactics. Additionally, many modern traders prefer instruments
that trade on all-electronic markets. This helps ensure that trades are ex-
ecuted quickly and efficiently since the trading is done via computers, and
not on an actual exchange-trading floor.
Understanding RiskRisk has many different meanings; in the context of trading, risk refers
to the probability of losing money or trading capital. Risk is what trading
is all about, or, more specifically, accurately managing risk. As a trader, you
should be well aware of the risks involved in trading: you can lose all of

The Fundamental Concepts of Trading 9
the money in your trading account and even wind up owing more. It can
happen, and it has happened to many unfortunate traders.
Before considering trading as a part-time or full-time business, you
should make sure that you have the financial means to support yourself
during the learning process and to adequately fund your trading account.
It is extremely important that the money used for trading capital is money
that you can afford to lose. Before proceeding along the path of trading,
you should review the U.S. Securities and Exchange Commission’s (the
SEC’s) risk disclosure statement and be aware of the rules and regulations
involved in trading.
Throughout this book we will explore the different aspects involved
with developing and trading a successful trading plan. By far, the most
important element in this equation is accurately assessing the risk involved
in any given trading method or system. The first step in evaluating risk
is to understand exactly how much you could potentially lose, given the
worst-case scenario. Traders should know exactly how much capital they
are willing to risk on each individual trade long before pushing the “buy”
button. This amount of trade risk can be expressed in risk units, or R. In
addition, traders must also decide how much money they are willing to
lose, known as maximum drawdown, before it becomes time to reevaluate
a trading plan. Your loss potential should never be left to chance.
The best defense against complete disaster is education and planning.
As a trader, it is your primary job to learn and understand as much as pos-
sible about the markets you are trading and how to control your potential
losses. You must develop a careful plan that limits loss to an acceptable
level if you ever hope to become profitable. Risk will always be there, and
successful traders are constantly evaluating that risk by not just asking
the question, “What can I win?” but first and foremost, “How much can
I lose?”

10 Make Money Trading
Most of us tend be optimists. We spend more time thinking about
good things than bad. In general, this is a pleasant trait, but in the trading
context it can be dangerous. It is a lot of fun to think about the money that
we can make trading, imagining ourselves on the deck of our boat, buying
our second house, or driving a fancy new sports car. We are thinking about
winning. As we will soon learn, trading is not just about winning.
Trading is mostly about losing. Not just losing, but learning from our
losses, controlling our losses, and accepting our losses as a part of trad-
ing. Traders do not need to win more frequently than they lose to make
money. In fact, many profitable trading systems only win about 40% of
the time. The key is to make more money on each winning trade than you
spend on losing trades (known as a +R advantage), as this allows traders to
make money over time.
To understand risk, it is helpful to objectively measure this factor in
order to establish and compare the elements of a trading plan. One of the
most valuable measures of risk involves the concept of probability. In trad-
ing, we are never absolutely sure about the direction of the markets and
we must rely on probability to help us understand the chances of making
a correct decision. Probability can be expressed either as a decimal from
0.00 to 1.00, or as a percentage from 0% to 100%. A probability of 1.00 or
100% means an event will always occur, while a probability of 0.00 means
the event will never happen. Keep in mind that when we analyze risk, we
begin by looking at the probability of losing, and not just the probability
of winning.
Let’s examine some principles of measuring risk using the simple ex-
ample of a repeated coin toss. If a gambler were to challenge you to bet
$100 on a coin toss where you could double your money with a win,
should you? In other words, a fair coin toss would determine if you won
$100 by landing on heads or you owed $100 by landing on tails. This type

The Fundamental Concepts of Trading 11
of system does not provide us with any type of +R advantage and yields
a high, 50% probability of losing our initial $100 bet. Many of us would
choose wisely and not take this challenge.
Probability of Loss = Number of Negative Outcomes (Tails) /
Total Number of Possible Out-comes = 1 / (1+1) = .50 or 50%
Now, the gambler changes the rules and offers you the ability to
double your bet on the coin toss. This time, a heads will earn $200, with
a tails still costing your initial $100. Mathematically, we now have a +R
advantage and know that over time we could generate a profit. We look in
our wallet and see two, crisp $100 bills. The question becomes, “Can we
afford to play long enough to make a profit?”
Another concept that we must consider is that although we may have
favorable rules, or a +R advantage, we must also be prepared to weather
a string of consecutive losses (tails). The 50% probability of the coin toss
would suggest that over a long period of time (100s or 1,000s of coin
tosses) we should have a statistically similar amount of heads and tails,
and thus see a significant profit. If we were to begin with several losses,
however, we would not stay in the game long enough to show any profit
since we would run out of money, ending up with a loss. This danger is
referred to as being undercapitalized. Even with the 2-to-1 +R advantage,
throwing seven tails during the first ten games will generate a loss. While
this seems highly unlikely, let’s take a closer look….
When tossing a coin ten times, there are 1,024 different possible out-
comes for the heads-and-tails sequences. While there are only 120 out-
comes with exactly seven tails, we must also consider the 45 outcomes

12 Make Money Trading
with eight tails, ten outcomes with nine tails and one outcome where all
ten throws are tails. In total, there are 176 possible outcomes for at least
seven tails. This gives us a 17% probability, or roughly a one in five chance,
that we will lose our money within the first ten throws.
Probability of Loss (7 Tails in 10 Throws) = 176 / 1024 = 17%
The question still remains, how much money do we need to have in
order to responsibly take the gambler’s coin tossing challenge? To answer
this, we will use an important concept in both trading and gambling
known as the probability of ruin. Probability of ruin allows us to measure
the relationship between how much a trader is willing to risk versus the
probability of losing everything. Losing everything is exactly what traders
need to avoid. Understanding probability of ruin allows traders to make
smarter decisions about bet or position sizing.
Probability of Ruin (for a Coin Toss) = 1 / ((1 + ERA) ^ N)
ERA = Expectancy per Risk Units (.5 for Coin Toss Example)
N = Units of Initial Capital (Initial Capital / Initial Amount Risked)
Figure 1.4 shows a graph of the coin toss example that relates the
amount of the bet (as a percentage of the overall account size) to the prob-
ability of ruin. Notice that as the bet size becomes larger, the probability
of ruin increases substantially. From our example, we have $200 of initial
capital in our wallet and we must bet $100, or 50%. From the chart, we
see that this relationship would give us a 44% probability of losing our

The Fundamental Concepts of Trading 13
entire $200 stake. This is not that much better than the 50% probability
of the coin toss in the first example. While most players would find this
to be too much risk, we now have tools that can help us stack the odds in
our favor.
One way to use this information to our benefit is to first determine an
acceptable probability of ruin and then decide how much capital is needed.
For example, choosing a conservative 10% bet provides us with a much
more comforting 2% probability of ruin; now the odds would be truly in
our favor. While it would require $1,000 of initial capital to safely bet at this
level, there is a 98% chance that we would become profitable because we
FIGURE 1.4
Risk of ruin for a coin toss where you can win twice as much as you risk on every throw.
14 Make Money Trading
are given a 2-to-1 +R advantage. Armed with this knowledge, I would run
to the closest ATM, withdraw an additional $800 and continue to bet 10%
of my capital as long as the coin-tossing gambler offered the game!
While trading is not exactly a game, the same rules apply. In fact,
many of the formulas presented in this book are commonly used by mod-
ern portfolio managers and have been derived from gambling and gaming
statistics. The bottom line is, before taking a trade, we should know exactly
how much we are willing to risk. Understanding risk allows us to make de-
cisions that will help us develop safer and more profitable trading plans.
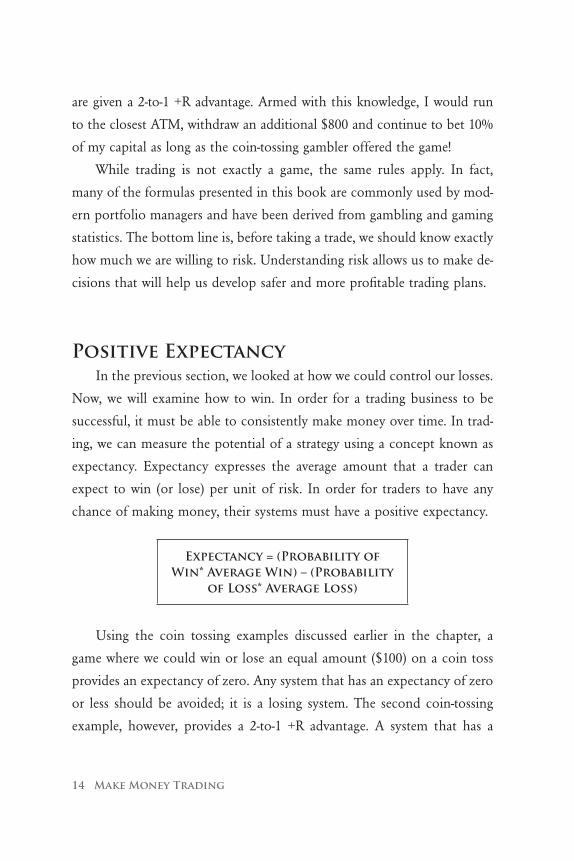
Positive ExpectancyIn the previous section, we looked at how we could control our losses.
Now, we will examine how to win. In order for a trading business to be
successful, it must be able to consistently make money over time. In trad-
ing, we can measure the potential of a strategy using a concept known as
expectancy. Expectancy expresses the average amount that a trader can
expect to win (or lose) per unit of risk. In order for traders to have any
chance of making money, their systems must have a positive expectancy.
Expectancy = (Probability of Win* Average Win) – (Probability
of Loss* Average Loss)
Using the coin tossing examples discussed earlier in the chapter, a
game where we could win or lose an equal amount ($100) on a coin toss
provides an expectancy of zero. Any system that has an expectancy of zero
or less should be avoided; it is a losing system. The second coin-tossing
example, however, provides a 2-to-1 +R advantage. A system that has a

The Fundamental Concepts of Trading 15
50% probability of winning, an average win of $200 and an average loss
of $100 would have an expectancy of $50. This is a moneymaking system
and what is meant by positive expectancy.
Expectancy = (.5 * $200) – (.5 * $100) = $50
Knowing this type of statistical information about a system allows us
to make projections, such as how much profit is possible from the sym-
metric outcome (equal number of heads/tails) of 20 throws. This becomes
a simple calculation of multiplying the expectancy by the number of
games. Given the rules of this particular game, one could expect to make
around $1,000 in 20 games.
Establishing positive expectancy in trading relies on two related com-
ponents: probability of winning and R advantage. Both of these factors are
critically important when developing and choosing a strategy on which
to build a trading plan. In fact, these two factors provide another meth-
od of expressing expectancy, called risk-adjusted expectancy or ERA. In
other words, expressing expectancy per unit of risk, instead of as a dollar
amount, is often useful in comparing different systems. Multiplying ERA
by the average dollar amount of risk (average loss) brings us back to the
dollar value in which expectancy was originally defined.
ERA = (Probability of Win * R Advantage) – (1 – Probability of Win)
ERA (for Coin Toss Example) = (.5 * 2) – (1 – .5) = .5R or .5
Probability of winning is the inverse of the probability of loss that we
discussed in the previous section. While it seems that our goal should be
to develop a trading plan that provides the greatest probability of winning

16 Make Money Trading
possible, the reality is that this statistic depends mostly on trading method-
ology. A bigger probability of winning is not always better, or necessary. This
is illustrated in the coin-tossing example where even a 50% winning system
can provide excellent profit opportunity, if we have the right rules. It is most
important to have a consistent and reliable probability of winning.
Probability of Winning = Number of Winning Trades / Total Number of Trades
R advantage relates the amount of the expected return to the risk
taken during an individual trade. Values greater than one are said to have a
+R advantage since the amount of the return is a positive multiple of the
amount of risk units taken (R).
R Advantage = Expected Return / Amount Being Risked {Values Greater than 1: +R
Advantage} {Values Less than or Equal to 1: -R Advantage}
As we have seen in the coin tossing examples above, having a +R
advantage can be an essential factor in developing a profitable system.
Developing trading rules that establish a +R advantage on every trade will
help to build positive expectancy. It is important, however, to take the
probability of winning into account as well. For example, planning a trade
with a +R advantage of 4.5 sounds great (risking $100 to make $450), in
theory. However, if the trades win less than 20% of the time, you will have
a losing system. Figure 1.5 shows a table illustrating the profit/loss rela-
tionship between the probability of winning and R advantage. This table
is calculated using the per dollar expectancy for 10 trades.

The Fundamental Concepts of Trading 17
RVa
lue
10%
20%
30%
40%
50%
60%
70%
80%
90%
100%
-2($
1,10
0.00
)($
1,20
0.00
)($
1,30
0.00
)($
1,40
0.00
)($
1,50
0.00
)($
1,60
0.00
)($
1,70
0.00
)($
1,80
0.00
)($
1,90
0.00
)($
2,00
0.00
)
-1.5
($1,
050.
00)
($1,
100.
00)
($1,
150.
00)
($1,
200.
00)
($1,
250.
00)
($1,
300.
00)
($1,
350.
00)
($1,
400.
00)
($1,
450.
00)
($1,
500.
00)
-1($
1,00
0.00
)($
1,00
0.00
)($
1,00
0.00
)($
1,00
0.00
)($
1,00
0.00
)($
1,00
0.00
)($
1,00
0.00
)($
1,00
0.00
)($
1,00
0.00
)($
1,00
0.00
)
-0.5
($95
0.00
)($
900.
00)
($85
0.00
)($
800.
00)
($75
0.00
)($
700.
00)
($65
0.00
)($
600.
00)
($55
0.00
)($
500.
00)
0($
900.
00)
($80
0.00
)($
700.
00)
($60
0.00
)($
500.
00)
($40
0.00
)($
300.
00)
($20
0.00
)($
100.
00)
$0.0
0
0.5
($85
0.00
)($
700.
00)
($55
0.00
)($
400.
00)
($25
0.00
)($
100.
00)
$50.
00
$200
.00
$350
.00
$500
.00
1($
800.
00)
($60
0.00
)($
400.
00)
($20
0.00
)$0
.00
$200
.00
$400
.00
$600
.00
$800
.00
$1,0
00.0
0
1.5
($75
0.00
)($
500.
00)
($25
0.00
)$0
.00
$250
.00
$500
.00
$750
.00
$1,0
00.0
0 $1
,250
.00
$1,5
00.0
0
2($
700.
00)
($40
0.00
)($
100.
00)
$200
.00
$500
.00
$800
.00
$1,1
00.0
0 $1
,400
.00
$1,7
00.0
0 $2
,000
.00
2.5
($65
0.00
)($
300.
00)
$50.
00
$400
.00
$750
.00
$1,1
00.0
0 $1
,450
.00
$1,8
00.0
0 $2
,150
.00
$2,5
00.0
0
3($
600.
00)
($20
0.00
)$2
00.0
0 $6
00.0
0 $1
,000
.00
$1,4
00.0
0 $1
,800
.00
$2,2
00.0
0 $2
,600
.00
$3,0
00.0
0
3.5
($55
0.00
)($
100.
00)
$350
.00
$800
.00
$1,2
50.0
0 $1
,700
.00
$2,1
50.0
0 $2
,600
.00
$3,0
50.0
0 $3
,500
.00
4($
500.
00)
$0.0
0 $5
00.0
0 $1
,000
.00
$1,5
00.0
0 $2
,000
.00
$2,5
00.0
0 $3
,000
.00
$3,5
00.0
0 $4
,000
.00
4.5
($45
0.00
)$1
00.0
0 $6
50.0
0 $1
,200
.00
$1,7
50.0
0 $2
,300
.00
$2,8
50.0
0 $3
,400
.00
$3,9
50.0
0 $4
,500
.00
5($
400.
00)
$200
.00
$800
.00
$1,4
00.0
0 $2
,000
.00
$2,6
00.0
0 $3
,200
.00
$3,8
00.0
0 $4
,400
.00
$5,0
00.0
0
co
mpa
res
th
e r
elat
ion
ship
bet
wee
n t
he
pro
babi
lity
of
win
nin
g a
nd
th
e R
ad
van
tag
e ba
sed
on
per
do
llar
exp
ecta
nc
y o
f 10
tr
ades
an
d $
100
of
ris
k.
FIG
UR
E 1.
5

18 Make Money Trading
When planning individual trades, traders should aim for a +R advan-
tage as high as possible while maintaining a reasonable percentage of prof-
itable trades. In addition, external factors in trading such as slippage and
commissions (discussed in Chapter 8 –Evaluating and Comparing Trading
Plans) will close the gap between your risk and return levels, and must be
considered. Most successful trading plans achieve a 40%-60% probability
of winning. Using this as a guideline, +R advantage ratios need to be 1.5
or greater. In general, traders should look for a consistent, mid-level prob-
ability of winning with a high +R advantage.
It can be noted that scalp traders often employ a high-risk day trad-
ing tactic that is opposite to most other styles of trading. Scalpers rely
on a high probability of winning trades (70% – 80%) and a very low R
advantage, often risking more than they make on any individual trade. In
order to make this style of trading profitable, scalpers must trade in large
volume, thus increasing their overall risk. While having such high winning
percentages may seem very appealing to newer traders, only very experi-
enced traders should attempt this style of scalp trading since it requires
absolute precision. Even a small mistake can result in significant losses. For
new traders attempting this style of trading, it can be like crossing a busy
interstate while blindfolded.
Optimal RiskWhenever we trade, there is no guarantee that we will make money.
Each individual trade is somewhat of a gamble that may result in a loss,
causing us to deplete our capital. We are constantly trying to strike a bal-
ance between the amount of risk we take versus what we stand to gain.

The Fundamental Concepts of Trading 19
In some cases, we may think of not only trading in terms of risk,
but everyday life as well. Most of us make choices each day that are the
outcome of risk to reward analysis. Should I drive all the way across town
to hear a short concert? Should I risk not being prepared for work on
Monday to take a relaxing weekend trip? Should I chance gaining weight
to indulge in a delicious chocolate cake? The point is that by practicing
thinking in terms of what you are risking versus what you stand to gain, it
will help you make clearer trading decisions and will be a key indicator for
determining your individual trading style.
A basic financial principle is the more risk you take, the greater the
potential for profit. Taking this principle to the extreme, however, has
been the downfall of many traders. Our primary goal in this business is
to protect our capital, and too much risk can create disastrous results.
Conversely, not taking enough risk will keep us from trading at a level
that will generate significant profits. Developing a profitable trading plan
requires us to become responsible risk takers and to establish reasonable
tolerances for risk.
This brings us back to the coin-tossing game where we can win twice
as much as we risk for each throw (+R advantage of 2). For this round,
however, the gambler allows us to bet whatever amount we would like,
but limits our play to 10 coin throws. Additionally, we are limited to only
betting with the $200 that is currently in our wallet. How much of the
$200 should we bet?
From the previous sections we know two things: (1) the game has
the ability to generate profits (positive expectancy), and (2) if we bet too
much of the overall account size, we will go bankrupt (risk of ruin). This
game has now become a much better simulation for the position sizing
decisions that we are faced with in actual trading. Before we determine
how much to bet, we must first decide how to bet. While it may seem

20 Make Money Trading
easiest to select a set amount of money to bet and continue betting that
amount, known as constant position sizing, this will not maximize our
statistical +R advantage. Instead, betting a consistent percentage of our
capital, referred to as fixed-percentage betting, will allow us to scale our
trading to the conditions. In other words, as our profits grow, so does the
amount that we will be betting. This allows us to risk more as we make
more, and vice-versa.
Figure 1.6 shows two graphs representing the probable outcomes of 10
coin tosses using the above rules. The curve represents the fixed-percent-
age relationship between bet size and profit, while the rectangular block
in the background shows the initial capital of $200 as a reference. As we
can see, the risk and profit relationship does not follow a straight line, as
many may think. In other words, more risk does not necessarily equate to
greater profits, as this only occurs when bet sizes are between 0 and 25%.
In fact, if we bet more than 50% in our coin tossing system, we begin to
lose money, and drop below our initial $200.
From the curve, we can see the maximum profit is $360 and occurs
at a bet size of 25%, this is known as the level of optimal risk (sometimes
referred to as optimal f—a term and concept made popular by the work
of Ralph Vince). Risking slightly more or less than 25% creates a sharp
decline in the amount of profit for the system. From this information, we
can deduce that in order to maximize our profits, we should risk $50 on
our initial coin toss and continue to risk 25% as our capital grows.
Optimal Risk = ERA / R Advantage Optimal Risk (Coin Toss Example) = .5 / 2 = 25%
Earlier in the chapter we introduced the concept of risk of ruin, and
we can now analyze this coin tossing system by referring back to Figure 1.4.

The Fundamental Concepts of Trading 21
If we compare the optimal risk percentage of 25%, we see that this system
would have a 20% probability of ruin. While this level of risk will statisti-
cally optimize the profit potential of this system, the one-in-five chance of
losing our entire $200 stake may be too high for many. Remember, just
because a system has a 50% chance of winning does not guarantee that a
consecutive string of losing coin tosses will not occur. Most would elect to
bet less than 25% and find a point that would yield good profits with less
probability of ruin. Knowing this information about a system allows us to
build an effective trading plan around our individual risk tolerances.
FIGURE 1.6
Figure 1.6 shows the optimal risk level for the coin tossing game.

22 Make Money Trading
Throughout this chapter, the importance of understanding risk was
discussed as an inescapable part of the trading business. For our examples,
we have used an ideal model of a coin toss. In real trading, however, nei-
ther the probability of winning nor the +R advantages of a system is fixed,
and we must adjust our formulas to account for this. We will explore the
specific trading application of probability of ruin, optimal risk, and other
important metrics in Chapter 8—Evaluating and Comparing Trading Plans.
For now, managing risk will become our primary challenge in building a
profitable trading business and designing an effective trading plan.

Chapter 2The Business of Trading
As a business, trading has many advantages that include being your own
boss, low startup costs, a flexible schedule, and virtually unlimited
income potential. Trading certainly offers the opportunity to have a thriving
part-time or full-time business. The key to developing a successful trading
business, or any type of business for that matter, is good planning.
Many people are lured into the trading business without knowing
what the business really entails. Some prospective traders even begin trad-
ing large positions without having developed any type of logical business
or trading plan. Any business embarked on with such impulsiveness and
lack of foresight is likely to fail.
Unfortunately, there is also lot of deception associated with learning
the business of trading. A quick Internet search or the myriad late night
infomercials will have you convinced that generating a huge income from

24 Make Money Trading
the financial markets is easy. Or, that anyone with enough money to fund
a trading account can double his or her money within a short amount of
time. Here are some facts about the trading business:
• Mosttradersthatbeginatradingbusiness(about90%)failwithinthe first year.
• Thereisnosuchthingaseasymoney.
• Thereisnosuchthingasatradingsystemthathaszerorisk.
• Thereisnosuchthingasystemthatwinsallofthetime.
• Mostsuccessfulindependenttradersarenot“filthyrich,”butgen-
erate a comfortable income.
Trading is not for everyone, nor is it easy. It is a business that requires
constant research, evaluation, and discipline. There are no guarantees or
insurance with the trading business, and people who are considering trad-
ing should make sure they have both the personality and the financial
means to take on this type of business activity. Some of the questions that
you should ask yourself before pursuing a part-time or full-time indepen-
dent trading business include:
• AmIdriventosucceed?
• HowdoIhandlelosing?
• HowwellcanItakecriticism?
• CanIsticktoaplan?
• DoIhavethesupportofmyfamily?
• HowdoIdealwithstress?

The Business of Trading 25
Those traders who are able to weather the learning curve and the in-
evitable account drawdowns often go on to achieve considerable financial
success. Trading is a business that is well suited for focused, responsible
risk takers.
First, it is important to view trading as a part-time or full-time busi-
ness, and not a hobby. As a hobby, trading would be frustrating and very
expensive. Just dabbling in trading will keep traders from gaining the profi-
ciency and experience needed to become consistently profitable. Although
trading can be fun and exciting, it is still a business—one that can be very
profitable and rewarding when approached from the proper perspective.
Profitable business owners seek to stay in business for the long haul,
and understand that get-rich-quick schemes often lead to failure. As a
business, trading may not always provide a short-term profit. Winning
trades are not considered net profit, since they have to be combined with
trading losses and other expenses to develop the overall profit or loss of
a trading business. It is the difference between the gross trading profit
and expenses over time that creates the overall net profit (or loss) for the
business. It is only over time that a business will develop a substantial
profit, and successful traders have to take this long-term view. Figure 2.1
shows a performance report for a trading plan broken down into months.
Although this system showed a large loss during the first month and a net
loss during two months of the time period, it managed to achieve an an-
nual total net profit of $76,050.00. Statistics such as these help us develop
a comprehensive business plan.
Developing a trading plan as part of an overall business plan may
seem like a daunting task, especially to novice traders. Trading, however,
offers a unique advantage that is not available to most other businesses:
the ability to accurately test trading plans on historical market data, a

26 Make Money Trading
process known as backtesting. Backtesting allows a simulation of a trading
plan on past market data.
Imagine making plans to open a new store and projecting how much
inventory you would need for the first year. Now imagine you have access
to records showing exactly what items would have sold during the previ-
ous five years, had your store been open in the same location. Although
this wouldn’t guarantee your store would sell the exact items again in the
upcoming year, it would provide a realistic starting point for inventory
projections. The historical records could also prove or disprove the viabil-
ity of your business plan.
Period Avg. Net Profit
Return on
$50,000 Account
Percent
Profitable
January ($9,290.00) -18.58% 0.00%
February $7,900.00 19.41% 50.00%
March $540.00 1.11% 37.50%
April $20,070.00 40.83% 100.00%
May $10,960.00 15.83% 66.67%
June $0.00 0.00% 0.00%
July $12,760.00 15.91% 100.00%
August ($4,850.00) -5.22% 0.00%
September $7,140.00 8.11% 100.00%
October $12,400.00 13.02% 80.00%
November $18,110.00 16.83% 100.00%
December $310.00 0.31% 100.00%
Totals $76,050.00 151.48% 63.64%
This performance report shows monthly profit and loss statistics for a trading system.
FIGURE 2.1

The Business of Trading 27
Developing a trading plan around historical testing can offer you the
same type of valuable statistical information that will help in developing
an overall strategic business plan. Throughout the following chapters we
will extensively use this method of historical backtesting in our devel-
opment of a trading plan. Using modern trading software and historic
market data, we can accurately test the merits of a trading plan before we
actually risk money trading it.
If you are considering becoming a part-time or full-time trader, there
are some important challenges along the way. The first is developing realis-
tic expectations for yourself, your business, and your ability to learn. This
is not a profession at which you will become skilled overnight. Traders
who push themselves into trading too soon or without a well-researched
trading plan often find themselves back at the beginning, but with a lot
less money in their accounts. Take the time to research and plan your busi-
ness, as these are essential steps in your overall success as a trader.
Protecting CapitalThe primary goal in a trading business is to protect trading capital.
This is, by far, the most important concept of successful trading and build-
ing a consistently profitable trading plan. The fact is, without money to
trade with, your business is bankrupt. Game over. Once a trading account
has been lost or significantly depleted it can take a very long time and a lot
of stress to start over. Get it right the first time by planning well enough
to protect your most valuable asset: your trading capital.
Trading capital can be thought of as inventory. Similar to a retail store,
once an inventory is considerably reduced, so is the ability to generate
profits. We cannot sell retail products that we do not have (there is no

28 Make Money Trading
backordering in trading). Traders are limited to the money in their ac-
counts (including margin limits, discussed in Chapter 4—The Tools of the
Trade) to buy or sell in the financial markets.
Unfortunately, the primary business goal for many new traders is sim-
ply to make money. This can be a dangerous goal since it causes many of
these traders to take unnecessary risks and burn through their initial trad-
ing capital. Don’t get me wrong; making a profit is an important part of
trading and is, in fact, our secondary business goal. But we should always
keep the big picture in mind by controlling our losses.
Early in my trading career, a mentor gave me the advice, “Before you
can make money, you must first learn how not to lose money.” At the
time, this was not very well received and sounded more like an ancient
proverb than useful trading advice. Over time, however, I have learned that
this very simple phrase carries great meaning. I have found myself mut-
tering this phrase during tense trading moments. The fact is, if you can
actively trade without depleting your initial capital, you are well on your
way to trading success.
Now that we understand the importance of protecting capital, we will
discuss how to accomplish this important task. There are two primary
methods that traders can employ to protect their capital and actively con-
trol losses: responsible position sizing and the use of a stop loss.
Position SizingBefore placing a trade, traders must specify the amount of shares or
contracts that they intend to buy or sell. This is an important factor in
protecting capital. As a general rule, traders should begin trading with
small position sizes and work up to trading larger positions. This allows
traders to build up their trading skills and their trading accounts. Traders
may take frequent losses while learning to trade and developing a trading

The Business of Trading 29
plan. Keep in mind that losses aren’t always a result of your trading strat-
egy: pilot error accounts for a notable amount of trading losses, especially
in the early days of a trading career. Order entry mistakes are common,
and more than a few traders have bought when they meant to sell, and vice
versa. Large losses at the beginning of a trading career can be devastating
because traders will not have the same amount of capital to trade with
later on.
Once a trading plan has been developed that has produced profits and
given consistent results, then it’s time to think about increasing position
sizes. This is known as an anti-martingale betting system, and it allows
us to take greater risk when trading with our profits than with our initial
capital. This is similar to the concept of fixed percentage betting that was
introduced in Chapter 1—The Fundamental Concepts of Trading. This
type of system allows traders to objectively choose a position size to trade
with, maintaining the primary goal.
Stop LossesThe second method of controlling loss is known as a stop loss. A stop
loss is a simple limit to how much capital you are willing to risk on any
one trade. A stop loss is a type of order that can be placed in the mar-
ket at the same time that a trade is initiated, and should only be a small
percentage of the overall trading account value. The stop loss amount is
determined prior to entering the trade, and if the trade goes the wrong
way and reaches that predetermined amount, the trade will be closed.
Although most of us think of losing as a bad thing, a stop loss is an es-
sential tool that limits losses. It is recommended that you always trade
with a stop loss.
In Chapter 1—The Fundamental Concepts of Trading, we introduced
the importance of having a +R advantage in our trading plan. One meth-

30 Make Money Trading
od of creating a consistent +R advantage is through the use of a carefully
placed stop loss. While there are many methods of determining the place-
ment for a stop loss, each provides us with a measurable distance from our
trade entry point. Setting a second order that will close the position for a
profit, known as a profit target, will allow us to create a trade with a known
+R advantage. Figure 2.2 shows a trade-planning example with location of
a trade entry, the stop loss, and the profit target. Notice that the distance
between the trade entry and the profit target is twice the distance as that
between the entry and the stop loss. This provides a +R advantage of 2 for
FIGURE 2.2
A price chart showing a potential trade with a protective stop loss and a +R advantage of 2.

The Business of Trading 31
this trade. While there is no guarantee that this trade will reach the pro-
jected profit target, we know that the maximum amount we can expect to
lose on this trade is 26 points. This type of trade planning can be critical
to establishing positive expectancy.
Getting an EducationMany aspiring traders may envision a time when they can sit in front
of their high-speed computers, fueled by adrenaline, and rely on their
instincts and quick reactions to make money in the markets. While this
vision may not be entirely unrealistic, the time commitment involved in
creating those instincts and quick reactions is significant and can be great-
ly underestimated. In addition, most successful traders are not fast paced,
adrenaline junkies, but responsible risk takers who have spent a consider-
able amount of time learning about and researching the markets and their
individual trading plans. These traders are typically very familiar with the
statistics of their trading plans and track their individual trades with some
type of journal for later analysis. These successful traders remain students
of the market.
As stated earlier, about 90% of people entering the trading business
fail within the first year. I believe that the largest reason for this low suc-
cess rate can be attributed to a lack of trader education. Although most
traders go into the business with great enthusiasm and a willingness to
succeed, few accurately estimate the length of time it takes to learn the
business. With many professions, there is a significant learning curve that
often requires many years of formal training before it is even possible
to legitimately enter the business. In trading, you do not need a degree
in finance or an MBA to try your hand at buying and selling stocks or

32 Make Money Trading
commodities. Many people assume the ease of entry into this profession
translates into a business that is easy to learn. Unfortunately, trading is not
an easy business to learn, nor is it intuitive.
Possibly the most difficult part of learning to trade is the lack of
binary feedback. In most learning situations, you are rewarded when you
perform correctly and, conversely, given criticism for doing something
wrong. In trading, you can do everything right and still lose money on a
trade. Even worse, you could completely ignore your trading plan, blow
through your stop loss, and still wind up making money on that indi-
vidual trade. You can see how learning in this way can be confusing and
very expensive. It is only over time and with consistency that you will be
rewarded for good trading.
New traders cannot rely on instinct or intuition to make market-tim-
ing decisions. Instead, they must rely on a trading plan that is developed
using historical research, one that employs consistent logic and sound
money management principles. Good trading is having the discipline to
always follow your trading plan.
We have already discussed how important it is to protect our capital;
strictly following your trading plan is what allows you to do just that. A
good day of trading should not be measured by how much money you
make but by how well you followed your plan. If you have correctly posi-
tion-sized, taken every trade that your trading plan alerted you to, and fol-
lowed your money management strategy, then you have achieved perfect
trading. Discipline is a vital factor in profitable trading and learning to
develop a successful trading plan.
So the question remains, how do we start to develop a profitable
trading plan? The first recommendation is to look at the startup costs of
trading not just in terms of initial trading capital, but also by how much
time you can afford to invest in learning the business. This can be a much

The Business of Trading 33
more significant investment than simply funding a trading account. Your
time should be viewed as risk capital or time that you can afford to be
without an income.
The next step is to develop an educational path. This may include
reputable trading schools, instructional chat rooms, seminars, or private
coaching/mentoring. Although these will add to the initial expense of
FIGURE 2.3
Online trading schools can introduce the business of day trading.

34 Make Money Trading
the business, they can be a critical step in minimizing the time it takes to
develop a successful trading business. When considering an educational
service, spend some time researching and comparing services. Typically,
services that promise “huge profits,” “no risk systems” or require you to
consistently subscribe to their recommendation service should be avoided.
Before paying for an educational service, you should talk with the service
provider to make sure they teach a trading methodology that is compat-
ible with your trading style and account size.
Using an organized approach to learning is critical, and developing a
schedule or educational plan will make the process much more efficient.
A competency model is often used to determine critical levels along the
learning spectrum, such as the one displayed in Figure 2.4. Recognizing
where you fall along this spectrum can help self-paced learners build an
effective educational plan. This is where a trading mentor or coach can be
LEVEL 1 LEVEL 2 LEVEL 3 LEVEL 4
Unconscious
Incompetence
Conscious
Incompetence
Conscious
Competence
Unconscious
Competence
This is where learn-
ing begins. Traders
at this level are not
aware of the skills or
behavior needed to
become successful
traders.
Traders have devel-
oped an awareness
of the skills that are
needed to become
successful traders.
Books, seminars or
a trading coach can
help bring these
skills into focus for
the trader.
At this level traders
can now trade with
reasonable com-
petence but must
think about doing it.
Trading does not yet
happen naturally.
These traders can
trade instinctively
and no longer have
to think about it.
Through much
repetition, trading
has become natural.
This is the level of
mastery
A competency model applied to trading.
FIGURE 2.4

The Business of Trading 35
very helpful. Learning requires us to take something that is complex and
break it down into a series of attainable steps. Each of these steps should
be linked together in a logical order known as a progression. It is through
this progression that we will be able to advance through the different
competency levels. Setting goals is the first logical step in developing this
process, and traders should have the answers to these key questions written
down in a journal or notebook:
• Whataremylong-termtradinggoals,otherthanspecific financial goals?
• Whataremyshort-termtradinggoals,otherthanspecific financial goals?
• WhatdoIhopetogainfromtrading,otherthanmoney?
Since there are so many elements to learn and understand in trading
and developing a trading plan, it is important to prioritize the key aspects.
Understanding your own personal learning style is essential to building
an effective educational plan. Traders often find that they will learn a lot
about themselves during this process, and having the answers to these
questions will be helpful:
• WhatdoIconsidertobemygreatestweaknesses?
• Whataremystrengths?
• HowhaveIexcelledinthepast?
• Whattools/methodsdoIneedtolearn?
• HowmuchtimeandmoneyamIwillingtorisk?
Another key tool is a trading journal, shown in Figure 2.5, which logs
individual trades and acts as a trading diary. Traders should write down

36 Make Money Trading
Dat
eSy
mbo
lSh
ares
/C
ontr
acts
Rea
son
fo
r Tr
ade
L/S
Ent
ry
Pric
eExi
t Pr
ice
Profi
t (L
oss)
Not
es
9/13
- 9/
22ER2U
064
L2 B
uyL
702.
9070
4.90
800
Gre
at s
uppo
rt o
ff M
A
9/22
- 10
/3ER2Z
06
4S1
Sel
lS
704.
9068
8.90
6400
Took
a li
ttle
hea
t, th
en n
ice
mov
e
10/4
- 10
/4ER2Z
064
L1 B
uyL
694.
0071
0.00
6400
Qui
ck m
ove
- fun
tra
de
10/1
0 - 1
0/13
ER2Z
064
S1 S
ell
S72
1.50
734.
60(5
240)
Trad
e ag
ains
t m
e righ
t aw
ay
coul
dn’t
pene
trat
e M
A
10/1
3 - 1
0/17
ER2Z
064
L2 B
uyL
734.
6074
5.20
4240
Goo
d re
sita
nce
from
DTL
Tim
e to
get
out
!
10/1
7 - 1
1/1
ER2Z
064
S1 S
ell
S74
5.20
729.
2064
00Fa
ily s
low
tra
de...
nic
e pu
sh
thro
ugh
MA
11/6
- 11
/7ER2Z
064
L1 B
uyL
727.10
743.
1064
00Bea
utifu
l Tra
de
11/1
5 - 1
1/28
ER2Z
064
S1 S
ell
S75
9.80
743.
8064
00Li
ttle
bou
ncy
A t
rad
ing
jo
ur
nal
is
a va
luab
le l
ear
nin
g t
oo
l.
FIG
UR
E 2.
5

The Business of Trading 37
every trade, making sure to provide information for each one. It is impor-
tant to review this journal at regular time intervals (weekly or monthly),
as this can be an important tool for evaluating progress and establishing
additional goals.
While learning the business of trading is hard work, that doesn’t mean
that the process cannot be fun and rewarding. It is important to maintain
a positive attitude and lifestyle throughout the learning process as this will
help to avoid frustration. It may sound a bit hokey, but adopting a posi-
tive mantra such as, “I will learn to develop a profitable trading plan,” can
help push through difficult points while learning. A good education is, by
far, the most important tool in developing a profitable trading plan and a
profitable trading business.
Researching the BusinessMost of us could not imagine opening a new retail store without hav-
ing extensive knowledge of the products that we were planning to sell. Yet,
many new traders try each year to start a trading business without having
a thorough understanding of what they are buying and selling. Sure, it
sounds easy to buy something and then sell it for more than you paid for
it. It is the detailed subject knowledge and expertise, however, that sepa-
rates the successful businesses from the bankrupt. Whether you choose to
have $50,000 in retail inventory or in a trading account, it is a business.
Successful business owners use more than just the retail value of their
products to determine pricing. They must understand their intended mar-
ket. They must also realize when to cut their losses by selling a product at
a loss in order to generate money to reinvest into other types of products
that are more popular and can consistently sell at a good profit. This type

38 Make Money Trading
of decision-making is critical to a successful business and requires experi-
ence, education, and practice. Trading is no different than any other type
of retail business. Business owners who wish to be successful must have a
professional, systematic approach and be willing to thoroughly research
their intended markets. Research is an important component in the trad-
ing business.
For most, trading is a one-person business, yet it requires two dis-
tinctly different roles: that of a strategist and that of a market trader. While
both aspects are critically important, each requires a different set of skills
and responsibilities. It is important that traders be able to differentiate
between the two distinctly different roles that are required of the trading
FIGURE 2.6
The Strategist and the Market Trader make up the two essential responsibilities of a
trading business.

The Business of Trading 39
business. Figure 2.6 shows a graphical model of these two important func-
tions associated with a successful trading business.
The strategist must see the “big picture” and is responsible for the
overall planning of the business, including the development of the trad-
ing plan. In addition, the strategist must set a risk limit with regard to
how much can be lost on any given trade, and overall, before the trading
plan is revised. Another responsibility for the strategist is maintaining the
trading account and selecting the technical tools that the trader will use.
Essentially, the strategist is the chief operating officer (COO) for a trading
business.
The market trader’s responsibilities are a much more defined: to in-
teract with the markets and follow the trading plan exactly. This requires
having complete confidence in the trading plan and executing each trade
precisely according to the rules of the plan. Market traders don’t care if
they lose a trade; they are well aware that over time the trading plan has
a positive expectancy, and they know the thresholds for the plan. As long
as the market is open and trading can take place, the market trader is on
duty. Everything that the market trader does should be written down in
the trading journal for later evaluation; any changes or revisions to the
trading plan fall under the jurisdiction of the strategist.
Strategist + Market Trader = Trader
As mentioned above, both of these roles are necessary for building
a successful trading business. While most of us have a stronger inclina-
tion for one role over the other, too much emphasis on just one aspect
of the trading business can create a significant imbalance. For instance,
some traders who enter the business look at trading as simply a new job.
They only want to focus on placing trades and being participants in the

40 Make Money Trading
markets. They prefer to be told how to trade, often looking to purchase a
trading plan or follow an advisory service. Unfortunately, without having
formulated a trading and business plan of their own, these market traders
will most likely fail. They seem to constantly change their tactics and are
always looking for a better system. The fact is, they must customize their
business and trading plans to meet their specific goals, account size, and
risk tolerance. By developing the skills necessary to becoming good strate-
gists and establishing long-term or strategic business goals, they will greatly
increase their chances of developing a profitable trading business.
Conversely, some people will focus on developing a trading business
solely around historical data and performance reports, without much re-
gard for developing trading skill. These strategists often view market trad-
ing as a menial task that is necessary to implement their overall financial
goals. They often have a difficult time removing themselves from the stress
of actual trading. As traders, they tend to overanalyze each trading deci-
sion and may not allow themselves to follow their own trading plan. They
must separate their roll as a strategist and focus on developing their skills
as a market trader in order to build a successful business. For them, this
means turning off the analytical part of their brains and focusing on the
task at hand…good trading. As mentioned earlier, good trading simply
means following the trading plan.
Having a strong inclination for one role over the other is not necessar-
ily a bad thing, as long as you realize your preference or bias towards one
role. Understanding your personal inclination as a business owner allows
you to structure your trading business around your particular strengths.
For instance, people who tend to be primarily a market trader may find
it helpful to select a more active style of trading (such as day trading) on
which to base their trading plan. Strong strategists may elect to use some
form of trade automation (explained in Chapter 6—Placing Trades), to
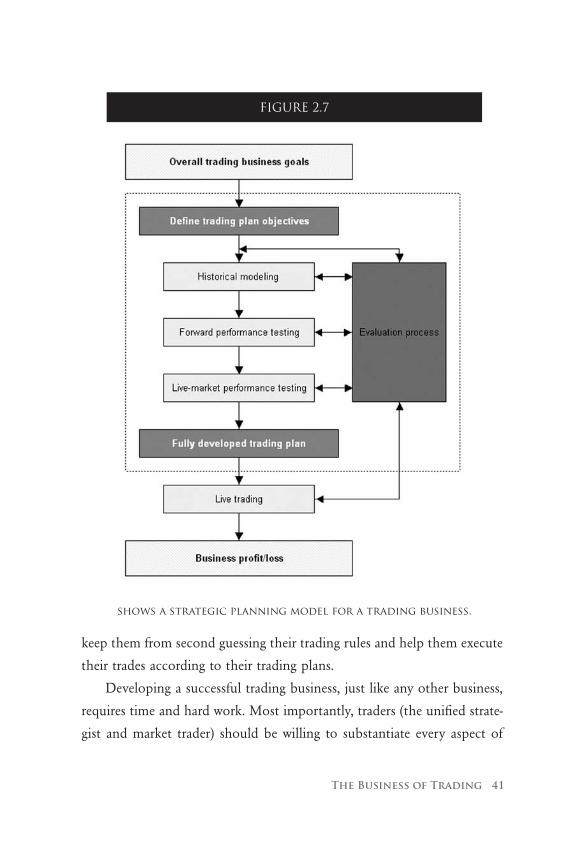
The Business of Trading 41
keep them from second guessing their trading rules and help them execute
their trades according to their trading plans.
Developing a successful trading business, just like any other business,
requires time and hard work. Most importantly, traders (the unified strate-
gist and market trader) should be willing to substantiate every aspect of
FIGURE 2.7
shows a strategic planning model for a trading business.

42 Make Money Trading
their business and trading plans by doing their own research. Trading is
not a profession that encourages shared information or an open exchange
of ideas. Trading is an individual competition (explained further in Chap-
ter 3—Getting to Know the Market), and sharing information can make a
trading plan or system less profitable, or even destroy the system’s profit-
ability all together. For this reason it becomes even more important to
develop your own business and investigate things on your own.
The reality is this: you have to do your own research and the research
is an ongoing process. Nobody is going to hand it to you. People who
have had past careers or backgrounds that required performing thorough
research often make outstanding traders.
Building a Strategic PlanA strategic plan serves as a map to lead traders from where they are
now to where they would like to be in the future. This type of planning
allows traders to build a comprehensive model for their trading businesses
as well as providing the most direct path to getting there.
Notice that the area surrounded by the dotted line in Figure 2.7 rep-
resents the specific steps in developing a trading plan. The overall model
illustrates a path to developing a successful trading business. A thorough
strategic plan includes the following components: a mission statement, ob-
jectives, goals, and a trading plan. In addition, a strategic plan should be:
• Written
• Concise
• Basedonaccurateresearch
The Business of Trading 43
A strategic plan should allow enough time to be successfully imple-
mented. Traders who rush into trading or that trade positions that are too
large will more than likely have problems.
A mission statement explains the reason for a part-time or full-time
trading business. While it may seem obvious that trading is about mak-
ing money in the financial markets, we still need to answer the question,
“Why choose trading to make money?” There are certainly many other
businesses that are less competitive or may fall into an area in which you
currently have more experience and expertise. For some, the answer may
be in the flexibility that trading offers or the desire to manage your own
investments. In any event, traders need to be able to clearly and simply
define this important question.
Objectives set out areas of emphasis that are critical to the success of
the business. These areas of emphasis outline what type of trading activi-
ties should be pursued. This includes both current and prospective trading
activities and, for new traders, should include an educational component
as well.
The importance of establishing goals has been mentioned earlier in
this chapter. For a strategic plan, these should include both long-term and
short-term goals. Monthly, quarterly, one-year, and five-year goals should
all be taken into consideration and will allow traders to outline the strategy
for reaching these goals. It is recommended to first set long-term goals
and then set short-term goals. In this way, the short-term goals act as steps
toward achieving the long-term goals.
A trading plan is an essential element of a strategic plan that addresses
the specific trading aspects of the business. This plan is based on thorough
research and addresses the implementation of all of the previous goals. In
essence, this is the action plan of how we will achieve our mission.

44 Make Money Trading
Trad
ing
Bus
ines
s Pr
ofit
and
Loss
Aug
Sep
Oct
Nov
Dec
2006
Win
ning
Tra
des
$0
$14,
280
$49,
600
$54,
330
$310
$2
65,5
12
Losing
Tra
des
($4,
865)
($7,15
0)($
37,2
25)
($36
,235
)($
5)($
189,
662)
Com
misio
ns($
15)
($10
)($
25)
($15
)($
5)($
200)
------
------
------
------
------
------
------
------
------
------
------
------
Trad
ing
Cos
ts($
4,88
0)($
7,16
0)($
37,2
50)
($36
,250
)($
10)
($18
9,86
2)
Gro
ss T
radi
ng M
argi
n($
4,85
0)$7
,140
$1
2,40
0 $1
8,11
0 $3
10
$76,
050
Ope
rating
Exp
ense
s:
Payr
oll
$4,1
67
$4,1
67
$4,1
67
$4,1
67
$4,1
67
$50,
000
Plat
form
Fee
s$1
00
$100
$1
00
$100
$1
00
$1,2
00
Exc
hang
e Fe
es$3
5 $3
5 $3
5 $3
5 $3
5 $4
20
Inte
rnet
Ser
vice
$45
$45
$45
$45
$45
$540
Phon
e/C
ell S
ervi
ce$8
0 $8
0 $8
0 $8
0 $8
0 $9
60
Insu
ranc
e$2
00
$200
$2
00
$200
$2
00
$2,4
00
Oth
er$1
75
$175
$1
75
$175
$1
75
$2,1
00
------
------
------
------
------
------
------
------
------
------
------
------
Tota
l Ope
rating
Exp
ense
s$4
,802
$4
,802
$4
,802
$4
,802
$4
,802
$5
7,62
0
Profi
t Bef
ore
Taxe
s($
9,65
2)$2
,338
$7
,598
$1
3,30
8 ($
4,49
2)$1
8,43
0
Taxe
s In
curr
ed$0
$1
,428
$2
,480
$3
,622
$6
2 $1
8,03
8
Net
Pro
fit($
9,65
2)$9
10
$5,118
$9
,686
($
4,55
4)$3
92
sho
ws
a pr
ofi
t an
d l
oss
sta
tem
ent
for
a s
mal
l, i
nd
epen
den
t tr
adin
g b
usi
nes
s.
FIG
UR
E 2.
8

The Business of Trading 45
Just writing down this type of information can help traders under-
stand the time and financial requirements for developing a successful trad-
ing business. Figure 2.8 shows a hypothetical profit and loss statement for
a small, full-time independent trading business. These numbers represent
the same trading plan that was illustrated in Figure 2.1. While the trading
profits (after commissions) still amount to $76,050 for 2006, the busi-
ness only shows a $392 overall net profit after accounting for operating
expenses, a nominal “salary,” and taxes. While it may be safe to say that
most traders begin trading only as a part-time business, this shows the
importance of seeing the big picture. Planning these types of business
expenses can provide a more realistic projection and can help answer im-
portant question such as:
• HowmuchmoneywillIneedinmytradingaccount?
• WhattypeofreturnsdoIneedtogeneratefromtrading?
• HowlongcanIaffordtolearnthebusiness?
• WhattypeofsalarycanIhopetogeneratefromtrading?
• ShouldIpursuetradingasafull-timeorpart-timebusiness?
A strategic plan should not be confused with a trading plan. A trading
plan is an essential element of a strategic plan that addresses the specific
trading aspects of the business. While the majority of this book will dis-
cuss building a successful trading plan, it is important for traders to also
consider the bigger picture of developing an overall business. As we dis-
cussed in Chapter 1, even an outstanding and well implemented trading
plan can result in ruin if it is undercapitalized or not planned correctly.
An overall strategic plan will help traders develop an important overview
of their trading businesses.


Chapter 3Getting to Know the Market
Before we talk about how to make money in the financial markets, it is
important to understand how these markets actually work. This chap-
ter can be considered a quick-start guide to help traders understand this
highly competitive atmosphere. Building a business around profiting from
inefficiencies in the financial markets literally means beating someone else.
In order for you to make money trading, someone else has to lose it; short
term trading is a zero sum game. The only market participants that never
lose money are the brokers and the exchanges. Traders must compete with
other traders for their profits.
To understand the markets, we must first take a look at what really
drives the market. While primarily guided by supply and demand, we must
also consider the investor emotions that lead to market inefficiencies: fear

48 Make Money Trading
and greed. While this may sound like a cliché, it is the emotional factor
that allows for short-term trading opportunities in the market. At this
point you may be wondering how we can profit from this emotional fac-
tor in the market. We do it by teaching ourselves to take all emotion out
of our trading. Our trading decisions should be based on good research
and planning, not on what we may feel at the moment. Establishing and
following a trading plan is what allows us to take advantage of emotionally
driven markets and make profits.
The Stock Market
Stock ExchangesMost people who refer to the “market” are usually talking about the
US equities market, or stock market. The US stock market is composed
of three primary exchanges where trading takes place: the New York Stock
Exchange (NYSE), the American Stock Exchange (AMEX), and the NAS-
DAQ Stock Market (NASDAQ), which combined list approximately 7,000
individual stocks. Stocks can be thought of as little pieces of a publicly-
traded company that can be bought and sold. Stocks are broken down
into units called shares and each individual share of a stock has a tangible
value. The exchanges can then be thought of as the exclusive retailers for
those companies. Much like the Wal-Marts, Sears, and K-marts of the trad-
ing world, the NYSE, AMEX, and NASDAQ represent enormous retail
markets where companies compete to sell their stock.
Also similar to the sale of goods in a store, stocks have both a whole-
sale and retail value. These are known in the trading world as the bid and
ask prices. As a retail trader (one who does not work at an exchange), we
must typically purchase a stock at its retail price (the ask price) and when

Getting to Know the Market 49
we wish to sell it, we can only sell it through the exchange at its wholesale
price (the bid price). Similar to purchasing a brand new car and driving it
off the lot, you cannot sell that car for exactly what you paid for it unless
the supply or demand for that vehicle significantly changes. In addition,
retail traders cannot buy directly from an exchange but must go through
a broker who will buy or sell shares of a stock on our behalf in exchange
for a commission.
The difference between the bid and ask price is called the bid-ask
spread and, along with the trading volume, this reflects a stock’s liquid-
ity. Trading volume is the number of shares that have been bought and
sold during a particular time period (daily volume is calculated from the
beginning of the day’s trading session). Typically, traders look for stocks
that have a very small bid-ask spread and trade in relatively high volume
as this will ensure that if you want to buy or sell a particular stock, some-
one else will be willing to sell it or buy it from you. This is what is meant
by liquidity.
Figure 3.1 shows a time and sales screen from a highly liquid stock,
Microsoft (MSFT). This shows the amount of buying and selling taking
place as soon as it happens. Since each transaction is matching a buyer
to a seller, “buy” or “sell” is relative to the last price at which a transac-
tion has occurred. In other words, if the last sale occurred at the ask price
(retail value) of the stock we can assume that it is being bought; if the
last sale occurred at the bid price (wholesale value), we can assume that
it is being sold. Since we know the bid and ask prices (shown at the top),
we can tell that someone just bought 100 shares at a price of $29.92 per
share, since this transaction occurred at the ask (retail) price. In addition,
we can see a very small $0.01 difference between the bid and ask prices for
this stock that shows that there is very little ‘markup’ for the price of this
stock. Prices can continue to fluctuate between the bid price and ask price

50 Make Money Trading
without the overall value of the stock changing; this simply represents the
normal buying and selling that can take place.
At this point, you may be wondering what makes the price of a stock
fluctuate. This is where trading volume and a good sales associate come
in. At the NYSE and AMEX, each individual stock has its own auction
taking place with its own specific auctioneer, known as a specialist. At
the NASDAQ, sales associates are called market makers and their job is
to create liquidity for their individual stocks by creating and selling their
own inventory and pricing the stock at a value that will initiate buying and
selling. Essentially, specialists and market makers are responsible for lining
up buyers with sellers by adjusting the price of the stock depending on
the current supply and demand. They do this by setting the price for their
FIGURE 3.1
A time and sales screen displays all of the real-time transactions for a stock. (Created with TradeStation)

Getting to Know the Market 51
stock, and carefully watching as market participants line up to buy or sell
that stock. If more participants are lining up to buy, they will increase the
price of the stock to attract more sellers (who will sell because the increase
in the stock’s value will allow them to profit). Once the amount of buyers
is equal to the amount sellers, the market has reached a point of efficiency
where everyone is happy and the value of the stock is considered “fair.” If
all of the sudden the higher price creates another imbalance and begins
to attract more sellers than buyers, however, the value of the stock will
go back down. These types of dynamic supply and demand imbalances
can be seen most clearly by viewing the intraday market depth data (also
known as a Level 2 screen) as seen in Figure 3.2.
The Level 2 screen of General Electric (GE) stock in Figure 3.2 shows
two shaded columns representing the amount of market participants buy-
ing versus those who are selling. The column labeled “ID” shows the
market participant’s identification, indicating from whom we could buy or
sell. The bid, ask, and size columns list what is currently available. We can
see from the top price lines that there are significantly more market par-
ticipants willing to sell at the ask price of $37.55 than are willing to buy at
FIGURE 3.2
A Level 2 screen for General Electric (GE) shows buyers on the left side, sellers on the right. (Created with TradeStation)

52 Make Money Trading
the bid of $37.54. These white price zones are known as the inside bid and
ask since they represent the best prices currently available for buying and
selling. From this information, we can assume that this market is trying
to initiate short-term buying since there seems to be greater supply than
demand. This may often create a short-term price drop as there are greater
bid sizes lining up to buy at the shaded price level of $37.53. This type of
price action occurs continually in most stocks throughout the day.
Although the NYSE, AMEX, and NASDAQ essentially do the same
thing (as do many other stock exchanges in the US and around the world),
there are several differences between these major exchanges. The NYSE, com-
monly referred to as the “Big Board,” is the oldest, most prestigious stock
exchange, and was founded in 1792. It is located on Wall Street in downtown
New York City and lists approximately 2,800 individual stocks, mostly from
the industrial and manufacturing sectors. The NYSE lists its stocks as one,
two, or three letter abbreviations (such as “GE” or “IBM”) and uses a system
where transactions occur live between traders and specialists. Trading on the
floor of the NYSE is a hybrid system, part electronic and part auction. In
the NYSE, there are several rooms with “posts” representing the different eq-
uities. In order to buy or sell a NYSE stock, or listed stock as they are called,
someone must physically place an order with a specialist on the floor of
the exchange.
In contrast, the NASDAQ is an all-electronic marketplace that con-
sists of a telecommunications network that does not have a physical trad-
ing floor. NASDAQ stocks are typically listed as four letter abbreviations
(“JAVA” or “INTC”) and include many technology-oriented stocks. Al-
though the NASDAQ was only started in 1971, it lists approximately 3,200
companies and surpassed the NYSE in 1994 in annual share volume.
While the AMEX is owned by NASDAQ, its structure is more similar
to the NYSE. The AMEX uses specialists to conduct its auction-like trad-

Getting to Know the Market 53
ing live on a trading floor. While most AMEX companies are smaller than
the NYSE or NASDAQ companies, they list over 800 individual stocks
and have become the primary trading location for Exchange Traded Funds
(see the ETF section later in this chapter).
If you have ever watched a ticker symbol scroll by or watched a finan-
cial news network such as CNBC, you may have noticed how stock prices
appear, as shown in Figure 3.3. In this case, each stock is represented by
a three or four letter abbreviation followed by the quantity and price for
the last sale of the stock. An up arrow, usually in green, means the stock
price is higher than its previous day’s value, while a down arrow, usually
in red, means that the stock is down on the day. The second stock shown
in Figure 3.3, for instance, shows that a transaction for General Electric
(GE) has just occurred for 15,000 shares at a price of $37.97. Additionally,
we can tell that this stock is down $0.03 from yesterday’s trading session.
While this can provide very basic information about the current state of a
stock price, unless we know the bid or ask price, we cannot determine if
the stock is being bought or sold.
Individual stocks have long been the trading instruments of choice for
many traders. Stocks are simple to understand and have become very easy
to trade through the popularity of online brokers who offer discount com-
mission fees. Individual stocks can also carry high levels of risk. This can
FIGURE 3.3
A stock ticker representing the last sale, quantity of the sale and the net change in daily price for each stock
symbol that scrolls by.
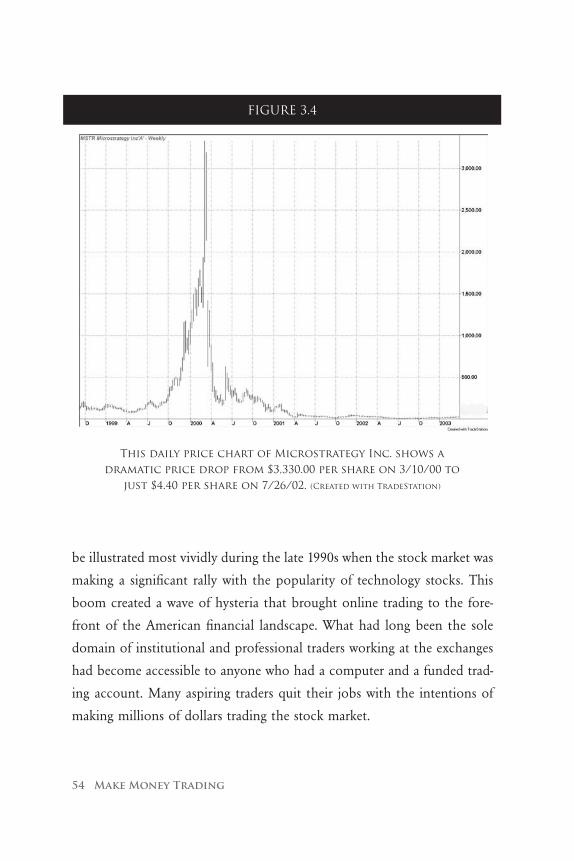
54 Make Money Trading
be illustrated most vividly during the late 1990s when the stock market was
making a significant rally with the popularity of technology stocks. This
boom created a wave of hysteria that brought online trading to the fore-
front of the American financial landscape. What had long been the sole
domain of institutional and professional traders working at the exchanges
had become accessible to anyone who had a computer and a funded trad-
ing account. Many aspiring traders quit their jobs with the intentions of
making millions of dollars trading the stock market.
FIGURE 3.4
This daily price chart of Microstrategy Inc. shows a dramatic price drop from $3,330.00 per share on 3/10/00 to
just $4.40 per share on 7/26/02. (Created with TradeStation)

Getting to Know the Market 55
The stock market craze was short lived, and by 2001 many prospective
day traders had lost huge amounts of money during the subsequent fall.
One such tech stock, Microstrategy, shown in Figure 3.4, fell from just
over $3,300 per share to about $4. The wild speculative investing was over
and the stock market settled. While retail investing and trading continue
to shape the face of the stock market, corporate scandals and increased
market competition have created an atmosphere requiring much more
caution. It should be noted that once you own shares of an individual
stock, it is possible for that company to go bankrupt and for the stock to
lose all of its value. This may leave investors holding onto shares of a stock
that they cannot sell simply because no one else wants to buy them. This
is an example of what is meant by risk in the stock market.
While stocks still offer opportunities to the retail trader, there are
many other trading instruments that may be better suited to modern ac-
tive trading. Although most of these instruments are based on the stock
market, they may offer fewer restrictions, have greater liquidity and may
require less research than trading individual stocks. In the following sec-
tions of this chapter, we will discuss many of these instruments and how
they can be used in building a trading plan.
Stock Market IndicesIt is important to understand the relationship of stock indices to the
overall market. Stock indices, also known as cash indices, are collections
of stocks that are tracked and combined into a statistic that can be used
to represent the strength of an exchange, trading sector, or similar market
capitalization. While market capitalization refers to the amount of money
that it would take to buy every share of an individual stock, there are
hundreds of different indices that are used around the world, and are
calculated and maintained by various institutions. These cash indices may

56 Make Money Trading
contain anywhere from 30 to over 6,700 individual stocks and can provide
us with an important method of gauging the movement of the overall
market. The three major cash indices for the US financial markets are the
Dow-Jones Industrial Average Index, the NASDAQ Composite Index, and
the Standard and Poor’s 500 Index (or S&P 500).
The Dow-Jones Industrial Average Index, commonly abbreviated
DJIA, is composed of 30 of the largest and most liquid stocks in the
world, primarily from the NYSE. A price-weighted average is used to calcu-
late the index, which simply adds the prices of the 30 stocks and divides
by a predetermined divisor. The Dow has become the most well-known
cash index in the world.
The NASDAQ Composite Index, abbreviated NAS, consists of over
4,800 stocks and represents the strength of the overall NASDAQ exchange.
Although this cash index is often confused with the NASDAQ-100 Index,
which is composed only of the top 100 non-financial NASDAQ compa-
nies, the NASDAQ Composite Index is an important metric for gauging
the overall NASDAQ marketplace. This is a capitalization-weighted index,
meaning that price fluctuations in larger companies have a bigger effect on
the index than the same price fluctuation in a smaller company.
The S&P 500 Index, or SPX, is a capitalization-weighted index that
tracks a combination of 500 large-cap stocks. A committee decides which
500 stocks to include in this versatile index. The S&P 500 is often used
FIGURE 3.5
This ticker shows the levels of the major US cash indices showing their current values and daily net change.

Getting to Know the Market 57
to gauge the trend and strength of the overall US financial markets and is
an important reference used by individual traders and money managers to
track their comparative performance.
The daily change in these cash indices is often used to point out the
strength or weakness in the broad market on any given day. Most news
networks run a continuous ticker with the major cash indices throughout
the day. The up or down arrows shown in Figure 3.5 indicate the current
intraday direction of these cash indices. As these numbers get larger and
the direction of multiple cash indices coincide, they can show strong
trends in the overall market. Figure 3.6 illustrates the general market sen-
timent as the daily changes in the DJIA and the NAS achieve different
levels. For example, if the DJIA is down more than 75 points from the
previous day’s trading session, it indicates an extremely bearish market
sentiment; if the NAS is up more than 20 points from the previous day’s
trading session, it indicates an extremely bullish market sentiment.
While a single number represents each of these indices, there is no way
to actually trade a stock index without owning shares of every component
stock in that index. Since it is not practical for most of us to buy and sell
Index
Extremely
Bearish Bearish Neutral Bullish
Extremely
Bullish
Dow Jones Industrial Average (Daily Change)
-75 or
Lower
-75 to -35 35 to -35 35 to 75 75 or
Higher
Nasdaq Compsite Index(Daily Change)
-20 or
Lower
-20 to -15 15 to -15 15 to 20 20 or
Higher
The different levels of daily change for two major cash indices, and the corresponding market sentiment.
FIGURE 3.6
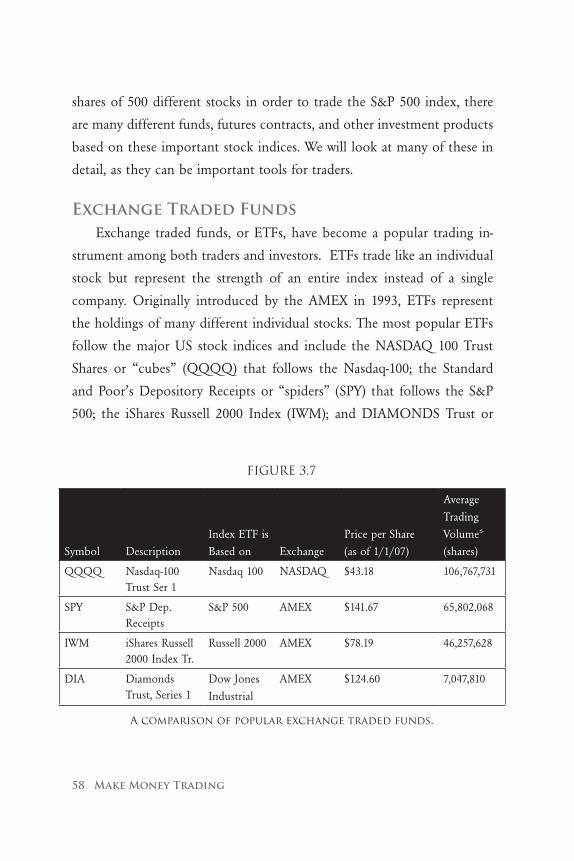
58 Make Money Trading
shares of 500 different stocks in order to trade the S&P 500 index, there
are many different funds, futures contracts, and other investment products
based on these important stock indices. We will look at many of these in
detail, as they can be important tools for traders.
Exchange Traded Funds Exchange traded funds, or ETFs, have become a popular trading in-
strument among both traders and investors. ETFs trade like an individual
stock but represent the strength of an entire index instead of a single
company. Originally introduced by the AMEX in 1993, ETFs represent
the holdings of many different individual stocks. The most popular ETFs
follow the major US stock indices and include the NASDAQ 100 Trust
Shares or “cubes” (QQQQ) that follows the Nasdaq-100; the Standard
and Poor’s Depository Receipts or “spiders” (SPY) that follows the S&P
500; the iShares Russell 2000 Index (IWM); and DIAMONDS Trust or
Symbol Description
Index ETF is
Based on Exchange
Price per Share
(as of 1/1/07)
Average
Trading
Volume*
(shares)
QQQQ Nasdaq-100 Trust Ser 1
Nasdaq 100 NASDAQ $43.18 106,767,731
SPY S&P Dep. Receipts
S&P 500 AMEX $141.67 65,802,068
IWM iShares Russell 2000 Index Tr.
Russell 2000 AMEX $78.19 46,257,628
DIA Diamonds Trust, Series 1
Dow Jones
Industrial
AMEX $124.60 7,047,810
A comparison of popular exchange traded funds.
FIGURE 3.7

Getting to Know the Market 59
“Diamonds” (DIA) that follows the Dow Jones Industrial Average. Figure
3.7 shows a comparison of these popular ETFs.
ETFs have many distinct advantages for retail traders, including the
ability to control risk through diversification. This simply means that hav-
ing stock in many individual companies offsets some of the risks involved
in trading one individual stock. Given the worst-case scenario of a com-
pany in which you own stock going bankrupt, an ETF would not lose
its entire value, and thus, gives you an element of protection. Another
advantage to trading ETFs is liquidity; this can be most easily seen through
the tight bid-ask spreads and high volume. The ETFs mentioned above
typically trade with very high volume, as seen in the bid and ask sizes on
the Level 2 screen in Figure 3.8. Notice that there are over 25,000 shares
available at the bid size and about 3,000 at the ask (with a bid size of
17,000 next in line), and with an extremely tight spread of only one cent.
This high liquidity within this ETF means that it is easy to enter or exit
a position.
FIGURE 3.8
This Level 2 screen of the Standard and Poor’s Depository Receipts (SPY) shows the large volume in the size of both the bid
and ask levels of an ETF. (Created with TradeStation)

60 Make Money Trading
An additional advantage to trading ETFs is that there is no uptick
rule on short sales. Short selling is the opposite of traditional buying and
selling of an instrument with the intention of profiting from a rising value
(also known as a long trade). Short selling (or selling short) means selling
first and buying later in the hopes of profiting from the falling price of an
instrument, and is described in greater detail in Chapter 6—Placing Trades.
While many brokers offer a list of individual stocks that can be used in
short selling, there is a well-known rule that only allows short sales on an
uptick in the stock’s price. ETFs do not have this restriction and traders
can go short just as easily as they can go long.
ETFs can provide good opportunities for trading; and, due to their
popularity, just about every online broker now offers access to them. ETFs
have also become widely accepted with longer-term investors and, in many
cases, are taking the place of more traditional mutual funds.
The Futures Market
Futures ExchangesThe futures market began in the US around 1850 as a means of trad-
ing commodities (such as corn, cotton, and wheat). This type of market
provided a method for farmers to get the money necessary for planting
and harvesting their crops and, in turn, the farmers agreed to sell their
produce when it was harvested at a particular price. This type of a contract
still provides farmers and buyers with a level of protection. Farmers can
plan on the future sale of crops; buyers can plan on the future purchase of
goods. Futures (commodities and financial instruments) are traded in units
known as contracts and do not have a tangible value since the underlying
commodity may not yet exist.

Getting to Know the Market 61
Unlike stocks, futures contracts are not issued but are formed when
one party buys a contract (takes a long position) from another party who
sells a contract (takes a short position). The number of contracts that
traders are long must equal the number of contracts that traders are short.
Futures trading always takes place through the exchange, and the exchange
becomes the counterparty for all trades.
Futures are traded on many different exchanges with each exchange
typically specializing in a particular type of commodity. The two primary fu-
tures exchanges are the Chicago Mercantile Exchange Group (CME Group)
and the New York Mercantile Exchange (NYMEX). The CME Group con-
centrates primarily on agricultural products, interest rates, and financial fu-
tures, while the NYMEX specializes in petroleum products and metals. It
should be noted that the CME Group is the result of the recent merger
between the Chicago Mercantile Exchange (CME) and the Chicago Board
of Trade (CBOT).
While a bit more complex than the stock market, it is important to
understand the dynamics of futures markets because they provide many
unique opportunities for short-term trading. Futures contracts state the
price that will be paid on a date in the future, known as the contract
month and year, in which the contract is set to expire (usually the third
Friday of the expiration month). No more trading can occur after the
expiration date, and the contract will be settled. At this point, plans are
made for delivery of the commodity or a cash settlement. Since futures
trades are always projected forward there may be multiple contracts for
the same commodity or instrument being traded simultaneously but with
different contract months. Typically, it is the closest contract month that
has the greatest liquidity and is most actively traded. In addition, some
futures will have a rollover date in which the liquidity switches from one
contact to another. Traders must use the correct futures symbols, as shown

62 Make Money Trading
FIGURE 3.9
Futures symbols must include the futures trading instrument symbol, the contract month, and the contract year.
FIGURE 3.10
A decoder for futures contract months.

Getting to Know the Market 63
in Figure 3.9, as the contract month and year will periodically change. A
symbol that defines a specific futures contract has three parts: the instru-
ment symbol (typically a two to four letter and/or number combination),
the contract month (a special one-letter code), and the contract year (the
last two digits of the year). Figure 3.10 shows the letter code for each fu-
tures month.
Similar to stock market trading, futures have a bid and an ask price.
These values do not represent the amount of money that you must
pay, rather a value that is relative to the commodity or financial prod-
uct that is being traded. While the minimum price fluctuation of stocks
is typically $.01, futures contracts use ticks to represent the minimum
price movements, and this value will differ for each commodity or finan-
cial instrument.
The market depth for futures is typically displayed as a price ladder
instead of the Level 2 screen used to analyze stocks, and is shown in Figure
3.11. This price ladder displays the current price, bid, ask, and market depth
as a series of vertical cells. In this case, the last price appears in black with
the size to the left of the price, and shows that one contract sold for 1421.50,
with 237 contracts at the inside bid of 1421.50 and 80 contracts at the inside
ask at 1421.75. This type of display may also be used to enter orders or man-
age trades and is described in detail in Chapter 6—Placing Trades.
Similar to ETFs, all futures contracts can be instantly shorted and,
as mentioned above, every long position must be matched with a short.
Possibly the biggest advantage for trading futures, however, is the amount
of leverage that a trader has access to. Unlike stocks and ETFs, futures
traders do not need to front all of the money for the futures contact that
they are buying or selling. Therefore, the margin (borrowing) requirements
in a futures account is significantly less and allows futures traders to use
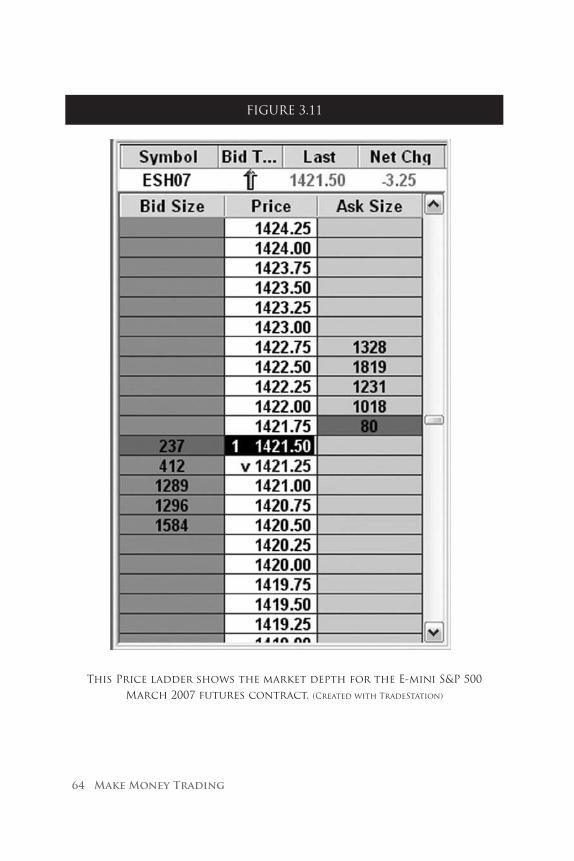
64 Make Money Trading
FIGURE 3.11
This Price ladder shows the market depth for the E-mini S&P 500 March 2007 futures contract. (Created with TradeStation)

Getting to Know the Market 65
large amounts of leverage. Although over leveraging is something to be
avoided, responsibly used leverage can allow futures traders to generate
greater profit using less initial capital (but keep in mind this can also gen-
erate greater losses).
Stock Index FuturesAlthough the futures markets began primarily as a means to sell com-
modities, the first stock index futures contract began trading in 1982.
Since its inception, stock index futures have taken off to become some
of the most actively traded instruments in the world. There are currently
full-sized futures contracts based on seven major indices, with the largest
being on the S&P 500. Much like ETFs, stock index future contracts allow
traders to buy and sell the strength of an entire cash index without having
to own every individual stock.
Stock index futures tend to track closely the cash indices on which
they are based, but with slight deviation. This deviation between the fu-
tures and cash indices is known as the premium and often occurs when
trader sentiment is bullish or bearish. As traders develop a positive bias
and expect higher stock prices, they will buy index futures, pushing the
futures price above the cash index, or at a premium. As traders anticipate
lower stock prices, the opposite will occur, bringing the futures price be-
low the cash index.
While stock index futures trade in much the same manner as any
other futures contact, they must be settled in cash (since they are not
based on an actual commodity). Unlike traditional futures contracts, stock
index futures trade both during daytime exchange trading hours and after
hours on electronic networks. Each stock index future trades on a multiple
of the underlying cash index and has a particular tick value. A full-sized
S&P 500 stock index futures contract, for instance, trades at a multiple of

66 Make Money Trading
$250 times the index with a minimum tick size of .10, with each full point
being valued at $250. If a trader bought a full-sized S&P contract and its
value increased by two points, he or she could sell the contract for a $500
profit (less commissions).
E-mini Index FuturesLaunched in 1997, the E-mini index futures are the smaller cousins
of the full-sized stock index futures and trade around-the-clock on all-
electronic networks. These extremely liquid trading instruments are much
more affordable to smaller investors and traders than the full-sized stock
index futures contracts. The E-mini S&P 500 futures contract, for instance,
is one-fifth the size of the full-sized S&P 500 futures contract, and has a
multiplier of $50 times the index, with each point being valued at $50.
Symbol Description
Index ETF
is Based on Size
Months
Traded
Minimum
Fluctuation
Average
Trading
Volume*
(contracts)
ESE-mini S&P
500S&P 500
$50 x
IndexH, M, U, Z .25 = $12.50 1,004,120
NQE-mini
Nasdaq 100Nasdaq 100
$20 x
IndexH, M, U, Z .5 = $10.00 281,339
ER2
E-mini Rus-
sell 2000
Index
Russell
2000
$100 x
IndexH, M, U, Z .1 = $10.00 164,795
YM
mini-sized
Dow
Futures ($5)
Dow Jones
Industrial
$5 x
IndexH, M, U, Z 1 = $5.00 101,130
Specifications for E-mini Futures Contracts.
FIGURE 3.12

Getting to Know the Market 67
E-minis have become the primary market for many active traders,
especially day traders. They offer some distinct advantages over both in-
dividual stocks and ETFs. One major advantage is that the all-electronic
trading networks provide transparency in the markets as well as a fast
and reliable method of placing trades. Transparency means that traders
can see exactly which market participants are buying or selling. Since we
are somewhat at a disadvantage when trading on exchanges where there
are live auctions taking place (and we are not physically on the trading
floor), electronic markets level the playing field by offering all participants
an equal advantage. Another important benefit to trading the E-mini fu-
tures is that the volatility of this market creates excellent potential for
profit, while maintaining very tight bid-ask spreads (usually around 1 tick).
Figure 3.12 shows the specifications for four of the major financial
E-mini contracts.
The Forex Markets
Foreign ExchangeForeign exchange (forex or FX for short) is another instrument that
is popular among today’s traders, and is the largest, most liquid finan-
cial market in the world. It is the arena where one nation’s currency is
exchanged for another’s. Although currency in some form or another
has been around since recorded history, the basis for the forex market
may have started in 1875 with the creation of the gold standard mon-
etary system. The idea behind the gold standard was for governments
to guarantee the conversion of currency into a specific amount of gold,
and vice versa. Essentially, a currency would be backed by gold. During
the late nineteenth century, all the major economic countries had estab-

68 Make Money Trading
lished an amount of currency that would be equivalent to an ounce of
gold. Eventually, the difference in price between two currencies for an
ounce of gold became the exchange rate for those two currencies. This
signified the first standardized method of currency exchange in history.
Today, currencies need to be exchanged to conduct business and foreign
trade. Import/export businesses could not operate without exchanging
currencies; individuals who travel internationally must exchange curren-
cies to pay for things in different countries. The global need for currency
exchange, the advent of online trading and the ever-increasing level of
sophistication in trading technology have all contributed to the growth of
the forex markets in recent years.
One of the biggest attractions to forex trading is its stability. With
the equivalent of about $1.9 trillion in transactions daily, it is virtually
impossible for the forex markets to get pushed around, even by the big
players. There is simply so much market depth that one institution would
have a difficult time creating a serious impact on the market. For traders,
that means that some of the whipsaws characteristic of lesser-traded instru-
ments are not typical in the forex arena.
Another benefit in forex trading is its round-the-clock availability and
liquidity. Unlike stocks and futures, the forex market has no physical
location and no central exchange, allowing it to operate 24 hours a day.
Since forex is a popular trading instrument around the world, it remains
active throughout most of the day. As US markets close, other markets in
the world open, allowing liquidity nearly 24 hours a day. Traders who are
unable to trade during US market hours still have access to liquid instru-
ments after hours with forex.
In addition to its stability and round-the-clock availability, forex is
intriguing to individual investors due to its ultra-high leverage. Traders can
enter large positions with practically nothing in their trading accounts. For

Getting to Know the Market 69
example, traders with $1,000 in their accounts can control a position of
$100,000, referred to as having 100:1 leverage. Since daily currency fluctua-
tions in forex are quite small, this leverage is used to amplify the value
of potential price moves. As with any leverage or margin, caution should
be used.
Forex is always traded in currency pairs. When a currency is quoted,
it is done in relation to another currency. The value of one currency is
reflected through the value of another. For example, if you want to know
the exchange rate between the Euro (EUR) and the US dollar (USD), the
quote would be:
EUR/USD = 1.3232
The currency on the left (EUR, in this case) is the base currency; the
currency on the right (USD, in this case) is called the quote or coun-
ter currency. The value of the base currency is always one unit, and the
quoted currency is what that one unit equals in the other currency. In
our example:
1 EURO = 1.3232 US dollars
FIGURE 3.13
The four “Majors” illustrate typical bid-ask spreads in forex trading.

70 Make Money Trading
As with most other trading, there is a bid and an ask price in forex.
These are in relation to the base currency. When buying (going long) a cur-
rency pair, the ask price refers to the amount of quoted currency required
to buy one base unit. When selling (going short) a currency pair, the bid
price refers to how much of the quoted currency will be obtained when
selling one unit of the base currency. The difference between the bid and
the ask (the bid-ask spread) is measured in pips (which stands for percent-
age in point). Forex is typically advertised as “commission free” trading
and this spread is where your broker makes a commission (transaction fee).
Figure 3.13 shows an example of a forex quote screen, and illustrates the
bid-ask spreads typical to the forex markets.
Every forex instrument has its own pip value and a corresponding
dollar value for each pip. We can see from Figure 3.14 that when trading
the EUR/USD currency pair, the minimum change in price (or pip value)
Symbol Description Terminology
Exchange Rate
(as of 1/2/07)
Pip Value
(basis point)
Dollar Value
of Pip*
EUR/USD Euro and US
Dollar
Euro 1.3232 0.0001 $1.00
USD/JPY US Dollar and
Japanese Yen
Dollar-Yen 118.59 0.01 $0.84
GBP/USD British Pound
and US Dollar
Sterling 1.9649 0.0001 $1.00
USD/CHF US Dollar and
Swiss Franc
Dollar-Swiss 1.2148 0.0001 $0.82
* Based on 10,000 unit contract tradeSpecifications for the “Majors” in the forex arena.
FIGURE 3.14

Getting to Know the Market 71
is 0.0001, with each pip valued at $1.00 (based on a 10,000 unit contract
trade). In other words, a one pip change in value is equivalent to a $1.00
change in price value with this particular contract.
The vast majority of forex trading involves the four “Majors”:
• EUR/USD(EuroandUSdollar)
• USD/JPY(USdollarandJapaneseyen)
• GBP/USD(BritishpoundandUSdollar)
• USD/CHF(USdollarandSwissFranc)
Forex can be traded on the spot market or the futures market. The
spot market is the most popular, since it is the underlying asset for the
futures market. When people refer to the forex market, they usually are
referring to the spot market.
Symbol Description
Currency Pair Contract is Based on Trading Unit
Months Traded
Minimum Fluctuation
ED EuroFX Futures
EUR/USD 125,000 Euro H, M, U, Z .0001 = $12.50
JY Japanese Yen Futures
USD/JPY 12,500,000 Japanese Yen
H, M, U, Z .000001 = $12.50
BP British Pound Futures
GBP/USD 62,500 British Pounds
H, M, U, Z .0002 = $12.50
SF Swiss Franc Futures
USD/CHF 125,000 Swiss Francs
H, M, U, Z .0001 = $12.50
Specifications for four of the most popular forex futures markets.
FIGURE 3.15
72 Make Money Trading
In contrast to the spot market, the futures market does not trade
actual currencies. Instead, it deals in contracts that are traded based on a
standard size and settlement date in public commodities markets, such as
the Chicago Mercantile Exchange Group. Similar to other futures markets,
forex futures contracts have specifications such as the contract trading
unit, delivery and settlement dates, and minimum price fluctuations, as
shown in Figure 3.15.

Chapter 4The Tools of the Trade
Technology as a ToolThroughout this book, we emphasize the two keys to building a suc-
cessful trading plan: taking a business-like approach to trading and ef-
fectively employing technology. Electronic trading has been around for
a while, but the tools that are available to modern traders are constantly
improving and evolving. This provides traders with faster access to infor-
mation, more methods of analyzing data, and powerful software that as-
sists in actual trading. Using outdated technology puts a trader at a severe
disadvantage; however, old school trading methods (those that are tried
and trued) can still be effective, especially when enhanced with current
technology. Keep in mind that trading is a competition, and you had bet-
ter believe that other traders are using top-of the line computers with the
fastest internet connections possible, reliable online brokers, and powerful
trading software. As with any business, becoming competitive means keep-
ing up with technology.

74 Make Money Trading
It wasn’t long ago that traders would have to pick up the phone and
call their brokers just to make a simple trade. They would then wait while
the broker called the order into one of the floor traders who were physi-
cally at the exchange that could buy or sell the order. As you can imagine,
trading this way was much more time consuming, and in fast moving
markets, trades could move away from your entry criteria long before the
order was even placed. Fortunately, trading in the 21st century has become
much more efficient. Faster computers, high-speed Internet, all-electronic
markets, and direct access trading have all helped the independent retail
trader. Additional technologies, such as trade automation, innovative mar-
ket research tools, and the ability to quickly test trading systems on histori-
cal data, have given us even more powerful tools to work with. Technology
is a definite edge in today’s trading world.
FIGURE 4.1
A monitor array from tradingcomputers.com
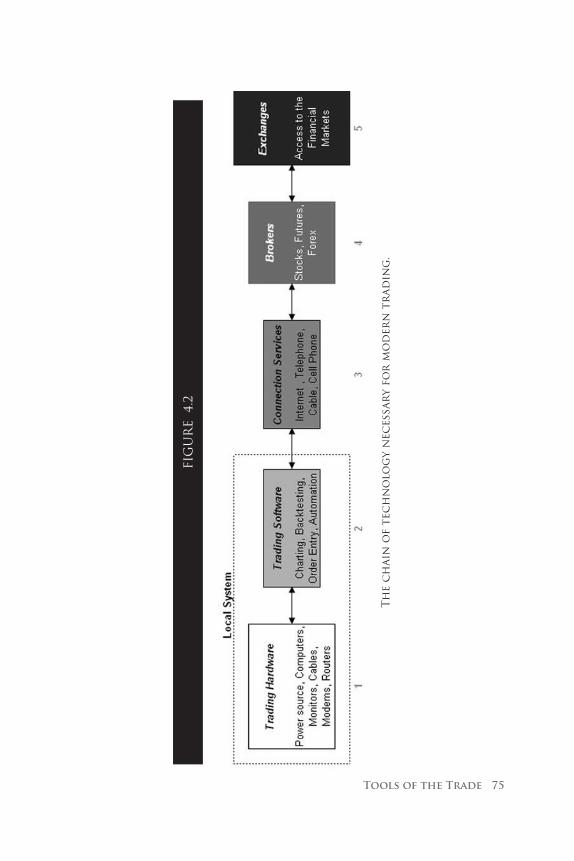
Tools of the Trade 75
FIG
UR
E 4
.2
Th
e c
hai
n o
f te
ch
no
log
y n
eces
sar
y fo
r m
od
ern
tr
adin
g.

76 Make Money Trading
Technology, nevertheless, is another area that can introduce signifi-
cant risk to a trading plan. When technology fails or we use it incorrectly,
we lose money. Imagine being in a trade and losing your Internet connec-
tion, having a software conflict, or getting the dreaded “blue screen” while
your computer seizes. Although these situations may occur at some point,
we want to be prepared and minimize the chances of losing money due
to technology failures. Figure 4.2 shows the technology chain that is typi-
cally used in trading. This can be a helpful troubleshooting reference, as
we should always begin at the left side of the chain and troubleshoot our
way to the right. Each of the five priority levels is critically important since
they each affect the higher priorities down the line. In addition, as we
move along these five levels, the complexity of troubleshooting increases.
Since trading is all about controlling risk, reliability is the key word when
choosing and setting up our trading tools.
For most of us, trading technology can be overwhelming at first and
can require a steep learning curve. In this chapter we describe why these
tools are important, and we hope to take some of the mystery away from
deciding which tools to use. Each link in the technological chain, whether
it is a computer, a data feed, or a piece of software, calls for a high level of
understanding and awareness in order for it to become an effective tool.
You should give yourself adequate time to learn and understand each piece
of technology in your trading arsenal. Most of us do not enjoy spending
hours reading detailed user manuals or waiting on hold for technical sup-
port, but it is a reality of the business. We must first master the technology
of trading before it can become an effective tool. During the process, keep
reminding yourself that, “Technology is your edge.”
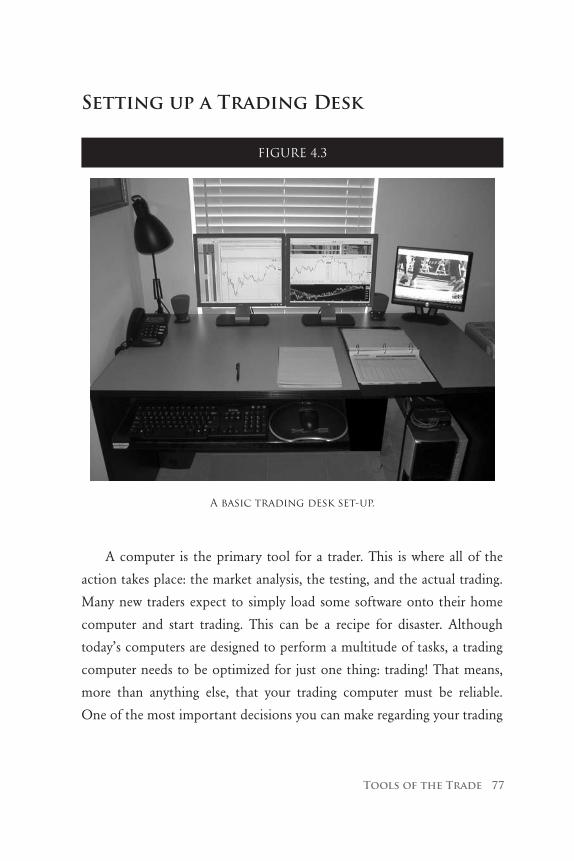
Tools of the Trade 77
Setting up a Trading Desk
A computer is the primary tool for a trader. This is where all of the
action takes place: the market analysis, the testing, and the actual trading.
Many new traders expect to simply load some software onto their home
computer and start trading. This can be a recipe for disaster. Although
today’s computers are designed to perform a multitude of tasks, a trading
computer needs to be optimized for just one thing: trading! That means,
more than anything else, that your trading computer must be reliable.
One of the most important decisions you can make regarding your trading
FIGURE 4.3
A basic trading desk set-up.

78 Make Money Trading
computer is to plan to use it just for trading. This should not be a family
computer, nor should it have any unnecessary programs running on it.
This is a business machine that should stay pure, fast, and healthy.
A trading computer does not need to be a high-end gaming computer
(nor should it be). It should be a dependable, multi-core PC with a high-
speed Internet connection, capable of running multiple applications and
able to support multiple monitors. Although Macintosh computers are
reputable and very reliable machines that are less prone to virus attacks,
there is currently very little trading software and support available for
them. The machine of choice for trading is the PC.
As with any recommendation having to do with computers or software,
traders should look for the fastest processor and the maximum amount
of memory they can afford. Traders should expect to spend about $1,500
- $3,000 on a trading computer (including monitors). Since computer tech-
nology evolves so quickly, we will only give general computer recommen-
dations in an attempt to not outdate this book before it goes to print.
Trading computer recommendations:
• IBMcompatiblePCwithamulti-coreprocessor
• AsmuchRandomAccessMemory(RAM)asthecomputer will hold
• Videocardcapableofhandlingatleasttwomonitors
• MostcurrentWindows-basedoperatingsystem
• UpdatedAntivirussoftware
• UpdatedSpyware/Adwaredetectionsoftware
• UninterruptiblePowerSupply(UPS)Backup
• Atleasttwoflatscreenmonitors(17to21inch)

Tools of the Trade 79
• High-speedInternetconnection(DSLorCable)
• NowirelessconnectionssuchasInternet,keyboard,ormouse
• Absolutelynonon-essentialsoftwareordatasuchasgames,vid-eos, or music
Traders should use at least two monitors for trading: one for charts,
and one for order execution. This type of a setup allows a trader to watch
both active trades and market action without having to switch back and
forth between windows. An example of electronic trading workspaces, or
screens, can be seen in Figure 4.4. Setting up efficient workspaces allows
for a higher level of situational market awareness. You may need more
monitors depending on your trading style or how many charts you plan
to analyze. Some professional traders like to have one monitor for each
instrument that they trade, as well one for order entry. Multiple monitors
FIGURE 4.4
A visual description of multiple trading workspaces. A software example of these screens can be seen in Figures 4.5 and 4.7.

80 Make Money Trading
require special video cards that accommodate multiple displays. For a
basic trading computer, a video card should support a minimum of two
monitors; others may be added to the computer later on.
You will also need a high-speed Internet connection. DSL and cable
are great options as they are typically fast and reliable. Satellite connec-
tions are not good for trading since they often have a lag time (as much
as 20 seconds), and can be unreliable during bad weather. Dial-up con-
nections are quite scary for a trader due to the possibility of slow fills and
spotty charting from the slower connection speeds. Many traders choose
to have both a primary Internet source and a back-up source.
Traders should avoid any wireless connections, as this will add another
link in the technology chain that can fail. Wireless Internet, keyboards,
speakers, or any other peripheral that is not hardwired into your computer
should be avoided. Remember, reliability, speed, and accuracy are the key
features of our trading technology.
Trading desks should always have a telephone with each broker’s
phone number programmed into the speed dial in case of a computer/
software failure or lost Internet connection. Additionally, the primary
phone at a trading desk should not be cordless, but connected directly
to a phone jack. A cell phone is an important back up as sometimes the
reason an Internet connection is lost is the same reason your phone line is
dead. It is no fun to have to look for a phone to borrow when you need
to exit a trade.
It is important to have a back-up battery for your computer—an unin-
terruptible power supply or UPS. You should have one that is big enough
to grow with your trading business and can run your essential equipment
long enough to close out any trades. Think about how long you will want/
need to keep your computer running if you lose power, and shop for your
UPS based on this, as well as the number of inputs you will need.

Tools of the Trade 81
Many traders like to have a television close to their desks with fi-
nancial news. This allows traders to keep abreast of any reports or news
that may create short-term moves in the market. While it is not recom-
mended to base any trading decisions on news events, most institutions,
exchanges, and brokerage houses, have a monitor with CNBC playing in
the background.
It is a good idea to understand your whole computer set-up before
you begin trading. You should know how to reboot your computer, re-
connect your Internet, and check your network connections. It is also
important to perform routine maintenance on your computer, including
the removal of unnecessary files, defragmenting the hard drive, and install-
ing regular system updates. Later in the book, we will talk about creating
a troubleshooting guide and trading binder for your trading desk (Chapter
9—Live Trading).
Purchasing/Leasing Trading SoftwareThe sheer amount of trading software on the market today is over-
whelming. Each claims to do something a little different that will provide
you with a unique edge, leading to higher profits. Most software compa-
nies offer a free demonstration or a free trial offer to persuade you to use
their products. Just trying out all of the software options available could
take well over a year. There are also great differences in price between
trading software packages, ranging from free to over $10,000. You might
be asking yourself, “What exactly can all this software do?” Let’s start by
focusing on what we absolutely need in trading software.
The first thing we need is a market analysis platform that has the abil-
ity to create price charts and display price quotes (shown in Figure 4.5).

82 Make Money Trading
For traders, charts are the windows to the world. These charts allow us
to see the market action graphically and are what we use to make trading
decisions. Market analysis platforms require a data feed into the market
that allows access to current information (typically, in less than a second).
This type of software permits traders to view the live trading that is occur-
ring during active market hours. It is critically important that the data is
accurate, as this will be our primary means of making trading decisions.
Market analysis platforms typically come in two different varieties
depending on your style of trading. These include end-of-day (EOD), or
FIGURE 4.5
A professional market analysis platform allows traders to see the price action as it occurs. (Created with TradeStation)

Tools of the Trade 83
delayed data versions, which are geared toward longer-term or position
traders who do not require constantly updating data. Shorter-term swing
and day traders, however, require real-time data versions (often referred to
as the professional version) that will instantly update as conditions change
in the market. Traders should look for a market analysis platform that of-
fers the ability to apply technical indicators to their charts, as well as the
capability to create custom indicators and studies (these are discussed in
Chapter 5—Charting the Market).
The next piece of software that is important in developing a trading
plan is a backtesting application. This type of software applies trading
systems to historical market conditions and calculates performance char-
acteristics. This type of functionality is often included in a market analysis
package and does not require additional software for this task. Testing a
trading plan on historical data could be accomplished manually by scroll-
ing back through historic price charts and writing down each possible
trade entry and exit; however, using a backtesting application makes this
process much more efficient and accurate. This type of software (seen in
Figure 4.6) often requires some programming on the part of the user in
order to describe the rules of the trading system. Once programmed, the
software applies the rules to the market(s) and charting intervals that the
user specifies, and automatically calculates the performance results. This
software also requires a data feed to provide accurate historical market
data. Backtesting applications are an essential component in the design
and evaluation of a successful trading plan.
An additional feature that is often available with backtesting software
is the ability to automate a system based on the rules developed through
backtesting (described in Chapter 6—Placing Trades and Chapter 9—
Live Trading).
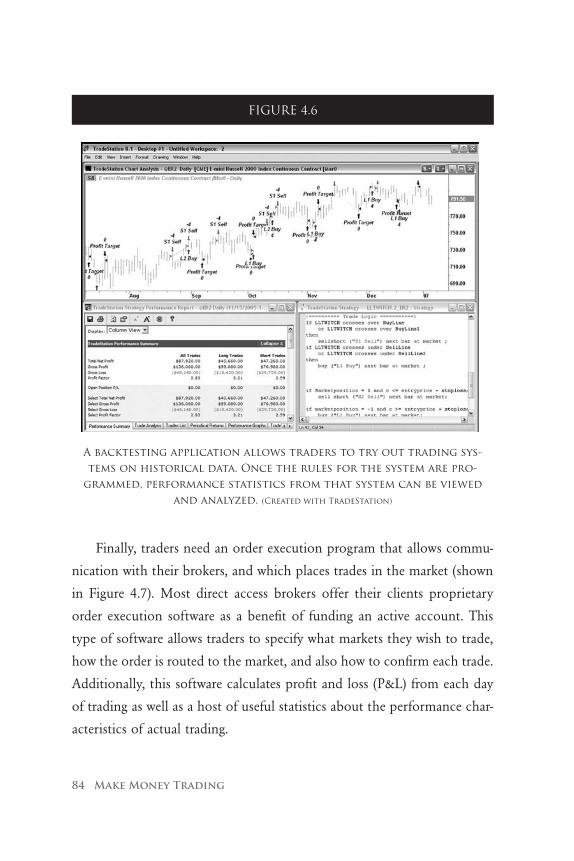
84 Make Money Trading
Finally, traders need an order execution program that allows commu-
nication with their brokers, and which places trades in the market (shown
in Figure 4.7). Most direct access brokers offer their clients proprietary
order execution software as a benefit of funding an active account. This
type of software allows traders to specify what markets they wish to trade,
how the order is routed to the market, and also how to confirm each trade.
Additionally, this software calculates profit and loss (P&L) from each day
of trading as well as a host of useful statistics about the performance char-
acteristics of actual trading.
FIGURE 4.6
A backtesting application allows traders to try out trading sys-tems on historical data. Once the rules for the system are pro-
grammed, performance statistics from that system can be viewed and analyzed. (Created with TradeStation)

Tools of the Trade 85
Order execution software should be easy to use but may require some
time to gain familiarity with it. For this reason, many brokers offer a trade
simulator that allows traders to practice trading with a demo account. It is
important to feel comfortable with your order entry software before begin-
ning live trading, as this will become the direct trading tool.
Most high-end trading software packages offer an element of pro-
grammability that permits traders to customize their indicators, studies,
or strategies to meet specific trading needs. This often requires becoming
familiar with the programming language of the trading platform. While
most of us do not consider ourselves programmers (nor do we all wish to
be), learning the basics can be a very helpful skill. Custom indicators and
strategies can be purchased, or they can be programmed for you, typically
at a rate of $75.00 - $100.00 per hour. Knowing how to do at least basic
FIGURE 4.7
Order execution software allows traders to quickly and efficiently buy and sell stocks, futures, or forex.
(Created with TradeStation)

86 Make Money Trading
programming, however, is a helpful skill and one that is worth the effort
in learning.
Market analysis, back testing, and order execution programs are es-
sential; however, additional software exists for other trading specific tasks,
such as pre-designed trading systems, custom indicators, trade automation
(discussed in Chapter 9—Live Trading), and portfolio analysis. You can
think of each individual program as a different tool for your trading tool-
box. Each tool takes time to learn, and it is best to first develop a specific
need for a tool, instead of purchasing it first and then trying to invent a
reason to use it. Keep in mind that no one is going to sell you a magic
program that will turn you into a great trader. You are not going to build
a mansion just because you bought a $10,000 hammer; you have to first
study carpentry and then learn how to use a host of other complementary
and important tools.
When deciding on your essential programs, you should focus on reli-
ability, accuracy, and speed. Having a fast data feed is useless unless you
are getting accurate data. Similarly, using bad data in historical testing can
give you false results when evaluating an overall system.
While some trading software is sold as a complete package, most is
leased on a monthly basis. Additionally, it is important to maintain a re-
lationship with the software vendor, as there are often essential upgrades
(or newer builds) that are necessary to maintain its greatest functionality.
It should be noted that since trading software requires an active data feed
to the markets, this will add a regular expense to a trading business. Typi-
cally, traders should plan to spend about $100 - $200 a month for reliable
software and data subscriptions.
While some software packages offer specific functions, more and more
are using an integrated approach and are offering all of the necessary

Tools of the Trade 87
features in one package. Some brokerages even incorporate market analy-
sis, back testing, order execution, and automation for their clients, all in
one package.
Below is a list of software companies providing market analysis and
backtesting packages:
TradeStation www.tradestation.com
NinjaTrader www.ninjatrader.com
Tradecision www.tradecision.com
eSignal www.esignal.com
Qcharts www.qcharts.com
MetaStock www.metastock.com
Strategy Center www.cybertrader.com
RealTick www.realtick.com
Sierra Chart www.sierrachart.com
Choosing a BrokerBrokers are an essential partner in the trading business and allow us to
interact with the markets. As retail traders, we cannot buy or sell directly
at the exchanges, and must look to a broker to act as an intermediary,
allowing us to trade stocks, futures, or forex. Brokers charge a fee, known
as a commission, to execute trades on our behalf. Since the accuracy of
trade executions and the cost of commissions directly affect our business,
choosing the right broker is an important decision. As with any compo-
nent in the chain of trading technology, reliability and accuracy are the
most important factors.

88 Make Money Trading
Stock, futures, and forex brokers are abundant, and you will need to
do some research before choosing one. Several trading magazines pub-
lish yearly broker guides that offer helpful information. It is a good
idea to call a prospective broker and get a feel for the type of customer
service you can expect to receive. Things to consider when choosing a
broker include:
• Dotheyservicemarkets thatyouwant to trade (i.e. stocks, fu-tures, or forex)?
• Howefficientistheircustomerservice?
• Whataretheirholdtimeswhencalling?
• Whataretheircommissionsandfees,including“hidden charges”?
• Doyouneedthemtoprovideadatafeed?
• Dotheyprovidetheirownorderexecutionsoftware,andis there a platform fee?
• Dotheyprovideasimulatortogainfamiliaritywith their software?
• Howdotheyhandleorderexecution?
• Whataretheirmarginrequirements?(Discussedlaterin
this chapter)
Brokers come in three different varieties: full service, online, and di-
rect access:
Full Service BrokersFull service brokers offer a variety of services in addition to market
access. These services include research and advice that may include trading

Tools of the Trade 89
recommendations, retirement planning, or tax tips. In exchange for their
services, full service brokers will charge a substantial commission. These
include the traditional, well-known brokers such as Merrill Lynch, Smith
Barney, or Charles Schwab. Buying or selling through a traditional full
service broker usually means calling them over the phone, and is more
appropriate for investing rather than trading.
Over the past few years, however, a new type of full service broker
has developed which allows for trader-assist system trading. Trader-assist
system trading is an alternative form of investing that allows traders to
purchase or lease commercial trading systems that are traded and moni-
tored by the broker. These systems can range in style from day to position
trading, and once traders agree to the terms of the system, they are in for
the ride. Much like traditional full service brokers, these brokers (who may
also be money managers) offer research tools and statistics to help traders
select a system or portfolio of trading systems. These full-service trader-as-
sist system brokers include:
Robbins Trading Company www.robbinstrading.com
Attain Capital Management www.attaincapital.com
Daniels Trading www.danielstrading.com
Online BrokersOnline brokers have become increasingly popular with self-directed
investors and active traders. Online brokers offer access to the markets
via the Internet and charge significantly smaller commissions than do full
service brokers. Online brokers typically offer only stock/ETF trading and
do not offer advisory services, but may include online or software research
tools for their clients. Online trades are executed at much greater speeds

90 Make Money Trading
than a full service broker, with some even advertising trade executions as
fast as a few seconds. While these brokers offer more reasonable commis-
sion pricing and trade execution speeds than full service brokers, they are
still not the primary brokers for short-term active traders, including day
traders. Online brokers do not offer the fastest connection to the markets,
their commission pricing is usually not scalable to position sizes (on-
line brokers usually charge a fixed rate for commission, regardless of the
amount of shares or contracts), and very few online brokers offer access to
the futures and forex markets. Popular online brokers include:
TD Ameritrade www.tdameritrade.com
E*Trade www.etrade.com
Scottrade www.scottrade.com
Fidelity Investments www.fidelity.com
Direct Access BrokersDirect access brokers allow clients to trade directly with a stock or fu-
tures exchange. This is the broker of choice for active traders who want to
focus on speed and order execution. This type of broker may offer stock,
futures, and forex access and will not provide research or advisory services,
except for a data feed that provides instant price quotes. Direct access bro-
kers offer low commission rates that are based on the amount of trading
volume (amount of shares or contracts traded over a time period). These
brokers offer some type of order execution software that allows clients to
instantly place trades in the market. Some order entry software includes
an application program interface, or API, that allows charting or front-end
software to be programmed to place or manage trades automatically (this
is discussed in Chapter 9—Live Trading).

Tools of the Trade 91
Using a direct access broker requires learning how to use their soft-
ware and knowing the specific type of orders that are available. Trading
with a direct access broker is serious business and should be approached
in that manner. Below is a list of a several direct access stock, futures and
forex brokers along with their web addresses:
TradeStation Securities www.tradestation.com
MB Trading www.mbtrading.com
Mirus Futures www.mirusfutures.com
PFG Direct www.pfgbest.com
Global Futures www.globalfutures.com
Interactive Brokers www.interactivebrokers.com
CyberTrader www.cybertrader.com
Forex Only Brokers:
Forex Capital Markets www.fxcm.com
Global Forex Trading www.gftforex.com
CMC Markets www.cmcmarkets.com
Setting Up a Trading AccountEstablishing a trading account is a decisive step in starting a trading
business. There are a few important concepts that new traders must under-
stand when opening a trading account. The first is that stocks, futures, and
forex trade differently and often require specific brokers. Make sure you
are using the correct broker for the type(s) of instruments that you will

92 Make Money Trading
be trading. In addition, traders who wish to day trade stocks or ETFs have
additional restrictions that require a higher minimum account balance to
be maintained (this is discussed later in this section).
Opening a trading account is a relatively easy task. This usually in-
volves filling out a variety of forms, providing your signature to indicate
that you acknowledge the risks of self-directed investing, and planning a
method of transferring money. Many brokers offer the ability to do this
electronically via their websites. Once funded, a trading account can be
approved and activated in as little as three business days.
Active traders should not open a cash account, but what is called a
margin account. Margin is essentially a loan that a broker gives you to-
wards purchasing stock shares, futures contracts, or foreign currency. The
concept of margin varies somewhat between stocks, futures, and forex be-
cause stock and forex trading requires purchasing a tangible entity (a part
of a company or a foreign currency) and futures trading involves buying
or selling a contract whose obligation will be met at an upcoming date.
Margin for stock or forex trading is defined as borrowed money, while
futures margin is considered an initial deposit, or an “earnest money”
deposit, required for entering into a contract. Margin can be a bit confus-
ing at first and should be fully understood before trading begins. Brokers
often have their own margin requirements in addition to the guidelines
that are already in place for the industry. For stock traders, the Federal
Reserve Board sets the minimum allowable margin requirements, known
as Regulation T or Reg T. Minimum margin requirements for futures con-
tracts are known as performance bonds and are set by the exchanges that
trade those instruments or commodities. Forex margin is established by
the individual brokerage. In addition, day trading has much different mar-
gin requirements than traditional overnight trading. Figure 4.8 shows the
important levels and terminology used to define margin requirements.

Tools of the Trade 93
Min
imum
Mar
gin
Initia
l Mar
gin
Mai
nten
ance
Mar
gin
Mar
gin
Cal
l
Bel
ow t
his
amou
nt,
brok
ers
cann
ot a
llow
any
tr
ades
on
mar
gin
Am
ount
tha
t tr
ader
s m
ust
pay
with
thei
r ow
n m
oney
Min
imum
am
ount
tha
t m
ust
be m
aint
aine
d in
a
mar
gin
acco
unt
Occ
urs
if th
e ac
coun
t fa
lls b
elow
the
mai
nte-
nanc
e m
argi
n am
ount
Stoc
ks (O
vern
ight
)$2
,000
(Reg
-T) M
argi
n R
ate:
2:1
50%
of th
e pu
rcha
se p
rice
(R
eg-T
)25
% o
f th
e to
tal m
arke
t va
lue
of a
ll st
ock
shar
es in
th
e ac
coun
t (R
eg-T
)
Trad
ers
mus
t de
posit
addi
tion
al m
oney
into
th
e ac
coun
t or
clo
se
existing
pos
itio
ns
Stoc
ks (Pa
tter
n D
ay
Trad
e)$2
5,00
0 (N
ASD
& N
YSE)
Mar
gin
Rat
e: 4
:125
% o
f th
e pu
rcha
se p
rice
(N
ASD
& N
YSE)
$25,
000
(NA
SD &
NYS
E)
Occ
urs
whe
neve
r ac
-co
unt
equi
ty fal
ls b
elow
$2
5,00
0
Futu
res
(Ove
rnig
ht)
Varies
by
brok
er in
itia
l ac
coun
t ba
lanc
e, t
ypic
ally
$5
,000
Varies
by
cont
ract
and
da
te. E
xam
ple:
E-M
ini
S&P
500
$3,5
00 p
er c
on-
trac
t (P
erfo
rman
ce B
ond)
Varies
by
cont
ract
and
dat
e.
Exa
mpl
e: E
-Min
i S&
P 50
0
$2,8
00 p
er c
ontr
act
(Per
-fo
rman
ce B
ond)
Trad
ers
mus
t de
posit
addi
tion
al m
oney
into
th
e ac
coun
t or
clo
se
existing
pos
itio
ns
Futu
res
(Int
rada
y)Va
ries
by
Bro
ker
Initia
l acc
ount
bal
ance
ty
pica
lly $
5,00
0
Varies
by
brok
er. E
xam
ple:
E-m
ini S
&P
500
$1,0
00 p
er
cont
ract
Varies
by
brok
er. E
xam
ple:
E-m
ini S
&P
500
$1,0
00 p
er
cont
ract
Trad
ers
mus
t de
posit
addi
tion
al m
oney
into
th
e ac
coun
t or
clo
se
existing
pos
itio
ns
Fore
xVa
ries
by
Bro
ker
Initia
l ac
coun
t ba
lanc
e ty
pi-
cally
$5,
000
Mar
gin
Rat
e:
100:
1
Mar
ket
pric
e /
mar
gin
rate
. Exa
mpl
e: E
UR/U
SD
(1.3
232
* 10
0,00
0 un
its)
/
100
mar
gin
rate
=
$1,3
23.2
0
Mar
ket
pric
e /
mar
gin
rate
. Exa
mpl
e: E
UR/U
SD
(1.3
232
* 10
0,00
0 un
its)
/
100
mar
gin
rate
=
$1,3
23.2
0
Trad
ers
mus
t de
posit
addi
tion
al m
oney
into
th
e ac
coun
t or
clo
se
existing
pos
itio
ns
Mar
gin
def
init
ion
s an
d r
equ
irem
ents
var
y fo
r s
toc
ks,
fu
tur
es a
nd
fo
rex
tr
adin
g.
FIG
UR
E 4.
8

94 Make Money Trading
A margin account is necessary for any type of short-term trading activ-
ity because a trade must be cleared before the transaction becomes official,
and that process can take several days. In the case of intraday trades, trad-
ers would have to fund the combined value of every transaction that they
make (not just profits or losses, but the complete value) for multiple days
in order to continue trading. This would be the retail equivalent of having
to buy an entire inventory every time we wanted to profit from the sale of
just one item. For this reason, brokers offer margin to provide the ability
to place multiple round turn trades while trades are still being cleared.
Round turn trades refers to the combination of trades that encompass
entering and exiting a position, returning to a neutral, or flat, position.
Another essential reason for margin is the ability to sell short. Sell-
ing short requires traders to begin a trade by borrowing shares of a stock
or futures contracts from a broker (using margin) and then selling them.
Traders must then buy back the stock or futures contracts (known as
buying to cover) when they wish to flatten or close out the trade. In this
way, traders can profit from falling prices as easily as they can from the
traditional buying and selling.
A third and important reason for margin is that it allows traders to
use leverage. Leverage allows us to buy more stock shares or futures con-
tracts than we could afford with the money in our trading account alone.
Brokers require a minimum amount of funds in an account, or minimum
margin, for traders to be able to use margin. A day trading margin rate for
stocks, for instance, is four times the account value. This would allow a
trader with a $30,000 trading account to buy $120,000 worth of stock (this
is also known as buying power). Futures intraday margin requirements for
E-mini contracts can be as small as $500 per futures contract, which would
allow a trader with a $30,000 trading account to buy up to 60 contracts.
When trading with this kind of leverage, a single point move on the E-

Tools of the Trade 95
mini S&P 500 Index would generate a $3,000 profit or loss. Forex brokers
typically offer a staggering 100:1 margin that would allow a trader with a
$30,000 account to buy up to $3,000,000 in foreign currency.
While leverage can be an important tool used to generate greater prof-
its, as previously stated it can also generate significant losses, and should
be used with extreme caution and consideration. Trading close to maxi-
mum margin rates is a recipe for disaster, as brokers will monitor the over-
all value of your account. If, for instance, traders elect to use substantial
margin and the underlying stock or futures contract moves against them
(loses value), they will be issued a margin call. A margin call is a demand
from your broker that you add more money to a trading account in order
to meet the minimum margin requirement. If this call is not met, the
broker will close out your position (without consulting you) in order to
ensure that you can pay back the margin.
The “pattern day trader” (PDT) designation was established in Sep-
tember 2001 by the NASDAQ and NYSE. Pattern day traders are those
traders who make four or more day trades within a consecutive five-day
period, where the number of day trades accounts for more than 6% of the
total trades taken during the time period. This classification requires stock
and ETF day traders to maintain minimum account equity of $25,000 at
the beginning of each trading day. In addition, if a margin call is issued
(referred to by many brokers as a daytrade call), a day trader has five busi-
ness days to deposit funds before their account is halted from any addi-
tional trading. The Securities and Exchange Commission, the government
agency that regulates the stock market, enforces these restrictions.
Using a margin account comes with a great responsibility, as traders
must know how much money is required at any given time to avoid a
margin call. Futures and forex accounts, in particular, allow for substantial
leverage and should be watched very carefully. Traders should never use

96 Make Money Trading
the maximum buying power that a broker will allow, as this could lead to
catastrophic losses. It is advised that newer traders begin trading without
significantly leveraging their accounts.
Chapter 5Charting the Market
Previous chapters in this book have explored the physical dynamics of
the market. This chapter will take a detailed look at what supply and
demand really look like in an active market. For traders, price charts offer
the most accurate view of market action and provide a means of making
objective trading decisions. Using high-performance charting techniques,
we can quickly spot market inefficiencies that can be exploited for a profit.
As traders, the faster we see these opportunities, the more potential there
is to make money and minimize losses.
This chapter will also introduce the concept of technical analysis,
which is a method of analyzing market movement based on past price and
volume activity. Technical analysis is a very important element in short-
term trading and trading plan development. We encourage you to spend

98 Make Money Trading
time researching this very important topic. It should also be noted that
while many traders implement only commonly used technical methodol-
ogy, having a slightly different and more innovative view of the markets
can give traders an edge. As we will see in Chapter 7—Developing a Trad-
ing Plan, thinking outside the box and using non-traditional methods of
technical analysis is a very important skill.
Chart Types
Bars and CandlesticksPrice charts simply provide a history of price and volume over a speci-
fied interval. This visual history of price action is only as useful as the data
that is used to create it. In other words, a charting platform must have ac-
curate and consistent data in order to provide traders with reliable charts.
Since price charts are the primary means of making trading decisions, they
must be dependable. Once data is received by a market analysis platform,
the prices can be displayed in a variety of charting methods. Price charts
are two-dimensional graphs that display price along the vertical axis, and
the charting interval along the horizontal axis. In order to have useful
price charts, an interval must be selected that reflects a snapshot of the
price fluctuations for a given period. For each interval, several data points
are recorded that include the price at which the interval began (Open),
the highest price during the interval (High), the lowest price during the
interval (Low), and the last price during the interval (Close). In addition,
the number of shares or contracts traded during the interval (Volume), and
the elapsed time for the interval (Time in minutes) are recorded.
The two most common ways to display price data are a bar chart and
a candlestick chart, as seen in Figure 5.1. Of these two charting methods,

Charting the Market 99
candlestick charts are the most useful to traders (and as such, we will usu-
ally refer to candle bars or candlestick charts when discussing charting
methods). Originally used in Japan by rice traders over a century ago,
candlestick charts are easy to understand and can give valuable informa-
tion about the direction of price. On a candlestick chart, a single candle
bar represents an individual interval. The thin, vertical line is called the
wick (or shadow) of the candle, and represents the highest and lowest
prices that occurred during the interval. The thicker part of the candle
is called the body and represents the opening and closing prices for that
candle bar. Candlesticks can be displayed on a chart in a variety of color
FIGURE 5.1
Candlestick and bar charts display price action over a given interval. (Created with TradeStation)

100 Make Money Trading
combinations, or as a single color with open or closed bars. The latter
method for displaying candle bars uses an outline of the body for up
candles (where the close is higher than the open), and a filled in body
for the down candles (where the close is lower than the open). When set-
ting up a candlestick chart, the candles should be big enough to identify
quickly and have a sharp contrast from the background of the chart.
Chart background colors are best kept neutral to allow good distinction
from the individual candle bars. White, gray or black are good colors for
chart backgrounds.
FIGURE 5.2
Some common candlestick patterns that form on price charts.

Charting the Market 101
Another advantage to using candlestick charts is the ability to easily
spot price patterns that may be indicative of a reversal or a weakening
trend. Patterns can be formed either by comparing the size of the body to
the wick on a single candlestick or by comparing several different candle-
stick bars. While candlestick patterns work great in hindsight (as do many
technical market theories), it is important to realize that when used alone,
they can be unreliable during real-time trading. This is because patterns
can change drastically during the formation of the current candlestick
bar. It is only after a candle bar has completely formed (and printed),
that a candlestick pattern can be confirmed. For instance, a pattern may
clearly form during the day on a daily chart, only to change by the end
of the day. This type of pattern recognition is best suited for end of the
day (EOD) technical analysis. Additionally, candlestick patterns work best
when combined with other technical tools or indicators. Figure 5.2 shows
several candlestick reversal patterns that occur regularly in just about every
market and interval.
Chart IntervalsChoosing a charting interval is an important factor in developing a
trading plan, as strategies are often built around a specific chart. In general,
bigger chart intervals will represent longer-term styles of trading and vice
versa for smaller chart intervals. Chart intervals can be monthly, weekly,
daily, or a variety of intraday timeframes. By far, the most common chart-
ing interval is the daily chart, where each bar or candlestick represents one
day of trading. While this is has become the standard interval, there are
many others that can be used in combination with a daily chart to gain a
more thorough view of the markets.
Figure 5.3 shows three different charts of the “cubes” (symbol:
QQQQ) where the shaded areas are magnified and shown in detail on the

102 Make Money Trading
next chart to the right. These three charts represent (from left to right)
daily, 30-minute and 5-minute chart intervals. While monthly, weekly, or
daily interval charts provide insight into the longer-term direction of the
market, it is also useful to monitor a variety of intraday charts as well.
Much like using a microscope with multiple lenses, traders may use the
broad magnifications to find possible trading opportunities, and then in-
crease the lens magnification to pinpoint high-probability trade entries. In
general, the more confirmation multiple charts provide for a price move,
FIGURE 5.3
These multiple interval charts for QQQQ provide a more detailed picture than can a single chart. The trading activity shaded in the left chart is expanded as the entire middle chart; the trading activ-ity shaded in the middle chart is expanded as the entire right chart.
(Created with TradeStation)

Charting the Market 103
the better the chance of a successful trade. Once in a trade, monitoring a
longer interval price chart can help traders stay in a trend longer and avoid
getting pushed out by short-term price fluctuations or pullbacks.
Intraday charts are particularly important to swing and day traders.
Intraday chart intervals can be either time- or data-based. Time-based price
charts are specified in minutes, such as 60-, 15- or 5-minute charts. This
type of chart prints a new bar or candlestick at the end of every time inter-
val. On a 5-minute chart, for instance, a candle bar will print at 9:35, 9:40,
9:45…and continue until the close of the market, regardless of the volume
or trading activity. Traders can select any minute interval for the charts,
and often a volume graph is added along the bottom of charts to show the
amount of trading activity that is contributing to a price move. Typically,
price moves that occur under higher volume tend to be more enduring.
During the past few years, as retail trading technology continues to
evolve, charting platforms and data providers have begun to offer new
types of intraday charting intervals. These new methods include the op-
tion of viewing price action from various data intervals instead of just
time. While many traders continue to use time-based charts in everyday
trading, tick and volume charts offer some unique advantages. Unlike
time-based charts, tick and volume charts close at the end of a specified
data interval, regardless of the time that has elapsed. Tick charts plot
prices for a specific number of transactions, while volume charts record
the prices for a specified number of contracts or shares traded. Tick and
volume charts often paint a more accurate picture of market action by
showing the effect that the number of transactions or the volume has on
price. This means that you can quickly determine the amount of trading
taking place just by glancing at a chart and noting the number of candle
bars during a particular time interval. As more candle bars print within a
set amount of time, it indicates an increase in volatility, as seen in Figure

104 Make Money Trading
5.4. Additionally, tick and volume charts can point out important price
patterns that time-based charts often miss.
When using tick or volume chart intervals, a countdown meter (some-
times referred to as a timer) should be used to display the number of ticks
or volume remaining in the current candle bar. A countdown meter acts
like a price display on a gas pump, and allows traders to judge the flow of
the market by the speed at which the price scrolls by. Since tick and vol-
FIGURE 5.4
This 233- tick chart of QQQQ shows two shaded areas, each repre-senting one hour of trading but with significantly more volume
during the opening hour than the lunch hour. The number on the right is a countdown meter that represents the number of transac-
tions remaining in the current bar. (Created with TradeStation)

Charting the Market 105
ume charts are not time-based, a candle bar could take just a few seconds
or several hours to print. Looking inside a bar using a countdown meter
allows a trader to gain instantaneous information about the condition of
the market. As the countdown meter progresses faster, this can be used to
gauge the immediate increase in market activity without having to wait for
several bars to print. Conversely, when the numbers on the countdown
meter advance slowly, or are not moving at all, it can help traders stay out
of a sluggish market. The EasyLanguage code for a countdown meter can
be found in Appendix B.
At this point, you might be wondering what intraday chart intervals
are the most useful. This is much like declaring your favorite color; it
will differ for everyone. For time-based intraday charts, common minute
intervals include:
1, 3, 5, 10, 15, 30, 60 and 120 – minute intervals
For data-based intervals where there is practically an unlimited number
of options, Fibonacci numbers can be used to establish rough guidelines
for tick and volume intervals. Fibonacci numbers are a series of numbers
that begin with zero and one, and are calculated by adding the two most
recent numbers to get the next:
0, 1, 1, 2, 3, 5, 8, 13, 21, 34, 55, 89, 144, 233, 377, 610, 987, 1597, 2584…
Originally described by Leonardo of Pisa (otherwise known as Fibo-
nacci) in 1200, Fibonacci numbers and ratios appear frequently in nature,
geometry, and statistics. Most importantly, traders love them and find uses

106 Make Money Trading
for these numbers whenever possible. Whether or not they accurately de-
scribe or predict the behavior of the markets, they provide a good statisti-
cal relationship on which to base a tick or volume interval. Traders should
try to find intervals that accurately portray the intraday dynamics of their
chosen markets. Additionally, instruments that trade at significantly differ-
ent volumes may require different chart intervals.
Support and ResistanceNow that we have described some methods of viewing price action us-
ing charts, we will look at techniques for determining what price might do
next. This is where it starts to get fun! The fundamental concept behind
this type of technical analysis is support and resistance. Support can be
thought of as a floor under trading prices, while resistance is the ceiling.
As prices move outside of these levels it is much like climbing onto the
roof of a house, and what was once resistance (the ceiling) now becomes
support (the roof). Prices often will hover around these areas (known as
consolidation) before moving up or down to the next level. These levels
of support and resistance occur on every chart interval with larger chart
intervals having the most significance. Figure 5.5 illustrates how price re-
sistance can often become support.
This concept is important in developing high probability trading
plans. Once traders can pinpoint an area of support or resistance, it pro-
vides valuable potential trade entry or exit points. Regardless of trading
methodology, these trade entry or exit points can provide relatively low
risk trades with a positive +R advantage. This is because as price reaches
a point of support or resistance, it will typically do one of two things:
bounce back towards its original direction or break out from the direc-

Charting the Market 107
tion from which it came (often dynamically). In either event, traders can
“bet” on a direction and quickly determine whether they are correct. If
price moves immediately against them, they can use a protective stop loss
to take a small loss on the trade. However, if price moves in the intended
direction, this often leads to a move that is many times greater than the
stop loss amount, yielding the all-important +R advantage.
This type of trade planning can be seen in Figure 5.6 where an area of
resistance is used to plan a long trade entry. Since price has recently found
support just below the trade entry point, this recent support level makes
FIGURE 5.5
This 55-tick chart of the E-mini S&P shows how resistance and sup-port levels may be determined. (Created with TradeStation)
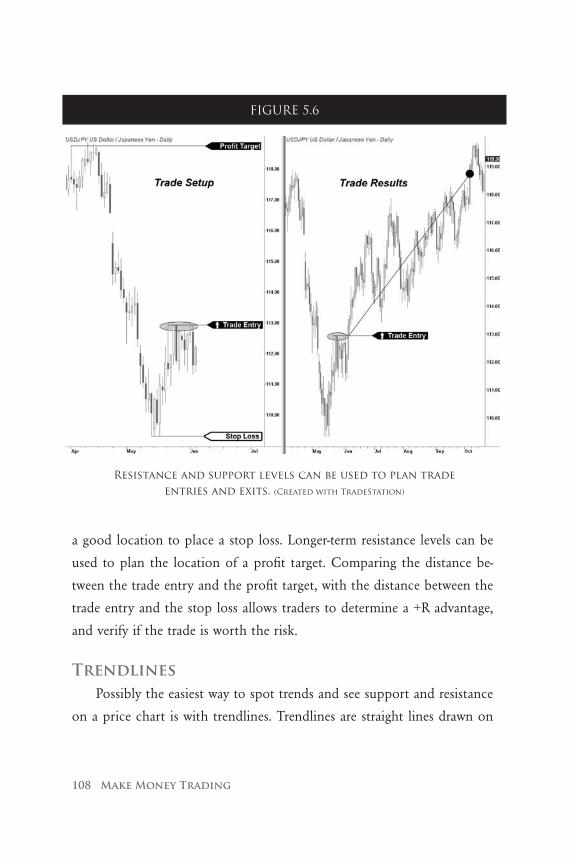
108 Make Money Trading
a good location to place a stop loss. Longer-term resistance levels can be
used to plan the location of a profit target. Comparing the distance be-
tween the trade entry and the profit target, with the distance between the
trade entry and the stop loss allows traders to determine a +R advantage,
and verify if the trade is worth the risk.
TrendlinesPossibly the easiest way to spot trends and see support and resistance
on a price chart is with trendlines. Trendlines are straight lines drawn on
FIGURE 5.6
Resistance and support levels can be used to plan trade entries and exits. (Created with TradeStation)

Charting the Market 109
a chart connecting points where prior price reversals have occurred, typi-
cally projecting into the future, or the right-hand edge of the screen. These
price reversals may be easily spotted by zooming out on a price chart and
looking for Vs or inverted Vs. These turning points are known as swing
lows and swing highs and can be seen in Figures 5.7 and 5.8, respectively.
Trendlines may be angled (known as up or down trendlines) or hori-
zontal. The slope of a trendline defines the phase of price movement for
the chart, and is shown in Figure 5.9. Markets are said to be in an up
trending phase (or an uptrend) if they are making higher swing highs and
FIGURE 5.7
Swing lows are used to draw a trendline showing levels of support. (Created with TradeStation)

110 Make Money Trading
higher swing lows. This would mean that two trendlines could be drawn
(one connecting swing highs, one for swing lows) that would both have
positive slopes and form an upward channel of price movement. Likewise,
a down trending phase occurs when prices form lower swing lows and
lower swing highs, creating trendlines with negative slopes and a down-
ward price channel. Horizontal trendlines (with a slope at or very close to
0) show periods of consolidation or market indecision where price is not
trending at all.
FIGURE 5.8
Swing highs are used to draw a trendline showing levels of resistance. (Created with TradeStation)

Charting the Market 111
Trendlines are an important tool for analyzing market activity and can
provide another method of making trading decisions. As price returns to
a trendline (known as testing the trendline) it will do one of two things:
bounce back in the direction from which it came, or break through. Trend-
lines become stronger as more swing highs or swing lows occur along the
same line. In many cases, stronger trendlines provide greater opportunities
for big price moves resulting from a break of the trend line. These moves
can by very dynamic and are referred to as price breakouts. It should be
noted that trendlines often show one key price that is acting as strong
FIGURE 5.9
Prices may be in an up or down trend depending on the slope of the trendlines. (Created with TradeStation)

112 Make Money Trading
support or resistance. Price levels that create support or resistance on mul-
tiple chart intervals (especially longer-term chart intervals) can pinpoint
important trading opportunities.
Drawing trendlines takes practice and can be somewhat subjective.
As a starting point, trendlines are most significant if at least three swing
highs or lows fall along the same line. In many cases, price will make three
swings in a particular direction before either breaking through or falling
back. Also, not all highs and lows need to be considered when drawing
FIGURE 5.10
A channel breakout can be seen on this 1597-tick chart of the E-mini Russell. (Created with TradeStation)

Charting the Market 113
trendlines since a rouge transaction (a sale significantly above or below the
market) can create an artificial swing.
Similar to candlestick patterns, trendlines form patterns that may be
indicative of large price moves. These patterns often trigger during a candle
bar and are easily spotted by comparing the price of the current candle
bar with the trendlines drawn on a chart. These patterns include a channel
breakout and a triangle pattern. A channel breakout can be seen in Figure
5.10 and is formed as price breaks out above or below two parallel (or close
FIGURE 5.11
A Triangle pattern formed on a Daily chart of the Euro FX futures. (Created with TradeStation)
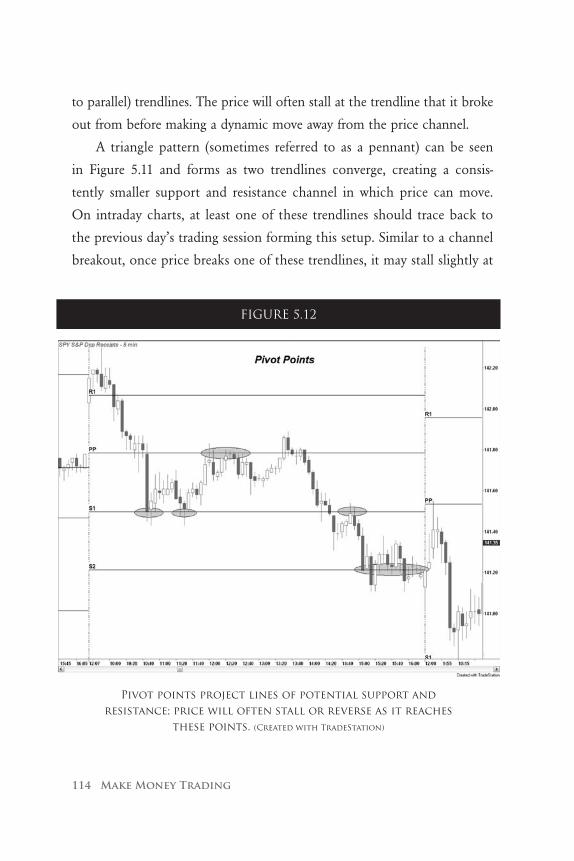
114 Make Money Trading
to parallel) trendlines. The price will often stall at the trendline that it broke
out from before making a dynamic move away from the price channel.
A triangle pattern (sometimes referred to as a pennant) can be seen
in Figure 5.11 and forms as two trendlines converge, creating a consis-
tently smaller support and resistance channel in which price can move.
On intraday charts, at least one of these trendlines should trace back to
the previous day’s trading session forming this setup. Similar to a channel
breakout, once price breaks one of these trendlines, it may stall slightly at
FIGURE 5.12
Pivot points project lines of potential support and resistance; price will often stall or reverse as it reaches
these points. (Created with TradeStation)

Charting the Market 115
the triangle formation before making a much larger move. Triangle pat-
terns can be a powerful precursor to fast, explosive price moves.
Pivot PointsPivot points are a type of technical indicator calculated by averaging a
previous day’s high, low, and closing prices. Originally calculated by floor
traders and market makers at the exchanges, pivots points project support
and resistance levels. Pivot points are overlaid on a price chart and appear
as horizontal lines that correspond to a price value, as illustrated in Figure
5.12. Unlike trendlines, pivot points attempt to predict areas of support
and resistance based on prior trading sessions. Pivots are only effective
at establishing areas of support and resistance if price respects them by
stalling at that pivot level. Without this confirmation, pivots do not have
much use and they should be disregarded.
While there are many variations of pivot point calculations available,
the concept behind interpreting these points is similar. Pivot points can be
used to determine the overall market trend by tracking price movements
above or below the central pivot point, as described in Figure 5.13. As
price crosses over the central pivot, it indicates a bullish market, favoring
long positions, while crosses below the pivot favor short positions. Addi-
tionally, prices often hover between the first support and resistance levels
(S1 and R1), but breakouts from these levels typically lead to moves that
reach the next subsequent level of support or resistance. Pivot points are
a helpful tool for creating profit targets and stop points.
While the basic formula for calculating pivot points is given below,
also included is a pivot point calculation that uses the Fibonacci relation-
ship. This type of pivot can be a helpful tool when applied to the index
and forex markets. The EasyLanguage code for these pivots is included in
Appendix B.

116 Make Money Trading
Pivot Level Description
R2 Second Resistance Level - Price often finds strong initial resistance at this level. Prices that break above this level often maintain their upward mo-mentum and continue higher throughout the day.
R1 First Resistance Level - Prices often find resistance at this level and bounce back toward the pivot. Once this level is broken, however, it often leads to an upward move to the R2 level.
PIVOT Average of previous day’s High, Low, and Close. Strong support or resis-tance. As price moves above this line, wait to buy until after a pullback. If price moves below this line, look to go short after a rally. Price will often oscillate above and below this line until a range is formed and a breakout occurs. Potential profit targets are R1 and S1.
S1 First Support Level - Prices often find support at this level and bounce back toward the pivot. Once this level is broken, however, it often leads to a fast, downward move to the S2 level.
S2 Second Support Level - Price often finds strong initial support a this level. Prices that fall below this level often maintain their downward momentum and continue lower throughout the day.
This chart describes the five major pivot points. It should be noted that pivot
point calculations are relative to the session times in which trading occurs. For
instance, pivot points for stocks are calculated during the normal exchange
hours of 9:30 am and 4:00 pm EST, but futures and forex trade during multiple ses-
sion times. In the case of E-mini futures and forex, pivot points should be calcu-
lated based on the specific session times in which most trading takes place.
FIGURE 5.13

Charting the Market 117
Standard Pivot Point Calculation Fibonacci Pivot Points
R3 = Pivot + R2 - S2 R3 = Pivot + ((H – L) * 1.000)
R2 = Pivot + R1 - S1 R2 = Pivot + ((H – L) * 0.618)
R1 = (Pivot * 2) - L R1 = Pivot + ((H – L) * 0.382)
Pivot = (H + L + C) / 3 Pivot = (H + L + C) / 3
S1 = (Pivot * 2) - H S1 = Pivot - ((H – L) * 0.382)
S2 = Pivot - R1 + S1 S2 = Pivot - ((H – L) * 0.618)
S3 = Pivot - R2 + S2 S3 = Pivot - ((H – L) * 1.000)
H = Yesterday’s High, L = Yesterday’s Low, C = Yesterday’s Close
Fibonacci RetracementsEarlier in this chapter, we introduced Fibonacci numbers. Retrace-
ments are another application where these numbers have become useful.
Fibonacci (Fib) retracements are a method of measuring past price move-
ments in an attempt to make a statistical projection of where price may go.
In other words, Fib retracements allow us a way of estimating where future
price may find support or resistance.
A retracement refers to the tendency of price to pull back after a
strong market move. These retracements occur on every charting interval
and occur whenever price makes a big move in a certain direction, reaches
a point of exhaustion, and inevitably falls back. While these retracements,
or pullbacks, may simply act as speed bumps as price continues in its
original direction, they may also initiate a complete reversal in price.
Fib retracements measure the strength of the initial price move by es-
tablishing the beginning and end of the price move using the swing highs
and lows. Once these points are established, prices are projected that rep-

118 Make Money Trading
resent different percentages of the original move. This is where Leonardo
of Pisa comes in and attempts to establish statistically significant ratios for
each of these projections.
The Fibonacci series has special values that keep showing up in un-
expected places, such as the logarithmic spiral in a nautilus shell and the
double helix of the DNA molecule. An important relationship in this
series is known as the “Golden Section” or 0.618, which describes the ratio
between any Fib number and the next highest Fib number (after the first
FIGURE 5.14
A Fib retracement applied to a 233-tick chart of the E-mini S&P shows a deep pullback (61.8%) that eventually becomes a
reversal. (Created with TradeStation)

Charting the Market 119
four calculations). This ratio is rounded into a percentage and subtracted
from 100% to create the key Fib levels of 61.8% and 38.2%. A 50% re-
tracement level is also added to form the final indicator, which typically
appears as a series of horizontal lines projected to the right hand side of
a price chart. In this way, each of these Fib levels can be directly related
to a price.
A popular application of Fib retracements is to estimate the strength
of a pullback by comparing the amount of the retracement to the Fib ra-
FIGURE 5.15
A Fib retracement is applied to a 610-tick chart of the E-mini S & P showing a shallow pullback (38.2%) that continues along its
original direction. (Created with TradeStation)

120 Make Money Trading
tios, shown in Figures 5.14 and 5.15. Retracements that only reach 38.2%
of their original trend show a strong tendency to maintain the trend and
go higher, while a 61.8% retracement often leads to a change in direction.
50% retracements display market indecision that can go either way. In
addition, prices regularly find support or resistance when approaching
the 0% or 100% levels as these swing highs and lows established the
initial trend.
Another application of Fib retracements is to apply them to multiple
chart intervals (of the same instrument). As instances of price levels coin-
cide from different charts, known as Fib clusters, they often become key
areas of support or resistance. While the jury may still be out on why Fib
ratios are so effective, it is remarkable how often they point out important
relationships in the market.
Technical IndicatorsTechnical indicators are tools that can offer traders a unique perspec-
tive on market activity. An indicator can either be overlaid on an existing
price chart or displayed on its own, usually just below the main price
chart. Most technical indicators are based on price action over a given
amount of time (or look back period), and use some type of mathematical
calculation or formula to determine a value. Technical indicators are used
to help traders quickly determine optimal market conditions, and can be
useful tools in developing the rules of a trading plan.
It is up to each trader to determine how best to use technical indica-
tors, as well as which indicator(s) to use. Most commonly available indica-
tors allow for an element of customizing simply by changing input values.
Input values are user-defined variables (such as look back period or type

Charting the Market 121
of price data) that modify the behavior of an indicator. Changing input
values can give an indicator much different values and point out different
market conditions. Figure 5.16 shows a window in a charting platform
used to modify an indicator’s input values.
Moving AveragesA moving average provides a reference for where price has been and
in which direction it is moving. It is used to smooth out market “noise”
and help determine if price is in trend. The most basic moving average is
known as a simple moving average (SMA) and is formed by adding up a
specified number of past prices and dividing by the total number of prices.
Two input values are used in the calculation of a SMA: the type of price
(high, low, open or close) and the look back period. The type of price
that is most commonly used to calculate a SMA is closing price, while the
look back period refers to the number of price bars that will be used in
FIGURE 5.16
An indicator formatting window in TradeStation for a simple moving average displays the values that users can easily
change. (Created with TradeStation)

122 Make Money Trading
the averaging. Shorter periods react faster to changes in the price, while
longer-term periods are slower to react. For example, adding the last five
closing prices and dividing by five would calculate a 5-period simple mov-
ing average of closing price:
Last 5 closing prices (in order of least to most recent): 707.8, 707.1,
707.0, 707.3, 707.1
SMA = (707.8 + 707.1 + 707.0 + 707.3 + 707.1) / 5 = 707.26
An exponential moving average, or EMA, is similar to a SMA but
gives more value (or weight) to the most recent prices in the look back
period. This type of moving average reacts faster to recent price moves
and follows price action more closely. The following formula shows the
calculation for an EMA and a sample calculation for a 5-period EMA us-
ing the above data:
EMA = P + [K x (C - P)]
C = Current Price
P = Previous period’s EMA (A SMA is used for the first period’s calculation)
K = Smoothing constant = 2 / (1 + N)
N = Number of periods for the EMA
EMA = ((707.8 * 1) + (707.1 * 2) + (707.0 * 3) + (707.3*4) + (707.1 * 5)) / 15 = 707.18
A double exponential moving average (DEMA) is a combination of
a single exponential moving average and the second derivative of the ex-
ponential moving average (that is, an EMA of another EMA). A DEMA

Charting the Market 123
provides a faster method of averaging that tracks price much more closely
than either an EMA or SMA. This can be a valuable tool for intraday
analysis where having less lag between the price and an indicator is impor-
tant. A DEMA can be derived using the following formula:
DEMA = (2 * EMA) - (N period EMA of EMA) N = Number of Periods for the EMA
The EasyLanguage code for the DEMA is included in Appendix B.
Figure 5.17 shows a comparison of the different types of moving aver-
ages applied to a daily chart. While each of these moving averages uses
the same 20-period input value of closing prices, they follow the price
action much differently. Each of these averages may be useful given the
right situation, with the DEMA leading the pack as the fastest to respond
to price moves.
While moving averages provide the basis for many other types of indi-
cators, they have several trading applications by themselves. Applying mul-
tiple moving averages to a price chart can be used to provide a reference
for trending activity. Many traders use moving average crossovers as signals
to enter or exit a trade. As with any technical indicator, traders must use
proper settings (such as look back periods) for the specific markets in
which they are used. An example of a moving average crossover system
is shown on the chart in Figure 5.18. Typically, when the smaller period
moving average (20-period DEMA) crosses above the larger (50-period
DEMA), a buying opportunity exists. Conversely, as the smaller moving
average crosses below the larger, an opportunity for selling exists.

124 Make Money Trading
Price BandsPrice bands form a channel that is projected onto a price chart, creat-
ing upper and lower lines. This type of technical indicator can help trad-
ers find short-term trading opportunities in choppy markets, since prices
often bounce back and forth within this channel. As price crosses outside
of the price bands, it can signal an opportunity to buy or sell in anticipa-
tion of a reversal. Price bands are constructed by adding and subtracting a
distance from a moving average. This distance often considers volatility. In
FIGURE 5.17
A comparison of three different types of moving averages: SMA, EMA, and DEMA. (Created with TradeStation)

Charting the Market 125
other words, as larger price swings occur, the distance between the bands
becomes greater and, conversely, the bands will constrict during times of
consolidation. This concept is shown in Figure 5.19; the arrows represent
areas where price has violated the upper or lower band of the Adaptive
Price Zone (APZ). The APZ is based on a double smoothed exponential
moving average and is calculated using the following formula:
FIGURE 5.18
A moving average crossover system using two DEMAs of different lengths. The arrows represent crosses of these averages that often
lead to the development of a trend. (Created with TradeStation)

126 Make Money Trading
APZ Upper Price Band = B * DEMA of (highs –lows) + DEMA
APZ Lower Price Band = DEMA – B * DEMA of (highs – lows)
B = Band Distance
Applying the APZ to a chart shows that the majority of price action
tends to stay within the upper and lower bands of the zone. When price
deviates significantly from its average and crosses out of the zone, there
is an almost magnetic attraction back towards the statistical average. This
FIGURE 5.19
Price bands applied to a 1597-tick chart of the E-mini S&P. The arrows represent points where price has moved above the upper channel or
below the lower channel. (Created with TradeStation)

Charting the Market 127
statistical “pull” forms the basis of the APZ’s logic. It is important to
note that this pull only becomes significant in markets that are not ac-
tively trending.
OscillatorsOscillator is a general term for technical indicators that bounce be-
tween two extreme values. This type of indicator is displayed separately
from the underlying price chart. Oscillators can point out areas where
FIGURE 5.20
A comparison of different oscillators (Stochastic, CCI, and ADX) shows how they react differently to price
movements. (Created with TradeStation)

128 Make Money Trading
turning points are likely to occur, and can be seen in Figure 5.20. As the
value of an oscillator approaches a level close to its upper extreme, the
value is referred to as becoming overbought. Values that approach the
lower extreme are called oversold.
While moving averages are important tools used in spotting trends,
oscillators are most useful in markets where a trading range has been estab-
lished. Oscillators can help locate turning points and estimate when price
may be forming a new trend. While there are many types of oscillators, the
average directional index (ADX), stochastic and commodity channel index
(CCI) oscillators are three of the most useful.
The ADX oscillator, originally developed by J. Welles Wilder in the
late 1970s, can be used to assess the strength of a trend. Much like a mov-
ing average, this indicator uses a look back period to determine the speed
at which it reacts to the market. The ADX can fluctuate between 0 and
100, although readings above 60 are uncommon. Indicator readings below
25 show a weak trend, while levels above 40 indicate a strong trend has
occurred. The ADX may be most useful, however, to identify changes in
trends. As the indicator values move from below 25 to above, for instance,
it may confirm that price is breaking out of a range and a trend could be
developing. An even more important application of the ADX is to spot
the end of a strong price move. As the ADX returns from higher levels to
below 45, it signifies the end of a short-term trend. This is often a good
indication to close out a trade if you have been lucky enough to ride the
initial trend. This often provides a method of getting out of a trade near
the high or low of the price move (the maximum profit potential).
A stochastic oscillator measures momentum by comparing the current
price of a trading instrument to its price range over a specified look back
period. Developed by George C. Lane in the late 1950s, this indicator has
become a popular trading tool. The stochastic looks inside candle bars to

Charting the Market 129
determine whether prices are closing nearer their highs or their lows, and
can be seen in Figure 5.21. As price closes near the high of the candle bar,
it indicates an up-trending market, while prices closing near the low show
a downtrend. The main value is known as %K and is the faster of the two
lines comprising the stochastic oscillator. A simple moving average is used
to smooth the value of %K to produce the slower of the two lines, called
%D. Both lines can be displayed on the indicator. In addition, horizontal
lines are often used to illustrate upper and lower thresholds where price is
considered overbought or oversold, respectively. The basic formula for a
stochastic oscillator is as follows:
%K = 100 x [(C - Ln) / (Hn - Ln)] C = the most recent closing price
n = look back period Ln = the low of the n previous price bars
Hn = the highest price traded during the same n period.
One effective method of applying stochastics to an intraday market is
to use two separate stochastics of different periods on the same chart. This
provides a short-term (13-, 5-period) and long-term (60-, 20-period) view of
price oscillation. As both of these indicators reach an overbought or over-
sold area (above 70 or below 30, respectively) and begin to change direction,
this indicates that price may be ready to reverse. Once in overbought or
oversold territory, a short-term stochastic cross of one of these thresholds
provides a good trade entry opportunity, as shown in Figure 5.21.
The CCI oscillator, created by Donald Lambert in 1980, was originally
developed to identify cyclical turns in commodities. The CCI provides
a method of gauging momentum by measuring the position of price in

130 Make Money Trading
relation to its moving average. Essentially, the CCI takes the wavy mov-
ing average line on a price chart, straightens it out, and plots the closing
price relative to this line. While this indicator often zigzags around zero,
values greater than 100 are considered overbought and values less than
–100 are thought to be oversold. The steps for calculating the indicator
are as follows:
FIGURE 5.21
A multiple stochastic may lead to powerful price moves. The arrows show the short-term stochastic crossing a threshold line
while the longer-term stochastic turns away from overbought or oversold territory. (Created with TradeStation)

Charting the Market 131
1. Calculate the last period’s Typical Price (TP) = (high + low + close) / 3.
2. Calculate a 14-period simple moving average (SMA) of TP.
3. Calculate the Mean Deviation by calculating the absolute value of the difference between the last period’s SMA and the TP for each of the past look back periods. Add all of these absolute val-ues together and divide by the look back period to find the Mean Deviation.
4. The final step is to apply the TP, the SMA, the Mean Deviation,
and a Constant (.015) to the following formula:
CCI = (TP – SMA) / [(0.015) x (Mean Deviation)]
The CCI has become a popular technical indicator among traders,
and some have found unique ways of trading with this oscillator. The CCI
tends to react quickly to price moves, as seen by its often-jagged shape.
One method of applying the CCI involves a longer-term CCI (50-period)
applied to a daily chart, as illustrated in Figure 5.22. In this instance, the
direction of the CCI can be used to establish the formation of a new
trend. When the CCI value is above zero it shows strength that can lead
to a new uptrend, while CCI values below zero may illustrate a new down-
trend. Once a new trend has been established, price will often pull back
towards the zero-line creating an opportunity to buy or sell in anticipation
of a continuing trend.
Custom IndicatorsCustom indicators can take many forms and must be programmed for
or imported into a market analysis platform. These indicators may com-

132 Make Money Trading
pare different data functions, look for unique market conditions, or com-
bine several different conditions into trading signals. This type of technical
indicator allows traders to identify specific market conditions, instead of
being limited to preprogrammed indicators that are included in charting
platforms. Custom indicators can be purchased from independent devel-
opers or developed and programmed on your own. Custom indicators
can also provide a method of quickly checking the validity of a trading
FIGURE 5.22
The CCI can define the formation of a new trend; as the CCI moves above the zero-line, it establishes an uptrend, and
vice versa. (Created with TradeStation)

Charting the Market 133
idea. Building a trading plan using a custom indicator can streamline the
development process since it is relatively easy to convert most custom
indicators into a testable trading system.
The boundaries in designing custom indicators are limitless. Figure
5.23 shows a useful custom indicator that provides a double exponen-
tially smoothed stochastic that is normalized on a scale from -1 to 1.
The Premiere Stochastic indicator can be applied to any charting interval
FIGURE 5.23
This custom indicator, called Premiere Stochastic, provides an extremely fast reaction to price swings. (Created with TradeStation)

134 Make Money Trading
providing an extremely fast reaction to price swings. Unlike a traditional
stochastic oscillator, there are four individual threshold lines located at
+/- 0.9 and +/- 0.2. These create an overbought and oversold “zone” that
can be used to determine the early onset of a price reversal. The Pre-
miere Stochastic calculation is based on the %K of the 8-period stochastic
as follows:
Premiere Stochastic = (Exponential Value (S) – 1) / (Exponential Value (S) + 1)
S = 5 period double smoothed exponential EMA ((%K – 50) * .1)
%K = 8- period stochastic
Premiere indicator readings above 0.2 represent strong price moves
favoring long positions, while readings below –0.2 show weakness. The
TradeStation code for this indicator is included in Appendix B.
Data IndicatorsData indicators can be used to gauge the current strength or weak-
ness in the markets. Unlike the other technical indicators mentioned in
this chapter, data indicators are not based on the price activity of just one
trading instrument or symbol. A data indicator is a separate index of short-
term trading data that is collected from the major stock indices. Similar to
using the net change of the Dow Jones Industrial Average or the Nasdaq
Composite as mentioned in Chapter 3—Getting to Know the Modern
Markets, market indicators offer statistics about the current condition of
the overall market.

Charting the Market 135
Dat
a In
dica
tor
Hig
h Rev
ersa
l Pr
obab
ility
Ext
rem
ely
Bea
rish
Bea
rish
Neu
tral
Bul
lish
Ext
rem
ely
Bul
lish
Hig
h Rev
ersa
l Pr
obab
ility
TRIN
- N
YSE
Trad
ers
Inde
x(A
ctua
l Val
ue)
1.30
or
Hig
her
1.30
to
1.15
1.15
to
1.00
1.00
to
0.85
0.85
to
0.70
0.70
to
0.55
0.55
or
Low
er
TIC
K -
NYS
E
Tic
k In
dex
(Act
ual V
alue
)
-100
0 or
Low
er-6
00 to
-100
0-3
00 to
-600
300
to -3
0030
0 to
600
600
to 1
000
1000
or
Hig
her
TIK
Q -
Nas
daq
Tic
k In
dex
(Act
ual V
alue
)
-600
or
Low
er-4
75 to
-600
-300
to
-475
300
to -3
0030
0 to
475
475
to 6
0060
0 or
Hig
her
TIK
I - D
ow J
ones
Tic
k In
dex
(Act
ual V
alue
)
-25
or L
ower
-20
to -2
5-1
2 to
-20
12 to
-12
12 to
2020
to
2525
or
Hig
her
FIG
UR
E 5.
24
Dat
a in
dic
ato
rs
that
can
be
use
d t
o g
aug
e th
e in
trad
ay m
ark
et.

136 Make Money Trading
For day traders in particular, getting to know the behavior of these
data indicators both individually and as a collective can provide a good
reference for favorable market activity. Since traders can easily reach infor-
mation overload by looking at too much data, data indicators should only
be used in the background. Traders only need to glance at them to observe
the overall market direction. Figure 5.24 lists four of the most important
data indicators used to monitor the intraday direction of the US equities
markets along with some guidelines on how to evaluate each. It should be
noted that none of these indicators is predictive, but rather a reaction to
what has already happened in the market.
TICKThe TICK stands for the NYSE Tick Index and can be a powerful
gauge of intraday market activity. The TICK measures the difference in
stocks currently trading positively on an uptick and stocks currently trad-
ing negatively on a downtick. An uptick occurs whenever a transaction
goes from a lower price value to a higher one, and vice versa for a down-
tick. The TICK is an extremely fast indicator that can instantly determine
whether the broad market is predominantly buying or selling.
Figure 5.25 shows a chart of the TICK. TICK readings between +/-
300 generally represent a neutral market (shown by the shaded area on the
chart). Since normal price fluctuations between the bid and the ask price
create upticks and downticks without any significant increase or decrease
in a stock’s value, it is not until the TICK reads +/- 600 that a significant
market move has occurred. Values in the extreme levels of the index (+/-
1000) show an overbought or oversold market and often signal reversals.
While the TICK monitors the Big Board stocks, there are several other
“tick” indicators that monitor other important stock indices. These in-
clude the “TIKQ” that represents the Nasdaq composite Tick Index, and

Charting the Market 137
the “TIKI” that represents the Dow Jones Tick Index. These data indica-
tors can provide an important snapshot of their respective markets. Each
tick indicator has a different relative value since each is based on the num-
ber of stocks in its particular index. A TIKI reading of –30, for instance,
would mean that all 30 stocks in the Dow Jones Industrial Average were
on a downtick, and would be an extremely bearish signal.
FIGURE 5.25
The NYSE Tick Index and the NYSE Trin Index applied to a 3-minute chart. The shaded areas represent neutral market
activity. (Created with TradeStation)
138 Make Money Trading
TRINThe TRIN is the NYSE Trader’s Index, measuring the intraday direc-
tion of the market by comparing the number and volume of NYSE stocks
that are advancing to those that are declining. Also known as the NYSE
Arms Index, the TRIN can be a helpful tool for assessing market strength,
and, while based on the NYSE, often represents the broad market.
The TRIN, seen in Figure 5.25, can be interpreted many different ways
with both the trend and the actual value of the indicator representing
market behavior. When the value of the TRIN is increasing, or creating an
uptrend, there is an increase in the market’s selling pressure; as the TRIN
value steadily decreases, it signifies more buying pressure. The overall value
of the TRIN may also be used to show a bearish bias with values greater
than 1.00, and becomes bullish as values move below –0.08.
Chart Setups for TradingSo far in this chapter we have discussed some important components
for technical analysis. Now it is time to put it all together and make sense
of it. At this point, you may be wondering which components are critical
to setting up basic charts for market analysis. Keep in mind that this is
an ongoing process and you may find that you are frequently adding and
removing indicators throughout your research. Below are some guidelines
to setting up an effective charting workspace:
• Usecontrastingcolorstomakechartsandquotesstandout
• Placeindicatorsinthesamelocation,usingthesamecoloron all charts
• Usethesame(neutral)backgroundcolorforallactivechartsofthe same symbol

Charting the Market 139
• Usemultiplemonitors(atleasttwo);onefororderentryandtherest for charts
• Useboldfontswheneverpossible
• Don’toverloadyourscreenwithinformation(morethanfiveopen windows on the same screen gets confusing)
• Keepchartindicatorstoaminimum(don’tputunnecessaryindicators on your charts)
• Onceyouhaveachartsetupthatyouarehappywith,saveitand take a screenshot for backup purposes (setting up a desktop
can be time consuming)
Daily Chart SetupOn a daily price chart, each candle bar represents one trading day.
For most short-term traders, this points out key price levels that should
be noted for more detailed analysis. It is often helpful to have several
longer-term moving averages on the chart, such as 20-, 50-, and 200-period
SMAs. These averages often provide areas of support or resistance that
are commonly used by longer-term investors as well. A volume graph is
another useful addition to this chart since daily price bars do not reflect
the amount of daily trading activity that has taken place. This helps gauge
the amount of buying or selling occurring within a price move, as greater
volume often leads to moves that are more dynamic.
One way to interpret this information is if the SMAs stack up (in order
of size) and volume is above its average, a trend has been established. The
example in Figure 5.26 shows in mid-June the 20-period SMA was below
the 50 SMA, which was below the 200 SMA. Once the volume exceeded
the daily average, this confirmed a bearish market phase. Alternatively, in
mid-October the 20 SMA was above the 50 SMA, which was above the 200
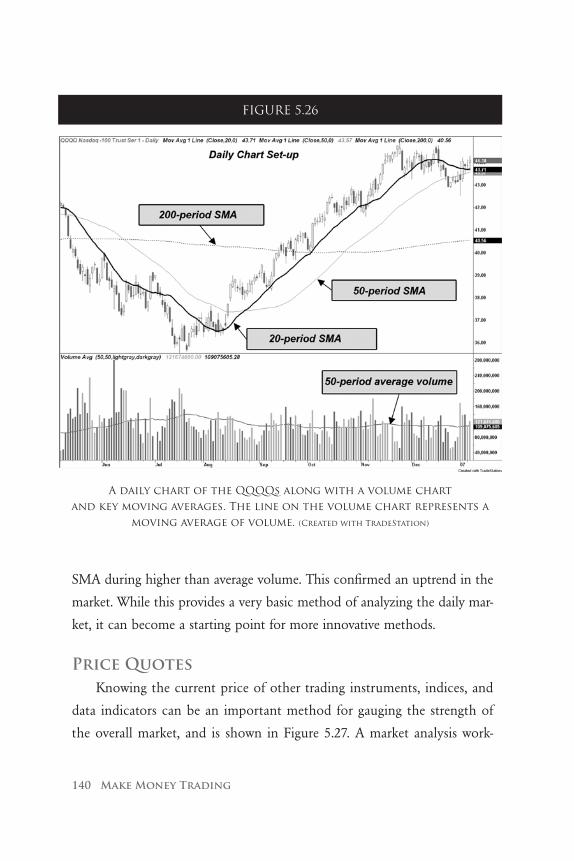
140 Make Money Trading
SMA during higher than average volume. This confirmed an uptrend in the
market. While this provides a very basic method of analyzing the daily mar-
ket, it can become a starting point for more innovative methods.
Price QuotesKnowing the current price of other trading instruments, indices, and
data indicators can be an important method for gauging the strength of
the overall market, and is shown in Figure 5.27. A market analysis work-
FIGURE 5.26
A daily chart of the QQQQs along with a volume chart and key moving averages. The line on the volume chart represents a
moving average of volume. (Created with TradeStation)

Charting the Market 141
FIG
UR
E 5.
27
A q
uo
te s
cr
een
sh
ow
ing
key
mar
ket
in
dic
es a
nd
pr
ice
info
rm
atio
n
fro
m w
ith
in t
he
sec
tor
. (C
rea
ted
wit
h T
rad
eSta
tio
n)

142 Make Money Trading
space should have a quote screen above the price charts with information
on other stock, futures or forex prices from within the sector. A sector
is simply a group that shares the same industry or market. Since sectors
often move together, these intra-market relationships can help point out
price moves that may affect the instruments or symbols you are trading.
Spotting inefficiencies in other markets, such as very large bid sizes for
instance, may create opportunities in the markets you are following.
Intraday Chart Setup While setting up intraday chart intervals has already been discussed,
technical indicators that are applied to intraday charts need to react very
quickly. In general, traders should avoid using intraday indicators with
large look back periods, and should find technical indicators that respond
with little or no lag. The chart in Figure 5.28 includes several technical in-
dicators that are well suited for a fast-paced intraday market. These include
the DEMA, stochastic, and the ADX.
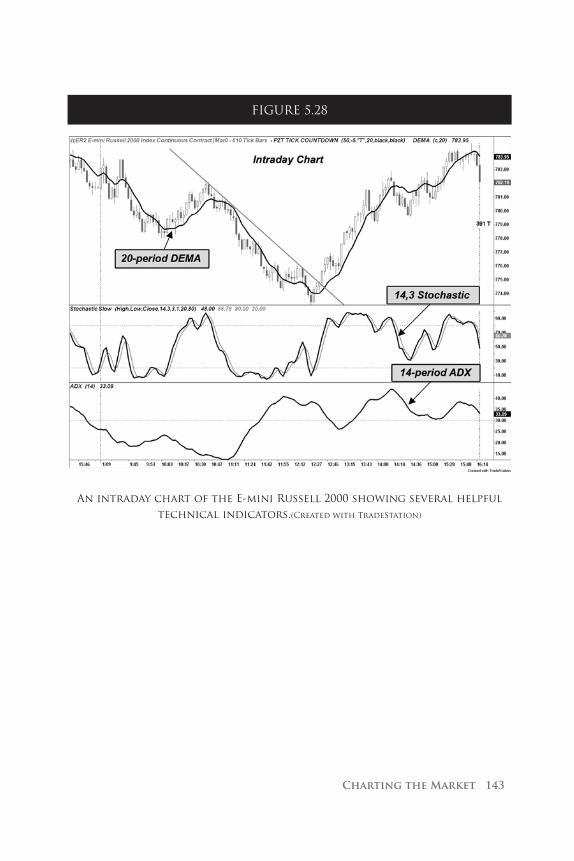
Charting the Market 143
FIGURE 5.28
An intraday chart of the E-mini Russell 2000 showing several helpful technical indicators.(Created with TradeStation)

Chapter 6Placing Trades
Trade DynamicsThis chapter will explore the important aspects of placing trade orders
and using multiple order types. Whenever possible, we’ll use examples
that show how these orders will look to a screen-based trader. A trade
order is the specific instruction that is sent to a broker to enter or exit a
trade. Traders often underestimate the importance of using proper trade
orders. At first, placing trades may seem remarkably simple: when entry
conditions are met, you push the buy button and, conversely, when exit
conditions have been met, you push the sell button. This is called trading
naked and, while it is possible to trade in this simplified manner, it is not
very efficient. Trading naked requires constantly monitoring the market,
and opens traders to the risks of missing important trade signals and trad-
ing without a protective stop loss.

146 Make Money Trading
Another important reason to avoid naked trades is what is known as
slippage. Slippage refers to the difference between the price you expect
and the price you actually get in a transaction. Since trade orders are filled
in the order in which they are received, naked traders are often the last to
place their orders and are subject to a greater amount of slippage. Over
time, slippage can significantly erode trading profits, and traders should
seek to minimize this factor in their trading plans.
In a sharp contrast to naked trading, most professional traders thor-
oughly plan their trade orders before entering into a position. Examples
of this type of order planning can be seen later in this chapter. Modern
trading technology allows for a multitude of order types and automation
tools that can help traders place trades according to their trading plans,
quickly and accurately. Employing the powerful tools that today’s brokers
and trading software developers offer can help minimize trading errors
and reduce slippage. Just knowing when to trade is not enough; successful
traders must also know how to trade.
To begin with, trades can be established in two different directions, de-
pending on the anticipation of a rising or falling market. These are known
as long and short trades.
Long TradesLong trades are the classic method of buying and selling with the
intention of profiting from a rising market. Long trades can be conducted
through all brokers and do not necessarily require a margin account (as
long as there is enough money in the account to fund the complete trans-
action). Shown on the daily chart of the QQQQs in Figure 6.1, a long
trade begins with buying shares of at a price of 39.50 on September 12th.
Once the value of the ETF increases to 43.00 per share, the position is

Placing Trades 147
closed by selling on November 7th. Even a small position size, 100 shares
for instance, would show a $350 profit from this trade.
Position P/L for Long Trade = (Exit Price – Entry Price) * Point Value * Position Size
= (43.00 – 39.50) * $1 * 100 = $350
Point value defines the dollar value for each point fluctuation of the
symbol ($1 for stocks/ETFs; varies by contract for futures and forex).
It should be noted that for a trader to enter this position without the
use of margin, it would require at least $3,950 (entry price value * posi-
FIGURE 6.1
A comparison of a long trade and a short trade.
148 Make Money Trading
tion size) to fund the trade. Had this trade gone the other way and the
QQQQs had fallen in price, the trader would be responsible for funding
the position loss as well as the initial purchase price.
Short Trades Short trades, otherwise known as selling short or going short, attempt
to profit from the falling price of a market. This is accomplished by bor-
rowing and then selling a stock, futures contract, or foreign currency from
a broker. Once price has reached the target level, traders buy back the
shares or contracts, called buying to cover. Buying to cover allows traders
to replace what was originally borrowed from a broker. The difference in
value between the initial sale and the replacement cost is what becomes
the profit (or loss) from a short trade.
As a conceptual example, imagine a friend has purchased a new car.
After he tells you the price he just paid, you find a dealer who is offer-
ing the same new car, but for a significantly lower price (well below the
market). Instead of accepting that it is too late to get this deal, you see
an opportunity, and ask to borrow your friend’s car for the day. You then
find a buyer and sell the car at the same price your friend paid for the
car. Using the money from this sale, you buy a replacement car from the
bargain dealer (at a much lower price than your friend originally paid). At
the end of the day, you return a car to your friend, and you make a profit
from the short sale. This represents the relationship of your broker (your
friend with the car), a falling market (the bargain dealer), and the potential
of a short trade (your profit from the transaction).
Trading short positions is an important facet of active trading, and
allows traders to take advantage of moves in both up or down markets.
While a bit more complex than the standard long trade, it is valuable for
traders to be able to profit in both directions. Many traders find that, over

Placing Trades 149
time, they are equally comfortable placing short trades as they are long. In
many cases, short trades offer faster, more dynamic price drops as market
fear, or panic, creates unique trading opportunities.
Short trades, especially in volatile stocks, involve some risks of which
traders should be aware. The ultimate risk involved with a long trade (the
theoretical worst-case scenario) is that the company could go bankrupt,
and the stock would lose its entire value. In this case, the total value of the
investment (stock price * position size) would be lost. While this is a wor-
risome concept, the theoretical risk of a short trade is unlimited. The price
of a stock may only fall a finite amount (to zero), but its value may con-
tinue to increase indefinitely. Since a short trade begins with a debt that
must be eventually repaid, a trader’s risk to cover this debt in a short trade
is theoretically unlimited. Using proper trading techniques, such as trading
with a stop loss, allows traders to manage the risks of a short trade.
Short trading requires a margin account with a broker since the broker
must allow you to borrow in order to make this type of transaction. In ad-
dition, not all stocks may be available to use for a short trade since your
broker must hold shares of these stocks in order for traders to borrow them.
In general, ETFs, futures, and forex are the easiest instruments for short trad-
ing, as described in Chapter 3—Getting to Know the Modern Markets.
Figure 6.1 shows an example of a successful short trade on the QQQQs
where a trade was initiated by selling short on May 11th at a price of 41.25.
Then, on July 12th, the trade was closed by buying to cover at a price
of 37.00. Using a 100-share example, this trade would have generated a
$425 profit.
Position P/L for Short Trade = (Entry Price – Exit Price) * Point Value * Position Size = (41.25
– 37.00) * $1 * 100 = $425

150 Make Money Trading
FIG
UR
E 6.
2
An
or
der
en
try
bar
use
d t
o p
lac
e tr
ades
.

Placing Trades 151
Order TypesOnce a trading account has been established, buying or selling stocks,
futures contracts, or foreign currency can be as straightforward as the click
of a mouse. Figure 6.2 shows an example of an order entry window for a
direct access trading account, displaying a variety of trading options. From
a trader’s perspective, making a successful trade entails placing the trade
order with a broker (clicking buy or sell), getting a confirmation of the
trade order, and receiving the final price for the fill. A fill is the completed
trade transaction that refers to the action of satisfying the trade order. Just
placing a trade order does not guarantee that it will be filled, or if it will be
filled at the intended price. This is why it is vital for traders to understand
how to correctly place and manage their buy and sell orders.
Before a trade order can be placed, traders must submit the following
information:
• Symbolthatisbeingtraded
• Positionsizeofthetrade
• Durationofthetradeorder
• Specialroutinginstructions
• Typeoftradeorder
The trade symbol represents the abbreviation for the instrument that
is being traded. As described in Chapter 3—Getting to Know the Modern
Markets, each trading instrument has a specific symbol that needs to be
correctly entered into the order execution software. This symbol defines
what is being bought or sold.
The position size or quantity of the trade refers to how many units
a trader is buying or selling. Short-term traders often refer to the size of
a trade in lots. A lot will vary between markets and refers to a standard
152 Make Money Trading
minimum position size that a trader would wish to trade. One lot typically
represents 100 shares of a stock or ETF, one futures contract, or $10,000 in
foreign currency. In addition, forex brokers often use this lot as a standard
to define the size of a trade.
The duration of a trade order defines how long an order will remain
active in the market (sometimes referred to as time-in-force). Trade orders
that will expire at the end of the current trading day are defined as “day”
orders. In some cases, traders may wish for an order to remain in the mar-
ket longer than the current day, or until they decide to remove it. This is
known as a “GTC” or good-till-canceled duration and can be useful for
trades that span multiple days. Traders should research the types of trade
durations that are available, as they will vary from broker to broker.
Routing instructions refers to the ability to choose which exchange
can fill an order. While this is not applicable to forex or futures, it can
be an important option for stock traders. A typical Level 2 stock screen
will show the market participants who are buying and selling. Knowing
this information, traders can choose a specific electronic communication
network (ECN) to trade with. In addition, many brokers offer an “intel-
ligent” or “smart” order routing system that helps traders find the ECNs
that have the greatest liquidity, a good choice if this feature is offered by
your broker.
Order types come in three varieties: market, limit, and stop orders.
Market OrdersA market order is the most basic type of trade order and instructs the
broker to buy or sell at the best price currently available. The advantage
to using market orders is that a trader is guaranteed to get the trade filled.
In other words, if a trader absolutely needs to get into or out of a trade, a
market order is the most reliable method of accomplishing this. The down
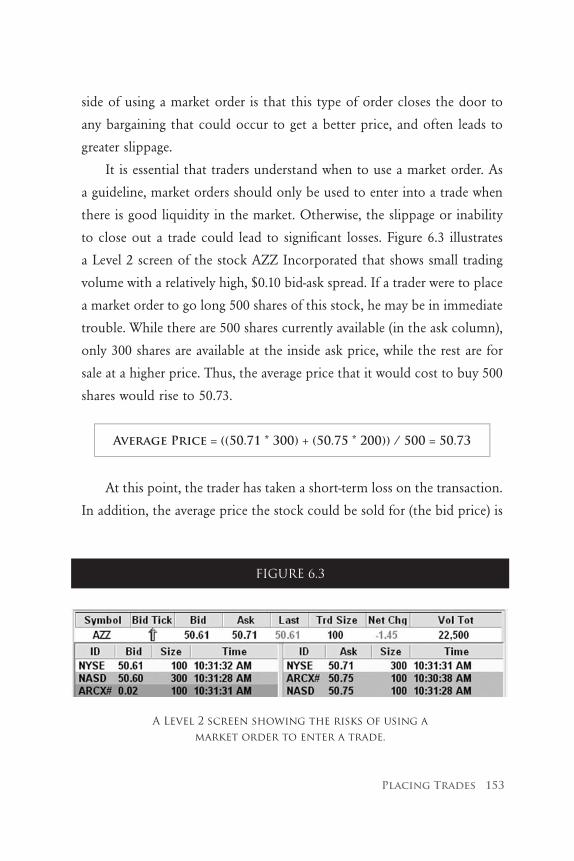
Placing Trades 153
side of using a market order is that this type of order closes the door to
any bargaining that could occur to get a better price, and often leads to
greater slippage.
It is essential that traders understand when to use a market order. As
a guideline, market orders should only be used to enter into a trade when
there is good liquidity in the market. Otherwise, the slippage or inability
to close out a trade could lead to significant losses. Figure 6.3 illustrates
a Level 2 screen of the stock AZZ Incorporated that shows small trading
volume with a relatively high, $0.10 bid-ask spread. If a trader were to place
a market order to go long 500 shares of this stock, he may be in immediate
trouble. While there are 500 shares currently available (in the ask column),
only 300 shares are available at the inside ask price, while the rest are for
sale at a higher price. Thus, the average price that it would cost to buy 500
shares would rise to 50.73.
Average Price = ((50.71 * 300) + (50.75 * 200)) / 500 = 50.73
At this point, the trader has taken a short-term loss on the transaction.
In addition, the average price the stock could be sold for (the bid price) is
FIGURE 6.3
A Level 2 screen showing the risks of using a market order to enter a trade.

154 Make Money Trading
50.60, resulting in an immediate $0.13 loss per share. Furthermore, there
are currently not enough buyers to sell back all 500 shares. [Note: the
ARCX# bid of 0.02 is just a placeholder and does not really represent 100
shares of stock at 0.02.] The value of this stock must increase by at least
$0.13, under increased market participation (more bids lined up to buy
back the shares), before this trade could break even (not lose money).
Traders should not be overly anxious to enter trades, and should un-
derstand what price they can expect from a market order, based on the
depth of the market. Figure 6.4 shows a price ladder display for an E-mini
S&P futures contract. This type of display can be used for order entry.
Traders can click on the proper cell to buy or sell at the amount specified
in the price column. In this market, the bid-ask spread is .25, the small-
est fluctuation, or tick size, possible for this market. [Note: each tick is
represented by a 0.25 change in the E-mini S&P price column, but has a
value to a trader of $12.50.] In other words, this is the smallest spread that
can exist in this market and makes it a good candidate for entering a trade
using a market order. If a trader wishes to buy one contract using a market
order, they should expect to buy at a price of 1444.50, or the inside ask.
Based on this market, traders could expect to sell (or sell short) one con-
tract at a price of 1444.25. Another benefit to a trader in this market is the
amount of contracts available to be bought and sold. In this case, there are
921 contracts available in the first two ask levels and 290 contracts in the
first two bid levels. [Note: E-mini contracts are typically sold in single units
(not 100s), and a single contract could be conceptually comparable to 100
stock shares. Thus, a 5-contract E-mini trade would be roughly similar to
trading 500 shares of a stock or ETF.]
Traders should expect a market order to be filled at the ask price when
buying, and at the bid price when selling. This defines what is meant by
the “market price.” When trades are filled at a price worse than the inside

Placing Trades 155
FIGURE 6.4
The location of market orders shown on a price ladder display.

156 Make Money Trading
bid or ask, this is known as trade slippage. For instance, if a market order
to buy was filled at 1445.00 (instead of 1444.50), this would represent two-
ticks of slippage. As stated in Chapter 3—Getting to Know the Modern
Markets, instruments that trade in all-electronic markets generally provide
the least amount of slippage, often providing the best candidates for short-
term trading.
Limit OrdersLimit orders allow traders to specify the price they are willing to get
for a trade, known as the limit price. A limit order to buy will occur at
or below the specified price, while a limit order to sell will take place at
or above the specified price. The advantage of using a limit order is that
it ensures that negative slippage will not occur, and provides a method to
bargain with the market. The down side of using limit orders is that there
is no guarantee that the order will be filled. Although a limit order can be
placed in the market, it is not filled until price reaches the specified level.
This means that a trader could miss a trading opportunity if price moves
away from the limit order before it can be filled.
Limit orders are an important tool for traders, often providing an ex-
cellent means of precisely entering and exiting a trade. As with any order
type, traders must understand when to use this type of order. Figure 6.5
shows a price ladder display of the E-mini S&P. In this example, instead
of accepting the current market price, we want to try to get a better price
(buy for less than the inside bid, or sell for more than the inside ask).
Limit orders must be placed on the correct side of the market to ensure
they will accomplish the task of improving price. In other words, to buy
using a limit order, the order must be placed at or below the current mar-
ket bid of 1444.25; to sell using a limit order, the price must be at or above
the current market ask of 1444.50.

Placing Trades 157
To enter a limit order for a long trade, we must first determine a level
for the limit order. Let’s say we want to go long with one contract if price
drops to 1443.50. The next step is to enter this price level and submit the
order (click the “buy” button). We would then see the number in the bid
column at the 1443.50 price level change to 642, reflecting our order to
FIGURE 6.5
The location of limit orders shown on a price ladder display.

158 Make Money Trading
buy at this price level. If price pulls back, we will get our buy order filled
at exactly 1443.50 and enter into a long trade.
Stop OrderA stop order to buy or sell becomes active only after a specified price
level has been reached (known as the stop level). Stop orders work in the
opposite direction of a limit order, with buy stop orders placed above the
market and sell stop orders placed below the market. Once a stop level
has been reached, the order will be immediately converted into a market
or limit order. In this sense, a stop order is not really an order in itself,
but a trigger for either a market or limit order. Accordingly, stop orders
are further defined as stop-market or stop-limit orders. The most common
and useful is the stop-market order, since these are normally filled more
reliably. Often, when traders refer simply to a stop order, they are referring
to a stop-market order.
Traders that are not familiar with the use of stop orders may be won-
dering, “Why would anyone want to pay a worse price than the current
market value?” In some instances, trading requires us to draw a line in
the sand and challenge price to reach that level in order to demonstrate
a significant level of strength or weakness in the market. Once this line is
crossed, it provides the catalyst to enter or exit a trade. Traders may choose
key support and resistance levels, for example, as described in Chapter
5—Charting the Market, to establish the levels of their stop orders. In
essence, stop orders allow traders to confirm the market is headed in a
particular direction before entering a position.
Figure 6.6 shows an example of the placement for stop orders. Pos-
sibly the most common use of a stop order is to set a risk limit for a
trade, or a stop loss. As an example, if we were to enter a long position at
1444.50, we could use a stop order to define the maximum amount that

Placing Trades 159
we were willing to risk on this trade as $150. This could be accomplished
by setting a stop order to sell at a level of 1441.50. If price goes against us
by 12 ticks [Note: E-mini S&P values, 12 ticks * $12.50 per tick = $150] we
would exit the position with a $150 loss (less slippage and commission).
FIGURE 6.6
The location of stop orders shown on a price ladder display.
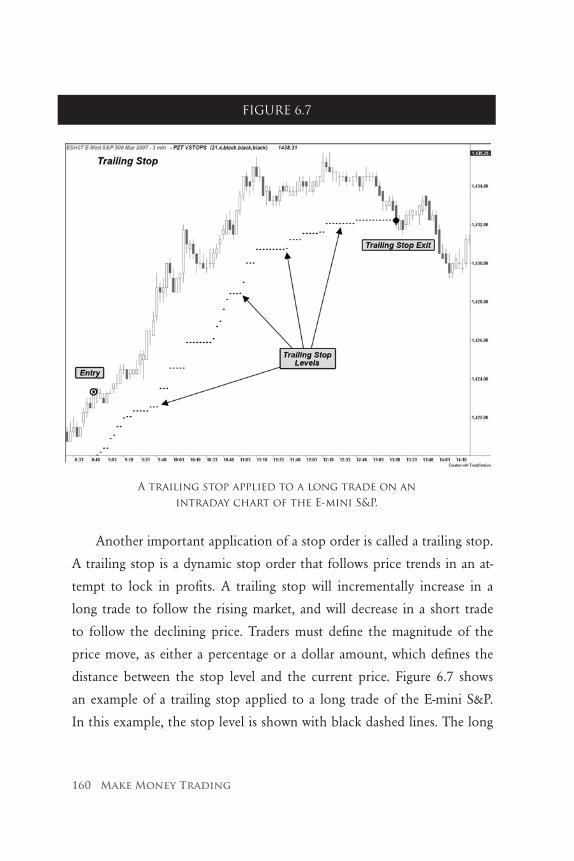
160 Make Money Trading
Another important application of a stop order is called a trailing stop.
A trailing stop is a dynamic stop order that follows price trends in an at-
tempt to lock in profits. A trailing stop will incrementally increase in a
long trade to follow the rising market, and will decrease in a short trade
to follow the declining price. Traders must define the magnitude of the
price move, as either a percentage or a dollar amount, which defines the
distance between the stop level and the current price. Figure 6.7 shows
an example of a trailing stop applied to a long trade of the E-mini S&P.
In this example, the stop level is shown with black dashed lines. The long
FIGURE 6.7
A trailing stop applied to a long trade on an intraday chart of the E-mini S&P.

Placing Trades 161
trade is eventually closed out as price falls back and triggers the stop order
to sell. Trailing stops have become a popular order type offered by most
brokers, and will appear as an option in the order entry software.
Trade ExamplesThe following examples are intended to demonstrate the application
of multiple order types. While each example illustrates important trade
management concepts, traders should first develop a clear, comprehensive
trading plan before placing actual trades. Therefore, it is assumed in the
following examples that a trading plan defining these specific trade entries
and exits has already been developed and tested, verifying the effectiveness
of these trades (discussed in Chapter 7—Developing a Trading Plan, and
Chapter 8—Evaluation and Comparing Trading Plans).
It should also be noted that each example illustrates an ideal, winning
trade. This is not always the case. The fact is that losing trades (trades that
reach a predetermined stop loss) are much easier to manage than winning
trades. Once a stop loss has been reached, traders should simply cancel all
open orders and look for other trading opportunities, as defined by their
trading plans. As mentioned earlier in this book, it is impossible to trade
without losing.
Each of the following examples is applied to the E-mini Russell 2000
March 2007 futures contract (symbol: ER2H07). Keep in mind that the
price on the charts does not equate to a per-share value but an index value
specific to this contract. For the “Mini Russell,” each point is worth $100
per contract, and the minimum price fluctuation, or tick value, is 0.10 of
a point, which relates to a value of $10 per contract. For instance, a price
move from 750.00 to 780.50 is worth $3,050 per contract to a trader. A

162 Make Money Trading
more detailed description of popular E-mini index futures contracts can
be found in Chapter 3—Getting to Know the Modern Markets.
Trade Example 1: Bracket In the first example, (Figure 6.8), a long trade will be entered using a
stop order, and will then be managed using a combination of stop and
limit orders, known as a bracket. The setup for this trade involves spotting
an area of prior resistance, which occurred when price reached the swing
high of 750.00 on September 28. This provides a point to place a buy
FIGURE 6.8
An example of a bracket trade on the E-mini Russell 2000.

Placing Trades 163
stop order in anticipation of a rising market. The logic is that if price can
push up to 750.00, it may continue higher. Using a stop order means that
the order will automatically become active if price reaches the designated
stop level. On October 4, we place the stop order to buy one contract at
a price of 750.00. The next day we get the confirmation that the order has
been filled at a price of 750.20 ($20 of slippage on one contract) as price
surges upward.
Now that we are in a long position, our trading plan has defined the
placement of the two sell orders to exit the position, depending on which
way the market moves: a profit target and a stop loss. The stop loss is
placed at an area of prior support below the current price, and the profit
target is set for a +R advantage of two, well above the current price. The
profit target is established by entering a limit order to sell at 800.00, and
the stop loss is placed as a stop order to sell at 725.00. The combination
of these two sell orders is called a bracket since they bracket, or surround,
the trade entry price. At this point, price will either reach our profit target
or fall back to the stop loss. Either way, we have the correct orders in the
market to exit the position as soon as one of these events occurs. On
November 15, price reaches the profit target and the limit order is filled at
exactly 800.00. At this point, it is important to cancel the open stop order
and completely flatten the position (otherwise, an unintended position
could be initiated).
Trade Example 2: Stop-and-ReverseThis trade example (Figure 6.9) uses a reversal logic that switches posi-
tions between long and short trades, keeping a trader constantly in the
market. The logic behind this method of trading is that the market must
go either up or down, and a stop-and-reverse system attempts to catch
strong trends since a trader will constantly be in the market. This trade is

164 Make Money Trading
initiated on November 17 when a limit order to buy one contract at 780.00
is placed. At this point, the current price is well above the limit price. As
outlined in our trading plan, if price pulls back to an area of previous resis-
tance around 780.00 (remember, prior resistance often acts as support), it
will provide the catalyst to take the long trade. On November 27, the limit
order is filled and we open the long trade. Our stop loss is set 10 points
below the entry price with a stop order to sell at 770.00. Similar to the pre-
vious example, we will place a simultaneous order for a profit target. This
time, however, if price reaches our profit target we will not just sell, but we
FIGURE 6.9
An example of stop-and-reverse trade on the E-mini Russell 2000.

Placing Trades 165
will also reverse the position and enter a short trade. To accomplish this,
we will submit a limit order to sell two contracts at 805.00 (one contract
to close the long trade, and one contract to enter the short trade).
Six days after our entry, price jumps up to the limit price and is filled
on December 4. We have successfully reversed our original trade and are
now in a short trade. At this point, we must cancel the remaining stop
order to sell and place another set of stop loss and profit target orders for
our trade exits.
Trade Example 3: Multiple Profit TargetsThe next example (Figure 6.10) demonstrates a money management
strategy that buys into a long position and aims to split the position
and sell at two separate profit targets. In addition, a protective stop loss
is put into place that will move up to a breakeven level (back to the
original entry price) once the first half of the position reaches the initial
profit target.
In the example, we enter a long trade using a market order to buy on
October 9, getting immediately filled for two contracts at a price of 755.00.
Now that we are in the market, we enter a stop order to sell two contracts
at 725.00 for our initial stop loss. We then enter two separate orders to
sell at different profit targets: a limit order to sell one contract at 780.00
and another limit order to sell one contract at 795.00. The trade quickly
moves in our direction and, in a little over a week, we reach our first profit
target; and, our first limit order is filled on October 16 at 780.00. Now, we
want to protect our profits and prevent this trade from becoming a loser.
Since we already have a nice profit, we move our stop loss for our remain-
ing contract up to breakeven. To do this, we cancel the stop order for two
contracts at 725.00, and enter a new stop order for one contract at 755.00.
Even if the trade turns and goes against us, we are still guaranteed a profit-

166 Make Money Trading
able trade; however, we will give this trade a chance to become even more
profitable. Over the next couple of weeks the market turns down and
almost stops out at the breakeven level before moving back up to reach
our second profit target on November 14. We then cancel the outstanding
stop order to avoid entering an unintended position.
FIGURE 6.10
An example of a multiple profit target trade on the E-mini Russell 2000.
Placing Trades 167
Trade AutomationAs demonstrated in the previous examples, traders often incorporate
advanced order, position sizing, and money management strategies into
their trading plans. In addition, traders will often trade several different
instruments simultaneously, known as a trading portfolio. As the level of
complexity of a trading plan increases, so does the potential for error in
placing, canceling, and managing multiple trade orders. Trade automation
is an important tool that allows traders to maintain their focus on the
markets, instead of just watching trade orders. Currently, there are three
different levels of trade automation available to retail traders: conditional
trade orders, front-end software, and system trading.
Conditional Trade OrdersThe most basic form of trade automation is known as a conditional
trade order, and is available through many brokers. Unlike the basic mar-
ket, limit, or stop orders, conditional trade orders will automatically be
submitted or canceled only if specified criteria are met. Conditional trade
orders must be specified before placing a trade, and are entered directly
through the order entry software, as seen in Figure 6.11. The two most
common conditional trade orders are the order cancels order (OCO) and
the order sends order (OSO).
An OCO enables traders to place several orders; when one is filled,
the remaining orders in the group are canceled. This type of order can be
useful for both trade entries and exits, and examples of possible OCO ap-
plications are shown in Figure 6.12. Possibly the most popular application
of an OCO is the bracket order, as shown in Figure 6.8. An OCO bracket
order can simplify the process of placing simultaneous stop and limit or-
ders in the market. With this type of an order, once either of these levels
is reached, the outstanding order is automatically canceled. This type of

168 Make Money Trading
OCO bracket order minimizes the order entry workload by allowing a
trader to place a single OCO order, instead of three individual orders (a
stop order, a limit order, and an order cancellation).
An OSO order is used to further automate the management of a trade
by sending orders into the market following an entry order’s fill. This
order is often used in conjunction with an OCO, and can significantly
streamline the process of placing protective stops and target limit orders.
For instance, an OSO order can be set to automatically trigger a bracket
order as soon as either a long or a short trade is entered.
FIGURE 6.11
This entry order screen from MB Trading Navigator shows a variety of proprietary order types. In this case, conditional
orders include “TTO” (Threshold Triggered Order) as an OCO order, and a “+” denotes a type of OSO order.

Placing Trades 169
FIGURE 6.12
Examples of possible OCO applications.
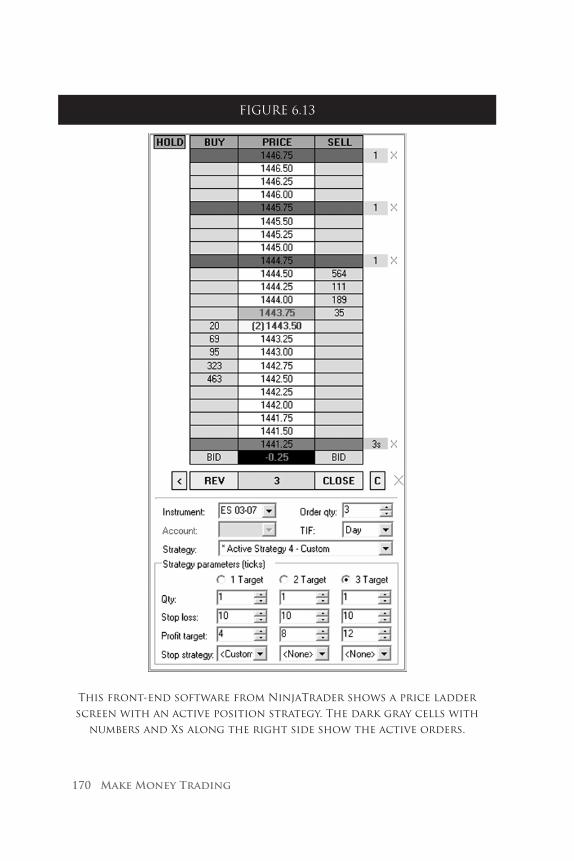
170 Make Money Trading
FIGURE 6.13
This front-end software from NinjaTrader shows a price ladder screen with an active position strategy. The dark gray cells with
numbers and Xs along the right side show the active orders.

Placing Trades 171
Front-End SoftwareThe next level of trade automation requires the use of an additional
trading program, known as front-end software, which interfaces with a
broker’s order entry software. Front-end software, as seen in Figure 6.13,
is used to automate more complex trade management and can be particu-
larly helpful to day traders. Most front-ends use a price ladder, and traders
can place or change an order by simply clicking and dragging the order
from one of these cells. As the position size changes, the front-end recal-
culates all associated orders and cancels any outstanding orders.
The advantage to using front-end software is its ability to automate
complex exit strategies that may include multiple profit targets, multi-level
stop orders, or pyramiding (adding shares or contracts to a winning posi-
tion). This tool can significantly speed up the order placement process,
and it allows the trader to “fire-and-forget” to a certain extent, as the
front-end can manage multiple trades with multiple conditions. Front-end
software typically does not require complex program writing or coding
to create exit strategies. Even intricate exit strategies can be set up using
a relatively straightforward interface with a series of drop down lists and
check boxes.
For newer traders, front-ends have a couple significant advantages. The
first benefit is that most developers that sell (or lease) front-end software
offer an accompanying trading simulator. This simulator functions iden-
tically to the actual software and allows traders to get familiar with the
functions and capabilities of the software before beginning live trading.
Many front-end simulators even attempt to simulate the delays and uncer-
tainty associated with getting orders filled in volatile markets. The second
advantage of using a front-end to manage trades is that it offers complete
consistency in how traders exit their positions. This can really help traders
fight the urge to deviate from their trading plans.

172 Make Money Trading
System TradingThe next degree of automation is fully automated trading or system
trading. System trading allows traders to develop specific rules that es-
tablish both trade entries and exits. Similar to front-end software, system
trading requires software that is linked to a broker. Trade entry and exit
rules can vary from simple criteria, such as moving average crossovers or
indicator values, to complex strategies that must be custom programmed.
Most traders who employ system trading, however, choose to program
their own strategies or work closely with a programmer. This requires
learning the proprietary programming language of the trading platform as
well as thoroughly understanding the technical market theories that are to
FIGURE 6.14
This TradeStation chart shows an automated trading strategy applied to the March 2007 E-mini Russell 2000 contract.

Placing Trades 173
be implemented within the strategy. Once developed, a strategy is applied
to a specific chart where it can be monitored in real-time as trades are
automatically triggered and sent to the market, as seen in Figure 6.14. The
trade entries and exits appear as arrows overlaid on the price chart.
Possibly the biggest advantage of system trading is the ability to take
some of the emotion away from trading. Since these systems can trade
completely mechanically based on the predetermined rules of a trading
plan, dealing with losses or second-guessing a trade entry will not affect
system performance. Additionally, trades can be automatically executed
with extremely fast reaction times.
The various benefits of trade automation make it a helpful tool for
traders, but it is important to remember that certain aspects of automation
can fail. For instance, the downside of managing trades through front-end
software is that the software must be running constantly with a live data
feed in order to function properly. Even fully automated systems still re-
quire monitoring since these systems can only react to the data that they
receive. If the system receives incorrect market data or loses a connection
to the data server, the trader must recognize the error and manually fix the
problem. If left unnoticed, a trade could be left naked in the market.


Chapter 7Developing a Trading Plan
The Importance of Using a Trading Plan
Throughout this book, the trading plan development and implemen-
tation has been established as a necessary tool for successful trading. Not
to overstate this point, but we are not aware of any traders who have be-
come consistently profitable without using a well-researched trading plan.
This chapter will discuss the elements involved in constructing a trading
plan as well as several basic examples.
In Chapter 2—The Business of Trading, we defined the two distinct
roles of a complete trader as a strategist and a market trader. Developing
a trading plan defines the most important role of the strategist. Putting
together a trading plan is a creative process wherein we apply our collec-
tive research to establish a set of definitive trading rules. These research

176 Make Money Trading
concepts include risk management, intra-market relationships, technical
analysis, and trade order dynamics. In other words, our individual research
will provide the building blocks for establishing the rules of our trading
plan. This is the point where we must roll up our sleeves and define the
details of our business.
Trading plans must be somewhat dynamic. As traders gain more trad-
ing experience and greater skill, their plans should evolve as well. Very few
experienced traders continue to use exactly the same trading plan as when
they began trading. One of the key decisions a strategist should make is
when and why to revise a trading plan. These criteria should be considered
part of the overall trading plan and should be put into place before actual
trading occurs.
It is important to mention that the greatest advantage to using a trad-
ing plan is the consistency that it offers. Consistently following the rules
of an effective trading plan will allow a trading business to make money
over time. Remember, we cannot win every trade, and we should not focus
on the results of only our most recent trades, but instead in consistent
trading over time. A trading plan should not change after each trade. In
fact, changing a trading plan too often will create an overly flexible plan
that will equate to not having a plan at all. A trader must strike a balance
between deciding when to change the plan, and allowing enough trades for
a trading plan to have the chance to demonstrate profitability.
Building a successful trading plan is a process, as illustrated in Figure
7.1. This process allows traders to develop and test their trading plans
through a logical and systematic progression. The initial step is to define
the trading plan objectives and establish a set of trading rules. A trading
plan must be written, and should include the following components:
• Timeframeorconditionsunderwhichtoreevaluatethe trading plan

Developing a Trading Plan 177
• Market(s)towhichitwillbeapplied
• Primarychartintervalthatwillbeusedtomaketradingdecisions
• Indicatorsandsettingsthatwillbeappliedtothechart
• Positionssizethatwillbeused,includingwhentoincrease/de-crease size
• EntryRules
• ExitRules
The process of developing a trading plan is similar to hiring a new
employee. In order to consider this trading plan for employment, it must
prove that it has the performance record, character, and skill to benefit
FIGURE 7.1
The process for developing a trading plan.

178 Make Money Trading
your trading business. The steps to evaluating a trading plan include his-
torical modeling (reviewing resumes), forward performance testing (check-
ing references), and live-market performance testing (the interview). It is
only after a trading plan has successfully gone through this process that
it has proven it is ready for employment in the market. Additionally,
criteria must be set to determine when a trading plan needs additional
development (training) or when it may need to be taken out of the market
completely (fired).
Once the rules of a trading plan are defined, it can be tested on histor-
ical data. This process, referred to as historical modeling, or backtesting,
can help prove the validity of the plan. It is essential to use enough data
that the historical modeling becomes statistically significant. Analyzing just
a few trades does not offer the type of confirmation that we are looking
for. In general, the more trades that are involved in the historical model,
the better. It is also possible to revise the plan at this point, as this process
often leads to important research that can improve the performance of the
plan. Traders must be careful, though, not to reconstruct a plan that will
only work on historical data (this is known as over-optimizing).
Once the trading plan has shown positive, satisfactory results in his-
torical modeling, it is time to practice applying the plan to the real market.
This step is called forward performance testing, and is sometimes referred
to as paper trading. Since there is no real trading at this point, we are only
placing trades via an order entry simulator (described in Chapter 4—The
Tools of the Trade), or on paper. At this point, the trading plan can no
longer benefit from hindsight, and must prove itself in the real market
environment. This testing will take some time in order to gain enough
trading experience to become significant. A minimum of ten trades is
recommended before making any initial judgments about the system. For-
ward performance testing is a vital step in the trading plan development
Developing a Trading Plan 179
process, and traders should look for good correlation between this and the
historical modeling. If it is determined that the trading plan is performing
as expected, it is time to begin live-market performance testing.
At this point, traders must put real money on the line to test the
system. Live-market performance testing should only be conducted with a
minimum position size. Remember, we have not yet completed the devel-
opment process and are still testing. Large losses at this point can cause a
significant setback to the overall business. While this step will feel exactly
like real market trading, it is intended as a bridge to get the trading plan
closer to being fully applied to the market. The focus of this phase is to
establish a correlation between the live-market trading results and the pre-
vious development steps. Live-market testing will often provide feedback
that will lead to future revisions of a trading plan. In some cases, traders
may find that they do not yet have the market trading skill or mindset
to follow the trading plan. This may require tailoring the plan to make it
more tradable for the individual market trader.
Once a trading plan has gone through this rigorous process with posi-
tive results, it is ready to be fully applied to the market (traded for real).
Traders should not rush through the testing process or try to take short
cuts. Any setbacks along the development process require traders to go
back to the initial phase, and continue through each step. These setbacks
should not be considered failures, for each time a trader goes through the
process of testing a trading plan, he or she becomes a more experienced
and savvy trader.
A key part of this process is having the tools to evaluate a trading
plan. This is accomplished by analyzing and comparing statistical results,
or performance reports, from each phase of testing. Examining these re-
ports and explaining key performance metrics will be described in Chap-
ter 8—Evaluating and Comparing Trading Plans.

180 Make Money Trading
Asset Allocation and Position SizingA discussion of position sizing and asset allocation would not be com-
plete without mentioning the Turtles. The Turtles have become somewhat
of a legend in the trading world, with their almost mythical success story
inspiring many new traders. The Turtles were actually the result of a study
by famous commodities trader Richard Dennis and his long-time friend
William Eckhardt. The two set out to determine if great traders were born
or made, and advertised for trading apprentices. Out of 1,000 applicants,
10 people were chosen and an additional three added, whom Mr. Dennis
had already known. This group was known as the Turtles.
This team of prospective traders attended a two-week training session
at the end of December 1983, and began trading small accounts at the
beginning of the next month. Mr. Dennis funded the Turtles with larger
accounts, ranging from $500,000 to $2,000,000 the following month. Over
the next four years, the Turtles earned an average annual compound rate
of return of 80%. Mr. Dennis felt as though he had proven that trading
could be taught: with a simple trading plan, people with little or no trad-
ing experience could become excellent traders.
Fundamental to the Turtles’ success was their approach to position
sizing and asset allocation. They believed in trading a fixed percentage of
their account, which increases asset allocation as equity increases, and de-
creases asset allocation as equity decreases. After each trade, funds were re-
allocated based on the results of that trade. In addition, the Turtles would
not risk more than two percent of capital on any trade, a percentage that
is still accepted as the industry standard.
Another important element in the Turtles’ trading plan was a volatil-
ity-based constant percentage risk position-sizing algorithm. It normalized
the dollar volatility of a position by adjusting the position size based on

Developing a Trading Plan 181
the dollar volatility of the market. In other words, more contracts were
held in markets that had lower volatility, and fewer contracts were held
in markets that had higher volatility. The result was that a given position
would tend to move up or down the same amount (in dollar terms) when
compared to positions in other markets, regardless of the volatility of the
particular market. Therefore, individual trades in different markets had the
same chance for a particular dollar loss or a particular dollar gain. This
improved the effectiveness of diversification.
Through the Turtles’ consistent trading plan, they objectively answered
the questions of what to trade and how much to trade.
Leverage and MarginDeciding precisely how much to trade is a key aspect of a trading busi-
ness that allows traders to control risk and maximize profits. The amount
of margin, or leverage, that a trader chooses to use determines how much
he or she can buy or sell at any given time. Traders must decide how to
use this powerful tool most effectively without creating a high probability
of ruin for their trading businesses.
It is recommended that traders begin trading only with a small per-
centage of the amount of money that is available in their accounts. Trad-
ers should start small and increase their position sizes as their profits
and trading skills grow. Newer traders that are too anxious to trade larger
positions (using the entire value of their accounts and/or large amounts of
leverage) almost always fail. Margin and leveraging should be applied with
extreme caution.
A trader can determine, for example, the maximum number of shares
of QQQQs (trading at $44.20 per share) they could afford to buy with a
$60,000 trading account, by dividing the account size by the current value
of the stock.

182 Make Money Trading
Max Position Size (Stocks) = Account Size / Stock Value = $60,000 / $44.20 = 1,357 Shares
A standard overnight margin account allows 2:1 leverage for stocks,
and would give this trader the buying power to purchase twice as many
shares than the account size could otherwise afford. This brings the maxi-
mum marginable position size up to 2,714 shares (Max Position Size *
Margin Rate). It is advised that traders should never trade at maximum
margin levels.
A more responsible method to determine a position size is to trade a
percentage of the overall marginable value of an account, instead of the
complete account value. For example, a trader may choose to base the
position size on 30% of the margin account value:
Max% Position Size (Stocks) = (Account Size * Margin Rate * Trading Percentage) / Stock Value =
($60,000 * 2 * 0.3) / $44.20 = 814 Shares
This amount is typically rounded down to the nearest 100 shares to
allow for easier order entry and trade management. Accordingly, the above
example would relate to 800 shares of the QQQQs.
It should be noted that the futures and forex markets require a nec-
essary amount of margin and this should be factored into any type of
position sizing. For instance, trading 30% of a maximum position in the
E-mini Russell 2000 futures contract (initial margin of $3,500 per contract)
with a $60,000 futures account could be calculated as follows:
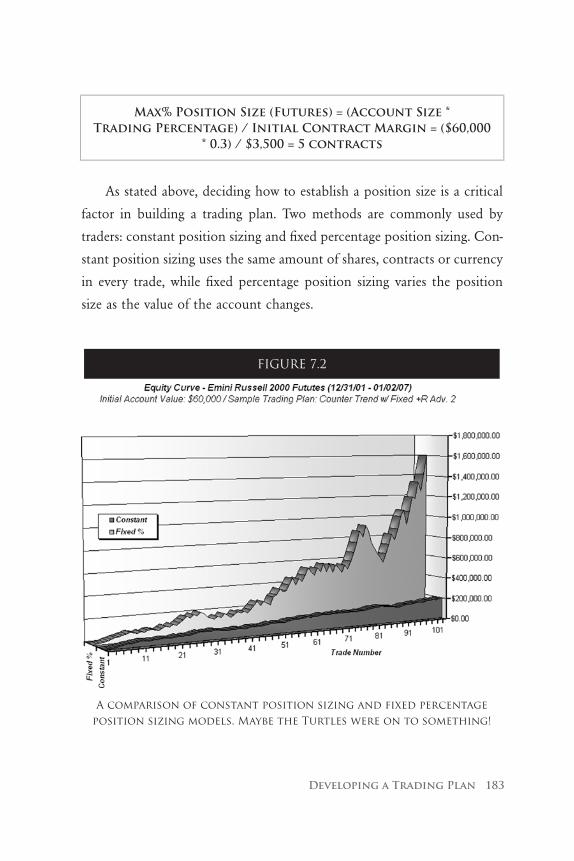
Developing a Trading Plan 183
Max% Position Size (Futures) = (Account Size * Trading Percentage) / Initial Contract Margin = ($60,000
* 0.3) / $3,500 = 5 contracts
As stated above, deciding how to establish a position size is a critical
factor in building a trading plan. Two methods are commonly used by
traders: constant position sizing and fixed percentage position sizing. Con-
stant position sizing uses the same amount of shares, contracts or currency
in every trade, while fixed percentage position sizing varies the position
size as the value of the account changes.
FIGURE 7.2
A comparison of constant position sizing and fixed percentage position sizing models. Maybe the Turtles were on to something!

184 Make Money Trading
A comparison of these two position sizing methods can be seen in
Figure 7.2. The equity curve for each of these position sizing models is
displayed using a sample trading plan applied to 6 years of historical data
from the E-mini Russell 2000 futures contract. An initial account balance
of $60,000 was used to construct these equity curves. While the constant
position size model would have traded with a consistent five contracts, the
fixed percentage model began with five contracts and increased the posi-
tion size as the account grew. This progressive method of fixed percentage
position sizing is one of the key concepts contributing to the effectiveness
of the Turtles’ trading plan. This essentially allows traders to compound
their trading profits and risk more only after they have made more. The
previous equations for max% position size can be used to calculate a po-
sition size based on the current account value, and should be calculated
following every trade.
While fixed percentage position sizing clearly has the advantage, con-
stant position sizing is still useful to traders. This method can work well
for traders who are just getting started, or trading smaller accounts. Con-
stant position sizing should also be used during the testing and evaluation
of a trading plan.
Instruments to TradeAnother aspect of a successful trading plan is deciding which instru-
ments, or symbols, to trade. Choosing these instruments requires research,
and traders often find that, after a period of observation, they will dis-
cover the instruments that are best suited to their trading styles and risk
tolerances. Chapter 4—The Tools of the Trade introduces several trading
instruments in the stock, futures, and forex markets that provide the li-
quidity and volatility that make good candidates for short-term trading.

Developing a Trading Plan 185
In addition, trading instruments based on market indices provide a pre-
established level of diversification.
A recommended practice is to develop a trading plan that will be used
with just one instrument, and then diversify (add instruments) as a trading
account and market trading skill increase. This can allow traders to focus
their research on effectively testing and executing a trading plan, instead
of constantly scanning for possible instruments to trade. This is not to say
that diversification and testing across a portfolio of trading instruments
is not important. In fact, many traders gain additional confidence if their
trading plans test favorably in multiple markets.
Adding instruments to a trading plan requires the same intensive test-
ing process that was used to establish the plan. In addition, traders should
attempt to add instruments that trade in dissimilar, or non-correlated,
markets. This provides the advantage of better diversification. A well-diver-
sified trading portfolio can help reduce trading losses because individual
losing trades can be offset by winning trades in other markets. In order to
gain the most benefit from diversification, traders must choose to trade
comparable position sizes. Establishing this type of portfolio diversifica-
tion can become challenging, as traders must mix a cocktail of instru-
ments to provide the best overall results. Similar to a well-mixed martini,
a well-diversified trading portfolio must include the proper components,
and in the correct proportions.
The Turtles offered a unique approach to mixing a portfolio cocktail
by normalizing the instruments in their portfolio based on the volatility
of the market. This approach can help traders decide which proportions
to trade by establishing comparable position sizes (or trading units). While
the Turtles applied this approach to large trading accounts, small investors
can also use this technique to compare unit sizes between trading instru-
ments. The first part in this approach is to establish the volatility using a

186 Make Money Trading
concept known as average true range. Average true range (ATR), originally
develop by Welles Wilder in the late 1970s, compares the trading range
over a period of time. The following calculation is used to calculate an
ATR of the past 20 periods:
Average True Range = (Previous ATR * 19 * TR) / 20
TR = True High – True Low
True High = Highest of the current high or previous close
True Low = Lowest of the current low or previous close
A trading unit can be established by dividing the risk capital by the
20-period ATR. In the following examples, a $60,000 trading account will
be used with a 2% risk limit. Using these amounts, we can establish com-
parable trading units for several instruments using the calculation:
Trading Unit = (Account Size * Percentage to Risk) / (Average True Range * Dollar Value of Point)
(ER2) E-mini Russell 2000 Unit = ($60,000 *.02) / (10 * $100) = 1 contract
(YM) E-mini Dow Unit = ($60,000 *.02) / (87 * $5) = 2 contracts
(ES) E-mini S&P Unit = ($60,000 *.02) / (11 * $50) = 2 contracts
(NQ) E-mini Nasdaq 100 Unit = ($60,000 *.02) / (25 * $20) = 2 contracts
(EC) Euro FX Futures Unit = ($60,000 *.02) / (.00957 * $125,000) = 1 contract

Developing a Trading Plan 187
This normalization allows traders to establish a reference to use when
creating a trading portfolio. For instance, the risk involved in trading one
E-mini Russell 2000 contract using 2% of a $60K account is comparable
to two E-mini S&P contracts.
Chart Intervals to TradeWhile some may wonder why choosing a charting interval falls under
the heading of asset allocation and position sizing, chart intervals are
typically associated with a particular style of trading. The amount of price
fluctuation per bar is much greater on longer-term charting intervals than
on shorter intervals. Thus, a charting interval relates to position size since
it defines a particular type of risk profile. This risk is typically adjusted by
trading larger positions in shorter-term styles of trading, explaining the
extremely low margin requirements available to day traders.
For a swing trader using a daily chart, risking $800 per contract may
be an appropriate tactic. For a day trader using a 15-minute chart, how-
ever, this same level of risk might be spread into four contracts, each risk-
ing only $200. While both traders have the same amount of risk per trade,
their styles of trading and corresponding chart intervals require different
allocations.
There are no calculations or formulas to help determine which chart-
ing intervals are most useful for a particular style of trading. This will
come down to personal preference and research. While traders may wish to
incorporate multiple charting intervals into a trading plan, it is important
to define a primary charting interval. This primary charting interval will
be used to define the specific trade entry and exit rules that describe the
type of trading strategy.

188 Make Money Trading
Trade EntriesThe goal of establishing trade entry rules is to provide a consistent
and decisive method of getting into the market. Traders may often find
an inclination to be conservative or aggressive in their approach to trad-
ing. Being too conservative or too aggressive can have equally negative
results. Conservative traders often look for multiple sources of confirma-
tion, wanting to make sure they are placing the correct trade. This type of
trader will often wait until the last possible opportunity to enter a trade
and, as a result, is often too late to capture a move. An aggressive trader,
on the other hand, will jump at the opportunity to get into a trade. This
type of trader often tries to anticipate entry signals, entering the market
frequently and sometimes without a real reason. Each trader should be
aware of his or her inclination for trade entries and attempt to find a bal-
anced entry method. A decisive entry includes two elements: trade triggers
and filters.
Trade TriggersA trade trigger is the line in the sand, so to speak, that defines pre-
cisely when a trade will be entered. While there may be several other condi-
tions that will further define a trade entry, known as trade filters, the trade
trigger tells traders exactly when to act. Once a trade trigger occurs, market
traders do not have to think…they just react. A trade trigger allows for a
fast and decisive trade entry. In many cases, having an immediate reaction
to positive market conditions equates to greater profits. As mentioned
above, traders who are slow to react often miss much of a price move.
There should be absolutely no ambiguity in a trade trigger. This means
that trade triggers must be clearly defined within the trading plan. An
example of a possible trade trigger would be: “Enter a long position once

Developing a Trading Plan 189
price breaks one tick above the high of the previous bar.” This provides a
market trader with the precise timing and location to enter a trade.
Trade triggers are often a specific trade order type, such as a stop or
limit order, which will put traders into a position as soon as the predeter-
mined stop or limit price occurs. They can also be the crossing of a price
threshold (such as support and resistance levels), or an indicator value.
Indicators can provide an objective means of trade entry since thresholds
can easily be established. Traders should avoid using any generalities when
defining their triggers. For instance, “Enter a long trade once the stochas-
tic is oversold” should be further defined as “Enter a long trade once the
13, 5 stochastic crosses above a value of 20.”
Another aspect of trade triggers is that they need to be simple. If there
are too many trade triggers, or if they become overly complex, a trading
plan will become more difficult to implement. This may lead to frequent
trading errors and a less effective overall trading plan. Trade triggers should
remain clear and obvious to a trader.
Trade FiltersTrade filters define the setup conditions that will allow a trade to oc-
cur. An example of trade filters would be: “Price above its 50- and 200-pe-
riod moving averages while making new 20-day highs.” This example could
define the setup for a long trade. Trade filters should not be confused with
the trade trigger. Trade filters simply define the conditions for when the
trade trigger is active. Trade filters can be thought of as the “safety” for the
trade trigger. Once all of the conditions for the trade filters have been met,
the safety is off and the trade trigger becomes active. Trade filters must
occur before the trade trigger.
Unlike a trade trigger, trade filters may include a variety of factors.
These can take into consideration the time of day, general market indices,

190 Make Money Trading
multiple charting intervals, indicator values, and price relationships. As
with any aspect of a trading plan, each of these factors must be clearly
defined to avoid any ambiguity. Trade filters provide a method of sifting
through numerous forms of market information to find the ideal, high
probability trading opportunities.
As a general guideline, a trader should only use about four or five dif-
ferent filters in his or her initial trading plan. Too many filters can limit
the “degrees of freedom” of a trading plan, and make it less effective in
real trading. The goal of an effective trade filter is to define optimal market
conditions or to create greater tradability. Too many filters may limit the
ability of a trading plan to be robust and produce consistent trades.
Trade ExitsTrade exits are a critical aspect of a trading plan. While many traders
put the majority of their research into trade entries, it is the exit plan that
will define the ultimate success of a trade. Trade exits are often referred
to as money management, since this is what trade exits really accomplish.
Using the same entry method (trade filters and trigger), a trade could be
either a winner or loser depending on when a trader chooses to exit the
trade. Trade exits are an important and often overlooked component of a
trading plan that require adequate research and testing—at least as much
as trade entries.
Traders often elect to use multiple exits in a trading plan. Multiple ex-
its help traders protect profits by cutting losses short and allowing winners
to run. In addition, exits can allow a trade to reverse directions (change
from a long to a short position, for instance) if there is a sudden change
in the market environment.

Developing a Trading Plan 191
Stop LossThe importance of a stop loss has been mentioned in earlier chapters.
This type of trade exit allows traders to establish per trade risk limits, and
is an essential element of a responsible trading plan. The fact is there is a
limit to how much a trader can afford to lose before margin requirements
are exceeded and they cannot continue to trade. We do not want to reach
that level, ever.
Traders must decide how much they are willing to risk on any individ-
ual trade, and this should be a small percentage of an overall account value
(the Turtles, for instance, used 2%). For newer traders, it is often easiest to
FIGURE 7.3
This chart illustrates the negative effect of setting stop loss levels too tight. The same chart interval and trading strategy
can be seen in Figure 7.8, but with more realistic stop loss levels.

192 Make Money Trading
set a dollar amount as the stop loss. This allows consistency and a fast, reli-
able calculation of stop orders to a broker. It is important that traders do
not let a stop loss pass by. Reaching a stop loss should not be considered
a failed trade; it is simply a trade that got stopped out. A failed trade is one
that does not follow the trading plan. Good market traders simply execute
the trading plan exactly as it is written; any analyzing (or second-guessing)
of the trading plan falls under the jurisdiction of the strategist.
It is important to develop realistic stop loss levels as part of a trad-
ing plan. Some traders feel overly confident when using a small stop loss,
thinking that they are trading conservatively. The fact is, several small
losses can add up to a big loss, as seen in Figure 7.3. The circled trade, in
particular, represents a long trade that was quickly stopped out despite a
significant price increase (favoring the long trade). The results of setting
a stop loss level too small can provide the same negative outcome as set-
ting a stop loss too large. When deciding on stop loss levels, it is impor-
tant that they allow enough room for a trade to become profitable. Few
trades will move immediately in the intended direction. More commonly,
price will oscillate (possibly for a number of days) before making a more
powerful move. Traders should understand the volatility of their intended
markets to determine a reasonable stop loss level.
Once again, always trade with a stop loss.
Profit Target(s)Profit targets define when an open trade will begin to take profits. A
profit target is the most reliable means of achieving a profit goal, and is
usually defined by a limit order. Unlike other exit methods, a profit target
will close the trade as soon as price reaches the desired price level. In other
words, we do not have to wait for price to fall back to exit the trade; it will

Developing a Trading Plan 193
happen immediately, even at the top of the price move, upon reaching
the target price.
Profit targets should be defined prior to opening a trade and, like a
stop loss, will depend on the volatility of the market. As a rule, the amount
of a profit target (or average of multiple profit targets) must be higher than
the amount of the stop loss. Maintaining a constant relationship between
the level of the stop loss and the profit target(s) can help create a trading
plan with a consistent +R advantage.
The down side of exiting a trade with a profit target is that it cannot
follow the trend of the market. In many cases, a winning trade may exceed
the profit target, continuing to produce a greater profit. Reaching a profit
target will exit the trade at its predetermined level, regardless of the current
strength of the market.
Stop ExitsStop exits include any type of exit that attempts to follow the move-
ment of price. The goal of stop exits is to protect profits by moving the
stop exit level in the direction of the market. This type of exit includes
the breakeven and trailing stops described in Chapter 6—Placing Trades, as
well as other stop methods that change with the volatility of the market.
Similar to a static stop loss, stop exits begin at a set distance from the
entry price; however, stop exits move progressively towards the current
price once a specific threshold is reached. Stop exits can be a good tool
for following the price of a trending market while providing enough room
for small price fluctuations. When using stop exits, price must fall back
to a certain level in order to close the trade. This means that traders will
never close a trade with a stop exit at the highest point of a price move.
This type of exit is also prone to more slippage in live-market trading than
may be illustrated in historical modeling.

194 Make Money Trading
Time ExitsTime exits will close a trade after a set amount of time or number of
candlestick bars has passed. This type of a trade exit is used to establish
the maximum time horizon in which a trade will take place. At the end
of this time, the trade will be closed, with or without a profit. Time exits
can be particularly useful to day traders who seek to close out all of their
positions by the end of the trading day.
It should be noted that, in many cases, the overall style of trading
could also be defined by the time exit. Day traders, for instance, must
consistently exit all positions by the end of the day in order for this style
of trading to be valid (otherwise, it would be considered swing trading).
Day traders who ignore this time exit (deciding to hold onto a position
overnight) may be violating their trading plans, and possibly changing the
basic principles for their style of trading. This is similar to ignoring a stop
loss, and can cause traders to lose control of their risk. It is important to
obey the time exits of a trading plan, as this is a key tool for developing
trading discipline.
Signal ExitsSignal exits refer to a condition occurring in the market that indicates
when traders will exit, or flatten, their open positions. Signal exits are
based on the adverse action of price, an indicator, or an outside market
relationship. An example of a signal exit could be: “Close all long posi-
tions if the $TICK index rises above 1,200.”
Signal exits can be a helpful tool that helps traders stay away from
uncertain market conditions. Similar to a trade trigger, signal exits must be
clearly defined and represent a point of immediate action.

Developing a Trading Plan 195
Strategy TypesUnfortunately, there is no Swiss army knife of trading strategies that
will work in every possible market condition. Traders must decide in
which market conditions their trading plans will be designed to work best.
Defining a strategy type helps traders develop a trading plan that will be
effective at catching the right kind of market moves. This makes it pos-
sible to qualify the strategy, since either it has caught the correct market
action or it has not. While there are many different strategy types, we will
focus on the three basic models: trend following, counter trend, and pat-
tern recognition.
Each of these strategy types focuses on different market conditions,
and each has its advantages and disadvantages. Most importantly, traders
can profit using any of these strategy types, provided they are designed
properly and applied to the correct markets. Deciding what type of strat-
egy to use comes down to personal preference. Most of us tend to have
a natural inclination for a particular type of market action. For instance,
some traders will see a powerful trend with skyrocketing prices and think,
“It looks like it’s time to sell,” while others may think, “What an incredible
opportunity to jump on for the ride!” Either of these concepts may work
equally well if applied correctly.
Markets often go through phases or cycles of activity. These phases
can range from slow moving, consolidating markets to fast-paced, trending
ones. Each of these phases has only one thing in common: we are not cer-
tain when it will occur. Knowing this, we must accept that if our trading
plan is designed to catch large trends, it may not show similar expectancy
during non-trending or range bound market conditions. Conversely, trad-
ing plans that are designed to profit from quick turns in overbought/over-
sold market environments may miss the large trends.

196 Make Money Trading
Trying to create a trading plan that will work equally well in every
market condition is almost impossible, and can significantly limit the ef-
fectiveness of the plan when optimal market conditions occur. Defining
a strategy type requires a necessary compromise that traders must face
in order to establish the goals of a trading plan. Traders that cannot ac-
cept this compromise often spend incredible amounts of time and money
searching for the elusive “Holy Grail” of strategy types, only to find that
it does not exist.
The following examples are meant to demonstrate different strategy
types as well as the elements of trading plan design. These examples are
not complete trading plans and are simply intended to act as a starting
point from which traders may continue their own research. The EasyLan-
guage code for these strategies can be found in Appendix B.
Trend FollowingAs the name implies, trend following strategies attempt to catch the
largest price moves in a market. Trading plans that use trend following
typically have a lower percentage of winning trades, offset by the size of
the winning trades being much greater than the losing trades. In order for
a trend following plan to be successful, it must catch every strong trend
in a market. To accomplish this, trend followers are often continually in
a trade (long or short), so they are guaranteed to be in the market when
a strong trend develops. A common technical tool for trend following is
a moving average or series of moving averages. This type of indicator can
allow traders to spot a trending market based on the movement of price
from its average.
The first trading plan example (Figure 7.4) uses a trend following strat-
egy type applied to the Euro/US Dollar forex pair. The rules for this
system can be seen in Figure 7.5. In general, because the forex markets will
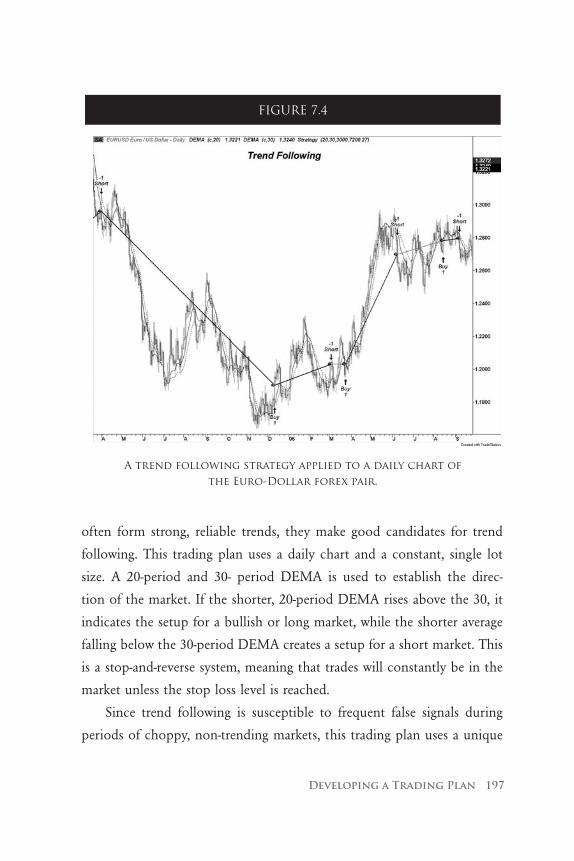
Developing a Trading Plan 197
often form strong, reliable trends, they make good candidates for trend
following. This trading plan uses a daily chart and a constant, single lot
size. A 20-period and 30- period DEMA is used to establish the direc-
tion of the market. If the shorter, 20-period DEMA rises above the 30, it
indicates the setup for a bullish or long market, while the shorter average
falling below the 30-period DEMA creates a setup for a short market. This
is a stop-and-reverse system, meaning that trades will constantly be in the
market unless the stop loss level is reached.
Since trend following is susceptible to frequent false signals during
periods of choppy, non-trending markets, this trading plan uses a unique
FIGURE 7.4
A trend following strategy applied to a daily chart of the Euro-Dollar forex pair.

198 Make Money Trading
entry method to help define the start of a trend. These entry rules are
detailed in Figure 7.6. Once the short-term and long-term DEMAs cross,
the high or low of the previous day’s price will be used as the trade trig-
ger. For a long trade entry, once the 20-period DEMA crosses over the
30-period, the high of the previous bar is noted as the “trigger high”. The
next filter condition that must take place is a candlestick bar closing below
this trigger high. This completes the filter setup, and a stop order to buy is
placed at the trigger high level. Once price reaches this level, a long trade
will be initiated. Reversing these signals and using a “trigger low” provides
the entry rules for a short trade.
FIGURE 7.5
A description of the Trend Follower trading plan.

Developing a Trading Plan 199
The exit rules for this trading plan are quite simple since the majority
of trades will exit on an opposing trade entry signal. This allows the trades
to reverse direction and stay in the market to catch a newly developing
trend. A protective stop loss exit is used to close out trades that have gone
in the wrong direction. While this stop loss is quite large, most trades
are exited long before the stop loss amount is reached. This allows for
a much larger average winning trade than the average loser. A complete
performance report for the historical modeling of this trading plan can be
seen in Figure 7.7.
FIGURE 7.6
A description of the entry method used in Trend Follower trading plan.

200 Make Money Trading
Trend following strategies work well for traders who like to catch the
big moves and who don’t mind sitting through long periods of regular
market oscillations. Many enthusiastic trend followers use the expression,
“The trend is your friend.” Trend following requires an element of pa-
tience as markets are not always trending. Another factor that is critical to
successful trend following is that traders must have the discipline to take
every trade that meets their entry criteria since the overall success of trend
following often comes from just a few trades that show extraordinarily
large profits. Missing one of these large winning trades can have a signifi-
cant negative impact on the results of the trading plan.
FIGURE 7.7
A historical testing performance report for the Trend Follower trading plan during the period of 12/31/2001 to 1/2/2007.

Developing a Trading Plan 201
Counter TrendCounter trend strategies rely on frequent market oscillations to make
consistent gains. Each winning trade often reflects price moves that are
many times smaller than the preceding trend. This type of logic anticipates
the possibility of price reversing in the opposite direction. Technical in-
dicators, such as trend lines and oscillators, are often used to help define
market turns and establish areas of high probability reversals. In a counter
trend trading plan, trades are much more frequent than with trend fol-
lowing. In addition, counter trend trading minimizes the amount of time
open trades are in the market and may limit a trader’s risk exposure.
FIGURE 7.8
A counter trend swing trading plan applied to a daily chart of the E-mini Russell 2000.

202 Make Money Trading
The rules for a sample counter trend, swing trading plan can be seen in
Figure 7.9. This plan uses the ADX and Premiere stochastic indicator that
was introduced in Chapter 5—Charting the Market. A daily chart interval
of the E-mini Russell 2000 futures contract will provide the target market.
Frequent price swings are common in stock index futures, creating good
markets for counter trend trading. The entry conditions for this trade plan
require the 14-period ADX to be below 52. Since counter trend strategies
trade in the opposite direction of the current trend, these trades are often
stopped out if the trend becomes too strong. The ADX will help define
FIGURE 7.9
A description of the Counter Trend swing trading plan.

Developing a Trading Plan 203
the strength of the trend; and if the trend is above a 14-period ADX level
of 52, we will choose to stay out of the market.
The entry trigger for this plan requires the Premiere stochastic to cross
below a level of 0.90 or 0.20 for a long position and above -0.90 or -0.20
for a short position. A trade will be entered with a market order on the
open of the bar that follows the Premiere stochastic cross at any of these
four levels. The logic for using these thresholds is that price will often re-
trace or reverse following a strong push. This counter trend entry attempts
to identify these price pushes early and anticipate the change of price di-
FIGURE 7.10
An historical testing performance report for the Counter Trend swing trading plan during the period of 12/31/2001 to 1/2/2007.

204 Make Money Trading
rection. Since we can profit from even a modest price move, an early entry
will allow for the greatest chance of reaching our target.
The exit rules for this strategy involve an exit bracket (combination
of stop and limit order) with an $800 stop loss and a single $1,600 profit
target. The difference between the amount of the stop loss and profit
target is set to a consistent +R advantage of 2, meaning the profit target is
twice as much as the stop loss. Another possible exit would be an entry
signal in the opposite direction. In this instance, the current trade would
be immediately closed and another initiated in the opposite direction
(stop-and-reverse).
The historical modeling results for this trading plan can be seen in
Figure 7.10. Counter trend strategies offer an active style of trading that
is appealing to many fast-paced traders. This type of trading will often
trade against the dominant trend or will catch a new trend early, exiting
after a small part of the move. Traders who use this type of strategy must
maintain consistency in their money management. Since the success of
this system depends on a constant +R advantage, missed stop losses or
early profit taking can easily break down the profitability for this type of
trading plan.
Pattern RecognitionPattern recognition relies on regularly occurring price patterns for
trade entry or exit rules. Individual markets often display a tendency to
move in a particular direction following the formation of reoccurring
price patterns. Candlestick charts may provide the best means for using
this type of logic, since these charts make price patterns relatively easy to
identify. Pattern recognition can be done visually or with the help of a
computer. While there is a large variety of named price and candlestick

Developing a Trading Plan 205
patterns, traders must research which patterns work best in their intended
markets and charting intervals.
The next sample trading plan (Figure 7.11) looks for bullish and bear-
ish engulfing patterns to day trade the QQQQs using a 15-minute chart,
and is described in Figure 7.12. Engulfing candlestick patterns (discussed
in Chapter 5—Charting the Market) create a type of reversal pattern, often
signaling the beginning of a new trend and a good point to enter a trade.
For this example, we will look for an established trend that can be de-
fined by three candlestick bars, each with open and closing prices succes-
FIGURE 7.11
A pattern recognition day trading plan applied to a 15-minute chart of the QQQQs.

206 Make Money Trading
sively lower for a long setup, or open and closing prices that are progres-
sively higher for a short setup. In addition to this price pattern filter, the
ADX will once again be used to stay away from excessively strong trends.
For this application, we will only consider a trade when the 14–period
ADX is lower than 30.
The trade trigger will be the bar that engulfs the previous bar. For
a long trade, the engulfing candlestick bar must be an up bar, and for a
FIGURE 7.12
A description of the Engulfing Pattern Recognition day trading plan.

Developing a Trading Plan 207
short trade it must be a down bar. A market order will be used to enter
the trade as soon as this engulfing bar is confirmed at the close of the
15-minute interval.
Since this is a day trading strategy, a mandatory time exit will close
any open positions before the end of the trading day (4:00 EST). An initial
stop loss will be set for $200 with an accompanying profit target at $900. A
$200 trailing stop will be implemented that will move with price, maintain-
FIGURE 7.13
An historical testing performance report for the Engulfing Pattern Recognition day trading plan during
the period of 1/3/2006 to 1/3/2007.

208 Make Money Trading
ing a $200 gap between the stop level and the highest point of the price
move during the life of the trade. In addition, this type of strategy can
reverse positions if an opposing engulfing pattern occurs.
The performance of this trading plan can be seen in Figure 7.13, and
depends heavily on its ability to follow a trend once in a position. The
trailing stop allows this strategy to move with the trend and capture a po-
tentially large move. Once the position has reached the $900 profit target,
however, the probability of the trade falling back to its trailing stop level
($700 profit) becomes relatively high, and the position is closed with a
profit that is 4.5 times higher than the initial risk.
Pattern recognition strategies are often a hybrid of trend following
and counter trend strategies. They may attempt to catch a continuation
of a trend or spot new market reversals. Traders should take the time to
carefully define their patterns, as this form of trading can easily become
subjective. While it is easy to spot patterns that would have led to power-
ful price moves in hindsight, traders should be able describe their patterns
in a forward market as well.

Chapter 8Evaluating and Comparing Trading Plans
In Chapter 1—The Fundamental Concepts of Trading, we introduced
some important measures that could be used to determine the optimal
amount of risk in a simple coin-tossing example. In this chapter, we will
use those same concepts, and show how they can be applied to trading.
While the math will be a little more complex and will require the use of
a spreadsheet, the concept of objectively measuring trading risk and per-
formance is very similar to the concepts demonstrated in the coin-tossing
examples.
During this chapter, we will look at four important elements of assess-
ing a trading plan:
1. Measuring key performance metrics that can be used to evaluate
a trading plan.

210 Make Money Trading
2. Defining the amount of risk in a trading plan.
3. Establishing an optimal percentage of risk to use as a baseline for
position sizing.
4. Applying methods that help a trading plan to perform as close as
possible to historical modeling.
The overall goal of objectively measuring a trading plan is to improve
on the plan. This may not just equate to making more money, but devel-
oping a plan that is more tradable or more consistent. In addition, every
step in the development process of a trading plan requires an evaluation to
ensure the system is on track and ready to move forward. Reliable testing
will help traders develop and improve their plans in the shortest amount
of time.
The easiest way to analyze a trading plan is to view the trade results
in a backtesting program. This allows traders to instantly see performance
reports from historical market data, such as those shown in Chapter 7—
Developing a Trading Plan. Using a backtesting program also provides
a method of quickly prototyping trading ideas, and allows for relatively
accurate and objective testing. Traders that use backtesting software must
make sure they have correctly programmed the rules of their strategies into
the software and, in addition, should review each hypothetical trade on a
chart to check for accuracy.
Backtesting software is not the only method of measuring a trading
plan. Traders without automatic backtesting capabilities can still benefit
from this important type of performance analysis. Long before backtesting
software was available, traders developed tools and systems to manually
test their trading plans on historical data. Traders can visually backtest the
logic of a trading plan by reviewing historical charts and recording the

Evaluating and Comparing Trading Plans 211
FIG
UR
E 8.
1
A p
erfo
rm
anc
e an
alys
is s
prea
dsh
eet
sho
win
g t
he
res
ult
s fr
om
th
e T
ren
d F
oll
ow
ing
sam
ple
plan
th
at
was
intr
od
uc
ed i
n C
hap
ter
7—
Dev
elo
pin
g a
Tr
adin
g P
lan
. On
ce
trad
e d
ata
is e
nte
red
in
to s
ecti
on
A,
the
spr
ead
shee
t w
ill
cal
cu
late
th
e r
est
of
the
key
per
for
man
ce
mea
sur
es.

212 Make Money Trading
exact trade entry and exit points into a spreadsheet, as seen in Figure 8.1.
This method, while more time consuming, often helps traders develop a
feel for the implementation of their trading rules. For this process to be ef-
fective, traders must be careful not to use any hindsight in deciding which
trades would or would not have been taken. A recommended practice is to
use a piece of paper to cover all but the most recent bars on a chart and
advance bar-by-bar until a trade entry or exit is located. Traders may also
be able to accomplish this be scrolling a chart slowly across their moni-
tors. The process of manually identifying trades must be objective, and if
traders find themselves thinking things like, “I would have never taken that
trade if I was really trading,” they are not doing it correctly.
Defining Important Performance Metrics
There are a hundreds of different performance metrics or statistics
that can be used to evaluate a trading plan. Traders often develop a pref-
erence for those metrics that are most valuable based on their particular
trading style or business goals. We will look at several performance metrics
that we consider the most important for assessing a variety of different
trading plans.
While traders who use backtesting software will be able to get many
of these performance metrics directly from within their programs, it is rec-
ommended to use the performance analysis spreadsheet described below,
since it will be used to demonstrate other important concepts later in the
chapter. The EasyLanguage code for importing trade data directly into a
spreadsheet is provided in Appendix B.

Evaluating and Comparing Trading Plans 213
Once traders have compiled a list of trades (the trade journal in Ap-
pendix C can be helpful for this purpose), the trades can be put into a
spreadsheet for further analysis. The following spreadsheets were created
using Microsoft Excel, and traders should familiarize themselves with this
powerful tool. Traders can construct a performance analysis spreadsheet
using the following procedure:
Section A—Individual Trade Data (Figure 8.1): For each trade, type
the entry price, exit price, number of shares or contracts traded, and the
trade direction (long “+1” or short “-1”) into columns A, B, C, and D.
Traders also must enter the full point value for the specific trading instru-
ment ($100 for the E-mini Russell or $1 for the QQQQs, for instance)
into cell N1. Please note that no data or formulas should be entered into
the first row as this is reserved for the column labels. In addition, please
note that the formulas reference an arbitrary number of rows as 122,
which provides ample space to begin testing. If more than 122 trades are
listed, all references to 122 will need to change to compensate for the in-
crease in the number of listed trades.
Section B—Individual Trade Formulas (Figure 8.2): Enter the eight
formulas in the second row of columns E through K, and drag them down
to the last row in which a trade has been entered. (Column K has two for-
mulas: the first formula is entered in cell K2 and is not dragged; the second
formula is entered directly below in cell K3 and is dragged down to the last
row in which a trade has been entered.) This data can be used to establish
the per trade performance characteristics for the trading plan.
Section C—Performance Formulas (Figure 8.3): Add the initial ac-
count value, Ruin%, and Maximum Risk into cells N11, N12, and N21.
Then, enter all of the formulas into the correct cells of column N. This
section includes performance statistics, risk of ruin calculations, and an opti-
mal risk percentage, allowing for an overall assessment of the trading plan.

214 Make Money Trading
Once all of the data and formulas are entered, the spreadsheet is ready
and can provide the necessary statistics to evaluate a trading plan. This
spreadsheet should be saved as it can be used to compare multiple trading
plans (without reentering all of the formulas) by simply changing the trade
data in section A.
Maximum DrawdownMaximum drawdown refers to the “worst case scenario” for a trading
period. This measures the greatest difference, or loss, from a previous eq-
uity peak. This statistic can help measure the amount of risk and establish
if a strategy is possible given the size of the trading account. In general,
this number should be as small as possible. Trading plans that require large
maximum drawdowns should be avoided.
FIGURE 8.2
The individual trade formulas used in section B of the performance analysis spreadsheet.

Evaluating and Comparing Trading Plans 215
As a basic rule, a trader should begin analysis of a trading plan by deter-
mining how much he or she can afford to risk. If the maximum drawdown
for a trading plan exceeds this amount, the trader may not need to look
any farther; the plan must be revised before it can advance to the next level.
While this performance metric often appears at the bottom of performance
reports in many software packages, it is among the most valuable. It is
recommended that traders begin their analysis by looking at the maximum
drawdown, as this determines the feasibility of a trading plan.
FIGURE 8.3
The performance formulas used in section C of the performance analysis spreadsheet.

216 Make Money Trading
Total Net ProfitThe total net profit represents the bottom line profit or loss for a
trading plan over a specified trading period. This statistic is calculated
by subtracting the gross loss of all losing trades (including commissions)
from the gross profit of all winning trades. While many traders use total
net profit as the primary measure of trading performance, this statistic by
itself can be deceptive.
Just knowing how much money a trading plan would have made
during a trading period does not provide enough information to measure
whether the plan is performing up to its historical standards, or if it is
efficient. Since it is assumed that trading plans will have a positive expec-
tancy, the more time a trading plan is in the market, the more it should
theoretically make. By comparing the same plan during different trading
periods, therefore, traders could expect significantly different total net
profit results. In addition, this metric does not allow us to normalize the
results of a trading plan based on the amount of risk that is incurred.
Let’s face it, we all want to know how much money a trading plan
could have made…our business depends on this type of projection. We
must be careful, however, not to get blinded by this number, and we must
continue to look at the overall statistics for a trading plan. Total net profit
alone does not allow traders to adequately compare or track the perfor-
mance of a trading plan.
Profit FactorThe profit factor can be thought of as the R advantage for the com-
plete trading plan. While the R advantage is only used to measure the risk
ratio of individual trades, the profit factor is defined as the gross profit
divided by the gross loss (including commission) for the entire trading

Evaluating and Comparing Trading Plans 217
period. This performance metric relates the amount of profit per unit of
risk, with values greater than one showing a profitable trading plan.
In theory, this number should be as high as possible. In reality, ex-
tremely high profit factors rarely correlate to actual trading performance.
Most successful trading plans may have anywhere between a 1.5 and 5.0
profit factor. One method of comparing profit factors is by looking for
consistency over time, regardless of the trading period.
Percent Profitable The percent profitable is also known as the probability of winning.
This statistic is calculated by dividing the number of winning trades by
the total number of trades for a given trading period. The percentage of
profitable trades depends entirely on the type of strategy employed in a
trading plan.
Typically, trading plans will have between a 40 and 60 percentage of
winning trades. Trend following strategies tend to have lower values, while
trading plans using counter trend or shorter-term styles of trading tend to
be higher. In addition, trading plans that rely on values greater than 80%
are rarely reliable in live trading. Traders do not necessarily need a high
percentage of profitable trades to create a successful trading plan. A more
important goal of using this metric is to find a consistent percent profit-
able during each level of development, and in live trading.
Average Trade Net ProfitThe average trade net profit is the expectancy of a trading plan. This
metric represents the average amount of money that was won or lost per
trade, and is calculated by dividing the total net profit by the total number
of trades. This metric provides a useful indication about the future perfor-
mance of a trading plan. This calculation is significantly affected by the

218 Make Money Trading
position size, since larger position sizes will magnify the average winning
and losing trade amounts. For this reason, it is recommended to initially
test a trading plan using a constant, minimal position size. This will allow
a more accurate comparison that can be used to gauge the efficiency of
the plan. In other words, traders should avoid increasing position size to
improve this statistic.
Another factor that should be taken into account is how close this
average relates to the biggest trades. Occasionally, historical modeling re-
sults may be skewed by a single trade that creates a profit (or loss) many
times greater than a typical trade. This type of trade, know as an outlier,
may create unrealistic results by over-inflating the average trade net profit.
In this case, it may be best to remove the outlier, especially if the success
of the trading plan is based on this single trade. Trading plans that rely on
one or two abnormally large trades over a trading period are often closer
to gambling that realistic trading.
Risk MeasurementsFor every success story like the Turtles, there are even more tales of
trading disaster due to improper risk management. Such is the case with
a hedge fund trader for Amaranth Advisors who lost over $4 billion in
the course of one week during the fall of 2006. Hedge funds, which are
aggressively-traded portfolios catering to high net worth investors, attempt
to generate unusually high returns by employing many of the same tactics
used by active traders. This includes short trades, trading a wide variety of
alternative markets, and applying trading leverage, or margin.
As mentioned earlier in this book, leverage must be used responsibly;
otherwise, traders risk very high losses. For the Amaranth trader whose

Evaluating and Comparing Trading Plans 219
account had previously been up roughly $2 billion earlier in the year, a
5-to-1 leveraged trade in the gas futures market spelled disaster. Looking
back on this incident, traders should be wondering, “What type of risk
management was he using?” This catastrophic loss points out the impor-
tance of measuring and assessing risk in a trading plan. While this trader
may have generated impressive returns in the past, he ignored the exces-
sively high risk of ruin that his trading tactics were creating. Even worse,
he dismissed the primary goal of successful trading: to always protect your
trading capital
Risk of RuinPreviously, we defined the risk of ruin as the probability of losing ev-
erything. At this point, we must redefine the risk of ruin for an individual
trading plan. The reality is that most traders would not risk bringing a
trading account all the way down to zero, nor is this even possible given
minimum margin requirements. Thus, we must define a percentage of an
account to consider as the point of ruin, or bankruptcy.
It is important to acknowledge that the risk of ruin is most critical
during the early stages of trading. When traders first begin, they often have
the least amount of money to lose since they have not yet begun making
trading profits to grow their accounts. A string of losses at the beginning
of a trading business can be much more significant than later on. For this
reason, traders must approach the initial stages of their trading businesses
very carefully.
The risk of ruin calculation section of the performance analysis spread-
sheet, shown in Figure 8.4, defines the elements used for this measurement.
Traders must enter their starting account balances and the ruin percentage
in order to define an ultimate risk level. For this example, we have used 21
trades from the counter trend swing trading plan that was introduced in

220 Make Money Trading
FIG
UR
E 8.
4
A p
erfo
rm
anc
e an
alys
is s
prea
dsh
eet
sho
win
g t
he
res
ult
s fr
om
21
trad
es i
n t
he
C
ou
nte
r T
ren
d s
win
g t
rad
ing
sam
ple
plan
.

Evaluating and Comparing Trading Plans 221
Chapter 7—Developing a Trading Plan. We have chosen a $15,000 trading
account and are willing to risk 50% of this amount, or $7,500. In other
words, if the value of this account falls below $7,500, all trading will cease,
and we will have reached the point of ruin. This trading plan shows strong
historical performance characteristics while trading a single E-mini Russell
2000 futures contract. As a result, we have a very reasonable 0.2% risk of
ruin probability.
The user-defined ruin% (cell N12 in our spreadsheet example) should
not be confused with the percentage of the overall account that we are
trading. The ruin% simply defines how much of the initial account will
be considered in the risk of ruin calculation. A larger ruin% will equate to
a smaller risk of ruin because we now have more money that can be lost
before we reach the point of ruin. For instance, changing the ruin% to
.70 would mean that we would have a larger, $10,500 amount to risk, and
would decrease the risk of ruin to only .02%. For the most part, these
numbers should remain constant as traders begin the development of a
trading plan.
The purpose of this statistic is to objectively measure the risk in any
possible trading plan or position sizing methodology. As traders increase
their position sizes, for example, the risk of ruin will also change to reflect
additional risk. If, for instance, we were to use our original ruin% of .5
and trade a constant position size of 10 contracts instead of one (changing
the value of every cell in column D to 10 or -10), we would increase the
probability of ruin to 54%. This would tell us that if we began trading 10
contracts, the chances of losing $7,500 would be greater than the odds
of a fair coin toss. (The only way traders could trade 10 contracts using a
$15K account is with day trading margin rates). It can also be noted that
the maximum drawdown for trading 10 contracts in this sample trading
plan is -$16,000; more than the entire value of the account. Trading at this

222 Make Money Trading
level is not realistic, and most responsible traders would not even consider
such terrible odds.
Optimal Risk PercentageThe optimal risk percentage is simply the mathematical optimization
of trading risk…it should not be used as a recommendation for how much
to risk in actual trading! In fact, trading at optimal risk percentages could
lead traders to take on high levels of risk with excessively large prob-
abilities of ruin. Traders should only use the optimal risk percentage as a
reference to understand the possibility of geometric account growth for a
particular trading plan.
In Chapter 7—Developing a Trading Plan, the importance of fixed per-
centage position sizing was discussed as a method of controlling risk and
maximizing profits. Using this concept, we can look at the performance
analysis spreadsheet to explore the possibility of different per-trade risk
percentages. The sample trades in Figure 8.4 will once again be used to
demonstrate these calculations. An initial maximum risk percentage value
must be entered into cell N21 to represent an arbitrary risk level, and will
be changed later on (this percentage must be entered as a decimal). The
theoretical account growth represents the possible total net profit of the
trading plan had it used this maximum risk percentage.
To optimize this theoretical account growth, we can use the chart
in Figure 8.5 that was created by varying the maximum risk percentage
and recording the corresponding theoretical account growth values from
the spreadsheet (this may also be accomplished using the Solver Add-In
feature in MS Excel). In this case, a 0.43 maximum risk percentage will
optimize the account at an impressive $533,038.26. The darker grey bar
behind the curve represents the initial account value.

Evaluating and Comparing Trading Plans 223
Traders should not assume that they could turn a $15K account into
$533K just by increasing their trade risk to 43%. This could only happen
if all 21 trading conditions lead to exactly the same profits and in the
same sequence all over again (without consideration of margin require-
ments). This is simply not a reality of actual trading. Instead, we have
established the upper limit to the maximum risk percentage for each trade.
Knowing this limit, traders can now determine a much lower risk percent-
age that offers a more reasonable risk of ruin while maintaining decent
profit potential.
FIGURE 8.5
A curve representing the relationship between theoretical account growth and maximum risk percentage.

224 Make Money Trading
It should be noted that the calculations associated with optimal risk
in the performance analysis spreadsheet are only projections, while all of
the other statistics relate to the actual performance of the trade data. For
instance, changing the maximum risk percentage will not affect the risk
of ruin or any other trade metrics, with the exception of the theoretical
account growth value and the equity multiplier column. While we feel it
is important to understand the implications of optimal risk—that there
is a point where more risk does not equate to greater profits—trading at
optimal risk levels is not practical because of the corresponding high risk
of ruin levels.
Slippage and CommissionSlippage and commissions are important factors that will have a nega-
tive effect on the profitability of a trading plan. These factors are an un-
avoidable reality of trading and must be taken into account in order to
create reliable projections.
Slippage is a set amount that is subtracted from each trade, providing
a method of simulating real market trading conditions. The amount of
real-life slippage will vary between markets and the type of trading strategy
that is implemented. As a starting point, traders should add at least one
tick (the minimum price fluctuation) of slippage to each trade. Once a
trading plan has undergone live-market testing, a more realistic slippage
value can be used in subsequent evaluations. Commission rates are easy to
calculate because they are readily available from a broker and are simply
subtracted from every trade.
Slippage and commissions will have a much larger effect on shorter-
term styles of trading due to the greater frequency of trades. Day trading

Evaluating and Comparing Trading Plans 225
plans, for instance, can see a significant eroding of profits due to this
factor. For these traders, it is especially important to test a system using
realistic slippage and commission values. Traders who wish to add slippage
and commission to the results of the performance analysis spreadsheet
can change the formula in cell E2 and drag it down to the bottom of
the sheet:
Cell E2 (and drag down): = (B2-A2)*C2*D2*N$1-30
This formula will now subtract $30 from every trade to account for
slippage and commission. Traders may change the “30” in the formula to
another number that reflects values more appropriate for an individual
market, position size, or trading plan.
Optimizing and Over-Optimizing (Curve Fitting)
Optimizing refers to the process of modifying values within a trading
plan with the goal of achieving better performance. Once traders develop
the tools to assess a trading plan, it is possible to change part of the plan,
such as the length of a moving average or ADX value, to create better
historical results. Optimizing can help tune a trading plan to a specific
market by definitively answering the question, “Which value would have
worked best?”
Traders often find that they can make significant improvements to the
performance of a trading plan through careful optimizing. For example,
the Counter Trend swing trading plan uses a 14-period ADX value of 52
as a filter. This value was chosen as the result of testing an entire range

226 Make Money Trading
of 14-period ADX values between 30 and 70, as seen in the optimization
report in Figure 8.6. This report, available in backtesting software, allows
a quick comparison of the effect that different values would have on the
plan. From this report, we find the ADX value of 52 to show the best
overall performance metrics for the 123 trades that were tested. Thus, this
optimized value was chosen for our sample trading plan.
While most trading plans will benefit from some level of optimizing,
traders must be careful of the risk of over-optimization. Over-optimizing
refers to excessive curve fitting that produces a trading plan that is unreli-
able in actual trading. An over-optimized plan will often show outstanding
FIGURE 8.6
An optimization report showing the performance metrics for the possible ADX values that could have been used
in the Counter Trend swing trading plan.
Evaluating and Comparing Trading Plans 227
performance statistics, but will only work on the historical data on which it
was tested. Fortunately, there are some indications that a plan has been over-
optimized during the development phases of a trading plan, including:
1. Performance metrics that are “too good to be true,” such as profit
factors in the double digits or the percentage of profitable trades
above 80%.
2. Performance metrics that are based on very few trades.
3. A lack of correlation between in-sample and out-of-sample trading
periods (described below).
The bottom line is that traders must be aware of the risk of over-op-
timization when using this form of historical modeling. Optimizing can
become an addicting part of trading plan development. Traders must keep
in mind that too much optimizing will decrease the effectiveness of a trad-
ing plan in real trading.
Using In-Sample and Out-of-Sample Historical Data
Most traders are familiar with the phrase, “Past performance is not
indicative of future results.” It is important to emphasize that although
historical modeling is an important component in measuring the potential
of a trading plan, it does not guarantee the same results in real trading.
Much like developing a trading plan to begin with, effectively testing and
optimizing a trading plan takes skill and practice. Inadequate historical
modeling can lead to incorrect assumptions about the legitimacy of the
trading plan. In addition, historical modeling is only the first step in build-
ing a complete trading plan.
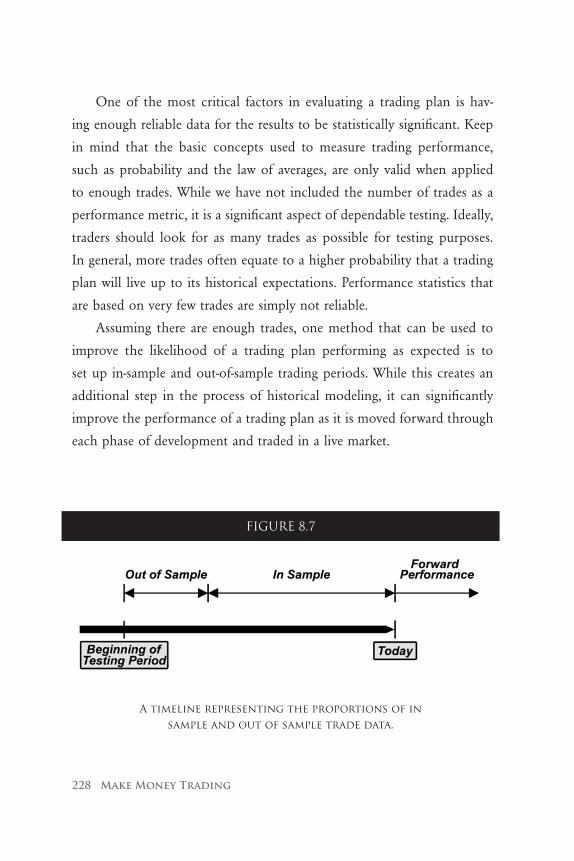
228 Make Money Trading
One of the most critical factors in evaluating a trading plan is hav-
ing enough reliable data for the results to be statistically significant. Keep
in mind that the basic concepts used to measure trading performance,
such as probability and the law of averages, are only valid when applied
to enough trades. While we have not included the number of trades as a
performance metric, it is a significant aspect of dependable testing. Ideally,
traders should look for as many trades as possible for testing purposes.
In general, more trades often equate to a higher probability that a trading
plan will live up to its historical expectations. Performance statistics that
are based on very few trades are simply not reliable.
Assuming there are enough trades, one method that can be used to
improve the likelihood of a trading plan performing as expected is to
set up in-sample and out-of-sample trading periods. While this creates an
additional step in the process of historical modeling, it can significantly
improve the performance of a trading plan as it is moved forward through
each phase of development and traded in a live market.
FIGURE 8.7
A timeline representing the proportions of in sample and out of sample trade data.

Evaluating and Comparing Trading Plans 229
An example of this type of testing involves breaking the historical test-
ing period into thirds and assigning two-thirds of this time as in-sample
trade data and the remaining third as out-of-sample trade data, as seen
in Figure 8.7. Once these sample periods have been established, traders
should only use the in-sample data for the initial testing and development
of their trading plan. The out-of-sample data should be set aside and not
used for anything other than to confirm the validity of the trading plan
(absolutely no optimizations using this data set).
Once a trading plan has been developed using in-sample trade data, it
is ready to be applied to the out-of-sample trades. Comparing the perfor-
mance statistics from the data used to develop the system to out-of sample
data will show how close a trading plan is to being ready for real trading.
Closer correlation between in-sample and out-of-sample data provides a
much greater probability of positive results during forward performance
testing and live trading. It should be noted, however, that as soon as out-
of-sample data is used in a comparison, it is no longer truly out-of-sample.
Each additional test with out-of-sample data decreases its value; therefore,
the data should be used as infrequently as possible.
Once a trading plan has successfully passed through the phase of his-
torical modeling, the next phase of forward performance testing, or paper
trading, provides additional out-of-sample testing. Close correlation be-
tween the real-time results and the historical results provides even greater
confidence that the system will perform as expected during live trading.

230 Make Money Trading
Forward Performance Testing (Paper Trading)
Forward performance testing involves a simulation of actual trading.
This process is often referred to as paper trading since no real trading oc-
curs and any profit or loss will only be on paper. This portion of trading
plan development requires traders to practice all of the elements used dur-
ing live trading, without actually placing real trades. This type of practice
can help traders establish a solid trading routine and develop the skills
that are necessary for successfully implementing their trading plans. The
goal is that forward performance testing will relate to better live trading
performance. Perfect practice makes perfect performance.
Traders should make their forward performance testing as realistic as
possible. More realistic simulated trading will create a much easier transi-
tion into live market trading. When done properly, forward performance
testing acts as a bridge between the historical testing and the actual imple-
mentation of a trading plan.
The problem with forward performance testing is that traders often
take it too lightly. Creating a trading atmosphere with absolutely no stress
or accountability will decrease the usefulness for this type of testing. While
it can be difficult to simulate the pressures of trading with real money,
traders should do their best to create a realistic trading environment.
When done correctly, forward performance testing can significantly help
traders begin to build the confidence and discipline required for successful
live trading.
Two methods should be used to create more realistic forward perfor-
mance testing. The first is to document all simulated trades in a trading
journal, and the second is to maintain a running total of simulated trad-
ing results. Keep in mind that this is practice for becoming an effective

Evaluating and Comparing Trading Plans 231
“market trader” and traders should mimic all of the steps that will be used
in live trading.
Writing trades down in a trading journal will provide a record that
can be evaluated and compared with the performance of historical model-
ing. In many cases, reviewing the simulated trades in a trading journal will
point out areas where traders can improve their ability to precisely follow
their trading plans.
Many brokers offer a simulated account that can be used to gain
familiarity with their order entry software. Using a simulated trading ac-
count can really add to the experience of forward performance testing.
When setting up a sample account, traders should use a realistic value to
mimic the size of their real trading accounts. While it is often an option,
traders should avoid resetting this account, even if it has been significantly
depleted. As much as possible, this account should be treated like an
actual trading account. Even without a simulated account, traders should
maintain a running total of simulated trading performance.


Chapter 9Live Trading
I have to admit, when I first told my father that I was going to start trad-
ing as a business, he smirked and said, “Oh, you’re getting into gam-
bling.” In my naivety, I viewed trading as a calculated business that relied
on research, statistics, and technical analysis to make educated predictions
about future market direction. “Dad, the trading that I will be doing is not
gambling at all,” I asserted. At first, the comparison really bothered me.
Was I really trying to support my family by gambling?
I have now come to realize that the gambling analogy is more accurate
than I could have imagined. Much like the uncertainty in a deck of cards,
live trading also carries a high degree of unpredictability; no one knows
for certain what the market will do next. The truth is that someone always
makes money in gambling (usually the casino!) What we are trying to do

234 Make Money Trading
as traders is stack the odds in our favor by using a positive, consistent ap-
proach: we want to be the house.
In the simplest sense, when we place a trade it will either reach our
profit goals or get stopped out. Either way, it does not really matter; it is
not the individual trade that is important, but the outcome of trading over
time. Experienced traders know this and do not get frustrated with losing
trades, nor do they get overly excited about their winners. Through their
research and experience, they know that following their trading plans al-
lows for the greatest odds of success in a somewhat random market.
Live trading can be stressful at first because we are betting real money
on the success of a trading plan. As mentioned earlier, good trading is sim-
ply reacting to and following a trading plan. It is important to understand
that winning or losing in live trading is not something over which we have
complete control. Just like the uncertainty of choosing the ace of hearts in
a well-shuffled deck of cards, no one can always predict the moves of the
market. Strictly adhering to a trading plan, however, will provide the great-
est odds of success and can significantly reduce the stress of live trading.
Throughout this book, we have been working towards developing a
profitable trading plan that will identify high probability market setups.
This plan, along with live trading practice, will allow us to react quickly as
we see positive market conditions unfold. Additionally, it will also allow us
to react to non-favorable conditions so we can minimize our losses.
PreparationMany of us can remember our high school coaches enthusiastically
barking, “Remember the five Ps of winning: Prior Planning Prevents Poor
Performance.” This recommendation rings true in trading as well as sport.

Live Trading 235
Thorough preparation is an often overlooked but critical aspect of suc-
cessful live trading. Over the course of time, things will go wrong in live
trading, and not having a plan to deal with these situations can cost
money and stress. Developing emergency protocols for live trading can
help traders minimize losses and create a more relaxed trading atmosphere
when problems do arise. More importantly, it can also help traders avoid
these situations all together. This type of preparation can be as simple as
scheduling regular computer maintenance or having a trading account
number handy.
For example, consider the following scenarios:
1. Imagine that a trading plan signals an entry into a short position
in a stock shortly after the open. Once the entry criteria have
been met, the trader carefully places an order to sell short and
quickly gets the confirmation that the order has been filled. The
price starts to bounce around as market participation increases.
The trader begins placing a protective stop loss order in the mar-
ket. Suddenly, he notices that the price on his charts and quote
screen is no longer updating. After the sobering realization that
he has gotten disconnected from his data server, the trader quickly
picks up the phone and pushes the speed dial button that is
preprogrammed to call his broker. After another long pause, he
realizes that it is not just the data server, but also the phone line
that is not working. What should this trader do?
2. In another scenario, a trader has taken a long position in several
index futures contracts over the past couple of days. The trade is
only showing modest profits and the trading plan signals a time exit
to close the trade. After submitting the order to close out the posi-
tion, it is rejected and the trader resubmits the order. A small box
appears on the bottom right corner of the monitor stating that the
236 Make Money Trading
broker’s server is currently down and cannot process any new trade
orders. A quick phone call to the trade desk confirms this and that
no trading can take place. What should this trader do?
In both of these examples, traders were correctly following their trad-
ing plans. The problem was that an event occurred that fell outside the
scope of the trading plan. While some would say that these events are out
of a trader’s control, responsible traders still must consider these possibili-
ties. We will discuss various methods of trader preparation, and then come
back to these scenarios.
Backing up Everything Before live trading begins, traders should think about all of the criti-
cal tools on which they rely for trading. These should all be replaceable.
In other words, traders should have a backup for all of the key tools in
their trading arsenals. This includes both the data and hardware that is
critical for the business. Since a computer is the primary trading tool,
it is important to make regular backup disks and be able to reformat a
computer from scratch if necessary. This includes all essential computer
programs, operating systems, drivers, and data. Some traders even like to
have trading software installed on a secondary notebook computer in case
the main computer fails.
This does not mean that traders need to have an inventory of com-
puter monitors, keyboards, or modems on hand just in case one gets
broken. These items are easily replaceable, costing a day or two to replace.
More important is making a backup of the complex items that may be
more difficult to replace such as charting workspaces, research, or files
containing an entire trading plan. Since many brokers now use electronic
statements to record trading activity, these should also be backed up on a
regular basis as well.
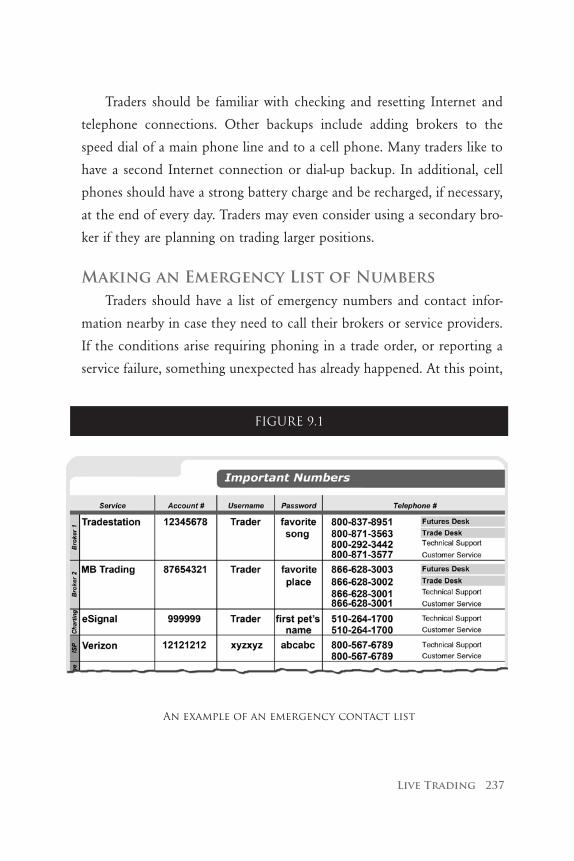
Live Trading 237
Traders should be familiar with checking and resetting Internet and
telephone connections. Other backups include adding brokers to the
speed dial of a main phone line and to a cell phone. Many traders like to
have a second Internet connection or dial-up backup. In additional, cell
phones should have a strong battery charge and be recharged, if necessary,
at the end of every day. Traders may even consider using a secondary bro-
ker if they are planning on trading larger positions.
Making an Emergency List of NumbersTraders should have a list of emergency numbers and contact infor-
mation nearby in case they need to call their brokers or service providers.
If the conditions arise requiring phoning in a trade order, or reporting a
service failure, something unexpected has already happened. At this point,
FIGURE 9.1
An example of an emergency contact list

238 Make Money Trading
the goal is to fix the problem quickly and with the least amount of stress
(and financial loss). While most brokers can take trade orders over the
phone, traders must first prove who they are by stating their account num-
bers and answering security questions. This information should be readily
available so that traders may prepare for these often-stressful situations.
It is highly recommended that traders compile a list of important
phone numbers, usernames, and password hints (not the actual password,
but a hint for remembering the password). This list, as seen in Figure 9.1,
should be posted visibly near the trading desk. Traders will find this to
be an indispensable tool during the early stages of live trading. A work-
sheet for creating a custom list of emergency numbers can be found in
Appendix C.
Creating a Troubleshooting ListA troubleshooting list allows traders to establish and follow a predeter-
mined protocol in the event of a problem. The list helps traders take deci-
sive action as soon as a problem is suspected. A well-defined list will also
help traders establish consistency in troubleshooting which, in many cases,
may mean not repeating prior mistakes. This list should be frequently up-
dated as traders develop more experience (and experience more problems).
The goal is to have the troubleshooting list as inclusive as possible, which
requires thinking about potential problems before they occur, and includ-
ing problems (and their solutions) that have already happened.
Although we would like to think that trading platforms are infallible,
this is far from true, and it is to our advantage to plan for the inevitable
failures. The best way to be prepared to fix a problem is to create a trou-
bleshooting guide specific to the platform being used. This should be an
easy-to-read list that gives a systematic solution to each problem. Giving
it a permanent home on the workstation wall will ensure that it can be

Live Trading 239
I lost my
internet connection
1. Check the phone line. If there is no dial tone and I am
in a trade, use the cell phone to call my broker and close
the trade. If there is a dial tone:
2. Check the connection status at my ISP’s website (under
favorites). Try to reconnect. If that doesn’t work:
3. Manually disconnect the power from both the modem
and the router. Wait 30 seconds and reconnect. Try again
to reconnect at my ISP’s website. If that doesn’t work:
4. Close down all applications, and restart the computer.
Try again to reconnect at my ISP’s website. If that doesn’t
work:
5. Call my ISP to report the problem.
6. Open TS with backup ISP and confirm that I have no
open positions.
I think I got a partial
fill on an order
1. Check the bottom of the TS window. Open positions will
read “0” if I am flat. Any number besides “0” means I still
have an open position.
2. Click on the “Orders” tab in the TradeManager window.
Check how many contracts were filled. (Filed orders will
be highlighted in blue).
3. Outstanding orders will be white.
4. Manually close the rest of the position if necessary; see
below (“I need to manually close a position”)
An example of a troubleshooting list for a specific trading platform.
FIGURE 9.2

240 Make Money Trading
found during stressful times. Color can be used to make the guide easier
to read and follow. This guide should state the problem, and list the steps
that need to be taken to fix it, as seen in Figure 9.2.
Now that we have covered some elements of live-trading preparation, it
is time to revisit the scenarios introduced at the beginning of the chapter:
In Scenario #1, the trader has an open (naked) position in the market
and has lost his telephone and Internet connections. This well-prepared
trader simply takes out his (fully-charged) cell phone, presses the prepro-
grammed speed dial, and is connected to his broker. Using the list of
emergency numbers located at his desk, he easily finds his account number
and password hint to confirm the trade order, and that he is in an open
position. Then, using his troubleshooting guidelines, the trader determines
whether to close the position or place an exit order over the phone. The
next step is to once again use the list of emergency numbers and locate
the contact information for the telephone and Internet service providers
to file a work order to fix the problems.
Scenario #2 involves an open long trade that cannot be closed due to
a broker’s server being down. While not common, this does happen on
rare occasions. Since this breakdown is on the broker’s end, there is noth-
ing the trader can do from her computer…unless she has another trading
account. Experienced traders often use a “backup broker” just for this
type of collapse. An open position that cannot be closed can significantly
damage a trading account, and the broker will not cover the loss. Using
her troubleshooting guidelines, she will open a short trade for the same
size with her backup broker. Since she is not able to close her original po-
sition, the short trade will offset any losses for the long position that she
cannot close (this is known as hedging). While this is a fairly extreme and
rare case, it highlights some of the considerations that traders may have to
make to help control unexpected risks.

Live Trading 241
Staying Mentally FocusedGetting behind a trading desk can feel a bit like climbing into the
cockpit of a fighter jet. Similar to modern jet combat, live trading relies
on a high level of situational awareness in order to make fast, important
decisions. Much like a novice pilot sitting behind the dials, switches, and
controls of an aircraft for the first time, the sheer amount of information
available to traders can be overwhelming. Taking a structured approach
to learning which aspects in trading require the most attention and focus
allows traders to gradually increase awareness and avoid distractions. This
will ultimately allow traders to process information faster, and develop the
reaction times necessary to do battle in today’s markets.
Becoming a focused trader will have different implications depending
on trading style, or specific trading plan. For day traders, this may mean
carefully monitoring price fluctuations throughout the day, while swing
traders may only have to check the intraday markets periodically. Position
traders, alternatively, may not need intraday data at all, and will simply
check the markets at the end of each trading day or week. For each style
of trading, traders must be ready to place a trade order as soon as they
encounter the conditions defined by their trading plans.
Since trading plans are developed and tested using idealized trading,
no allowances have been made for missed trades or trades that fell outside
of the plan. It is just as important that live trading maintain this same
consistency. Traders must follow their trading plans exactly if they hope
to gain the same expectancy from live trading. Following a trading plan
perfectly takes practice, and requires staying mentally focused.
Live trading involves going from long, slow periods of inactivity to
fast, dynamic cycles requiring instant action. Staying mentally focused dur-
ing these slower times in the market will help traders stick to their plans

242 Make Money Trading
FIGURE 9.3
A conceptual scope for developing market awareness. A trader should maintain focus on his or her primary chart,
and expand awareness outward.
FIGURE 9.4
An example of a trader alert that can be used to help traders maintain focus.

Live Trading 243
and not miss trading opportunities. To maintain focus and avoid informa-
tion overload, traders should prioritize which elements are most critical to
successful live trading. Figure 9.3 provides a conceptual scope from which
traders can prioritize market focus. Starting from the inside of this chart
and expanding outward, traders can steadily increase their awareness of
market dynamics as they become more familiar with this information.
Many traders find trader alerts to be a useful tool in helping to im-
prove market focus. Trader alerts are audio or visual alerts that are set to
activate when certain conditions in the market occur. Traders can custom-
ize these alerts within their market analysis platforms. A typical alert may
sound an alarm if a filter condition for a trading plan is met. Once the
condition occurs in the market, a bell may sound along with a pop-up
window, as seen in Figure 9.4, alerting a trader to the potential trade.
Traders should also avoid distractions that may cause missed or incor-
rectly managed trades. Incoming phone calls, instant messages, or a noisy
office space should all be avoided during active live-market trading. These
distractions can contribute to trading errors.
It should be noted also, from a physical standpoint, that being well-
rested and well-hydrated, making healthful food choices, and getting
enough physical activity (exercise) can all contribute significantly to being
able to maintain focus while trading.
Staying mentally focused on the market takes practice, and traders can
measure this by tracking how well they are following their trading plans.
This can be accomplished using a simple percentage scale to rate perfor-
mance, with 100% representing perfect live trading. This rating is most
important during the initial stages of live trading, and it can be included
on the notes section of the trading journal.

244 Make Money Trading
Using a Trading JournalA trading journal can help traders gain important feedback from live
trading and forward testing performance. This type of trading diary, as
seen in Figure 9.5, includes detailed information about individual trades
that performance reports alone do not provide. A trading journal can be
used for the following purposes:
1. To identify potential weaknesses in a trading plan.
2. To verify the individual trades in brokerage account statements.
3. To help determine areas where live trading performance can
be improved.
Whenever live trading or forward performance testing (paper trad-
ing), traders should use a trading journal. The date, time, price, direction,
reasons for the trade, and individual trade notes should be written down
for each trade. In the simplest sense, this provides a record of trading
activity that can be later used to evaluate the performance of the overall
trading plan.
A trading journal can help traders find potential flaws in the plan that
may only become obvious during live trading. For instance, traders may
discover on days when there are Federal Reserve Meetings (commonly
referred to as Fed Days), trades do not follow through or quickly turn into
losers. This type of observation, recorded over time in a trading journal,
can be later evaluated and, if confirmed, a Fed Day filter (for example)
could be added to the trading plan. As another example, if a trader notes
that nine out of ten losing trades were barely stopped out, it may be cause
to evaluate the stop loss level in the trading plan. Conversely, if a trader
notes that nine out of ten winning trades would have gone on to much
greater profits, it may be cause to evaluate the profit target level(s) in the

Live Trading 245
FIG
UR
E 9.
5
A t
rad
ing
jo
ur
nal
use
d t
o r
eco
rd
liv
e tr
adin
g d
ata.

246 Make Money Trading
trading plan. And, as noted earlier with the Fed Days, outside factors, such
as the release of economic data, can turn out to have a predictable effect
on a trading plan. The goal for this type of analysis is to create a more
profitable trading plan that is tuned to live trading experiences.
Another useful purpose of a trading journal is to confirm the trad-
ing activity from a brokerage statement. A brokerage statement, as seen
in Figure 9.6, lists the trades that were taken during the month. Similar
to balancing a checkbook, a trading journal can be used to confirm each
trade transaction and verify that the broker has not made any errors. Entry
and exit prices, profit and loss figures, and commissions and fees should
be carefully checked each month. It should be noted that many brokers
require notification within 24-48 hours of trading activity if there is an
error in their records; for this reason, it is recommended that traders also
check each daily electronic statement (if applicable) for accuracy.
FIGURE 9.6
A monthly brokerage statement that is often sent electronically.

Live Trading 247
Possibly the most critical reason for using a trading journal is to
be able to assess live trading performance. Since traders are ultimately
responsible for evaluating their roles as market traders, reviewing these
journals can help spot aspects of live trading that require improvement.
The individual trade notes section can be especially telling if it is filled out
thoughtfully. It is important to note if the trading plan was not followed
and, if not, to explain why. An amazing trading plan can still lead to great
losses if it is not traded correctly. It is essential that traders are honest with
themselves and that they identify problem areas in their live trading. There
is great opportunity in the notes section of a trading journal; it is recom-
mended that traders put solid effort into this aspect of the journal since it
can provide useful information that is not available from other sources.
Trade AutomationWhile trade automation has already been discussed in Chapter 6—Plac-
ing Trades, live trading with this technology involves some unique con-
siderations. The theory behind automated trading makes it appear simple;
just set up the software, program the rules, and watch it trade. The reality
is that automated trading requires a much higher degree of sophistication
in troubleshooting than other methods of trading. Trading platforms that
support fully automated trading typically involve two components: the
strategy that generates the “theoretical trades” and the order entry plat-
form that turns them into real trades. Because of this integration, there are
twice as many aspects to troubleshoot if an automated system fails during
live trading.
Traders that employ this technology should also maintain a trading
journal, making sure to note all of the system parameters and any anoma-

248 Make Money Trading
lies that occur. Since troubleshooting an automated system often requires
a phone call to tech support, having this information on hand is im-
portant. Traders who automate their trading plans must also anticipate
an event where the strategy may get disconnected from the live trades.
This will require an element of manual trade management that must be
included in the troubleshooting list. As such, traders who automate their
strategies should also be practiced in manual trading.
Automating a trading plan can be a good option for traders who are
comfortable with computers and technology. With the ability to constant-
ly monitor the markets, errors associated with staying mentally focused
and precisely following the rules of a trading plan are minimized: there
is less opportunity for “pilot error” when using trade automation. This
technology often requires modifying strategies to meet the demands of
live trading, however, and may require additional programming to more
precisely define the entry or exit rules of the automated strategy based on
live trading performance.
Trusting Your Trading PlanTraders must learn to trust their trading plans if they hope to develop
a profitable trading business. For many traders, the emotional aspects of
live trading can be significantly underestimated. This is the leading cause
for traders to disregard the rules of their trading plans. A big challenge in
effective live trading is removing as much emotion as possible from trad-
ing. Our goal in live trading is to precisely follow our trading plan and
become unemotional, mechanical market traders.
Imagine that a trader has just begun live trading and the first three
trades have each resulted in a loss. While this trading plan has shown rea-
Live Trading 249
sonable performance statistics throughout the prior development stages,
should this be cause for concern? The fact is, three consecutive losers can
be a rough way to start live trading, but it does not show any flaws in
the logic of the overall trading plan at this point. There has not yet been
enough trading activity to assess the real performance of this plan.
Aside from the loss of capital, a string of losing trades, or a drawdown,
can have a considerable emotional impact on a trader. It is during these
negative phases that traders have a tendency to question their trading
plans. The risk of second-guessing, and not completely following a trading
plan, is significant. Traders will not benefit from any previous research and
will lose any type of expectancy. Even during a drawdown period, a trad-
ing plan can still be on target to reach its performance measures. In most
cases, continuing to follow the trading plan will allow it to trade its way
back to profitability.
Traders should not assume that there are flaws in their trading plans
just because they show a short-term loss. As much as possible, traders
should remind themselves that losing trades and drawdowns are a reality
of the trading business. A trading account should be thought of as an
inventory that will both decrease and grow over time: these are necessary
and normal fluctuations. This account should not be thought of as money
that is being lost, or which could be spent on other things. Traders that
view their trading accounts simply as money often have a difficult time
removing their emotions from trading and making objective decisions.
One method of overcoming the tendency to second-guess a trading
plan is to develop a motivation system for correctly following a trading
plan. Traders that provide themselves with incentives for good trading
(meaning, following their trading plans) often perform more consistently.
Traders that make mistakes might need to take out a piece of paper and
write 100 times, “I will always follow my trading plan, I will always follow

250 Make Money Trading
my trading plan, I will…” Just acknowledging this can help traders improve
market trading performance.
Below is a list of reminders that may help traders control emotions
and trust their trading plans. It is recommended to review this list regularly
before trading:
• Tradingisfunandchallenging.
• Approacheverytradeasanopportunitytomakemoney.
• Tradeconfidently:trustyourtradingplan.
• Stayrelaxed:donotgetfrustratedaboutaloss(orseveral),donot
get excited about a win (even a big win).
• Bepreparedtoloseoneverytrade:nosingletradewillbreakyou;
no single day will break you.
• Only closed trades equate to profits: do not dollar count the
profit or loss of an open position.
• Tradingerrorswillhappen:learnfromthesemistakes.
• Focusonyourplan:atradingplancannotcatcheverymovein
the market; all you can do is follow your trading rules.
Another element that can increase a trader’s confidence in his or her
trading plan is to establish the criteria for reevaluation. This essentially
places a limit on the amount of trading losses that can occur. This helps
traders to understand when their trading is still within its statistical range
or whether it is really off base. Establishing this principle, as well as mea-
suring live trading performance, will be discussed in Chapter 10—Evaluat-
ing Live Performance.

Chapter 10Evaluating Live Performance
The goal of evaluating any aspect of a trading plan is to minimize risk,
create consistency, and generate greater profitability. Nowhere is this
more important than in the evaluation of live trading. Measuring live
trading performance allows a trader to determine how effective his or her
trading plan really is and how to become a better market trader.
Until now, the performance of a trading plan has been primarily quan-
tified using historical data. At this phase, live trading results are all that
matter since this is what will generate the true profit or loss for the trading
business. If the performance of live trading does not match the results of
historical modeling, it may be necessary to revise the trading plan based
on the live results. Tuning a trading plan to a live market may require mak-
ing compromises that decrease historical performance. This is reasonable,

252 Make Money Trading
since historical profits are not the same as real profits. The significance
of historical performance has little value if live trading does not confirm
these results.
In this chapter, we will look at some methods of evaluating live trad-
ing that can help traders:
1. Set goals to improve live trading performance.
2. Track how closely live trading compares with the historical testing that was used to create the trading plan.
3. Determine when to make revisions to a trading plan based on the results of live trading.
4. Decide when it is necessary to stop using a trading plan.
Measuring live performance is critical to successfully implementing a
trading plan. Even a solid trading plan will fail if traders are unable to ef-
fectively trade it in a live market. As a result, traders may find it necessary
to fine-tune their trading plans based on their experiences in live trading.
Reviewing Trading JournalsTrading journals provide a record of live trading which should be re-
viewed on a regular basis. For new traders, it is recommended to examine
trading journals following each completed, round-turn trade. In addition,
traders should set up a schedule to review their trading journals over a
monthly or quarterly basis. This provides a larger, more statistically signifi-
cant group of trades to analyze. In many cases there is a lot of information
hidden in trading journals that will only become apparent over time.

Evaluating Live Performance 253
The initial purpose of reviewing trading journals is to gain insight
that will improve live trading. While the individual trade data such as
date, time, and entry/exit points will allow traders to measure overall per-
formance statistics, the notes that traders take during live trading can be
equally valuable. These notes can help traders spot patterns in their live
trading that may be causing trading errors. Once these trends are discov-
ered, traders can take the necessary actions and set goals to fix these reoc-
curring errors.
Trading errors can take two distinct forms: intentional and uninten-
tional. Intentional trading errors occur when a trader deliberately violates
his or her trading plan. This is usually the result of the trader’s emotions
overriding the rules of the trading plan. Examples of intentional errors
include closing a trade early, ignoring a stop loss, or entering trades that
are not defined within the trading plan. These errors can be particularly
destructive to a trading account since any type of risk management or ex-
pectancy is lost. Once a trader has spotted a pattern of intentional trading
errors, they must acknowledge the mistakes and take immediate action to
stop them. Traders must learn to avoid intentional trading errors, making
this their primary market trading goals. As stated repeatedly, good trading
is all about sticking to your trading plan.
Unintentional trading errors are “honest mistakes” that occur due
to of a lack of trading experience or skill. This type of trading error may
include placing incorrect order types (going long instead of short, for
example), missing a trade signal, or using the wrong trading symbol. The
level of skill that is involved when implementing a trading plan is often
underestimated. Overly complex trading plans may need to be scaled back
in order to create better results in live trading and minimize unintentional
trading errors. As traders gain more experience and develop greater profi-

254 Make Money Trading
ciency in their market trading, the occurrences of this type of trading error
will become less frequent.
Number CrunchingOnce traders have reviewed their trading journals, the next step is to
employ the identical statistical performance measures that were used to
originally develop their trading plans. This can be accomplished using
the same performance analysis spreadsheet that was presented in Chap-
ter 8—Evaluating and Comparing Trading Plans. Entering the trade data
from live trading journals provides useful information about trading per-
formance. Close correlation between the results of live trading and the
historical data used to develop a trading plan can provide additional con-
fidence in the rules of the trading plan.
Reviewing these performance metrics will help traders see the big
picture in their live trading. Errors that have been made during live trad-
ing will often be magnified during this type of review. For instance,
imagine that a trader decides to close profitable trades early in an attempt
to protect profits. This trader may rationalize this as a way to increase the
percentage of profitable trades (percentage profitable). When examined
over time, however, closing trades early will also decrease the R advantage
of these individual trades. This will also decrease the average trade net
profit and possibly create a negative expectancy for the entire trading plan.
Remember, trading plans must have a positive expectancy to make money
over time. From this information, a trader can determine that taking prof-
its too early will decrease overall profitability and that he should stick to
the rules of the trading plan.
One method of comparing data is to use a side-by-side comparison
of historical and live trading results, as seen in Figure 10.1. The results

Evaluating Live Performance 255
of this comparison show the historical performance on the left and live
trading on the right. For this trading plan, the live trading results have
exceeded historical expectations. While this is certainly a nice way to begin
live trading, we must also consider the amount of trading that has taken
place. Since only five trades have been used in this analysis of live trad-
ing, it does not hold much statistical significance just yet. Once we have
taken and recorded more live trades, this type of comparison will become
more reliable.
Because these statistics can be utilized to develop projections that can
be used to determine position sizing, more live trades means greater con-
fidence and potentially less risk. It is important to subtract commissions
from both sets of data and apply realistic slippage to the historical data.
This also contributes to a more realistic comparison.
Figure 10.2 shows another comparison of historical versus live trading
results (with slippage and commissions factored in). While the individual
performance statistics in these reports are only mediocre, the close cor-
relation between data shows good reliability. In this example, there are
FIGURE 10.1
A comparison of historical data and live trading results for a trading plan. The small amount of live trades makes
this comparison unreliable.

256 Make Money Trading
enough trades to gain greater confidence in the correlation of live trading
data. Consistent performance statistics between historical and live trading
is much more important than strong historical performance alone. In
fact, the most important test of a trading plan is its ability to perform as
expected during live trading. Closer correlation between historical testing
and live trading relates to a more reliable trading plan.
The Real Equity CurveAn equity curve provides a graphical representation of trading per-
formance by charting the number of trades versus the running total of
trading profits. This provides traders with another tool with which to
evaluate performance. Using the performance analysis spreadsheet, traders
can quickly create a chart that represents the equity curve for a trading
plan, as demonstrated in Figure 10.3. The steps to creating an equity curve
in Microsoft Excel are as follows:
FIGURE 10.2
Another comparison of historical data and live trading. The number of trades and close correlation in statistics provide
confidence in the logic of the trading plan.

Evaluating Live Performance 257
1. Highlight all of the cells containing a value in column H under the heading “Running Total.”
2. Go the “Insert” menu and choose Chart.
3. Select the Chart type: “Line” and click the Finish button.
Equity curves based on historical data alone do not provide much
useful information about the real performance of a trading plan. For this
purpose, a real equity curve should be used to determine if live trading is
measuring up to its historical projection. A real equity curve is constructed
by combining the data from live trading and from the development phases
FIGURE 10.3
Microsoft Excel is used to chart an equity curve from the performance analysis spreadsheet.

258 Make Money Trading
FIG
UR
E 10
.4
Th
e c
om
posi
tio
n o
f a
rea
l eq
uit
y c
urv
e.
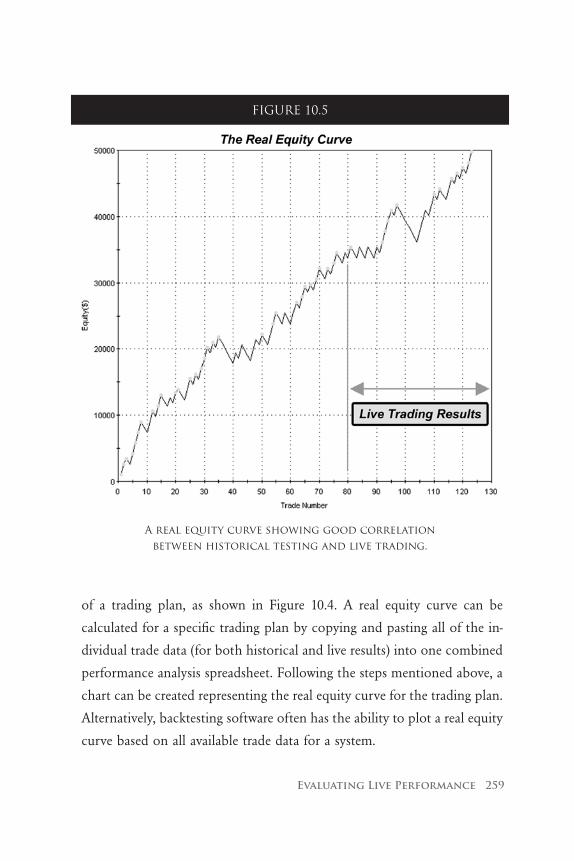
Evaluating Live Performance 259
of a trading plan, as shown in Figure 10.4. A real equity curve can be
calculated for a specific trading plan by copying and pasting all of the in-
dividual trade data (for both historical and live results) into one combined
performance analysis spreadsheet. Following the steps mentioned above, a
chart can be created representing the real equity curve for the trading plan.
Alternatively, backtesting software often has the ability to plot a real equity
curve based on all available trade data for a system.
FIGURE 10.5
A real equity curve showing good correlation between historical testing and live trading.

260 Make Money Trading
A real equity curve can provide a method of easily spotting the cor-
relation between historical testing and live trading. Figure 10.5 shows a real
equity curve where, in this case, live trading has begun at trade number
80. The consistency of this real equity curve shows the ideal relationship
between live trading and the development phases of a trading plan. Notice
that the live trading equity acts as a continuation of the previous curve.
Establishing this type of equity analysis not only confirms the validity
of a trading plan’s logic, but illustrates effective live trading performance
as well.
FIGURE 10.6
The shaded area in this real equity curve shows how a potential shift in market dynamics can affect a trading plan.

Evaluating Live Performance 261
In most cases, the real equity curve will show some type of variation
between the development phases and live trading. These variations may be
in the slope of the curve, the size of the drawdown troughs, or the overall
shape. As long as the trading plan is continuing to create new equity peaks
at regular intervals (continuing to make money) without exceeding its
historical maximum drawdown, live trading performance should be con-
sidered on target. It is only when the real equity curve shows an extreme
change during live trading or plummets into a perpetual drawdown, that a
trading plan or its implementation must be reconsidered.
While changes in a real equity curve are most common and significant
during the early stages of live trading, they can occur at any time. Changes
to the shape of a real equity curve can point out changes in a market en-
vironment that may require adjusting the trading plan. The fact is, markets
will change over time and trading plans may need to be updated to fit
the current market. Examining the real equity curve can provide an early
warning to shifts in the market that may cause a profitable trading plan to
become less effective.
Drawing a trendline along the most recent drawdown troughs of a
real equity curve, as shown in Figure 10.6, provides an additional tool to
help traders analyze their trading. This simple trendline acts as a reference
for estimating trading potential, with breaks below this line illustrating a
negative turn in live trading performance. In the case of this trading plan,
the equity curve has shown a profitable upward slope and has just begun
to show signs of weakening as represented by the shaded area. While this
trading plan may pull its way out of the drawdown and continue to reach
new equity peaks, traders may use this trendline break as a signal to review
their recent trading.

262 Make Money Trading
When to Abandon a Trading PlanDeciding when to stop using a trading plan can be a difficult deci-
sion. Given the time and effort that goes into development, abandoning
a trading plan is an absolute last resort. Each trader must establish his or
her own criteria for when to stop using a trading plan, and this should
be included as part of the written trading plan. This is an important de-
cision that every trader should make before beginning live trading. For
the market trader, there should be no subjectivity in deciding when to
stop trading.
There are several objective methods that traders can use as criteria for
deciding when to abandon their plans. To begin with, comparing the per-
formance statistics between live and historical trading data can provide an
important starting point. The performance metric that is most useful for
this purpose is the maximum drawdown. Since this number represents the
worst-case scenario for the historical testing period, a drawdown during
live trading that is greater than this amount can be a cause for concern.
Traders can use a percentage of the maximum historical drawdown as a
trigger to shut down a trading plan.
Another method of determining when to discard a trading plan is ap-
plying a trendline to the real equity curve as mentioned in the previous
section. If the equity curve breaks well below the trendline in the early
stages of live trading, it is a trigger to stop live trading. In Figure 10.7, the
live trading results are clearly not performing up to expectations. In fact,
traders would be advised to stop using this trading plan long before it sunk
so far below the trendline and into such a large drawdown. This type of
discrepancy between historical testing and live trading can be the result of
an over-optimized trading plan.
While the prospect of abandoning a trading plan is not pleasant, it
can provide an important learning experience. Just because a trading plan

Evaluating Live Performance 263
has failed, does not mean that the entire trading business is a failure. Most
importantly, traders should step back and learn why their plans failed.
Once this is determined, traders will be better equipped to develop profit-
able, viable trading plans that fit the current market. The important point
is recognizing when to abandon an unprofitable trading plan before it
does unrecoverable damage to a trading account. Remember, our goal is
to stay in the game as long as possible. Abandoning a trading plan should
only be a setback in a trading business.
FIGURE 10.7
This chart show how the results of live trading can fall far below the historical expectations.


Chapter 11Record Keeping
The directive “stay organized” sounds like rather basic advice, but is
an important part of the trading business. For instance, imagine the
IRS showing up for an audit of your business. Would you have all of your
paperwork in order, or would you have to scramble? Consolidating trading
specific information and maintaining well-organized records can help trad-
ers stay prepared and minimize the stress of trading. As with any aspect
of trading, good planning will help to create and maintain an organized,
professional business.
266 Make Money Trading
Staying Organized
The Organized Market TraderStaying organized in a trading business is multifaceted. Primarily, trad-
ers must be organized for actual trading. Trading desks (or workstations)
must be in order with adequate office supplies kept handy. A missing
calculator will probably never lead directly to a losing trade, but being
disorganized, even on the office supply level, can lead to greater stress.
Through organization we are trying to avoid stress and run more efficient
businesses.
Traders should also keep a legal pad or other notepad of paper on the
trading desk for note taking, observations, and keeping a record of any
out-of-the-ordinary events. Each trading day should begin a new page in
the pad, with the day’s date clearly written at the top. While not a trading
journal, this pad is useful for recording unusual market behavior, market
affecting news events, or any technological issues confronted during the
day. If, for example, a trader needs to call technical support for a problem
with a trading platform, this is the place to take notes for future refer-
ence. In doing so, important information will be in one place rather than
scattered around the office. These daily notes can also be valuable when
developing or updating a troubleshooting list.
Traders need quick access to trading-specific support tools around the
workstation. These include a reliable economic calendar, the important
phone numbers list, and troubleshooting list (described in Chapter 9—Live
Trading). Economic calendars help traders be better prepared for the quick
market moves that often accompany key economic reports. Ideally, the
economic calendar, important phone numbers list, and the troubleshoot-
ing list should hang next to the trading desk, close enough to be easily
read while sitting at the desk and speaking on the phone. As a backup,

Record Keeping 267
these items should also be placed inside a three-ring binder and kept
within reach of the trading desk (as described later in the chapter).
A trading journal is another component in trader organization that
should always be present at the workstation. Previous chapters have dis-
cussed the merits of keeping a trading journal. A trading journal is a practi-
cal way for traders to keep track of trades in an orderly fashion (useful for
balancing broker statements and during tax time), and also provides an
organized method for reviewing past trades and notes. This is particularly
valuable during trading plan evaluations and development.
The Organized StrategistIn addition to being well organized for actual trading, traders need
to have a structured means of conducting research and development; this
is, after all, what prepares us to trade. Imagine spending hours compiling
a performance analysis spreadsheet, only to never find it again. Most of
this work can be saved on a hard drive, and regular backup disks should
be burned (made), labeled, and filed. For hard copies, it is recommended
that traders use a filing cabinet or bookcase, or a portable file box at
the very least, to organize this important paperwork that falls under the
jurisdiction of the strategist. Hard copies provide an extra backup of im-
portant work.
A separate folder should be used for each trading plan or strategy. Any
corresponding research and development materials should be in the file,
such as performance statistics, optimization reports, mathematical equa-
tions, or pertinent magazine articles. If minor changes have been made to
a trading plan, consider using the same trading plan name, and attaching
a version number (similar to software versions) to the end:
Trend Follower V1.0
Trend Follower V1.1

268 Make Money Trading
Counter Trend Strat V1.4
Counter Trend Strat V1.5
As a business owner, regular reviews must be performed to deter-
mine the financial status of the business. Monthly profit and loss state-
ments should be compiled, reflecting trades, commissions, platform fees,
and other expenses. When reviewing these monthly reports, it is essential
to remember that in trading (as with most businesses) the big picture
is what counts: an unprofitable month does not automatically make an
unprofitable year. Monthly reviews allow traders to gauge the progress of
their businesses.
A lawyer or CPA can be consulted if a trader wishes to form a business
entity, such as a Limited Liability Corporation (LLC). Many traders operate
as sole proprietors of their trading businesses. Special consideration should
be given to filing as a business entity if more than one person is involved
in the trading business. A lawyer or CPA can explain the various business
designations and recommend what will work best for a given situation.
Creating a Trading BinderIt is possible to incorporate a trading journal and other important
paperwork into a complete trading binder. Maintaining a trading binder
is one method for organizing the important paperwork that is necessary
to a trading business. A three-ring binder works well, with clearly labeled
dividers in between each section. A three-hole-punch can be used to fit the
pages neatly into the binder. A new binder should be started each year,
and the old ones filed away for reference. The different sections include:
❖ Trading Plan
•Writtendescriptionofthetradingplan’slogic

Record Keeping 269
•Hardcopyofprogramming/coding for the tradingplan (if ap-plicable)
•Pastversionsoftradingplans
❖ Trader Resources
•Importantphonenumberslist
•Troubleshootinglist
•Economiccalendar
•Listofmarketholidays
❖ Trading Journals
•Past journalpages (apaperclipon thecurrentpagemakes iteasy to find)
•Blankjournalpages
❖ Brokerage Statements
•Separatesectionforeachbroker
•Statementsshouldbebalancedmonthly
Compiling all of these materials into one binder allows for better orga-
nization. You may have noticed that some of the recommended materials
in the trading binder, such as the important numbers list and trouble-
shooting list, should also be hanging next to a trading desk. This is done
not so much out of redundancy as it is for convenience. Having a com-
plete trading binder puts all of the important paperwork in one place, and
it is handy for traveling or if a trader needs to leave the office in a hurry.
270 Make Money Trading
Taxes for TradersBy default, the IRS considers trading to be an investment activity.
Traders are expected to follow the tax laws for investment activities unless
they rise to the level of trading as a business (thereby achieving “trader tax
status”). Active traders may choose the Mark-to-Market (MTM) election
for tax purposes. This is the only designation for traders that allows de-
ductions for trading-related expenses, such as platform fees or education.
The IRS is rumored to be particular about who actually qualifies for the
MTM status. In general, they expect to see that a trader has spent all day,
every day, trading. If a trader elects the MTM status, all positions must
be counted as closed out at the end of the year, whether or not they have
actually been closed, and all related taxes become due.
The MTM election can be beneficial to securities traders, but in most
cases is a detriment to futures or commodities traders who typically re-
ceive better tax treatment (due to lower tax rates) without the election.
Reversing the MTM election can be challenging, and its pros and cons
should be discussed with a tax professional prior to making the election.
Additionally, the election must be made by April 15th for individuals and
partnerships (March 15th for corporations) of the tax year in which a
trader wishes to take the MTM status.
It is recommended that traders seek the advice and expertise of a Cer-
tified Public Accountant (CPA) or other tax specialist for handling yearly
and any quarterly taxes. It is outside the scope of this book to provide any
authoritative information regarding taxes. Trader tax laws are complicated,
and vary greatly depending on what is traded and how often it is traded;
different types of trading instruments are taxed differently. In addition, the
laws do change, and new laws are created to encompass the latest trading
instruments as they are introduced. It may be worth the effort to find a

Record Keeping 271
CPA qualified to handle trader taxes (with a good understanding of the
relevant tax laws) to achieve the greatest benefits at tax time. Traders can
check with a CPA or other tax professional to see what deductions may be
allowed for expenses such as:
• Officespace
• Homeoffice
• Start-upcosts
• Tradingplatformexpenses
• Utilities,suchascellphone,Internet,phone,cable
• Books,seminars,subscriptions
• Education
• Professionalaffiliationdues
• Travelexpenses
• Consultingexpenses
Ongoing effort is required throughout the year to be prepared to file
a tax return. Electing the MTM status, for example, could save a trader
thousands of dollars at tax time. Traders can best plan for tax time by
consulting with a tax professional ahead of time and staying organized.


Chapter 12Top 10 Rules of Successful Trading
Rule #1: Always use a trading plan.
Rule #2: Treat trading like a business.
Rule #3: Use technology to your advantage.
Rule #4: Protect your trading capital.
Rule #5: Become a student of the markets.
Rule #6: Risk only what you can afford to lose.
Rule #7: Develop a trading methodology based on facts.
Rule #8: Always use a stop loss.
Rule #9: Know when to stop trading.
Rule #10: Keep trading in perspective.

274 Make Money Trading
Though a bit cliché, we thought it valuable to include a list of impor-
tant trading rules. Each of the ten rules has been covered in the previous
chapters of this book. Some of the rules are the same rules that traders
may read in other books—and with good reason. The rules are well-known,
tested methods of improving trading success. We don’t think anyone would
argue that protecting capital is essential to profitable trading. Other rules
may make their debut in this book. These lesser-known rules are every bit
as important as their big brothers.
Becoming a profitable trader takes time and planning. The previous
chapters have introduced a host of concepts that can help traders mini-
mize the time to reaching trading success. This chapter is somewhat of a
recap of the key ideas that have been presented throughout this book.
These ten rules are interrelated: one rule may require strict adherence to
another rule in order to reach fruition. For example, Rule #4 (Protect your
trading capital) requires traders to follow all the other rules to meet this
challenge. Following these ten basic rules can help establish and maintain
a consistently profitable trading business.
Rule #1: Always use a trading plan.There is a common axiom among professional traders: “Plan your
trade, trade your plan.” Using a trading plan allows traders to do this. The
development phase of a trading plan can be challenging and time-consum-
ing. Once completed, the next obstacle is adhering to the plan. Once trad-
ers have developed a solid trading plan, they must stick to it. Taking trades
that fall outside of a trading plan, even if they turn out to be winners, is
considered bad trading and destroys any expectancy in the plan. Without
the consistency of a trading plan, traders cannot develop a baseline for
making their trading more profitable.

Top 10 Rules of Successful Trading 275
This does not mean that a trading plan will never change. In fact, trad-
ers should establish regular intervals to perform “system maintenance” on
their trading plans. Systems that perform beautifully in today’s market are
likely to become less effective eventually. Sometimes a minor adjustment
is all that is needed to maintain a system’s profitability.
Rule #2: Treat trading like a business.Approaching trading as a full-time or part-time business (not as a
hobby or a job) is essential. As a hobby, trading can be very expensive; as a
job, it can be frustrating since there is no such thing as a regular paycheck.
Trading is a business—complete with expenses, losses, taxes, uncertainty,
stress, and risk. Understanding that trading is a business, and planning for
it as such, can prepare traders to overcome the inevitable hurtles along
the way.
As with any successful business, traders much carefully develop their
trading businesses using some form of strategic planning. In particular, it
is important to thoroughly research, test, and effectively apply to the ap-
propriate market(s) the trading methodology (the trading plan). Rules #1
and #2 go hand in hand.
Rule #3: Use technology to your advantage.
The technology available to today’s traders is vast. Charting platforms
provide an array of choices for viewing the markets. The ability to backtest
a trading idea on historical data before risking real money is invaluable.
High-speed Internet has dramatically improved the speed with which trad-

276 Make Money Trading
ers can enter and exit positions. These are just a few of the ways in which
today’s traders can take advantage of available technology.
Trading is a competitive endeavor, and it is safe to assume that the
person sitting on the other side of a trade is taking full advantage of the
available technology. It is wise to do the same.
Rule #4: Protect your trading capital.Saving enough money to open a reasonably funded trading account
can take a considerable amount of time. It can be even more difficult the
second time around. “Protect your trading capital” should never be con-
fused with “Don’t have any losing trades.” We all know that would be im-
possible. Protecting your capital means doing everything possible to trade
smart: use a plan, use a stop loss, risk only what you can afford to lose.
Rule #5: Become a student of the markets.
There is so much to learn about the markets that it would be virtually
impossible to learn it all before starting to trade. Therefore, it is important
to remain vigilant about learning more each day. Hard research allows
traders to learn the facts; focus and observation allow traders to absorb
some of the nuances in the markets. It would be a mistake for a trader to
ever assume that he or she knew “enough” about the markets and could
therefore stop trying to learn new things.
World politics, world events, world economies, consumer sentiment,
technology, trading instruments—all of these things are dynamic, and by
default create a dynamic, ever-changing market environment. The more
Top 10 Rules of Successful Trading 277
traders know about the past and current markets, the better prepared trad-
ers will be to tackle the future.
Rule #6: Risk only what you can afford to lose.
It is important that the money in your trading account is expendable.
It may take time to save enough money to fund a brokerage account with
“extra” money. You have to count on losing all the money in your trading
account, and still being able to pay the bills. Before you begin trading,
make sure that the money in the account is truly expendable. If it isn’t,
keep saving until it is.
If your trading account has been depleted, these rules still apply. You
must wait until you have saved money that is not needed for paying the
bills. It should go without saying that your trading account should never
be money that is earmarked for, say, the mortgage or the kids’ college
funds. Losing money is stressful enough; it is even more so if it is money
that should have never been risked to begin with.
Rule #7: Develop a trading methodol-ogy based on facts.
Facts, not emotions or speculation, should be the driving force be-
hind developing a trading plan. As such, traders should expect to spend a
significant amount of time researching and developing their trading plans.
It is important to be objective about the research, and to be wary of any
fantastic claims of success in other people’s trading systems that are preva-
lent over the Internet. Traders who acknowledge that the development

278 Make Money Trading
process is challenging (but well worth the effort) typically have an easier
time sorting through all the information that is available over the Internet.
Traders that want to hurry up and make some money are usually more apt
to fall for the “make millions” scams.
Rule #8: Always use a stop loss.It is important to always trade with a stop loss. A stop loss limits the
risk that a trader is exposed to for each trade. Setting a predetermined
amount of risk on each trade can take some of the emotion out of trad-
ing—as long as traders stick to the stop loss. Letting a stop loss blow by is
never a good idea, even if it leads to a winning trade. It is a bad precedent,
and more than likely it will simply lead to greater losses. Remember this:
exiting on a stop loss is good trading. We would all like to always exit with
a profit, but that is not realistic. Since we know we are going to have los-
ing trades, it makes sense to know how big those losing trades are going
to be. If the trade goes against us that far, we close it. And then we move
on to the next trade.
Rule #9: Know when to stop trading.There are two main reasons to stop trading. The first reason is that the
trading plan is ineffective and losing more than anticipated in historical
testing. Markets may have changed, interest in a particular trading instru-
ment may have changed, or the trading plan simply is not performing up to
expectations. It may be time to take a step back and reevaluate the trading
plan. It is important to remain businesslike and unemotional during these
potentially stressful times. An ineffective trading plan is a problem that
needs to be solved; it does not necessarily mean the end of the business.

Top 10 Rules of Successful Trading 279
On the other hand, the second reason to stop trading is that the
trader is ineffective: things like external stressors, bad health, and negativ-
ity can have a significant impact on trading performance. It is beneficial to
both the trader and the business that any personal problems be recognized
and dealt with as soon as possible. In such a stressful environment, recog-
nizing that there is a problem can be challenging. If traders feel that they
are not performing well, it is recommended that they take at least a long
weekend away from trading. Stepping away from the situation can provide
some clarity, and allow traders to make the necessary changes to improve
trading performance.
Rule #10: Keep trading in perspective.While it is important to remain focused each and every trading day, it
is equally important to remain focused on the big picture. Since trading
is a business, it is the cumulative profits that matter. A losing day is just
that— a losing day. We all have losing days; it is an inescapable part of trad-
ing. Likewise, a winning day is just that—a winning day. Win or lose, it’s
just another day at the office. Keep the emotions to a minimum.
It is helpful to remember the glamorous, multi-million dollar traders
are the exception, not the norm. Most traders who can survive the tough
part of the learning curve can make a nice living trading. Most individual
traders are not trading seven figure accounts every day, making millions
of dollars a year. It is important during business planning that traders set
realistic goals for their businesses.
Traders who have the patience and discipline to follow all of these
rules will greatly increase their odds of success in the incredibly challeng-
ing and competitive trading arena.


Appendix ASample Trading Plan
A Simple Trading Plan by Raymond Deux,
President and CEO of NinjaTrader, LLC
Early in my trading career I learned that having a trading plan was
vital if one wanted to be a successful trader. Having a trading plan does
not mean that you will be successful but it does mean that you can hold
yourself accountable for your actions. Primary components of my trading
plan included:
• Keytradesetups
• Pre-definedtrademanagementrules
Key Trade Set UpsThere are many different trade set ups that you will come to explore
or develop on your own but what is important is that you limit the

282 Make Money Trading
amount of trade set ups to a select few that you intimately understand and
can execute without letting emotions negatively influence your actions. As
part of the learning process, I tried many different trade set ups, indica-
tors, and markets. It wasn’t until I focused on trading a select few set ups
that I began to make decisions with more clarity and confidence. As a new
trader, your plan should only include one trade set up. Learn this well, and
then add another one.
Pre-defined Trade Management RulesIt is critically important to have defined rules that dictate when and
where you take profits or cut your losses. These rules and conditions
form the basis for your trade management and ensure that you are able to
control your emotions, which then promotes discipline and consistency
in your trading. When trading intraday, having a trading platform that can
execute these trade management strategies can give you a dramatic advan-
tage and this is what motivated me to conceive the NinjaTrader trading
application. Once I have identified a trade set up and have entered the
market, NinjaTrader takes over and semi-automates my trade strategy by
submitting my stop loss and profit target orders based on my pre-defined
parameters.
I can now go into a fight with a sharp knife!
A trading plan provides me with a well defined plan of “action” and
more importantly, a plan of “no action” when trading the markets. From
my experience, when you act outside of your trading plan, you surely pay
for it many times over. My key trade set ups tell me what to look for and
my trade management rules manage my trades. I only focus on what is in
my plan and I do it with a patient demeanor.
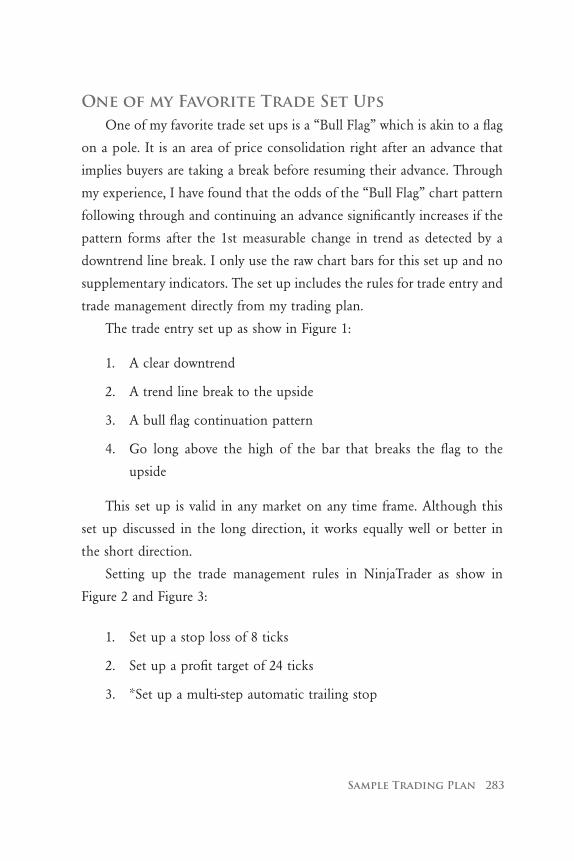
Sample Trading Plan 283
One of my Favorite Trade Set UpsOne of my favorite trade set ups is a “Bull Flag” which is akin to a flag
on a pole. It is an area of price consolidation right after an advance that
implies buyers are taking a break before resuming their advance. Through
my experience, I have found that the odds of the “Bull Flag” chart pattern
following through and continuing an advance significantly increases if the
pattern forms after the 1st measurable change in trend as detected by a
downtrend line break. I only use the raw chart bars for this set up and no
supplementary indicators. The set up includes the rules for trade entry and
trade management directly from my trading plan.
The trade entry set up as show in Figure 1:
1. A clear downtrend
2. A trend line break to the upside
3. A bull flag continuation pattern
4. Go long above the high of the bar that breaks the flag to the
upside
This set up is valid in any market on any time frame. Although this
set up discussed in the long direction, it works equally well or better in
the short direction.
Setting up the trade management rules in NinjaTrader as show in
Figure 2 and Figure 3:
1. Set up a stop loss of 8 ticks
2. Set up a profit target of 24 ticks
3. *Set up a multi-step automatic trailing stop

284 Make Money Trading
This pre-defined trade management set up provides me with a 1:3 risk
to reward ratio.
*I like protect profits as the trade moves into profitable territory. The Ninja-
Trader automatic trailing stop allows me to set an initial liberal trail stop that only
activates at a predefined level of profit.
SummaryEveryone’s trading plan will be different since we all have different
tolerances for risk and psychological states. What’s important is that you
have one, you manage it, and you work it and hold yourself accountable
to it.
FIGURE 1

Sample Trading Plan 285
FIGURE 2

286 Make Money Trading
FIGURE 3

Appendix BEasyLanguage Code for Sample Indicators and Strategies
Fib / Pivot Points Indicator: Chapter 5
inputs:
UseFibPivots(true),
Color(red),
PivotColor(blue);
arrays:
pivotLevel[7](0),
lineID[7](0),
textID[7](0),
textSTR[7](“”);
variables:

288 Make Money Trading
Pivot(0),
R1(0),
R2(0),
R3(0),
S1(0),
S2(0),
S3(0),
count(0),
PrevHigh(0),
PrevLow(0),
PrevOpen(0),
PrevClosed(0);
If date <> date[1] then begin
PrevHigh = highd(1);
PrevLow = lowd(1);
PrevOpen = opend(1);
PrevClosed = closed(1);
if UseFibPivots then begin
Pivot = (PrevHigh + PrevLow + PrevClosed )/3;
R1 = Pivot + (PrevHigh - PrevLow) * .382;
S1 = Pivot - (PrevHigh - PrevLow) * .382;
R2 = Pivot + (PrevHigh - PrevLow) * .618;
S2 = Pivot - (PrevHigh - PrevLow) * .618;
R3 = Pivot + (PrevHigh - PrevLow);
S3 = Pivot - (PrevHigh - PrevLow);
end
else begin
Pivot = (PrevHigh + PrevLow + PrevClosed )/3;
R1 = 2 * Pivot - PrevLow;

EasyLanguage Code for Sample Indicators and Strategies 289
S1 = 2 * Pivot - PrevHigh;
R2 = Pivot - S1 + R1;
S2 = Pivot - R1 + S1;
R3 = Pivot - S2 + R2;
S3 = Pivot - R2 + S2;
end;
if bartype < 2 then begin
PivotLevel[1] = R3;
PivotLevel[2] = R2;
PivotLevel[3] = R1;
PivotLevel[4] = Pivot;
PivotLevel[5] = S1;
PivotLevel[6] = S2;
PivotLevel[7] = S3;
TextStr[1] = “R3”;
TextStr[2] = “R2”;
TextStr[3] = “R1”;
TextStr[4] = “Pivot”;
TextStr[5] = “S1”;
TextStr[6] = “S2”;
TextStr[7] = “S3”;
for count = 1 to 7 begin
LineID[count] = tl_new(date, 0, PivotLevel[count], date, 2359, PivotLevel[count]);
TextID[count] = text_new(date, time, PivotLevel[count], textStr[count]);
text_setstyle(textID[count], 0, 1);
text_setcolor(textID[count], Color);
tl_setcolor(LineID[count], Color);
if count = 4 then begin
tl_setcolor(LineID[count], PivotColor);

290 Make Money Trading
text_setcolor(textID[count], PivotColor);
end;
if date = currentdate then value1 = tl_setextright (lineID[count], true);
commentary(textstr[count] + “- “ + numtostr(pivotlevel[count],2) + newline);
end;
end
else begin
plot1(Pivot, “Pivot”, PivotColor);
plot2(R1, “R1”, Color);
plot3(S1, “S1”, Color);
plot4(R2, “R2”, Color);
plot5(S2, “S2”, Color);
plot6(R3, “R3”, Color);
plot7(S3, “S3”, Color);
end;
end;
Double Exponential Moving Average Indicator: Chapter 5
inputs:
Price(close),
Period(20);
variables:
X1(0),
X2(0),
DEMA(0);

EasyLanguage Code for Sample Indicators and Strategies 291
X1 = xaverage(Price, Period);
X2 = xaverage( X1, Period);
DEMA = iff(currentbar <= 1, Price, X1 * 2 - X2);
plot1(DEMA, “DEMA”);
Adaptive Price Zone Indicator: Chapter 5
inputs:
Price(Close),
Period(20),
BandPct(1.4);
variables:
Length(0),
DSPrice(0),
DSRange(0),
PctBand(0),
UpBand(0),
DnBand(0);
Length = iff(Period < 0, 1, squareroot(Period));
DSPrice = xaverage(xaverage( Price, Length ), Length);
DSRange = xaverage(xaverage( h - l, Length ), Length);
PctBand = BandPct * DSRange;
UpBand = DSPrice + PctBand;
DnBand = DSPrice - PctBand;
Plot1( UpBand, “UpBand” );
Plot2( DnBand, “DnBand” );

292 Make Money Trading
Premiere Stochastic Indicator: Chapter 5
inputs:
Line1(.9),
Line2(.2),
Period(25);
variables:
oFastK(0),
oFastD(0),
oSlowK(0),
oSlowD(0),
Length(0),
NormStoch(0),
SmoothStoch(0),
Premiere(0);
Value1 = Stochastic( h, l, c, 6, 1, 3, 1, oFastK, oFastD, oSlowK, oSlowD);
Length = iff(Period < 0, 1, squareroot(Period));
NormStoch = .1 * (oslowK - 50);
SmoothStoch = xaverage(xaverage(NormStoch, Length), Length);
Premiere = (expValue(1 * SmoothStoch) - 1) / (expValue(1 * SmoothStoch) + 1);
plot1(Premiere, “Premiere”);
plot2(Line1, “1”);
plot3(Line2, “2”);
plot4(Line1 * -1, “3”);
plot5(Line2 * -1, “4”);

EasyLanguage Code for Sample Indicators and Strategies 293
Tick Interval Countdown Meter Indicator: Chapter 5
inputs:
DescripText(“T”),
Color(blue);
variables:
SetPosition(0),
LowestDispValue(0),
HighestDispValue(0),
TickReg(0),
TxtStr(“”),
TxtID(-1);
if BarType = 0 then begin
HighestDispValue = getAppInfo(aiHighestDispValue);
LowestDispValue = getAppInfo(aiLowestDispValue);
SetPosition = LowestDispValue + 0.01 * 50 * (HighestDispValue - LowestDispValue);
if BarNumber = 1 then begin
TxtID = text_new(date, time, close, “Start”);
text_SetStyle(TxtID, 0, 2);
text_SetColor(TxtID, Color);
end;
if time <> time[1] or TickReg <= 0 then begin
TickReg = BarInterval;
text_SetStyle(TxtID, 0, 1);
text_SetLocation( TxtID, Date, Calctime(time, 1), SetPosition);
end;
TickReg = TickReg - ticks;

294 Make Money Trading
TxtStr = numToStr(TickReg, 0) + “ “ + DescripText;
text_SetString(TxtID, TxtStr);
end;
Trend Following Position Trading Strategy: Chapter 7
inputs:
StopLoss(2400),
Length1(20),
Length2(30);
variables:
X1(0),
X2(0),
Y1(0),
Y2(0),
BuyPrice(0),
SellPrice(0),
DemaX(0),
DemaY(0);
X1 = xaverage(c, Length1);
X2 = xaverage( X1, Length1);
DemaX = iff(currentbar <= 1, c, X1 * 2 - X2);
Y1 = xaverage(c, Length2);
Y2 = xaverage( Y1, Length2);
DemaY = iff(currentbar <= 1, c, Y1 * 2 - Y2);
if DemaX crosses over DemaY then BuyPrice = h[1];

EasyLanguage Code for Sample Indicators and Strategies 295
if DemaX > DemaY and c < BuyPrice then buy next bar at BuyPrice stop;
if DemaX crosses under DemaY then SellPrice = l[1];
if DemaX < DemaY and c > SellPrice then sellshort next bar at SellPrice stop;
setstoploss(StopLoss);
Counter Trend Swing Trading Strategy: Chapter 7
inputs:
StopLoss(800),
ProfitTarget(1600),
ADXValue(52),
Line1(-.9),
Line2(-.2),
StochLength(8),
Period(25);
variables:
oFastK(0),
oFastD(0),
oSlowK(0),
oSlowD(0),
Length(0),
NormStoch(0),
SmoothStoch(0),
Premiere(0);
value1 = Stochastic( h, l, c, StochLength, 1, 3, 1, oFastK, oFastD, oSlowK, oSlowD);
Length = iff(Period < 0, 1, squareroot(Period));
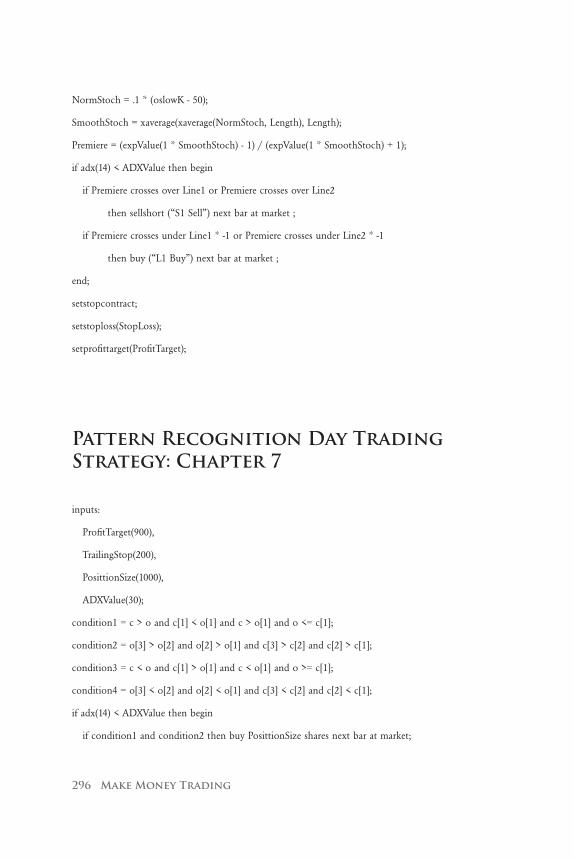
296 Make Money Trading
NormStoch = .1 * (oslowK - 50);
SmoothStoch = xaverage(xaverage(NormStoch, Length), Length);
Premiere = (expValue(1 * SmoothStoch) - 1) / (expValue(1 * SmoothStoch) + 1);
if adx(14) < ADXValue then begin
if Premiere crosses over Line1 or Premiere crosses over Line2
then sellshort (“S1 Sell”) next bar at market ;
if Premiere crosses under Line1 * -1 or Premiere crosses under Line2 * -1
then buy (“L1 Buy”) next bar at market ;
end;
setstopcontract;
setstoploss(StopLoss);
setprofittarget(ProfitTarget);
Pattern Recognition Day Trading Strategy: Chapter 7
inputs:
ProfitTarget(900),
TrailingStop(200),
PosittionSize(1000),
ADXValue(30);
condition1 = c > o and c[1] < o[1] and c > o[1] and o <= c[1];
condition2 = o[3] > o[2] and o[2] > o[1] and c[3] > c[2] and c[2] > c[1];
condition3 = c < o and c[1] > o[1] and c < o[1] and o >= c[1];
condition4 = o[3] < o[2] and o[2] < o[1] and c[3] < c[2] and c[2] < c[1];
if adx(14) < ADXValue then begin
if condition1 and condition2 then buy PosittionSize shares next bar at market;

EasyLanguage Code for Sample Indicators and Strategies 297
if condition3 and condition4 then sellshort PosittionSize shares next bar at market;
end;
setexitonclose;
setdollartrailing(TrailingStop);
setprofittarget(ProfitTarget);
Trade Import Strategy Add-on: Chapter 8
Please Note: This is not a complete strategy, and should be copied into the
end of an existing strategy to import trade information for further analysis.
This program will create a spreadsheet (.csv file) whose location may need
to be further defined within this code.
variables: TradeNum(0);
TradeNum = totaltrades;
if TradeNum > TradeNum[1] then fileappend(“C:\Documents and Settings\TradeList “ +
getsymbolname + “.csv”, “,” + numtostr(entryprice(1), 4) + “,” + numtostr(exitprice(1), 4) + “,” +
numtostr(maxcontracts(1), 0) + “,” + numtostr(marketposition(1), 0)+ Newline);
For a online version go to www.traderslibrary.com/TLEcorner


Appendix CTrader Worksheets
Included in this Appendix are several worksheets meant to guide you
in building a successful trading business. There is a sample trading strategy
outline, a sample journal entry, an emergency contact list, and a reference
of important market indicators. For printable versions of these worksheets,
please visit www.traderslibrary.com/TLEcorner.

300 Make Money Trading
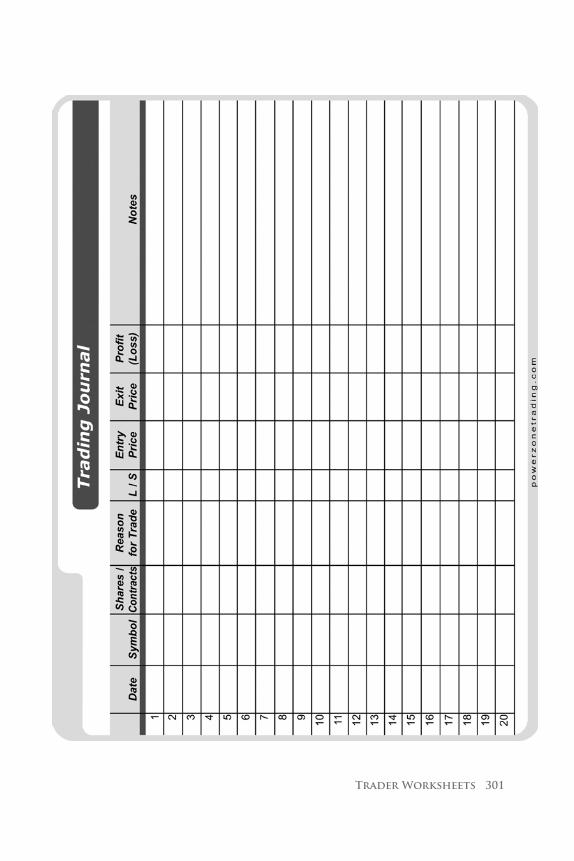
Trader Worksheets 301

302 Make Money Trading

Trader Worksheets 303


Glossary
+R Advantage +R Advantage is achieved when a trading system makes
more money on each winning trade than it spends on its losing trades.
Adaptive Price Zone The Adaptive Price Zone is a technical indicator
that creates bands on a price chart; the majority of price action tends to
stay within the upper and lower bands of the zone. When price devi-
ates significantly from its average and crosses out of the zone, there is a
tendency for price to push back towards the statistical average.
Anti-Martingale Betting System An anti-martingale betting system
dictates that traders take greater risks when trading with profits than with
initial capital. As the account size grows, so does the bet size.

306 Make Money Trading
Ask The ask is the price a seller is willing to accept for an instrument,
and is therefore the price that retail traders will pay to buy an instru-
ment. The ask price is always a little higher than the bid price.
Average Trade Net Profit The average trade net profit is a performance
metric that measures the expectancy of a trading plan. This metric repre-
sents the average amount of money that was won or lost per trade, and is
calculated by dividing the total net profit by the total number of trades.
Backtesting Backtesting, or historical modeling, refers to the testing of
trading plans on historical market data.
Backtesting Application A backtesting application is a type of software
that applies trading systems to historical market conditions and calcu-
lates performance characteristics.
Bid The bid is the price that a buyer is willing to pay for an instrument,
and is therefore the price that retail traders will receive for selling an
instrument. The bid price is always a little less than the ask price.
Bid-ask Spread The bid-ask spread is the difference between the bid
and ask price of an instrument at any given time.
Bracket Order Bracket orders are multiple orders placed simultaneously
in the market using a combination of stop and limit orders. They allow
traders to lock in profits (when a profit target is reached) or limit
losses (when a stop loss is reached), without having to constantly follow
the position.

Glossary 307
Channel Breakout A channel breakout occurs when price breaks out
above or below two parallel (or close to parallel) trendlines. The price
will often stall at the trendline that it broke out from before making a
dynamic move away from the price channel.
Compounding Compounding refers to the reinvesting of profits and
dividends in additional shares of stock.
Conditional Trade Orders Unlike basic market, limit, or stop orders, a
conditional trade order will be automatically submitted or canceled only
if specified criteria are met. Conditional trade orders must be specified
before placing a trade, and are entered directly through the order
entry software.
Countdown Meter A countdown meter is a type of indicator used to
display the number of ticks or volume remaining in a current candle bar.
Counter-trend Strategy Counter trend strategies rely on frequent mar-
ket oscillations to make consistent gains. Each winning trade often re-
flects price moves that are many times smaller than the preceding trend.
This type of logic anticipates the possibility of price reversing in the op-
posite direction.
Data Indicators A data indicator is an index of short-term trading data
that is collected from the major stock indices.
Day Trading Day trading refers to the active style of trading in which all
positions are closed by the end of the day.
308 Make Money Trading
Direct Access Brokers Direct access brokers are broker that allow cli-
ents to trade directly with a stock or futures exchange. This is often
the broker of choice for active traders who want to focus on speed and
order execution.
Downtrend A downtrend occurs when prices form lower swing lows and
lower swing highs, creating trendlines with negative slopes and a down-
ward price channel.
Duration The duration of a trade order (sometimes referred to as time-
in-force) defines how long an order will remain active in the market.
Equity Curve An equity curve provides a graphical representation of
trading performance by charting the number of trades versus the run-
ning total of trading profits.
ETF Exchange Traded Fund. ETFs track an index, a commodity or a
basket of instruments, but are traded like a stock on an exchange.
Expectancy Expectancy expresses the average amount that a trader can
expect to win (or lose) per unit of risk. In order for traders to have any
chance of making money, their system must have a positive expectancy.
Fibonacci Retracements Fibonacci retracements measure the strength
of an initial price move by establishing the beginning and end of the
price move using the swing highs and lows. Once these points are estab-
lished, prices are projected that represent different percentages (based on
Fibonacci sequence numbers) of the original move.

Glossary 309
Fill Fill refers to the action of satisfying a trade order for an instrument.
Placing a trade order does not guarantee that it will be filled, or if it will
be filled at the intended upon price. Fill price is the price for which the
transaction is completed.
Fixed-percentage Betting Fixed-percentage betting refers to risking a
consistent percentage of capital (2% for instance) on any given trade. As
an account size changes, so will the trade size.
Forex The foreign exchange market, also called “forex” or “FX”, is the
arena where one nation’s currency is exchanged for another’s.
Forward Performance Testing Forward performance testing, some-
times referred to as paper trading, is the stage in trading plan develop-
ment where trades are placed via an order entry simulator or on paper.
No actual trading takes place during this stage.
Front-end Software Front-end software allows its users a certain level of
strategy automation. The advantage to using front-end software is its abil-
ity to automate complex exit strategies that may include multiple profit
targets, multi-level stop orders, or pyramiding (adding shares or contracts
to a winning position). This tool can significantly speed up the order
placement process.
Full Service Brokers Full service brokers are broker whose services
include research and advice such as trading recommendations, retirement
planning, or tax tips. In exchange for their services, full service brokers
typically charge substantial commissions.
Historical modeling See Backtesting.

310 Make Money Trading
Input Values Input values are user-defined variables (such as look back
period or type of price data) that modify the behavior of an indicator.
Changing input values can give an indicator much different values and
point out different market conditions.
Inside Bid and Ask Inside bid and ask are the best prices currently
available for buying and selling.
Investing Investing refers to the buying and selling of instruments with
the goal of building wealth over extended periods of time.
Leverage Leverage refers to the increased buying power available in mar-
gin accounts. Leverage allows traders to enter larger positions than could
be afforded with the money in a trading account alone. Leverage magni-
fies both profits and losses.
Limit Order Limit orders allow traders to specify the price they are will-
ing to get for a trade, known as the limit price. A limit order to buy will
be filled at or below the specified price, while a limit order to sell will be
filled at or above the specified price.
Liquidity Liquidity is characterized by a high level of trading activity
allowing traders to enter and exit positions easily without affecting the
instrument’s price.
Live-market Performance Testing Live-market performance testing is
the stage in trading plan development where traders must put real money
on the line to test the system. Live-market performance testing should
only be conducted with a minimum position size. The focus of this
phase is to establish a correlation between the live-market trading results
and the previous development steps.

Glossary 311
Margin Margin is essentially a loan that a broker provides traders
and investors towards purchasing stock shares, futures contracts, or for-
eign currency.
Margin Call A margin call is a demand from a broker that money
be added to a trading account in order to meet the minimum margin
requirement. If this demand is not met, the broker will close out any
positions (without consulting the account holder) in order to ensure that
the account is brought up to the minimum maintenance amount.
Market Analysis Platform Market analysis platforms create price charts
and display price quotes that allow traders to see market action graphi-
cally. Market analysis platforms require a data feed into the market that
allows access to current information (typically, in less than a second).
Market Order A market order is the most basic type of trade order and
instructs the broker to buy or sell at the best price currently available.
The advantage to using market orders is that a trader is guaranteed to get
the order filled.
Market Trader The market trader defines one role of a trader (the other
being the strategist). The market trader’s role is to follow the trading
plan exactly.
Mark-to-Market Mark-to-Market (MTM) is an election that active trad-
ers may choose to elect for tax purposes. This is the only designation
for traders that allows deductions for trading related expenses, such as
platform fees or education.

312 Make Money Trading
Maximum Drawdown Maximum drawdown is a performance metric
that measures the greatest difference, or loss, from a previous equity peak
in a system’s equity curve.
Online Brokers Online brokers offer access to the markets via the In-
ternet and charge significantly smaller commissions than do full service
brokers. Online brokers typically offer only stock/ETF trading and do
not offer advisory services, but may include online or software research
tools for their clients.
Optimal Risk Optimal risk, sometimes called optimal f, refers to the
method of estimating the optimal percentage of risk for a trading system,
so that the system achieves the highest net profit possible.
Optimizing Optimizing refers to the process of modifying values in a
trading plan with the goal of achieving better performance. Once traders
develop the tools to assess a trading plan, it is possible to change part of
the plan, such as the length of a moving average or ADX value, to create
better historical results.
Order Execution Software Order execution programs allow an ad-
vanced level of strategy automation through fully automatic order han-
dling for trading systems, strategies, and indicators.
Oscillator Oscillator is a general term for technical indicators that bounce
between two extreme values to define overbought and oversold conditions.
Over-optimizing Over-optimizing refers to excessive curve fitting that
produces a trading plan that is unreliable in actual trading. An over-op-
timized plan will often show outstanding performance statistics, but will
only work well on the historic data on which it was tested.

Glossary 313
Pattern Day Trader Pattern day traders are those traders who make four
or more day trades within a consecutive five-day period, where the num-
ber of day trades accounts for more than 6% of the total trades taken
during the time period.
Pattern Recognition Pattern recognition is a strategy type that relies on
regularly occurring price patterns for trade entry or exit rules. Individual
markets often display a tendency to move in a particular direction fol-
lowing the formation of reoccurring price patterns. Pattern recognition
can be done visually or with the help of a computer.
Percent Profitable Percent profitable is also known as the probability
of winning. This statistic is calculated by dividing the number of winning
trades by the total number of trades for a given trading period.
Performance Metrics Performance metrics are statistics that can be
used to evaluate a trading plan. Traders often develop a preference for
those metrics that are most valuable based on their particular trading
style or business goals.
Pip Pip refers to the smallest price change that an exchange rate
can make.
Pivot Points Pivot points are a type of technical indicator calculated by
averaging a previous day’s high, low, and closing prices. Originally calcu-
lated by floor traders and market makers at the exchanges, pivots points
project support and resistance levels.
Position Size Position size refers to how many units a trader is buying
or selling, or the dollar amount that a trader is going to trade. Short-
term traders often refer to position size in terms of lots.

314 Make Money Trading
Position Trading Position trading refers to a relaxed style of trading in
which trades are taken over a period of months to years. This style of
trading attempts to identify technical trends in stocks or commodities
where large price movements are likely to occur.
Price Bands Price bands are formed by adding and subtracting a user
defined distance from a moving average. The result is a channel with up-
per and lower lines that are projected onto a price chart.
Price Breakout Price breakout refers to price moves resulting from a
break of an established trend line. These moves can by very dynamic,
especially when confirmed on multiple timeframes.
Probability Probability can be expressed either as a decimal from 0.00
to 1.00, or as a percentage from 0% to 100%. A probability of 1.00
or 100% means an event will always occur, while a probability of 0.00
means the event will never happen.
Probability of Ruin (Risk of Ruin) The probability of ruin refers to the
risk of losing all of the invested capital.
Probability of Winning The probability of winning is the inverse of
the probability of loss or ruin.
Profit Factor The profit factor can be thought of as the R advantage
for the complete trading plan. While the R advantage is only used to
measure the risk ratio of individual trades, the profit factor is defined as
the gross profit divided by the gross loss (including commission) for the
entire trading period.

Glossary 315
Profit Target A profit target defines when an open trade will begin to
take profits.
R The amount of trade risk can be expressed in risk units, or R.
Real Equity Curve A real equity curve is constructed by combining the
data from live trading and from the development phases of a
trading plan.
Risk Risk is the probability of losing money or trading capital.
Risk-adjusted Expectancy Risk-adjusted expectancy (ERA) expresses
expectancy per unit of risk, instead of as a dollar amount, and is often
useful in comparing different systems. Multiplying ERA by the average
dollar amount of risk (average loss) brings us back to the dollar value in
which expectancy was originally defined.
Routing Instructions Routing instructions refer to the ability to choose
which exchange will fill an order.
Scalping Scalping refers the trading style that involves frequent buying
and selling throughout the day. Scalp trades target the smallest intraday
price movements and take place within seconds or minutes.
Sell Short Selling short, or short selling, requires traders to begin a trade
by borrowing shares of a stock or futures contracts from a broker (using
margin) and then selling them. Traders must then buy back the stock or
futures contracts (known as buying to cover) when they wish to flatten or
close out the trade. In this way, traders can profit from falling prices.

316 Make Money Trading
Signal Exit Signal exits refer to a condition occurring in the market that
indicates when traders may want to exit, or flatten, their open positions.
Signal exits are based on the adverse action of price, an indicator, or an
outside market relationship.
Slippage Slippage refers to the difference between the price a trader
expects and the price he or she actually gets in a transaction.
Stop Exit A stop exit refers to any type of trade exit that attempts to fol-
low the movement of price. The goal of a stop exit is to protect profits
by moving the stop exit level in the direction of the market. This type of
exit includes breakeven and trailing stops.
Stop Loss A stop loss is a simple limit to how much capital a trader is
willing to risk on any one trade.
Stop Order A stop order to buy or sell becomes active only after a
specified price level has been reached (known as the stop level). Stop or-
ders work in the opposite direction of a limit order, with buy stop orders
placed above the market and sell stop orders placed below the market.
Once a stop level has been reached, the order will be immediately
converted into a market or limit order. In this sense, a stop order is not
really an order in itself, but a trigger for either a market or limit order.
Strategic Plan A strategic plan leads traders from where they are now to
where they would like to be in the future. This type of planning allows
traders to build a comprehensive model for their trading businesses as
well as providing the most direct path for getting there.
Glossary 317
Strategist The strategist defines one role of a trader (the other role is the
market trader). The strategist must see the “big picture” and is respon-
sible for the overall planning of the business, including the development
of the trading plan.
Support and Resistance Support and resistance refers to areas where
prices have previously stalled or reversed. Support can be thought of as a
floor under trading prices, while resistance is the ceiling.
Swing High Swing highs are price movements characterized by inverted
Vs on a price chart; swing highs are points where price has risen and
reversed, forming an inverted V shape.
Swing Low Swing lows are price movements characterized by Vs on a
price chart; swing lows are points where price has dropped and reversed,
forming a V shape.
Swing Trading Swing trading refers to the trading style that involves tak-
ing trades (or positions) that last a few days or weeks.
Symbol Symbol refers to the abbreviation for an instrument that is
being traded.
System Trading System trading allows traders to develop specific rules
that establish both trade entries and exits. Similar to front-end software,
system trading requires software that is linked to a broker.
Technical Analysis Technical analysis is the method of analyzing mar-
ket movement based on past price and volume activity.

318 Make Money Trading
Thermometer Indicator The Thermometer Indicator acts as a tempera-
ture gauge for intraday price movements and is intended to function
in real time. It works on all intraday charts and registers a value as a
percentage price difference.
TICK The TICK stands for the NYSE Tick Index and measures the
difference in stocks currently trading positively on an uptick and stocks
currently trading negatively on a downtick.
Tick Chart Tick charts plot prices for a specific number of transactions.
For example, a 144 tick chart will print a bar for every 144 transactions
that have occurred.
Time Exit Time exits are a type of trade exit. Time exits close a trade
after a set amount of time or after a number of candlestick bars have
passed. This type of a trade exit is used to establish the maximum time
horizon in which a trade will take place. At the end of this time, the
trade will be closed, with or without a profit.
Total Net Profit The total net profit represents the bottom line profit
or loss for a trading plan over a specified trading period. This statistic
is calculated by subtracting the gross loss of all losing trades (including
commissions) from the gross profit of all winning trades.
Trade Filters Trade filters define the setup conditions that will allow a
trade to occur. Trade filters should not be confused with the trade trig-
ger. Trade filters simply define the conditions for when the trade trigger
is active. Trade filters can be thought of as the “safety” for the trade
trigger. Once all of the conditions for the trade filters have been met, the
safety is off and the trade trigger becomes active. Trade filters must occur
before the trade trigger.

Glossary 319
Trade Trigger A trade trigger is the line in the sand that defines pre-
cisely when a trade will be entered. While there may be several other
conditions that will further define a trade entry, known as trade filters,
the trade trigger tells traders exactly when to act.
Trader A trader is one who places frequent trades in the markets with
the intention of profiting from the trades. Within the scope of this
book, a trader is part strategist and part market trader.
Trader Alerts Trader alerts are audio or visual alerts that are set to acti-
vate when certain conditions in the market occur. Traders can customize
these alerts within their market analysis platforms.
Trader-assist System Trading Trader-assist system trading is an alterna-
tive form of investing that allows traders to purchase or lease commercial
trading systems that are traded and monitored by a broker.
Trading Trading refers to the frequent buying and selling of stocks or
commodities with the goal of generating returns that outperform buy-
and-hold investing.
Trading Journal A trading journal is a record of individual trades and
acts as a trading diary.
Trading Plan A trading plan is an essential element of a strategic plan
that addresses the specific trading aspects of the business. This plan is
based on thorough research and addresses the implementation of all of
the previous goals.
Trading Style Trading style refers to the time frame or holding period in
which stocks, commodities, or other trading instruments are bought
and sold.

320 Make Money Trading
Trading Volume Trading volume refers to the number of shares that
have been bought and sold during a particular time period.
Trailing Stop A trailing stop is a dynamic stop order that follows price
trends in an attempt to lock in profits. A trailing stop will incrementally
increase in a long trade to follow the rising market, and will decrease in a
short trade to follow the declining price.
Trend Following Strategy Trend following strategies attempt to catch
the largest price moves in a market. Trading plans that use trend follow-
ing typically have a lower percentage of winning trades, offset by the
winning trades being much greater than the losing trades.
Trendlines Trendlines are straight lines drawn on a chart connecting
points where prior price reversals have occurred. They typically project
into the future, or the right-hand edge of the chart.
Triangle Pattern A triangle pattern forms as two trendlines converge,
creating a consistently smaller support and resistance channel in which
price can move.
TRIN The TRIN, also known as the NYSE Arms Index, is the NYSE
Trader’s Index. It measures the intraday direction of the market by
comparing the number and volume of NYSE stocks that are advancing
to those that are declining. The TRIN can be a helpful tool for assess-
ing market strength, and, while based on the NYSE, often represents the
broad market.
Undercapitalized Being undercapitalized is the risk of not having
enough money to trade with in order to become profitable.

Glossary 321
Uptrend An uptrend is price movement with higher swing highs and
higher swing lows. Two trendlines can be drawn (one connecting swing
highs, one for swing lows) that both have positive slopes and form an
upward channel of price movement.
Volatility Volatility refers to the amount of price fluctuation in a
given instrument.
Volume Chart Volume charts record the prices for a specified number
of contracts or shares traded. For example, a 250 volume chart will print
a bar for every 250 shares/contracts that have been traded.


Index
2% risk limit, 13, 186–87, 191–92, 221
50% rule for swing trading, 283
A
Adaptive Price Zone (APZ), 125–27
adaptive price zone indicator, 291–92
ADX (average directional index) oscillators, 127–28, 202–3, 206, 225–27
alerts, 242, 243
AMEX (American Stock Exchange), 48–53
anti-martingale betting system, 29
application program interface (API), 90–91
APZ (Adaptive Price Zone), 125–27
ask prices

324 Make Money Trading
in forex, 70
in futures, 63
in stock exchanges, 48–52, 53
See also bid-ask spreads; bid prices
asset allocation and position sizing, 180–87
ATR (average true range), 186–87
attitude, maintaining a positive, 37
auctioneer/specialist and price action, 50–52
average directional index (ADX) oscillators, 127–28, 202–3, 206, 225–27
average price, 153–54
average trade net profit, 217–18
average true range (ATR), 186–87
B
backtesting. See historical modeling
backtesting software, 83–84, 210, 211, 226, 259
bar charts, 98–99
bearish hammer pattern, 100, 101
bid-ask spreads
effect of, 136–37
in E-minis, 67
of ETFs, 59
in forex markets, 70–71
inside bid and ask, 52, 63, 153–56
in stock exchanges, 49–52
and volume, 153–54
See also ask prices; bid prices
bid prices
in forex, 70
for futures, 63

Index 325
and profit availability, 153–54
in stock exchanges, 48–52, 53
See also ask prices; bid-ask spreads
BP (British Pound) futures, 71–72
brackets, 162–63, 167–69, 204
breakeven stops, 165–66
British Pound (BP) futures, 71–72
brokers
backup broker, 240
choosing, 87–88, 91–92
commissions, 70–71, 224–25
for day trading, 90–91
direct access brokers, 84, 90–91, 150, 151
full service brokers, 89
margin account with, 63, 65, 92–96, 149, 181–84
online brokers, 89–90
order routing systems, 152
proprietary order execution software, 84, 91, 152
simulators for learning trading, 85, 171, 231
statements from, 246, 269
and system trading, 172–73
trade durations available from, 152
trading account, 91–96, 249
bullish reversal patterns, 100, 101
business. See trading as a business
business entity decisions, 268
business expenses, 44, 45
buying (going long) currency pairs, 70
buying to cover, 94, 148
buy stop orders, 162–63

326 Make Money Trading
C
cable Internet connections, 80
candlesticks, 98–101, 204–5. See also charts
capital
equating to inventory, 27–28, 37, 249
potential for losing, 9, 19, 28
and probability of ruin, 12–14, 20–21, 219–22, 223–24
and style of trading, 5, 7
and trading plan, 249
undercapitalization, 11, 45
capital, protecting, 27–31, 32, 274, 276. See also position size; stop losses; trading plans
capitalization-weighted indices, 56–57
cash indices, 56, 57
catastrophic losses, 218–19
CBOT (Chicago Board of Trade), 61
CCI (commodity channel index) oscillators, 127–28, 129–31, 132
cell phone, 80
central pivot point, 115, 116–17, 287–90
Certified Public Accountant (CPA), 270–71
chain of technology, 75
channel breakouts, 112, 113–14
charts
bar charts, 98–99
candlesticks, 98–101, 204–5
curve fitting, 226–27
daily charts, 101–3, 139–42, 201
equity curve, 183–84, 256–57, 259
Fibonacci retracements, 117–20
and multiple moving averages, 123
Index 327
overview, 97–98
pivot points, 114, 115–17
prioritizing, 242–43
real equity curve, 258–61, 262, 263
setting up, 138–43
software for creating, 81–83
tick charts, 103–8, 118–20
trendline patterns, 112, 113–15
trendlines, 108–13, 260, 261, 262, 263
of volume, 103–6, 139–40
See also entry and exit points; intervals; intraday charts; profit targets; stop losses
Chicago Board of Trade (CBOT), 61
Chicago Mercantile Exchange Group (CME Group), 61
coin toss example, 10–16, 19–22
commercial trading systems, 7
commission, 70–71, 224–25
commodities trading, 65. See also futures markets
commodity channel index (CCI) oscillators, 127–28, 129–31, 132
competency model, 34–35
compounding, 2
computer hardware, 78–80
conditional trade orders, 167–69
consistency, value of, 176, 217, 256
consolidation of prices, 106
constant position sizing, 20, 184
contracts in futures markets, 61–65, 103–6, 151–52
countdown meters, 104–6, 293–94
counter trend swing trading plan, 201–4, 217, 219–20, 225–27, 296–97
CPA, 270–71
currency exchange, history of, 67–68

328 Make Money Trading
currency pairs, 69–72, 196–200
curve fitting, 226–27
custom indicators, 132–34
D
daily change in cash indices, 56, 57
daily charts, 101–3, 139–42, 201
data-based intervals, 103–6
data feed, 82, 83, 86–87, 90, 173
data indicators, 134–38
data points, 98
“day” orders, 152
day trading
brokers for, 90–91
and data indicators, 134–38
effect of slippage and commissions, 225
in E-minis, 67
margin requirements, 93, 94, 95
overview, 5–7
pattern recognition strategy, 204–8, 217, 297–98
time exits for, 194
See also intraday charts
DEMA (double exponential moving average), 122–24, 125, 197–98, 290–91
Dennis, Richard, 180
development phase of trading plan, 175–79
dial-up Internet connections, 80
DIAMONDS Trust (DIA), 58–60
direct access brokers, 84, 90–91, 150, 151
display price quotes, 81–83
diversification, 59–60, 184–87

Index 329
double exponential moving average (DEMA), 122–24, 125, 197–98, 290–91
Dow Jones Industrial Average (DJIA), 56–58
Dow Jones Tick Index (TIKI), 135, 137
downticks, 136–37
downtrends, 110–11, 131, 132, 137
drawdown, 214–15, 221, 249, 262
drawdown troughs of real equity curves, 260, 261
DSL Internet connections, 80
duration of a trade order, 151, 152
E
Eckhardt, William, 180
ECN (electronic communication network), 152
economic calendars, 266
ED (EuroFX futures), 71–72, 113
educational path
avoiding losses, 28–29, 250
broker-provided simulators, 85, 171, 231
competency model, 34–35
deciding on, 33–35
forward performance testing as, 178–79, 230–31
need for, 31–33
on-the-job learning process, xi, 9, 31–37, 241, 262–63, 276–77
See also trading journal
electronic communication network (ECN), 152
electronic trading, 65, 66–67, 156. See also technology maximization; trade automation
EMA (exponential moving average), 122, 124
emergency numbers list, 237–38, 302
E-mini index futures, 66–67, 94–95, 116–17, 154
E-mini NASDAQ 100 (NQ), 66–67

330 Make Money Trading
E-mini Russell 2000 Index (ER2), 66–67, 112, 113–14, 142–43, 161–66
E-mini S&P 500 (ES)
deep pullback to reversal, 118–20
limit orders, 156–58
margin and leverage, 95
market orders, 154–57
overview, 66–67
price bands on tick chart, 126–27
price ladders, 63, 64
shallow pullback to support level, 119–20
tick chart with resistance and support levels, 106–7
emotional factor in markets, 47–48
end of day (EOD) analysis, 101
engulfing candlestick patterns, 100, 101, 205–7
entry and exit points
for counter trend strategy, 202–4
gap entry and exit rules, 282, 283, 284
moving average crossover system, 123, 125
for pattern recognition strategy, 205–8
and primary charting interval, 187, 242
resistance and support levels as, 106–8
for trend following strategy, 198–99
See also entry points; exit strategies
entry points
ADX and Premier stochastic for, 202–4
engulfing patterns as, 205–7
overview, 188–90
short-term stochastic cross, 129, 130, 203
for swing trading, 282–83
EOD (end of day) analysis, 101

Index 331
equity curve, 183–84, 256–57, 259. See also real equity curve
ER2 (E-mini Russell 2000 Index), 66–67, 112, 113–14, 142–43, 161–66
ERA (risk-adjusted expectancy), 12, 15, 20–21
errors, 29, 253–54
ES. See E-mini S&P 500
ETFs (Exchange Traded Funds), 58–60, 95, 149, 151–52
EuroFX futures (ED), 71–72, 113
Excel spreadsheets, 211–15, 256–57. See also performance analysis spreadsheet
exchange rates, 67–68
exchanges
AMEX, 48–53
for futures market, 60–65
NASDAQ, 48–52
NYSE, 48–52
participants in, 53–55
See also brokers; markets
Exchange Traded Funds (ETFs), 58–60, 95, 149, 151–52
exit strategies
ADX for, 128
for day trading, 207–8
exit bracket, 204
front-end software for, 171
overview, 190–94
stop exits, 145–46, 193
for swing trading, 283–84
See also stop losses; stop orders
expectancy
average trade net profit, 217–18
maintaining, 249
negative expectancy, 254

332 Make Money Trading
per risk units, 12, 15, 20–21
positive expectancy, 14–18, 39, 254
trading outside the plan vs., 241, 249, 253, 274
trading plan strategy and, 195, 216, 217–18
exponential moving average (EMA), 122, 124
F
farmers, 60
Federal Reserve Board, 92, 93
Fibonacci numbers, 105–6, 118–19
Fibonacci retracements, 117–20
50% rule for swing trading, 283
fill (completed trade transaction), 151
fixed-percentage betting, 20
fixed-percentage position sizing, 184
forex markets (foreign exchange/FX)
brokers for, 91
futures market, 71–72
“majors,” 69, 70–71
margin requirements, 92–94, 95, 182–84
one lot of currency, 151–52
overview, 67–70
pivot point calculations for, 116–17
for short trades, 149
trend following strategy for, 196–200
forward performance testing, 178–79, 230–31
front-end software, 90–91, 167, 170–71, 173
full service brokers, 89
futures markets
contracts in, 61–65, 103–6, 151–52

Index 333
exchanges, 61–65
forex, 71–72
intraday margin requirements, 94–95
margin requirements, 63, 65, 92–96, 182–84
overview, 60–61
pivot point calculations for, 116–17
for short trades, 149
stock index futures, 65–66
See also entries beginning with “E-mini”
G
gambling
anti-martingale betting system, 29
on coin toss, 10–16, 19–22
fixed-percentage betting, 20
trading compared to, 233–34
gap entry and exit rules, 282, 283, 284
General Electric (GE), 51–52, 53
goals, x, 25, 35, 41, 42, 43, 252
gold standard monetary system, 67–68
good-till-canceled duration (GTC), 152
H
hammer patterns, 100, 101
hedge funds, 218
hedging, 240
historical modeling or backtesting
comparing live performance to, 254, 255–56
evaluating trading plans, 178–79, 225–29
limitations of, 251–52

334 Make Money Trading
maximum historical drawdown, 262
optimizing and over-optimizing, 225–27
software for, 83–84, 210, 211, 212, 226, 259
using in-sample and out-of-sample data, 227–29
value of, 25–27
holding period, risk and, 7–8
horizontal trendlines, 110
I
Important Numbers worksheet, 302
independent trading
benefits of, ix–x
challenges and responsibilities, x–xi
profit and loss statement, 44, 45
surfer to yacht comparison, 1–2
See also trading styles
indices, stock market, 55–58, 136–38
initial margin, 93
input values, 120–23, 128–31
in-sample data, 227–29
inside bid and ask, 52, 63, 153–56
instrument symbol for futures contract, 62, 63
intelligent order routing, 152
intentional trading errors, 253
Internet connection, 80
intervals
on candlestick charts, 98–99
data-based, 103–6
data points, 98
multiple chart intervals, 111–12, 120, 187, 189–90

Index 335
multiple interval charts, 101–3
time-based, 101–3, 105
intraday charts
applying stochastics to, 129, 130
choosing interval for, 105–6
data-based charts, 103–6
DEMA analysis, 122–24
overview, 142–43
time-based charts, 101–3
and trendline triangle pattern, 114
intraday market, data indicators for, 134–38
intraday traders. See day trading; scalp trading
intraday trades and margin account, 93, 94, 95
investing vs. trading, 2–4
iShares Russell 2000 Index (IWM), 58–60
J
Japanese Yen futures (JY), 71–72
journal. See trading journal
L
Lambert, David, 129
Lane, George C., 128–29
Level 2 screen, 51–52, 59, 152, 153–54
leverage
in forex markets, 68–69
in futures contracts, 63, 65
margin account and, 94–95, 181–84
limit orders, 156–58, 189, 192–93
liquidity, 8, 49, 59–60, 66–67, 153

336 Make Money Trading
live-market performance testing, 178
live trading
emergency numbers list, 237–38, 302
making backups of key tools, 236–37, 267
mental focus for, 241–43
overview, 233–34
preparation for, 235–36
trade automation for, 247–48
and trading journal, 244–47
troubleshooting list, 238–40, 247–48
live trading performance, evaluating
and equity curve, 256–57, 259
overview, 251–52
with performance analysis spreadsheet, 254–56
and real equity curve, 258–61
with trading journal, 252–54
and trading plan issues, 262–63
long gap entry, 282
long swing entry, 282
long-term goals, x, 25, 35, 42, 43
long trades
orders for, 146–48, 157–58, 162–65
overview, 146–48
short trades vs., 147, 149
stop loss levels for, 191–92
and trailing stop levels, 160–61
look back periods, 120–23, 128–31, 142
losses, learning to avoid, 28–29, 250
lots, size of trade in, 151–52

Index 337
M
Macintosh computers, 78
maintenance margin, 93
margin account, 63, 65, 92–96, 149, 181–84
margin call, 93, 95
market action. See price action
market analysis platforms
custom alerts, 242, 243
overview, 81–83
quote screen showing market indicators, 141
troubleshooting guide for problems with, 238–40
market capitalization, 55
market depth, 63, 64, 154
market indicators, 55–58, 141. See also price action; technical indicators
Market Indicators worksheet, 303
market inefficiencies, 47–48, 142
market orders, 152–56, 158
market price, 154–56
markets
changes over time, adapting to, 261
conceptual scope of, 242–43
data indicators for gauging strength of, 134–38, 139–40, 142
learning about, xi, 9, 31–37, 241, 262–63, 276–77
phases or cycles of activity, 195–96
technical aspects vs. fundamentals, 4
See also exchanges; forex markets; futures markets; stock markets
market sentiment, 57
market traders, 38, 39–41
Mark-to-Market (MTM) tax status, 270–71
maximum drawdown, 214–15, 221, 249, 262
338 Make Money Trading
maximum historical drawdown, 262
maximum margin level, 182
maximum profit, 20–21
mean deviation, 131
mental focus, 241–43
Microsoft Excel spreadsheets, 211–15, 256–57. See also performance analysis spreadsheet
Microsoft (MSFT) bid and ask prices, 49–50
Microstrategy, Inc., 54, 55
minimum margin level, 93
Mini-sized Dow Futures ($5) (YM), 66–67
mission statement, 42, 43
moving averages, 121–24, 139–40
MSFT (Microsoft) bid and ask prices, 49–50
MTM (Mark-to-Market) tax status, 270–71
multiple chart intervals, 111–12, 120, 187, 189–90
multiple interval charts, 101–3
multiple profit target orders, 165–66, 171
multiple stochastics, 130
multiple trade exits, 190
N
naked trading, 145–46
NASDAQ-100 Index, 56
NASDAQ-100 Trust Shares (QQQQ)
daily chart setup for, 139–40
multiple interval charts of, 101–3
overview, 58–60
and pattern recognition day trading plan, 205–6
successful short trade on, 147, 149
tick chart example, 103–4

Index 339
NASDAQ Composite Index (NAS), 56–58
Nasdaq composite Tick Index (TIKQ), 135, 136–37
NASDAQ Stock Market (NASDAQ), 48–52
negative expectancy, 254
New York Mercantile Exchange (NYMEX), 61–65
New York Stock Exchange (NYSE), 48–52
normalization based on market volatility, 185–87
NQ (E-mini NASDAQ 100), 66–67
NYMEX (New York Mercantile Exchange), 61–65
NYSE Arms Index; NYSE Trader’s Index (TRIN), 135, 137, 138
NYSE (New York Stock Exchange), 48–52
NYSE Tick Index (TICK), 135, 136–37
O
objectives, defining, 42, 43, 176–77
OCO (order cancels order), 167–69
office (trading space), 77–87
online brokers, 89–90
online trading schools, 33
open positions
canceling, 161, 163, 165–66
profit expectations and, 250
and profit targets, 192
signal exits and, 194
verifying closure of, 239, 240
opposing short position, 3
optimal market conditions, 120, 190, 196
optimal risk (optimal Fibonacci), 18–21
optimal risk percentage, 210, 222–24
optimism, 10

340 Make Money Trading
optimization report, 226
optimizing a trading plan, 225–27
order cancels order (OCO), 167–69
order entry mistakes, 29
order entry with price ladder, 154–57. See also trade orders
order execution software, 84–86, 91, 150, 152, 171
order routing systems, 152
orders. See trade orders
order sends order (OSO), 167–69
oscillators, 127–31, 132
outliers, 218
out-of-sample data, 227–29
overbought and oversold areas, 129, 130, 134, 136
over-optimizing a trading plan, 226–27, 262
P
pattern day traders (PDTs), 93, 95
pattern day trading strategy, 204–8, 217, 297–98
percentage in point (pips), 70–71
percent profitable (probability of winning), 14–16, 16–18, 217, 254
performance analysis spreadsheet
adding slippage and commission to, 225
creating, 212–14
for evaluating live performance, 254–56
evaluating live performance with, 254–60
examples of, 211, 220
formulas for, 213
importing data into, 212, 298
optimal risk percentage, 222–24
risk of ruin calculation, 219–22

Index 341
performance bonds, 92
performance metrics, 209, 212–18, 227–29
performance reports, 25–26, 200, 203, 207
performance standard, 4
perspective on trading, 234, 279
phone numbers list, 237–38, 302
pips (percentage in point), 70–71
pivot points, 114, 115–17, 287–90
portfolio diversification, 59–60, 184–87
position size
decisions about, 19–20, 28–29, 187, 210
and front-end software, 171
for live-market performance testing, 179
margin and, 182–84
maximum position size, 181–82
overview, 151–52
and risk of ruin, 19–21, 221–22
for testing a trading plan, 218
in Turtles’ winning strategy, 180–81
position trading, 5, 6–7, 89, 241
positive expectancy, 14–18, 39, 254
Premier stochastic indicator, 133–34, 202, 203–4, 292–93
premium, 65
price action
attraction to statistical average, 126–27
in futures, 63
in markets, 50–52
oscillators’ response to, 127–28, 134
and stop exits, 193
tendency for pull back after strong move, 117

342 Make Money Trading
tick and volume charts for, 103–6
See also charts; technical analysis; technical indicators
price bands, 124–27
price breakouts, 111–15
price charts. See charts
price ladder for futures, 63, 64, 154–57, 170–71
price quotes, including on market analysis workspace, 140–42
price-weighted average index, 56
primary charting interval, 187, 242
prioritizing information, 242–43
probability, 10–12
probability of ruin, 12–14, 20–21, 219–22, 223–24
probability of winning (percent profitable), 14–16, 16–18, 217, 254
profit, conceptualization of, 148
profit and loss statement, 44, 45, 84
profit factor, 216–17
profit targets
in bracket orders, 162–63
for counter trend strategy, 204
evaluating success of, 244, 246
multiple profit target orders, 165–66, 171
overview, 30–31, 192–93
in pattern recognition strategy, 207–8
pivot points and, 116
programmability of software packages, 85–86
proprietary order execution software, 84, 91, 152
pullbacks, evaluating strength of, 118–20
Q
QQQQ. See NASDAQ-100 Trust Shares

Index 343
R
R (trade risk units), 9, 16
R1 resistance level, 115, 116–17
R2 resistance level, 116–17
R advantage, 16, 17, 216–17, 254
+R advantage
in counter trend strategy, 204
maximizing, 20
overview, 10, 14–18
from recognizing entry or exit points, 106–8
from relationship of stop loss and profit target, 193
with stop losses, 30–31
+R advantage ratios, 16, 18
real equity curve, 258–61, 262, 263
record keeping, 265–71. See also trading journal
reevaluation criteria, 250
Regulation T (Federal Reserve Board), 92, 93
research, 42, 175–76, 267–68. See also trading plans
resistance, 106–8, 110, 115, 116–17
retracements, 117–20
reversal patterns, 100–101, 124, 205–7
revisions to trading plan, 176, 178, 179
risk
assessing amount of, 210
individual risk tolerance, 20, 277
of individual stocks, 53–55
length of holding period and, 7–8
from misuse of technology, 76
optimal percentage of risk, 210

344 Make Money Trading
optimal risk level, 18–21
overview, 8–14
and positive expectancy, 14–18
with profits vs. capital, 29
in short trades, 149
trading style and, 8
risk-adjusted expectancy (ERA), 12, 15, 20–21
risk capital, 33, 186
risk limits. See stop losses
risk management, catastrophic losses vs., 218–19
risk measurements, 219–24
risk of ruin, 12–14, 20–21, 219–22, 223–24
risk per trade, 187
risk-to-reward analysis, 19
rouge transactions, 113
round-the-clock trading, 65–66, 67, 68
round turn trades, 94, 252
routing instructions, 151, 152
ruin%, 220, 221
Rules of Successful Trading, 273–79
S
S1 support level, 115, 116–17
S2 support level, 116–17
satellite Internet connections, 80
scalp trading, 5, 6–7, 18
sector, definition of, 142
Securities and Exchange Commission (SEC), 9, 95
selling short. See short trades
sentiment of market or traders, 57

Index 345
SF (Swiss Franc) futures, 71–72
short gap entry, 283
short selling. See short trades
short swing entry, 282
short-term buying/price drop, 52
short-term goals, x, 4, 35, 42, 43
short trades
currency pairs, 70
of ETFs, 60
futures contracts, 63
long trades vs., 147, 149
margin account for, 94, 149
orders for, 148–49, 163–65
overview, 148–49
and trailing stop levels, 160
signal exits, 194
simple moving average (SMA), 121–22, 124, 131, 139–40
simulators for learning trading
broker-provided, 85, 171, 231
forward performance testing as, 178–79, 230–31
slippage, 146, 153, 154–56, 193, 224–25
smart order routing, 152
SMA (simple moving average), 121–22, 124, 131, 139–40
software
application program interface, 90–91
for backtesting, 83–84, 210, 211, 226, 259
chart setups, 138–39, 140–42
Excel spreadsheets, 211–15, 256–57
front-end, 167, 170–71
indicator formatting window, 120–21

346 Make Money Trading
leasing, 86
market analysis platform, 81–83
for order execution, 84–86, 91, 150, 152, 171
overview, 81, 86
and PC vs. Macintosh, 78
SwingTracker, 281–82
for system trading, 7, 8
troubleshooting guide for problems with, 238–40, 247–48
software companies, 87
specialist/auctioneer and price action, 50–52
spot market, forex, 71
spreadsheets, 211–15, 256–57. See also performance analysis spreadsheet
stability of forex markets, 68
Standard and Poor’s 500 Index (S&P), 3–4, 56–58. See also E-mini S&P 500
Standard and Poor’s Depository Receipts (SPY), 58–60
statistics
from historical data, 27
performance metrics, 209, 212–18, 227–29
probability, 10–12
probability of ruin, 12–14, 20–21, 219–22, 223–24
probability of winning, 14–16, 16–18, 217, 254
total net profit, 3–4, 216
See also technical analysis; technical indicators
stochastic oscillators, 127, 128–29, 130
stock index futures, 65–66
stock indices, 56, 57
stock markets
exchanges, 48–55
exchange-traded funds, 58–60
indices, 55–58, 136–38

Index 347
margin concept in, 92–96
pivot points for stocks, 116
See also exchanges
stock shares, 103–6, 151–52
stock ticker display, 53, 56, 57
stop-and-reverse orders, 163–65, 197–99, 204
stop exits, 145–46, 193
stop losses
and 2% risk limit, 13, 186–87, 191–92, 221
action on reaching, 161
evaluating success of, 244
overview, 29–31, 158–59, 191–92, 278
in pattern recognition strategy, 207–8
and profit targets, 193
+R advantage from, 30–31
for short trades, 149
support level for, 106–8
for swing trading, 283
in trend following strategy, 199
stop orders
in dollar amount, 192
front-end software and, 171
overview, 158–61, 283–84
stop order to buy, 198, 282
stop order to sell, 283
trade examples with, 161–66
as trade triggers, 189
trailing stops, 160–61, 207–8, 283–84
See also stop losses
strategic plans, 41, 42–43. See also trading plans

348 Make Money Trading
strategist traders, 38–41, 267–68
strategy types
counter trend, 201–4, 219–20, 225–26, 296–97
overview, 195–96
pattern recognition, 93, 95, 204–8, 217, 297–98
trend following, 196–200, 211, 217, 294–95
stress
minimizing, 27, 234–40, 265–71
utilizing, 230
supply and demand imbalances, 50–52
support, 106–8, 109, 115, 116–17, 163
support and resistance
Fibonacci retracements, 117–20
on multiple chart intervals, 111–12, 120, 187, 189–90
overview, 106–8
pivot points, 114, 115–17, 287–90
trendline patterns, 112, 113–15
trendlines, 108–13, 260, 261, 262, 263
See also resistance; support
surfer to yacht comparison, 1–2
swing highs, 109–13
swing lows, 109–13
SwingTracker software, 281–82
swing trading
acceptable risk for, 187
counter trend plan, 201–4, 219–20, 225–26, 296–97
entry and exit points, 282–84
overview, 5–7, 187
sample trading plan, 281–86
Swiss Franc (SF) futures, 71–72

Index 349
symbols, 61–63, 151
system trading, 7, 8, 167, 172–73
T
taxes, 270–71
technical analysis
overview, 97–98
pivot points, 114, 115–17, 287–90
resistance, 106–8, 110, 115, 116–17
support, 106–8, 109, 115, 116–17, 163
and system trading, 172–73
See also charts; support and resistance
technical indicators
APZ, 125–27
custom indicators, 132–34
data indicators, 134–38
DEMAs, 122–24, 125, 197–98, 290–91
moving averages, 121–24, 139–40
oscillators, 127–31, 132
overview, 120–21
Premier stochastic indicator, 133–34, 292–93
price bands, 124–27
technology maximization
alerts, 242, 243
back-up battery, 80
computer hardware, 78–80
data feed, 86–87
Internet connection, 80
making backups of key tools, 236–37, 267
monitor workspace setup, 139

350 Make Money Trading
overview, 73–76, 275–76
strategic plan and, x, xi
television, 81
See also charts; performance analysis spreadsheet; software; trade automation
television, 81
testing your trading plan, 178–79, 225–29, 230–31. See also trading plans, evaluating
threshold lines, 129–30, 134, 189, 203. See also support and resistance
threshold triggered order (TTO), 168
tick charts, 103–8, 118–20
TICK (NYSE Tick Index), 135, 136–37
time-based intervals, 101–3, 105
time exits, 194
time-in-force, 151, 152
tools of the trade, 73–76, 236–37, 266–69. See also brokers; software; technology
maximization
Top Ten Rules of Successful Trading, 273–79
total net profit, 3–4, 216
TP (typical price), 131
trade automation
conditional trade orders, 167–69
front-end software for, 167, 170–71
intelligent order routing, 152
in live trading, 247–48
order execution software, 84–86, 91, 150, 152, 171
in system trading, 172–73
See also technology maximization
trade data, entering into Excel, 213
trade data export strategy add-on, 212, 298
trade filters, 189–90, 198
trade formulas for Excel spreadsheet, 213, 214

Index 351
trade orders
bracket, 162–63, 167–69
buy stop, 162–63
conditional, 167–69
limit, 156–58, 189, 192–93
for long trades, 146–48, 157–58, 162–65
market, 152–56, 158
multiple profit target, 165–66, 171
order cancels order, 167–69
order sends order, 167–69
overview, 145–46, 151–52, 161–62
for short trades, 148–49, 163–65
stop-and-reverse, 163–65, 197–99, 204
threshold triggered, 168
See also profit targets; stop orders
trader alerts, 242, 243
trader-assist system trading, 89
traders
aggressive vs. conservative, 188
choosing style, 5
and emotional factor, 47–48, 173, 248, 277–78
independent, ix–x, x–xi, 1–2, 44, 45
instincts of, 31
learning about markets, xi, 9, 31–37, 241, 262–63, 276–77
market traders, 38, 39–41
minimizing stress, 27, 234–40, 265–71
objectivity of, 212
recognizing personal ineffectiveness, 279
routing instructions of, 151, 152
skills of, 37–42

352 Make Money Trading
strategist traders, 38–41, 267–68
trend following strategy types, 200
trusting your trading plan, 248–50
See also trading styles
trader worksheets, 300–303
trade simulators. See simulators for learning trading
trade triggers, 188–89, 198
trading
definition of, 2
inconsistent rewards from, 32
perspective for, 234, 279
vs. investing, 2–4
trading account, 91–96, 249. See also margin account
trading as a business
awareness of requirements, 23–25, 242
business entity decisions, 268
business expenses, 44, 45
equating capital to inventory, 27–28, 37, 249
overview, ix–xi, 9, 275
record keeping, 265–69
research and decision-making practice, 37–38
strategic plan, 41, 42–43
taxes, 270–71
See also trading journal; trading plans
trading binder, 268–69
trading capital. See capital
trading errors, 29, 253–54
trading journal
blank form for, 301
creating, 35–37, 39, 230–31, 243, 244–47

Index 353
incorporating into trading binder, 268–69
overview, 267
reviewing, 252–54
trading naked, 145–46
trading plans
asset allocation and position sizing, 180–87
criteria for abandoning, 262
development and testing, 175–79, 178, 184–85
expectancy of, 195, 216, 217–18
as hedge against emotionally-driven traders, 48, 277–78
losing expectancy, 241, 249, 253, 274
mental focus related to, 241–43
motivation system for sticking with, 249–50
optimizing, 225–27
over-optimizing, 226–27, 262
overview, x–xi, 274–75
performance reports, 25–26, 200, 203, 207
performance standard, 4
role of, 32, 42, 43, 45
support and resistance recognition for, 106–8
for swing trader, 281–86
trend following, 196–200, 198, 294–95
trusting your, 248–50
See also entry and exit points; expectancy; strategy types
trading plans, evaluating
abandonment decision, 262–63, 278
forward performance testing, 178–79, 230–31
overview, 209–12, 251–52
and performance metrics, 212–18
risk measurements, 218–24
354 Make Money Trading
slippage and commission, 224–25
testing with historical data, 178–79, 225–29
trading journal review, 252–54
Trading Plan worksheet, 300
trading rules. See trading plans
trading space (office), 77–87
trading styles
and chart interval, 187
choosing, 40–41
counter trend swing trading, 201–4, 219–20, 225–26, 296–97
mental focus related to, 241–43
overview, 5–8
pattern day trading, 93, 95, 204–8, 217, 297–98
position trading, 5, 6–7, 89, 241
probability of winning related to, 16
and risk tolerance, 184–85
scalp trading, 5, 6–7, 18
swing trading, 5–7, 187, 283–84
system trading, 7, 8, 167, 172–73
trader-assist system trading, 89
trend following, 196–200, 211, 217, 294–95
See also day trading
trading volume, 49, 59, 103, 153–54
trading volume charts, 103–6, 139–40
trailing stops, 160–61, 207–8, 283–84
transactions, plotting with tick charts, 103–6
transparency in markets, 67
trend following strategies, 196–200, 211, 217, 294–95
trendline patterns, 112, 113–15
trendlines, 108–13, 260, 261, 262, 263

Index 355
trends
assessing strength of, 128, 139–40, 261
daily change in indices and, 57
in forex markets, 197
identifying changes in, 128
indicator value and, 138
and moving averages, 123
triangle patterns, 113, 114–15
TRIN (NYSE Arms Index; NYSE Trader’s Index), 135, 138
troubleshooting list, 238–40, 247–48
TTO (threshold triggered order), 168
the Turtles, 180–81, 183–84, 185–87
typical price (TP), 131
U
undercapitalization, 11, 45
unintentional trading errors, 253–54
uninterruptible power supply (UPS), 80
uptick rule, 60
uptrends
and CCI values, 131, 132
and stochastic oscillator, 128–29
trendlines showing, 109–11
value of TRIN and, 138
user-defined ruin%, 220, 221
V
volatility
diversification and, 185–87
of E-mini market, 67

356 Make Money Trading
and exit strategies, 192–93
overview, 8
position size based on, 180–81
and price bands, 124–25, 126
and profit targets, 193
from tick and volume charts, 103–4
volume, 49, 59, 103, 153–54
volume charts, 103–6, 139–40
W
Wilder, J. Welles, 128, 186
wireless equipment or access, 80
world events and market dynamics, 276–77
Y
YM (Mini-sized Dow Futures) ($5), 66–67

Trading Resource Guide
Recommended ReadinG
Jack SchwaGeR’S compleTe Guide To maSTeRinG The maRkeTSby Jack Schwager
Imagine having an in-depth conversation with not one-but dozens of the world’s greatest traders. Jack Schwager has, and his three best-selling “Market Wizards” books reveal intimate secrets of the trading superstars. Now he’s filtered years of in-depth research into an amazingly comprehensive home study workshop. This workshop is now on DVD and repackaged to make it easier for you to maximize the profit potential of this course. With Schwager’s trademark thoroughness, easy-to-follow instruction, and real-life examples, this complete trading resource-hailed by the “Market Wizards” themselves-will send you into the trading world armed with proven techniques, insider knowledge, elevated self-confi-dence, and winning methods.
Item #BCJFx4352093 - $799.00

STRaTeGieS foR pRofiTinG on eveRy TRadeby Oliver Velez
An accessible, reliable course for the trader looking for profits in the competitive, dynamic world of trading.
Each section of the book offers clear examples, concise and useful definitions of important terms, over 90 charts used to illustrate the chal-lenges and opportunities of the market; and how you can take advantage of patterns. Written in the parlance of the day trader’s world, you’ll enjoy the experience of being taught trading skills by the best of the best.
This focused and effective trading resource features seven key lessons to further a trader’s education including market basics, managing trades, psychology in trading and planning, technicals, utilizing charts, income versus wealth building producing trades, and classic patterns. It truly is as Paul Lange says, “Many of these lessons have been taught to students worldwide over a span of 4 years. These lessons contain powerful infor-mation that goes far beyond the basics you may find in many introduc-tory trading books.”
Item #BCJFx5031652 - $49.95
BReakThRouGh STRaTeGieS foR pRedicTinG any maRkeTby Jeff Greenblatt
Breakthrough Strategies for Predicting Any Market is sure to be considered one of the great trading books of the 21st century. In this landmark work, Jeff Greenblatt will teach you how to understand the time dimension of the market and take your technical analysis to the next level.

With extensive case studies and charts, Jeff will reveal his high-probability pattern recognition system; one that will give you a deeper understanding of how the markets really work and will make whatever methodology you use ten times better. Following in the footsteps of the great W.D. Gann, Jeff will help you gain greater precision in any instru-ment you trade, on any time frame.
Item #BCJFx5150460 - $149.95
The compleTe Guide To Technical indicaToRSby Mark Larson
Traders have used the power of technical indicators to put significant gains in their account. Now you can easily carve through the hundreds of indicators and get right to the ones that make money most often and help you achieve success in trading. In this comprehensive guide to cracking the code of technical indicators, best-selling author and acclaimed presenter, Mark Larson, shows you how to find the indica-tors that best fit your trading style and reveals which indicators work in which markets. With this experience, you will have the power to increase your winning percentage, no matter what the market does.
Item #BCJFx5197572 - $795.00


Perfect for BeginnersIf you’re new to trading, there is a long learning curve ahead. A mentor can be a huge help to get you started the right way... increase your skills, your confidence. A mentor will impart years of experience and save you thousands of dollars in trial-and-error lessons.
Perfect for seasoned traders ...Experienced traders have also found huge benefits from professional mentoring. All traders must learn trading strategies, and apply them successfully. Yet most have trouble conquering the same obstacles:
• Do you have trouble pulling the trigger and frequently miss big trades that would have been winners?
• Do you seem to have a ceiling in your trad-ing? Just when you start to build some success, do you seem to just give it all back?
• Do you invest for excitement? Do you find that you’ve taken some questionable high-risk trades and then wonder why you took them?
• Did you have a large trading loss in your past, and then find that the loss still affects what you do in the market today?
• Do you get caught up in the news, hunches and rumors and let them effect your ability to follow your system?
If you answered yes to any of these questions, then you need to work on overcoming these obstacles to success. A good trading mentor is the perfect solution for you to overcome these problems.
YoUr KeY to sUccess &
financiaL freedoM trading stocKs,
coMModities & oPtions
The Ultimate Mentorship for
Ultimate Results• learn signals pros use
to pick their trades
• learn how to protect yourself on the back end
• learn how to master the ups and downs
• learn how to become and stay profitable without fear
call Pacific trading academy at 1-800-339-8588 now to discover a whole new profitable world where you can take positive action in the markets instead of relying on chance.
The UlTimaTe menTorshipprivate, one-on-one instruction with Top pro Traders
Pacific Trading Academy1-800-339-8588


Lee Leibfarth is an independent futures trader who designs, tests and im-plements his own trading systems. He is president and founder of Power-Zone Trading. His articles on trading have been featured in The Technical Analysis of Stocks & Commodities, Futures, Active Trader and Trader’s Journal magazines.
Jean Folger is a stock and futures trader who began her trading business while searching for dynamic portfolio diversification. She is a system re-searcher and developer for PowerZone Trading.
Jean Folger
Lee Leibfarth
About The Authors

This book, along with other books, is
available at discounts that
make it realistic to provide it as a gift to
your customers, clients, and staff. For
more information on these long lasting,
cost effective premiums, please call us at
(800) 272-2855 or you may email us at
