major elements in particulate matter from in-use diesel
TRANSCRIPT
energies
Article
Qualitative and Quantitative Characterisation ofMajor Elements in Particulate Matter from In-useDiesel Engine Passenger Vehicles by LIBS
Richard Viskup * , Christoph Wolf and Werner Baumgartner
Institute of Biomedical Mechatronics, Johannes Kepler University Linz, Altenberger strasse 69, 4040 Linz,Austria; [email protected] (C.W.); [email protected] (W.B.)* Correspondence: [email protected] or [email protected]; Tel.: +43-732-2468-4811
Received: 25 November 2019; Accepted: 25 December 2019; Published: 12 January 2020�����������������
Abstract: In this research we apply a high-resolution optical emission spectroscopy technique forspectrochemical analysis of collected diesel particulate matter. We use the laser-induced breakdownspectroscopy technique (LIBS) for qualitative and quantitative measurements of major chemicalelements present in the particulate matter generated from different diesel engine passenger vehiclesin use. The high-resolution LIBS technique can instantly measure major chemical elements within thediverse particulate matter matrices.
Keywords: particulate matter; diesel particulate matter; soot; diesel emissions; ultrafine particles;nanoparticles; metallic nanoparticles; trace elements; carbon emissions; aerosols; air quality; dieselengine; in-use vehicles; laser induced breakdown spectroscopy; laser induced plasma spectroscopy
1. Introduction
Actual problems with diesel-engine emissions and control failures [1–3] are prominent in publicperception around the world. To breathe clean air is very important for human health—not only for lungsand cardiovascular system, but also for the brain and central nervous system [4,5]. Therefore, it shouldbe among our highest priorities to find out new technique(s) for accurate and sensitive measurement(s)of actual exhaust emissions.
The existing emission standards Euro [6,7], Tier [8], or Low-Emission Vehicle Program (LEV) [9],for diesel-engine vehicles specify the maximum allowable emissions of hydrocarbons, carbon monoxide,nitrogen oxides and Particulate Matter (PM) from diesel exhaust fumes.
Generally speaking, these emission standards do not concern an additional compounds or chemicalelements contained in the exhaust emissions or exhaust vapour [10], PM, [11], black carbon/carbon black(BC/CB) [12], or in the soot [13], formed by the diesel or biodiesel [14], from combustion engines [15].Nevertheless, chemical elements adsorbed by carbonous particles present significant volumetric aswell as mass fraction of the total Diesel Particulate Matter (DPM) or soot emission contents.
Moreover, inhalation of metallic base particles or ions has numerous negative health effects,especially upon long-term exposure. Automotive emissions are considered the dominant source forairborne metal pollution in urban areas [16]. Therefore, accurate in-situ technique to assess the on-lineatomic elemental composition of particulate matter from automotive emissions would be desirable.
Among the early pioneers in measurement of particulate trace emissions from vehicles was thegroup of Schauer et al. [11] as they used a comprehensive dilution source sampler, organic chemicalanalysis and X-ray fluorescence analysis for mass and chemical composition measurements of fineparticles. Other groups [10,12,15,17], used Inductively-Coupled Plasma Mass Spectrometry (ICP-MS)and X-Ray Fluorescence (XRF) for characterisation of metals and other particle-phase species from
Energies 2020, 13, 368; doi:10.3390/en13020368 www.mdpi.com/journal/energies
Energies 2020, 13, 368 2 of 18
on-road motor vehicles. They found the following trace elements in the particles: Al, Ba, Be, Ca, Cd,Co, Cr, Cu, Fe, K, Mg, Mn, Mo, Na, Ni, Pb, Pt, S, Sr, Ti, V, Zn.
Other groups [18–22], used Inductively Coupled Plasma-Optical Emission Spectrometry (ICP-OES)to characterize the different biodiesel samples with special concern to quantify the Al, Ca, Cu, Fe,K, Mg, Mn, Na, Ni, P, Sr, B and Cl content, to evaluate the fuel quality and to control the emissionof pollutants to the atmosphere. In this case the samples were prepared using a high pressure asherdigestion procedure for metal determination in biodiesel samples. Different groups used ICP-MS tocharacterise additional bound elements, like Cd, As, Ba and Ti in the particulate matter collected fromultra low sulphur diesel and biodiesel powered engine exhaust emissions [23].
In this research we apply a high-resolution laser-induced breakdown spectroscopy technique(LIBS) [24–26], for qualitative and quantitative spectrometric measurements of diesel particulate mattercollected from passenger diesel combustion engine vehicles in use.
Laser induced breakdown spectroscopy is an emerging measurement technique [27] for rapidqualitative [28] and sensitive quantitative compositional analysis [29,30] of various forms of materialslike solids [31], liquids [32], gases [33], powders [34] or nanoparticles [35].
The first pioneering group, that investigated the metallic elements in diesel soot collected onfilter by means of laser induced breakdown spectroscopy, was Lombaert et al. [36]. They found thatFe, Cu, Ca, Zn, and Mg appear as the main metallic species deposited within diesel particles on thereference filter.
The aim of this study is to use the LIBS technique for qualitative and quantitative spectrochemicalanalyses of major chemical elements contained in the diesel-engine exhaust emissions that arecontributing to the particulate matter composition from in-use vehicles. The presence of these elementsin the exhausts of diesel-engine vehicles originates from different sources. Mainly from the fueland additives, engine combustion process, incomplete catalytic reaction, inefficient diesel particulatefiltering technique, engine failure or even from contaminated intake air.
Every information revealed from these studies can be very beneficial for scientists or engineers,like combustion physicists, engine developers, environmentalists, biomedical and medical scientistsor emission specialists, to better understand the DPM composition, for modelling of PM emissionsgenerated from diesel-engine vehicles, for the development of after treatment technologies and to setthe future emission standards.
2. Methodology
2.1. Laser-Induced Breakdown Spectroscopy (LIBS) Technique
If a high-power and short-pulse laser is focused into a target material, absorption of the laserradiation followed by temperature rise and subsequent ablation of the material surface occurs.This process is accompanied with the formation of laser plasma [25]. Laser-induced plasma is a veryintense and bright source of radiation. Its optical spectral information can be used as fingerprint ofemitting atomic and ionic or molecular species, contained in the studied sample. The collected emissiondata can be further used for the basic spectrochemical analysis of the material’s composition [24].In LIBS a high-power laser beam, usually with nanosecond pulse duration, is interacting with the targetmaterial [37]. This short light—matter interaction generates plasma, from which an optical emissionspectrum is collected by the optical spectrometer and then further processed by software. From theseLIBS spectra, the elemental chemical composition of the examined sample is obtained. The qualitativespectral information can be further calibrated, to obtain quantitative results. The LIBS techniqueprovides very sensitive and rapid analytical measurements, without sample pre-treatment, in the rangeof ppm levels [38], almost instantaneously, in contrast to competing analytical techniques, such asLaser Ablation Inductively Coupled Plasma Mass Spectrometry (LA-ICP-MS) [39], Atomic AbsorptionSpectrometry (AAS) [40], X-Ray Fluorescence Spectroscopy (XRFS) [41], or Secondary Ion Mass

Energies 2020, 13, 368 3 of 18
Spectrometry (SIMS) [42]. This advantage pushes the LIBS technique forward in many new researchareas [43], and makes it also attractive for industrial applications [44,45].
2.2. LIBS Technique for Quantitative Material Analysis
Qualitative and quantitative spectrochemical information about the composition of an examinedanalyte is contained in the LIBS spectrum. This originates from excited neutrals, ions and moleculeswithin the laser-induced plasma. Therefore, different approaches are known to gain the quantitativeinformation from LIBS measurements. One of the methods determines the concentration of eachelement independently by evaluating the line emission from known transition probabilities and fromabsolute measurements of the integrated line intensities. Another possible way is to measure theemission line intensities relative to the line intensity of the main abundant element. Quite often theapproaches to obtain quantitative results are the LIBS intensities in relation to known calibrationstandards or certified reference materials. By assuming the optical emission line intensity (or integralof spectral peak curve), the ratio of the concentration of two species A and B can be expressed asa function ratio of the line intensity of species A to the line intensity of species B. Considering thatthe concentration ratio is directly proportional to the ratio of corresponding line intensities, it ispossible to establish a calibration function. This curve is basically a plot of relative concentrations of anelement obtained by LIBS measurements versus the known relative concentrations of this elementin the samples. Calibration curves can be then used for the quantitative determination of unknownconcentrations in the examined material.
3. Experimental Procedures
3.1. LIBS Setup
The experimental setup for laser induced breakdown spectroscopy measurements of particulatematter collected from in-use diesel-engine passenger vehicles consists of a high intensity pulsed lasersystem, with nanosecond laser pulse duration, the experimental chamber, a collection of optics anda high precision optical spectrometer. The plasma is generated by focusing the high-intensity laserpulse into the target. Usually a solid state laser or diode pumped laser is applied at its fundamentalwavelength of 1064 nm or the second harmonic (532 nm) with repetition rates ranging from 1 Hz tofew kHz. A schematic of the experimental LIBS setup is shown in Figure 1.
Energies 2020, 13, x FOR PEER REVIEW 3 of 19
X-Ray Fluorescence Spectroscopy (XRFS) [41], or Secondary Ion Mass Spectrometry (SIMS) [42]. This advantage pushes the LIBS technique forward in many new research areas [43], and makes it also attractive for industrial applications [44,45].
2.2. LIBS Technique for Quantitative Material Analysis
Qualitative and quantitative spectrochemical information about the composition of an examined analyte is contained in the LIBS spectrum. This originates from excited neutrals, ions and molecules within the laser-induced plasma. Therefore, different approaches are known to gain the quantitative information from LIBS measurements. One of the methods determines the concentration of each element independently by evaluating the line emission from known transition probabilities and from absolute measurements of the integrated line intensities. Another possible way is to measure the emission line intensities relative to the line intensity of the main abundant element. Quite often the approaches to obtain quantitative results are the LIBS intensities in relation to known calibration standards or certified reference materials. By assuming the optical emission line intensity (or integral of spectral peak curve), the ratio of the concentration of two species A and B can be expressed as a function ratio of the line intensity of species A to the line intensity of species B. Considering that the concentration ratio is directly proportional to the ratio of corresponding line intensities, it is possible to establish a calibration function. This curve is basically a plot of relative concentrations of an element obtained by LIBS measurements versus the known relative concentrations of this element in the samples. Calibration curves can be then used for the quantitative determination of unknown concentrations in the examined material.
3. Experimental Procedures
3.1. LIBS Setup
The experimental setup for laser induced breakdown spectroscopy measurements of particulate matter collected from in-use diesel-engine passenger vehicles consists of a high intensity pulsed laser system, with nanosecond laser pulse duration, the experimental chamber, a collection of optics and a high precision optical spectrometer. The plasma is generated by focusing the high-intensity laser pulse into the target. Usually a solid state laser or diode pumped laser is applied at its fundamental wavelength of 1064 nm or the second harmonic (532 nm) with repetition rates ranging from 1 Hz to few kHz. A schematic of the experimental LIBS setup is shown in Figure 1.
Figure 1. Layout of the laser-induced breakdown spectroscopy (LIBS) experimental setup. LS—Laser Source, M—Mirror, P—Plasma, S—Sample, FL—Focusing Lens, L1 and L2—Optical Telescope, OS—Optical Spectrometer, D— Intensified Charge Coupled Device (ICCD) Detector.
To generate the laser induced breakdown from diesel particulate matter, a Nd:YAG solid state laser from Quantel was used. It was operated at the fundamental laser wavelength of 1064 nm with pulse duration 8.5 ns and laser energy 300 mJ per single pulse. Due to the large number and different origin of DPM matrices, we applied higher laser energy, to enhance the optical emission from the plasma and gain signals from the infrared, visible as well as ultraviolet spectral regions. The laser
Figure 1. Layout of the laser-induced breakdown spectroscopy (LIBS) experimental setup. LS—LaserSource, M—Mirror, P—Plasma, S—Sample, FL—Focusing Lens, L1 and L2—Optical Telescope,OS—Optical Spectrometer, D— Intensified Charge Coupled Device (ICCD) Detector.
To generate the laser induced breakdown from diesel particulate matter, a Nd:YAG solid state laserfrom Quantel was used. It was operated at the fundamental laser wavelength of 1064 nm with pulseduration 8.5 ns and laser energy 300 mJ per single pulse. Due to the large number and different originof DPM matrices, we applied higher laser energy, to enhance the optical emission from the plasma andgain signals from the infrared, visible as well as ultraviolet spectral regions. The laser radiation hasbeen focused with a 10 cm focusing lens into the plane of the DPM solid target surface to create a plasma.

Energies 2020, 13, 368 4 of 18
Optical emissions from the plasma have been collected perpendicularly, via an optical telescope, into thehigh-resolution Echelle spectrograph (Model Aryelle Butterfly from LTB Lasertechnik Berlin, equippedwith an Intensified Charge Coupled Device-ICCD) detector. The spectrometer consists of two separatespectrographs, one for the UV range from 190 nm to 440 nm and the second unit for the visible (VIS)optical spectrum in a range from 440 nm to 800 nm. The spectral resolution capability is from 3 p.m. to 7p.m. for the ultraviolet (UV) range and from 4 p.m. to 8 p.m. for the VIS range, thus providing spectralinformation of a broad range with very high-resolution and variability. Optical emissions from theplasma have been collected from ultraviolet to infrared spectral window, thus the total spectrum from190 nm to 800 nm were recorded. The delay time for starting recording of the optical spectral signalwas set to 1 µs after the trigger signal, and gate time for spectral acquisition has been set to 2 µs. Inearlier delay times than 1µs, the black body radiation dominates in the laser-induced plasma, while forlater time intervals like 3 µs the atomic and ionic emissions start decaying [46]. The LIBS emission wasmeasured in an open air atmosphere under atmospheric pressure and at room temperature.
3.2. Particulate Matter Collection and Sample Preparation
Sixty-seven different DPM samples were obtained from miscellaneous in-use diesel-enginepassenger vehicles of diverse types and models from major brand car producers in Europe. Vehiclesselected for the sample collection were from production models that are frequently encountered onpublic roads. Neither preproduction vehicles nor experimental engines were used. It is importantto mention that these studies have not been concerned with the technical conditions and propertiesof individual vehicles. As well as the air pollution has not been taking into the account as we haveneither measured the chemical composition of engine intake air nor the particles attached at the airfilters of the vehicles. Both conditions would be hard to assess, because vehicles were driving indifferent environment during their life time. Diesel particulate matter has been extracted from the endsections of the tailpipes of the passenger vehicles that means from position after the Diesel ParticulateFilter (DPF), Diesel Oxidation Catalyst (DOC) or catalytic converter if applied. For this purpose wehave carefully collected only upper part of particulate matter residual deposits from the tailpipe wall,which has been stored individually for each vehicle. Each PM sample was produced from one differentvehicle. Even more vehicles and PMs were actually accessed, but due to the sample preparation andmeasurements, not all samples were sustained or were sufficient for LIBS consistent measurements.Vehicles were selected randomly and no manufacturer was preferred. All these samples were analysedusing the LIBS method. The results presented in this paper originate from eight largely diverse DPMmatrices with respect to the LIBS spectrum. The reason is to qualitatively and quantitatively describethe elemental composition of these matrices by laser induced breakdown spectroscopy. A specialemphasis is given to analyse the major spectral lines that are mostly pronounced in the ultraviolet,visible and infrared optical emission spectrum from diesel particulate matter. The collected exhaustparticles from individual in-use diesel-engine vehicles have been mechanically pressed into solid pelletswith a flat disc shape. These DPM samples were then analysed by LIBS without further preparation.The optical spectra obtained were averaged over 12 laser shots. Also various positions on each pelletwere sampled, to assure the repeatability and reproducibility of the measurements.
4. Results and Discussion
4.1. Qualitative Measurements of Particulate Matter
To this end, the state-of-the-art laboratory laser-induced breakdown spectroscopy setup was usedto obtain precise and high resolution optical emission spectra recorded from laser induced plasmainteraction with different DPM matrices. The qualitative LIBS results of these measurements are shownin Figure 2. Here, the signal is dominating by strong lines—optical emissions from: (a) carbon, (b) iron,(c) magnesium, (d) aluminium, (e) chromium, (f) zinc, (g) sodium and (h) calcium spectral lines. A LIBS

Energies 2020, 13, 368 5 of 18
spectrum exhibits characteristic optical emissions with distinct lines of atomic, ionic and molecularorigin in the signal.
Energies 2020, 13, x FOR PEER REVIEW 5 of 19
spectral lines. A LIBS spectrum exhibits characteristic optical emissions with distinct lines of atomic, ionic and molecular origin in the signal.
Figure 2. Optical emission spectra of eight different diesel particulate matter (DPM) matrices measured by laser-induced breakdown spectroscopy.
In Figure 2, the spectral line emission from DPM samples differs considerably. Thus the chemical compositions of the particulate matter matrix also change. Consequently this is because of different origin of DPM samples are the unique formation of the diesel exhaust emissions. In fact, the source of composition differences is a combination of: the composition of diesel fuel and quality, additives in the fuel, combustion process, type of the engine, performance of the engine and composition of the intake air. Other parts that influence the final composition of DPM are applied aftertreatment devices, like DPF or catalytic converter. All these input parameters influence the final chemical composition of exhaust diesel particulate matter matrix from diesel vehicles.
4.2. Major Chemical Elements of Particulate Matter
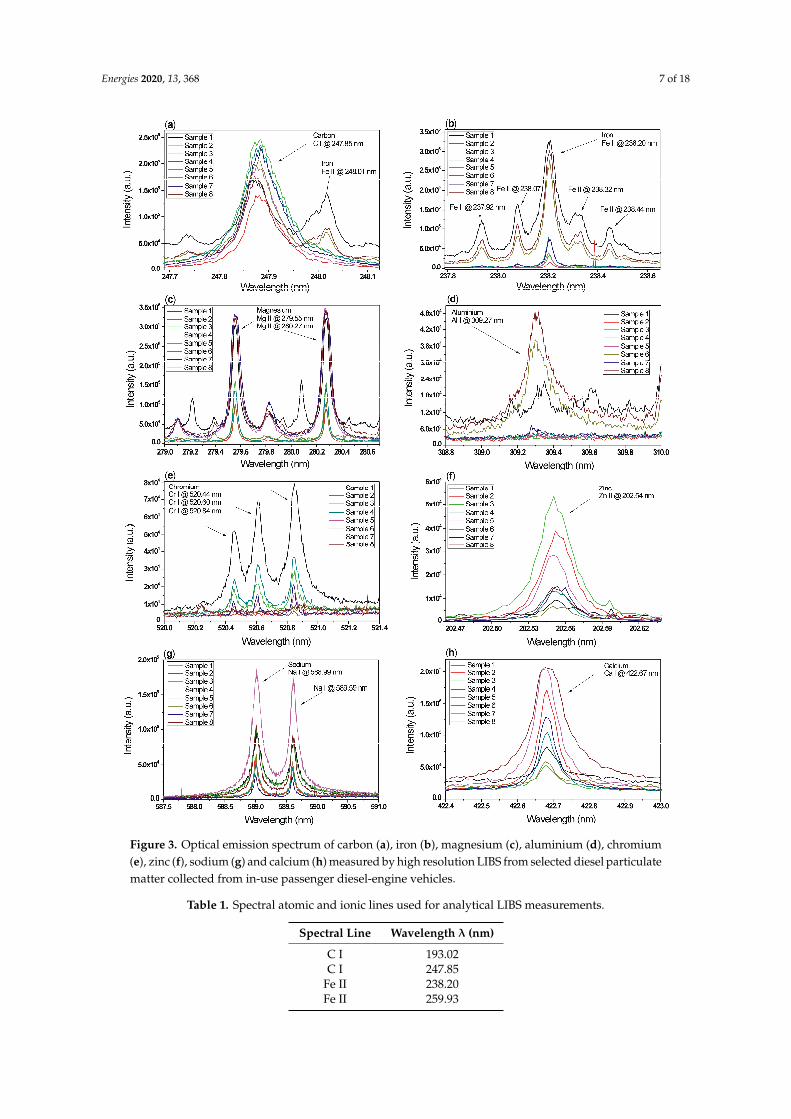
Carbon Spectral Line In Figure 3a a comparison of eight atomic carbon spectra (C I at 247.85 nm) from different DPM
samples with high content of C, Fe, Mg, Al, Cr, Zn, Na, Ca is shown. The peak intensity and width varies for each spectrum. Additionally samples with a high content of iron (#6), aluminium (#8) or chromium (#1) posses an additional iron peak (Fe II at 248.015 nm), that partially interferes with the carbon spectrum.
Iron Spectral Line In Figure 3b comparisons of the ionic emission from iron spectral line Fe II at 238.20 nm of eight
DPM samples are shown. From the intensity of spectra lines, samples with high content of iron are
Figure 2. Optical emission spectra of eight different diesel particulate matter (DPM) matrices measuredby laser-induced breakdown spectroscopy.
In Figure 2, the spectral line emission from DPM samples differs considerably. Thus the chemicalcompositions of the particulate matter matrix also change. Consequently this is because of differentorigin of DPM samples are the unique formation of the diesel exhaust emissions. In fact, the source ofcomposition differences is a combination of: the composition of diesel fuel and quality, additives inthe fuel, combustion process, type of the engine, performance of the engine and composition of theintake air. Other parts that influence the final composition of DPM are applied aftertreatment devices,like DPF or catalytic converter. All these input parameters influence the final chemical composition ofexhaust diesel particulate matter matrix from diesel vehicles.
4.2. Major Chemical Elements of Particulate Matter
Carbon Spectral Line
In Figure 3a a comparison of eight atomic carbon spectra (C I at 247.85 nm) from different DPMsamples with high content of C, Fe, Mg, Al, Cr, Zn, Na, Ca is shown. The peak intensity and widthvaries for each spectrum. Additionally samples with a high content of iron (#6), aluminium (#8) orchromium (#1) posses an additional iron peak (Fe II at 248.015 nm), that partially interferes with thecarbon spectrum.

Energies 2020, 13, 368 6 of 18
Iron Spectral Line
In Figure 3b comparisons of the ionic emission from iron spectral line Fe II at 238.20 nm of eightDPM samples are shown. From the intensity of spectra lines, samples with high content of iron aresamples #1, #6, #8. Iron is one of the components often present in the DPM that mainly influences theoptical emission. It is responsible for matrix transition and affects the LIBS signal quite considerably.
Magnesium Spectral Line
In Figure 3c comparisons of the ionic doublet from magnesium spectral lines Mg II at 279.55 nmand Mg II at 280.27 nm are shown. Optical emission from magnesium is present in most of theDPM matrices.
Aluminium Spectral Line
In Figure 3d the ionic aluminium signal from Al II at 198.98 nm is shown. Strong aluminium linesare present in three selected DPM matrices, in samples (1, 6, 8).
Chromium Spectral Line
The comparison of the LIBS optical emissions from the atomic chromium triplet lines Cr I at520.44 nm, 520.60 nm and 520.84 nm is shown in Figure 3e. Chromium lines are pronounced insamples (1,3–5,7).
Zinc Spectral Line
Signal from zinc line Zn II at 202.54 nm is shown in Figure 3f. Zinc is usually present in all DPMmatrices. With high intensity is present in samples (2, 3, 5). Zinc is the major trace element andinfluences DMP matrices significantly.
Sodium Spectral Line
Optical emissions from the sodium doublet atomic spectral lines Na I at 588.99 nm and Na I at589.59 nm are shown in Figure 3g. Sodium is principally present in all DPM matrices. Sodium lines arerelatively intense and dominate in the visible part of the LIBS spectra. This significantly influences theoverall composition of DPM.
Calcium Spectral Line
Calcium spectrum Ca I at 422.67 nm is shown in Figure 3h. Calcium lines pervasive in LIBSspectra from DPM and due to the strong LIBS emission are considered as a major element.
In Table 1 are given the spectral atomic and ionic emission lines used for analytical LIBSmeasurements. Data are obtained from the National Institute of Standards and Technology (NIST)atomic spectra database [47], and are for major chemical elements in DPM.
Energies 2020, 13, 368 7 of 18Energies 2020, 13, x FOR PEER REVIEW 7 of 19
Figure 3. Optical emission spectrum of carbon (a), iron (b), magnesium (c), aluminium (d), chromium (e), zinc (f), sodium (g) and calcium (h) measured by high resolution LIBS from selected diesel particulate matter collected from in-use passenger diesel-engine vehicles
Table 1. Spectral atomic and ionic lines used for analytical LIBS measurements.
Spectral Line Wavelength λ (nm) C I 193.02 C I 247.85
Fe II 238.20
Figure 3. Optical emission spectrum of carbon (a), iron (b), magnesium (c), aluminium (d), chromium(e), zinc (f), sodium (g) and calcium (h) measured by high resolution LIBS from selected diesel particulatematter collected from in-use passenger diesel-engine vehicles.
Table 1. Spectral atomic and ionic lines used for analytical LIBS measurements.
Spectral Line Wavelength λ (nm)
C I 193.02C I 247.85
Fe II 238.20Fe II 259.93

Energies 2020, 13, 368 8 of 18
Table 1. Cont.
Spectral Line Wavelength λ (nm)
Fe II 248.01Al I 309.27Al II 198.98Cr I 520.44Cr I 520.60Cr I 520.84Zn II 202.54Na I 588.99Na I 589.59Ca I 422.67H I 656.27
Mg II 279.55Mg II 280.27
4.3. Quantification of the LIBS Signal
Preparation of the Calibration Samples
For the quantification of the LIBS signal, calibration standards with different concentrationsof selected chemical elements in the particulate matter were prepared. In particular, carbon, iron,magnesium, aluminium, chromium, zinc, sodium and calcium that form the main matrix elements ofDPM. Based on previous qualitative analytical research of individual DPM matrices by LIBS, similarparticulate matter matrices were produced as internal standards. Calibration standards have been madeof certified pure materials, either from Carl Roth GmbH or from Sigma-Aldrich Inc. (Germany). For allcalibration samples, mixtures of extra pure nano-powdered materials were used. Nano-powderedmaterials were further milled together using a laboratory grinder to assure a well-mixed and finepowder. The powder was mechanically pressed into small pellets with 6 mm diameter, similar to theDPM samples.
Calculation of the Limit of Detection
The limit of detection (LOD) is defined as the minimum concentration of an element detected witha specified degree of uncertainty. In our case of a linear calibration function with 95% of confidencelevel, the LOD can be calculated as [25]:
LOD =3σS
(1)
where the sensitivity S is the slope of the calibration curve for the specific atomic emission at the lowestmeasured concentration. The standard deviation, σ, is the precision of the measurement given by:
σ =
√√ n∑i=1
1n
(X −Xi
)2(2)
where the mean value X is defined as:
X =1n
n∑i=1
Xi (3)
with the obtained quantity Xi, measured n-times.
Measurement of Calibration Samples by LIBS
The calibration samples were measured under the same experimental conditions as the DPM matricesabove. Identical experimental parameters, optical setup, laser energy (300 mJ), optical spectrometerand ICCD detector settings, particularly the delay time 1 µs and gate width 2 µs remained unchanged.
Energies 2020, 13, 368 9 of 18
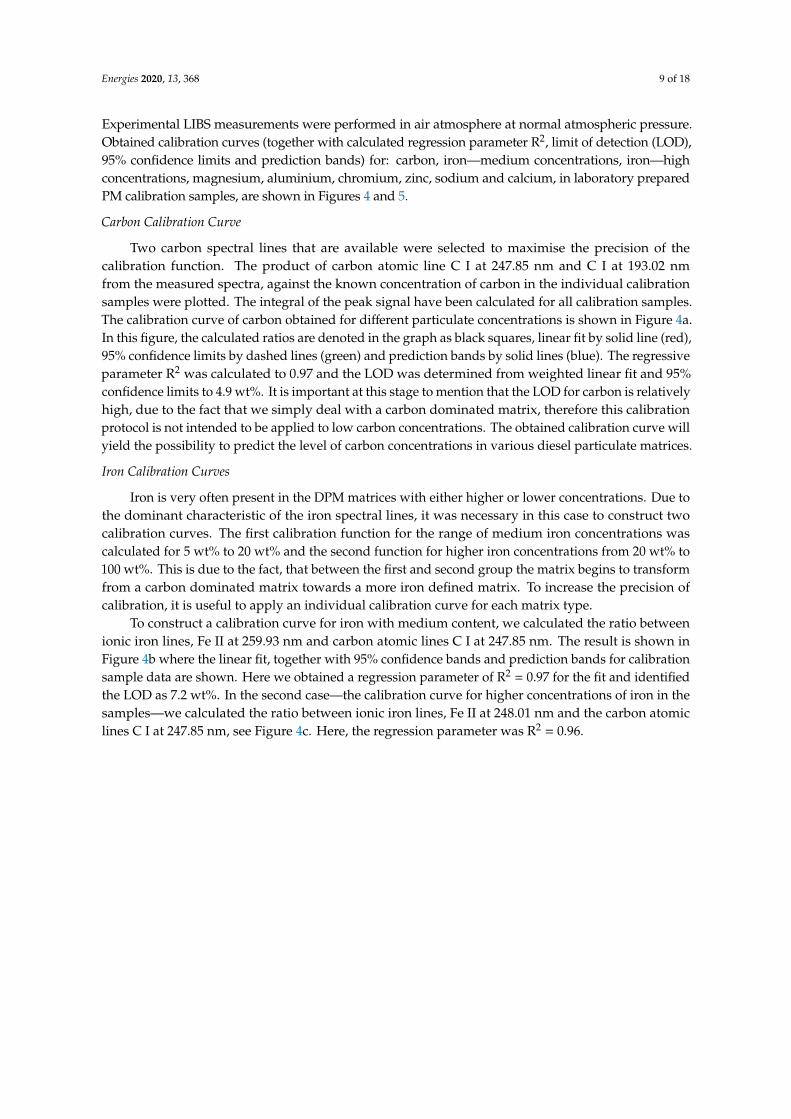
Experimental LIBS measurements were performed in air atmosphere at normal atmospheric pressure.Obtained calibration curves (together with calculated regression parameter R2, limit of detection (LOD),95% confidence limits and prediction bands) for: carbon, iron—medium concentrations, iron—highconcentrations, magnesium, aluminium, chromium, zinc, sodium and calcium, in laboratory preparedPM calibration samples, are shown in Figures 4 and 5.
Carbon Calibration Curve
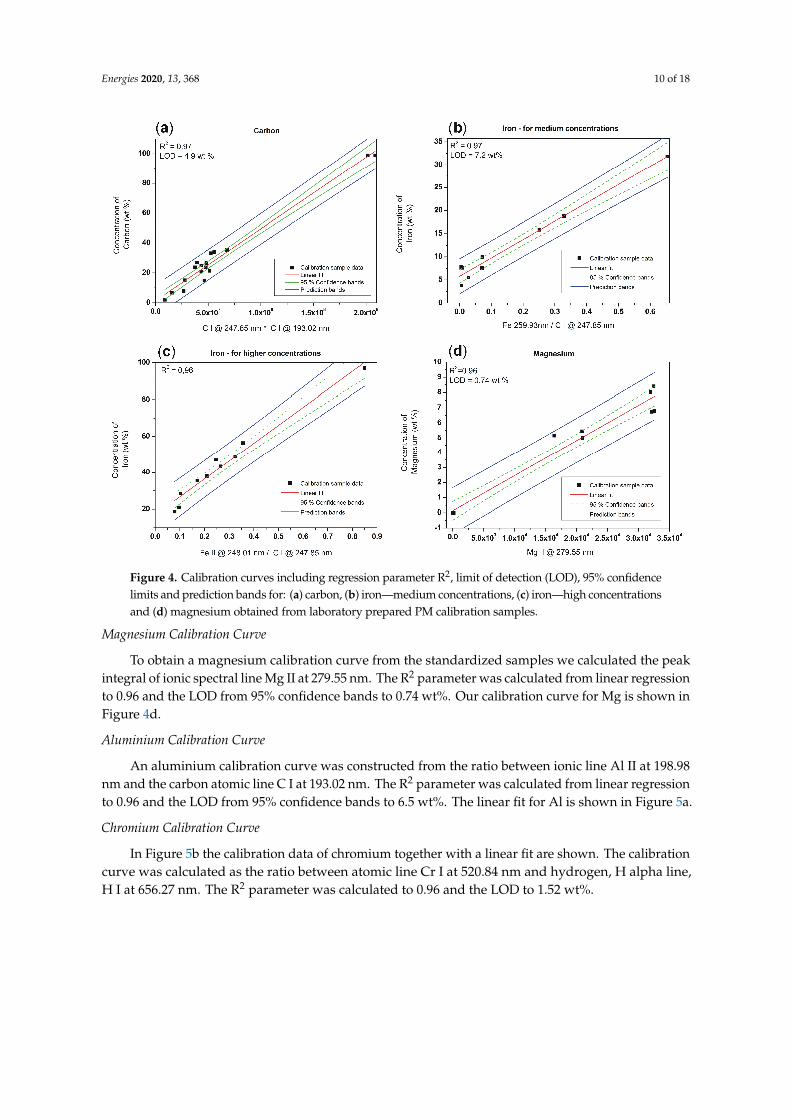
Two carbon spectral lines that are available were selected to maximise the precision of thecalibration function. The product of carbon atomic line C I at 247.85 nm and C I at 193.02 nmfrom the measured spectra, against the known concentration of carbon in the individual calibrationsamples were plotted. The integral of the peak signal have been calculated for all calibration samples.The calibration curve of carbon obtained for different particulate concentrations is shown in Figure 4a.In this figure, the calculated ratios are denoted in the graph as black squares, linear fit by solid line (red),95% confidence limits by dashed lines (green) and prediction bands by solid lines (blue). The regressiveparameter R2 was calculated to 0.97 and the LOD was determined from weighted linear fit and 95%confidence limits to 4.9 wt%. It is important at this stage to mention that the LOD for carbon is relativelyhigh, due to the fact that we simply deal with a carbon dominated matrix, therefore this calibrationprotocol is not intended to be applied to low carbon concentrations. The obtained calibration curve willyield the possibility to predict the level of carbon concentrations in various diesel particulate matrices.
Iron Calibration Curves
Iron is very often present in the DPM matrices with either higher or lower concentrations. Due tothe dominant characteristic of the iron spectral lines, it was necessary in this case to construct twocalibration curves. The first calibration function for the range of medium iron concentrations wascalculated for 5 wt% to 20 wt% and the second function for higher iron concentrations from 20 wt% to100 wt%. This is due to the fact, that between the first and second group the matrix begins to transformfrom a carbon dominated matrix towards a more iron defined matrix. To increase the precision ofcalibration, it is useful to apply an individual calibration curve for each matrix type.
To construct a calibration curve for iron with medium content, we calculated the ratio betweenionic iron lines, Fe II at 259.93 nm and carbon atomic lines C I at 247.85 nm. The result is shown inFigure 4b where the linear fit, together with 95% confidence bands and prediction bands for calibrationsample data are shown. Here we obtained a regression parameter of R2 = 0.97 for the fit and identifiedthe LOD as 7.2 wt%. In the second case—the calibration curve for higher concentrations of iron in thesamples—we calculated the ratio between ionic iron lines, Fe II at 248.01 nm and the carbon atomiclines C I at 247.85 nm, see Figure 4c. Here, the regression parameter was R2 = 0.96.
Energies 2020, 13, 368 10 of 18Energies 2020, 13, x FOR PEER REVIEW 10 of 19
Figure 4. Calibration curves including regression parameter R2, limit of detection (LOD), 95% confidence limits and prediction bands for: (a) carbon, (b) iron—medium concentrations, (c) iron—high concentrations and (d) magnesium obtained from laboratory prepared PM calibration samples.
Magnesium Calibration Curve
To obtain a magnesium calibration curve from the standardized samples we calculated the peak integral of ionic spectral line Mg II at 279.55 nm. The R2 parameter was calculated from linear regression to 0.96 and the LOD from 95% confidence bands to 0.74 wt%. Our calibration curve for Mg is shown in Figure 4d.
Aluminium Calibration Curve
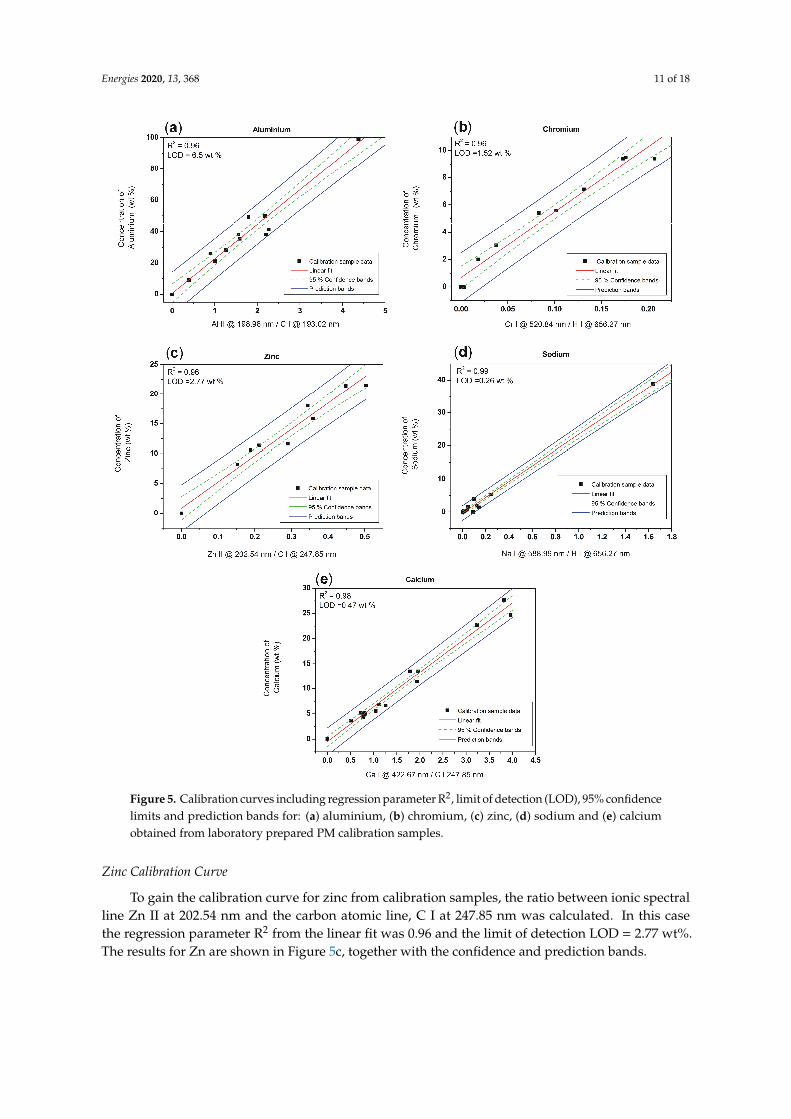
An aluminium calibration curve was constructed from the ratio between ionic line Al II at 198.98 nm and the carbon atomic line C I at 193.02 nm. The R2 parameter was calculated from linear regression to 0.96 and the LOD from 95% confidence bands to 6.5 wt%. The linear fit for Al is shown in Figure 5a.
Chromium Calibration Curve
In Figure 5b the calibration data of chromium together with a linear fit are shown. The calibration curve was calculated as the ratio between atomic line Cr I at 520.84 nm and hydrogen, H alpha line, H I at 656.27 nm. The R2 parameter was calculated to 0.96 and the LOD to 1.52 wt%.
Figure 4. Calibration curves including regression parameter R2, limit of detection (LOD), 95% confidencelimits and prediction bands for: (a) carbon, (b) iron—medium concentrations, (c) iron—high concentrationsand (d) magnesium obtained from laboratory prepared PM calibration samples.
Magnesium Calibration Curve
To obtain a magnesium calibration curve from the standardized samples we calculated the peakintegral of ionic spectral line Mg II at 279.55 nm. The R2 parameter was calculated from linear regressionto 0.96 and the LOD from 95% confidence bands to 0.74 wt%. Our calibration curve for Mg is shown inFigure 4d.
Aluminium Calibration Curve
An aluminium calibration curve was constructed from the ratio between ionic line Al II at 198.98nm and the carbon atomic line C I at 193.02 nm. The R2 parameter was calculated from linear regressionto 0.96 and the LOD from 95% confidence bands to 6.5 wt%. The linear fit for Al is shown in Figure 5a.
Chromium Calibration Curve
In Figure 5b the calibration data of chromium together with a linear fit are shown. The calibrationcurve was calculated as the ratio between atomic line Cr I at 520.84 nm and hydrogen, H alpha line,H I at 656.27 nm. The R2 parameter was calculated to 0.96 and the LOD to 1.52 wt%.
Energies 2020, 13, 368 11 of 18Energies 2020, 13, x FOR PEER REVIEW 11 of 19
Figure 5. Calibration curves including regression parameter R2, limit of detection (LOD), 95% confidence limits and prediction bands for: (a) aluminium, (b) chromium, (c) zinc, (d) sodium and (e) calcium obtained from laboratory prepared PM calibration samples.
Zinc Calibration Curve
To gain the calibration curve for zinc from calibration samples, the ratio between ionic spectral line Zn II at 202.54 nm and the carbon atomic line, C I at 247.85 nm was calculated. In this case the regression parameter R2 from the linear fit was 0.96 and the limit of detection LOD = 2.77 wt%. The results for Zn are shown in Figure 5c, together with the confidence and prediction bands.
Sodium Calibration Curve
The element sodium was calibrated through the ratio between sodium atomic spectral line Na I at 588.99 nm and the hydrogen alpha line, H I at 656.27 nm. The integral of the spectral lines were calculated and data are shown in Figure 5d. Thus the calibration curve was obtained from a linear fit
Figure 5. Calibration curves including regression parameter R2, limit of detection (LOD), 95% confidencelimits and prediction bands for: (a) aluminium, (b) chromium, (c) zinc, (d) sodium and (e) calciumobtained from laboratory prepared PM calibration samples.
Zinc Calibration Curve
To gain the calibration curve for zinc from calibration samples, the ratio between ionic spectralline Zn II at 202.54 nm and the carbon atomic line, C I at 247.85 nm was calculated. In this casethe regression parameter R2 from the linear fit was 0.96 and the limit of detection LOD = 2.77 wt%.The results for Zn are shown in Figure 5c, together with the confidence and prediction bands.

Energies 2020, 13, 368 12 of 18
Sodium Calibration Curve
The element sodium was calibrated through the ratio between sodium atomic spectral line Na Iat 588.99 nm and the hydrogen alpha line, H I at 656.27 nm. The integral of the spectral lines werecalculated and data are shown in Figure 5d. Thus the calibration curve was obtained from a linear fitwith the regression parameter R2 = 0.99. The limit of detection for sodium was determined from theconfidence bands to 0.26 wt%.
Calcium Calibration Curve
Calcium is also a major element in diesel particulate matter. To obtain the concentration level ofthis element, the calibration function was constructed from the ratio of calcium atomic spectral line CaI at 422.67 nm and the carbon atomic line C I at 247.85 nm. The calculated data are shown in Figure 5e,together with the linear fit, confidence and prediction bands. From linear regression, the R2 parameterwas calculated to be 0.98 and the LOD = 0.47 wt%.
Selected spectral lines used for calculation of LIBS signal, and obtained regression parameters R2
together with LOD from calibration functions of different analytes are summarised in Table 2.
Table 2. Summary of spectral lines used for LIBS signal calculation, calibration of major chemicalelements in DPM, obtained regression parameter R2, and limit of detection (LOD).
Calibration for Analyte RegressionParameter R2 LOD in wt% Integrated Peak Ratio
Calculation
C 0.97 4.9 C I @ 247.85 nm, C I @ 193.02 nmFe–medium 0.97 7.2 Fe II @ 259.93 nm, C I @ 247.85 nm
Fe–high 0.96 - Fe II @ 248.01 nm, C I @ 247.85 nmMg 0.96 0.74 Mg II @ 279.55nmAl 0.96 6.5 Al II @ 198.98 nm, C I @ 193.02 nmCr 0.96 1.52 Cr I @ 520.84 nm, H I @ 656.27 nmZn 0.96 2.77 Zn II @ 202.54 nm, C I @ 247.85 nmNa 0.99 0.26 Na I @ 588.99 nm, H I @ 656.27 nmCa 0.98 0.47 Ca I @ 422.67 nm, C I @ 247.85 nm
4.4. Quantitative Composition of Particulate Matter from Selected In-Use Diesel-Engine Vehicles
The results from quantitative determination of selected major chemical elements of eight DPMmatrices acquired from different in-use diesel-engine passenger vehicles are shown in Figures 6 and 7.The calculated concentration of carbon, iron, magnesium, aluminium, chromium, zinc, sodium andcalcium in DPM were achieved by means of calibration curves obtained from prepared calibrationstandards. Each concentration number represented the average value of calculated concentration.These average values were obtained from three different position measurements by LIBS at the sameDPM sample. The quantitative concentration of each element was determined from spectral line ratiosand by means of calibration curves acquired for each major element. Values obtained were averageconcentrations of weight percent (wt%), because of the multiple LIBS measurements from differentsample positions and consequent averaging.
From Figures 6 and 7 one can observe that carbon concentrations are not consistent for all DPMsamples. The carbon concentration is changing in the individual matrices, from maximum measuredcontent of 64 wt% to minimum content 22 wt% for certain samples. Iron concentration also variessignificantly, from 54 wt% to 8 wt%. Magnesium content between 7 wt% and 1 wt%. Two samplesshown higher value of aluminium, more than 6 wt%. Almost all samples contain chromium withconcentration below 1 wt% to more than 6 wt%. Zinc concentration is from 1 wt% up to 7 wt%.Sodium concentration is more than 11 wt% and calcium 13 wt%.

Energies 2020, 13, 368 13 of 18Energies 2020, 13, x FOR PEER REVIEW 13 of 19
Figure 6. Quantitative determination of selected major chemical elements measured by LIBS, showing average values of wt% in different DPM matrices, (Sample 1, 2, 3 and 4) obtained from in-use passenger diesel combustion engine vehicles.
Figure 6. Quantitative determination of selected major chemical elements measured by LIBS, showingaverage values of wt% in different DPM matrices, (Sample 1, 2, 3 and 4) obtained from in-use passengerdiesel combustion engine vehicles.
Energies 2020, 13, 368 14 of 18Energies 2020, 13, x FOR PEER REVIEW 14 of 19
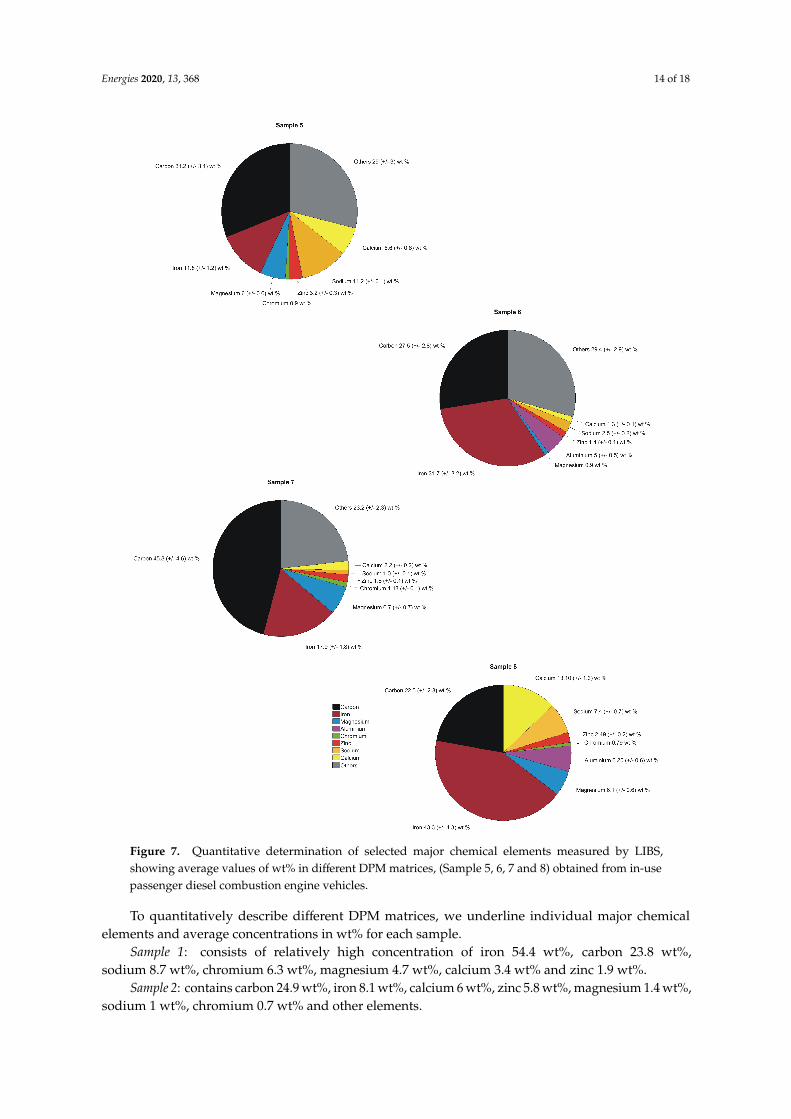
Figure 7. Quantitative determination of selected major chemical elements measured by LIBS, showing average values of wt% in different DPM matrices, (Sample 5, 6, 7 and 8) obtained from in-use passenger diesel combustion engine vehicles.
To quantitatively describe different DPM matrices, we underline individual major chemical elements and average concentrations in wt% for each sample.
Sample 1: consists of relatively high concentration of iron 54.4 wt%, carbon 23.8 wt%, sodium 8.7 wt%, chromium 6.3 wt%, magnesium 4.7 wt%, calcium 3.4 wt% and zinc 1.9 wt%.
Sample 2: contains carbon 24.9 wt%, iron 8.1 wt%, calcium 6 wt%, zinc 5.8 wt%, magnesium 1.4 wt%, sodium 1 wt%, chromium 0.7 wt% and other elements.
Figure 7. Quantitative determination of selected major chemical elements measured by LIBS,showing average values of wt% in different DPM matrices, (Sample 5, 6, 7 and 8) obtained from in-usepassenger diesel combustion engine vehicles.
To quantitatively describe different DPM matrices, we underline individual major chemicalelements and average concentrations in wt% for each sample.
Sample 1: consists of relatively high concentration of iron 54.4 wt%, carbon 23.8 wt%,sodium 8.7 wt%, chromium 6.3 wt%, magnesium 4.7 wt%, calcium 3.4 wt% and zinc 1.9 wt%.
Sample 2: contains carbon 24.9 wt%, iron 8.1 wt%, calcium 6 wt%, zinc 5.8 wt%, magnesium 1.4 wt%,sodium 1 wt%, chromium 0.7 wt% and other elements.

Energies 2020, 13, 368 15 of 18
Sample 3: is composed of carbon 63.7 wt%, iron 13.9 wt%, sodium 9.4 wt%, zinc 6.9 wt%,magnesium 3.1 wt%, chromium 1.5 wt%, calcium 1.5 wt% and other elements.
Sample 4: carbon 61.1 wt%, iron 15.7 wt%, chromium 3.6 wt%, sodium 1.9 wt%, magnesium 1.8 wt%,zinc 1.6 wt%, calcium 1 wt% and other elements.
Sample 5: carbon 31.2 wt%, iron 11.8 wt%, sodium 11.2 wt%, calcium ~6.6 wt%, magnesium 6 wt%,zinc 3.2 wt%, chromium ~0.9 wt% and other elements.
Sample 6: iron 31.7 wt%, carbon 27.5 wt%, aluminium 5 wt%, sodium 2.5 wt%, zinc 1.4 wt%,calcium 1.3 wt%, magnesium 0.9 wt%, and other elements.
Sample 7: carbon 45.8 wt%, iron 17.9 wt%, magnesium 6.7 wt%, calcium 2.2 wt%, zinc 1.8 wt%,chromium 1.1 wt%, sodium 1 wt%, and other elements.
Sample 8: iron 43.3 wt%, carbon ~22.5 wt%, calcium 13.1 wt%, sodium 7.4 wt%, aluminium 6.3 wt%,magnesium 6.1 wt%, zinc ~2.5 wt% and chromium ~0.8 wt%. A summary of major chemical elementsand their average concentration values in wt% for eight selected DPM sample, measured by LIBS usingcalibration curves, is shown in Table 3.
Table 3. Composition of major chemical elements in selected DPM samples, measured by LIBS usingcalibration curves. Showing average values in wt%.
Sample C (wt%) Fe (wt%) Mg (wt%) Al (wt%) Cr (wt%) Zn (wt%) Na (wt%) Ca (wt%)
1 23.8 54.4 4.7 - 6.3 1.9 8.7 3.42 24.9 8.1 1.4 - 0.7 5.8 1 63 63.7 13.9 3.1 - 1.5 6.9 9.4 1.54 61.1 15.7 1.8 - 3.6 1.6 1.9 15 31.2 11.8 6 - 0.9 3.2 11.2 6.66 27.5 31.7 0.9 5 - 1.4 2.5 1.37 45.8 17.9 6.7 - 1.1 1.8 1 2.28 22.5 43.3 6.1 6.3 0.8 2.5 7.4 13.1
Additionally most of the samples (2, 4, 5, 6 and 7) are consisting of other elements—major andminor, depicted in the Figure 6 as “Others”. These are the elements not measured, detected or notanalysed by LIBS so far, in this paper. These can include e.g., sulphur or chlorine and other major,minor as well as trace elements contained in DPM.
The main outline of this study was to qualitatively and quantitatively analyse major chemicalelements contained in the PM exhaust emissions from in-use passenger diesel-engine vehicles.The presence of carbon, iron, magnesium, aluminium, chromium, zinc, sodium and calcium in theparticulate matter of diesel exhausts as principal components could have different reasons. Generally thebirthplace can be from diversified sources. One source is from engine intake (fuel, additives, air),the second source is from engine combustion process (engine materials, piston, cylinder, bearings,etc.), the third is from engine lubricating oil, and the last source from filtering like DPF and catalyticconverter devices.
These components altogether influence the total chemical composition of diesel exhausts andparticulate matter (PM) from in-use diesel-engine vehicles.
5. Conclusions
This research presents a LIBS technique for accurate qualitative and quantitative analyticalmeasurements of DPM. Particulate matter has been collected from in-use diesel-engine vehicles.Diesel passenger vehicles were randomly chosen from a daily-life environment and major brand carproducers in Europe. From spectrochemical LIBS analysis we found that DPM from in-use vehiclesdoes not consist solely or at least mainly of pure carbon particles. Instead it consists of many chemicalelements with diverse concentrations. The high-resolution LIBS technique can instantly measuremajor chemical elements within diverse types of DPM matrix. From qualitative LIBS measurements

Energies 2020, 13, 368 16 of 18
we obtained principal compounds of DPM: carbon, iron, aluminium, chromium, zinc, magnesium,calcium and sodium elements.
Special concern has been given to the quantification of the LIBS signal obtained from thedifferent DPM matrices. We characterised quantitatively the different DPM samples and their mainelemental compositions.
In this study we have assessed the qualitative and quantitative composition of major chemicalelements in various DPM matrices using a high-resolution LIBS technique. Nevertheless, in futureresearch it will be necessary to obtain detailed information about additional major elements containedin DPM, which were not measured, particularly Sulphur and Chlorine content. This is because ofspectral window gap in our current LIBS setup. Further interests are minor and trace elements in DPM.
General comprehension of DPM and its chemical composition can lead to better control of thediesel exhaust emissions as well as diesel-engine and combustion processes. Therefore, in the futurethe development of the in situ LIBS technique for particulate matter will be crucial for further helpin controlling and limiting unwanted pollutant emissions from diesel-engine driven vehicles in realdriving situations. However the composition of final PM emissions from the diesel-engine vehiclesbesides the diesel fuel, fuel additives and lubricating oils can be further affected by aftertreatmentdevices such as DPF, DOC or catalytic converters. Therefore, first it would be important to assessindividual components and traces from these devices to clarify and distinguish the proportion ofchemical elements and composition in the final PM matrix from the diesel-engine exhaust emissions.This knowledge can in the future help to meet further emission standards and regulations.
Author Contributions: All authors contributed to the manuscript. For further details please contact thecorresponding author. All authors have read and agreed to the published version of the manuscript.
Funding: Authors would like to thank for the financial support of the Linz Center of Mechatronics (LCM),project number K 24400/LCM. This research was funded by Austrian Science Fund (Fonds zur Förderung derwissenschaftlichen Forschung) FWF, project number P 27967. Austrian Science Fund: P 27967
Acknowledgments: Authors would like to thank Maria Rusnak for the proofreading and for the valuablecorrections. Open Access Funding by Austrian Science Fund (Fonds zur Förderung der wissenschaftlichenForschung) FWF. Authors would like to acknowledge the financial support of the Linz Center of Mechatronics(LCM), project number K 24400/LCM.
Conflicts of Interest: The authors declare no conflict of interest.
References
1. Ntziachristos, L.; Papadimitriou, G.; Ligterink, N.; Hausberger, S. Implications of Diesel emissions controlfailures to emission factors and road transport NOx evolution. Atmos. Environ. 2016, 141, 542–551. [CrossRef]
2. Zacharof, N.; Tietge, U.; Franco, V.; Mock, P. Type approval and real-world CO2 and NOx emissions from EUlight commercial vehicles. Energy Policy 2016, 97, 540–548. [CrossRef]
3. Commission Regulation (EU) 2016/646. Commission Regulation (EU) 2016/646 of 20 April 2016 AmendingRegulation (EC) (No 692/2008) as Regards Emissions from Light Passenger and Commercial Vehicles (Euro 6).Available online: http://eur-lex.europa.eu/eli/reg/2016/646/oj (accessed on 9 January 2020).
4. Calderón-Garcidueñas, L.; Mora-Tiscareño, A.; Ontiveros, E.; Gómez-Garza, G.; Barragán-Mejía, G.;Broadway, J.; Chapman, S.; Valencia-Salazar, G.; Jewells, V.; Maronpot, R.R.; et al. Air pollution, cognitivedeficits and brain abnormalities: A pilot study with children and dogs. Brain Cogn. 2008, 68, 117–127.[CrossRef] [PubMed]
5. Block, M.L.; Calderon-Garciduenas, L. Air pollution: Mechanisms of neuroinflammation and CNS disease.Trends Neurosci. 2009, 32, 506–516. [CrossRef]
6. Commission Regulation (EC) 692/2008. Commission Regulation (EC) 692/2008 of 18 July 2008 Implementingand Amending Regulation (EC) No 715/2007 of the European Parliament and of the Council on Type-Approvalof Motor Vehicles with Respect to Emissions from Light Passenger and Commercial Vehicles (Euro 5and Euro 6) and on Access to Vehicle Repair and Maintenance Information. Available online: http://eur-lex.europa.eu/eli/reg/2008/692/oj (accessed on 9 January 2020).

Energies 2020, 13, 368 17 of 18
7. Regulation (EC) No 715/2007. Regulation (EC) No 715/2007 of the European Parliament and of the Councilof 20 June 2007 on Type Approval of Motor Vehicles with Respect to Emissions from Light Passenger andCommercial Vehicles (Euro 5 and Euro 6) and on Access to Vehicle Repair and Maintenance Information.Available online: http://eur-lex.europa.eu/eli/reg/2007/715/oj (accessed on 9 January 2020).
8. United States Environmental Protection Agency, Regulations for Emissions from Vehicles and Engines,Tier 3 Motor Vehicle Emission and Fuel Standards. Available online: https://www.epa.gov (accessed on9 January 2020).
9. California Environmental Protection Agency, Low-Emission Vehicle Program-LEV III. Available online:https://www.arb.ca.gov/ (accessed on 9 January 2020).
10. Lough, G.C.; Schauer, J.J.; Park, J.S.; Shafer, M.M.; Deminter, J.T.; Weinstein, J.P. Emissions of metals associatedwith motor vehicle roadways. Environ. Sci. Technol. 2005, 39, 826–836. [CrossRef]
11. Schauer, J.J.; Kleeman, M.J.; Cass, G.R.; Simoneit, B.R.T. Measurement of emissions from air pollution sources.2. C-1 through C-30 organic compounds from medium duty diesel trucks. Environ. Sci. Technol. 1999, 33,1578–1587. [CrossRef]
12. Cheung, K.L.; Ntziachristos, L.; Tzamkiozis, T.; Schauer, J.J.; Samaras, Z.; Moore, K.F.; Sioutas, C. Emissionsof Particulate Trace Elements, Metals and Organic Species from Gasoline, Diesel, and Biodiesel PassengerVehicles and Their Relation to Oxidative Potential. Aerosol Sci. Technol. 2010, 44, 500–513. [CrossRef]
13. Tolomelli, L.T.E.; Barreta, L.G.; Lacava, P.T.; Carinhana, D. Study of the influence of the Biodiesel in SootEmissions of Diesel Laminar Diffusion Flames. J. Braz. Chem. Soc. 2017, 28, 1384–1388. [CrossRef]
14. Das, D.; Kumar, A.; Yadav, A. Evaluation of performance, emission and combustion characteristics of a CIengine fueled with karanja biodiesel and diethyl ether blends. Biofuels 2018, 9, 89–94. [CrossRef]
15. Ntziachristos, L.; Ning, Z.; Geller, M.D.; Sheesley, R.J.; Schauer, J.J.; Sioutas, C. Fine, ultrafine and nanoparticletrace element compositions near a major freeway with a high heavy-duty diesel fraction. Atmos. Environ.2007, 41, 5684–5696. [CrossRef]
16. Schauer, J.J.; Lough, G.C.; Shafer, M.M.; Christensen, W.F.; Arndt, M.F.; DeMinter, J.T.; Park, J.S.Characterization of metals emitted from motor vehicles. Research report. Health Eff. Inst. 2006, 133,1. Available online: http://www.healtheffects.org (accessed on 9 January 2020).
17. Kleeman, M.J.; Schauer, J.J.; Cass, G.R. Size and composition distribution of fine particulate matter emittedfrom motor vehicles. Environ. Sci. Technol. 2000, 34, 1132–1142. [CrossRef]
18. Packer, A.P.; Sarkis, J.E.S.; Giné, M.F.; Santos, É.J. High Pressure Asher (HPA-S) Decomposition of BiodieselSamples for Elemental Analysis by Inductively Coupled Plasma Optical Emission Spectrometry (ICP OES).J. Braz. Chem. Soc. 2014, 25, 743–749. [CrossRef]
19. Fontaras, G.; Karavalakis, G.; Kousoulidou, M.; Tzamkiozis, T.; Ntziachristos, L.; Bakeas, E.; Stournas, S.;Samaras, Z. Effects of biodiesel on passenger car fuel consumption, regulated and non-regulated pollutantemissions over legislated and real-world driving cycles. Fuel 2009, 88, 1608–1617. [CrossRef]
20. Edlund, M.; Visser, H.; Heitland, P. Analysis of biodiesel by argon–oxygen mixed-gas inductively coupledplasma optical emission spectrometry. J. Anal. At. Spectrom. 2002, 7, 232–235. [CrossRef]
21. Gangwar, J.N.; Guptab, T.; Agarwal, A.K. Composition and comparative toxicity of particulate matter emittedfrom a diesel and biodiesel fuelled CRDI engine. Atmos. Environ. 2012, 46, 472–481. [CrossRef]
22. Agarwal, A.K.; Gupta, T.; Kothari, A. Particulate emissions from biodiesel vs diesel fuelled compressionignition engine. Renew. Sustain. Energy Rev. 2011, 15, 3278–3300. [CrossRef]
23. Betha, R.; Balasubramanian, R. Emissions of particulate-bound elements from stationary diesel engine:Characterization and risk assessment. Atmos. Environ. 2011, 45, 5273–5281. [CrossRef]
24. Noll, R. Laser-Induced Breakdown Spectroscopy, Fundamentals and Applications; Springer: Berlin, Germany, 2012.25. Miziolek, A.W.; Palleschi, V.; Schechter, I. Laser-Induced Breakdown Spectroscopy (LIBS): Fundamentals and
Application; Cambridge University Press: New York, NY, USA, 2006.26. Cremers, D.A.; Radziemski, L.J. Handbook of Laser-Induced Breakdown Spectroscopy; John Wiley & Sons Inc.:
New Delhi, India, 2013.27. Hahn, D.W.; Omenetto, N. Laser-Induced Breakdown Spectroscopy (LIBS), Part II: Review of Instrumental
and Methodological Approaches to Material Analysis and Applications to Different Fields. Appl. Spectrosc.2012, 66, 347–419. [CrossRef]

Energies 2020, 13, 368 18 of 18
28. Noll, R.; Fricke-Begemann, C.; Brunk, M.; Connemann, S.; Meinhardt, C.; Scharun, M.; Sturm, V.; Makowe, J.;Gehlen, C. Laser-induced breakdown spectroscopy expands into industrial applications. Spectrochim. ActaPart B At. Spectrosc. 2014, 93, 41–51. [CrossRef]
29. Fortes, F.J.; Moros, J.; Lucena, P.; Cabalin, L.M.; Laserna, J.J. Laser-Induced Breakdown Spectroscopy.Anal. Chem. 2013, 85, 640–669. [CrossRef] [PubMed]
30. Wang, Z.Z.; Deguchi, Y.; Zhang, Z.Z.; Wang, Z.; Zeng, X.Y.; Yan, J.J. Laser-induced breakdown spectroscopyin Asia. Front. Phys. 2016, 11, 114213. [CrossRef]
31. Viskup, R.; Praher, B.; Linsmeyer, T.; Scherndl, H.; Pedarnig, J.D.; Heitz, J. Influence of pulse-to-pulse delayfor 532 nm double-pulse laser-induced breakdown spectroscopy of technical polymers. Spectrochim. ActaPart B At. Spectrosc. 2010, 65, 935–942. [CrossRef]
32. Samek, O.; Beddows, D.C.S.; Kaiser, J.; Kukhlevsky, S.V.; Liska, M.; Telle, H.H.; Young, J. Application oflaser-induced breakdown spectroscopy to in situ analysis of liquid samples. Opt. Eng. 2000, 39, 2248–2262.[CrossRef]
33. Effenberger, A.J.; Scott, J.R. Effect of Atmospheric Conditions on LIBS Spectra. Sensors (Basel) 2010, 10,4907–4925. [CrossRef]
34. Stehrer, T.; Praher, B.; Viskup, R.; Jasik, J.; Wolfmeir, H.; Arenholz, E.; Heitz, J.; Pedarnig, J.D. Laser-inducedbreakdown spectroscopy of iron oxide powder. J. Anal. At. Spectrom. 2009, 24, 973–978. [CrossRef]
35. Viskup, R.; Praher, B.; Stehrer, T.; Jasik, J.; Wolfmeir, H.; Arenholz, E.; Pedarnig, J.D.; Heitz, J. Plasma plumephotography and spectroscopy of Fe-Oxide materials. Appl. Surf. Sci. 2008, 255, 5215–5219. [CrossRef]
36. Lombaert, K.; Morel, S.; Le Moyne, L.; Adam, P.; de Maleissye, J.T.; Amouroux, J. Nondestructive analysisof metallic elements in Diesel soot collected on filter: Benefits of laser induced breakdown spectroscopy.Plasma Chem. Plasma P 2004, 24, 41–56. [CrossRef]
37. Aragón, C.; Aguilera, J. Characterization of laser induced plasmas by optical emission spectroscopy: A reviewof experiments and methods. Spectrochim. Acta Part B At. Spectrosc. 2008, 63, 893–916. [CrossRef]
38. Stepputat, M.; Noll, R. On-line detection of heavy metals and brominated flame retardants in technicalpolymers with laser-induced breakdown spectrometry. Appl. Opt. 2003, 42, 6210–6220. [CrossRef]
39. Günther, D.; Hattendorf, B. Solid sample analysis using laser ablation inductively coupled plasma massspectrometry. Trac Trend Anal. Chem. 2005, 24, 255–265. [CrossRef]
40. De Schrijver, I.; Aramendia, M.; Vincze, L.; Resano, M.; Dumoulin, A.; Vanhaecke, F. Comparison of atomicabsorption, mass and x-ray spectrometry techniques using dissolution-based and solid sampling methods forthe determination of silver in polymeric samples. Spectrochim. Acta Part B At. Spectrosc. 2007, 62, 1185–1194.[CrossRef]
41. Mans, C.; Hanning, S.; Simons, C.; Wegner, A.; Janβen, A.; Kreyenschmidt, M. Development of suitableplastic standards for x-ray fluorescence analysis. Spectrochim. Acta Part B At. Spectrosc. 2007, 62, 116–122.[CrossRef]
42. Benninghoven, A. Surface analysis by secondary ion mass spectrometry (SIMS). Surf. Sci. 1994, 299, 246–260.[CrossRef]
43. Praher, B.; Palleschi, V.; Viskup, R.; Heitz, J.; Pedarnig, J.D. Calibration free laser-induced breakdownspectroscopy of oxide materials. Spectrochim. Acta Part B At. Spectrosc. 2010, 65, 671–679. [CrossRef]
44. Noll, R.; Sturm, V.; Aydin, Ü.; Eilers, D.; Gehlen, C.; Höhne, M.; Lamott, A.; Makowe, J.; Vrenegor, J.Laser-induced breakdown spectroscopy–from research to industry, new frontiers for process control.Spectrochim. Acta Part B At. Spectrosc. 2008, 63, 1159–1166. [CrossRef]
45. Pedarnig, J.D.; Heitz, J.; Ionita, R.; Dinescu, G.; Praher, B.; Viskup, R. Combination of RF–plasma jet andLaser–induced plasma for breakdown spectroscopy analysis of complex materials. Appl. Surf. Sci. 2011, 257,5452–5455. [CrossRef]
46. Viskup, R. Single and Double Laser Pulse Interaction with Solid State–Application to Plasma Spectroscopy.In Nd YAG Laser; Dumitras, D.C., Ed.; InTech: Rijeka, Croatia, 2012; ISBN 978-953-51-0105-5. [CrossRef]
47. Kramida, A.; Ralchenko, Y.; Reader, J.; NIST ASD Team National Institute of Standards and Technology NIST.Atomic Spectra Database. Available online: http://physics.nist.gov/asd (accessed on 9 January 2020).
© 2020 by the authors. Licensee MDPI, Basel, Switzerland. This article is an open accessarticle distributed under the terms and conditions of the Creative Commons Attribution(CC BY) license (http://creativecommons.org/licenses/by/4.0/).