major banks analysis – south africa - pwc · getting the balance right major banks analysis –...
TRANSCRIPT

Getting the balance rightMajor banks analysis – South Africa
PwC analysis of major banks’ results for the reporting period ended 30 June 2016
September 2016
www.pwc.co.za/banking

Contents
Major banks analysis – South Africa September 2016
1. The big picture 1
2. Economic outlook 12
3. Net interest income 15
4. Non-interest revenue 19
5. Efficiency 22
6. Asset quality 24
7. Capital and funding 29
1
29
12
15
22
19
24
8. Two sides of a technological evolution 36
9. The revolution in audit reports 41
10. Hot off the press 44
11. Key banking statistics 49
12. Industry data 52
13. Contacts 56
36
41
49
44
52
56
1 PwCMajor banks analysis – South Africa September 2016
1. The big picture
Combined results and economic overview
*Combined headline
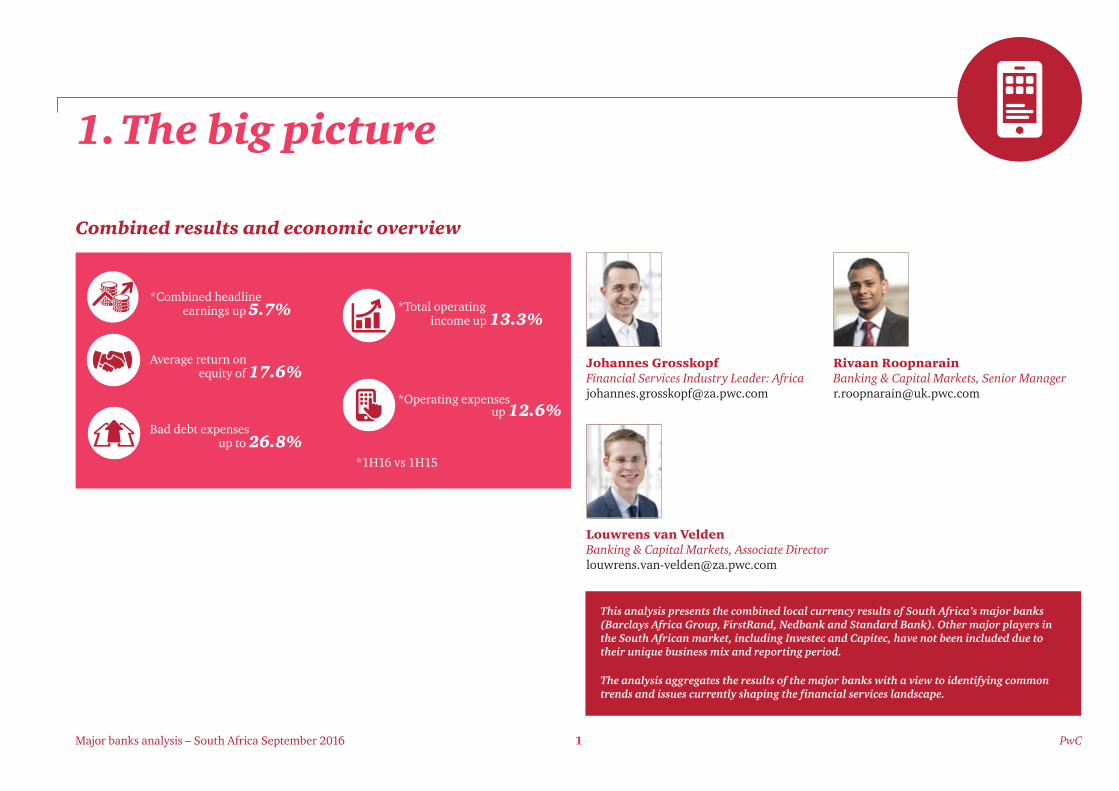
*1H16 vs 1H15
earnings up 5.7% *Total operating income up 13.3%
*Operating expenses up 12.6%
Average return on equity of 17.6%
Bad debt expenses up to 26.8%
Johannes Grosskopf Financial Services Industry Leader: Africa [email protected]
Rivaan Roopnarain Banking & Capital Markets, Senior Manager [email protected]
Louwrens van Velden Banking & Capital Markets, Associate Director [email protected]
This analysis presents the combined local currency results of South Africa’s major banks (Barclays Africa Group, FirstRand, Nedbank and Standard Bank). Other major players in the South African market, including Investec and Capitec, have not been included due to their unique business mix and reporting period.
The analysis aggregates the results of the major banks with a view to identifying common trends and issues currently shaping the financial services landscape.

2 PwCMajor banks analysis – South Africa September 2016
1. The big picture
Much has been said and written about technological innovation within the banking industry in recent years. Interestingly, the word ‘disruption’ in the context of challenger threats facing the industry has been used more freely than actual disruptive experiences to date might suggest.
Yet, irrespective of actual experience, few can realistically dismiss the potentially game-changing challenges facing the industry today. These emanate from a range of sources, most notably rapid advances in financial technology (fintech). Either incumbents – major banking institutions – have proven more resilient than the mainstream narrative might suggest or, more likely, equating ‘disruption’ with explosive growth in fintech is an incomplete analysis.
Back in 2012, at a time when lessons from the financial crisis were being embedded, we published our global thinking on Banking industry reform – A new equilibrium. We noted that banks’ responses to the crisis and the related reform agenda should take full account of the trends and developments facing the industry or they would risk contemplating a future having emerged from the crisis ‘recapitalised, restructured, reformed... but irrelevant.’ We hypothesised that changes – in global economic growth patterns, in stakeholder expectations, including regulatory reform, and in particular technological advances – could present radical transformation to the industry, giving a rough timescale of 2025-2030 for this to play out.
Four years down the line, the pace of change accelerants seems more rapid than anticipated. Social, economic, geopolitical and technological change, together with the evolution of risks they have brought about, have been faster than expected, throwing up a new combination of scenarios for the financial services industry to contend with in the debate about its future shape.
Consequently, our thinking has evolved beyond considering disruption, towards exploring dislocation, and more nuanced strategic responses to competitive threats facing the industry. Our latest global report outlines our views on The future shape of banking in Europe, revisits our earlier assertions and sets out a series of scenarios that convey our contribution to the debate on the future of banks, and banking.
Many of the strategic considerations explored in the report are global in scale, and therefore have potential impacts for all major banks beyond European borders. With fintech developments being central to the future shape of the industry, we highlight key fintech developments in section 8 of this publication, together with the cyber risks presented by the darker face of technological change.
Yet change is relevant not only in the strategic sense. More practically, the reporting obligations of banks and stakeholder expectations on the extent of insight they seek from public disclosures have risen prominently in recent years. Evolving and more prescriptive risk disclosures are being consulted on by the Basel Committee on Banking Supervision (BCBS) in the form of a new Pillar 3 reporting framework, while accounting developments such as IFRS 9 on the near-term horizon will add to the scale, granularity and extent of reporting requirements banks will have to produce.
In parallel to these developments, the external auditor reporting model has undergone its most significant revisions in decades with the intent of enhancing the level of insight shared in the auditor’s report. We unpack these changes in one of our feature articles, ‘The revolution in audit reports’, which will come into effect in South Africa for reporting periods ending from 15 December 2016.
Taking all of this into account, the South African banking sector continues to face a raft of changes influencing the industry – disruptive, strategic, economic, operational and practical. As always, the major banks’ results are indivisible from the broader macroeconomic and domestic operating environment against which they have been achieved. While economic headwinds at the macro and domestic levels are not new, the challenging external environment that characterised the current results period was particularly notable in terms of its scale, severity and unpredictability.

3 PwCMajor banks analysis – South Africa September 2016
1. The big picture
External developments
The historic outcome of the UK’s referendum in June 2016 to leave the European Union (EU) shocked financial markets and amplified a period of sustained macroeconomic volatility. The wave of uncertainty triggered by the referendum result broadly spanned, and continues to span, three key questions – what will the UK’s future relationship with the EU look like, what terms of access will it be able to negotiate to the European ‘single market’, and how will these outcomes impact UK-based FS firms’ ability to ‘passport’ activities from London to the rest of the continent?
These are broad uncertainties that have brought with them a question mark over London’s position as Europe’s leading financial centre, and added to a global chorus of economic uncertainty. How all of this plays out will have implications for the political, economic and immigration outlook for the UK – potentially for the rest of Europe – and in turn will add to the list of macroeconomic headwinds facing its key trading partners globally, including South Africa.
While the referendum made for the most notable headlines during the first six months of 2016, a number of more familiar downside economic risks prevailed over the period leading up to ‘Brexit’. These included continued commodity price fluctuations across most asset classes, ongoing geopolitical tensions, including those driven by extremist events and refugee flows in parts of Europe, and muted, uneven growth levels in many advanced economies.
Questions over the sustainability of sparks of growth in some advanced economies, together with general consensus over the fragility of the global economic environment, are both evident in the continued use of unorthodox monetary policy by a number of central banks. In particular, the European Central Bank, the Bank of Japan and others have shown that zero is no longer the lower bound for market interest rates.
Through efforts to stimulate economic activity in a benign environment, central banks have made it clear that using monetary policy tools in unconventional ways to provoke lending is now a more accepted course of action. These actions continue to fuel speculation of a ‘lower-for-longer’ global economic environment and highlight the scale of the global growth challenge.
Turning to the United States, in spite of slight appreciations in the dollar immediately following the ‘Brexit’ vote, as capital flowed to the perceived safe haven of US assets, recent market movements suggest that underlying concerns over the US economy persist, with the dollar still weaker than it was at the start of 2016.
As we go to press – a week before the Federal Open Market Committee meets – there are divergent views on the timing (although not on the trajectory) of the next US interest rate movement. It goes without saying that, in many ways, global economic sentiment remains linked to perceptions of US economic performance, making the US Federal Funds Rate a much-watched economic metric. Our global view remains that the Federal Reserve will maintain its stance on raising rates at least within the next 12 months, if not sooner, but may pause until after the US presidential election and the global economy has had time to digest the UK’s referendum decision.
Mixed economic signals generated by some advanced economies have done little to make the emerging markets economic narrative any more positive. Acute concerns over the sustainability of China’s growth trajectory, which has been a source of uncertainty for some time, continue to persist. During the current period, emerging market investors have cited material concerns over significant corporate debt levels in China, slowing private sector investment growth and structural concerns over the pace of reform of its state-owned enterprises as reasons for their concern over China’s economic future.1
Collectively, these factors are being seen to weigh heavily on the prospects of the world’s second-largest economy as it balances changing the shape of its economy from a traditionally consumption-led one, to one that balances a more sustainably consumer and investment-led economy. These factors, in turn, weaken the associated economic perceptions of China’s trading partners, and its emerging market peers, including South Africa.
A cursory glance through the International Monetary Fund’s (IMF) World Economic Outlook update released at the end of July 2016 helps put current macroeconomic complexity into context, although not necessarily a positive one.
The IMF notes disappointing growth in most advanced economies, low potential growth over the forecast period, and diverse prospects across emerging economies. In particular, following the outcome of the UK referendum, the IMF downgraded global growth projections by 0.1% for both 2016 and 2017 to 3.1% and 3.4% respectively.
For sub-Saharan Africa, the IMF downgraded its outlook by over 1% for 2016 to 1.6%, largely on account of adverse developments in Nigeria and South Africa. However, a note of positivity could be detected in the IMF’s outlook for emerging markets, which generally maintains a consistent tone with better than initially forecast recoveries in Brazil and Russia.
1 PwC Global Economy Watch – July/August 2016

4 PwCMajor banks analysis – South Africa September 2016
1. The big picture
Closer to home, the growth experience of key economies in Africa has been similarly challenging. In particular, Nigeria ended August 2016 with an announcement of a Q2-2016 GDP decrease of 2.1% (annualised), officially putting the country in recession.
With the Nigerian population growing at 2.7% per annum, this means that annualised GDP per capita shrank by close to 5% in Q2-2016, a difficult and volatile situation in a key African market. Two primary reasons put forward for the recent economic experience in Nigeria have been the substantial decline of foreign investment, and loss of sizeable oil production due to unrest in the Niger Delta.2
At the same time, volatility experienced in FX markets and general weakening of exchange rates was not limited to the rand, but extended to many other emerging market economies. In the case of Nigeria, removal of the Naira’s peg against the US dollar by the Nigerian central bank in June 2016 contributed to further FX volatility.
With the broader macroeconomic environment serving as a backdrop, domestic economic and political developments over the first half of 2016 combined to present considerable downside risk to the South African economy and financial system. Of particular concern has been speculation associated with the sovereign credit rating, and the possibility of a downward migration in the sovereign rating to non-investment grade.
In spite of government efforts to affirm its focus on continued fiscal discipline, ratings agencies have expressed concern about what they perceive to be ‘ongoing tensions between the Minister of Finance and other parts of government’, persistently weak economic fundamentals, dual deficits on the current account and the budget and other structural constraints afflicting the South African economy. In combination, these led to a downgrade by ratings agency S&P in the domestic outlook to ‘negative’ in June 2016.
These factors and others combined to result in South Africa’s economic growth decelerating by 1.2% in Q1-2016. However, the second quarter yielded a positive turn, with the domestic economy recording a 3.3% increase in Q2-2016 economic growth. There have been some suggestions that the SARB will be able to revise its 2016 economic growth estimate upward on the back of a relatively good Q2 growth figure, and potentially revising its previous expectation for no growth in 2016 overall.
2 PwC Nigeria Chief Economist, Andrew Nevin: “Challenging times for Nigeria’s economy”, 1 September 2016
Balancing uncertainty with opportunityQuestions around Brexit
• What will the UK’s future relationship with the EU look like?
• What terms of access will it be able to negotiate to the European ‘single’ market?
• How will these outcomes impact UK-based firms’ ability to ‘passport’ activities from London to the rest of the continent?

5 PwCMajor banks analysis – South Africa September 2016
1. The big picture
Major banks’ performance
Against this challenging operating background both globally and domestically, the major banks have produced a credible set of results for the first half of 2016, reporting combined growth in headline earnings of 5.7% against the comparable period to reach R34.6bn. In many ways, this performance reflects the strength and resilience of their franchises and clear diversification of earnings capacity that exists within their organisations.
Growth in headline earnings remains underpinned by resilient operating drivers, with net interest income growth of 15.9% and non-interest revenue growth of 10.1% against the comparable period. Continuing a theme seen in our previous major banks analysis, total combined credit impairments of the major banks show increases against both 1H15 and 2H15, growing 26.8% and 29.3% respectively. This is attributable to latent credit stresses, both realised and unrealised, within the major banks’ total credit portfolios as a consequence of a challenging economic environment across the retail and wholesale sectors.
Gross loans and advances showed muted growth of 1.3% and 6.5% for 1H16 compared to 2H15 and 1H15 respectively, reflecting difficulties in credit origination in the current climate. In response to concerns about the quality of their portfolios, all of the major banks continue to emphasise their application of conservative judgements in their credit provisioning strategies, evident in the sizeable increase of 15% in their portfolio credit impairment charge against 1H15.
The growth of the impairment charge aligns with the combined non-performing loans (NPLs) of the major banks which have continued an upward trend that we have seen take effect since the previous period, growing by 7.5% and 14.7% against 2H15 and 1H15 respectively. We unpack additional portfolio specific credit trends in the Asset quality section of our analysis.
A key and notable point in this results period has been solid combined net interest income growth of 15.9% against 1H15, which continued to benefit from the positive endowment impact as the higher interest rate environment contributed to faster asset repricing relative to fixed-rate liabilities, equity and non-rate-sensitive funding sources of the major banks. At the same time, good margin growth has been reported in the current period with the combined net interest margin of the major banks increasing to nearly 4.7% compared to approximately 4.4% at both 1H15 and 2H15. It will be interesting to see how the major banks manage margins over the near to medium term, given domestic inflation expectations and any resultant increase in the prime lending rate.
Non-interest revenue (NIR) growth continues to be underpinned by a strong contribution in net fee and commission income in absolute terms. However, a trend seen for a few recent periods has been robust growth in trading revenue, which grew 15.3% when compared to 1H15, but largely flat against 2H15 on the back of a difficult trading environment over the first half of 2016. Total NIR grew at a healthy 10.1% compared to 1H15, although only by 2.9% when compared against 2H15. A range of factors including pricing competition and regulatory changes such as reduced interchange fees are starting to show their weight on overall NIR growth levels.
In response to regulatory requirements associated with the integrity of risk data, efforts to strengthen cybersecurity and enhance electronic platforms, IT spend continues to show an increasing trend. Total operating costs of the major banks grew sharply by 12.6% against the comparable period, although at a more moderate 4.7% against 2H15. The impact of dollar-based costs for those banks with large physical presences in the rest of Africa contributed to ongoing cost pressure during the current review period, amplified by FX market volatility.
The major banks’ combined cost-to-income ratio improved slightly to 54.8% compared to 55.1% at 2H15, but was largely flat against the 54.9% seen at 1H15. Managing this important metric will therefore continue to rank high on the agenda of bank management going forward.

6 PwCMajor banks analysis – South Africa September 2016
1. The big picture
The combined return on equity (ROE) of the major banks, while still at enviable compared to international trends, fell slightly 17.6% at 1H16, compared to 17.9% and 18.2% at 2H15 and 1H15 respectively. In spite of their diversified businesses, the ROE experience of each of the major banks continue to be influenced by different growth experiences over the period.
We have introduced a new metric in our analysis (depicted as Figure 1.3 below), which reflects the major banks’ combined economic spread (i.e. ROE less cost of equity, as reported). Subject to being a crude indicator, the economic spread can be seen as a risk-reflective view of performance, as it effectively takes into account the risk-premium priced into the cost of bank funding, together with other factors. We will continue to track this metric in future analyses and how it compares to international peers. What is currently clear is that the major banks’ combined economic spread of 3.6% at 1H16 (4.3% at 2H15) fairs considerably better than their European counterparts – which our global research indicates was in negative territory at 2H15 for European global systemically important banks (G-SIBs) with net economic spreads stuck at around -6% for the past two years. However, the compression in the economic spread for the major banks at 1H16 to 3.6% from 4.3% at 2H15 is a clear reflection of the subdued operating environment over the period – which negatively impacts returns while adding to the cost of bank funding.
Driven by a decrease in credit risk-weighted assets (RWAs), the major banks combined total RWAs remained largely flat against 2H15. For 1H16, containment of RWA growth represented an important driver in assisting growth of the combined total capital adequacy ratio of the major banks in the current review period. Consequently, the combined total capital adequacy ratio increased marginally to 15.5% at 1H16, compared to 15.2% at 2H15 and 15.4% at 1H15. As the industry moves along the Basel III timeline towards full implementation in 2019, this trend of relatively flat capital adequacy ratios that we have seen over recent reporting periods is consistent with the major banks’ own expectations and those of market analysts, given the still changing prudential regulatory landscape. It is positive to note that the banks’ combined common equity tier 1 (CET 1) capital ratio – the core measure of regulatory capital under Basel III – remains robust at 12.7% at 1H16 (12.5% at 2H15 and 12.6% at 1H15), comfortably above the required regulatory minimum of 6.5% for this capital tier.
Going forward, how these ratios evolve in light of current and impending regulatory changes on the horizon will be closely watched by the banks and market participants.
Stakeholder expectations
Two of the major banks are currently working through arrangements for changes in their shareholding structure, with Barclays plc announcing its intention in March 2016 to reduce its shareholding in BAGL to a level that would ultimately permit accounting and regulatory deconsolidation.
Old Mutual plc (OM) has outlined its intention for a managed separation of its interest in Nedbank Group. While OM does not intend to sell any part of its shareholding in Nedbank to a new strategic investor, the managed separation process is expected to see a significant proportion of its Nedbank shareholder base widely held by shareholders on the register of a new OM SA holding company.
In both instances, global regulatory developments and the implications of regulatory change will have had a bearing on the decisions by both of these foreign investors. At the same time, both of these processes will involve significant ongoing regulatory and stakeholder engagement.
The pace of the global regulatory reform agenda continues since our last Major Banks Analysis in March 2016, and in some cases has shown acceleration on the part of international standards-setting bodies to complete the work that began in response to the financial crisis.
In particular, the BCBS has introduced – or is in the process of introducing – further policies and requirements which, when combined, could fundamentally influence the prudential regulatory landscape and significantly change the way banks’ RWAs are calculated.
Additionally, there is now a clear shift in prudential regulation towards strengthening the ‘resolution framework’ for banks to an internationally consistent level. While the focus of Basel III has been on ‘going concern’ capital requirements (ensuring banks have sufficient quantity and quality of capital while operating as going concerns), the introduction of a ‘gone-concern’ capital regime (known as Total Loss Absorbing Capacity, TLAC) shifts focus to capital requirements in the context of recovery and resolution planning. In South Africa, the collective views of National Treasury, the SARB and the Financial Services Board (FSB) were set out in a position paper issued in 2015 to solicit public comment and serve as a basis for further industry discussions in preparation for the drafting of a special resolution bill.

7 PwCMajor banks analysis – South Africa September 2016
1. The big picture
The pace of global regulatory developments has by no means been limited to prudential regulation, as regulators have also been prolific in the context of market conduct and consumer protection regulation.
In March 2016, the UK implemented the Senior Managers Regime (SMR) which, among other things, represents a defined set of ‘prescribed responsibilities’ and ‘key functions’ that must be allocated among banking senior managers. In the US, in response to persistent weaknesses in banks’ anti-money laundering (AML) transaction monitoring and watchlist filtering capabilities, the New York State Department of Financial Services issued a final rule3 in June 2016 requiring senior officers or a firm’s board to certify the effectiveness of its AML programmes.
The rule represents the first time a regulator has moved beyond oral guidance and written enforcement actions to provide a formal regulation regarding FS firms’ AML transaction monitoring and filtering programmes, and brings with it a broad set of considerations for all firms to consider.
It is not beyond possibility that these rules may serve as a template that sets the direction of travel for other international supervisors to follow regarding conduct or AML regulation – topics that have been consistently escalating on the supervisory agenda. As we have noted previously, we continue to expect that supervisory focus on market conduct regulation in South Africa will rise on the stakeholder agenda as the Financial Sector Regulation Bill (FSRB) – which gives effect to the proposed Twin Peaks approach to FS regulation in South Africa – is expected to be finalised later in the year.
The trend of instilling individual accountability and board-level attestations across FS firms is a multidimensional development resonating across stakeholder groups at various levels, and is seemingly shared by both investors and regulators. For example, significant revisions to enhance banks’ published risk disclosures that are now on the horizon through the revised Pillar 3 framework will require that “one or more senior officers of a bank, ideally at board level or equivalent, must attest in writing that disclosures have been prepared in accordance with the board-agreed internal control processes”.
Internal responses
While each of the major banks have consistently outlined unique strategies that play to their areas of strength, they all share certain common strategic themes. Key among these is maintaining and, where possible, expanding their product and platform capabilities in selected African markets beyond South Africa.
While individual execution strategies differ for each of the major banks, diversifying and enhancing their earnings profile from their operations across the continent remains a central theme of their strategies, particularly in light of relatively stronger economic prospects in the rest of the continent compared to domestically.
A second key theme shared by the major banks is continued focus on growing their transactional banking franchises, particularly in corporate banking, and the associated enhancements towards more integrated core banking and electronic platform capabilities.
Linked to platform and digital strategies, the major banks are all paying keen attention to rapid technological developments within the fintech industry. From exploring or embedding strategic partnerships, horizon scanning for potential partnership opportunities and upscaling in-house fintech efforts, each of the banks are attuned to ongoing digital enhancements in a rapid, potentially industry-shaping fintech environment.
Globally, common sentiments among the banking sectors in some developed markets are that although the fintech industry is clearly evolving rapidly, it is not yet thriving at the levels its latent potential suggests. Our research indicates that while banks understand that innovation is critical, their long development cycles, legacy systems, organisational structures and other challenges may at times not allow them to keep pace with today’s rapid shifts in technology and customer needs.
Continued investment in building a healthy, holistic fintech ‘ecosystem’ – an environment that will produce the innovative offerings needed to compete in the years to come – therefore appears to be a model that the South African major banks may continue to follow.
Other common strategic themes shared by the major banks include ongoing focus on product, platform and channel innovation, enhancing their focus on customer needs across the wholesale, SME and retail customer segments, strong capital management and cost control in a challenging operating environment.
3 PwC US, “AML Monitoring: NY regulator gets prescriptive” in Financial Crimes Observer, July 2016

8 PwCMajor banks analysis – South Africa September 2016
1. The big picture
At the same time, recent examples of sophisticated international cyberattacks, including the attack on the central bank of Bangladesh earlier in the year and examples of a string of attacks that SWIFT – the global financial messaging and communication system – has communicated to its members, highlight the need for ongoing focus by banks on cyber resilience. More directly, a sophisticated, co-ordinated fraud incident using a small number of fictitious debit and cheque cards at various ATMs outside South Africa contributed to operational risk losses for one of the major banks.
In this challenging environment the focus on IT enhancements for the major banks is being driven from multiple angles – security and resilience, customer centricity, regulatory demands for more granular risk information and stronger symmetries between risk and finance data, as well as innovation and agility.
Prospects
Continuing a trend we have highlighted previously, the global economy is undergoing a period in which patterns of growth are changing, and not insubstantially. Interestingly, the extent of divergent economic experiences and outlooks across individual jurisdictions suggest that the traditional boundaries of terminology for ‘emerging’ versus ‘developed’ economies is itself being blurred, as degrees of equivalence in the structural characteristics of economies and risk perceptions of individual territories (for example Russia compared to China, or Qatar compared to South Africa) are as vast as the countries themselves.
What is clear is that forecast risk will remain to the downside with market volatility at elevated levels in the near to medium term. In turn, this places sharp emphasis on the need for banks to continue to engage in robust, strategic planning that takes full account of all factors that have a bearing on their future profitability levels.
These include navigating uncertain and volatile global and domestic economic terrain, continued prudential regulatory reform, a growing focus on culture, conduct and consumer protection regulation, increasing cyber threats, and critically, the intersection of all these on overall bank strategy.
While the outlook for the next six months will sharply be attuned to how domestic political and other structural concerns are interpreted by ratings agencies, analysts and the wider investment communities’ perceptions of the sovereign rating, the SARB’s Financial Stability Review First edition, 2016 captures the severity of possible implications:
The impact of a further ratings downgrade on the South African economy and financial system could manifest in the form of capital outflows, potential spill-overs to rand-denominated government debt; higher cost of, and reduced access to, funding; reduced credit to the private sector; increasing CDS spreads; receding business confidence; falling corporate profits; high and rising household debt levels and financing costs thereof; and elevated credit risk of financial and non-financial sectors.
However, with relatively strong second quarter economic growth having been recorded, the South African economic outlook for the full year 2016 has received a welcomed positive tone. While overall growth is still expected to remain at low levels, what is important is that previous expectations of a no-growth year expressed by many market commentators may begin to soften.

9 PwCMajor banks analysis – South Africa September 2016
1. The big picture
At the same time, forecast economic growth in markets across the continent outside South Africa is expected to exceed growth levels within domestic borders, although it is expected to remain volatile, particularly for the major oil-exporting countries. Domestically, the prospects for inflation to exceed the SARB’s target band are generally expected to manifest in a further increase in the repurchase rate in 2016.
Against this uncertain outlook, the major banks have all selected cautious language in outlining their individual prospects through to year end. Most have predicted a mixed outlook for developed economies, with continued uncertainties being generated as the UK navigates a path set by its recent EU referendum.
Ongoing concerns over levels of consumer indebtedness are expected to see the trend of wholesale and corporate credit growth continuing to exceed retail credit growth, though potentially offset by weaker South African business confidence levels.
Intense regulatory change will continue to place strong focus on capital and liquidity management across all banks, while inflationary and cost pressures imply that cost control and a proactive focus on cost-to-income ratios will remain high on the strategic agenda.
In spite of challenges including the economic and risk outlook facing the industry, the major banks have shown that their strong and diverse franchises have consistently aided them to access profit pools and in navigating difficult operating terrain. In summary, a tone of ‘cautious optimism’ would appear to be the consensus outlook for the rest of 2016.

Major banks analysis – South Africa September 2016
Combined results for six-month periods (Rm)
1H16 2H15 1H15 2H14 1H16 v 1H15 1H16 v 2H15
Net interest income 84 803 78 838 73 153 72 740 15,90% 7,60%
Non-interest revenue 66 940 65 044 60 800 61 812 10,10% 2,90%
Total operating income 151 743 143 882 133 953 134 552 13,30% 5,50%
Total operating expenses -85 893 -82 070 -76 288 -76 853 12,60% 4,70%
Core earnings 65 850 61 812 57 665 57 699 14,20% 6,50%
Impairment charge -17 237 -13 336 -13 590 -12 038 26,80% 29,30%
Other income/(expenses) 183 -1 022 1 709 2 224 -89,30% >-100.0%
Discontinued operations - -261 3 002 -2 713 -100,00% -100,00%
Income tax expenses -11 630 -11 429 -10 768 -11 318 8,00% 1,80%
Profit for the period 37 166 35 764 38 018 33 854 -2,20% 3,90%
Attributable earnings 34 468 32 502 35 718 31 191 -3,50% 6,00%
Headline earnings 34 640 33 745 32 763 29 984 5,70% 2,70%
Return on equity 17,6% 17,90% 18,20% 17,50% -0,60% -0,30%
Source: PwC analysis

11 PwCMajor banks analysis – South Africa September 2016
1. The big picture
Figure 1.1 Combined income statement of the major banks
NII NIR Opex Impairment Tax Other
Rm
ROE
0
50 000
100 000
150 000
200 000
0
2
4
6
8
10
12
14
16
18
2H15 1H15 1H162H14
-100 000
-50 000
150 000
%
Source: PwC analysis
Figure 1.2 Key drivers of combined profit and loss
0
10 000
20 000
30 000
40 000
50 000
60 000
NII NIR Opex Impairment Other Tax
1H161H15 Income Expenses
Rm
Source: PwC analysis
Figure 1.3 Economic spread performance (ROE – cost of equity)
0
1
2
3
4
5
6
7
8
1H16 2H15 1H15 2H14
%
Source: PwC analysis

12 PwCMajor banks analysis – South Africa September 2016
2. Economic outlook by Dr Roelof Botha, economic advisor to PwC
The odds in favour of stable or marginally lower money market rates over the next six months are stacking up.
South Africa’s prime overdraft rate stood at 10.5% in early September (350 basis points above the repo rate), which is 200 basis points above the level of early January 2014.
The first and most important clue to forecasting the likely short-term trend for the prime rate is related to inflation. After declining to a benign annualised rate of 3.9% in February 2015, the consumer price index (CPI) crept up to 7% a year later, mainly as a result of the drought and the fairly dramatic weakening of the rand exchange rate over this period. Fortunately, the CPI has started a declining trend, dropping to 6% in July 2016.
Few global currencies have matched the rand’s volatility over the past year, which was due to an unusual combination of technical and political factors. The periodic strength of the US dollar whenever rumours of higher US interest rates do the rounds invariably exerts downward pressure on emerging market currencies, whilst the ‘Brexit’ vote in the UK had the opposite effect.
The rand’s performance against the US dollar since the beginning of 2013 does not make for pleasant reading for the monetary authorities:
• January 2013 to January 2014 – decline of 19.2%
• January 2014 to January 2015 – decline of 6%
• January 2015 to January 2016 – decline of 29.4%
• January 2015 to August 2016 – increase of 18.6%
Even though the rand was still 6.5% weaker against the US dollar in August 2016 than it was twelve months earlier, this depreciation is more or less in line with inflation differentials and is insignificant compared with the trend during calendar year 2015.

2. Economic outlook
13 PwCMajor banks analysis – South Africa September 2016
Barring any unexpected events surrounding the executive leadership of National Treasury, it is clear that the recovery of the rand exchange rate against all major currencies since the beginning of the year has led to a reversal of inflationary trends relating to imports.
In addition, most authoritative climate research agencies are confident that the drought brought about by the El Niño phenomenon has been replaced by prospects for average or above-average summer rainfall in the region.
As a direct result of the drought that ravaged many parts of the country over the past 18 months, food prices escalated quite steeply. Food price CPI increased by 10.8% between July 2015 and June 2016, compared to an overall CPI increase of 6.3%.
Selected global energy & food commodity price declines between, June 2015 - August 2016 (USD)
Commodity % decline Commodity % declineSorghum 33.7 Sunflower oil 11.1
Wheat (US HRW) 28.6 Maize 9.7
Brent crude oil 26.0 Beef 4.7
World gas index 19.9 Poultry 4.2
Sources: World Bank; PwC analysis
Fortunately, many global food prices have declined over the past year, with the commodity price index for grains having declined by more than 13%.
Figure 2.1 World Bank commodity price indices, August 2015 – August 2016
50
55
60
65
70
75
80
85
90
95
100
105
AugJulyJuneMayAprMarFebJanDecNovOctSept Aug
Energy Beverages
2015 2016
Grains
Source: World Bank, PwC analysis
Despite a recovery since January 2016, energy prices, which also exert a major impact on inflation, were 16.3% lower in August 2016 than a year ago.
Against the background of recent food price trends, prospects for a recovery in agricultural production and the fact that the rand exchange rate remains undervalued, it is almost certain that the rate of inflation will continue to decline for the remainder of the year and possibly also into 2017.
This may remove a key rationale for the decision by the SARB to continue raising the benchmark lending rate.

2. Economic outlook
14 PwCMajor banks analysis – South Africa September 2016
Figure 2.2 Annualised growth in private sector credit extension
0
2
4
6
8
10
12
JulyJuneMayAprMarFebJanDecNovOctSept Aug2015 2016
%
Source: SARB, PwC analysis
A second clue is provided by the underlying trend in the R186 government bond yield, which was 120 basis points lower in mid-August than in January 2016. While investor perceptions surrounding a potential investigation involving the Minister of Finance has contributed to an increase in the yield again, even in early September, this yield was still 65 basis points lower than at the beginning of the year.
Another good reason to suspect that monetary authorities may adopt a less rigid approach towards pursuing price stability is the continued decline in the real value of outstanding mortgage loans. The property boom of 2002 to 2008 witnessed an increase of more than 160% in this value to more than R1.4 trillion, but it has since declined by 12.6%.
Additionally, the threat of a return to recession has been omnipresent since the beginning of the year and it is clear that demand inflation in South Africa is virtually non-existent.
A variety of other key macroeconomic indicators confirm the strong need for measures aimed at boosting the country’s growth potential. These include lower volumes of new vehicle sales, a 10-year low for the generation of electricity and a six-year low for the country’s leading business cycle indicator.
A more accommodating monetary policy stance will lower the cost of capital for businesses and also provide households with a measure of relief via lower finance costs. It may just be on the cards soon.

15 PwCMajor banks analysis – South Africa September 2016
3. Net interest income
Net interest margin (Rm)
Combined1H16 2H15 1H15 2H14
Gross loans and advances 3 402 723 3 358 186 3 287 314 3 033 571
Net interest margin (% of average interest-earning assets)
4.65% 4.38% 4.34% 4.64%
Figure 3.1 Net interest margin and advances
Source: PwC analysis
2H14
1H15
2H15
1H16
2H14
1H15
2H15
1H16
2H14
1H15
2H15
1H16
2H14
1H15
2H15
1H16
0
200 000
400 000
600 000
800 000
1 000 000
1 200 000
BAGL FSR NED SBK
0
1
2
3
4
5
6
Gross loans and advances Net interest margin (% of average interest earning assets)
Rm
%

3. Net interest income
16 PwCMajor banks analysis – South Africa September 2016
Growth in combined net interest income for the major banks for the current period amounted to 15.9% when compared to 1H15, and 7.6% against 2H15.
The impact of endowment, deposit and advances growth and ongoing focus on balance sheet mix remain key factors benefitting NII growth. These factors have been offset, however, by the impact of regulatory requirements, high funding costs and competitive pricing among the banks.
At the same time, the combined net interest margin grew to 4.65% from 4.34% at 1H15 and 4.38% at 2H15. The key drivers influencing the major banks’ net interest income remain largely consistent with the previous period, and continue to include:
• The effect of endowment and the economic environment;
• Regulatory requirements and higher funding costs;
• Balance sheet mix and pricing; and
• The effect of volatile foreign exchange markets.
Endowment impact and economic environment
The endowment effect positively affects the earnings capacity of bank assets during periods of market interest rate increase, as these changes result in variable-rate assets typically re-pricing faster than non-rate sensitive liabilities or the equity that funds those assets.
The current period has witnessed dual increases in the repurchase rate by the SARB of a cumulative 75 basis points. Consequently, the impact of endowment has been positive for the banks’ net interest income line as these increases effectively provided enhanced earnings generation of the major banks’ asset bases.
While bank margins benefitted to some extent as a result of higher market interest rates in the current period, the effect of higher interest rates and persistently high levels of consumer price inflation (CPI) add strain to household incomes, debt-service costs and aggregate consumer credit demand.
For this reason, the impact of endowment on bank margins would be expected to normalise over the medium- to longer-term as the complete effects of rate increases are embedded in the economy. It is also worth noting that the outlook for interest rates in South Africa is one of expected increases over the rest of 2016 given inflation levels being at the upper end of the SARB’s target range.
Gross loans and advances for 1H16 grew by a muted 1.3% compared to 2H15 and 6.5% against 1H15. Interestingly, the combined retail portfolios of the major banks has seen contraction of 0.5% in the current period against 2H15, a development we have not seen since we began our analysis. In many ways, this trend can be seen to be a reflection of both a constrained South African consumer, with limited credit appetite given inflationary and interest rate pressures, and banks taking a measured approach to credit origination in a difficult operating climate.
A continued key driver supporting loan growth for the major banks remains their corporate and investment banking portfolios, which is consistent with the theme observed in our previous analyses. However, as we note in the Asset quality section of this publication, the rate at which corporate credit has grown is lower than that seen previously.
On the deposit side, while each of the banks has seen growth across their core deposit franchises, the levels of growth have subdued, resulting in combined deposit growth of only 1.5% against 2H15, but a healthier 6.7% against 1H15.
Each of the major banks has seen double-digit growth in net interest income against the comparable period ranging between 11% and 17%, an achievement they have managed consistently over a number of periods.

3. Net interest income
17 PwCMajor banks analysis – South Africa September 2016
Regulatory requirements, higher funding costs and balance sheet mix
A factor continuing to influence net interest margin over the current period has been the effect of banks’ accumulating stocks of high-quality liquid assets (HQLA) to meet contractual liabilities over a 30-day simulated period of stress, as the Basel III liquidity coverage ratio (LCR) increased from its 2015 minimum of 60% to 70% on 1 January 2016. Increases in the minimum LCR requirement will continue in equal annual steps of 10% towards 100% in 2019.
Consequently, margins from interest-earning assets have continued to come under pressure in light of larger amounts of HQLA being held to ensure LCR compliance, as well as efforts by the major banks to lengthen their funding profiles in anticipation of the net stable funding ratio (NSFR) – the longer-term structural regulatory requirement introduced by Basel III – that comes into effect on 1 January 2018.
The LCR and the NSFR have real implications for liquidity management and the cost of bank funding, as higher quantities of HQLA place downward pressure on bank margins given the relatively low-yielding nature of these assets, which are specified by regulation.
Additionally, all of the major banks have commented in some way on the fact that the current period appeared to reflect relatively higher wholesale liquidity premiums and a negative mix impact associated with wholesale funding.
A key reason supporting this view has been high levels of uncertainty and volatility in funding markets that prevailed over the current period, as well as rising market funding costs as a result of current and anticipated regulatory requirements.
Consistent with our observations in previous periods, the major banks continue to place focus on proactive improvements to pricing strategies, appropriately pricing for risk and balancing these against growth in both risk appetite and growth ambitions.
Particularly in the competitive retail banking sector, we continue to note improvements in balance sheet mix being counteracted by competitive pricing strategies among the major banks. Interestingly, there has been a noticeable decline in rate-sensitive asset portfolios such as credit cards and overdrafts from the levels seen previously.
We continue to note that ongoing regulatory developments regarding liquidity risk result in banks placing greater emphasis on their deposit franchises in order to secure ‘stable’ funding sources and generally diversify their funding base.
Asset and liability mix efforts continue to include favouring shorter-term rather than longer-term assets such as retail mortgages, as the introduction of the NSFR will require access to stable sources of funding that are difficult to attract for an emerging market economy with the structural features that South Africa has, such as a relatively low household savings rate.
Volatile foreign exchange markets
Those banks using their physical footprints or operations outside South Africa to grow lending will have seen their foreign currency translation reserves continue to be impacted by volatile foreign-exchange markets over the period, amplified by the period leading up to, and immediately following, the UK’s referendum result.
Each of the major banks has different structures, business models and strategies with regard to the management of foreign-currency advances. While some maintain large physical footprints (and separate legal entities through which they originate foreign currency credit), others make use of their South African balance sheets to write credit outside the domestic market.
Consequently, the effects of exchange rate impact the banks’ earnings in different ways, with some benefitting through a stronger USD-exchange rate where their foreign loan books are generally USD-denominated. Others would have experienced an element of dilution in earnings as a result of a weaker rand (converting non-ZAR legal entity balances into a rand reporting currency).
In either case, what is clear is that volatile foreign-exchange markets introduce added complexity to navigate for the banks in managing their margins. The still uncertain exchange rate outlook over the short term will continue to be a focus area for the banks as they look to manage, and in some cases hedge, their exposure to foreign-currency risk.

3. Net interest income
18 PwCMajor banks analysis – South Africa September 2016
The way forward
While the major banks have shown their ability to protect – and in many cases grow – margins in difficult trading conditions, net interest margins will undoubtedly remain a key area of focus for treasury teams.
Continued pressure on the net interest margin is expected to continue as regulatory requirements, specifically those from a liquidity perspective, are expected to influence strategic funding activity and balance sheet mix in future periods.
At the same time, continued uncertainty over the global macroeconomy and domestic economic concerns will likely translate into periods of volatile financial markets, which are never positive for funding spreads.
The effects of these changes are potentially likely to lead to continued pressure on bank margins. To react, a distinct strategic focus by all the major banks on growth in non-interest revenue sources such as fee and commission-based income, asset management activities and other related services is expected to continue.

19 PwCMajor banks analysis – South Africa September 2016
4. Non-interest revenue
Non-interest revenue (NIR) continues to be primarily supported by growth in fee and commission income, which represents 70% of the total for 1H16. NIR grew 10.1% in 1H16 compared to 1H15, but by only 2.9% against 2H15.
NIR has continued on a positive growth trajectory as the levels of growth increased during recent periods with NIR growing 10.1% in 1H16 compared to 1H15. NIR composition continues to be dominated by fee and commission income, which represents 70% of the total for 1H16, largely consistent with the contribution for the previous four six-month periods. For the major banks, the level of growth ranged between 9% and 12% compared to those observed in 1H15.
An interesting development, noted in the last two reporting periods, has continued with the significant increase in the contribution of ‘rest of Africa’ operations to the growth in the NIR line for the major banks. Although absolute contributions remain relatively small, the growth seen bears testimony to the successful implementation of strategies to cater for growth in these markets at a time when it is becoming increasingly more challenging to extract strong growth from the South African market, which has become increasingly saturated.
Non-interest revenue (NIR) continues to be primarily supported by resilient growth in fee and commission income, which represents approximately 70% of total NIR for 1H16
NIR grew 10% in 1H16 compared to 1H15, but only by 2.9% against 2H15
4. Non-interest revenue
20 PwCMajor banks analysis – South Africa September 2016
This growth was achieved across most spectrums of NIR, being net fee and commission income and fair value income, although this growth has remained constrained by the tough macroeconomic conditions. Consistent with 2H15, there was a decline in insurance and bancassurance income. However, this decline was significantly less than what was noted in the prior period.
Net fee and commission income
Net fee and commission income grew by 9.8% compared to 1H15, which represents a continuation of the strong growth trajectory recorded in the past.
The banks have commented that this growth is attributable to net growth in customer numbers and below inflation-related increases in the prices of selected products. We see this growth as a remarkable achievement in the face of headwinds experienced in the form of lower interchange fees and the generally subdued macroeconomic environment.
The current reporting period, as with 2H15, includes the full impact of the revised lower interchange fees. The majority of banks also commented that they have seen strong growth in card-acquiring volumes that have softened the impact of lower interchange fees.
Management teams continue to diversify the net fee and commission income revenue streams across various geographical regions in Africa, given the relatively mature state of the banking market in South Africa and muted opportunities for significant further growth in this region. Management continues to focus on growth in annuity revenue in the rest of Africa, particularly through focusing on less capital-intensive activities.
Knowledge-based fee income, largely associated with investment banking advisory activities, has also continued to show resilience despite tough trading conditions. The current economic uncertainty could, however, impact negatively on this line item in the near term as big financing decisions, listings and takeovers are delayed.
Fair value income
Fair value income continued to follow the volatile pattern observed in previous reporting periods, growing by a robust 15.3% on 1H15, with a marginal growth of 1.1% against 2H15.
Trade flows within the major banks generally benefited from increased demand for hedging and risk management products in light of the levels of market volatility prevalent over the current review period.
At the same time, the trading environments remained challenging due to increased competition and compressed margins. Given the currency volatility noted in 1H16, the banks benefited from this tailwind, notwithstanding the pressure placed on other areas of the banks given the currency volatility.
The growing contribution of trading operations in the rest of Africa has been a positive development for some of the major banks as they capitalise on the increase in cross-border trading activities. The relative contribution of trading operations in the rest of Africa now constitutes a significant portion of the banks’ fair value income, although the banks have commented that given weaker fundamentals and increased competition, the strong growth experienced in their rest-of-Africa portfolios is expected to moderate in the near term.
Fair value income has also been affected by downward private equity revaluations at some banks. On the positive side, some banks have had favourable realisations/revaluations of private equity and property investments, which boosted their fair value income. Given the unstable economic environment, we foresee a slowdown in these frequent realisations continuing to come through in upcoming reporting periods.

4. Non-interest revenue
21 PwCMajor banks analysis – South Africa September 2016
Insurance and bancassurance income
Revenue related to insurance and bancassurance activities decreased by 2.6% compared to 1H15.
Various headwinds were faced during the reporting period, including softer global equity markets, a moderation in the growth of life and short-term insurance premiums on the back of slower economic growth and consumer spending power, and increased investments being required to meet the increased regulatory obligations expected in the near term.
An interesting development is that the banks are increasingly looking for expansion opportunities in the rest of Africa in both the short-term and long-term insurance markets to bolster growth, given the relatively low levels of penetration in insurance markets in these territories. Higher weather-related claims also negatively impacted on levels of growth in this area.
Figure 4.1 Non-interest revenue
0
10000
20000
30000
40000
50000
60000
70000
2H14 1H15 2H15 1H16
Net fee and commission income Fair value income
Insurance & bancassurance income Other income
Rm
Source: PwC analysis
22 PwCMajor banks analysis – South Africa September 2016
5.Efficiency
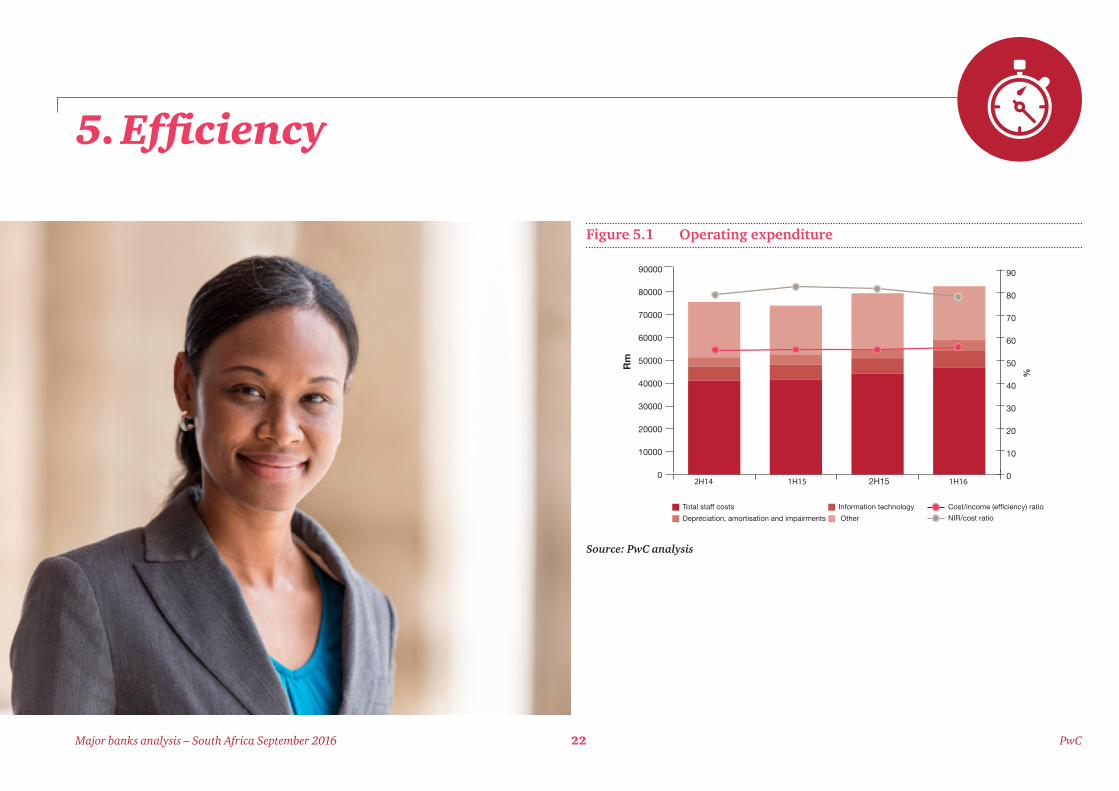
Figure 5.1 Operating expenditure
Source: PwC analysis
2H14 1H15 2H15 1H16
Total staff costs Information technology Cost/income (efficiency) ratio
Depreciation, amortisation and impairments Other
Rm
0
10000
20000
30000
40000
50000
60000
70000
80000
90000
0
10
20
30
40
50
60
70
80
90
NIR/cost ratio
%

5. Efficiency
23 PwCMajor banks analysis – South Africa September 2016
The banks continue to focus on structural cost programmes to realise efficiency gains that can be invested in growth initiatives. There has been a marginal improvement in their cost-to-income ratio to 54.8% (1H15: 54.9%) mostly due to an increase in income rather than a decrease in operating expenses.
This ratio continued its downward trend from a high of 59% in 2H11 as banks continue to intensify their efficiency efforts and seek to manage costs effectively across their organisations. Interestingly, this is the fifth reporting period where the cost-to-income ratio is in the 55.1% to 54.8% range, illustrating the challenge that the banks are facing to further improve on it.
As previously observed, we continue to expect pressure on the cost-to-income ratio as the major banks invest for future growth within a challenging current economic climate. A few areas where these increased costs may manifest include:
• Initiatives to right-size the branch networks and consolidate branches, coupled with increased costs to build out a branch network that is fit for the future and responsive to the changing needs of customers. The banks are looking critically at internal processes and levels of automation with the aim of simplifying processes and rationalising systems, where possible, in order to ensure an enhanced customer experience.
• Initiatives to invest in the rest of Africa, where significant investment is currently being made in infrastructure/IT systems. The inflationary environment outside South Africa is generally higher than domestically. The average USD/ZAR exchange rate deteriorated from R11.94 in 1H15 to R15.19 in 1H16, placing significant additional pressure on the cost line for imported IT services.
The major banks have commented that they are making significant investments in their IT systems to meet increased regulatory requirements and heightened customer expectations for seamless transactional banking and digital solutions.
We previously indicated that there will be increased amortisation charges as these systems come online which will negatively impact costs and the banks commented on this drag on performance in their current period results.
Specific areas receiving focus include the banks’ responses to the rising threat of cyber risk and their overall readiness for new regulation in the form of the Basel Committee’s Principles for effective risk data aggregation and risk reporting (BCBS 239).
The principles contained in this BCBS document became effective on 1 January 2016 for the majority of global banks (those designated as G-SIBs). The principles require greater linkage between risk and finance systems and also seek to ensure the integrity of risk data nearly to the same extent as financial reporting data.
There is also a heightened awareness of IT spend as the major banks race to embed digital platforms in competition with non-traditional opponents in the form of companies residing within industries outside financial services. One bank noted that an offshore fraud event related to ATMs led to a R300m operating loss and negatively impacted their cost-to-income ratio.
More than 57% of the total operating expenses of the major banks relate to staff costs, which represents a slight increase on the contribution of 56% at 1H15. One of the banks noted that significant increases in staff costs arose because they converted temporary staff into permanent staff in line with strategic and legal considerations. This increase was, however, somewhat mitigated by the reduced share-based payments charge given the decrease in the majority of the bank’s average share price as at the end of 1H16.
We expect this increasing staff cost trend to continue as specialist and skilled resources are employed to assist the banks with the IT transformation described above and to help meet the heightened levels of regulatory compliance required.
The major banks have to be commended on their cost containment strategies over the current period, which have resulted in a relatively stable cost-to-income ratio. Over the coming period it will be interesting to see how banks respond to subdued global growth, an unstable local economic environment, a depreciating currency, creeping inflation and continuing levels of investment in IT-related costs to meet their future ambitions.
The combined cost-to-income ratio improved marginally to 54,8% in 1H16 (1H15: 54.9 %)
The banks continue to focus on structural cost programmes to realise efficiency gains that can be invested in growth initiatives banking franchises and physical branch networks towards the ‘bank of the future’

24 PwCMajor banks analysis – South Africa September 2016
6. Asset quality
Asset quality (Rm)
Combined
1H16 2H15 1H15 2H14Gross loans and advances 3 402 723 3 358 186 3 287 314 3 033 571
Non-performing loans 107 472 100 009 93 685 91 690
Impairments -71 343 -67 322 -62 486 -60 926
Portfolio provisions -26 504 -24 548 -23 050 -21 602
Specific provisions -44 839 -42 774 -39 436 -39 324
Gross loans and advances
For 1H16, the major banks combined loans and advances grew 1.3% compared to 2H15 and 6.5% against 1H15. However, while credit growth continues to be achieved, albeit at a very moderate pace, a trend of slowing growth compared to that seen in previous periods is clearly observable over the last three six-monthly periods, with growth rates falling from 7.8% in 1H15 and 5.2% in 2H15 to 1.3% in 1H16.
In many ways, this is consistent with the range of economic headwinds that have prevailed over these periods, including lacklustre domestic economic growth, subdued business confidence levels and strained South African household balance sheets.
Given the range of specific economic challenges that persisted over the six months to June 2016, the banks have adopted a cautious approach to credit origination across all portfolios in an effort to optimise the balance between risk, return and growth.

6. Asset quality
25 PwCMajor banks analysis – South Africa September 2016
Therefore, and perhaps not surprisingly, the overall composition of loan portfolios across the major banks remain largely unchanged to 2H15, as is evident in figure 6.1 below. This reflects no significant strategic portfolio or business model changes – a theme to be expected given the difficult operating climate over the period and the uncertain short- to medium-term outlook.
Corporate lending
Growth recorded in the corporate lending and commercial property portfolios of the major banks continued to present a mixed picture individually as growth rates varied. The combined corporate loan book of the major banks grew by 2.6% for 1H16 against 2H15, and a more resilient 8.4% when compared against 1H15. Consequently, lending in wholesale sectors still continues to be the key driver sustaining overall loan growth.
However, the pace of growth has shown a consistent declining trend over the last two six-monthly periods with corporate credit growth falling from 13.3% at 1H15 and 5.6% at 2H15 to 2.6% at 1H16 when measured against the immediately preceding period.
This decrease is reflective of challenges impacting corporate South Africa. These include mild economic growth, a rising interest-rate cycle and low levels of business confidence. Additionally, the slowing growth trend in corporate lending can also be attributed to an ongoing focus by the major banks to balance risk, return and growth against risk-appetite levels.
SARB data for all South African banks supports this analysis, as the latest SARB Quarterly Bulletin noted that:
The corporate sector remained the dominant driver behind the increase in credit demand, albeit at a marginally slower rate when compared to the same period a year ago. Notwithstanding the challenging economic environment, the corporate sector’s demand for bank credit has been resilient. While benchmark interest rates have been increased by a cumulative 200 basis points since 2014, lending rates remain well below the highs experienced in 2008. Nevertheless, the rising debt-service cost has added pressure on both households and corporates exposed to high debt levels in the weak economic growth environment.
While forecasting where corporate credit demand will end up for the rest of 2016 remains difficult, what is clear is that the impact of volatile commodity prices, expectations for low levels of domestic economic growth, uncertainty over the sovereign credit rating and currency volatility is expected to continue to have a range of implications for different sectors of the South African economy.
Retail mortgages
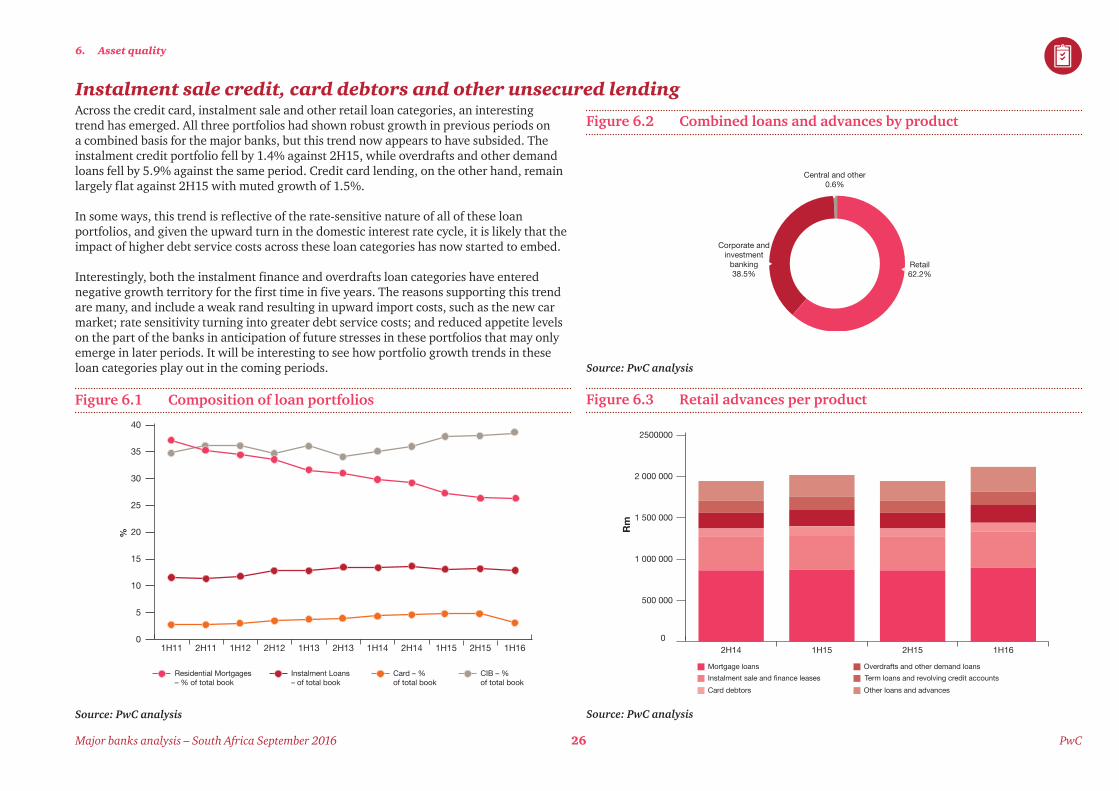
Retail mortgages continue to constitute the most sizeable portion of the major banks’ total loan portfolios, making up 26.3% of the total combined loan book at 1H16, which is largely consistent with the 26.4% noted at 2H15.
Considering that retail mortgages constituted approximately 35% of the total loan book of the major banks just four years ago, it is evident that there are various strategic and business model considerations weighing on the minds of bank management in seeking to moderate their exposure to the South African domestic real estate sector. In some ways, this can be attributed to the low-yielding, long-tenored nature of residential mortgages.
For the current period, retail mortgage credit growth of the major banks remained largely flat, increasing by only 1.1% against 2H15 and 2.5% when compared to 1H15. Consistent with industry data, the SARB notes a similar trend with regards to this asset category in its latest Quarterly Bulletin of June 2016:
Mortgage advances recorded somewhat firmer increases in the first months of 2016, extending the acceleration recorded in 2015. Twelve-month growth in mortgage advances firmed steadily from around 2 per cent at the end of 2013 to reach 6 per cent in September 2015, and subsequently remained at around that level to April 2016. The pickup in growth of mortgage advances over the past two years has been skewed towards commercial property, with growth in mortgage advances on residential property gaining pace at a more subdued rate.
Current economic conditions impacting the domestic economy, together with an unpredictable residential property market, have both played a role in muting demand for retail mortgage credit over recent periods. Household disposable income has come under significant pressure as a result of increased rates of food price inflation and higher electricity tariffs, which have had an impact over recent periods.
From a credit supply perspective, cautionary origination practices by the major banks has contributed to subdued growth in retail mortgage lending as they have spent recent periods on restructuring and working out legacy NPLs in their retail mortgage portfolios, which have remained stickily on-book.
We therefore maintain our view that clear incentives for the major banks to focus significantly on growing their retail mortgage portfolios appear somewhat limited, as they may look to deploy resources in higher-margin, less capital-intensive and shorter-term banking products.
6. Asset quality
26 PwCMajor banks analysis – South Africa September 2016
Instalment sale credit, card debtors and other unsecured lendingAcross the credit card, instalment sale and other retail loan categories, an interesting trend has emerged. All three portfolios had shown robust growth in previous periods on a combined basis for the major banks, but this trend now appears to have subsided. The instalment credit portfolio fell by 1.4% against 2H15, while overdrafts and other demand loans fell by 5.9% against the same period. Credit card lending, on the other hand, remain largely flat against 2H15 with muted growth of 1.5%.
In some ways, this trend is reflective of the rate-sensitive nature of all of these loan portfolios, and given the upward turn in the domestic interest rate cycle, it is likely that the impact of higher debt service costs across these loan categories has now started to embed.
Interestingly, both the instalment finance and overdrafts loan categories have entered negative growth territory for the first time in five years. The reasons supporting this trend are many, and include a weak rand resulting in upward import costs, such as the new car market; rate sensitivity turning into greater debt service costs; and reduced appetite levels on the part of the banks in anticipation of future stresses in these portfolios that may only emerge in later periods. It will be interesting to see how portfolio growth trends in these loan categories play out in the coming periods.
Figure 6.1 Composition of loan portfolios
Source: PwC analysis
0
5
10
15
20
25
30
35
40
1H162H151H152H141H142H131H132H121H122H111H11
Residential Mortgages– % of total book
Instalment Loans– of total book
Card – %of total book
CIB – %of total book
%
Figure 6.2 Combined loans and advances by product
Source: PwC analysis
Figure 6.3 Retail advances per product
Source: PwC analysis
Retail62.2%
Corporate andinvestment
banking38.5%
Central and other0.6%
Mortgage loans Overdrafts and other demand loans
Instalment sale and finance leases Term loans and revolving credit accounts
Card debtors Other loans and advances
Rm
0
500 000
1 000 000
1 500 000
2 000 000
2500000
1H162H151H152H14

6. Asset quality
27 PwCMajor banks analysis – South Africa September 2016
Non-performing loans
The composition of the major banks’ non-performing loans (NPLs) remains relatively mixed, with clear nuances in the stock of NPLs across individual credit portfolios. For 1H16, the combined NPLs of the major banks increased 7.5% against 2H15, but by a considerable 14.7% against 1H15. Consistent with our previous analysis, retail NPLs continue to make up the majority of NPLs, constituting nearly 74% of total NPLs.
An interesting observation is that for the first time since we began our analysis, NPLs across all credit categories have seen increases on a rolling six-month period. This would suggest that there is a clear emergence of NPLs across certain, previously high-growth portfolios such as corporate lending, credit cards, instalment finance and other retail lending (which includes unsecured lending). As we have seen previously, the rise of a rate cycle generally has a lag period before credit stress starts to emerge and NPLs materialise. This increase in NPLs across all portfolios may suggest that the credit cycle for the major banks, on a combined basis, has now turned – a prediction we have commented on previously.
Additionally, a recent SARB Directive that deals with restructured credit exposures may also be a contributing factor to the increase in NPLs. One of the features of the directive is to provide clarity on the reporting treatment of restructured credit and, specifically, to reinforce the principle that “a minimum observation period of six months after restructure is required” in the case of retail credit exposures. This may therefore be a contributing factor to the increased stock of retail NPLs as banks may be applying a greater time period in which a restructured credit exposure spends in ‘default’ even in the event of rehabilitation or curing.
All of the banks continue to highlight prudent approaches to their credit origination strategies. These approaches continue to be applied in recognition of high levels of market volatility in the South African economy and significant uncertainties in the macroeconomic environment.
However, strategies of the major banks remain robust and there is a clear focus on reducing old stock in NPLs’ buckets to offset new inflows.
Coverage ratios and income statement impairments
The major banks’ combined income statement impairment charge grew by 26.8% and 29.3% against 1H15 and 2H15 respectively. While each of the banks had different individual impairment experiences over the six months to June 2016, it is clear that the combined bad debt charge reflects a case of different individual circumstances across the major banks.
Our previous analyses have supported the view that the major banks consistently maintain healthy credit coverage ratios, and this trend has continued in the current period. As a percentage of total gross advances, the combined NPLs of the major banks has remained at a level of roughly less than 5% for the last five years (averaging 3.7% over since 1H11). At 1H16, total NPLs amounted to 3.2% of gross loans and advances (compared with 2.9% and 2.9% against 2H15 and 1H15 respectively).
The specific impairment coverage ratio – calculated as specific impairments divided by total NPLs – has decreased marginally in the current period from 68.5% at 2H15 to 67% at 1H16, but is still reflective of high levels of specific credit coverage. However, given the increase in the income statement charge in the current period, the combined credit loss ratio (calculated as income statement impairment charge divided by average gross advances) deteriorated from 0.82% at 2H15 and 0.89% at 1H15 to 1.04% in 1H16.
There are a number of factors driving the current combined impairment experience of the major banks, including specific credit write-offs for some, and general increases in portfolio (unidentified) provisions for others.
All the banks have commented on applying proactive provisioning strategies to react in a timely way to latent stresses within their credit portfolios, given the range of economic challenges and levels of uncertainty over the period. At the same time, the increase in impairments is a function of credit written in previous periods, which has now felt the strain of the increased rate cycle and resultant higher debt service costs.
It is also worth noting that a key change in accounting for credit impairments is now on the horizon. IFRS 9 Financial Instruments, a new accounting standard with an effective date of 1 January 2018, replaces IAS 39’s incurred loss impairment approach, with a new forward-looking expected credit loss (ECL) approach to impairment provisions for financial assets. It will be interesting to see how the banks’ provisioning strategies evolve in the period leading up to IFRS 9 implementation.

6. Asset quality
28 PwCMajor banks analysis – South Africa September 2016
For the rest of 2016, we continue to expect the major banks to focus intensively on managing their credit portfolios and provisioning strategies across all lending categories given the extent of economic forecast risk that is expected for the rest of the year, the subdued expectations for business confidence and the range of stresses facing all sectors of the South African economy.

29 PwCMajor banks analysis – South Africa September 2016
7. Capital and funding
Capital and funding (Rm)
Combined/Average
1H16 2H15 1H15 2H14Common equity tier 1 348 329 330 350 310 685 294 724
Total tier 1 369 793 353 555 327 393 321 360
Tier 2 61 530 60 687 55 488 54 855
Total qualifying capital and reserve funds
431 323 414 242 382 881 376 215
Total capital adequacy ratio 15.5% 15.2% 15.4% 15.3%
Risk-weighted assets 2 817 705 2 828 345 2 599 837 2 527 286
Deposits 3 630 945 3 578 418 3 403 126 3 197 387
While the major banks remain well capitalised, with total regulatory capital adequacy ratios comfortably above required minimums, challenging earnings growth resulted in only a slight increase in the total capital adequacy ratio to 15.5% at 1H16 (compared to 15.2% at 2H15 and 15.4% at 1H15).

7. Capital and funding
30 PwCMajor banks analysis – South Africa September 2016
Capital resources and requirements
For 1H16, a minor contraction in combined risk-weighted assets (RWAs) represented an important driver in assisting growth of the major banks’ combined total capital adequacy ratio in the current review period.
Total RWA’s reduced marginally against 2H15. However, when compared against 1H15, growth of 8.4% came on the back of general loan book growth experienced in the previous period. Credit RWAs still represent the most material portion of the major banks’ total RWAs, amounting to nearly 74% at 1H16 (compared to approximately 75% at 2H15).
The decline in credit RWAs of 1.5% against 2H15 is attributable to lacklustre gross loan growth as a consequence of the deteriorating macroeconomic environment that persisted over the review period.
Given the significant contribution of credit RWAs as a component of the major banks’ total RWAs, they continue to refine their credit modelling parameters across wholesale portfolios and focus on RWA optimisation initiatives within retail portfolios.
The combined total capital adequacy ratio of the major banks for the current review period increased marginally to 15.5% at 1H16, compared to 15.2% at 2H15 and 15.4% at 1H15.
As the industry moves along the Basel III timeline towards full implementation in 2019, the trend of relatively flat capital adequacy ratios that we have seen over recent reporting periods remains consistent with the major banks’ own expectations and those of market analysts, given the still changing prudential regulatory landscape.
It is positive to note that the banks’ combined common equity tier 1 (CET 1) capital ratio – the core measure of regulatory capital under Basel III – remains robust at 12.7% at 1H16 (12.5% at 2H15 and 12.6% at 1H15), comfortably above the required regulatory base minimum of 6.5% for this capital tier.
The minimum total required capital adequacy level increased to 10.375% at 1 January 2016 with the introduction of the Capital Conservation Buffer, and a resultant change in the Pillar 2A requirement. The additional Domestic Systemically Important Bank (D-SIB) requirement is excluded in our analysis on the basis that it is bank specific and confidential.This is a level that all of the major banks comfortably surpass and is a credit to their prudent stance on capital management in current and previous years in preparation for the current increasing capital regime still being brought about by Basel III.
However, capital generated through earnings growth continues to be offset by sustained growth in RWAs, and we continue to see ‘old-style’ issued Additional Tier I and Tier II capital instruments being phased out of the capital resource base in line with transitional regulatory requirements under Basel III.
The haircut percentage applied in the capital calculation to legacy Tier II instruments has increased in 2016 by an additional 10% to 40%.
Beyond the base minimum capital requirements, there has been a growing international trend of supervisory focus on banks’ risk management and governance influencing how Pillar 2 capital add-ons are set. This trend is being driven by an evolving supervisory methodology used for setting Pillar 2 requirements (known as the Supervisory Review and Evaluation Process, SREP) to factor in the supervisors’ views on the maturity and effectiveness of banks’ risk management and governance processes.

7. Capital and funding
31 PwCMajor banks analysis – South Africa September 2016
The evolving prudential landscape
Ongoing efforts regarding over-the-counter (OTC) derivatives regulatory reform continues at a global level, with regulators determined to address the significant weaknesses exposed during the global financial crisis in OTC markets, which included excessive and opaque risk-taking.
The reform programme to reduce systemic risk from OTC derivatives comprise certain key elements that broadly include:
• Trading OTC instruments on exchanges or electronic platforms;
• Having them clearing through central counterparties (CCPs);
• Reporting to trade repositories; and
• Higher margin requirements for non-centrally cleared derivatives.
In 2015, the SARB removed the credit valuation adjustment (CVA) capital charge exemption in South Africa, resulting in South African banks having to incur a RWA requirement on their derivatives portfolios.
The absence of a central counterparty results in a higher CVA capital charge relative to other territories. There therefore continues to be interest by various stakeholders, including international players, in establishing a central counterparty in South Africa.
Refining modelling practices is a key component in driving optimisation of RWAs given that all of the major banks adopt an advanced (modelled) approach for the measurement of the majority of their credit RWAs.
However, the benefits of these efforts are offset for operations outside South Africa, which do not have sufficiently granular data to utilise modelling for credit risk purposes. In these instances, the major banks typically apply conservative assumptions or make use of the Basel framework’s standardised approach to measure credit risk exposure for regulatory capital purposes.
Earlier in the year, the BCBS consulted on topical revisions to the internal ratings-based (IRB) approach for certain credit portfolios and the implementation of model-parameter floors. Given the significance of the changes it will be interesting to follow industry comments to the consultation.
Depending on the form of the final rules, these floors may create a need for banks to maintain simultaneous calculations of standardised and model-based approaches for credit risk purposes.
In light of the BCBS’ increasing focus on enhancing the standardised approaches to measuring RWAs, as a result of concerns over apparent disparities in RWAs between large internationally active banks due to divergent modelling practices and judgements, we continue to track the RWA-density ratio of the major banks.
These provides useful insight into the relationship between their assets on a total and risk-weighted basis, depicted in Figure 7.1. At 1H16, this ratio (measured as total RWA divided by total assets) for the major banks reflected a combined average of 58.9% (compared to 59.1% at 2H15 and 58.6% at 1H15).
To add greater perspective to the major banks’ profitability in the context of regulatory capital requirements, we have introduced a new metric in our analysis (depicted as Figure 1.3), which reflects the major banks’ combined economic spread (i.e. ROE less cost of equity). While being a crude indicator, the economic spread can be seen as a risk-reflective view of performance, as it effectively takes into account the risk-premium priced into the cost of bank funding, together with other factors.
We will continue to track this metric in future analyses, as well as how it compares to international peers. For the moment, what is clear is that the major banks’ combined economic spread of 3.6% at 1H16 (4.3% at 2H15) fairs considerably better than their European counterparts – which our global research indicates was in negative territory at 2H15 for European globally systemically important banks (G-SIBs) with net economic spreads stuck at around -6% for the past two years.
However, the compression in the economic spread for the major banks at 1H16 to 3.6% from 4.3% at 2H15 is a clear reflection of the subdued operating environment over the period – which negatively impacts returns while adding to the cost of bank funding.

7. Capital and funding
32 PwCMajor banks analysis – South Africa September 2016
RWA density
Total assets
Risk weighted assets
0
1000000
2000000
3000000
4000000
5000000
50
51
52
53
54
55
56
57
58
59
60
61
2H14 1H15 1H162H15
%
Source: PwC analysis
Figure 7.1 RWA density
Total Tier 1 capital
BAGL FSR NED SBK
ROE
Total Tier 2 capital Regulatory minimum
0
5
10
15
20
25
30
2H14
1H15
2H15
1H16
2H14
1H15
2H15
1H16
2H14
1H15
2H15
1H16
2H14
1H15
2H15
1H16
% Source: PwC analysis
Figure 7.2 Regulatory capital ratios and ROEs

7. Capital and funding
33 PwCMajor banks analysis – South Africa September 2016
Prudential and market conduct regulatory developments
The Basel Committee on Banking Supervision (BCBS) has introduced – or is in the process of introducing – a series of regulatory changes that will materially influence the prudential landscape over the next few years.
Some commentators have begun to use the term ‘Basel IV’ to describe the collective suite of changes currently being consulted on by the BCBS. To date, international regulators have been dismissive of the ‘Basel IV’ terminology on the basis that the changes being developed do not represent an overhaul of the prudential regulatory framework.
Instead, their stance has been that the changes proposed are intended to complete the global regulatory reform agenda that began with Basel III, have been informed by subsequent market developments and quantitative impact studies since Base III, and represent ‘sensible adjustments’ to counteract variances in RWAs across banks.
Despite not yet gaining official acceptance, the term ‘Basel IV’ provides a shorthand for the cumulative changes being proposed to the prudential framework, and is now commonly used by a number of market commentators, industry analysts and the financial press.
These revisions will affect all banks – irrespective of whether they use modelled or standardised approaches for regulatory purposes. Depending on the form of final implementation, they could result in significant changes to the way banks’ RWAs are calculated, with potential knock-on implications for business models and bank strategy.
Conduct, culture and consumer protection remain high on the supervisory agenda
The pace of global regulatory developments has by no means been limited to prudential regulation, as regulators have also been prolific in the context of market conduct and consumer protection regulation.
While the focus of Basel III has been on ‘going concern’ capital requirements (ensuring banks have sufficient quantity and quality of capital while operating as going concerns), the introduction of a ‘gone concern’ capital regime (known as total loss absorbing capacity [TLAC]) at the global level shifts focus to capital requirements in the context of recovery and resolution planning.
TLAC: A local view in a global contextIn South Africa, the collective views of National Treasury, the SARB and the Financial Services Board (FSB) were set out in a position paper issued in 2015 to solicit public comment and serve as a basis for further industry discussions in preparation for the drafting of a special resolution bill.
The paper set out the motivation, principles and policy proposals for a strengthened framework for the resolution of financial institutions in South Africa, and clearly references a TLAC-type framework that will be introduced in future years.
What’s changing beyond ‘Basel IV’? The proposed changes largely impact the Pillar 1 regime (base minimum requirements) and, among other areas, relate to revisions to the standardised (non-modelled) approaches for banks’ credit, market and operational risk exposures.
Changes to other elements of the prudential framework – beyond RWAs – being consulted on include:
• Further revisions to the leverage ratio (the non-risk sensitive backstop introduced by Basel III, which moves to a Pillar 1 minimum requirement on 1 January 2018);
• Revisions to the capital-floor regime, which are intended to restrict the benefit banks obtain by using modelled approaches to calculate RWAs; and
• Strengthening the resolution framework and the introduction of ‘gone-concern’ capital requirements

7. Capital and funding
34 PwCMajor banks analysis – South Africa September 2016
In March 2016, the UK implemented the Senior Managers Regime (SMR) which, among other things, represents a defined set of ‘prescribed responsibilities’ and ‘key functions’ that must be allocated among banking senior managers. It is aimed at supporting a change in culture at all levels in firms through individual accountability.
The SMR is an important element in the assessment of management and governance at FS firms and forms part of the forward-looking, judgement-based approach that now firmly appears to be a supervisory trend.
In the US, in response to persistent weaknesses in banks’ anti-money laundering (AML) transaction monitoring and watchlist filtering capabilities, the New York State Department of Financial Services issued a final rule on 30 June 2016 requiring either senior officers or a firm’s board to certify the effectiveness of its AML programmes.
The rule represents the first time a regulator has moved beyond oral guidance and written enforcement actions to provide a formal regulation regarding FS firms’ AML transaction monitoring and filtering programmes. It introduces a broad set of considerations for all firms to consider.
It is not beyond possibility that this US rule may serve as a template that sets the direction for other international supervisors to follow regarding AML regulation – a topic that has been consistently escalating on the supervisory agenda.
Weaknesses in AML processes and controls have been highlighted by South African regulators by means of recent supervisory sanctions, suggesting that it will continue to be an area of focus for all banks.
Our basis for this view is that, similarly to international jurisdictions where Twin Peaks has been embedded, supervisory intensity will increase as a result of separate and dedicated prudential and conduct regulators.
In some ways this trend is already noticeable with a number of conduct-related regulatory proposals either due to take, or having taken, effect. These include caps on unsecured interest rates and card interchange fees.
The trend of instilling individual accountability and board-level attestations across FS firms is a multidimensional development resonating across stakeholder groups at various levels, and is seemingly shared by both investors and regulators.
For example, significant revisions to enhance banks’ published risk disclosures that are now on the horizon through the revised Pillar 3 framework will require that “one or more senior officers of a bank, ideally at board level or equivalent, must attest in writing [that] disclosures have been prepared in accordance with the board-agreed internal control processes”.
We continue to expect that supervisory focus on market conduct regulation in South Africa will rise on the stakeholder agenda as the Financial Sector Regulation Bill (FSRB) – which gives effect to the proposed Twin Peaks approach to FS regulation in South Africa – is expected to pass through Parliament later in the year.

7. Capital and funding
35 PwCMajor banks analysis – South Africa September 2016
The liquidity lens: Focus on growing deposits continues
The major banks have consistently reported a robust loan-to-deposit ratio (calculated as total deposits divided by total banking book assets) in previous periods. This trend continued at 1H16 on the back of resilient but slowing deposit book growth of 1.5% against 2H15 (compared to 5.2% at 2H15 against 1H15).
The combined loan-to-deposit ratio was 96.0% at 1H16 was marginally lower than the 96.2% reported at 2H15. The sustained resilience in the loan-to-deposit ratio reflects the banks’ focused efforts to grow their deposit franchises – still a highly competitive market – through product, channel and business model innovation across both retail and wholesale customer segments.
The liquidity coverage ratio (LCR), introduced as a new Basel III regulatory concept, has now been embedded as a prudential requirement since 1 January 2015. The combined LCR for the major banks at 1H16 was 94.4% (compared to 80.8% at 2H15). There has been a steady increase in the LCR across the major banks since its implementation, with all exceeding the required current required minimum of 70% by between approximately 13% and 34%. This is clearly a deliberate focus area on the part of the banks as the LCR requirement increases to 100% on 1 January 2019.
Given its still relatively new prudential status, the LCR represents an evolving area of focus for the banking industry. In particular, with its focus on cash flows, effective compliance with the rules of the LCR requires banks to ensure that they have the necessary systems capabilities to access granular, counterparty-specific or transaction-level data – which is generally a challenge, given the systems architecture of our banks.
Since its implementation as a regulatory requirement, the SARB has sought to address a number of technical interpretations in the Regulations associated with the LCR, most recently through a Banks Act Circular (Circular 2/2016).
Going forward, the banks will focus on the strategic and practical considerations arising from the LCR. To date, most LCR focus has been on the asset side of the balance sheet and ensuring that banks grow their levels of high-quality liquid assets (HQLA). Consequently, there has been pressure on the combined net interest margin, a new trend which we first started to observe a year ago.
We expect that strategic consideration by the banks on the liability side of the balance sheet will continue, with a strong focus on their deposits franchises. Some level of unavoidable margin compression due to the accumulation of HQLA (typically low-yielding) may cause a growing focus on increasing commission and fee-based revenue streams to supplement this shortfall.
The longer-term Basel III liquidity ratio, the net stable funding ratio (NSFR), will come into effect for our banks as a prudential requirement from 1 January 2018. This new liquidity regulatory requirement may potentially pose problems given certain structural features of the South African economy and banking sector (including low household savings rates – seen as ‘stable funding’ – and contractual liquidity mismatches due to large, legacy mortgage portfolios funded by shorter term funding instruments).
The prudential regulatory environment continues to impact the major banks’ funding strategies and business models, which has led them to focus in recent years on enhancing and diversifying their retail and corporate transactional banking franchises, while strategically considering where these businesses and their product sets are best positioned within their diversified banking groups.
However, while low-RWA generating businesses are less capital intensive than investment banking businesses, the Basel framework effectively constrains the capital benefit through the non-risk-sensitive leverage ratio – which some commentators have referred to as the ‘new binding constraint’. Managing significant regulatory change will therefore continue to be at the top of the management agenda for banks.

36 PwCMajor banks analysis – South Africa September 2016
8. Two sides of a technological evolutionby Haskell Garfinkel, US Fintech Practice co-leader and Dean Nicolacakis, Principal, PwC
Fintech Q&A with our Global experts
What is fintech?Financial technology—fintech for short—describes the evolving intersection of financial services and technology.
The term can refer to start-ups, technology companies, or even legacy providers. The lines are blurring, and it’s getting harder to know where technology ends and financial services begin.
The term fintech is often tossed around in the media and in casual conversation. And while many use the term, its specific meaning often gets lost somewhere along the way.
Start-ups use technology to offer existing financial services at lower costs, and to offer new tech-driven solutions. Incumbent financial firms look to acquire or work with start-ups to drive innovation. Technology companies provide payment tools. These can all be seen as fintech.
Look beyond the name and you’ll see some of the most exciting industry developments in a generation. We caught up with Haskell Garfinkel and Dean Nicolacakis, PwC’s US Fintech Practice co-leads, to better understand the fintech ecosystem.

37 PwCMajor banks analysis – South Africa September 2016
8. Two sides of a technological evolution
Q. Who’s doing this? What does a typical fintech company look like?
A. When people think of fintech, they often focus on start-ups, breaking into areas that banks and other legacy financial institutions have dominated. But we think about all the players in a larger fintech ecosystem, which we refer to as the As, Bs, Cs, and Ds:
• As are large, well-established financial institutions such as Bank of America, Chase, Wells Fargo, and Allstate. We sometimes refer to these as ‘incumbents’.
• Bs are big tech companies that are active in the financial services space but not exclusively so, such as Apple, Google, Facebook, and Twitter.
• Cs are companies that provide infrastructure or technology that facilitates financial services transactions. This broad group includes companies like MasterCard, Fiserv, First Data, various financial market utilities, and exchanges such as NASDAQ.
• Ds are disruptors: Fast-moving companies, often start-ups, focused on a particular innovative technology or process. Companies include Stripe (mobile payments), Betterment (automated investing), Prosper (peer-to-peer lending), Moven (retail banking), and Lemonade (insurance).
Q. In a recent presentation, Haskell referred to ‘fintech as a verb’. What exactly did he mean by that?
A. Fintech isn’t static. We see it as the evolving intersection of financial services and technology. When we talk about the As, Bs, Cs, and Ds, we think of them as sectors in motion, all moving toward each other over time.
For example, financial institutions are becoming more technology focused. At the same time, big tech companies are offering peer-to-peer payment solutions over social networks and email. Meanwhile, disruptors are providing financial services that until recently you could get only from banks or financial advisors.
Q. Where have you seen the most disruption in financial services so far?
A. Fintech disruptors started by offering products and services in payments and peer-to-peer lending. Because of this, these have been the most disrupted areas to date. We can think of this as ‘fintech 1.0’, in which new market entrants have focused largely in the business-to-consumer (B2C) space.4
Q. What do you see unfolding over the next 12 months?
A. Looking forward, we expect fintech disruptors to continue to expand into other areas within financial services. There’s a lot of interest in areas like marketplace lending, credit underwriting, digital cash, treasury functions, deposits, and bill payments. We also anticipate a lot of activity in the robo-advice and wealth management space over the next year.
Perhaps more importantly, we predict a lot of fintech innovation in the next 12 months in the business-to-business (B2B) space. You can think of this as ‘fintech 2.0’. Here, expect tech innovations like blockchain to come online. As they do, they’ll start to radically alter business processes and drive down costs. We’re already witnessing a lot of firms exploring how they can apply these breakthrough technologies. Done right, there are some real efficiency gains to be had.5
Q. What should incumbents do about all this? Do they need a fintech strategy?
A. We see incumbent banks, asset managers and insurance companies looking for ways to play defence and offense at the same time. And that’s reasonable. You have to know how a disruptive fintech development could hurt your business, even as you’re looking for ways to take advantage of the technology.
The disruptors themselves take different approaches. Some target specific niche areas of the industry. Others are using new technologies, such as blockchain, in ways that will cross a lot of boundaries.
For incumbent financial institutions to succeed, they’ll have to do three things well:
• Continuously scan the environment to identify new threats and opportunities.
• Quickly understand the effect that emerging trends and technologies could have on their business.6
• Come up with solid strategies to react—from acquiring or working with fintech start-ups to building their own innovative solutions.
5 For more information on blockchain, see PwC Financial Services Institute, Making sense of bitcoin, cryptocurrency, and blockchain, Feb 2016.
6 For more information on our new platform focused on the impact of fintech innovation on financial services, visit http://www.strategyand.pwc.com/denovo
4 Of the many inaugural fintech ‘unicorns’ (the term that refers to companies with valuations of US$1 billion or more), most had core businesses focused on B2C lending and payments.

38 PwCMajor banks analysis – South Africa September 2016
8. Two sides of a technological evolution
Q. Do you have any recommendations for the longer term?
A. Everyone needs to recognise that this isn’t going away. It’s the ‘new normal’. Over the long term, financial institutions are going to have to make some fundamental changes. They’ll need to:
• Become more agile. Incumbents tend to have long planning and delivery cycles. They’ll need to change this as they incorporate emerging technology into their businesses and partner more with disruptors.
• Change the way they approach innovation. Most incumbents still struggle with finding and implementing innovative ideas. There are ways to do it well, though. In fact, they can learn from disruptors. Once you’ve figured out how to test-and-learn, a lot of other things fall into place.
• Manage the business from the ‘inside out’ instead of from the ‘outside in’. Fintech offers amazing potential, but that can actually be a distraction. Institutions have to start with their own needs in mind, rather than working backwards to figure out how to use the latest technology.
Growing focus on cybersecurity
by Junaid Amra, Associate Director, PwC South Africa
What is cybersecurity and how has it evolved?Back in the 1980’s, electronic networks were relatively secure and not interconnected. Consequently, the risk of external hacks was minimal. Business then moved to email and a conduit was created to facilitate emails entering and leaving organisations, creating an opportunity for external attackers to get in.
In the 1990s, electronic commerce (e-commerce) started taking off, which resulted in organisations exposing core systems that were never before reachable from outside. This was necessary to facilitate internet banking and other ‘e-services’. Fast-forward 20 years and we’re seeing an explosion in internet-enabled consumer technology – including mobile applications, connected vehicles, appliances and various other devices. We call this the Internet of Things (IoT).
The modern business ecosystem has changed dramatically in terms of how organisations are interconnected and there are many layers to consider. Most organisations have links to suppliers, regulators, services providers and various other entities. A security breach at any of these layers essentially presents a risk due to the hyper-connected environment organisations operate in and has opened up many opportunities for cybercrime to occur.
What key challenges are facing the financial sector from a cybersecurity perspective? PwC’s Global State of Information Security® survey is carried out every two years and is conducted among senior representatives globally. The top challenges identified in the financial services sector in the 2016 survey include:
Third-party security
Respondents ranked assessment of security capabilities of third-party vendors as the top challenge to their information security efforts. More than half said they would increase spending to better monitor third-party security in the next 12 months. Others are improving third-party cooperation through the use of risk-based security frameworks. These guidelines can also help companies exchange information more easily with third-party business partners and suppliers, and communicate expectations and concerns about services being provided.

39 PwCMajor banks analysis – South Africa September 2016
8. Two sides of a technological evolution
Third-party risk has arisen due to the interconnected environment in which we now operate, making it critical that organisations perform third-party due diligence in terms of the IT security posture of the service provider. For the most part, organisations tend to focus on the value, quality of service and costs of third-party service providers in evaluating whether or not to engage them. IT security is often overlooked in the process.
Another factor to consider given the nature of recent attacks: Do you want third-party organisations who are providing services to you to advertise this fact?
Essentially this provides attackers with valuable information on potential electronic links organisations have with each other and allows them to attempt to launch attacks through these channels.
Complex attacks from abroad
Another top challenge for FS firms is escalating security threats that originate outside their home country. Much of the concern revolves around foreign nation states, organised crime and activist/hacktivist groups. The worry is certainly warranted: we have seen striking year-on-year increases in incidents attributed to these highly-skilled adversaries.
FS firms have long dealt with sophisticated actors like organised crime, but some cite a worrisome trend: certain threat actors seem to be working together to carry out attacks. For instance, company employees may be colluding with external adversaries like hacktivists.
Perhaps even more menacing, some FS executives believe that organised crime and foreign nation states are joining forces to perpetrate cybercrime. Many organisations are fighting back with the use of advanced analytics to monitor for covert threats. Doing so has helped them better understand evolving external and internal security risks, as well as better monitor user behaviour and network activity.
Where cybersecurity trends can we expect?
More data-centric initiatives
It is now not possible to determine or protect the perimeter of networks. The thinking in this regard has shifted so cybersecurity initiatives will become more data centric. This means that security frameworks and methodologies will evolve to protect data given that it is not possible to prevent attackers from entering your networks.
Improvements to monitoring systems using big data and artificial intelligence
Most organisations still don’t have sufficient data internally to understand their own security baselines. In the current environment, it is critical that organisations start collecting this data. Behavioural analytics coupled with artificial intelligence will allow machine learning in assisting with detecting threats. Based on investigations performed up till now, we find that approximately two-thirds of organisations are alerted by external factors and not internal mechanisms when a cyber breach occurs.
Another factor to consider given the nature of recent attacks: Do you want third-party organisations who are providing services to you to advertise this fact?
Essentially this provides attackers with valuable information on potential electronic links organisations have with each other and allows them to attempt to launch attacks through these channels.
Use of mobile devices and payments
Globally, use of mobile devices and apps for consumer banking has exploded. To secure these interactions, FS respondents to the survey say mobile device security is a leading spending priority.
One way that FS firms are tackling the rise in mobile risks is through the use of advanced authentication. Many banks, for instance, allow customers to access their accounts using biometrics like voice and facial recognition – an approach that is more convenient for consumers and improves security for financial firms.
In addition to mobile banking, consumers are embracing the use of mobile payment systems. Already, most FS firms say they now accept some form of mobile payment. The next step will be to ensure robust, end-to-end security for these payment systems.
Another area in practice where we have found organisations to be weak is in properly evaluating consumer technology like mobile applications from a security perspective before launching the service. Very often the deployment of such initiatives are driven by business – without sufficient involvement of information security teams.
Another area in practice where we have found organisations to be weak is in properly evaluating consumer technology like mobile applications from a security perspective before launching the service. Very often the deployment of such initiatives are driven by business – without sufficient involvement of information security teams.

40 PwCMajor banks analysis – South Africa September 2016
8. Two sides of a technological evolution
Re-evaluating or tweaking of security operating models
Currently most organisations have group information security functions with links to risk or information security functions residing within individual business units. In terms of control, these entities within the business unit are not under the direct control of the group-wide information security function, leading to disparate working practices with regards to security within organisations.
Some organisations are optimising their models in order to deal with this issue and ensure closer working practices of all their information security teams.
Modern organisations, especially in the financial sector, cannot ignore technology adoption and trends. It is imperative that cognisance is taken of the risks associated with any deployment. The time spent up front on risk identification and remediation is well spent and can avoid serious issues at a later stage.

41 PwCMajor banks analysis – South Africa September 2016
9. The revolution in audit reports
Widely recognised as one of the most significant developments in auditing in recent history, the new and revised auditor reporting standard is intended to enhance the communication value of the auditor’s report.
In the aftermath of the financial crisis and with growing complexity in financial reporting, investor demands for more informative auditor’s reports increased.
For a long time, the evolution of audit reports proceeded at a leisurely pace. Historically, the audit report began its life with often fewer than 50 words, a theme that continued for decades, with the reports only expanding by a few words to a small number of standardised paragraphs.
Even with these minimal expansions, audit reports were still generic and used largely standard language. The moment of revolution for audit reports remained elusive. However, since 2013 some international territories, in particular the UK, have seen something of a revolution.
Extended audit report requirements were introduced for certain companies, which, in the world of auditing, was a bold move. With growing investor sentiment driving a call for momentum, standard-setting bodies determined that the audit report has the potential to be a valuable tool for delivering insights in its own right.

42 PwCMajor banks analysis – South Africa September 2016
9. The revolution in audit reports
International regulators, including the Public Company Accounting Oversight Board (PCAOB) in the US and the Financial Reporting Council in the UK, undertook projects to consider the need for change. The International Auditing and Assurance Standards Board (IAASB), the standard-setting body responsible for setting International Standards on Auditing (ISA), followed and ultimately took the lead in revisions to the global auditor reporting project.
The IAASB issued its final standards to enhance the auditor’s report on 15 January 2015. In South Africa, auditor reporting under the new model will come into effect for financial periods ending from 15 December 2016.
Building trust
The primary aims of the changes to the auditor’s report include:
• Insight To shed light on those matters, that in the auditor’s judgement, were of the most significance in the audit of the financial statements.
• Transparency To introduce an explicit statement regarding auditor’s independence in all reports and identify the engagement partner’s name in audit reports for listed entities.
• Readability To provide a restructured report that puts the audit opinion and entity-specific information first.
Today’s extended audit reports applied in the UK, Netherlands and some other territories are a significant departure from the boilerplate, binary opinion of a few years ago. They provide an insight into the audit process, audit quality and provide the auditor’s unique perspective on the risks and challenges faced by companies.
Feedback from our UK firm suggests shareholders are finding the changes are better meeting their needs. In fact, some shareholders have indicated that the audit report is among the first area they turn to in the annual report and believe it represents a valuable engagement tool, which they use to focus their discussions with directors.
Our global experience has found that the new audit reports not only enhance dialogue between shareholders and directors, but are also providing the key to understanding the holistic annual external audit process –explaining much more of what an auditor actually does.
Unlocking the audit ‘black box’ increases the level of trust that shareholders place in an audit, and therefore, in the financial statements and the companies themselves. By illuminating the multiple decisions and judgements taken, it allows the true complexity of the audit process to be understood and provides richer insight into the entity.
Summary of the key changes
Opinion Moves to the first section of the audit reportBasis for opinion Includes a new statement of the auditor’s independence.
Material uncertainty regarding going concern (if any)
Any material uncertainty with respect to going concern will be described in a separate section.
Key audit matters (KAMs) The most significant innovation in the new auditor’s reports is seen to be the introduction of ‘key audit matters’. This is the section of the new reports that shareholders have pointed to as being the most valuable.
The KAMs section will be required for audits of listed companies, but can also be included voluntarily by others.
Other information New section describing auditor’s responsibilities for ‘other information’ and the outcome of these procedures.
Responsibilities for the financial statements
Responsibilities expanded to explain management’s responsibilities with respect to going concern.
Auditor’s responsibilities More comprehensive description of auditor’s responsibilities, including a description of responsibilities with respect to going concern.
Date, address and signature Auditor’s reports for listed companies will now identify the engagement partner’s name.
• Key audit matters (KAMs) The auditor’s report of listed entities will include KAMs. These are defined as those matters that, in the auditor’s professional judgement, were of most significance in the audit of the financial statements of a given period. As KAMs are meant to focus on the audit and give further useful information in respect of the audit to assist the reader to understand the entity better, they are not intended to supply original information about the entity – that role rests with management. KAMs are selected from matters auditors are already required to communicate with those charged with governance. There is therefore a focus on those matters of most significance for KAM identification.

43 PwCMajor banks analysis – South Africa September 2016
9. The revolution in audit reports
• Communication with audit committees The ISA standard that deals with ‘communication with those charged with governance’ has been strengthened to ensure early and ongoing communication between the auditor and audit committee. This change was driven by the fact that it would be counterintuitive for investors if there is no strong linkage between what the auditor reports as a KAM and the level of information that the entity itself provides on the matter. However, while enhanced communication will strengthen the overall ‘audit dialogue’, it is within the auditor’s discretion to identify and decide what should be reported as a KAM.
• Going concern The ISA changes require that in the event that management applied the going concern basis of preparation inappropriately, the auditor should express an adverse audit opinion. It also requires that, if adequate disclosure of information about a material uncertainty did not take place, the auditor should express a qualified or adverse option and state in the basis for the qualification that material uncertainty exists over the entity’s ability to continue as a going concern, and that the financial statements do not adequately disclose such matters. Alternatively, if adequate disclosure about the material uncertainty was provided, the auditor may be able to issue an unmodified opinion, but highlight to users the material uncertainty disclosed by management. This will be done under a separate heading in the auditor’s report to ensure prominence. The going concern requirements are applicable to all audits performed under the ISAs and are not limited to listed entities.
Other changes include the positioning of the auditor’s opinion, which will move to the top of the audit report to enhance its prominence. There will also be a requirement that the engagement partner’s name must be disclosed, which will be of little significance in South Africa and many other countries, where this requirement is already in place.
Additionally, the auditor’s report must make reference to the relevant ethical requirements related to the audit process. A significant consequential change is the clarification of the auditor’s reporting requirement for other information that accompany the financial statements (typically the integrated report).
Currently, the auditor’s report is generally silent as to whether the other information was audited, read, reviewed or not considered at all. Going forward, the auditor’s report will clarify work done on other information beyond the primary financial statements.
Reactions to the new reports in the UK and the Netherlands
The shareholder community in the UK and the Netherlands have told us that the new reports have so far been a good start. While they value the binary ‘true and fair’ opinion, in the past they felt excluded from the audit process and findings in the companies in which they were invested because these were invisible to them. Most of the new reports, on the other hand, are seen as including useful, tailored and informative descriptions.
Examples of the types of matters that have been reported as KAMs include goodwill and credit impairments, revenue recognition, fair value measurements, pension accounting, IT environment and control deficiencies, litigation and claims, taxation, acquisitions and disposals and management override of controls.
In summary, KAMs are often related to areas in which management has exercised significant judgement in the accounting treatment and/or measurement or valuation.
Some key lessons learnt in applying the new audit reporting model includes avoiding ‘boilerplate’ wording, and recognising that the selection of KAMs and describing them is an iterative process.
Looking ahead
In preparation for audit reporting under the new regime, some South Africa companies have participated in a pilot to provide an indication of what their audit reports might look like under the new standards. Additionally, the pilot aims to test the process to ensure smooth implementation once the standards become effective.
The biggest challenge for the audit profession is to continue to work to change the perception of what the audit report is and what it can be. Drawing from international experiences, firms’ will be focusing on highlighting risks, scoping, materiality, systems and KAMs, among others, in order to help shareholders understand how ‘the story of the audit’ changes from year to year as implementation of the new reporting model is embedded.
44 PwCMajor banks analysis – South Africa September 2016
10. Hot off the press
RecentPwCfinancialservicesandrelatedpublications
How can CEOs and their top teams make sense of the swirl of technological breakthroughs affecting business today? How do they gauge the impact of artificial intelligence on their companies’ future compared with, say, the Internet of Things or virtual reality?
Given the sheer pace and acceleration of technological advances in recent years, business leaders can be forgiven for feeling dazed and perhaps a little frustrated. More and more C-suite executives are genuinely tech-savvy increasingly effective champions for their companies’ IT vision and more and more of them know that digital disruption can be friend as well as enemy. But it’s fair to say that most struggle to find the time and energy necessary to keep up with the technologies driving transformation across every industry and in every part of the world.
https://www.pwc.com/gx/en/issues/technology/tech-breakthroughs-megatrend.html
Tech breakthroughs megatrend: how to prepare for its impact
www.pwc.com/techmegatrend
How to prepare for the technological breakthroughs megatrend, and the eight technologies to start with
Tech breakthroughs megatrend:how to prepare for its impact

45 PwCMajor banks analysis – South Africa September 2016
9. Hot off the press
Being Better Informed is our quarterly financial services update for South Africa, which aims to keep you up to speed on significant regulatory, accounting and audit developments affecting the financial services industry.
In this edition we look at developments in the industry including:
• Financial Crime in the Spotlight
• Summary of the 2016 Retirement Fund Strategic Matters and Remuneration Survey
• Blockchain – disrupting central banks?
• Basel III monitoring gets going
• SARB Circular 4 of 2016: Implementation of the capital conservation buffer
• Insurance contracts project update
• Tax implications of the proposed TLAB amendments affecting banking institutions
http://www.pwc.co.za/en/industries/financial-services-industry/being-better-informed.html
Being better informed: FS regulatory, accounting and audit bulletin
Being better informedFS regulatory, accounting and audit bulletin
Financial Services Risk and Regulation
September 2016
• Financial Crime in the Spotlight• Summary of the 2016 Retirement Fund Strategic
Matters and Remuneration Survey• Blockchain – disrupting central banks?• Basel III monitoring gets going• SARB Circular 4 of 2016: Implementation of the capital
conservation buffer• Insurance contracts project update• Tax implications of the proposed TLAB amendments
affecting banking institutions
http://www.pwc.co.za/en/beingbetterinformed
In the past, high barriers of entry protected incumbent payments companies from new entrants. This is no longer the case and payments executives are well aware of this ongoing and imminent disruption.
Even though more than one in eight (13%) traditional payments companies believe that their business faces no fintech-related risk, those who recognise the threat are afraid that, on average, as much as 28% of their business could be lost to new players. This constitutes the highest percentage of all financial industry players. Payments is also the sector with the highest proportion of participants that fear they could lose more than 60% or even all of their business to fintech entrants.
http://www.pwc.com/gx/en/industries/financial-services/publications/payments-in-the-wild-tech-world.html
Payments in the Wild Tech World: Digitisation and changing customer expectations
The very simplicity that underlies banking products and processes for savings, lending and business services renders the sector ripe for disruption. The majority of financial sector executives (73%) perceive consumer banking as the one most likely to be disrupted by fintech.
New entrants see opportunity in disaggregating the components of traditional banking and offering targeted solutions, which with better serve both retail consumers and businesses. In parallel, the threats posed by fintech companies have the ability to disrupt four categories of incumbents’ business – market share, margins, information security/privacy and customer churn – at higher rates when compared to other financial sectors.
http://www.pwc.com/gx/en/industries/financial-services/publications/fintech-is-reshaping-banking.html
Customers in the spotlight: How fintech is reshaping banking
Payments in the Wild Tech World Digitisation and changing customer expectations
pwc.com/fintechreport
87% Most payments companies believe that some part of their business is at risk to FinTechs
35%More than one-third of traditional players launch their own FinTech subsidiaries
Global FinTech Survey 2016
Customers in the spotlightHow FinTech is reshaping banking
pwc.com/fintechreport
76%More than three in four banking respondents fear some part of their business is at risk to FinTech
42%Many banks engage in joint partnerships with FinTech companies
Global FinTech Survey 2016

46 PwCMajor banks analysis – South Africa September 2016
9. Hot off the press
Managers from more than 2 000 companies in 26 countries answered questions for this study. The figures and forecasts they provided tell their own story: the average level of digitisation is expected to increase from 33% to 72% within five years.
Companies are budgeting approximately 5% of their turnover annually for investment in digitisation. This amounts to a total of over US$900 billion per year – based only on the companies surveyed.
The study also shows that:
• 87% of SA companies plan to introduce new digital products and data-based services over the next five years;
• 83% of SA respondents expect data analytics will have a significant influence on their decision-making processes in five years’ time; and
• Only 10% of local respondents rate the maturity of their data analytics capabilities as advanced.
http://www.pwc.co.za/en/publications/industry-40.html
Industry 4.0: Building the digital enterprise
In the aftermath of a raft of media commentary and expert analyses of the likely long-term implications of the Brexit referendum vote, it’s fairly clear that the level of global socio-economic and political uncertainty has been raised.
Brexit – weathering the storm in South Africa
www
Literally thousands of existing treaties and regulations that impact on UK businesses need to be nullified, but many of them will eventually be re-negotiated.
Dr Roelof Botha, Economic Advisor to PwC
July 2016
Short-term volatilityAs a general rule, members of the global equity investment fraternity are wary of undue uncertainty. This has been vividly illustrated by declining equity market prices across the globe and currency weakness in Europe in the immediate aftermath of the narrow majority vote for the UK to exit the European Union (EU).
Much of the equity market losses outside of Europe have, however, been recouped since the referendum. It’s important to note that global investment funds haven’t dried up, but are simply being diverted to so-called safe haven destinations, including precious metals and US bonds.
Several economic research agencies have warned against exaggerating the anticipated economic impact of the referendum result. Due to its unprecedented nature, short-term volatility of key indicators was predictable, but financial markets are bound to come to grips with the reality that Britain will remain an integral and pivotal part of Europe.
Economic prowessThe UK is classified by the International Monetary Fund as a major advanced economy and is a member of the seven most influential countries in the world (the G-7 group). It also enjoys a per capita GDP of $44,000, which is more than four times higher than the world average. Furthermore, currency depreciation has automatically lifted the competitiveness of the British economy, which borrows in its own currency and does not have much to fear from liquidity constraints.
There will be significant uncertainty over the coming months as the detailed political and legal issues are worked out, and business confidence may be impacted. In due course, markets are likely to develop a greater understanding of two key aspects of Brexit that are likely to assist a return to greater financial and currency stability.
Firstly, it’ll take several years to complete the arduous legal and administrative processes required for the exit from the EU. Literally thousands of existing treaties and regulations that impact on UK businesses need to be nullified, but many of them will eventually be re-negotiated.
One of the uncontested tenets of economic theory is that international trade benefits both participants, be they individual countries or regions. Norway represents an informative case study of a country that’s not a member of the EU. While not a member of the European Union, in return for access to many of the economic privileges of EU membership, they agree to abide by the internal market’s rules, such as social or environmental legislation, and pay smaller contributions than EU members.
Potential for deregulationA second issue that elucidates the outcome of the referendum vote is the zealousness with which the EU has drawn up thousands of new regulations and directives, particularly over the last six years.
In the aftermath of a raft of media commentary and expert analysis of the likely long-term implications of the Brexit referendum vote, it’s fairly clear that the level of global socio-economic and political uncertainty has been raised.
http://www.pwc.co.za/en/assets/pdf/brexit-sa.pdf
Brexit – weathering the storm in South Africa
2016 Global Industry 4.0 Survey What we mean by Industry 4.0 / Survey key findings / Blueprint for digital success
www.pwc.com/industry40
Industry 4.0: Building the digital enterprise
2000+respondents in 26 countries
US$493 bn in digital revenue gains p.a.
US$421 bn p.a. in cost and efficiency gains
US$907 bn in annual digital investments
Non-executive directorsPractices and remuneration trends report
8th edition
January 2015
South Africa
www.pwc.co.za
The responsibility of directing corporate citizens in today’s environment is a daunting task entailing ever-increasing responsibility for directors. In this issue we examine seven African stock exchanges and look at the level of NED fees paid.
We look at:
• Non-executive directors’ fees: PAYE or VAT?
• Shaping the board of the future
• Profile of a non-executive director
• Regulatory update
• Environmental and social investing
• London FTSE 100
• Meetings
• African stock exchanges
http://www.pwc.co.za/en/publications/non-executive-directors-report.html
Non-Executive directors – Practices and Fees Trends Report – South Africa 2015

47 PwCMajor banks analysis – South Africa September 2016
9. Hot off the press
This publications expands on a previous paper and sets out three possible scenarios for the future of banking in Europe:
1. Established banks adapt and consolidate, but not before challengers have taken a permanent, sizeable (20%) share of the market;
2. A tipping point is reached and established banks either fade away or are reduced to playing a utility role; this trend could be accelerated by a new banking crisis triggered by falling investment in incumbents; or
3. Incumbents and challengers find a symbiotic, collaborative relationship, the industry addresses itself collectively to customer service innovation and a new banking ecosystem emerges.
The report argues that an evolved banking ecosystem, in Europe and beyond, is both the most likely and most desirable outcome (a form of scenario 3) and sets out key steps that will lead banking, and banks, to this path.
http://www.pwc.com/gx/en/issues/economy/future-shape-of-banking-in-europe.html
The future shape of banking in Europe
It’s not just about the financialsThe widening variety of factors used in investment decision making
www.pwc.com
August 2016
In association with
Investment professionals are becoming more and more interested in understanding how environmental, social and governance (ESG) matters affect businesses. So we asked them to talk candidly and in some depth about how they use ESG information, whether it is growing in importance, how well they think companies do in communicating it, where the gaps are in ESG reporting and how they think Integrated Reporting can help.
This report, produced with the International Integrated Reporting Council, includes interviews with senior investment professionals from some of the world’s biggest investment institutions, with almost US$2 trillion of assets under management between them.
Key findings:
• Tide of opinion is turning for ESG information. Far from considering it as ‘greenwashing’, the investment professionals we spoke with firmly believe relevant ESG information captures important aspects of corporate performance.
• They were clear that ESG information is not always non-financial in nature. Instead, they repeatedly cited it as a leading indicator for future financial impacts.
• Rather than viewing ESG information as a way of explaining how the company affects the environment, investment professionals are starting to use it to understand how the environment (and other risk areas) affect the company – and what they’re doing about it.
http://www.pwc.com/gx/en/services/audit-assurance/corporate-reporting/investor-view/iirc-investor-study.html
It’s not just about the financials: The widening variety of factors used in investment decision making

48 PwCMajor banks analysis – South Africa September 2016
9. Hot off the press
Coming soon
African Banking Survey
This highly-anticipated survey on banking in South Africa and across Africa highlights strategic and emerging issues in banking. Through our extensive face-to-face and online interviews with a number of banking CEOs and senior executives, our report unpacks the key trends in the industry and provides perspectives on how banking in South Africa and across the continent could evolve.

49 PwCMajor banks analysis – South Africa September 2016
11. Key banking statistics

50 PwCMajor banks analysis – South Africa September 2016
11. Key banking statistics
Key banking statistics – 1H16
Rm BAGL FSR NED SBK Combined Growth
1H16 2H15 1H15 2H14 1H16 2H15 1H15 2H14 1H16 2H15 1H15 2H14 1H16 2H15 1H15 2H14 1H16 2H15 1H15 2H14 1H16 v 1H15
1H16 v 2H15
Balance sheetTotal assets 1 142 469 1 144 604 1 038 945 991 414 1 149 326 1 139 523 1 059 262 980 176 944 188 925 726 866 624 809 313 1 549 292 1 578 859 1 471 293 1 550 261 4 785 275 4 788 712 4 436 124 4 331 164 7,9% -0,1%
Gross Loans and advances
818 303 806 410 767 395 724 681 867 982 844 691 793 964 736 523 704 871 693 043 659 848 624 116 1 095 230 1 100 047 1 066 107 948 251 3 486 386 3 444 191 3 287 314 3 033 571 6,1% 1,2%
Total deposits 754 895 751 399 700 267 677 863 919 930 899 619 865 521 801 698 741 712 725 851 690 495 653 450 1 214 408 1 201 549 1 146 843 1 064 376 3 630 945 3 578 418 3 403 126 3 197 387 6,7% 1,5%
Risk weighted assets 698 685 702 663 647 472 619 705 698 732 680 400 630 441 598 698 507 466 501 243 465 544 440 696 912 822 944 039 856 380 868 187 2 817 705 2 828 345 2 599 837 2 527 286 8,4% -0,4%
Asset quality & provisioning Non-performing loans 31 409 27 980 26 758 27 367 21 282 19 409 17 551 17 970 18 437 17 559 16 695 15 846 36 344 35 128 32 681 30 507 107 472 100 076 93 685 91 690 14,7% 7,4%
Impairments -19 431 -17 100 -16 448 -16 130 -16 577 -16 158 -14 793 -14 994 -11 539 -11 411 -11 004 -11 095 -23 796 -22 652 -20 241 -18 707 -71 343 -67 321 -62 486 -60 926 14,2% 6,0%
Collective provisions -5 666 -5 027 -4 790 -4 359 -8 359 -7 988 -7 760 -7 665 -4 856 -4 747 -4 386 -4 263 -7 623 -6 790 -6 114 -5 315 -26 504 -24 552 -23 050 -21 602 15,0% 8,0%
Individually assessed provisions
-13 765 -12 073 -11 658 -11 771 -8 218 -8 170 -7 033 -7 329 -6 683 -6 664 -6 618 -6 832 -16 173 -15 862 -14 127 -13 392 -44 839 -42 769 -39 436 -39 324 13,7% 4,8%
Non-performing loans (% of advances)
3,8% 3,5% 3,5% 3,8% 2,5% 2,3% 2,2% 2,4% 2,6% 2,5% 2,5% 2,5% 3,3% 3,2% 3,1% 3,2% 3,1% 2,9% 2,8% 3,0%
Impairment charge (% of average advances)
1,5% 1,0% 1,1% 0,9% 1,0% 0,8% 0,7% 0,9% 0,7% 0,8% 0,8% 0,8% 1,1% 0,7% 1,0% 0,9% 1,0% 0,8% 0,9% 0,8% 16,9% 26,9%
Impairment coverage ratio
61,9% 61,1% 61,5% 58,9% 77,9% 83,3% 84,3% 83,4% 62,6% 65,0% 65,9% 70,0% 65,5% 64,5% 61,9% 61,3% 67,0% 68,5% 68,4% 68,4% -2,1% -2,2%
Implied loss given default
43,8% 43,1% 43,6% 43,0% 38,6% 42,1% 40,1% 40,8% 36,2% 38,0% 39,6% 43,1% 44,5% 45,2% 43,2% 43,9% 40,8% 42,1% 41,6% 42,7% -2,0% -3,1%
Profit & loss analysis Net interest income 21 093 19 944 18 463 18 404 22 907 20 823 19 562 19 048 13 028 12 210 11 675 11 698 27 775 25 861 23 453 23 590 84 803 78 838 73 153 72 740 15,9% 7,6%
Non interest income 15 415 14 831 13 960 14 037 18 080 16 909 16 595 16 114 11 357 11 298 10 450 10 832 22 088 22 006 19 795 20 829 66 940 65 044 60 800 61 812 10,1% 2,9%
Total operating income
36 508 34 775 32 423 32 441 40 987 37 732 36 157 35 162 24 385 23 508 22 125 22 530 49 863 47 867 43 248 44 419 151 743 143 882 133 953 134 552 13,3% 5,5%
Total operating expenses
-20 759 -20 252 -18 768 -19 380 -21 740 -20 130 -18 900 -18 724 -14 152 -13 987 -12 906 -13 157 -29 242 -27 701 -25 714 -25 592 -85 893 -82 070 -76 288 -76 853 12,6% 4,7%
Core earnings 15 749 14 523 13 655 13 061 19 247 17 602 17 257 16 438 10 233 9 521 9 219 9 373 20 621 20 166 17 534 18 827 65 850 61 812 57 665 57 699 14,2% 6,5%
Impairment charge -5 197 -3 370 -3 550 -2 722 -4 014 -3 145 -2 701 -3 086 -2 211 -2 482 -2 307 -2 173 -5 815 -4 339 -5 032 -4 057 -17 237 -13 336 -13 590 -12 038 26,8% 29,3%
Other income/(expenses)
55 58 71 71 640 813 757 742 -427 294 436 48 -85 -2 187 445 1 363 183 -1 022 1 709 2 224 -89,3% <-100%
Discontinued operations
- - - - - - - - - - - - - -261 3 002 -2 713 - -261 3 002 -2 713 -100,0% -100,0%
Income tax expenses
-2 997 -2 992 -2 907 -2 859 -3 227 -3 557 -3 352 -3 274 -1 944 -1 699 -1 820 -1 841 -3 462 -3 181 -2 689 -3 344 -11 630 -11 429 -10 768 -11 318 8,0% 1,8%
Profit for the period 7 610 8 219 7 269 7 551 12 646 11 713 11 961 10 820 5 651 5 634 5 528 5 407 11 259 10 198 13 260 10 076 37 166 35 764 38 018 33 854 -2,2% 3,9%
Attributable earnings 7 019 7 561 6 770 7 050 12 083 10 480 11 319 10 304 5 442 5 393 5 328 5 198 9 924 9 068 12 301 8 639 34 468 32 502 35 718 31 191 -3,5% 6,0%
Headline earnings from continuing operations
7 252 7 532 6 755 6 922 11 988 10 399 11 240 9 901 5 427 5 508 5 323 5 281 9 973 10 306 9 445 7 880 34 640 33 745 32 763 29 984 5,7% 2,7%

51 PwCMajor banks analysis – South Africa September 2016
11. Key banking statistics
Rm BAGL FSR NED SBK Combined Growth
1H16 2H15 1H15 2H14 1H16 2H15 1H15 2H14 1H16 2H15 1H15 2H14 1H16 2H15 1H15 2H14 1H16 2H15 1H15 2H14 1H16 v 1H15
1H16 v 2H15
Key data Other operating income (% of total income)
42,2% 42,6% 43,1% 43,3% 44,1% 44,8% 45,9% 45,8% 46,6% 48,1% 47,2% 48,1% 44,3% 46,0% 45,8% 46,9% 44,3% 45,4% 45,5% 46,0% -2,6% -2,4%
Net interest margin (% of average interest earning advances)
5,0% 4,9% 4,7% 4,7% 5,6% 5,0% 4,9% 5,3% 3,4% 3,2% 3,4% 3,5% 4,7% 4,3% 4,4% 5,1% 4,7% 4,4% 4,3% 4,6% 7,2% 6,3%
Standardised efficiency ratio
53,4% 56,1% 55,9% 57,2% 52,0% 51,1% 51,2% 50,8% 57,1% 56,4% 55,8% 56,5% 56,8% 56,7% 56,7% 53,9% 54,8% 55,1% 54,9% 54,6% -0,1% -0,4%
Return on equity 16,1% 17,6% 16,4% 16,7% 24,6% 23,4% 25,4% 24,0% 14,6% 15,4% 16,0% 16,5% 15,2% 15,0% 14,8% 12,9% 17,6% 17,9% 18,2% 17,5% -2,9% -1,3%
Total number of staff 41 247 41 018 41 723 41 644 45 100 43 406 42 263 39 508 31 915 31 312 30 739 30 499 48 645 47 958 50 960 42 642 166 907 163 694 165 685 154 293 0,7% 2,0%
Capital ratios CET 1 12,1% 11,9% 11,7% 11,9% 13,9% 13,7% 14,1% 13,8% 11,6% 11,3% 11,4% 11,6% 13,2% 12,9% 13,2% 12,4% 12,7% 12,5% 12,6% 12,4% 0,8% 2,0%
Tier 1 12,6% 12,6% 12,3% 12,7% 14,6% 14,4% 14,9% 14,7% 12,5% 12,0% 12,1% 12,5% 13,6% 13,3% 13,7% 12,9% 13,3% 13,1% 13,3% 13,2% 0,6% 1,9%
Tier 2 2,0% 1,9% 1,8% 1,7% 2,3% 2,2% 1,9% 1,8% 2,0% 2,1% 2,4% 2,1% 2,3% 2,4% 2,4% 2,6% 2,2% 2,2% 2,1% 2,1% 1,2% 0,0%
Total 14,6% 14,5% 14,1% 14,4% 16,9% 16,6% 16,8% 16,5% 14,5% 14,1% 14,5% 14,6% 15,9% 15,7% 16,1% 15,5% 15,5% 15,2% 15,4% 15,3% 0,7% 1,6%

52 PwCMajor banks analysis – South Africa September 2016
12. Industry data
GDP growth
Source: Statistics SA
20092006 2007 2008 2010 2011 2012 2013 2014 2015 2016
Q2
Q1
Q4
Q3
Q2
Q1
Q4
Q3
Q2
Q1
Q4
Q3
Q2
Q1
Q4
Q3
Q2
Q1
Q4
Q3
Q2
Q1
Q4
Q3
Q2
Q1
Q4
Q3
Q2
Q1
Q4
Q3
Q2
Q1
Q4
Q3
Q2
Q1
Q4
Q3
Q2
Q1-8
-6
-4
-2
0
2
4
6
8
GD
P g
row
th %

53 PwCMajor banks analysis – South Africa September 2016
12. Industry data
BAGL House Price Index
Source: BAGL
0
200
400
600
800
1000
1200
1400
1600
Q2
Q1
Q4
Q3
Q2
Q1
Q4
Q3
Q2
Q1
Q4
Q3
Q2
Q1
Q4
Q3
Q2
Q1
Q4
Q3
Q2
Q1
Q4
Q3
Q2
Q1
Q4
Q3
Q2
Q1
Small
2009 2010 2011 2012 2013 2014 2015 2016
Medium Large
New vehicles sold
Source: SARB
20082006 2007 2009 2010 2011 2012 2013 2014 2015 2016
Q2
Q1
Q4
Q3
Q2
Q1
Q4
Q3
Q2
Q1
Q4
Q3
Q2
Q1
Q4
Q3
Q2
Q1
Q4
Q3
Q2
Q1
Q4
Q3
Q2
Q1
Q4
Q3
Q2
Q1
Q4
Q3
Q2
Q1
Q4
Q3
Q2
Q1
Q4
Q30
20
40
60
80
100
120
’000
veh
icle
s

54 PwCMajor banks analysis – South Africa September 2016
12. Industry data
Industry credit impairments
Source: SARB
Total assets
2008 2010 2011 2012 2013 2014 2015 20162009
Specific impairment %
0
1000
2000
3000
4000
5000
6000
Rm
%
0,80
0,85
0,900,95
1,001,05
1,10
1,151,20
1,251,30
1,351,40
1,451,50
1,55
1,60
Interest rates
Source: SARB / Investing.com
Q4
Q3
Q2
Q1
Q4
Q3
Q2
Q1
Q4
Q3
Q2
Q1
Q4
Q3
Q2
Q1
Q4
Q3
Q2
Q1
Q4
Q3
Q2
Q1
Q4
Q3
Q2
Q1
Q4
Q3
Q2
Q1
Q4
Q3
Q2
Q1
Q4
Q1
Q2
Q3
Q20
2
4
6
8
10
12
14
Q1
Q3
20082006 2007 2009 2010 2011 2012 2013 2015 20162014
Repo rate R 157 Bond yield
%

55 PwCMajor banks analysis – South Africa September 2016
12. Industry data
Growth in mortgage advances
Source: SARB
0
10
20
30
40
50
60
Q2
Q1
Q4
Q3
Q2
Q1
Q4
Q3
Q2
Q1
Q4
Q3
Q2
Q1
Q4
Q3
Q2
Q1
Q4
Q3
Q2
Q1
Q4
Q3
Q2
Q1
Q4
Q3
Q2
Q1
Q4
Q3
Q2
Q1
Q4
Q3
Q2
Q1
Q4
Q3
Q2
2008 2009 2010 2011 2012 2013 2014 2015 20162006
%
2007
Industry credit extension (Rtn)
Source: SARB
0,0
0,5
1,0
1,5
2,0
2,5
3,0
3,5
20082007 2009 2010 2011 2012 2013 2015 2016
Q4
Q3
Q2
Q1
2014
Q4
Q3
Q2
Q1
Q2
Q1
Q4
Q3
Q2
Q1
Q4
Q3
Q2
Q1
Q4
Q3
Q2
Q1
Q4
Q3
Q2
Q1
Q4
Q3
Q2
Q1
Q4
Q3
Q2
Q1
Q4
Q3
%

56 PwCMajor banks analysis – South Africa September 2016
13. Contacts
Johannes Grosskopf Financial Services Industry Leader: Africa PwC Africa
+27 11 797 4346 [email protected]
Costa Natsas Financial Services Risk and Regulation PwC Africa
+27 11 797 4105 [email protected]
Stefan Beyers Banking & Capital Markets Partner PwC Africa
+27 11 797 4690 [email protected]
Contributors
Louwrens van Velden Rivaan Roopnarain Dale Stonebridge Hemal Kana Claire Hutchinson Prashani Veerasamy

This document is protected under the copyright laws of South Africa and other countries as an unpublished work. This document contains information that is proprietary and confidential to PricewaterhouseCoopers Incorporated, which shall not be disclosed outside the recipient’s company or duplicated, used or disclosed in whole or in part by the recipient for any purpose other than to evaluate this proposal. Any other use or disclosure in whole or in part of this information without the express written permission of PricewaterhouseCoopers Incorporated is prohibited.
© 2016 PricewaterhouseCoopers (“PwC”), a South African firm, PwC is part of the PricewaterhouseCoopers International Limited (“PwCIL”) network that consists of separate and independent legal entities that do not act as agents of PwCIL or any other member firm, nor is PwCIL or the separate firms responsible or liable for the acts or omissions of each other in any way. No portion of this document may be reproduced by any process without the written permission of PwC (16-19403)