maintenance, validation, and recalibration of liquid … papers/2009cross... · the validation and...
TRANSCRIPT

NIST Special Publication 1088
Maintenance, Validation, and Recalibration of Liquid-in-Glass
Thermometers
C. D. Cross W. W. Miller D. C. Ripple G. F. Strouse
i

NIST Special Publication 1088
Maintenance, Validation, and Recalibration of Liquid-in-Glass
Thermometers
C. D. Cross W. W. Miller D. C. Ripple G. F. Strouse
Thermometry Group, Process Measurements Division Chemical Science and Technology Laboratory
January 2009
U.S. Department of Commerce Carlos M. Gutierrez, Secretary
National Institute of Standards and Technology
Patrick Gallagher, Deputy Director
ii

iii
Certain commercial entities, equipment, or materials may be identified in this
document in order to describe an experimental procedure or concept adequately. Such identification is not intended to imply recommendation or endorsement by the
National Institute of Standards and Technology, nor is it intended to imply that the entities, materials, or equipment are necessarily the best available for the purpose.
National Institute of Standards and Technology Special Publication 1088 Natl. Inst. Stand. Technol. Spec. Publ. 1088, 32 pages (February 2009)
CODEN: NSPUE2

Abstract Liquid-in-glass thermometers are pervasive throughout industry. These thermometers provide a convenient method for measuring temperature over a broad range of applications with reasonable stability and accuracy. However, like all thermometers, liquid-in-glass thermometers are subject to drift as a function of time and maximum temperature of use. This paper describes methods for the validation and recalibration of previously calibrated liquid-in-glass thermometers to maintain the metrological traceability established with the initial calibration. Procedures and examples are given for visually inspecting a thermometer, using an ice point for a single-point recalibration, and determining uncertainties for thermometers with a single-point recalibration. We discuss when a single-point recalibration is acceptable, and when a full recalibration is needed. Key words: bulb-volume change, calibration, ice point, liquid-in-glass thermometer, mercury thermometer, organic thermometer, recalibration, thermometer, validation. Table of Contents 1. Introduction................................................................................................................................. 1 2. Description of liquid-in-glass thermometers .............................................................................. 2 3. Causes of instrument drift ........................................................................................................... 4 4. Periodic maintenance plan .......................................................................................................... 5 5. Visual inspection......................................................................................................................... 6 6. Joining separated columns .......................................................................................................... 8
6.1 Mercury-filled thermometers .......................................................................................... 8 6.2 Organic-filled thermometers......................................................................................... 10
7. Testing and recalibration at the ice point.................................................................................. 11 7.1 Preconditioning................................................................................................................... 11 7.2 The ice point as a reference point ....................................................................................... 11 7.4 Recalibrating liquid-in-glass thermometers—Method I ..................................................... 12 7.5 Recalibration of liquid-in-glass thermometers—Method II ............................................... 13 7.6 Recommended recalibration interval .................................................................................. 15 7.7 Preparation of an ice point .................................................................................................. 15 7.8 Reading thermometers at the ice point................................................................................ 16 7.9 Uncertainties with correction.............................................................................................. 19
8. Organic-liquid thermometers .................................................................................................... 22 9. Summary of recommendations ................................................................................................. 22 Acknowledgments......................................................................................................................... 22 References..................................................................................................................................... 23 Appendix A. Analysis of historical data obtained at NIST ......................................................... 24 Appendix B. Validation of correction method at 150 °C and below........................................... 26
iv

1. Introduction Liquid-in-glass thermometers have a proven history of convenience, stability, and accuracy for a broad range of applications. Nonetheless, like all other thermometers, liquid-in-glass thermometers may drift, resulting in changes of the indicated temperature versus true temperature. Reversible thermometer changes include:
• separation of the liquid column, • introduction of gas bubbles into the column or bulb, or • temporary bulb volume changes when a thermometer is used shortly after exposure to a
higher temperature.
Irreversible thermometer changes include • changes in bulb volume, • microscopic alterations in glass geometry at elevated temperature, • microscopic cracking, • degradation of the thermometer liquid, or • obvious physical breakage.
This document presents:
• methods for visual inspection of thermometers, • methods for user validation of thermometers, and • guidance for recalibration of thermometers.
The document presumes that the thermometer was originally calibrated by the manufacturer or a competent laboratory. The linkage of a measurement back to primary temperature standards is termed metrological traceability [1]. Traceability to the standards maintained by NIST consists of:
• maintaining an unbroken chain of measurements back to NIST standards, with documented measurement uncertainties, and
• assuring the continued quality of the measurement artifacts used.
Note that many different thermometer types may be used to perform traceable measurements. Types other than liquid-in-glass thermometers include platinum resistance thermometers (abbreviated PRTs, or RTDs for resistance temperature detectors), thermistors, and thermocouples. The user should carefully consider the best choice of thermometer type for a given application [2]. Several steps are necessary to assure the continued validity of the calibration results of a liquid-in-glass thermometer. There are three separate checks, applied in various combinations for different thermometer types:
1. visual inspection to ensure that the liquid column has not separated or the thermometer has not otherwise degraded,
2. calibration at the ice point (or another point on the low end of the scale), and 3. full recalibration.
1

For mercury-filled thermometers used at temperatures of 200 °C and below, a single point recalibration at the ice point (0 °C) may be used, and a full recalibration is not necessary. However, for thermometers with contraction chambers and fine graduations, full recalibration is likely necessary for the best performance. Thermometers used at temperatures of 300 °C and above are known to undergo changes in the capillary glass, leading to significant drift in indications; periodic recalibrations are needed for these thermometers. In the temperature range 200 °C to 300 °C, little data on the reliability of a single-point recalibration are available; we recommend periodic recalibration for this usage range as well. Additionally, little data are available for plastic-coated thermometers, and we recommend periodic recalibration for this type of thermometer. Because the thermal expansion of plastics do not match that of glass, coatings may cause unpredictable changes in thermometer readings, especially for high-precision work.
NOTE: Extreme care must be taken when working with mercury thermometers to avoid breakage of the thermometer. Operators should be familiar with the health risks of mercury, and with laboratory policies and safety procedures in the event of a mercury spill. Mercury is a potent neurotoxin and is categorized as a hazardous material. The U.S. Environmental Protection Agency [3] and the Occupational Safety and Health Administration [4] provide additional information on health and environmental hazards, and control of those hazards.
Thermometers filled with organic liquids present special issues that could result in aging behavior different than mercury-filled thermometers:
• the smaller ratio of bulb volume to capillary volume may amplify any changes in the capillary;
• the organic liquids may be less chemically stable than mercury, especially at elevated temperatures; and
• the interaction of the liquids with the capillary wall may change. The methods for visual inspection and checks at the ice point provide users valuable tools to check the performance of organic-filled thermometers, but we do not recommend the single point recalibration of organic liquid filled thermometers at this time. Research on this topic is still needed. The recommendations in this document are based on the data contained in Appendices A and B. This document supersedes NIST Special Publication SP819 [5].
2. Description of liquid-in-glass thermometers In this section, we give a brief description of various types of liquid-in-glass thermometers (see Refs. [6,7] for more details). Liquid-in-glass thermometers consist of a liquid contained in a glass envelope. Figure 1 provides an illustration of thermometer features and pictures of various construction types. The glass envelope has a bulb, which is placed in the region where the temperature is to be measured, and a narrow, graduated capillary, which is part of the thermometer stem. The liquid has a higher thermal expansion than the glass. As the temperature
2

a)
b)
c)
d)
e)
Fig. 1. Schematic showing the parts of a liquid-in-glass thermometer and pictures of various construction combinations for both partial and total immersion thermometers: a) principal features of a liquid-in-glass thermometer, b) partial immersion thermometer with an auxiliary scale, contraction chamber, and immersion line, c) partial immersion thermometer with no auxiliary scale and no contraction chamber, d) total immersion thermometer with an auxiliary scale and contraction chamber, and e) total immersion thermometer with no auxiliary scale and no contraction chamber.
3

increases, expansion of the liquid in the bulb forces the liquid to rise in the capillary. Reading the liquid meniscus position on the scale provides the measured value of temperature. If the thermometer is calibrated, an additional correction accounting for the error of the thermometer is added to the measured value. When a partial-immersion thermometer is used, the bulb and the portion of the stem up to the immersion line should be exposed to the temperature being measured, with the remainder of the stem exposed to ambient conditions. When a total immersion thermometer is used, the bulb and the entire portion of the stem containing liquid, except for the last 1 cm, are exposed to the temperature being measured. The thermal expansion of the liquid contained in the stem of the thermometer significantly affects the thermometer reading. Because the stem of a partial-immersion thermometer is not maintained at a controlled temperature, partial-immersion thermometers have a greater sensitivity to variations in ambient temperature and generally poorer reproducibility than total-immersion thermometers. The sensitivity to ambient temperature is approximately a factor of 6 higher for thermometers filled with organic liquids than for mercury-filled thermometers. Use of either a partial- or total-immersion thermometer at an incorrect immersion can result in large measurement errors, due to the incorrect stem temperature. The expansion chamber reduces the pressure rise inside the thermometer as the liquid rises up the scale. Some thermometers feature a contraction chamber, which allows a reduction in the length of the stem. An auxiliary scale, separated from the main scale by a contraction chamber, allows measurement at the ice point to check for changes in the bulb volume.
3. Causes of instrument drift Like all temperature measuring devices, a liquid-in-glass thermometer may indicate different values at a given temperature over a period of time. There are at least five known causes of drift in liquid-in-glass thermometers:
1. Change in bulb volume, 2. Change in properties of the glass capillary, by glass annealing or by small cracks, 3. Separation of the liquid column, 4. Movement of foreign objects inside of the glass capillary, and 5. Degradation of the liquid.
Bulb volume changes may be either permanent, after extended or high-temperature use, or temporary. (Temporary bulb-volume changes occur when the thermometer is heated above room temperature. However, the bulb contracts to or near the original volume within 72 h after cooling to room temperature. This will be discussed in Sections 7.4 and 7.5.) If the volume of the bulb expands, the thermometer will give a lower reading at a specified temperature, compared to its reading with the original bulb volume. Changes in the volume of the glass capillary are generally negligible for thermometers used below 150 °C and often tolerable up to 200 °C. At temperatures near 300 °C and above, irreversible changes in the capillary (and contraction chamber, if present) are common.
4

Separation of the liquid column can be corrected, using the procedures of Section 6. Known circumstances that promote separation are:
• use of organic-liquid thermometers above 100 °C or below −100 °C, • storage of organic-liquid thermometers in a horizontal position, and • shipment of thermometers, or similar rough handling.
Small droplets may also separate from the main column. Again, the procedures of Section 6 can rejoin these droplets to the main liquid column. Condensation of liquid is sometimes observed with thermometers filled with organic liquids. If condensation droplets form routinely, one should consider using a thermometer with a different filling liquid or another type of thermometer. Any thermometer that has visible foreign objects inside the glass capillary, such as glass chips or any other particles, should be removed from service. Liquid degradation is rare, but the thermometer should be replaced if a change in the color of the liquid, or any byproducts of liquid oxidation or breakdown in the capillary or bulb are observed. Mercury sometimes degrades through oxidation, leaving a residue on the capillary wall. The dye used to color organic liquids sometimes degrades when exposed to sunlight or ultraviolet light. Any thermometer with a degraded filling liquid should be removed from service.
4. Periodic maintenance plan All calibrated or certified liquid-in-glass thermometers should be maintained periodically. Maintenance steps include:
• visual inspection to ensure that the liquid column has not separated or degraded, • visual inspection to ensure that the scale and graduations are still legible over the full scale
length, • calibration at the ice point (or another point on the low end of the scale), and • full recalibration (instead of, or in addition to, calibration at the ice point).
The interval between visual inspections varies greatly with use. For a thermometer that is maintained in a vertical position at a steady temperature, there is virtually no likelihood of a column separation. Thermometers that are routinely shipped or transported, on the other hand, may need inspection after every transport. Organic thermometers are more likely in general to separate than mercury thermometers, especially when subjected to temperatures below −100 °C or greater than +100 °C. The frequency for performing a single-point recalibration or of a full recalibration depends on the maximum temperature of use, the duration of use, and the characteristics of the individual thermometer tested. Noticeable drift in a liquid-in-glass thermometer is most likely to occur in thermometers that are in steady, rather than intermittent use; are used at elevated temperatures; or have fine graduation intervals and contraction chambers. At a minimum, even thermometers used intermittently near room temperature should be checked yearly at the ice point. Thermometers used steadily at elevated temperatures should be checked much more often, at least until a history has been established. Section 7.6 discusses a recommended recalibration interval based on knowledge of a thermometer’s stability at the ice point.
5

Single-point recalibration is valid for mercury-filled thermometers used at temperatures of 200 °C or below. In the case of thermometers with contraction chambers and fine graduations, full recalibration is likely necessary for the best performance. Thermometers with usage temperatures above 200 °C require periodic full recalibration. Full recalibration will also give the lowest possible uncertainties, as discussed in Section 7.9. When a large change (greater than one scale division for thermometers with graduations of 0.05 °C or larger) in ice-point reading is observed, care should be taken in applying a single-point recalibration, especially for conditions of use where a large change in ice-point reading would not be expected. An additional visual inspection and ice-point reading should be performed to confirm the results.
5. Visual inspection Visually detectable thermometer defects can be divided into two categories: manufacturing defects apparent when the thermometer is new, and defects that appear with use. For new thermometers, we recommend a single visual inspection for manufacturing defects, including:
• uneven scale graduations, • improper numbering of the scale, • other defects in the glass bulb or funnels connecting chambers with the capillary, and • the presence of foreign objects in the filling liquid or in the capillary.
Figure 2 shows an example of a foreign object (glass chip) in the glass capillary.
Fig. 2. Example of a foreign object (glass chip with the red circle) in the glass capillary.
We recommend periodic visual inspections for thermometer defects that may appear with use, including:
• degradation of the filling liquid, • cracks or other degradation of the glass, • loss of scale or numbering legibility, and • separation of the liquid column.
See Section 3 for details.
6

Large errors can occur if gas bubbles are introduced into the thermometer bulb or if the liquid column separates. Thermometers should be visually inspected for these two conditions regularly. A visual inspection is recommended prior to all calibrations, after any preconditioning step. Figure 3 shows examples of separated liquid columns. Visually, mercury oxidation may appear to be column separations that cannot be rejoined, or as a brownish discoloration near the mercury meniscus. To inspect a thermometer, place the thermometer on a flat surface with good illumination. Use a hand magnifier or low-power microscope (10X), and scan for defects along the full length of the thermometer. As shown in Figure 4, rotate the long axis of the thermometer 360° at the bulb and at any contraction chambers.
a) b) Fig. 3. Example of a separated liquid column indicated by the red oval: a) mercury thermometer and b) organic thermometer.
Fig. 4. Visual inspection of a liquid in glass thermometer using a low-power microscope (10X).
7
6. Joining separated columns
Sections 6.1 and 6.2 describe methods for joining separated columns observed in mercury-filled and organic-filled thermometers, respectively. Success in using these methods requires practice, care in execution, and attention to laboratory safety. Inexperienced users may wish to consult the manufacturer or an experienced calibration laboratory for assistance.
6.1 Mercury-filled thermometers NOTE: Extreme care must be taken when working with mercury thermometers to avoid breakage of the thermometer. Operators should be familiar with the health risks of mercury, and with laboratory policies and safety procedures in the event of a mercury spill. Mercury is a potent neurotoxin and is categorized as a hazardous material. The U.S. Environmental Protection Agency [3] and the Occupational Safety and Health Administration [4] provide additional information on health and environmental hazards, and control of those hazards.
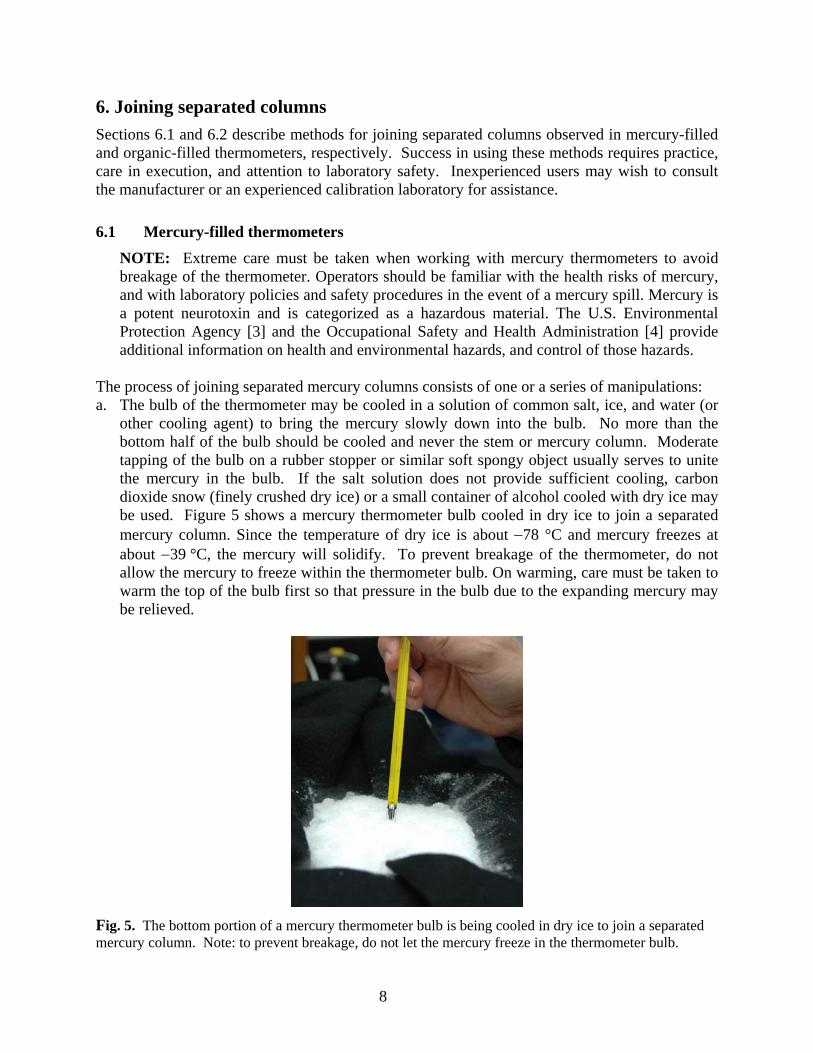
The process of joining separated mercury columns consists of one or a series of manipulations: a. The bulb of the thermometer may be cooled in a solution of common salt, ice, and water (or
other cooling agent) to bring the mercury slowly down into the bulb. No more than the bottom half of the bulb should be cooled and never the stem or mercury column. Moderate tapping of the bulb on a rubber stopper or similar soft spongy object usually serves to unite the mercury in the bulb. If the salt solution does not provide sufficient cooling, carbon dioxide snow (finely crushed dry ice) or a small container of alcohol cooled with dry ice may be used. Figure 5 shows a mercury thermometer bulb cooled in dry ice to join a separated mercury column. Since the temperature of dry ice is about −78 °C and mercury freezes at about −39 °C, the mercury will solidify. To prevent breakage of the thermometer, do not allow the mercury to freeze within the thermometer bulb. On warming, care must be taken to warm the top of the bulb first so that pressure in the bulb due to the expanding mercury may be relieved.
Fig. 5. The bottom portion of a mercury thermometer bulb is being cooled in dry ice to join a separated mercury column. Note: to prevent breakage, do not let the mercury freeze in the thermometer bulb.
8

b. The mercury can sometimes by reunited by warming the bulb until the column reaches the separated portion in either the contraction chamber or the expansion chamber. If this procedure is used, never heat the bulb in an open flame, which could cause rapid heating and possible bulb breakage, or permanent damage to the bulb if it survives heating. Heat the thermometer only in a temperature-regulated stirred-liquid bath. Never use a liquid bath at a temperature greater than the flash point of the bath fluid. Great care is needed to avoid filling the expansion chamber with mercury, which might produce pressure great enough to burst the bulb. The expansion chamber should never be more than two-thirds full. Joining the mercury is more readily accomplished if the quantity in either cavity has first been divided into droplets by tapping the thermometer gently against the hand. This method should only be attempted by experienced users with the proper laboratory equipment.
As shown in Fig. 6, to remove a droplet of mercury at the top of the thermometer above the graduated scale (if graduated above 260 °C), turn the thermometer upside down in a hot, stirred-liquid bath near 250 °C and vaporize the droplet back toward the main scale. After the thermometer cools (right side up), the bulb can be heated to allow the main column to pick up the droplet, which is now in the capillary (on scale). Never heat the thermometer above 260 °C, and never use a liquid bath at a temperature greater than the flash point of the bath fluid. This method should only be attempted by experienced users with the proper laboratory equipment and attention to proper safety protocols.
Fig. 6. Heating a mercury thermometer upside down in a liquid bath near 250 °C to join a separated mercury column. A second thermometer is used to monitor the bath temperature.
9

Gas bubbles, which are sometimes found along the surface of the mercury in the thermometer bulb, may be collected by circulating, or “washing,” a large gas bubble around the inside of the bulb (small bubbles will combine with the large bubble). As outlined in method a) above, bring all of the mercury into the bulb. Hold the thermometer in a horizontal position and gently tap the thermometer against the hand to form a large gas bubble. Force the bubble to travel around the wall of the bulb by rotating the thermometer and tapping it against the palm of the hand. When the entire surface has been “washed,” rotate the bubble to the top of the bulb and reunite the mercury as described above. It may be necessary to cool the mercury in dry ice (see above) to release the large gas bubble back into the stem. Success with this method requires practice at generating one large bubble and not more smaller bubbles.
Fig. 7. Example of a gas bubble being washed out of the mercury in the thermometer bulb. The red circle indicates the gas bubble. All of these manipulations require patience (and experience is helpful), but they will generally yield the desired results if care is used. If the procedures are not successful, do not risk breakage of the thermometer by deviating from the procedures given above.
6.2 Organic-filled thermometers The process of joining separated organic-liquid columns is similar to the procedures for mercury filled thermometers, with only minor changes. Recommended procedures include: a. The bulb of the thermometer may be cooled to bring the organic liquid slowly down into the
bulb. The cooling agent should be selected so that thermometer bulb is subject to a temperature cold enough to draw the liquid down into the thermometer bulb, but not so cold as to cause rapid freezing of the bulb liquid. A mixture of regular ice and salt will attain a minimum temperature of −21 °C (at a salt concentration of 23 % by weight); crushed dry ice will reach −78 °C; and liquid nitrogen will reach −196 °C. A stirred liquid bath may also be used. A cooling agent should be chosen with a temperature at least 20 °C lower than the lowest graduation on the thermometer. Only the bulb should be cooled and never the stem or liquid column. Moderate tapping of the bulb on a rubber stopper of similar soft spongy object usually serves to unite the liquid in the bulb. To prevent breakage of the thermometer, do not allow the organic liquid to freeze within the thermometer bulb. During warming, care must be taken to heat the top of the bulb first so that pressure in the bulb due to the expanding liquid may be relieved.
10

b. The organic liquid can sometimes by reunited by warming the bulb until the column reaches the separated portion in either the contraction chamber or the expansion chamber. If this procedure is used, never heat the bulb in an open flame, which could cause rapid heating and possible bulb breakage, or permanent damage to the bulb if it survives heating. Heat the thermometer only in a temperature-regulated stirred-liquid bath. Never use a liquid bath at a temperature greater than the flash point of the bath fluid. Great care is needed to avoid filling the expansion chamber with the organic liquid, which might produce pressure great enough to burst the bulb. The expansion chamber should never be more than one-half full. This method should only be attempted by experienced users with the proper laboratory equipment.
All of these manipulations require patience (and experience is helpful), but they will generally yield the desired results if care is used. If the procedures are not successful, do not risk breakage of the thermometer by deviating from the procedures given above.
7. Testing and recalibration at the ice point
7.1 Preconditioning There is some evidence that liquid-in-glass thermometers, if left unused for several months, will give readings on first heating that differ from readings on subsequent heatings. Consequently, if a liquid thermometer is not known to have been used recently and has a maximum temperature of use of 150 °C or greater, it should be thermally cycled prior to recalibration. We recommend heating the thermometer to the temperature of maximum use, holding it at that temperature until the bulb has heated to within 1 °C of its equilibrium temperature, and then cooling to room temperature. After the preconditioning cycle, wait 72 h prior to recalibration. For thermometers used above 300 °C, we recommend that measurements at the ice point be incorporated into this procedure, as a check on the stability of the thermometer:
• measure the ice point; • heat the thermometer to the temperature of maximum use, holding it at that temperature
until the bulb has heated to within 1 °C of its equilibrium temperature; • cool to room temperature • rest the thermometer at ambient environmental conditions for 72 h (hours); and • re-measure the ice point.
If the ice-point measurements do not agree to within one scale division, then the thermometer is rejected for calibration and use.
7.2 The ice point as a reference point
For many liquid-in-glass thermometers, especially those used at temperatures below 200 °C, long term changes in the thermometer readings at a given temperature are predominantly a direct result of changes in the bulb volume. To compensate for this change in the bulb, it is only necessary to determine the magnitude of the change on the thermometer scale in order to recalibrate it. This is done by checking at any one of the temperatures that was used as a calibration point. The point used most often is the ice point, 0 °C (32 °F), consisting of crushed
11

ice and water in an insulated flask, as described in Section 7.7. The ice point is recommended as a secondary “fixed point” for calibration of thermometers approximating the International Temperature Scale of 1990 [8,9] and can be reproduced in any laboratory with an expanded uncertainty (k = 2) of approximately 0.002 °C [10], provided that the methods in Ref. [10] are followed. (Sections 7.6 and 7.7 provide a description of the preparation and use of an ice point.) When the ice point is properly realized, the calibration uncertainty of a liquid-in-glass thermometer is limited by the repeatability of the thermometer, which is typically much larger than the uncertainty of the ice-point temperature. 7.3 Shape of correction curve The shape of a correction versus temperature plot for a given liquid-in-glass thermometer is not affected by a bulb volume change, provided that there are no changes to the capillary volume. The only change is a shift along the temperature axis (the ordinate), as shown in Fig. 8.
-0.05
0.00
0.05
0.10
0.15
0.20
0.25
-20 0 20 40 60 80 100 120
Temperature, °C
Cor
rect
ion,
°C
New correction for ice-point change
Original correction
Fig. 8. Recalibration plot of corrections versus temperatures for a given liquid-in-glass thermometer. Lines connect calibration points to aid in interpolation between points.
7.4 Recalibrating liquid-in-glass thermometers—Method I Before the bulb-volume change is determined by observing the scale reading at the ice point or at another calibration temperature, the thermometer must remain at room temperature for 72 h. This is necessary because a temporary, reversible change will occur in the volume of the bulb if the thermometer is heated beyond room temperature. This temporary expansion of the bulb will introduce an error in the reading, since most thermometers are initially calibrated by starting at the lowest temperature (usually 0 °C) and proceeding to the higher temperatures. This heating of
12

the thermometer from the lowest point to the highest point will cause gradual expansion of the bulb. For the following examples, the ice point is used as the recalibration point, since, in practice, it is the one most often used in recalibrations. After the thermometer has been at room temperature for 72 h, an ice-point measurement is recorded (from which the ice-point correction is calculated) and compared to the ice-point measurement that was determined the last time the thermometer was calibrated or recalibrated. If the ice-point reading is found to be higher or lower then the previous reading, all other readings will be higher or lower, respectively, by the same amount. Examples are given in Table 1 and in Fig. 8
Table 1. Recalibration of liquid-in-glass thermometers using the ice point.
Calibration Point, °C
Original Correction, °C
New Correction For Ice-Point Change, °C
0 −0.05°C −0.10 °C 50 + 0.10 + 0.05
100 + 0.22 + 0.17 150 + 0.07 + 0.02
Calibration Point, °C
Original Correction, °C
New Correction For Ice-Point Change, °C
−50 −0.03 + 0.07 0 −0.10 0.00
50 + 0.15 + 0.25 100 + 0.23 + 0.33
7.5 Recalibration of liquid-in-glass thermometers—Method II The recalibration method described above is used when the standard liquid-in-glass thermometer is needed only once or twice a week and the thermometer is used starting from the lowest temperature point and going to the highest temperature points and not used again for 72 h. Many times, however, a standard liquid-in-glass thermometer is needed every day and at numerous temperatures. Temporary changes that occur in the bulb volume make using the thermometer at any time impossible if corrections generated as in Section 7.4 are to be used. The magnitude of the ice-point depression increases as the maximum temperature of use increases. The magnitude also depends on the type of glass used in the thermometer fabrication. The change in reading due to the temporary bulb-volume change is known as the ice-point depression because the expanding bulb volume causes the ice-point reading to decrease. Fortunately, there is a way to compensate for temporary bulb-volume changes. First, the variation of the thermometer ice-point reading as a function of temperature must be determined. After the thermometer has remained at room temperature for 72 h, observe the scale reading at the ice-point and adjust the corrections as described in Section 7.4 to account for the new ice-
13

point reading. We will term these corrections the “current corrections”. Next, heat the thermometer to within one scale division of the next higher calibration temperature, cool to room temperature, and then insert it into an ice point. The ice-point reading is observed and recorded. This is repeated at all of the calibration points in ascending order. The ice-point reading (not correction) is then added to the current correction at each calibration point, producing what is called an "adjusted set of scale corrections". An example of how to establish a set of adjusted-scale corrections is given in Table 2. This procedure need only be performed once for each thermometer.
Table 2. Establishing adjusted-scale corrections.
Calibration Current Ice-Point Reading Adjusted-Scale Point, °C Correction, °C After Heating to Correction, °C
Calibration Point, °C 0 +0.10 −0.10 0.00
40 +0.15 −0.10 +0.05 80 +0.20 −0.10 +0.10
120 +0.15 −0.15 +0.00 160 +0.25 −0.15 +0.10 200 +0.10 −0.20 −0.10
Note that the adjusted-scale correction is only an intermediate step in determining the correction to be applied in actual use. The recipe for the complete correction is as follows. After use of the thermometer at a given temperature, cool the thermometer to room temperature, and read the thermometer in an ice point within 30 min. Subtract this last ice-point reading from the appropriate adjusted-scale correction to obtain the actual correction. As an example, suppose we measured the temperature of an oil bath with the thermometer from Table 2. In the oil bath, we read a temperature of 100.00 °C. The thermometer was removed from the oil bath, allowed to cool, and then a reading of −0.15 °C was obtained at the ice point. The bath temperature is calculated as follows:
1. From Table 2, the adjusted-scale correct is +0.05 °C, obtained by linear interpolation of the values +0.10 °C at 80 °C and 0.00 °C at 120 °C.
2. To obtain the thermometer correction at 100 °C, we subtract the recent ice-point reading from the adjusted scale factor:
Correction at 100 °C = +0.05 °C – (−0.15 °C) = +0.20 °C. This gives the total correction that is to be added to the thermometer reading of 100.00 °C.
3. The actual temperature of the oil bath is then 100.00 °C + 0.20 °C = 100.20 °C. Application of this method, or adherence to the limits of Method I, may not always be practical. In such circumstances, the magnitude of the ice-point depression may be determined by heating the thermometer to a given temperature, reading the ice-point value shortly after cooling and after a 72 h wait, and taking the difference between the two ice-point values to obtain a typical ice-point depression. If this depression is small relative to the desired measurement uncertainty, the difference may be taken as an additional component of the standard uncertainty. If, on the
14

other hand, the ice-point depression is large compared to the desired measurement uncertainty, use of a different thermometer should be considered.
7.6 Recommended recalibration interval The interval of recalibration of a liquid-in-glass thermometer depends on several factors. If a thermometer has a large bulb, is used at high temperatures (exceeding 200 °C), or is new, it is expected that the greatest change will be seen. Initial checks at the ice point may be as often as once a month. If the ice point shows little change over a period of time, the recalibration interval can be increased to every two months. If the ice point continues to indicate a stable bulb, within an acceptable uncertainty, the recalibration interval can be extended to once or twice a year. This is recommended as the minimum interval between calibration checks.
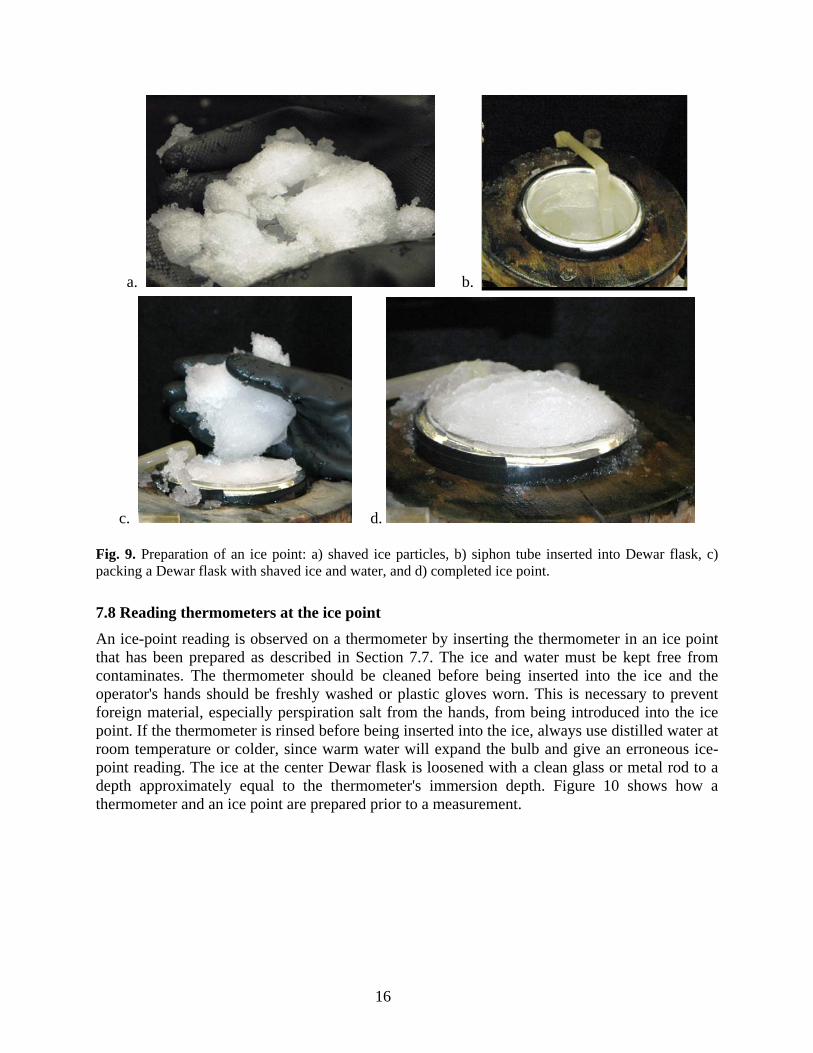
7.7 Preparation of an ice point Since the ice point is so important in the recalibration and use of liquid-in-glass thermometers, a discussion will be given of its preparation. A new ice point should be made every day it is needed. (We use the term “ice point” to describe the physical realization of the ice melting point. The terms “ice bath” and “ice-point bath” describe the same realization.) The ice, from which to prepare the ice point, can be made from distilled or de-ionized water, or it can be the clear portion of commercially-available ice, which is frozen from the outside inward, leaving the impurities in the center. The ice is shaved to the consistency of that used in a "snow cone", with particles of 2 mm to 5 mm in diameter. The ice is placed in the Dewar flask with distilled water and packed firmly. Put as much ice in the flask as possible and fill the crevices with distilled water. Cover the surface of the ice with an opaque cover (a dark colored piece of felt is adequate. After approximately 15 min to 30 min, excess water, resulting from the melting of the ice, is siphoned from the flask and ice is added to replace that which has melted. The ice point is ready to use when it has set for 15 min to 30 min, the ice should be saturated with distilled water, but the ice should not float in the flask, and there is no excess water on the surface of the ice. If more than a few thermometer measurements are to be made, a siphon tube is placed at the bottom of the flask to remove excess water that will be produced by melting of the ice. Throughout the day, replace the siphoned water with ice. Preparation of an ice point used at NIST is shown as Fig. 9.
15
a. b.
c. d.
Fig. 9. Preparation of an ice point: a) shaved ice particles, b) siphon tube inserted into Dewar flask, c) packing a Dewar flask with shaved ice and water, and d) completed ice point.
7.8 Reading thermometers at the ice point An ice-point reading is observed on a thermometer by inserting the thermometer in an ice point that has been prepared as described in Section 7.7. The ice and water must be kept free from contaminates. The thermometer should be cleaned before being inserted into the ice and the operator's hands should be freshly washed or plastic gloves worn. This is necessary to prevent foreign material, especially perspiration salt from the hands, from being introduced into the ice point. If the thermometer is rinsed before being inserted into the ice, always use distilled water at room temperature or colder, since warm water will expand the bulb and give an erroneous ice-point reading. The ice at the center Dewar flask is loosened with a clean glass or metal rod to a depth approximately equal to the thermometer's immersion depth. Figure 10 shows how a thermometer and an ice point are prepared prior to a measurement.
16

a. b.
c. d. Fig. 10. Preparing a thermometer for measurement at the ice point: a) cleaning the thermometer with shaved ice, b) pre-chilling the thermometer prior to insertion into the ice point, c) creating a hole for the thermometer in the ice point with a clean metal rod, and d) inserting thermometer to its proper immersion. Gently place the thermometer through the holder and into the region of loosened ice. If the thermometer touches a firm surface before it is immersed to the immersion line or 0 °C mark, then remove the thermometer and loosen the ice further down into the Dewar flask to permit the thermometer to be immersed to the proper depth (see Fig. 1 and Fig. 11). If the immersion line or 0 °C mark on the thermometer passes below the surface of the ice before resting on a firm foundation, remove the thermometer, repack the ice, and loosen the ice to the correct depth. The flask must be sufficiently deep to ensure that at least 3 cm of ice-water mixture are between the bottom of the thermometer bulb and the bottom of the flask. When the thermometer is properly immersed and perpendicular to the measurement device (e.g., digital video camera, telescope, magnifier, eye), firmly pack the ice around the thermometer to the immersion line or approximately 1 cm below the 0 °C mark, the thermometer is ready to be read.
17

a. b. Fig. 11. Proper immersion depth of a thermometer in an ice point: a) partial immersion and b) total immersion. The thermometer should remain in the ice point for approximately three minutes. (Thermometers using an organic liquid instead of mercury as the thermometric fluid will require approximately 15 mins, or even longer at the lowest temperatures, to attain a stable reading because the organic fluid drains slowly from the wall of the capillary.) When stability is reached (the meniscus stops moving) for mercury thermometers, gently tap the thermometer to free the mercury meniscus (which can sometimes stick) and record the ice-point reading. For thermometers with a scale graduation of 0.01 °C or less, a soft plastic rod, or something of similar compliance, is placed near the point to gently tap mercury thermometers before reading. If a magnifier is used, it should be designed for use with liquid-in-glass thermometers, its mount should hold the lens perpendicular to the thermometer stem, and its mounting should not prevent proper immersion of the thermometer into the ice point. When using a magnifier, the calibrator must read the thermometer with a direction of vision perpendicular to the thermometer. Otherwise, parallax error may be significant. Partial-immersion thermometers that meet ASTM specification E1 require a stem-temperature correction. These thermometers will have an immersion depth and the letters “ASTM” on the back of the thermometer. Refer to the appropriate ASTM standards [7,11] for additional guidance.
18

7.9 Uncertainties with correction The use of a single-point recalibration at the ice point adds an additional uncertainty to the updated thermometer calibration result at every temperature but the ice point. There is a simple relation between the original and adjusted thermometer correction at temperature t: 0 orig,0orig )()( CCtCtC −+= (1
where C(t) is the correction at temperature t at the time of recalibration, Corig(t) is the correction of the original calibration, C0 is the ice-point reading at the time of recalibration, and Corig,0 is the ice-point reading of the original calibration. This measurement equation then leads to the standard uncertainty u(C) for a thermometer correction C at temperature t:
[ ] ,)()(2/12
orig22
orig ssCuCu ++= (2
where u(Corig) is the standard uncertainty of the original calibration at a given temperature t, s is the short-term repeatability at the ice point as measured by the user, and sorig is the short-term repeatability at the ice point for the original calibration. The value of u(C) and s depend on the properties of the thermometer and the skill of the operator in reading the thermometer. A properly prepared ice point contributes a relatively small component to u(C). For a given thermometer, the value of s can be estimated by repeat measurements of the ice point over several days. As an alternative, values of s for mercury-filled thermometers may be estimated based on literature values of liquid-in-glass thermometer uncertainties [12] and on the resolution of various methods to read thermometers. Typical reading resolutions for various methods are listed in Table 2. From Ref. [12], values of s obtained with a video readout may be approximated as s = 0.02 °C for temperatures less than 100 °C, and s = 0.04 °C for temperatures between 100 °C and 200 °C. (For thermometers graduated in Fahrenheit, the equivalent values are s = 0.036 °F for temperatures less than 212 °F, and s = 0.072 °F for temperatures between 212 °F and 392 °F.) A general recipe for the value of s is to take the maximum of the literature values and the resolution values in Table 3. Tables 4 and 5 give results for thermometers in degrees Celsius and degrees Fahrenheit, respectively. The values in these tables are only guidelines; repeatability data obtained in other laboratories may be used instead.
Table 3. Typical resolutions for various methods of reading liquid-in-glass thermometers.
Method Reading resolution Video camera 0.03 graduation
Telescope 0.05 graduation Magnifier 0.10 graduation Naked eye 0.25 graduation
19

Table 4. Approximate values for ice-point repeatability (either s or sorig) for thermometers graduated in degrees Celsius.
Maximum usage temperature less than 100 °C Reading method
Graduation Video Telescope Magnifier Naked
Eye (°C) s, (°C) s, (°C) s, (°C) s, (°C)
0.05, 0.1 0.02 0.02 0.02 0.03 0.2 0.02 0.02 0.02 0.05 0.5 0.02 0.03 0.05 0.13 1 0.02 0.05 0.10 0.25 2 0.04 0.10 0.20 0.50
Maximum usage temperature less than 200 °C Reading method
Graduation Video Telescope Magnifier Naked
Eye (°C) s, (°C) s, (°C) s, (°C) s, (°C)
0.05, 0.1 0.04 0.04 0.04 0.04 0.2 0.04 0.04 0.04 0.05 0.5 0.04 0.04 0.05 0.13 1 0.04 0.05 0.10 0.25 2 0.04 0.10 0.20 0.50
Table 5. Approximate values for ice-point repeatability (either s or sorig) for thermometers graduated in degrees Fahrenheit.
Maximum usage temperature less than 212 °F Reading method Graduation Video Telescope Magnifier Naked Eye
(°F) s, (°F) s, (°F) s, (°F) s, (°F) 0.1 0.04 0.04 0.04 0.04 0.2 0.04 0.04 0.04 0.05 0.5 0.04 0.04 0.05 0.13 1 0.04 0.05 0.10 0.25 2 0.04 0.10 0.20 0.50
Maximum usage temperature less than 392 °F Reading method Graduatio
n Video Telescope Magnifier Naked Eye (°F) s, (°F) s, (°F) s, (°F) s, (°F) 0.1 0.07 0.07 0.07 0.07 0.2 0.07 0.07 0.07 0.07 0.5 0.07 0.07 0.07 0.13 1 0.07 0.07 0.10 0.25 2 0.07 0.10 0.20 0.50
20

These tables apply to thermometers that have graduation lines approximately 0.5 to 1.0 mm apart, typical of many thermometers defined in ASTM E 1 [7]. Thermometers with closer graduation lines, such as those that meet the obsolete SAMA specification [13], will have higher values of s. Thermometers with wider separations may have smaller values of s. Note that the calibration uncertainties described above may not fully account for the uncertainties in actual use. A user often may not be able to read the thermometer at the same resolution as obtained in the calibration. Also, the readings of partial immersion thermometers depend on the temperature of the liquid column, as described in Ref. [6], and the effect can be quite large for thermometers filled with organic liquids and/or used at elevated temperatures. Example A thermometer with maximum usage temperature of 125 °C and 1 °C graduations has an expanded uncertainty (k = 2) of 0.25 °C for the original calibration. The original calibration used a telescope. What is the revised calibration uncertainty if recalibrated at the ice point, using a magnifier? The original uncertainty is divided by two to obtain the standard (k = 1) uncertainty:
.C125.02
C25.0)( orig °=°
=Cu (3
The values of ice-point repeatability are taken from Table 2: sorig = 0.05 °C and s = 0.10 °C. The standard uncertainty of the recalibrated thermometer is determined by summing in quadrature u(Corig), sorig, and s, using Eq. 2:
[ ] . C 17.0C) 10.0(C) 05.0(C) 125.0()( 222 °=°+°+°=Cu (4 Finally, the standard uncertainty is multiplied by two to obtain the expanded uncertainty: C 34.0)(2)( °== CuCU (5 Tables 4 and 5 give typical calibration uncertainties and values of s for mercury-in-glass thermometers [9]. If the user is unable to perform periodic calibrations at the ice point with a sufficiently low uncertainty, then periodic recalibration by a competent calibration laboratory will be necessary. This calibration may be solely at the ice point for mercury-filled thermometers with a maximum usage temperature of 200 °C or less, with calibration uncertainty as described in section 7.9. If these measurements indicate significant drift in the thermometer, a full recalibration will be necessary to determine the thermometer corrections at intermediate temperatures. As a final alternative, all of the points of the original calibration may be repeated. In either case, an allowance for variation in the ice point should be included in the user’s uncertainty budget, based on the variation observed between the original and subsequent calibration results.
21

8. Organic-liquid thermometers Periodic visual inspection and measurement at the ice point serve as a valuable measurement assurance tool for organic-liquid thermometers. However, the procedures described in this document for single-point recalibration have not been validated for organic liquid thermometers and is not recommended at the time of this publication. There are several reasons why organic liquids may be more susceptible to drift than mercury-filled thermometers:
• the smaller ratio of bulb volume to capillary volume may amplify any changes in the capillary;
• the organic liquids may be less chemically stable than mercury, especially at elevated temperatures; and
• the interaction of the liquids with the capillary wall may change with time.
9. Summary of recommendations When properly cared for, liquid-in-glass thermometers can give excellent, repeatable results at a low instrument cost. A common misconception is that these thermometers require no periodic recalibration or validation. Mercury thermometers require:
• visual inspection, • periodic checks at the ice point (single-point recalibration), if used at temperatures below
200 °C, and • full recalibrations, if used at temperatures of 200 °C and above, if the thermometer has a
contraction chamber and fine graduations, or if the ice-point check shows changes that are large compared to the thermometer uncertainty.
The interval between full recalibrations is best determined by past history of the thermometer and the user’s tolerance on the measurement uncertainty (as described in Section 7.6). Organic thermometers require:
• visual inspection, and • full recalibrations, or validation of the original calibration at the highest and lowest
temperatures of use. In all cases, checks at the ice point can be a useful intermediate check between full recalibrations. However, single-point recalibration has not been validated for organic liquid thermometers and is not recommended at the time of this publication Visual inspection and measurements at the ice point can be performed by the user.
Acknowledgments We thank the members of ASTM committee E20.05 on Liquid-in-Glass Thermometers and Hydrometers for their helpful comments.
22

References [1] International Vocabulary of Metrology – Basic and General Concepts and Associated Terms (VIM),
3rd edition, JCGM 200:2008 (BIPM, Sèvres, France, 2008).
[2] Ripple, D. C., and Strouse, G. F., “Selection of Alternatives to Liquid-in-Glass Thermometers,” J. ASTM International 2, JAI13404 (2005).
[3] Website http://www.epa.gov/mercury/ accessed on Dec. 16, 2008.
[4] Website http://www.osha.gov/SLTC/mercury/ accessed on Dec. 16, 2008.
[5] Wise, J. A., “A Procedure for the Effective Recalibration of Liquid-in-Glass Thermometers,” NIST SP 819 (National Institute of Standards and Technology, Gaithersburg, MD, 1991).
[6] Wise, J. A., “Liquid-in-Glass Thermometer Calibration Service,” NIST SP 250-23 ((National Institute of Standards and Technology, Gaithersburg, MD, 1988).
[7] ASTM E 1-07, “Standard Specification for ASTM Liquid-in-Glass Thermometers,” (ASTM, West Conshohocken, PA, 2007).
[8] Preston-Thomas, H., “The International Temperature Scale of 1990 (ITS-90),” Metrologia 27, 3-10 (1990); Metrologia 27, 107 (1990).
[9] Bedford, R. E., Bonnier, G., Maas, H., and Pavese F., “Recommended values of temperature on the International Temperature Scale of 1990 for a selected set of secondary reference points,” Metrologia 33, 133-154 (1996).
[10] Mangum, B. W., “Reproducibility of the Temperature of the Ice Point in Routine Measurements,” NIST TN 1411 (National Institute of Standards and Technology, Gaithersburg, MD, 1995).
[11] ASTM E 11-07, “Standard Test Method for Inspection and Verification of Thermometers,” (ASTM, West Conshohocken, PA, 2007).
[12] Vaughn, C. D., and Strouse, G. F., “NIST Calibration Uncertainties of Liquid-in-Glass Thermometers over the Range from -20 °C to 400 °C,” in Temperature: Its Measurement and Control in Science and Industry, ed. D. C. Ripple et al., Vol. 7, CP684 (AIP Conf. Proc., Melville, NY, 2003), pp. 447-452.
[13] SAMA/ANSI Z236.1-1986, “American National Standard for Liquid-in-Glass Thermometers—General Purpose Laboratory Use,” (Scientific Apparatus Maker Association, Alexandria, VA, 1983).
23
Appendix A. Analysis of historical data obtained at NIST Prior to the common usage of single-point recalibration, NIST routinely performed repeat calibrations of liquid-in-glass thermometers at multiple points. We have analyzed calibration data from 24 thermometers calibrated at NIST, plus the 3 thermometers reported in Table 2 of Ref. [5]—examining whether repeat calibration data can be adequately predicted from the change in correction at the ice point alone. Table 6 gives an overview of the statistical analysis. To determine if the correction curves shifted by the same amount as the ice-point reading, as seen in Fig. 2, we: 1. computed the difference between the correction at each temperature and the ice-point
reading, for each set of calibration results; 2. calculated the standard deviation for all the differences corresponding to a particular
calibration temperature; 3. computed the ratio of the standard deviation to the expected standard uncertainty calculated
using Eq. 2; and 4. identified outliers where the ratio of standard deviation to standard uncertainty exceeded two. For a few thermometers, there was no auxiliary scale, and thus no ice-point reading. In this case, we used the lowest calibration point instead of the ice point as a reference state. Of the 27 thermometers studied, five thermometers indicated possible outliers. Three of these thermometers had maximum calibration temperatures of 300 °C or higher. One of the thermometers had very fine graduation intervals relative to its operating temperature, and the identification as an outlier depended greatly on our assignment of calibration uncertainty. For the remaining thermometer, with a maximum calibration temperature of 136 °C, the large standard deviations could be traced to a single discrepant point; we suspect that that point is an erroneous reading. From this analysis, we concluded the following:
1. For all thermometers with a maximum calibration temperature of 200 °C or lower, recalibration at the ice point was valid (with one ambiguous case discussed in Note (d) of Table 6). However, few of these thermometers showed significant drift in the ice-point value in any case.
2. The single-point recalibration method dramatically failed for thermometers with maximum calibration temperatures of 300 °C or above.
3. In the case of thermometers with large contraction chambers and fine graduations, full recalibration is necessary for the best performance.
24

Table 6. Summary of thermometers used in study of historical data. Thermometers with clear signs of capillary changes have the maximum calibration temperature in bold font.
Type Notes Max. cal. temperature,
°C
Number of repeat calib.
Number of calib. points
Number of
outliers 10 Partial Immersion Thermometers
94 °F to 115 °F, in 0.02 °F 41 4 6 0 −26 °F to 66 °C, in 0.2 °C 55 3 3 0 −20 °C to 110 °C, in 1 °C 56 2 2 0 −20 °C to 110 °C, in 1 °C 56 2 1 0 −20 °C to 110 °C, in 1.0 °C 56 5 2 0
30 °F to 314 °F in 0.2 °F 99 3 4 0 98 °C to 200 °C, in 0.5 °C 200 3 3 0 −5 °C to 200 °C in 0.2 °C 200 3 4 0 200 °F to 400 °F in 1.0 °F 204 3 2 1 (a) 100 °F to 950 °F, in 5 °F 509 3 2 1 (b)
17 Total Immersion Thermometers
19 °C to 35 °C in 0.02 °C 34.5 2 11 0 (c) −10 °C to 101 °C in 0.1 °C 40 2 4 0 −1 °C to 201 °C 0.2 °C 80 2 3 0
75 °C to 105 °C in 0.1 °C 90 2 1 0 167 °F to 221 °F in 0.2 °F 99 2 2 0 204 °F to 220 °F in 0.1 °F 103.3 2 4 0 (c) 98 °C to 152 °C in 0.1 °C 110 2 2 0
272.5 °F to 277.5 °F in 0.1 °F, with aux. 136 4 3 3 or 0 (d) 99 °C to 201 °C, in 0.1 °C 140 2 2 0
95 to 155 °C in 0.2 °C, with aux. 145 4 3 0 −1 °C to 201 °C in 0.2 °C 200 4 2 0 −2 °C to 205 °C in 0.2 °C 200 4 11 0 −2 °C to 205 °C in 0.2 °C 200 4 11 0
295 °F to 400 °F in 0.5 °F, with aux. 204 4 2 0 295 °F to 400 °F in 0.5 °F, with aux. 204 4 1 0
30 °F to 580 °F, in 2 °F 300 2 6 1 (b) 30 °F to 760 °F in 2 °F 371 2 7 4 (b), (c)
Notes: (a) Outlier resulted from one anomalous point, most likely a calibration error (b) Clear evidence of capillary changes (c) Data from Table 2 of Ref. [5]. (d) This thermometer has a very large contraction chamber, and the value to use for the
calibration uncertainty is not well known. If the calibration uncertainty is based on thermometers with similar maximum temperature of use in Ref. [11], there are zero outliers. If the calibration uncertainty is based on thermometers with similar intervals between graduations in Ref. [11], all three calibration points are outliers.
25

Appendix B. Validation of correction method at 150 °C and below The data described in Appendix A dates were measured prior to 1985, for all but two thermometers. To test the performance of modern thermometers, we performed a series of tests with a set of five, newly purchased ASTM 67C thermometers. These total immersion thermometers have a scale from 95 °C to 155 °C, with 0.2 °C divisions and a 0 °C auxiliary scale. Initial tests gave erratic results, later attributed to a lack of preconditioning (see Section 7.1). The tests were repeated with another set of preconditioned thermometers, with much better results. Ice points were acquired 30 min, 24 h, and 72 h after each exposure to high temperature. All of the data plotted in the figures use the 72 h ice-point readings. The measurement history was as follows: 1. Two rounds of testing at 110 °C, with a full set of ice-point measurements between rounds. 2. 10 days exposure at 110 °C, followed by 30 days at room temperature. 3. Three rounds of testing at 150 °C, with a full set of ice–point measurements between rounds. 4. 14 days exposure at 150 °C 5. Two rounds of testing at 150 °C, with a full set of ice–point measurements between rounds. 6. Testing at 110 °C, 150 °C, and 110 °C, with a full set of ice–point measurements after the
three points. Observations with a polariscope before and after measurements showed no visible changes of strain in the glass stem of the thermometer. Figure 12 shows the thermometer corrections at 110 °C and 150 °C at various steps in the thermal history. Note that there is no clear sign of drift in the corrections, even after a 14 d soak at 150 °C. As confirmation of this observation, the standard deviation of the corrections at 0, 110, and 150 °C were all slightly smaller than the Type A repeatability (k = 1) reported for this type of thermometer in Ref. [11]. Figure 13 shows the corrections after adjustment for changes in the 72 h ice-point reading.
To investigate whether correcting for ice-point changes reduces the variance of the corrections at 110 °C and 150 °C, we calculated the standard deviation of both the corrections themselves at each temperature and the corrections adjusted for changes in the ice point. Table 7 gives the pooled standard deviations for the set of five thermometers. There is virtually no difference between the raw corrections and the corrections adjusted for ice-point changes, indicating that correcting for the ice-point change did neither good nor harm for this particular set of thermometers.
26

−0.2
−0.1
0.0
0.1
0.2
110
110
10 da
ys at
110
150
150
150
14 da
ys at
150
150
150
110
150
110
Measurement History
Cor
rect
ion,
°C
S/N 4D5070S/N 4D5071S/N 4D4072S/N 4B8826S/N 4B8827
U (k =2)
Fig. 12. Corrections at 110 °C and 150 °C (designated by 110 and 150 on the ordinate).
-0.2
-0.1
0.0
0.1
0.2
110
110
10 da
ys at
110
150
150
150
14 da
ys at
150
150
150
110
150
110
Measurement History
Cor
rect
ion,
°C
S/N 4D5070S/N 4D5071S/N 4D4072S/N 4B8826S/N 4B8827
U (k =2)
Fig. 13. Corrections at 110 °C and 150 °C (designated by 110 and 150 on the ordinate) adjusted for changes in the ice-point reading.
27

28
Table 7. Comparison of pooled standard deviations (SD) for thermometer corrections with and without adjustment for ice-point changes.
Pooled SD, °C t, °C Without adjustment With adjustment 100 0.041 0.038 150 0.036 0.041