maintenance & rehabilitation strategies lecture 5
TRANSCRIPT

Maintenance & Rehabilitation Strategies
Lecture 5
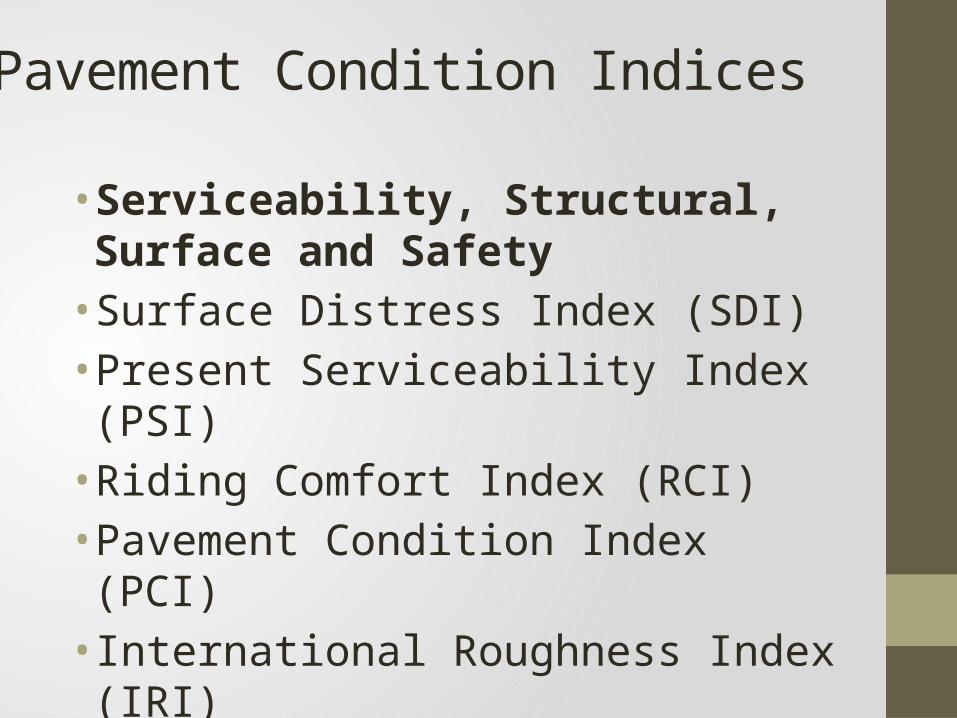
• Serviceability, Structural, Surface and Safety • Surface Distress Index (SDI)• Present Serviceability Index (PSI)• Riding Comfort Index (RCI)• Pavement Condition Index (PCI)• International Roughness Index (IRI)
Pavement Condition Indices

Establishing Criteria
• A criterion is a specified limit for some measure of pavement behavior, response, performance, and deterioration or operating specific against which comparison of actual measurements or estimates can be completed. • Example: the limit of PSI =2. 0 set at a minimum
acceptable level for collector highway pavement, then any section with 2.0 or less would be represent a deficiency.

Establishing Criteria Cont.
At the network level, criteria can be used to • Provide an objective basis for identifying current
needs and estimating future needs; • Provide consistency between sections and between
classes of roads; • Have a means for effectively showing current and
future accumulations of the work or deficient mileages.
At project level, criteria have usually been in terms of specification.
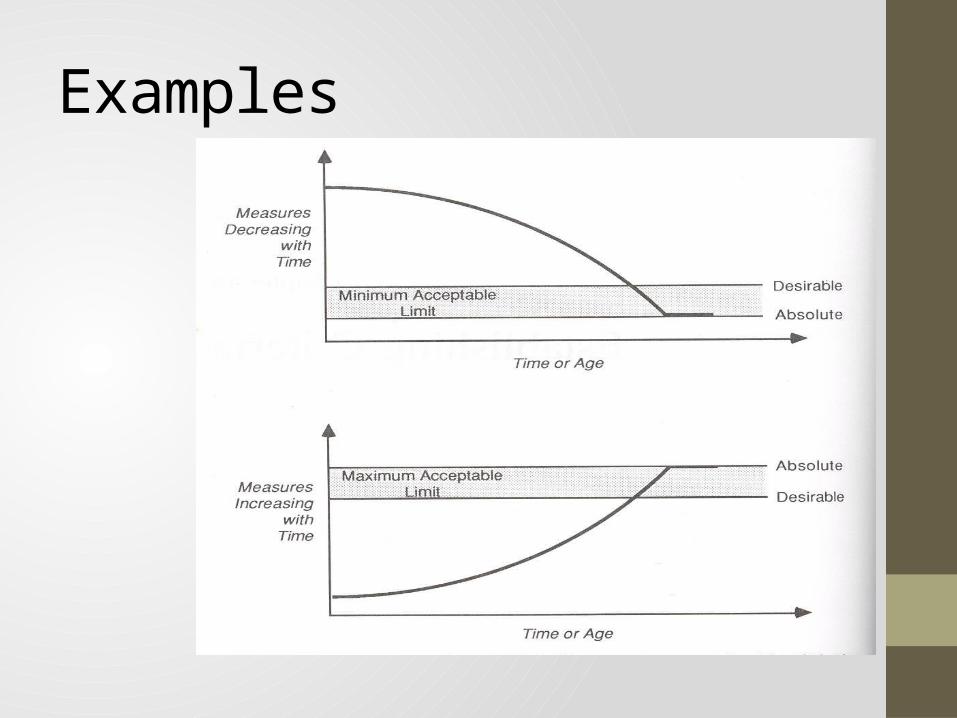
Examples
Establishing Criteria Cont.
• In general, all performance measures (individual index or combine ones) described so far plus• Traffic delay• Vehicle operation cost
Factors Affecting Criteria Limits
• Type and functional class of facility (rural or urban, freeway, arterial, collector, or local). This is the main factor. • Size of pavement network and type of agency
(federal, state, local). • Resources, budgets and policies of the agency.

Effects of Changing Criteria
1) Advance or delay the needs years; equally to decrease or increase the amount of deficient mileage.
2) Changing the criteria can affect the list of feasible rehabilitation actions.
3) Lowering the minimum acceptable values for PSI/SDI would be to increase the amount and cost of corrective maintenance required, traffic disturbances and vehicle operating costs.

Examples (not recommendations)

Prediction Models for Pavement Deterioration• Purely mechanistic: based on some primary
behaviors such as stress, strain or defalcation.• Mechanistic empirical: related to deterioration such
as distress or roughness.• Regression: related to one or more independent
variables like subgrade strength, axle load applications and pavement layer thickness.• Subjective: using transition process models.

Classification of Predication Models

Determining Needs
• The action year can be advanced, which may be desirable for certain section such as those carrying high traffic volumes:• Economic benefits.
• Could be the feasible action years by changing the minimum acceptable level for the measures of pavement deterioration

Needs Year and Action

Decision Making in R&M • Decision making in R&M is to select a feasible R&M
alternative from a set of available alternatives for a specific type of deficiency. • First step is to clearly identify a feasible set of R&M
alternatives for each type of deficiency, based on costs, physical restraints and condition of the existing pavement.

R&M alternatives used in Ontario

R&M Categories
• Preventive: such as chip seals, crack sealing, thin overlays, usually at levels of pavement deterioration considerably above the acceptable limits • Corrective: such as hot- and cold-mix patching,
usually at levels of deterioration near or even below the acceptable limits • Emergency: is often related to safety and time, with
cost not being a primary consideration.

Categories of Pavement Maintenance

Examples • https://www.youtube.com/watch?v=YDTeqSfAAdM
• https://www.youtube.com/watch?v=yy1tWWHvV-wwatch?v=yy1tWWHvV-w

State of the Art of R&M • Service life for each R&M has been estimated by
many transportation agencies. This is heavily engineering experience based. • Actual deterioration models in terms of many
performance measures remain to be developed for most of the R&M alternatives

Methods for Decision Making in R&M
The process used to select feasible rehabilitation alternatives from a set of available alternatives can range from simple judgment to a decision tree of expert systems approach which considers several combinations of factors. • Judgmental systems (practical experience).• Knowledge-based expert systems (consider various
combinations of factors) • Deterioration model

Example of Judgmental systems

Example of Decision Tree (Matrix Form)
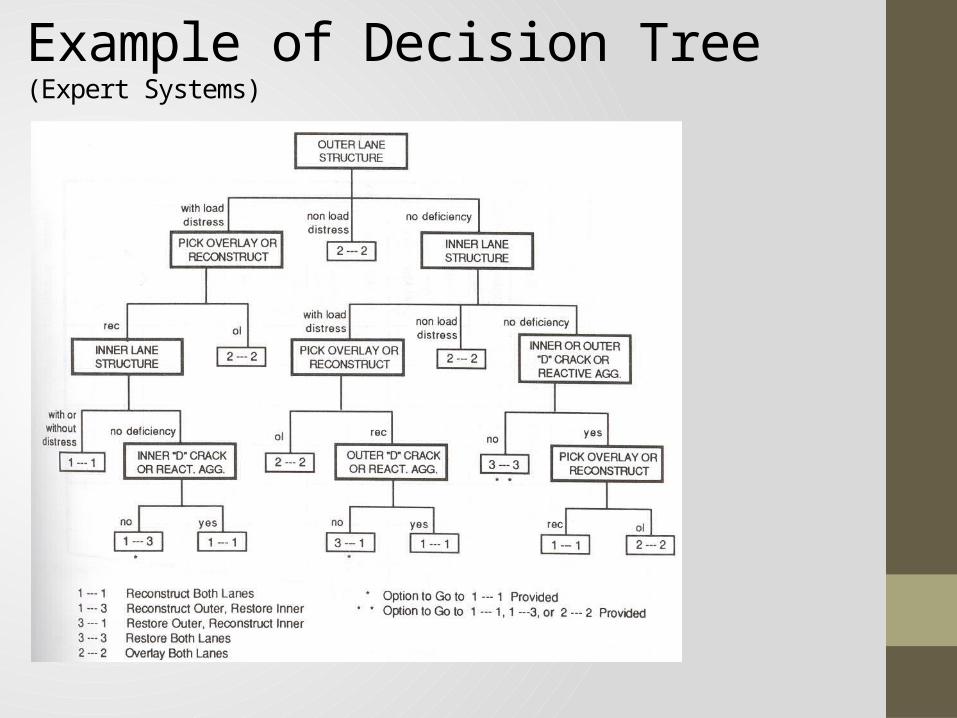
Example of Decision Tree (Expert Systems)

Cost Benefit Analysis R&M costs include: 1) Cost of the actual work (material, transport, placement, labor, etc.) • Straight forward calculations. Many agencies have manuals
for carrying out the necessary calculations. • Future rehabilitation alternatives can be estimated in
terms of costs discounted back to the present or using the following equation:
Present worth= future cost x present worth factor (PWF)Where: PWF = 1 / (1 + i)n n= number of years to the rehabilitation implementationi= discount rate

Cost Benefit Analysis Cont. 2) Vehicle operating costs (VOC)• Vehicle operating costs are the costs associated with
owning, operating, and maintaining a vehicle and include fuel consumption, oil and lubrication, tire wear, repair and maintenance, depreciation, and license and insurance• The differences in VOC occurring between a
rehabilitation action and no rehabilitation can be considered a measure of the relative difference in benefits.

Example: Relative benefits and costs for rehabilitation (overlay)
Cost Benefit Analysis Cont.3) Cost of user delay• The costs associated with highway users’ time. User
delay costs help quantify costs associated with slow downs due to construction and maintenance activities and denial-of-use. • User delay costs are the most difficult and most
debated life-cycle cost to exactly calculate because they involve assigning a dollar value to individuals’ delay time.• Very few agencies consider user delay costs directly.
One of the reasons to not consider user delay cost is that these are not a part of the agency’s budget.

Example: User delay costs

Cost Benefit Analysis Cont.4) Accident cost (not used in cost calculation) The costs associated with highway accidents. Generally crash costs are categorized into fatality, non-fatal injury and property damage only.2005 Federal Highway Administration (FHWA) report “Crash Cost” • Fatality (K) = $4,008,900/fatal crash• Injury (A/B/C) = $82, 600/ injury crash• Disabling Injury (A) = $216,000/disabling injury crash• Evident Injury (B) = $79,000/evident injury crash• Possible Injury (C) = $44,900/possible injury crash• PDO (O) = $7,400/PDO crash

Cost Benefit Analysis Cont.
5) Environmental damage (not used in cost calculation) These costs include traffic noise, as well as the pollution created and energy expended in the construction and upkeep of a pavement facility.
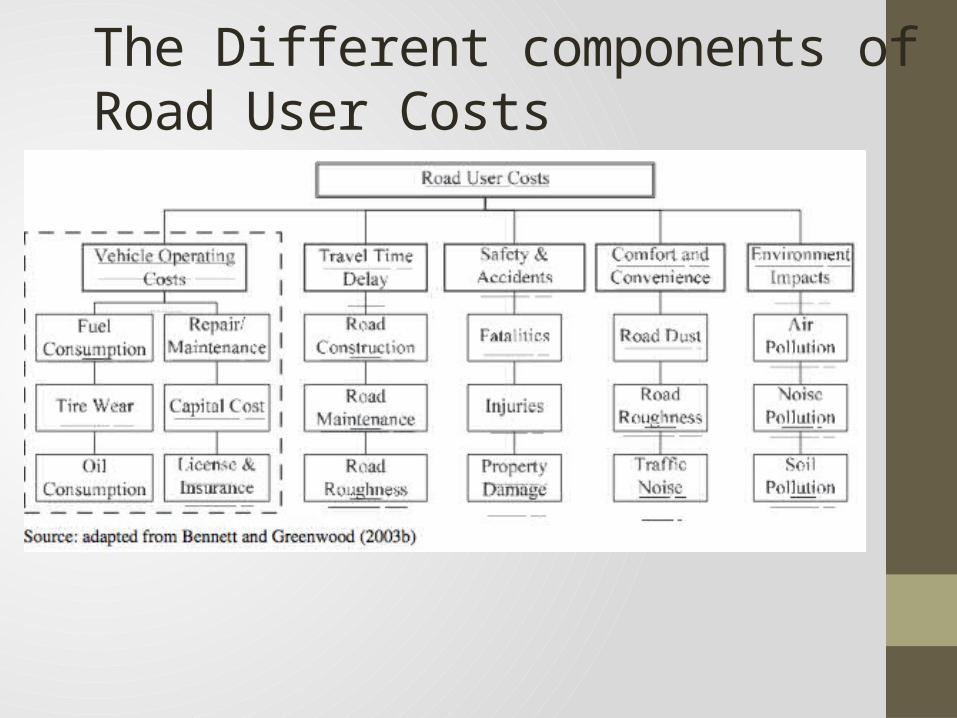
The Different components of Road User Costs

References• http://onlinepubs.trb.org/onlinepubs/nchrp/nchrp_rpt_720.
pdf• http://www.transportation.nebraska.gov/docs/pavement.pdf• http://www.pavementinteractive.org/article/life-cycle-cost-an
alysis/
• HIGHWAY SAFETY MANUAL• https://www.youtube.com/watch?v=YDTeqSfAAdM• https://www.youtube.com/watch?v=yy1tWWHvV-wwatch?v=
yy1tWWHvV-w