maintenance decision support system intersection i-15 intersection i-15 and i-70 in utah and i-70 in...
TRANSCRIPT

Maintenance Decision Support System
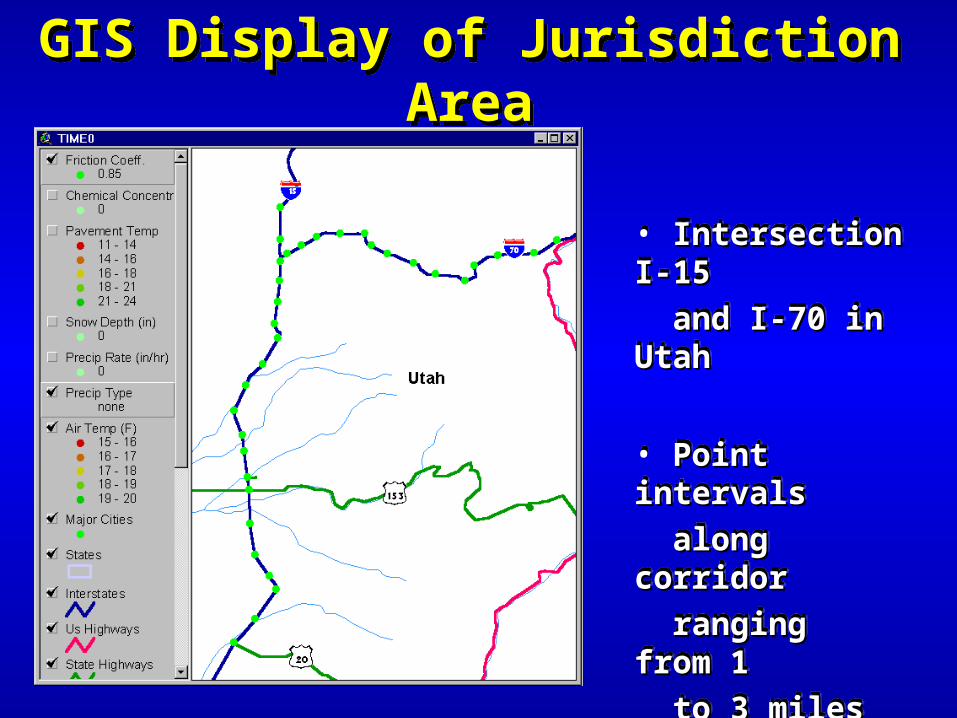
• Intersection I-15Intersection I-15
and I-70 in Utahand I-70 in Utah
• Point intervalsPoint intervals
along corridoralong corridor
ranging from 1ranging from 1
to 3 milesto 3 miles
• Intersection I-15Intersection I-15
and I-70 in Utahand I-70 in Utah
• Point intervalsPoint intervals
along corridoralong corridor
ranging from 1ranging from 1
to 3 milesto 3 miles
GIS Display of Jurisdiction AreaGIS Display of Jurisdiction Area

Snow Rain Mixed
MidnightWednesday
MidnightTuesday
MidnightThursday
0.00
0.10
0.20
0.30
0.40
Pre
cip
ita
tio
n R
ate
(SW
E)
(in
/hr)
Two-Day Precipitation Rate HistoryPrediction Point #3
3 6 9 12 15 18 21 24 27 30 33 36 39 42 45 48
Time Since Awareness (hrs)
0
0.05
0.15
0.25
0.35

5
10
15
20
25
30
35
40
Tem
per
atu
re (
deg
F)
3 6 9 12 15 18 21 24 27 30 33 36 39 42 45 48
Time Since Awareness (hrs)
0
0
Two-Day Temperature HistoryPrediction Point #3
MidnightWednesday
MidnightTuesday
MidnightThursday
Pavement Temperature
Air Temperature

MidnightWednesday
MidnightTuesday
MidnightThursday
Two-Day Snow Depth HistoryWithout TreatmentPrediction Point #3
2
4
6
8
10
12
14
16
Sn
ow
Dep
th (
in)
3 6 9 12 15 18 21 24 27 30 33 36 39 42 45 48
Time Since Awareness (hrs)
0
0
Snow Depth with No Maintenance Efforts

MidnightWednesday
MidnightTuesday
MidnightThursday
Two-Day Chemical Concentration HistoryWithout TreatmentPrediction Point #3
Co
nce
ntr
ati
on
(%
by
wei
gh
t)
5
10
15
20
25
3 6 9 12 15 18 21 24 27 30 33 36 39 42 45 48
Time Since Awareness (hrs)
0
0
Concentration of NaCl (no treatment)

MidnightWednesday
MidnightTuesday
MidnightThursday
Two-Day Friction Coefficient HistoryWithout TreatmentPrediction Point #3
Fri
ctio
n C
oef
fici
ent
3 6 9 12 15 18 21 24 27 30 33 36 39 42 45 48
Time Since Awareness (hrs)
0
0
0.1
0.2
0.3
0.4
0.5
0.6
0.7
0.8
0.9
1Friction Coefficient with No Maintenance Efforts

What ? When ?How ?

Decisions Supported by MDSS
2.1 become aware of weather threat2.2 monitor weather threat2.3 identify weather threat occurance
2.4 assess sufficiency of equip. & consumables2.6 check readiness of equip. & consumables
2.10 assign minimum staff to monitor and manage2.13 disseminate important weather info to field staff2.14 forward-place equipment and stocks2.16 alert supervisory staff to monitor/prepare2.18 alert crews

Decisions Supported by MDSS
2.21 select treatment expendables2.5 replenish consumable stocks2.7 mix expendables
2.11 select event-treatment strategy2.17 confirm strategy-plan in place
2.12 assign crews to shifts, schedules
2.22 dress and load equipment
2.19 split crew shifts
2.25 dispatch crews to treat (anti-ice)

Decisions Supported by MDSS
2.24 dispatch crews to wait at routes
2.27 dispatch crews to treat (plow/spread)
2.28 dispatch crews to treat (plow cake, de-ice)2.30 dispatch crews to treat (ice-spot treat)2.42 re-evaluate storm intensity and duration2.44 determine the LOS goal is reached2.39 close roads2.41 rest crews

Decisions Supported by MDSS
2.29 dispatch crews to treat (bulk removal)2.31 dispatch crews to treat (drifting)2.47 dispatch crews to clean up
2.43 identify threat end2.48 open roads

Pre-Defined Levels Of ServicePre-Defined Levels Of Service
● DOT road classifications based on number of vehicles/day● Level of Service standards
• Bare Pavement• Full-width• 50%-75% width• Left-wheel• Passing Lane• None
• Time• 4, 6, 16, 24 hours after storm ends• Or as soon as practical and as weather permits
● “Provide reasonable traveling conditions for the prudent driver during storm, depending on location, time of day”

Current Pavement Temperature (F)
Anticipated Pavement Temperature Change
Precipitation Type* / Severity
Salt Application Rate ** (lbs per two-lane mile) Comments
Above 32
25 to 32
20 to 25
15 to 20
15 or Below
Higher
Lower
Higher
Higher
Lower
Lower
Higher
Higher
Lower
Lower
Higher
Higher
Lower
Lower
R, SL, WS / Light
R, SL, WS / Mod. - Heavy
FR, SL, DS, WS / Light
FR, SL, DS, WS / Mod. – Heavy
FR, SL, DS, WS / Light
FR, SL, DS, WS / Mod. - Heavy
SL, DS, WS / Light
SL, DS, WS / Mod. – Heavy
SL, DS, WS / Light
SL, DS, WS / Mod. - Heavy
SL, DS / Light
SL, DS / Mod. – Heavy
SL, DS / Light
SL, DS / Mod. - Heavy
100 to 200
200 to 300
200 to 300
200 to 400
200 to 400
300 to 500
300 to 500
400 to 600
400 to 600
500 to 700
500 to 700
700 to 800
700 to 800
No Salt. Apply Sand
and Plow as Needed.
Use Pre-Wet System
Pre-Wet: 6 Gallons/Ton
Pre-Wet: 6 Gallons/Ton
Pre-Wet: 6 Gallons/Ton
Pre-Wet: 6 Gallons/Ton
Pre-Wet: 8 Gallons/Ton
Pre-Wet: 8 Gallons/Ton
Pre-Wet: 8 Gallons/Ton
Pre-Wet: 8 Gallons/Ton
Pre-Wet: 10 Gallons/Ton
Pre-Wet: 10 Gallons/Ton
Pre-Wet: 10 Gallons/Ton
Pre-Wet: 10 Gallons/Ton
Monitor Pavement Temp.
Switch to Salt if Rising Above
15F
* R=Rain, FR=Freezing Rain, SL=Sleet, WS=Wet Snow, DS=Dry Snow
If snow is blowing off roadway and no hard-pack exists, do not apply chemicals or abrasives.
** Initial application. Plow and re-apply salt at half-rate if surface becomes mealy or slushy, or full rate if glazed or packed.
Maine DOT Application Rate MatrixMaine DOT Application Rate Matrix

0 6 12 18 24 30 36 42 48
T IM E, H O U R S
0
5
10
15
20
25
30
35
SA
LT C
ON
CE
NT
RA
TIO
N, P
ER
CE
NT
BY
WE
IGH
T
0
10
20
30
40
PA
VE
ME
NT
TE
MP
ER
AT
UR
E, D
EG
RE
E F
AH
RE
NH
EIT
R a in
Snow
O ne tim e 400 lb /lane m i
100 lb /lane m i @ 3 hrs
250 lb /lane m i @ 6 hrs
400 lb /ln m i and 100 @ 3hrsFully Satura ted Solu tion
Ice-So lutionPhase L ine
Pavem ent Tem pera ture

Snow Rain Mixed
Ideal Time ForChemical Application
Ideal Time ForPlowing Effort
MidnightWednesday
MidnightTuesday
MidnightThursday
0.00
0.10
0.20
0.30
0.40
Pre
cip
ita
tio
n R
ate
(SW
E)
(in
/hr)
Two-Day Decision Support HistoryRecommended Treatments
Prediction Point #3
3 6 9 12 15 18 21 24 27 30 33 36 39 42 45 48
Time Since Awareness (hrs)
0
0.05
0.15
0.25
0.35
MidnightWednesday
MidnightTuesday
MidnightThursday
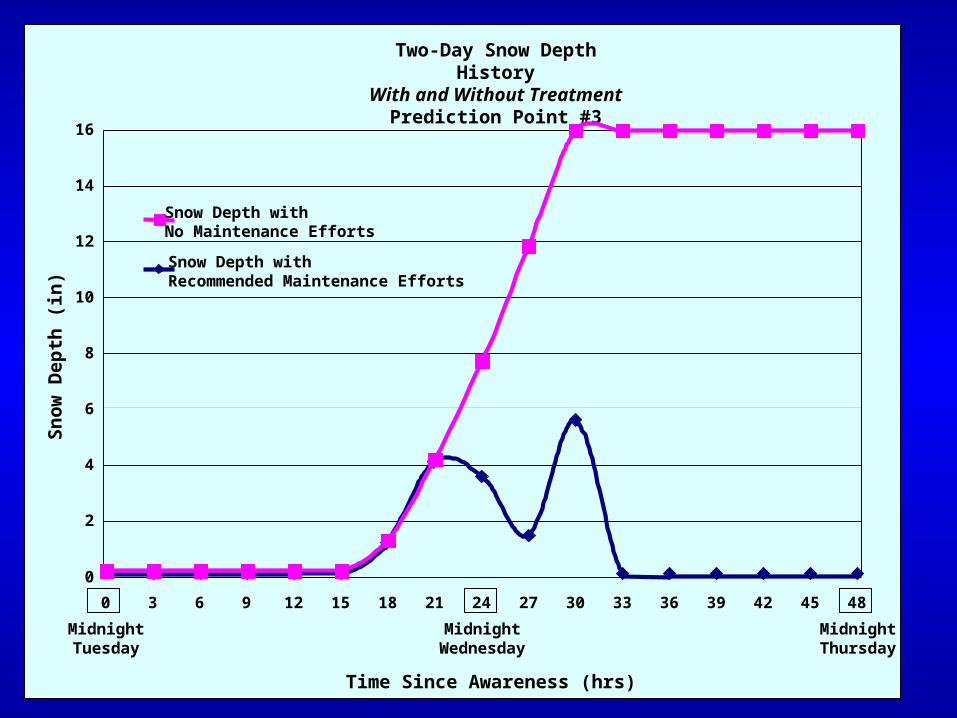
Two-Day Snow Depth HistoryWith and Without Treatment
Prediction Point #3
2
4
6
8
10
12
14
16
Sn
ow
Dep
th (
in)
3 6 9 12 15 18 21 24 27 30 33 36 39 42 45 48
Time Since Awareness (hrs)
0
0
Snow Depth with No Maintenance Efforts
Snow Depth with Recommended Maintenance Efforts

MidnightWednesday
MidnightTuesday
MidnightThursday
Two-Day Chemical Concentration HistoryWith and Without Treatment
Prediction Point #3
Co
nce
ntr
ati
on
(%
by
wei
gh
t)
5
10
15
20
25
3 6 9 12 15 18 21 24 27 30 33 36 39 42 45 48
Time Since Awareness (hrs)
0
0
Concentration of NaCl (no treatment)
Concentration of NaCl (with treatment)

MidnightWednesday
MidnightTuesday
MidnightThursday
Two-Day Friction Coefficient HistoryWith and Without Treatment
Prediction Point #3
Fri
ctio
n C
oef
fici
ent
3 6 9 12 15 18 21 24 27 30 33 36 39 42 45 48
Time Since Awareness (hrs)
0
0
0.1
0.2
0.3
0.4
0.5
0.6
0.7
0.8
0.9
1Friction Coefficient with No Maintenance Efforts
Friction Coefficient with Recommended Maintenance Efforts
LOS 1
What A
Tool !