maintaining utility services for the...
TRANSCRIPT

Maintaining UtilityServices for the Poor
Policies and Practices in Central and Eastern Europeand the Former Soviet Union
September 2000
The World Bank
Washington, D.C.
ii
Copyright © 2000THE WORLD BANK1818 H Street, N.W.Washington, D.C. 20433, U.S.A.
All rights reservedManufactured in the United States of AmericaFirst printing September 20001 2 3 4 03 02 01 00
The opinions expressed in this report do not necessarily represent the views of the World Bank orits member governments. The World Bank does not guarantee the accuracy of the data includedin this publication and accepts no responsibility whatsoever for any consequence of their use.
The material in this publication is copyrighted. Requests for permission to reproduce portions ofit should be sent to the Office of the Publisher at the address shown in the copyright noticeabove. The World Bank encourages dissemination of its work and will normally give permissionpromptly and, when the reproduction is for noncommercial purposes, without asking a fee.Permission to copy portions for classroom use is granted through the Copyright ClearanceCenter, Inc., Suite 910, 222 Rosewood Drive, Danvers, Massachusetts 01923, U.S.A.
ISBN 0-8213-4804-3
Cover design by Tomoko Hirata, World Bank.
Library of Congress Cataloging-in-Publication DataLibrary of Congress Cataloging-in-Publication Data has been applied for.
iii
Table of Contents
EXECUTIVE SUMMARY . . . . . . . . . . . . . . . . . . . . . . . . . . . . . . . . . . . . . . . . . . . . . . . . . . . . . . . . . . . . . . . . . . . . . . . .1
Introduction . . . . . . . . . . . . . . . . . . . . . . . . . . . . . . . . . . . . . . . . . . . . . . . . . . . . . . . . . . . . . . . . . . . . . . . . . . . . . . . .1Analysis . . . . . . . . . . . . . . . . . . . . . . . . . . . . . . . . . . . . . . . . . . . . . . . . . . . . . . . . . . . . . . . . . . . . . . . . . . . . . . . . . . . .1Overview of Bank Advice and Government Response . . . . . . . . . . . . . . . . . . . . . . . . . . . . . . . . . . . . . . . . . . . . . . . .3
INTRODUCTION . . . . . . . . . . . . . . . . . . . . . . . . . . . . . . . . . . . . . . . . . . . . . . . . . . . . . . . . . . . . . . . . . . . . . . . . . . . . . .4
EVALUATION OF SUBSIDY MECHANISMS . . . . . . . . . . . . . . . . . . . . . . . . . . . . . . . . . . . . . . . . . . . . . . . . . . . . . . . .7
Framework for Evaluation . . . . . . . . . . . . . . . . . . . . . . . . . . . . . . . . . . . . . . . . . . . . . . . . . . . . . . . . . . . . . . . . . . . . .7No Disconnection . . . . . . . . . . . . . . . . . . . . . . . . . . . . . . . . . . . . . . . . . . . . . . . . . . . . . . . . . . . . . . . . . . . . . . . . . . .10Across-the-board Price Subsidy . . . . . . . . . . . . . . . . . . . . . . . . . . . . . . . . . . . . . . . . . . . . . . . . . . . . . . . . . . . . . . . . .11Life-line Tariff . . . . . . . . . . . . . . . . . . . . . . . . . . . . . . . . . . . . . . . . . . . . . . . . . . . . . . . . . . . . . . . . . . . . . . . . . . . . . .14Price Discount for Privileged Consumers . . . . . . . . . . . . . . . . . . . . . . . . . . . . . . . . . . . . . . . . . . . . . . . . . . . . . . . . .16Burden Limit . . . . . . . . . . . . . . . . . . . . . . . . . . . . . . . . . . . . . . . . . . . . . . . . . . . . . . . . . . . . . . . . . . . . . . . . . . . . . . .17Other Earmarked Cash Transfers . . . . . . . . . . . . . . . . . . . . . . . . . . . . . . . . . . . . . . . . . . . . . . . . . . . . . . . . . . . . . . .19Non-earmarked Cash Transfers . . . . . . . . . . . . . . . . . . . . . . . . . . . . . . . . . . . . . . . . . . . . . . . . . . . . . . . . . . . . . . . .22Summary of Findings . . . . . . . . . . . . . . . . . . . . . . . . . . . . . . . . . . . . . . . . . . . . . . . . . . . . . . . . . . . . . . . . . . . . . . . . .24
WORLD BANK ADVICE AND GOVERNMENT RESPONSE . . . . . . . . . . . . . . . . . . . . . . . . . . . . . . . . . . . . . . . . .27
The Case of Poland . . . . . . . . . . . . . . . . . . . . . . . . . . . . . . . . . . . . . . . . . . . . . . . . . . . . . . . . . . . . . . . . . . . . . . . . . .28The Case of Russia . . . . . . . . . . . . . . . . . . . . . . . . . . . . . . . . . . . . . . . . . . . . . . . . . . . . . . . . . . . . . . . . . . . . . . . . . . .30
ANNEX 1 - HOUSEHOLD SURVEY DATA AND POVERTY LINES . . . . . . . . . . . . . . . . . . . . . . . . . . . . . . . .33
ANNEX 2 - PRIVILEGES AND POVERTY STATUS IN MOLDOVA AND UKRAINE . . . . . . . . . . . . . . . . . .35
ANNEX 3 - ADDITIONAL TABLES . . . . . . . . . . . . . . . . . . . . . . . . . . . . . . . . . . . . . . . . . . . . . . . . . . . . . . . . . . . .41
REFERENCES . . . . . . . . . . . . . . . . . . . . . . . . . . . . . . . . . . . . . . . . . . . . . . . . . . . . . . . . . . . . . . . . . . . . . . . . . . . . .57
The paper was prepared by a team that included Laszlo Lovei (team leader/energy), Eugene Gurenko (water),Michael Haney (Russia and Poland case studies), Philip O’Keefe (general social assistance), and Maria Shkaratan(statistical analysis/annexes). Staff in Bank offices in Central and Eastern Europe and the former Soviet Unionprovided data on utility prices, costs, and subsidies to the team. The peer reviewers were Margaret Grosh andBranko Milanovic. The paper also benefited from advice and data provided by Bank staff working on the paperMaking Transition Work for Everyone: Poverty and Inequality in Europe and Central Asia, World Bank, 2000,in particular, by Christine Jones, Mansoora Rashid, and Ruslan Yemtsov. The work was carried out under thegeneral guidance of Marcelo Selowsky, Chief Economist, Europe and Central Asia Region.

1
IntroductionFurthermore, the decline of real average household
income was coupled with increasing income polarization.As a result of these two trends, the share of the poor with-in the overall population reached alarming proportions inmany countries. Paying utility bills became a major chal-lenge for the rapidly growing army of poor households.Some governments simply pressured utility managers to belenient with households that did not pay their utility bills.By the middle of the 1990s, however, most governmentsrecognized that this does not provide a sustainable solu-tion, and started to experiment with various subsidyschemes aimed at low income households. The main objec-tives of this paper are (i) to provide a conceptual frame-work and methodology for the evaluation of utility subsidymechanisms in order to help decisionmakers choose themechanism that suits their specific circumstances and pri-orities best; and (ii) to present the results of applying thismethodology to a selected number of countries and utili-ties relying on currently available information and data.
Utility subsidies can serve many objectives. Sometimesgovernments want to ensure that all households receive abasic (universal) level of service because of the perceivedpositive externalities associated with it, or as an attempt to“buy” support from the electorate. A temporary subsidymay be an acceptable “price” to pay for making a largetariff increase politically palatable. Subsidies to certainclasses of consumers may facilitate a systematic effort to
strengthen payment discipline and reduce the stock of out-standing receivables. Finally, subsidies may enable thepoor to receive utility services without having to sacrificeother essential needs. The analysis in this paper is presentedfrom the point of view of this last objective.
AnalysisHouseholds receive several types of utility subsidies in
Central and Eastern Europe and the former Soviet Union.In order to simplify the analysis in this paper, we havegrouped these subsidies into the following seven categories:
• No disconnection of delinquent residential customers
• Across-the-board household price subsidies• Life-line tariffs (with two fixed or “floating” blocks,
or with three blocks)• Price discounts provided to certain households
selected on the basis of occupation, medical history,age, merit, etc.
• Compensation for the share of utility expendituresthat exceeds a notional burden limit set as a givenpercentage of monthly household income (basedon actual utility expenditures or expenditure norms)
• Other earmarked cash transfers helping low incomehouseholds to pay for utility services
• Non-earmarked cash transfers to poor households.To evaluate the performance of utility subsidy mech-
ntil the early 1990s, utility prices were set artificially low for residential consumers in mostcountries in Central and Eastern Europe and the former Soviet Union. When the cost of theseacross-the-board price subsidies became unaffordable, one government after another decid-
ed to bring residential tariffs closer to supply costs. The resulting price adjustment process, however,turned out to be more painful than originally expected. The required large increase in the prices of util-ity services coincided with a decrease in household incomes due to the general contraction of economic activity.
U
Executive Summary

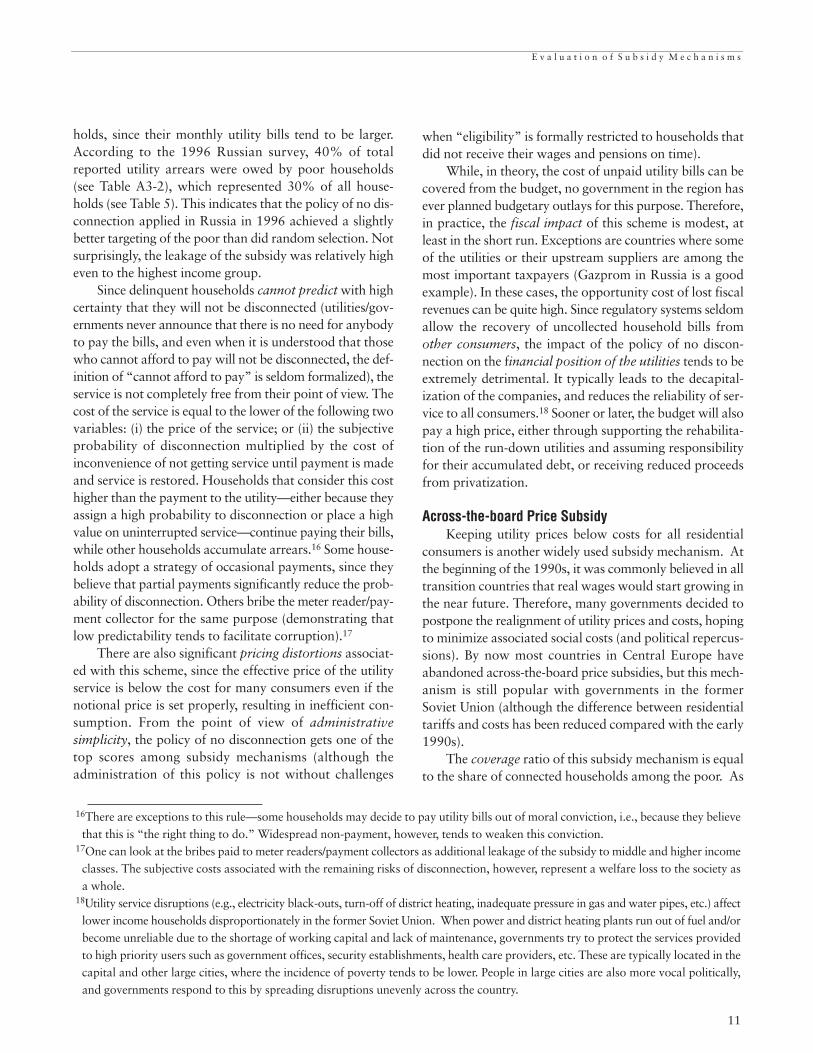
EVALUATION OF SUBSIDY MECHANISMSa
Life- Price Burden Burden Other Non-Across the Life- Life- line Discount Limit Limit Ear- ear-
No Board line line with for Based on Based on marked markedEvaluation Discon- Price with 2 with 3 Floating Privileged Actual Util. Exp. Cash CashCriteria nection Subsidy Blocks Blocks Blocks Consumers Util. Exp. Norms Transfer Transfer
Coverage 1 1 to 2 1 to 2 1 to 2 1 to 2 1 1 1 1 1
Targeting 1 0 0 2 1 1 0 1 2 2
Predictability 0 2 2 1 2 2 1 1 1 1
Pricing Dis- -2 -2 -1 -2 -1 -1 -1 0 -1 0
tortion
Administra- 0 0 0 0 -1 -1 -2 -2 -2 -2
tion Cost/
Difficulty
Aggregate 2 2 to 4 3 to 5 5 to 7 4 to 6 4 0 3 4 5
Scoreb
a Scoring: 0 – low, 1 – medium, 2 – high (see the last section of Chapter II for more information).b Calculated with double weights to first two criteria.
M a i n t a i n i n g U t i l i t y S e r v i c e s f o r t h e P o o r
2
anisms, the paper relies on household survey data, augmented with information provided by government min-istries and statistical bureaus. Each subsidy mechanism isevaluated against the following criteria (first, at a concep-tual level, and then using real-life examples):
• The extent to which the poor are being reached (i.e.,coverage)
• The share of the subsidy that goes to the poor (i.e.,targeting)
• Predictability of the benefit for the poor (whichtends to be inversely related to corruption)
• The extent of pricing distortions and other unin-tended side effects due to the subsidy
• Administrative simplicity.In addition, the paper briefly reviews the financial
impact of each subsidy mechanism on the budget, other(non-household) consumers, and utilities. The paper cov-ers electricity, gas, heat, water, and sewerage services.
We have found that subsidy mechanisms that performwell according to some of the criteria tend to performpoorly according to others (e.g., high coverage is usuallyassociated with low targeting). Furthermore, not all sub-sidy mechanisms are applicable or perform equally wellacross all countries and utility services (the lack of meter-ing in water supply, for example, poses a problem for life-line tariffs). Therefore, it has not been possible to identify
one subsidy mechanism that outperforms all other mech-anisms irrespective of country circumstances and prefer-ences. It has been possible, however, to identify subsidymechanisms that, at least from the point of view of theabove five criteria, are unlikely to be top performers in anycountry and sector. These are the mechanisms of no-dis-connection, across-the-board price subsidy, earmarkedcash transfers, and burden limits.
The table below presents the main results of the eval-uation in a numerical format. To find the subsidy mecha-nism that suits their circumstances best, decisionmakersneed to (i) obtain information on the share of the poor con-nected to each type of utility service (this will help to nar-row down the coverage scores of across-the-board subsi-dies and life-line tariffs); (ii) consider the possibility ofmetering/billing actual household consumption (this willshow whether life-line tariffs are a meaningful option);(iii) determine the weights that they assign to each of thefive criteria (if metering/billing of actual consumption is notfeasible, zero weight should be assigned to the price dis-tortion criterion); (iv) calculate aggregate scores for eachsubsidy mechanism and for each type of utility service; and(v) identify the subsidy mechanisms that received the high-est aggregate scores for each type of utility service.
To illustrate how this can be done, we included anaggregate score in the table, calculated with double weights

E x e c u t i v e S u m m a r y
3
assigned to the first two criteria. For utilities with high connection ratios among the poor (e.g., electricity andwater supply in most countries), the three-block and the“floating”-block life-line tariffs occupy the first and the sec-ond place, respectively. For utilities with lower connec-tion ratios among the poor (typically, district heat, gas, andsewerage), the first place is shared between non-earmarkedcash transfers and the three-block life-line tariff. When noreliable estimate exists for actual consumption (or thebilling system has major deficiencies), life-line tariffs dropout, the criterion of pricing distortions becomes meaning-less, and the top score goes to cash transfers/privilegedconsumer discounts or across-the-board price subsidies,depending on the connection rate of the poor.
In principle, the cost of the household subsidies can becovered by the utilities themselves, non-household con-sumers, or the budget. The first option, however, rapidlyleads to the depletion of the working capital of the utilities,which in turn reduces the reliability of the services they pro-vide, and the resulting and inevitable curtailments (whichtend to have an anti-poor bias) reverse the poverty allevi-ation impact of the subsidy. The second option may alsobecome unsustainable if demand from industrial con-sumers is highly elastic with respect to price. Even when theshort-term price elasticity of industrial demand for a spe-cific utility service is relatively low, the welfare cost of dis-torting the price of an essential input is likely to be largerin the long run than the deadweight loss associated withadditional taxes in the context of a well-functioning taxregime. Cross-subsidies also run counter to the worldwidetrend to liberalize the supply of electricity and gas to indus-trial consumers. In summary, financing of the subsidy fromthe budget seems to be the best option in most utility sec-tors and countries.
Overview of Bank Advice and Government ResponsePointing to the need to reduce fiscal deficits, the Bank
advocated a rapid phase-out of across-the-board utilitysubsidies in all countries in the region. In the former SovietUnion, the Bank also argued strongly against the wide-spread tolerance of non-payment and the continued appli-cation of large price discounts to privileged consumers.Responding to government concerns that many house-holds would not be able to pay tariffs that fully covercosts, the Bank generally recommended the use of income-tested subsidies to soften the negative impact of rising util-ity tariffs on low income households. However, the Bankprovided little practical advice on the administration and
financing of these income-tested cash transfer mechanisms,and tended to overestimate the coverage of the poor thatcould be achieved by these mechanisms in real life. In sev-eral countries in the former Soviet Union, the Bankendorsed the application of a specific income-tested sub-sidy mechanism, burden limits, without noticing the lowcoverage and targeting ratios that this subsidy mechanismproduced. A possible explanation for this oversight is theinsufficient amount of analytical work that supported andsubstantiated Bank advice. There were few Bank studiesthat relied on statistical evidence from household surveysto evaluate the extent to which the applied subsidy mech-anisms reached their stated objectives.
Heeding the Bank’s message about fiscal prudence,most countries in the region have made significant progressin phasing out budget-funded across-the-board utility sub-sidies. However, their track record is less positive con-cerning the phase-out of across-the-board subsidies fund-ed through higher prices paid by industrial and commercialconsumers. Also, the countries of the former Soviet Union(with the exception of the Baltic states) have achievedonly modest progress in their efforts to strengthen paymentdiscipline and to phase out price discounts to privilegedhouseholds. As a result, several subsidy mechanisms coex-ist in many countries in the region today, providing moresupport to the middle class than to the poor, and having adetrimental impact on the financial health of utilities, onindustrial competitiveness, and on local and central gov-ernment budgets.
In view of these remaining challenges, the Bank shouldstep up its assistance to governments that are willing tomove away from particularly ineffective and costly subsidymechanisms (for example, governments that have decidedto sell state-owned electricity and gas distribution compa-nies to strategic investors, since the new owners will moreaggressively pursue and ultimately disconnect non-payinghouseholds). In each country where the government issearching for a better way to protect the poor, an effortneeds to be made to collect data on utility connectionratios, household expenditures, and the impact of the cur-rently applied subsidy mechanisms on the poor and thenon-poor. In some countries, the necessary informationwill be available from previous household surveys, whilein other countries, new household surveys will have to beundertaken. The time and money spent on these surveyswill enable the Bank to provide higher quality and moreconvincing advice to its clients.

4
Households received a cross-subsidy from large (typ-ically industrial) consumers, who paid higher than averageutility tariffs despite lower than average costs,1 and alsoenjoyed an across-the-board subsidy provided to all class-es of energy consumers (in the form of budgetary transfersfinancing the capital costs of energy production, trans-port, and distribution). The same “cross-subsidy on top ofan across-the-board subsidy” mechanism operated inwater supply and sewerage.
By the mid-1990s, these low household utility tariffshad become unsustainable in most countries in the region.
The budget lacked resources to cover the costs of pricesubsidies, industrial consumers revolted against high tar-iffs that hurt their international competitiveness (severalswitched to self-supply), and many of the newly corpora-tized (in some cases privatized) utilities were reluctant toshoulder indefinitely the losses associated with the low res-idential tariffs. The resulting price adjustment process,however, turned out to be more painful than originallyexpected.
The required large increase in the prices of utility services coincided with a decrease in household incomes
Introduction
ntil the end of the 1980s, major production and investment decisions in Central and EasternEurope and the former Soviet Union were guided by political considerations, resulting in pro-duction patterns and fixed assets that turned out to be uneconomic after these economies were
opened to international trade. Commodity prices were divorced from world market prices and setadministratively to facilitate the fulfillment of centrally prepared plans. Gas, electricity, and heat pricespaid by residential consumers were set particularly low.
U
1The transport and distribution of electricity, gas, heat, and water is subject to a positive economy of scale. This economy ofscale effect explains the natural monopoly characteristics of basic utility services, justifying the need for economic regulation.
2 Due to the growing share of the informal economy in Ukraine, official statistics may overstate the decline of income by as much as20 percentage points.
TABLE 1. UKRAINE: AVERAGE HOUSEHOLD INCOME AND ENERGY TARIFFS, 1992-98 (1992=100, CPI ADJUSTED)
% Income 2 Electricity Tariff Natural Gas Tariff District Heat Tariff (Kiev City)
1992 100 100 100 100
1993 65 47 27 69
1994 44 79 46 180
1995 41 376 448 1270
1996 38 578 643 1953
1997 43 617 613 1973
1998 43 594 563 1644
Source: World Bank staff estimates based on data from the State Statistical Committee and the Ministry of Economy.
5
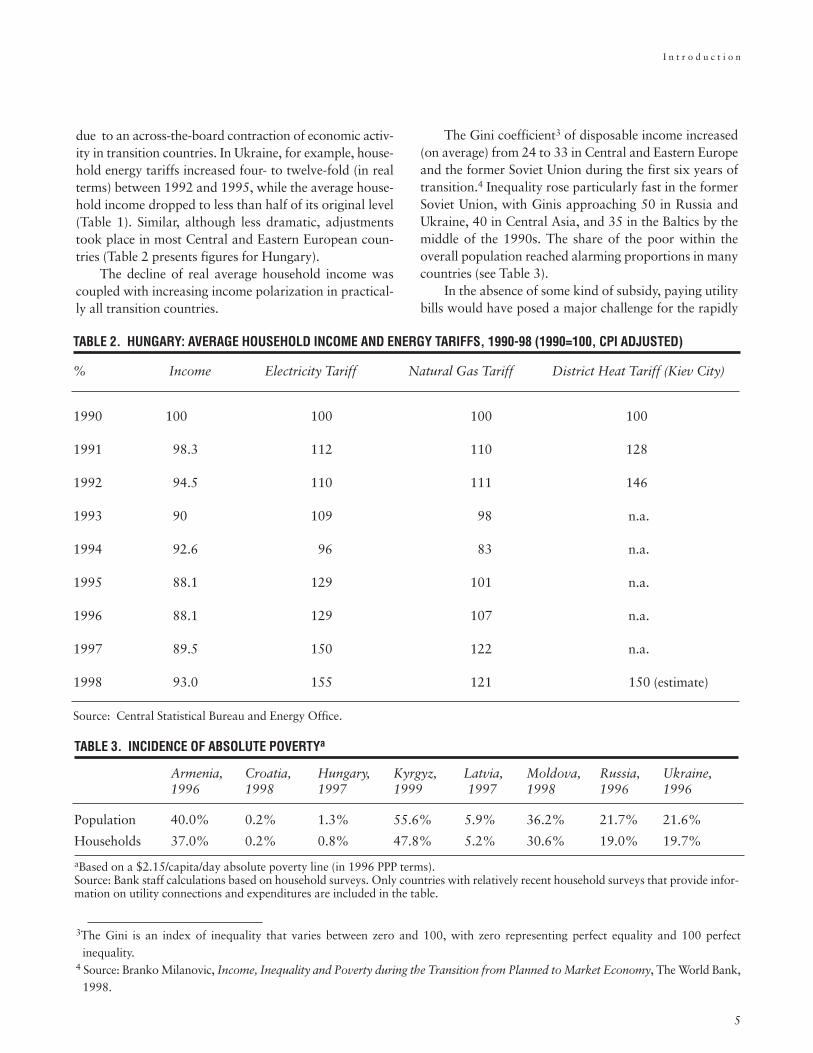
due to an across-the-board contraction of economic activ-ity in transition countries. In Ukraine, for example, house-hold energy tariffs increased four- to twelve-fold (in realterms) between 1992 and 1995, while the average house-hold income dropped to less than half of its original level(Table 1). Similar, although less dramatic, adjustmentstook place in most Central and Eastern European coun-tries (Table 2 presents figures for Hungary).
The decline of real average household income wascoupled with increasing income polarization in practical-ly all transition countries.
The Gini coefficient3 of disposable income increased(on average) from 24 to 33 in Central and Eastern Europeand the former Soviet Union during the first six years oftransition.4 Inequality rose particularly fast in the formerSoviet Union, with Ginis approaching 50 in Russia andUkraine, 40 in Central Asia, and 35 in the Baltics by themiddle of the 1990s. The share of the poor within theoverall population reached alarming proportions in manycountries (see Table 3).
In the absence of some kind of subsidy, paying utilitybills would have posed a major challenge for the rapidly
I n t r o d u c t i o n
3The Gini is an index of inequality that varies between zero and 100, with zero representing perfect equality and 100 perfect inequality.
4 Source: Branko Milanovic, Income, Inequality and Poverty during the Transition from Planned to Market Economy, The World Bank,1998.
TABLE 2. HUNGARY: AVERAGE HOUSEHOLD INCOME AND ENERGY TARIFFS, 1990-98 (1990=100, CPI ADJUSTED)
% Income Electricity Tariff Natural Gas Tariff District Heat Tariff (Kiev City)
1990 100 100 100 100
1991 98.3 112 110 128
1992 94.5 110 111 146
1993 90 109 98 n.a.
1994 92.6 96 83 n.a.
1995 88.1 129 101 n.a.
1996 88.1 129 107 n.a.
1997 89.5 150 122 n.a.
1998 93.0 155 121 150 (estimate)
Source: Central Statistical Bureau and Energy Office.
TABLE 3. INCIDENCE OF ABSOLUTE POVERTYa
Armenia, Croatia, Hungary, Kyrgyz, Latvia, Moldova, Russia, Ukraine,1996 1998 1997 1999 1997 1998 1996 1996
Population 40.0% 0.2% 1.3% 55.6% 5.9% 36.2% 21.7% 21.6%
Households 37.0% 0.2% 0.8% 47.8% 5.2% 30.6% 19.0% 19.7%
aBased on a $2.15/capita/day absolute poverty line (in 1996 PPP terms). Source: Bank staff calculations based on household surveys. Only countries with relatively recent household surveys that provide infor-mation on utility connections and expenditures are included in the table.

M a i n t a i n i n g U t i l i t y S e r v i c e s f o r t h e P o o r
6
growing army of poor households. For example, just thedistrict heating bill would have exceeded 60% of the (cashplus in-kind) income of a typical family of four in the low-est income quintile living in a small apartment of 40 m2 inMoldova during the heating season in 1997/98.5 After thetactic of delaying tariff adjustments was exhausted, somegovernments simply pressured utility managers to belenient with households that did not pay their utility bills.6
By the middle of the 1990s, however, most governmentsrecognized that these practices do not provide a sustainablesolution, and started to experiment with various subsidyschemes aimed (according to official statements) at lowincome households. As a result of these subsidy schemes,the share of expenditures used on utilities remained with-in tolerable limits for most households in the region,including the poor (see Table 4).
The main objectives of this paper are (i) to provide aconceptual framework and methodology for the evaluationof utility subsidy mechanisms in order to help deci-
siomakers choose the mechanism that best suits their spe-cific circumstances and priorities; and (ii) to present theresults of applying this methodology to a selected numberof countries and utilities relying on currently availableinformation and data. The utilities covered are electricity,natural gas, district heat, water, and sewerage. The paperis divided into three chapters. After this first introductorychapter, the second chapter describes the pros and cons ofeach subsidy mechanism at a conceptual level, and thenillustrates these with real-life examples. The third chapterreviews the evolution of Bank advice and governmentresponses in this area, and draws lessons for the future.Supplementing the main text of the report, Annex 1 pro-vides information on household survey data sets andabsolute and relative poverty lines that we used in theanalysis. Annex 2 describes the assumptions we madewhen assessing the system of price discounts for privilegedconsumers. Finally, Annex 3 presents additional tablessupporting the main findings of the report.
5Due to the rapid depreciation of the Leu and a decrease in real incomes, the full cost of district heating for the same Moldovan family exceeded the family’s income by the end of the 1998/99 heating season. Even for a family of four with the estimated nation-wide average per capita income, paying the full cost of district heating would have required about 40% of the total income of the family.
6Industrial, agricultural, and budgetary customers also benefited from this political pressure. The stock of receivables in the Ukrainian power industry, for example, ballooned from $650 million to $3.2 billion between early 1995 and end-1996.
TABLE 4. SHARE OF UTILITY EXPENDITURES IN TOTAL HOUSEHOLD EXPENDITURE
Poverty Groups Armenia, Croatia, Hungary, Kyrgyz, Latvia, Moldova, Russia, Ukraine,(absolute poverty line) 1996 1998 1997 1999 1997 1998 1996a 1996
Non-poor 11.4% 7.9% 15.4% 7.9% 25.3% 12.8% 7.7% 4.0%
Poor 10.2% 9.0% 12.1% 10.6% 44.8% 12.5% 29.1% 3.5%
All households 11.0% 7.9% 15.3% 9.4% 26.3% 12.7% 12.3% 3.9%
aRent is included in utility expenditure.Source: Bank staff calculations using household survey data.

7
Evaluation of SubsidyMechanisms
tility subsidies can serve many objectives. Sometimes governments want to ensure that allhouseholds receive a basic (universal) level of service because of the perceived positive externalities associated with it,7 or as an attempt to “buy” support from the electorate. A tem-
porary subsidy giving households time to adjust may be an acceptable “price” to pay for making alarge tariff increase politically palatable. Subsidies to certain classes of consumers may facilitate a sys-tematic effort to strengthen payment discipline and reduce the stock of outstanding receivables. Finally,subsidies may enable the poor to receive utility services without having to sacrifice other essentialneeds. The analysis in this paper is presented from the point of view of this last objective.
UFramework for Evaluation
Households receive several types of utility subsidies inCentral and Eastern Europe and the former Soviet Union.In order to simplify the analysis in this paper, we havegrouped these subsidies into the following seven cate-gories:
• No disconnection of delinquent residential customers
• Across-the-board household price subsidies• Life-line tariffs (with two fixed or “floating” blocks,
or with three blocks)• Price discounts provided to certain households
selected on the basis of occupation, medical history,age, merit, etc.
• Compensation for the share of utility expendituresthat exceeds a notional burden limit, set as a givenpercentage of monthly household income (basedon actual utility expenditures, or on utility expen-diture norms)
• Other earmarked cash transfers helping lowincome households to pay for utility services
• Non-earmarked cash transfers to poor households. The performance of a subsidy mechanism depends on
its success in reaching the poor, and on the amount of pur-chasing power it transfers to them.8 Since the average support per beneficiary provided by most utility subsidymechanisms can be adjusted relatively easily (within cer-tain limits), the real challenge is to increase coverage.9
However, the evaluation of any subsidy mechanismshould go beyond the amount of support provided to thepoor. First, subsidies have a cost that needs to be financedfrom somewhere. For a given level of purchasing power tobe transferred to the poor, this cost depends on the tar-geting efficiency of the subsidy mechanism.10 Second,some subsidy mechanisms allow the poor to count on alevel of support with a reasonable certainty, while benefitsfrom other mechanisms are highly unpredictable (which
7Water and sewerage utilities provide health benefits that extend beyond the members of a household receiving these services,suggesting that private willingness-to-pay may be somewhat below the socially optimal level. The same consideration, however,does not apply to electricity, gas, and district heat (the frequently cited public benefits of street lighting are independent from thesupply of electricity to individual households).
8These two factors determine the effectiveness of the subsidy, defined as the percentage of the poverty gap eliminated.9Conceptually, the coverage ratio is equal to (1-e)u, where e is the error of exclusion (the ratio of those who are poor but don’tqualify) and u is the rate of subsidy uptake (the ratio of those among the poor who decide to apply).
10The targeting ratio or efficiency of a subsidy mechanism is equal to P (1-i) / [P (1-i)+N i], where P is the average benefitprovided to the poor, i is the error of inclusion, and N is the average benefit provided to the non-poor. Sometimes i is dividedinto two parts, formal inclusion error (when the eligibility criteria are designed in a way that they knowingly allow certain non-poor households to receive the subsidy) and infiltration (when some recipients “fake” poverty and qualify due to inadequateeligibility checks).

8
tends to invite corruption in countries with poor gover-nance). Third, subsidies have unintended side effects due totheir interference with price signals and other incentivesresulting in the wasteful use of resources. Fourth, certaintypes of subsidies demand sophisticated institutions ortechnology to administer them, while others require verylittle extra administrative effort.
Based on the above considerations, we use the fol-lowing five criteria to evaluate the performance of utilitysubsidy mechanisms:
• The extent to which the poor are being reached (i.e.,coverage)
• The share of the subsidy that goes to the poor (i.e.,targeting)
• Predictability of the benefit for the poor• The extent of pricing distortions and other unin-
tended side-effects due to the subsidy• Administrative simplicity.The evaluation of each mechanism is divided into two
parts: (i) a brief description of the mechanism and a dis-cussion of its performance at a conceptual level, includingsome of the problems that are likely to be encounteredwhen applying the mechanism in practice; and (ii) illustra-tion of the main conclusions through the analysis of avail-able empirical data.
Not all criteria are of the same level of importance. Agovernment with a chronic shortage of budgetary resourcesmay assign top priority to reducing the leakage of the sub-sidy to the non-poor. Another government with a limitedinstitutional capacity may value administrative simplicitymore highly. Unfortunately, subsidy mechanisms that per-form well according to some of the criteria tend to performpoorly according to others (e.g., high coverage is usuallyassociated with low targeting). Furthermore, not all sub-
sidy mechanisms are applicable or perform equally wellacross the full range of utility services. The lack of meter-ing of water use, for example, may pose a problem for life-line tariffs.11 Therefore, it is not possible to rank subsidymechanisms independently of time, place, and sector. Theaim of the paper is to help decisionmakers choose the sub-sidies that are most likely to suit the specific circumstancesin their countries.
For most decisionmakers, it also matters who has toshoulder the cost of the subsidy. In some countries, there isa separate line item in the budget covering this cost. Inother countries, the cost is borne by industrial or other non-household consumers through utility tariffs that are setabove costs. Sometimes, however, the budget is unable tohonor this obligation, or the industrial customer base col-lapses, and utilities end up absorbing the cost of the sub-sidy. Although governments have considerable freedom ofchoice in selecting the source of financing, not all subsidymechanisms are equally amenable to being financed fromthe budget or through higher industrial tariffs. The dis-cussion of each subsidy mechanism below includes a briefassessment of its financial impact on the budget, non-household consumers, and utilities.
Since decisions about subsidy mechanisms are made inthe context of a single country, we used a relative definitionof poverty for the purpose of the evaluation. In each coun-try, we considered as poor those household survey respon-dents whose per capita consumption was less than two-thirds of the median per capita consumption of all surveyedhouseholds (see Annex 1 for details). The share of the (rel-ative) poor in countries with recent household surveys ofacceptable quality are presented in Table 5. As expected,the incidence of relative poverty is higher in countries witha higher level of inequality.
M a i n t a i n i n g U t i l i t y S e r v i c e s f o r t h e P o o r
11There is a solution to this problem in district heating and gas (assuming it is used for space heating)—the heat/gas bill can be calculated using the amount of heated apartment space as a proxy for heat/gas consumption.
TABLE 5. INCIDENCE OF RELATIVE POVERTY
Armenia, Croatia, Hungary, Kyrgyz, Latvia, Moldova, Russia, Ukraine,1996 1998 1997 1999 1997 1998 1996 1996
Population 28.6% 18.2% 18.7% 27.8% 20.5% 23.43% 30.0% 25.0%
Households 29.8% 19.7% 16.7% 23.6% 18.8% 22.6% 30.4% 26.5%
Source: Bank staff calculations using data from household surveys.

E v a l u a t i o n o f S u b s i d y M e c h a n i s m s
9
Table 6 above presents the average share of utilityexpenditures within total household expenditures in thesecountries.12 The large differences that can be observedbetween countries seem to be more reflective of differ-ences in the level of cost recovery than in the level ofincome. Heating, for example, was heavily subsidized inUkraine in 1996. In addition, non-payment was wide-spread in Moldova, Russia, and Ukraine when the house-hold surveys were undertaken. The differences betweenpoor and non-poor in the burden utility expendituresplaced on household budgets were insignificant inArmenia, Croatia, Hungary, Moldova, and Ukraine. InRussia and Latvia, however, utility expenditures repre-sented a significantly larger share of total householdexpenditures for poor than non-poor households.
We encountered considerable difficulties during theevaluation of the subsidy mechanisms. First, we found thattwo (or more) types of subsidies co-exist in the same sectorin many countries. In Ukraine, for example, most non-pay-ing households don’t get disconnected from the electricitynetwork, the residential electricity tariff is kept belowcosts, a large number of households receive electricity pricediscounts of 50 to 100%, and a housing allowance systemcovers part of the utility bill if it exceeds 15% (more recent-ly, 20%) of household income. In order to keep matterssimple, the analysis in the paper is based on relatively“clear-cut” cases, and provides no guidance on the inter-action between two or three subsidy mechanisms.
Second, we found that several of the household surveydata sets were of poor quality (at least from the point ofview of this exercise), particularly the ones from the formerSoviet Union, and had to be dropped from the study. Dataproblems included (i) poorly formulated questions; 13 (ii)missing or implausible answers; (iii) data imputed using adoubtful methodology; and (iv) the poor timing of sur-veys.14 After eliminating these data sets, we were left witha smaller number of surveys than ideally required to testthe robustness of some of the findings. Third, the surveys(understandably) did not provide all the information need-ed to evaluate the subsidy mechanisms. The necessaryadditional information (e.g., on eligibility criteria, bud-getary outlays, administration costs, etc.) was obtaineddirectly from those government ministries that provid-ed/monitored the subsidies.
The analysis of subsidy mechanisms below leaves opensome important issues. As noted above, it does not coverthe interaction between various utility subsidy mechanisms(e.g., the combined effect of a life-line tariff and a burdenlimit), and between utility subsidies and other sector-spe-cific subsidy schemes (e.g., housing and food subsidies).Furthermore, it does not provide practical guidance onhow to make the selected subsidy mechanisms perform bet-ter, and how to adopt these to changes in utility ownershipand regulation. These issues represent an agenda for furtherresearch.
12The numbers in Table 6 differ slightly from the numbers in Table 4, since the definition of the poor in Table 4 was based on the absolutepoverty line.
13An example is the question “how much is your monthly payment for utilities?” in a country where district heating is heavily seasonal,delinquent households don’t get disconnected, and there is also a housing allowance scheme. Without additional information, it is dif-ficult to tell whether the response is based on (i) the actual payment or the utility bill that in fact did not get paid; (ii) the payment/billin the survey month or the monthly average during the year; and (iii) the full payment, including the payment from the housingallowance scheme, or the net payment after deducting a part of the bill paid by the housing office.
14An example is a survey carried out in Bulgaria over a course of several months that included a period of hyperinflation followed bymonetary stabilization.
TABLE 6. SHARE OF UTILITY EXPENDITURE IN TOTAL HOUSEHOLD EXPENDITURE
Armenia, Croatia, Hungary, Kyrgyz, Latvia, Moldova, Russia, Ukraine,1996 1998 1997 1999 1997 1998 1996a 1996
Non-poor 11.4% 7.9% 15.4% 7.9% 25.3% 12.8% 7.7% 4.0%
Poor 10.2% 9.0% 12.1% 10.6% 44.8% 12.5% 29.1% 3.5%
All households 11.0% 7.9% 15.3% 9.4% 26.3% 12.7% 12.3% 3.9%
aRent is included in utility expenditure.Source: Bank staff calculations using data from household surveys.

M a i n t a i n i n g U t i l i t y S e r v i c e s f o r t h e P o o r
10
No DisconnectionIn several countries in the region, utilities are pressured
by governments not to disconnect households that don’tpay their bills. The pressure comes from local as well ascentral governments, sometimes in the form of executiveorders motivated by social and political considerations. Acouple of Parliaments in the former Soviet Union evenpassed a law forbidding the disconnection of those who didnot receive their salary or pension on time. Countries inCentral Europe have never really caught this habit and theBaltic states have managed to get out of it, but non-pay-ment by residential (and most other) consumers hasremained widespread in the Balkans and throughout therest of the former Soviet Union.15 Payment discipline hasgreatly improved in the few cases when utilities were soldto foreign strategic investors (particularly in the electricitysector), but the transfer of ownership to management,workers, and local investors has produced limited results.
The coverage of the poor achieved by the policy of nodisconnection is significantly less than 100%. First, as
presented in Table 7 below, many poor households aresimply not connected to district heating, gas, hot water, andsewerage. Second, some poor households may decide topay their utility bills since they value the risk of discon-nection higher. In a household survey carried out in Russiain 1996, 39% of poor families reported that they hadunpaid utility bills (see Table A3-1).
The targeting of the poor through this mechanismdepends on (i) the share of the poor among those who havepayment arrears; and (ii) the relative size of the averagepayment arrears of poor and non-poor households (assum-ing that the subsidy received by each household is equal tothe household’s payment arrears). One could expect lowincome households to be over-represented among house-holds with payment arrears due to (i) the pro-poor bias inofficial announcements about tolerating non-payments;and (ii) the higher subjective value that non-poor house-holds assign to uninterrupted utility service. On the otherhand, it is likely that the average size of the paymentarrears is larger in the case of delinquent non-poor house-
15That a delinquent customer continues to receive supply for social reasons is not unheard-of in the West. Northern American utili-ties, for example, frequently postpone the disconnection of poor households in order to avoid creating life-threatening situations inthe winter. Unless customers start repaying their arrears in the spring, however, they do get cut off. Uncollected revenues represent less than 1% of billed revenues for most Northern American utilities. In the former Soviet Union, this ratio tends to be 20-30times higher.
TABLE 7. PERCENTAGE OF HOUSEHOLDS CONNECTED TO UTILITIES
Utilities Poverty Armenia, Croatia, Hungary, Kyrgyz, Latvia, Moldova, Russia, Ukraine,Groups 1996a 1998 1997 1999 1997 1998 1996 1996
Electricity Non-poor 99.0% 99.8% na 98.8% 99.9% 99.8% na 99.9%
Poor 98.2% 99.0% na 99.2% 98.7% 97.7% na 99.5%
District Heating Non-poor 9.0% 33.4% 26.6% 30.0% 69.9% 35.9% 72.7% 31.2%
Poor 10.4% 7.8% 14.8% 12.5% 49.0% 23.1% 62.5% 36.9%
Network Gas Non-poor 1.9% 27.1% 82.0% 21.8% 52.9% 30.0% 63.1% na
Poor 1.4% 11.0% 56.4% 8.6% 38.4% 21.4% 60.9% na
Water Non-poor 88.4% 96.6% 93.4% 76.2% 83.9% 35.0% 79.2% 57.8%
Poor 87.4% 74.5% 73.4% 68.7% 70.2% 20.0% 68.2% 69.5%
Hot Water Non-poor 1.2% 42,6% na 0.7% 59.0% 32.9% 61.4% 24.3%
Poor 1.0% 20.3% na 0.1% 39.3% 19.3% 45.3% 24.8%
Sewerage Non-poor na 79.6% 92.8% na 82.1% 35.0% 69.9% 34.1%
Poor na 51.2% 71.0% na 66.4% 20.0% 57.4% 39.8%
aHouseholds with connections to non-functioning utility services are not considered connected.Source: Bank staff calculations using data from household surveys.
11
holds, since their monthly utility bills tend to be larger.According to the 1996 Russian survey, 40% of totalreported utility arrears were owed by poor households(see Table A3-2), which represented 30% of all house-holds (see Table 5). This indicates that the policy of no dis-connection applied in Russia in 1996 achieved a slightlybetter targeting of the poor than did random selection. Notsurprisingly, the leakage of the subsidy was relatively higheven to the highest income group.
Since delinquent households cannot predict with highcertainty that they will not be disconnected (utilities/gov-ernments never announce that there is no need for anybodyto pay the bills, and even when it is understood that thosewho cannot afford to pay will not be disconnected, the def-inition of “cannot afford to pay” is seldom formalized), theservice is not completely free from their point of view. Thecost of the service is equal to the lower of the following twovariables: (i) the price of the service; or (ii) the subjectiveprobability of disconnection multiplied by the cost ofinconvenience of not getting service until payment is madeand service is restored. Households that consider this costhigher than the payment to the utility—either because theyassign a high probability to disconnection or place a highvalue on uninterrupted service—continue paying their bills,while other households accumulate arrears.16 Some house-holds adopt a strategy of occasional payments, since theybelieve that partial payments significantly reduce the prob-ability of disconnection. Others bribe the meter reader/pay-ment collector for the same purpose (demonstrating thatlow predictability tends to facilitate corruption).17
There are also significant pricing distortions associat-ed with this scheme, since the effective price of the utilityservice is below the cost for many consumers even if thenotional price is set properly, resulting in inefficient con-sumption. From the point of view of administrative simplicity, the policy of no disconnection gets one of thetop scores among subsidy mechanisms (although theadministration of this policy is not without challenges
when “eligibility” is formally restricted to households thatdid not receive their wages and pensions on time).
While, in theory, the cost of unpaid utility bills can becovered from the budget, no government in the region hasever planned budgetary outlays for this purpose. Therefore,in practice, the fiscal impact of this scheme is modest, atleast in the short run. Exceptions are countries where someof the utilities or their upstream suppliers are among themost important taxpayers (Gazprom in Russia is a goodexample). In these cases, the opportunity cost of lost fiscalrevenues can be quite high. Since regulatory systems seldomallow the recovery of uncollected household bills fromother consumers, the impact of the policy of no discon-nection on the financial position of the utilities tends to beextremely detrimental. It typically leads to the decapital-ization of the companies, and reduces the reliability of ser-vice to all consumers.18 Sooner or later, the budget will alsopay a high price, either through supporting the rehabilita-tion of the run-down utilities and assuming responsibilityfor their accumulated debt, or receiving reduced proceedsfrom privatization.
Across-the-board Price SubsidyKeeping utility prices below costs for all residential
consumers is another widely used subsidy mechanism. Atthe beginning of the 1990s, it was commonly believed in alltransition countries that real wages would start growing inthe near future. Therefore, many governments decided topostpone the realignment of utility prices and costs, hopingto minimize associated social costs (and political repercus-sions). By now most countries in Central Europe haveabandoned across-the-board price subsidies, but this mech-anism is still popular with governments in the former Soviet Union (although the difference between residentialtariffs and costs has been reduced compared with the early1990s).
The coverage ratio of this subsidy mechanism is equalto the share of connected households among the poor. As
E v a l u a t i o n o f S u b s i d y M e c h a n i s m s
16There are exceptions to this rule—some households may decide to pay utility bills out of moral conviction, i.e., because they believethat this is “the right thing to do.” Widespread non-payment, however, tends to weaken this conviction.
17One can look at the bribes paid to meter readers/payment collectors as additional leakage of the subsidy to middle and higher incomeclasses. The subjective costs associated with the remaining risks of disconnection, however, represent a welfare loss to the society asa whole.
18Utility service disruptions (e.g., electricity black-outs, turn-off of district heating, inadequate pressure in gas and water pipes, etc.) affectlower income households disproportionately in the former Soviet Union. When power and district heating plants run out of fuel and/orbecome unreliable due to the shortage of working capital and lack of maintenance, governments try to protect the services providedto high priority users such as government offices, security establishments, health care providers, etc. These are typically located in thecapital and other large cities, where the incidence of poverty tends to be lower. People in large cities are also more vocal politically,and governments respond to this by spreading disruptions unevenly across the country.

M a i n t a i n i n g U t i l i t y S e r v i c e s f o r t h e P o o r
12
presented in Table 7, this share tends to be very high in thecase of electricity, somewhat lower for (cold) water, and sig-nificantly lower for gas, sewerage, hot water, and districtheat. Interestingly, the opposite tends to be true for the sizeof the price subsidy—district heating, hot water, and sew-erage are typically the most subsidized utilities (when thesubsidy per unit of consumption is expressed as a percent-age of unit costs), followed by water, gas, and electricity.This suggests that most governments in the region maintainacross-the-board utility price subsidies for political ratherthan social reasons.
The targeting ratio of across-the-board price subsi-dies is influenced by two factors: (i) the share of the pooramong those households that are connected (see Table 8below for selected countries); and (ii) the relative con-sumption levels of poor and non-poor households. Sincepoor households tend to be under-represented among thosewho are connected, the first factor suggests a low targetingefficiency. The second factor also favors the non-poor,since the income elasticity of the consumption of utility ser-vices is positive (although this could partially be compen-sated by household size in countries where poor house-holds tend to be larger, such as in Hungary, Latvia, andMoldova).19 Comparing Table 8 with Table 5, one indeed
finds that the targeting achieved through across-the-boardprice subsidies, even without the impact of the second fac-tor, is worse in most countries than the targeting that ran-dom selection would produce.20
To illustrate this, let’s consider the price subsidy pro-vided to residential consumers of gas in Ukraine in 1996.The budget spent about $500 million on the gas price sub-sidy in that year and about 21% of this went to the poor,21 which is below the targeting ratio (26.5%) thatwould have been achieved by a random selection mecha-nism. The targeting of the $220 million that the Ukrainiangovernment spent on the district heating subsidy in thesame year was slightly better—about 28% of this went tothe poor—due to the higher share of the poor among thehouseholds connected to district heating, and also to therelatively small difference in the average size of the apart-ments between connected poor and non-poor households(47.5 m2 versus 51.3 m2 – see Table A3-4).
The predictability of the benefit received throughacross-the-board utility price subsidies is fairly high for thepoor. However, these subsidies create a distorted priceregime, resulting in wasteful consumption practices amonghouseholds.22 Across-the-board price subsidies are as simple to administer as the policy of no disconnection. In
19With the exception of electricity (plus water and gas in Central European countries), utility services tend not to be metered in the region.Most countries, however, use the size of the apartment (for district heat and gas when used for heating) and the number of people inthe household (for water and sewerage) as proxies for actual consumption when calculating utility bills (the per capita water con-sumption “norms” are sometimes adjusted to reflect the amenities apartments have).
20There are exceptions to this tendency. For example, the share of district heating connections was higher for poor than non-poor house-holds in Armenia in 1996. The same was true for district heat, water, and sewerage in Ukraine. These exceptions in Armenia andUkraine are caused by the high incidence of urban poverty in these countries (district heating and sewerage are more widespread inurban than in rural areas).
21About half of the $500 million went to the approximately 2 million households that relied on gas to heat their homes, while the other
TABLE 8. SHARE OF POOR AMONG HOUSEHOLDS THAT ARE CONNECTED TO UTILITIES
Armenia, Croatia, Hungary, Kyrgyz, Latvia, Moldova, Russia, Ukraine,1996a 1998 1997 1999 1997 1998 1996 1996
Electricity 29.7% 18.7% na 23.7% 18.6% 22.3% na 26.4%
District Heating 33.1% 5.2% 10.1% 11.5% 13.9% 15.9% 27.3% 29.9%
Network Gas 23.5% 8.7% 9.3% 11.0% 14.4% 17.3% 29.7% 24.6%
Water 29.6% 15.3% 13.6% 28.1% 16.2% 14.3% 27.4% 30.3%
Hot Water 24.6% 10.0% na na 13.3% 14.6% 24.4% 26.9%
Sewerage na 13.1% 13.3% na 15.8% 14.3% 26.4% 29.6%
a Households with connections to non-functioning utility services are not considered connected.Source: Bank staff calculations using data from household surveys.

E v a l u a t i o n o f S u b s i d y M e c h a n i s m s
13
order to maintain the financial viability of the serviceproviders, a modest administrative effort is needed to calculate and channel to the utilities the annual contribution from the budget (or to set the price forindustrial consumers that will compensate for the lossesmade on the low residential tariff; see below). Of coursethere are considerable risks—cost and demand projectionsmay prove to be inaccurate and the budget may run out ofmoney—but these are risks that are present in most regu-latory environments and budgeting processes.
Across-the-board subsidies can place a heavy burdenon the budget. Therefore, many governments in the regiondecided to leave the budget out of the equation, and raisedprices for other (industrial) consumers to compensate theutilities for the losses on the services provided below costto households. This of course makes an already distortedprice regime even more distorted, leading to wastefulattempts to economize on the utility bill among industrialconsumers who have the ability to turn to alternative sup-ply sources. An example for the latter is the increasedreliance among industrial companies on heat produced intheir own heat-only boilers even though the true econom-ic cost of co-generated heat produced by power plants anddistributed by the district heating system might be lower.Those industrial consumers who have no meaningful sup-ply alternative see their costs go up even more, negativelyaffecting their competitiveness. Either way, what originallywas designed as a revenue-neutral subsidy mechanism can
become quite detrimental to the financial position of theutility, since the volume of sales to over-charged industrialconsumers drops and to under-charged residential con-sumers increases. A number of district heating companieswere driven to insolvency this way in the former SovietUnion by the time their governments decided to eliminatethe difference between residential and industrial heat prices.23
In the case of electricity and water, alternative suppliesare more expensive or their access is forbidden (e.g., lack ofthird party access in electricity supply or restrictions on theuse of underground aquifers), so cross-subsidies tend to livelonger. An example is the water tariff in Russia, with pricesfor industrial enterprises and other non-residential con-sumers several times above residential rates. The totalvalue of the cross-subsidy provided this way to house-holds was about $1.1 billion in 1997. In addition, house-holds received a $275 million across-the-board price sub-sidy from the water utilities that suffered financial lossessince their total revenues fell short of their total expenses.24 About 74% of these subsidies, however, wentto middle and higher income consumers, thereby slightlyincreasing rather than reducing social inequality (the poorrepresented 30% of the population in Russia).25 Anotherexample is the electricity tariff in Croatia, with a residen-tial rate that was 36-41% below the rates forindustrial/commercial consumers who were connected atlow voltages in 1998. The total value of the cross-subsidy
half of the subsidy went to the approximately 8 million households that used gas for cooking and water heating (since space heatingon average requires about four times more gas than cooking/hot water for a year as a whole). Only 23% of households that use gasfor space heating were poor; furthermore, the average size of the apartments of these households was 22% smaller than the apartmentsof the non-poor (see Tables A3-3 and A3-4). As a result, only about 19% of the first $250 million went to the poor. Assuming thatthe share of the poor among those households that cook (and some also make hot water) with network gas was the same as amongthe rest of the households in 1996, and that the consumption of gas for cooking and water heating is proportional to the number ofpeople in a household (the consumption of these low volume users is typically not metered), 22% of the second $250 million subsidywent to poor households (since poor households on average were 7% smaller than non-poor households —see Table A3-4). These tworatios combined produce an estimated targeting ratio of 20.5%.
22As pointed out earlier, a moderate household price subsidy for water and sewerage may actually reduce a distortion by compensat-ing for the public health benefits associated with these services. It is important to note, however, that only external health benefits countin this respect (i.e., public health benefits on top of those that accrue to the family members receiving the service), so the subsidy wouldhave to be modest.
23A truly cost-reflective utility tariff requires more than making the prices for these two consumer classes equal. Due to economy of scaleeffects and the relative stability of industrial demand within a day and within a year, the cost of providing electricity, gas, heat, andwater to industrial consumers is significantly below the cost of supply to households.
24Table A3-5 includes data on water consumption and tariffs in the Russian Federation in 1997. The estimated value of the cross-sub-sidy from non-residential consumers and the shortfall in water utility revenues was derived from that table.
25The 74% figure is based on the number of poor and non-poor connected to the water supply system in 1996, weighted by the esti-mated water consumption per capita of poor and non-poor households, taking into account residential consumption norms for different house/apartment characteristics (see Table A3-6).
M a i n t a i n i n g U t i l i t y S e r v i c e s f o r t h e P o o r
14
26The 9.6% targeting ratio reflects the large (about 100%) difference between the average monthly electricity consumption of poor andnon-poor households in Croatia in 1998, based on information obtained from a household survey (see Table A3-7).
27As noted earlier, there are exceptions to these general tendencies. A subsidy through a life-line water tariff would reach only 20%of poor households in Moldova, while a subsidy through a life-line district heat tariff would reach 62% of poor households in Russia.
28The subsidy (S) that a household consuming more than the initial block (C>B1) receives is equal to the size of the initial block (B1)multiplied by the difference between the price of the first and the price of the second block (P2-P1), assuming that P2 is equal to thecost of the service. If the household consumes less than the initial block (C<B1), its subsidy is equal to C*(P2-P1).
29Unfortunately, reducing the size of the initial consumption block also reduces the amount of money transferred to the poor, but thiscan be compensated for by increasing the size of the price discount.
30With P3>P2, the subsidy (S) that a household consuming more than the second block (C>B2) receives is equal to B1*(P2-P1) – (C-B2)*(P3-P2). Please note that S becomes negative at high consumption levels. This tariff structure may not improve targeting in coun-tries where poverty status is strongly correlated with household size.
31It is not clear whether the price for the third block was truly above the cost of supply in Hungary in 1997. We simply assumed thatthe cost was equal to the price of the middle block. Even if the cost was somewhat above this price, a modest parallel increase in theprice of each block would not have altered consumption patterns significantly, so our main finding about the (hypothetical) improve-ment in targeting that a three-block tariff can produce is not sensitive to the accuracy of this assumption.
provided this way to Croatian households was about $126million in 1998. However, only 9.6% of this total amountwent to the (relative) poor, who represented 19.7% of allhouseholds in Croatia in that year.26
Life-line TariffRestricting the price subsidy to the initial block of
consumption (called the basic need level) offers a less cost-ly alternative to across-the-board price subsidies while pre-serving the politically attractive universal protection featureof the latter. Not surprisingly, many governments in theregion introduced life-line tariffs for utility services withmetered or relatively easily estimated consumption, i.e., forelectricity, gas, and (in some cases) district heat. As themetering of water supply becomes more widespread, anumber of countries will have the option of adopting life-line water tariffs.
As is the case with the across-the-board price subsidy,the coverage ratio of this mechanism is equal to the shareof connected households among the poor. As can be seen inTable 7, a life-line tariff for electricity or water tends to pro-duce high coverage, while a life-line tariff for gas or districtheat tends to “score” relatively low in this respect inCentral and Eastern Europe and the former Soviet Union.27
The targeting ratio of the life-line tariff depends on (i)the share of the poor among households that are connect-ed (see Table 8); and (ii) the relative size of the average sub-sidy for poor and non-poor households.28 The latterdepends on the size of the initial, subsidized consumptionblock compared with the consumption levels of poor andnon-poor households. Since consumption grows withincome, the targeting ratio improves as the size of the ini-
tial block decreases, and the best targeting ratio that can beachieved with a two-block tariff is equal to the share of thepoor among those who are connected. This ratio isachieved when the share of poor and non-poor householdsconsuming less than this initial block becomes the same.29
But even in this case, the targeting achieved through asimple life-line tariff tends to be worse than the targetingthat a random selection mechanism would produce (sincethe poor tend to be under-represented among those withutility connections).
Targeting can be improved, however, with the appli-cation of a three-block tariff structure, assuming the pricefor the third block is set above the cost, so it includes a neg-ative subsidy.30 Hungary, for example, operated such anelectricity tariff structure in 1997, with a first block of 0-50 kWh/month/household, a second block of 50-300kWh/month/household, and a third block of 300kWh/month/household and more.31 The price of electric-ity within the first block was 17% below the price of thesecond block, while the price of electricity within the thirdblock was 16% above the price of the second block. Withthis arrangement, poor households received 19.9% of thesubsidy distributed (after netting out the impact of the neg-ative subsidy; see Table A3-8), producing a targeting ratiothat is slightly better than random selection (16.7%).Without the third block “penalty,” a two-block tariffwould have produced a targeting ratio of 16.1% (seeTable A3-9), while spending 35% more in the process(with most of the extra spending going to the non-poor).For the sake of the analysis, we restricted the size of thesecond block to 50-150 kWh/month/household. The tar-geting ratio in this hypothetical case jumped to 196%,since the poor received almost two times more benefit

E v a l u a t i o n o f S u b s i d y M e c h a n i s m s
15
than the amount of (net) subsidy transferred to the wholeclass of residential consumers, due to negative subsidygoing to the non-poor (see Table A3-10). However, theaverage size of the subsidy received by the poor was halvedbecause many poor households used more than 150kWh/month electricity. As an additional side-effect, thecoverage of the subsidy mechanism dropped from 95% to81%, since some poor households consumed so muchelectricity that their “penalty” in the third block was high-er than their subsidy in the first block. By increasing the sizeof the price discount and the “penalty” at the same time,the size of the average subsidy can be increased while pre-serving the favorable targeting ratio. This adjustment,however, will not improve coverage, suggesting that thereis a trade-off between coverage and targeting in this case.
If the size of the first block is not fixed but set higher(on average) for the poor than the non-poor, a two-blocktariff can also produce a better targeting ratio than theshare of the poor among those who are connected. InMoldova, households connected to district heating paid aheavily subsidized price for heating the first 12 m2/capitaof their apartments in the winter of 1998/99. Since poorhouseholds tend to have a larger family size than the non-poor in Moldova, the average amount of the district heat-ing subsidy provided to them was slightly higher than thesubsidy provided to non-poor households, resulting in atargeting ratio of 16.0%, just above the 15.9% share of thepoor among those who were connected to district heating(see Table A3-11).
The same approach can also be applied to electricityand gas tariffs (and also to water tariffs after metering isintroduced) in countries where poor households tend tohave a larger family size.32 Defining the first, subsidizedblock as 20 kWh/capita/month of electricity consumptionin Hungary, we recalculated the subsidies provided to thehouseholds surveyed in 1997. The result was a targetingratio of 17.7%, higher than the 16.1% ratio produced bya two-block tariff with the first block fixed at 50kWh/month (see Table A3-12). While this “floating” life-line tariff does not produce improvements in targeting asdramatic as the three-block tariff, it (partly) compensatesfor this by preserving the coverage achieved by the “fixed”life-line tariff.
The benefit received through a two-block life-line tar-iff is highly predictable. The predictability of the benefitdecreases somewhat with the introduction of the third(“penalized”) block, since actual electricity consumptionfluctuates and even low income families may get “penal-ized” occasionally. Even when the price discount is rela-tively high, the price distortion caused by a two-block life-line tariff can be fairly low if the first block is keptsufficiently small so most consumers (including the poor)consume more than the first block (ensuring that the lastunit of consumption is priced correctly).33 In the case of athree-block tariff, however, the “penalty” (assuming itkicks in early enough to improve targeting, i.e., most non-poor households should consume beyond the secondblock) distorts the marginal price signal, and may forcemany households to adopt saving measures that are over-ly costly. So the impressive targeting performance of thistariff comes with a price tag—reduced coverage (see above)and increased price distortion.
In terms of the administrative burden, a two-block tar-iff is only slightly more demanding than the across-the-board price subsidy. However, it requires reliable (tamper-proof) metering or a reasonable proxy (such as apartmentsize for heating) to estimate consumption, therefore it is notsuitable for water and sewerage in countries where resi-dential water use is not metered. Furthermore, it requiresdisciplined meter readers/controllers who are not temptedeasily by households wanting to keep their recorded con-sumption below the limit for the first block. The samerequirements apply to the three-block tariff. The adminis-tration of a life-line tariff with “floating” blocks is signif-icantly more demanding, since it requires the matching of(metered/estimated) consumption volume and family size(or other factors correlated with poverty status) in order tocalculate the utility bill. Nonetheless, this is unlikely toimpose a major burden on utilities in the region.
Depending on the size and the source of the price sub-sidy, life-line tariffs can place a significant burden on thebudget, on the finances of the utility, or on other (indus-trial) consumers (if the cost is recovered through a higherindustrial tariff). This financing burden can be greatlyreduced and partly (or wholly) shifted to (mostly) non-poorhouseholds when a third block is introduced with a “penal-
32More generally, the size of the initial, subsidized block can be tied to any indicator that is well-correlated with poverty. For exam-ple, the initial block can be set at 30 kWh/household/month, plus 20 kWh/month for each pensioner (or child) in a country where theincidence of poverty is high among pensioners (or among families with many children).
33This assumes that consumers respond to the marginal (as opposed to the average) price signal. The evidence in this respect is mixed,particularly if price differences between blocks are small. With a large (e.g., 100%) price jump between the first and second blocksand an effort to increase consumer awareness, it is likely that most households will recognize that they face the higher tariff for every additional kWh.
16
ty.” In the above example in Hungary, the cost of the life-line tariff dropped to less than 1/10 of its original valuewhen the “penalty” kicked in at 150kWh/month, withthe great majority of savings coming from the non-poor.34
Price Discount for Privileged ConsumersThe former Soviet Union operated a system of merit-
based utility price discounts. The purpose of these privi-leges was not to reduce poverty, but to reward service incertain occupations (police, firemen, judges, etc.), and tocompensate for injuries or human suffering as a result ofbirth defects, hard labor, war, or man-made catastrophes(e.g., Chernobyl). Many of these privileges—price dis-counts of 25 to 100%—were established in legislative acts,while others were promulgated by government decree.Afraid of popular discontent, few governments/parlia-ments in the newly independent republics dared to over-haul this system (the Baltic states are the most notableexception), despite complaints from utilities that theylacked the resources to sustain these unfunded mandates.A few parliaments even increased the number of privi-leged citizens, adding the victims of political persecutionand low income pensioners to the list. As a result, somelevel of privilege is enjoyed by one-third or more of thepopulation in several countries in the former Soviet Union.
Since the primary goal of the system of privileges is notpoverty alleviation, it is not surprising that the system failsto reach many of the poor (although some of the late addi-tions to the privileged list were intended to help the lowerincome groups). In Moldova, for example, 314,329 peo-ple benefited from electricity price privileges in 1997, andabout 35% of these were poor (see Annex 2). Moldova’stotal population was about 4 million in that year, and23.4% of the population was below the (relative) povertyline. On this basis, the coverage of the poor achieved bythe system of privileges was only 13%. The situation wasnot much better in Ukraine. Out of 5.4 million privilegedelectricity consumers in 1999, we estimated that only about1.3 million were poor, representing about 28% of all poorhouseholds (Ukraine had 16.3 million households onJanuary 1, 1999).35
The targeting of the poor by the system of privilegesdepends on (i) the size of the price discount provided to the
various privileged groups; (ii) their utility connection ratios;(iii) the volume of electricity/gas/heat/water consumption(or the limit placed on their privileged consumption) ofthose privileged households that are connected; and (iv) theincidence of poverty within each privileged group. InMoldova, we estimated that 33% of the subsidy providedby the system of electricity privileges went to the poor in1997 (see Annex 2), indicating a targeting ratio that isbetter than the ratio that random selection would pro-duce (23.4%). In Ukraine, we estimated that 23% of thesubsidy provided to privileged electricity consumers wentto poor households in 1999 (see Annex 2), which wasbelow the ratio of random selection (26.5%). The bettertargeting ratio in Moldova was due to the inclusion of lowincome pensioners in the privileged list. This shows thatreplacing some of the occupation-based privileges (whichtend to support the middle class) with privileges based onincome or household characteristics that favor the poor isa natural way to improve the targeting performance of thissubsidy mechanism.
The system of privileges provides highly predictablebenefits. Similarly to the across-the-board price subsidy,privileges can be highly distortionary. An extreme case isthe 100% electricity price discount provided to certainveterans in Ukraine, resulting in highly wasteful con-sumption patterns. A cap placed on the volume of privi-leged consumption can, however, minimize the impact ofprice distortion, particularly if the cap is set below thetypical consumption level.
The administration of the system of privileges includes(i) the issuance of certificates recording the privileged sta-tus of certain consumers; (ii) noting the privileged statusand the corresponding price discount on each consumer’srecord kept by the utility; and (iii) taking the discount intoaccount when calculating the monthly bill for these con-sumers. This is clearly more demanding than administeringthe no-disconnection, across-the-board price subsidy orlife-line tariff mechanisms. The administration of thismechanism becomes even more complicated when a cap isplaced on the amount of “privileged” consumption and theprivilege is tied to the individual rather than the entirehousehold. This suggests that there is a trade-off betweenadministrative simplicity on the one hand, and reduced distortions on the other hand.
34In practice, keeping the size of the first (and the second) block small may be quite challenging politically. Also, the cross-subsidy element may disappear if price adjustments don’t keep up with changes in supply costs, resulting in two subsidizedblocks rather than one (Armenia had such an electricity tariff in 1997). There is a body of evidence from across the worlddemonstrating that block tariffs tend to be captured by the middle class.
35There was an important difference between Moldova and Ukraine with respect to the operation of the system of electricityprivileges. While in Ukraine the whole household was entitled to the price discount if one family member was privileged, inMoldova only the privileged person received the discount. This was achieved by placing a cap of 60 kWh/month on thediscounted volume of electricity consumption for each privileged person.
M a i n t a i n i n g U t i l i t y S e r v i c e s f o r t h e P o o r

E v a l u a t i o n o f S u b s i d y M e c h a n i s m s
17
Depending on the number of privileged consumersand the size of the price discount, privileges can place a sig-nificant burden on the budget (as in Moldova), on thefinances of the utility (as in Ukraine), or on industrial consumers (if the cost is recovered through a higher indus-trial tariff). A cap placed on the volume of privileged con-sumption reduces the financial burden, and also makes thefinancial cost of the subsidy more predictable.
Burden LimitStarting in 1995, a number of former Soviet states
introduced subsidies to limit the burden placed by utilityexpenditures on household budgets. Typically, govern-ments established networks of offices to administer thesesubsidies. Housing allowance offices receive their fundingfrom the budget, and make payments to utilities on behalfof households whose combined utility expenditures exceeda certain share of their income. This share—the burdenlimit—typically varies from 15 to 30%, and its calculationmay also include fuel costs (in rural areas) or rental pay-ments on apartments (in cities).
In Ukraine, for example, the housing allowance systemcovers rent plus all utility services, and also the fuels pur-chased on an individual basis when a house is not con-nected to gas or district heating. The burden limit was setat 15% of total family income in February 1995 (when thesystem was introduced), and it was increased to 20% inJuly 1998. Actual utility bills are used to determine expen-ditures for the calculation of the subsidy. 36 Income also hasto be proven by presenting official documents from theemployer, social security office, tax authority, etc. Peoplewithout work should be registered with the unemploy-ment office to be eligible (except mothers of young childrenand the disabled). Utility payment arrears need to be settledin full, or a payment schedule should be agreed with thesupplier. According to the Ministry of Economy, 1.2 mil-lion households received housing allowances in 1995, 5.7million in 1996, 8.1 million in 1997, and 6.2 million in1998 (as noted above, Ukraine has about 16 million house-holds). The average allowance disbursed (for a year as awhole) was $10/household in 1995, $25/household in1996, $64/household in 1997, and $71/household in 1998.
The coverage of the poor by this mechanism dependson (i) the recorded income of the poor; (ii) the size of theutility expenditures of the poor in relation to income; (iii)the stipulated burden limit; and (iv) the ability of the poorto meet additional qualification criteria (if any) to receivethe benefits. In a household survey in Ukraine in 1996,58% of the poor who answered the question on housingallowances reported receiving support through this mech-anism. It is likely, however, that the share of householdsthat did not receive the allowance was higher among thosewho did not answer the question. In the same survey, 28%of those who reported receiving housing allowances werepoor. Extrapolating this figure to the total number of recip-ients, it appears that about 1.6 million poor householdsreceived housing allowances in 1996, which implies thatthe housing allowance system reached about 36% of poorhouseholds in the country. The true coverage ratio wasprobably somewhere between 36% and 58%. The rela-tively high share of the poor missed by the housingallowance system can be explained by (i) the lack of astrict regime of disconnecting non-payers, thereby reducingthe willingness of the poor to apply for a housingallowance; (ii) the high number of poor households whoseutility expenditures fall below the burden limit; (iii) the dif-ficulty for poor households to meet other eligibility criteria(such as agreeing on a payment schedule with the utility foroverdue bills); and (iv) the heavy administrative burden onthe poor associated with the application for a housingallowance (there is anecdotal evidence that this burdenposes an obstacle for some of the poor families).
The targeting of the poor by the burden limit mecha-nism depends on (i) the number of poor and non-poorhouseholds with utility bills that exceed the burden limit inrelation to recorded income; (ii) the relative ability/will-ingness of these poor and non-poor households to turn tothe housing allowance office and prove their eligibility forthe allowance; and (iii) the average allowance provided topoor and non-poor households.37 In the 1996 householdsurvey in Ukraine, only 28% of the households that report-ed that they received a housing allowance were below the(relative) poverty line. Their average allowance was slight-ly (2%) lower than the average allowance provided to
36If the apartment size is larger than 21m2/capita plus 10.5m2 common space for the household as a whole (a very generous limitthat few apartments/houses exceed in Ukraine), only a pro-rated share of total rent and utility expenditures is taken intoaccount in the calculation of the allowance.
37The allowance (A) provided by the burden limit scheme is equal to E – bY (or zero, whichever is larger), where E is actualutility expenditure, b is the burden limit (expressed as a percentage of income), and Y is income. E is equal to pC, where p is theprice of a “unit” of utility service, and C is the amount of utility service consumed. Since C is a function of income, the natureof the relationship between A and Y depends on the parameters in this function. In particular, it cannot be determined a prioritywhether A increases or decreases with income.
18
non-poor households, resulting in a targeting ratio of 28%(see Table A3-13), slightly above the targeting ratio ofrandom selection (26.5%).
Using data from the same household survey, we testedthe hypothesis that increasing the burden limit improvesthe targeting of the housing allowance (this is the case if thenear-poor spend a smaller share of their income on utili-ties). First, we re-calculated the housing allowance foreach household based on their reported income, their rentplus utility bill, and the 15% burden limit, disregarding anyother eligibility criteria. While the number of poor andnon-poor recipients almost remained the same, the averagesize of the allowance became larger for non-poor house-holds, resulting in a targeting ratio of 22% (see Table A3-14). Increasing the burden limit to 25% slightly reducedboth the number of recipients and the average allowance(reducing total outlays by 29%), and produced a targetingratio of 22.5% (see Table A3-15). Increasing the burdenlimit to 35% and 45% raised the targeting ratio to 23%and 24%, respectively, but decreased the coverage of thepoor (29% of the poor who received a subsidy under the15% limit became ineligible when the burden limit wasincreased to 45%; see Tables A3-16 and A3-17). The per-sistently low targeting ratio of the burden limit mechanism(below that of random selection) is caused by a weak cor-relation between per capita household income and theshare of utility expenditures (plus rent) within householdincome in Ukraine.38
This phenomenon is not unique to Ukraine. We carriedout the same hypothetical exercise using 1997 householdsurvey data from Latvia, and found that the targeting ratio
of the burden limit mechanism was below the targetingratio of random selection, and the targeting ratio changedvery little when the burden limit was increased, as inUkraine.39 The correlation between per capita householdincome and the share of utility expenditures (plus rent)within household income was almost as weak in Latvia asin Ukraine.40 To test whether this phenomenon is caused bya systemic factor that is particular to the former SovietUnion, such as the gross under-reporting of income bymiddle and upper classes, we selected a Central Europeancountry, Hungary, where household expenditure was bet-ter correlated with household income.41 Surprisingly, thecorrelation between per capita household income and theshare of the utility bill in household income proved to beeven weaker in Hungary.42 These results suggest that bur-den limits are not a suitable mechanism to target the poorin Central and Eastern Europe and the former SovietUnion.43
A solution for the problem of low targeting efficiencyis the replacement of actual utility expenditures by nor-mative utility expenditures in the formula that is used tocalculate the allowance. These can be set on the basis of percapita norms for apartment space (and associated heatingrequirements), and water and electricity consumption.Since the norms are independent of income, the allowancethat a household receives under this modified burden limitmechanism is inversely related to income.44 It is crucial,however, to set the norms sufficiently low (below the old“sanitary” norms applied in the former Soviet Union) inorder to keep the number of beneficiaries limited and theamount of support affordable for the budget.
M a i n t a i n i n g U t i l i t y S e r v i c e s f o r t h e P o o r
38The R2 of a regression of the share of utility expenditures (plus rent) in household income using per capita household income asthe independent variable was 5.7% in Ukraine (see Table A3-18). The correlation was particularly weak at lower income levels.The correlation remained weak (R2=0.5%) when we replaced household income with household expenditure on both sides ofthe regression (see Table A3-19).
39The poor received 13.8% of the total (hypothetical) subsidies when the burden limit was set at 15% (see Table A3-20). Thisfigure reached 16.9% when the burden limit was increased to 45% (see Table A3-21), still below the targeting ratio of randomselection (18.8%).
40The R2 of a regression of the share of utility expenditures (plus rent) in household income using per capita household income asthe independent variable was 8.6% in Latvia (see Table A3-22). The correlation increased somewhat (R2=14.4%) when wereplaced household income with household expenditure on both sides of the regression (see Table A3-23).
41The R2 of a regression of total household expenditure using household income as the independent variable was 50.1% inHungary (see Table A3-24), 33.9% in Latvia (see Table A3-25), and 23.8% in Ukraine (see Table A3-26).
42The R2 of a regression of the share of utility expenditures in household income using per capita household income as theindependent variable was 0.1% in Hungary (see Table A3-27). The correlation remained weak (R2=1.3%) when we replacedhousehold income with household expenditure on both sides of the regression (see Table A3-28).
43A cursory look at household survey data suggests that this conclusion may apply to some of the other regions of the world aswell. A possible explanation is that the income elasticity of household energy consumption tends to be close to unity in the lowto middle income range. It is worth noting that in the United States, where many states rely on burden limits, the eligibility of ahousehold for the utility subsidy is frequently determined on the basis of an income test, and the burden limit is used only to setthe amount of the subsidy. This two-step procedure greatly reduces the leakage of the subsidy to the non-poor.
44The allowance (A) is now equal to pcN – bY (or zero, whichever is larger) where p, b, and Y are the same as before,

E v a l u a t i o n o f S u b s i d y M e c h a n i s m s
19
The Kyrgyz Republic operates a system of housingallowances based on normative utility expenditures inBishkek, the capital city. To be eligible for the allowance, ahousehold should live in an apartment building and its nor-mative utility expenditures (electricity excluded) shouldexceed 23% of its income (the burden limit). Normativeutility expenditures depend on the number of people in thehousehold and on the level of utility tariffs. About 2,600families received $22/family (on average) support underthis scheme in 1999, implying a coverage ratio of 11%(there are about 23,000 relatively poor households inBishkek). Using data from a recent household survey, wehypothetically “extended” the coverage of the scheme tothe whole Kyrgyz Republic. As expected, the targetingratio of the scheme—18.7% (see Table A3-29)—was some-what above the targeting ratio of random selection if onlyhouseholds that live in apartment buildings are consid-ered (the incidence of poverty is 13.1% among those wholive in apartments), but still below the targeting ratio ofrandom selection (23.6%) when all households in theKyrgyz Republic are taken into account. If expenditures fordistrict heat and gas are based on actual expenses when cal-culating the housing allowance, the targeting ratio decreas-es to 17.8% (see Table A3-30). If actual electricity expen-ditures are also included in the calculation, the targetingratio further decreases to 16.7% (see Table A3-31), demon-strating that the replacement of expenditure norms withactual utility expenditures decreases the targeting efficien-cy of housing allowances. As in the case of Ukraine (andLatvia), increasing the burden limit improves the targetingratio only marginally in the Kyrgyz Republic.45
Benefits received through burden limits can be predicted with a reasonable certainty, although they are notas highly predictable as those derived from life-line tariffsbecause of the demanding administrative requirementsassociated with the application. Since the price of an addi-tional unit of electricity/gas/heat/water is effectively zero fora household that reached the burden limit, this is probablyone of the most distortionary of all utility subsidy mecha-nisms on the demand side (of course this distortion isunavoidable when consumption is not metered). The dis-tortionary effect, however, is confined to those households
that receive support, while the distortions created by anacross-the-board subsidy affect every consumer. Placing acap on per capita or total household consumption of util-ity services that counts toward the burden limit, or (evenbetter) using consumption norms to fix the level of utilityexpenditures for the purpose of subsidy calculation (seeabove) can significantly reduce the distortionary effect.46
The use of consumption norms (irrespective of actual con-sumption) has the additional advantage of somewhatreducing the complexity of an administratively verydemanding subsidy mechanism, making application forthe subsidy more simple for the poor. In Ukraine, theadministrative cost of the household allowance schemewas $7.6 million, or about 2% of total outlays in 1998.While this is not a very high ratio, it nevertheless representsa substantial cost. As of January 1, 1999, about 7,000 peo-ple were employed in 756 offices to administer housingallowances. In Bishkek, one office administers the housingallowance scheme with annual expenses that were equal to9.5% of the subsidies distributed in 1999.
Burden limits can be quite costly for the budget, par-ticularly if the limit is set low. In Ukraine, the cost of theprogram was $13.5 million in 1995, $140 million in 1996,$517 million in 1997, and $439 million in 1998 (after theburden limit was increased to 20%). Raising the burdenlimit from 15% to 25%, 35%, and 45% in our hypothet-ical calculations for Ukraine decreased budgetary outlaysby 29%, 48%, and 62%, respectively (see Tables A3-14,A3-15, A3-16, and A3-17). However, the coverage of thepoor dropped from 58% (under the 15% burden limit) to42% (under the 45% burden limit), indicating a trade-offbetween coverage and cost (see Table A3-33). Also, theunpredictability of the budgetary outlays during the courseof a year may pose a serious difficulty for Ministry ofFinance officials working on next year’s budget. An unan-ticipated real income shock can lead to a big gap in thebudget for the housing allowance system that will likelytranslate into non-payment, causing financial problemsfor the utilities.
Other Earmarked Cash TransfersCovering the part of the utility bill that exceeds a
given share of income is only one of the utility subsidy
c is the norm for per capita utility consumption, and N is the number of persons in the household. Since pcN does not changewith income, the allowance decreases as household income grows.
45The targeting ratio of the fully norm-based housing allowance increased to 21.9% when the burden limit was raised to 45% (seeTable A3-32).
46Burden limits as well as the other income-tested subsidy mechanisms discussed below may also create disincentives to participatein the formal economy, thereby either reducing the overall supply of labor or pushing people toward the informal sector.
M a i n t a i n i n g U t i l i t y S e r v i c e s f o r t h e P o o r
20
mechanisms that provide cash to selected households ear-marked to pay part of their utility bills.47 The City of Rigain Latvia, for example, provided a payment toward the util-ity bill at a level that ensured that the income of each fam-ily who applied for support, after paying the remainingpart of the bill for rent and utilities, reached $38/capi-ta/month in the 1997/98 heating season (households abovea limit of 18m2/capita apartment area were not eligible).Most other Latvian municipalities operated social supportmechanisms that were broadly similar to the one in Riga.48
The total number of households in Latvia that receivedsupport for utility expenditures through this decentralizedsocial support system was about 330,000 in 1996 andabout 263,000 in 1997 (there are about 1 million house-holds in Latvia). The average annual subsidy was$35/household in 1996 and $37/household in 1997.
In Hungary, the government set up an Energy Fund tocompensate (partially) low income families for the January1, 1997, electricity price increase and subsequent addi-tional price increases. In early 1997, the Energy Fundreceived about $5 million from the budget and about $2.4million in the form of semi-voluntary contributions fromthe mostly privately owned electricity generators and dis-tributors. All recipients of regular social assistance wereconsidered automatically eligible for support from theFund. Other households could also apply for compensa-tion, subject to approval by the local government or anyinstitution providing regular social support. The number ofrecipients was about 373,000 in 1997, and the supportprovided ranged from $8 to $60 per household (the aver-age was about $20/household).49 The Energy Fund wasextended to cover gas during its first year of existence. Withthe purpose of (partially) compensating for gas priceincreases for selected households who use gas for spaceheating, the Fund received $3.5 million from the govern-ment and $3.0 million from the gas companies. The eligi-bility criteria were similar to the criteria used for the elec-tricity price compensation. The number of recipients wasabout 410,000, and the support ranged from $15 to $38per household. About 100,000 households received com-pensation for both the electricity and gas price increases.
In Bulgaria, the government operates a GuaranteedMinimum Income (GMI) program that includes an energybenefit component provided monthly to eligible familiesduring the heating season. To be eligible, householdsshould meet a set of asset and employment criteria, andtheir income from the preceding month should be lowerthan the GMI. The GMI is set periodically by the Councilof Ministers, and is differentiated based on coefficientsapplied to various family sizes/types. The amount of theenergy benefit is equal to the difference between the incomeof the family on the one hand, and the GMI plus the ener-gy norm on the other hand, but it cannot exceed the ener-gy norm itself. In 1997/98, the central government budgetreimbursed the energy companies for the cost of electrici-ty, heat, and fuel supplied to the eligible families. In1998/99, the families received their energy benefits in cash.The energy norm was set at 430 kWh/month/family, pricedat about $14 at that time. The average energy benefit forthe 1998/99 heating season was $57/family, and 575,800families50 were supported this way. The program wasadministered by the municipal social assistance offices,which received the funding for the energy benefit fromthe Ministry of Finance in a special account earmarked forthis purpose.51
In the absence of reliable survey data, estimates for thecoverage of the poor achieved by these earmarked cashtransfer schemes are highly uncertain. After comparingthe reported income and utility expenditures of Latvianhouseholds in the 1997 survey, we found that 57% ofpoor households in the survey were (hypothetically) eligi-ble to receive a subsidy, based on the criteria applied inRiga City (see Table A3-34). This figure, however, shouldbe decreased by the share of those poor who did notapply/qualify for other reasons. In addition, one needs totake into account that many municipalities operated lessgenerous assistance programs than Riga. Therefore, thetrue coverage ratio of the scheme was most likely below50%. In Hungary, we estimated that about 480,000 poorhouseholds and 200,000 non-poor households benefited
47To simplify the administration and monitoring of the use of the subsidy, the cash is typically sent to the bank account of the utility,which then reduces the receivables from the respective household by an equivalent amount.
48In Latvia, the administration of income-tested utility subsidies has been decentralized to 600 local governments since 1995. Local gov-ernments decide on the criteria for eligibility and on the amount of subsidies disbursed.
49The level of support for each household was determined by a complex formula that took into account the income, size, and energyconsumption pattern of households and the total amount of money available in the Fund.
50The support was provided to families, not households. There is anecdotal evidence that households with two generations of adultssubmitted more than one application, so the number of households that received support was below 575,800.
51The rest of the GMI program was financed from the municipal budgets, and payments to the beneficiaries were frequently delayeddue to the lack of funds. This problem did not affect the energy benefits that were disbursed with good regularity.

E v a l u a t i o n o f S u b s i d y M e c h a n i s m s
21
from the Energy Fund in 1997.52 Since there were about600,000 households in (relative) poverty in Hungary inthat year, the Energy Fund covered about 80% of the poor.In Bulgaria, the energy benefit program covered about12% of the population in the 1998/99 heating season.Even assuming that all recipients were poor, the coverageratio was probably below 50%.53
Relying on data from the 1997 household survey forLatvia, and using the criteria applied by Riga City for thecountry as a whole, we found that 33% of the total (hypo-thetical) subsidy was provided to poor households (seeTable A3-35), indicating that the targeting ratio was sig-nificantly above random selection (18.8%).54 In the case ofHungary, assuming that the same average support (perrecipient) was provided by the Energy Fund to poor andnon-poor households, we estimated a targeting ratio of70%. In Bulgaria, there is evidence that the bulk of theenergy benefits probably went to the poor, so the targetingratio might have been as high as in Hungary.
The predictability of earmarked cash transfers dependson the eligibility criteria and the formula used to calculatebenefits. For example, the amount of assistance providedby the Hungarian Energy Fund was difficult to predict formost recipients in 1997 due to the fact that the finalapproval of the support was far removed from the benefi-ciaries, and that a non-transparent and fairly complex for-mula was used to distribute the available funds.55 The pre-dictability of support from the City of Riga, however, wasabout the same as the predictability of support from theburden limit mechanism. In Bulgaria, the formula appliedto calculate the energy benefit was transparent and simple,
but the eligibility criteria were numerous and complex, sothe predictability of support was somewhat lower than inRiga.
The scheme used by the City of Riga made the cost ofan additional unit of utility consumption zero for eligiblehouseholds, creating strong incentives for wasteful consumption.56 Due to its unpredictability, support fromthe Hungarian Energy Fund was unlikely to create major distortions on the consumer side, implying that there is atrade-off between preserving incentives to save energy onthe one hand, and increasing the predictability of ear-marked benefits on the other hand.57 The Bulgarian ener-gy benefit scheme of 1998/99 provided to the beneficiariescash that they could use for any purpose, so it did not dis-tort energy consumption patterns (in fact, the energy ben-efits in the 1998/99 heating season were similar to a non-earmarked cash transfer mechanism—see the discussion inthe next section). The same cannot be said about the in-kind energy benefits provided in the 1997/98 heating sea-son, since as long as the consumption of an eligible house-hold was within the maximum energy benefit, the effectivecost of each additional unit of energy/fuel was zero.58
The operation of these earmarked, income-tested sub-sidy mechanisms can be quite demanding administrative-ly. In Latvia, 842 people administered the decentralizedsocial assistance system, including housing and utilityallowances and all other social benefits, at an estimatedcost of about $1.7 million (less than 7% of total benefitsprovided) in 1998. In Bulgaria, the administrative cost ofthe social assistance system, including the handling of ener-gy benefits, was about $1.3 million in 1998 (less than 3%
52We assumed that the incidence of poverty was 100% among those households who were regular recipients of social support, and 50%among the rest of the households supported by the Hungarian Energy Fund.
53We don’t have reliable data on the incidence of (relative) poverty in Bulgaria for this period. Since inequality in Bulgaria was prob-ably not lower than it was in Moldova, we assumed that at least 24% of the population was poor.
54Since most municipalities applied more restrictive eligibility criteria than Riga, this is a fairly safe statement to make.55The Hungarian earmarked cash transfer scheme seems to be an exception to the rule that low transparency of the allocation formulaand low predictability of the amount of subsidy for individual households tend to generate corruption.
56In addition, as do most other income-tested subsidy mechanisms, it might have created incentives to shift the activity of potential recip-ients to the informal sector or to withdraw from the labor market.
57A special kind of earmarking—support to poor households to implement energy saving/weatherization measures—gets around thisproblem rather elegantly. By reducing the amount of energy needed to achieve the same comfort level, this mechanism can providesustained relief to the beneficiaries. The disadvantages of this scheme are the high costs for the budget (at least in the short term), andthe administrative requirements that are of a magnitude larger than the administrative requirements of any other subsidy mechanismdiscussed in this paper (which may explain why this kind of earmarking has not yet been applied in Central and Eastern Europe andthe former Soviet Union).
58Someone with a paternalistic attitude may claim that the certainty that the subsidy will be applied to the utility bill rather than spenton other goods compensates for this negative side-effect. Since the positive externality of utility consumption is zero or very low inmost cases, we decided not to “reward” earmarked mechanisms for this feature.

M a i n t a i n i n g U t i l i t y S e r v i c e s f o r t h e P o o r
22
of total benefits provided). The Hungarian Energy Fundwas administered separately from the general social assis-tance system. Electricity and gas suppliers were asked toattach to the bill of each consumer a form to be filled out,certified by the municipality or a specialized social assis-tance entity, and mailed to the Fund. A small number ofcore staff evaluated the requests, asked for supplementalinformation when necessary, calculated the support due toeach applicant according to a formula, and transferredthe money to the bank account of the utility serving thecustomer. This low cost method (administration costs wereequivalent to about $16,000 in 1997) managed to producea high targeting ratio because it “piggybacked” on thesocial assistance systems run at the municipal level.
Most earmarked cash transfer schemes are financedfrom local and central government budgets. In Latvia, forexample, local governments spent $11.9 million on utilitysubsidies in 1995, $11.7 million in 1996, and $9.7 millionin 1997. In Bulgaria, the central government spent $33 mil-lion on the energy benefit scheme in the 1998/99 heatingseason. Typically, earmarked cash transfers do not placeany financial burden on the utilities.59 Hungary was anexception to this rule, since only part of the funding ($8.5million) for the 1997 energy subsidies came from the cen-tral government, while the rest ($5.4 million) was financedby the utilities themselves. The net burden on the utilities,however, was significantly less than the amount they con-tributed to the scheme, since some of the poor householdswould probably have been unable to pay their bills otherwise.60
Non-earmarked Cash TransfersAll subsidy mechanisms discussed above assume a sec-
tor-specific approach to addressing the social impact of util-ity price adjustments. But is such an approach justified?Typically, governments tried to mitigate the negative socialimpact of the price liberalization of other essential itemssuch as food through the general social assistance pro-gram. Therefore, it is far from obvious that the impact ofutility price increases on the poor should be mitigatedthrough sector-specific public interventions. This section
discusses the application of non-earmarked cash trans-fers to support poor households in the region.
A number of countries in Central and Eastern Europeand the former Soviet Union have introduced general cashbenefits targeting poor households. These have two mainforms: (i) cash benefits provided only on the basis of thepoverty status of households, assessed in different ways;and (ii) cash benefits provided on the basis of categoricaleligibility (e.g., targeted child allowances) combined withpoverty status.61 These non-earmarked cash transfer mechanisms give complete freedom to households whendeciding how to use the money received. While the size of the subsidies is not linked directly to utility expendi-tures/prices, this may occur indirectly when the level ofsupport is tied explicitly or implicitly to overall consumerprice movements. Nonetheless, from a political economyangle, non-earmarked transfers lack the appeal of intro-ducing price and benefit increases simultaneously.
In terms of coverage of the poor, non-earmarked cashtransfers is the only mechanism among those reviewed thatis not subject to the constraint of the share of poor con-nected to utility services. Coverage depends on the abilityand willingness of the poor to meet the eligibility criteriaapplied by the general social assistance system. In schemeswhere the eligibility criterion is poverty only (with no cat-egorical “screen”), the most common method is income-testing, based on self-declared income from a full range ofsources (at least in theory). Frequently this is supplement-ed by an asset test of some form (e.g., if the householdowns a car, or if there are able-bodied adults in the house-hold who are not registered unemployed and not raisingchildren or students, the household may be ineligible).The asset test in some countries is done on a more discre-tionary basis, for example, through home visits of socialworkers and other staff (e.g., in the former Yugoslavrepublics). At the end of the spectrum is a combined guide-line and discretion approach, as implemented through themahalla scheme in Uzbekistan, which combines centralgovernment guidelines for eligibility with a final decisionin the hands of mahalla committees (groups of localelders). The eligibility criteria may also be based on proxy
59In fact, earmarked subsidies may be preferable from the point of view of the utilities due to their positive impact on payment col-lections. This impact, however, is insignificant in countries where utilities do cut off non-payers. Surveys have indicated that house-holds in these countries place a relatively high priority on paying their utility bills (right after paying for food and rent, and before cov-ering medical and other expenses).
60This is particularly clear if one takes into account the larger contribution that the government made to the scheme. Apart from thepotential financial benefits, the utilities’ willingness to participate was also influenced by their desire to project a positive corporate image.
61While there is a range of other assistance programs (e.g., birth and death allowances), the discussion here focuses on the fiscally mostsignificant programs aimed at assisting the poor.

E v a l u a t i o n o f S u b s i d y M e c h a n i s m s
23
means-testing, for example, in Armenia and on a pilotbasis in some oblasts of Russia. Proxy means-testing relieson identifying household characteristics that are known tobe associated with poverty, and aggregating these on aweighted basis using a formula. Proxy means-testing canalso be supplemented by an asset test.
In practice, the coverage of the poor achieved by theseprograms seldom gets above 60%, as many poor do notreceive general social assistance benefits. In some countries,funding constraints lead to conscious efforts to limit cov-erage to the poorest of the poor.62 More frequently, how-ever, it is the shortfall of funding during the fiscal year(compared with the plan) that results in leaving manypoor applicants “out in the cold.” In other cases, onerousadministrative requirements make it difficult for the poorto meet the eligibility criteria. Also, some poor familiesmay decide not to apply as a result of the (perceived orreal) social stigma associated with being a welfare programrecipient.63 Lack of information and guidance due to theabsence of outreach efforts is another factor reducing cov-erage.
In spite of the efforts to exclude those who are notpoor, the targeting ratio achieved by non-earmarked cashtransfers seldom approaches 100%. In the formerYugoslav Republic of Macedonia, for example, only 60%of the recipients of social assistance can be consideredpoor according to survey data. When the support provid-ed is subject to additional categorical eligibility require-ments (e.g., having a certain number of children, or thepresence of elderly in the family), the positive impact ontargeting depends on the correlation of the screening char-acteristic with poverty status. For example, household sizeis correlated with poverty in several countries in the region(though there are notable exceptions such as Armenia,Russia, and Ukraine). The same is generally true for theelderly living alone. However, these additional categorical
eligibility requirements also exclude some of the poor,pointing again to the trade-off between coverage and targeting.
The predictability of non-earmarked cash transfersfor the poor depends on (i) the eligibility criteria; (ii) the fre-quency with which these criteria are changed; (iii) the sta-bility of budgetary revenues funding these cash transferswithin each fiscal year; and (iv) the predictability of budgetsallocated to these schemes from one year to another. Evenwhen continued receipt of support can be reasonably wellpredicted for the poorest of the households already receiv-ing benefits, the value of the support in terms of units ofelectricity, heat, or water may remain highly uncertain incountries with frequent price adjustments, as there is noguarantee that the overall fiscal position and utility pricemovements will be correlated. Therefore, the support pro-vided by this subsidy mechanism tends to be less pre-dictable than the support provided through price discountmechanisms (across-the-board subsidies, price discountsfor privileged consumers, and life-line tariffs), but morepredictable than the support provided through no-discon-nection.
The ability of households to spend non-earmarkedcash support as they wish means that this mechanism is theleast distortionary of the utility subsidy mechanismsreviewed in this paper.64 In terms of administration, non-earmarked cash transfers impose a similarly heavy burdenas other income-tested mechanisms (earmarked cash trans-fers or burden limits). However, mitigating the socialimpact of utility price increases through this mechanismcreates no additional administrative requirements if thereis a social assistance system in place already. This approachalso avoids the risk that there will be two poverty lines ina country—one for general social assistance eligibility, andanother one for utility allowance eligibility—adding con-fusion to the administration of already complex programs.
62The same problem can occur at a smaller scale when the financing of these non-earmarked cash transfers is decentralized. Districtswith a high incidence of poverty tend to have smaller tax bases for funding social assistance. Available evidence suggests that the cov-erage of the poorest of the poor has remained low under most general social assistance systems in the region.
63There is anecdotal evidence that some of the “suddenly poor” are more willing to apply for housing/heating allowances than for gen-eral poverty benefits in the former Soviet Union.
64Non-earmarked cash transfers are not entirely distortion-free. As noted earlier, income-tested social assistance schemes may producedisincentives to participate in the labor market, and there is anecdotal evidence of this in some Central European countries with moregenerous social assistance benefits. In many countries in the region (particularly in the former Soviet Union), however, the level of ben-efits is so low that these create minimal disincentives to work. In addition, some countries (e.g., Estonia) counteract this by exclud-ing non-working family members of working age from benefit calculations. The weak ability of many social assistance systems to mea-sure income from informal sector activities further reduces the scope of this undesirable effect. On the other hand, non-earmarked cashtransfers and all other income-tested subsidy schemes may encourage potential recipients to shift their activities to the informal sec-tor, producing a different set of distortions.

M a i n t a i n i n g U t i l i t y S e r v i c e s f o r t h e P o o r
24
As do all subsidy schemes funded from general bud-getary revenues, non-earmarked cash transfers have a sig-nificant fiscal cost (although typically below the cost ofacross-the-board price subsidies, due to the low targetingefficiency of the latter). On the other hand, non-earmarkedcash transfers present no financial burden for utilities orother (non-household) consumers.
Summary of FindingsLooking at coverage, all subsidy mechanisms reach at
least one-third of the poor. Only two mechanisms—across-the-board price subsidies and life-line tariffs—reach morethan two-thirds of the poor, but even that is limited to elec-tricity and water supply, since at least one-third of thepoor don’t have access to gas, district heating, and sewer-age in most countries in the region.
Across-the-board price subsidies, two-block life-linetariffs and “actual” burden limit (based on actual utilityexpenditures) produce targeting ratios that are below theratio that can be achieved through random selection. Nodisconnection, two-block “floating” life-line tariffs and the“normative” burden limit (based on utility expenditurenorms) can produce targeting that is somewhat better thanrandom selection. The three-block life-line tariff andincome-tested (earmarked or non-earmarked) cash trans-fers can produce targeting ratios that are at least two timeshigher than the ratio produced by random selection.
Across-the-board price subsidies, two-block life-linetariffs, and price discounts for privileged consumers pro-vide highly predictable support to the poor. Burden limit,most earmarked and non-earmarked cash transfers, andthree-block life-line tariffs (with a “penalized” third block)have medium predictability. No-disconnection and certainnon-earmarked cash transfers are mechanisms that pro-duce highly unpredictable subsidies to the poor.
No-disconnection and the burden limit based on actu-al utility expenditures create large price distortions for thehouseholds that benefit from these mechanisms (by mak-ing the effective price of their last unit of consumptionzero). Across-the-board price subsidies, and three-blocklife-line tariffs are mechanisms that create significant pricedistortions for all (or almost all) households. Two-blockand “floating”-block life-line tariffs and privileged dis-counts create significant price distortions for the minorityof households connected. Non-earmarked cash transfersand the “normative” burden limit create no utility pricedistortions.
No-disconnection, across-the-board price subsidies,and life-line tariffs (with the exception of life-lines with
“floating” blocks) are very simple to administer. Price dis-counts for privileged consumers and “floating” life-line tar-iffs pose significant administrative challenges since theutilities need to match meter readings with certain house-hold characteristics. The administration of burden limitsand other income-tested cash transfers exceeds the admin-istrative capacity of utilities, and requires the establishmentof a specialized network of local offices. Furthermore, forincome-tested subsidy mechanisms to be effective, theauthorities should have a good knowledge of the povertyprofile of the country.
Table 9 presents the above findings in a numerical for-mat. The scores assigned to each subsidy mechanism weredetermined the following way:
• A coverage ratio below 33% was given a score ofzero, between 33% and 66% was given a score ofone, and higher than 66% was given a score oftwo. A number of subsidy mechanisms were givenscores of “one to two,” since the share of the poorwho are connected (and can be reached) variesgreatly by utility.
• A targeting ratio below the ratio that can beachieved by random selection was given a score ofzero, above that ratio was given a score of one, andabove two times that ratio was given a score oftwo.
• For predictability, no-disconnection, the mostunpredictable mechanism, was given a score of zero.Mechanisms that provide benefits with high cer-tainty (across-the-board price subsidies, two-blockand “floating”-block life-line tariffs, and privilegeddiscounts) were given a score of two. The remainingsubsidy mechanisms were given a score of one.
• For pricing distortion, the two subsidy mechanismsthat do not affect the effective price of the last unitof consumption (non-earmarked cash transfer and the burden limit based on utility expenditurenorms) were given a score of zero. Mechanisms thatdistort the effective price for most households(across-the-board price subsidies and three-blocklife-line tariffs), or greatly distort this price for the beneficiaries (no-disconnection and the burden limit based on actual utility expenditures) were given a score of two. The remaining subsidymechanisms were given a score of one.
• For administration cost/difficulty, subsidy mecha-nisms that can be administered by the utilities withlittle extra effort (no-disconnection, across-the-board price subsidies, and two-block and three-

25
block life-line tariffs) were given a score of zero.Mechanisms that require extra effort from the util-ities (“floating” life-line tariffs and privileged dis-counts) were given a score of one. Subsidy mecha-nisms that require the establishment of a network ofoffices to administer the income tests were given ascore of two.
• Scores for the last two criteria were given a negativesign to facilitate the calculation of aggregate scores.
To find the subsidy mechanism that best suits their cir-cumstances, decisionmakers need to (i) obtain informationon the share of the poor connected to each type of utilityservice (this will help to narrow down the coverage scoresof across-the-board subsidies and life-line tariffs); (ii) takeinto account the possibilities that exist for reliable estima-tion and billing of actual household consumption (thiswill show whether life-line tariffs can be meaningfullyconsidered); (iii) determine the weights that they assign toeach of the five criteria (if metering/approximation ofactual consumption is not feasible, zero weight should beassigned to the price distortion criterion); (iv) calculate theaggregate scores for each subsidy mechanism and for eachtype of utility service; and (v) identify the mechanismswith the highest aggregate scores for each type of utility service.
To illustrate how this can be done, we included inTable 9 aggregate scores calculated with double weightsassigned to the first two (typically most important) evalu-ation criteria. For utilities with high connection ratiosamong the poor (e.g., electricity and water supply), thethree-block and “floating”-block life-line tariffs occupythe first and the second place. For utilities with lower con-nection ratios among the poor (e.g., district heat, gas, andsewerage), the first place is shared between non-earmarkedcash transfers and the three-block life-line tariff. When noreliable estimate exists for actual consumption (or thebilling system suffers from major deficiencies), life-line tar-iffs drop out, the criterion of pricing distortions becomesmeaningless, and the top score goes to cash transfers/priv-ileged consumer discounts or across-the-board price sub-sidies, depending on the connection rate of the poor.65
Relying on individual scores in the above table, aggre-gate scores can easily be re-calculated using any set ofweights. Hypothetically, depending on the weights assignedto the evaluation criteria, the subsidy mechanism with thehighest aggregate score can be non-earmarked cash trans-fers, any of the life-line tariffs, or even across-the-boardprice subsidies and privileged consumer discounts (in the case of non-metered water supply). There is no set of weights, however, that makes no-disconnection,
E v a l u a t i o n o f S u b s i d y M e c h a n i s m s
65 This finding may explain the particularly slow phase-out of across-the-board water price subsidies in the former Soviet Union. Thefirst best solution is to install water meters, establish a reliable meter reading and billing mechanism, and replace the across-the-boardsubsidy with a life-line tariff.
TABLE 9. EVALUATION OF SUBSIDY MECHANISMS
Life- Price Burden Burden Other Non-Across the Life- Life- line Discount Limit Limit Ear- ear-
No Board line line with for Based on Based on marked markedEvaluation Discon- Price with 2 with 3 Floating Privileged Actual Util. Exp. Cash CashCriteria nection Subsidy Blocks Blocks Blocks Consumers Util. Exp. Norms Transfer Transfer
Coverage 1 1 to 2 1 to 2 1 to 2 1 to 2 1 1 1 1 1
Targeting 1 0 0 2 1 1 0 1 2 2
Predictability 0 2 2 1 2 2 1 1 1 1
Pricing Dis- -2 -2 -1 -2 -1 -1 -1 0 -1 0
tortion
Administra- 0 0 0 0 -1 -1 -2 -2 -2 -2
tion Cost/
Difficulty
Aggregate 2 2 to 4 3 to 5 5 to 7 4 to 6 4 0 3 4 5
Scorea
aCalculated with double weights to first two criteria.

M a i n t a i n i n g U t i l i t y S e r v i c e s f o r t h e P o o r
26
earmarked cash transfer, or burden limit the top scoringsubsidy mechanism.
In principle, the cost of the subsidies can be covered bythe utilities themselves (i.e., through decapitalization), non-household consumers (i.e., by setting the prices they payabove cost), or the budget (i.e., from general taxation). Thefirst option, however, should be used as a short-term bufferonly, because it rapidly leads to the depletion of the work-ing capital of the utilities, which in turn reduces the relia-bility of the services they provide, and the resulting andinevitable curtailments (which tend to have an anti-poorbias) reverse the poverty alleviation impact of the subsidy.The second option may also become unsustainable ifdemand from industrial consumers is highly elastic withrespect to price (e.g., in the district heating sector). In thatcase, the drop in sales to over-charged industrial consumerscreates a need for additional surcharges on industry torecover the cost of the household subsidy, which thenprompts a further drop in industrial demand, ultimatelyleading to a major loss of the customer base that wasexpected to shoulder the cost of the subsidy. Even when theshort-term price elasticity of industrial demand for a spe-cific utility service is relatively low (as in the case of elec-tricity), the welfare cost of distorting the price of an essen-tial input is likely to be larger in the long run than thedeadweight loss associated with additional taxes in thecontext of a well-functioning tax regime.66 Cross-subsidiesalso run counter to the worldwide trend to liberalize thesupply of electricity and gas to industrial consumers.67 In
summary, financing of the subsidy from the budget seemsto be the best option in most utility sectors and countries.
Concerning the financing burden placed on the budget,the higher the targeting efficiency of the subsidy mecha-nism, the lower this burden is going to be. Specifically, fora given amount of purchasing power to be transferred tothe poor, the three-block life-line tariff and the income-test-ed cash transfer schemes require the least amount of fund-ing. In fact, the three-block life-line tariff can be designed in sucha way that the “penalty” at the high consumption level (in thethird block) fully covers the subsidy at the low consumptionlevel (in the first block). At the other end of the scale, across-the-board subsidies place such a large burden on the bud-get that most governments have phased these out by now.While at first sight the mechanism of no-disconnectionappears to have no impact on the budget, in reality it tendsto be so costly for utilities that the budget not only receiveslower revenues from corporate taxes, but over time has tofinance maintenance and rehabilitation costs and assumeresponsibility for the accumulated debt in order to preventthe complete collapse of utility services. A number of gov-ernments in the region that were lacking in fiscal resourcesdecided to sell their electricity and gas utilities in order toavoid total system collapse (e.g., in Armenia, Georgia,Kazakhstan, and Moldova). The low proceeds from the pri-vatization of these utilities compared with the proceeds incountries where non-payers are regularly disconnected(e.g., Hungary) represented another manifestation of the neg-ative impact of the no-disconnection policy on the budget.
66In addition, budgetary outlays on the subsidy do not necessarily represent a net increase in the expenditure side of the budget, i.e.,the need to fund the subsidy may crowd out other, low priority budgetary outlays.
67A few developed countries have recently introduced competition in the supply of electricity and gas to both industrial and residential consumers. When this trend reaches Central and Eastern Europe and the former Soviet Union, cross-subsidies between house-holds (e.g., a three-block life-line tariff that channels subsidies from households with high energy consumption to households with lowenergy consumption) will also become unsustainable.

27
Pointing to the need to reduce fiscal deficits, the Bankadvocated a rapid phase-out of across-the-board utilitysubsidies in all countries in the region. In the former SovietUnion, the Bank also argued strongly against the wide-spread tolerance of non-payment and the continued appli-cation of large price discounts to privileged consumers.Responding to government concerns that many house-holds would not be able to pay tariffs that fully covercosts, the Bank generally recommended the use of income-tested subsidies to soften the negative impact of risingutility tariffs on low income households. However, theBank provided little practical advice on the administrationand financing of these income-tested cash transfer mech-anisms, and tended to overestimate the coverage of thepoor that could be achieved by these mechanisms in reallife. In a number of countries in the former Soviet Union,the Bank endorsed the application of a specific income-tested subsidy mechanism, burden limits, without noticingthe low coverage and targeting ratios that this subsidymechanism produced. A possible explanation for this over-sight is the insufficient amount of analytical work that sup-ported and substantiated the Bank’s advice. For example,in the two country cases that are presented in some detailbelow, only three Bank studies relied on statistical evidencefrom household surveys to evaluate the extent to which theapplied subsidy mechanisms reached their stated objectives.68
Heeding the Bank’s message about fiscal prudence,most countries in the region have made significant progress
in phasing out budget-funded across-the-board utility sub-sidies. However, their track record is less positive con-cerning the phase-out of across-the-board subsidies fund-ed through higher prices paid by industrial and commercialconsumers. In addition, the countries of the former SovietUnion (with the exception of the Baltic states) haveachieved only modest progress in their efforts to strength-en payment discipline and to phase out price discounts toprivileged households. As a result, several subsidy mecha-nisms coexist in many countries in the region today, pro-viding more support to the middle class than to the poor,and having a detrimental impact on the financial health ofthe utilities, on industrial competitiveness, and on local andcentral government budgets.
In view of these remaining challenges, the Bank shouldstep up its assistance to governments that are willing tomove away from particularly ineffective and costly subsidymechanisms (for example, governments that have decidedto sell state-owned electricity and gas distribution compa-nies to strategic investors, since the new owners will moreaggressively pursue and ultimately disconnect non-payinghouseholds). In each country where the government issearching for a better way to protect the poor, an effortneeds to be made to collect data on utility connectionratios, household expenditures, and the impact of the cur-rently applied subsidy mechanisms on the poor and thenon-poor. In some countries, the necessary informationwill be available from previous household surveys, whilein other countries, new household surveys will have to be
World Bank Advice andGovernment Response
n this chapter we briefly review the evolution of (i) Bank advice concerning the need for sub-sidies to mitigate the impact of utility price increases on the poor; (ii) recommended subsidymechanisms; and (iii) government responses during the past ten years. We selected the cases
of Poland and Russia to illustrate the challenges governments and Bank staff faced in Central andEastern Europe and the former Soviet Union. Both of these countries received substantial assistancefrom the Bank that included lending as well as policy advice, and Bank assistance was fairly contin-uous during the examined period. In addition, the two countries received substantial technical assis-tance and financial support from other donors, and the case studies below briefly describe these as
I
68These three studies are: (i) Caroline Freund and Christine Wallich, Raising Household Energy Prices in Poland: Who Gains? Who
Loses?, World Bank Policy Research Working Paper No. 1495, 1995; (ii) Poverty in Russia: An Assessment, World Bank, Report No.14110, June 1995; and (iii) Russia: Affordability of Cost Recovery—Housing and Communal Services, World Bank, 1999 (mimeo).

28
undertaken. The time and money spent on these surveyswill enable the Bank to provide higher quality and moreconvincing advice to its clients.
The Case of PolandPoland rejoined the World Bank in June 1986 after a
hiatus of 38 years. Between 1986 and 1989, the Bank carried out comprehensive reviews of the Polish economybut postponed lending until 1990. Throughout the 1990s,the Bank provided extensive financial and technical sup-port to the Government's economic transformation efforts,including the radical economic reforms that were intro-duced in January 1990. Thus, the Bank’s involvement inPoland encompassed the distinct economic periods of pre-transition, the “big bang” transition, the post-transitioncontraction, and finally, the period of Poland’s sustainedgrowth and aspirations to accede to the European Union.
As the table below shows, Poland, as did other coun-tries in the region, started the 1990s with utility tariffs thatwere a fraction of economic costs. The evolution ofincomes in Poland, however, differed from the evolution ofincomes in most countries in Eastern Europe and the for-mer Soviet Union due to the steady growth of Poland’sGDP since 1992 (although basing the index on the year of1990 masks the 15% decline of household incomes in thatyear relative to 1989).
Bank advice and financial support in Poland wereoffered both in the sector-specific contexts of energy and
social protection studies and operations, and in the broad-er context of the Bank’s support of Poland’s sweepingreforms through country assistance strategies and eco-nomic memoranda, and related lending operations.Energy sector work generally focused on remedying thedistortions of the centrally planned economy and dealingwith the critical issues of sector restructuring, while advicein the area of social protection covered income support, thesocial safety net, and the evolution of poverty during tran-sition. Relatively little Bank advice focused explicitly on theintersection of the utility sector and social issues.
A characteristic feature of Poland’s centrally plannedeconomy that remained in place up to the end of the 1980swas the pervasive subsidization of consumer goods andservices. The price structure reflected the belief that thestate should satisfy the basic needs of the population atbelow-cost (or “social”) prices. The cost to the budget ofthese subsidies was estimated at 11% of GDP in 1987. ABank study issued in 1989 examined the degree to which various categories of subsidies succeeded at reducing income-inequality.69 Across-the-board utilityprice subsidies were found to be relative income equalizers,although higher income households received more subsi-dies in absolute terms. The study noted that energy andhousing subsidies were considerably less efficient (on a unitof budgetary outlay basis) than some other subsidies inreducing income-inequality, and recommended that thegovernment focus its efforts on providing direct cash trans-
M a i n t a i n i n g U t i l i t y S e r v i c e s f o r t h e P o o r
69Poland: Subsidies and Income Distribution, World Bank Report No. 7776-POL, November 14, 1989.
TABLE 10. POLAND: HOUSEHOLD INCOMES AND ENERGY TARIFFS, 1990-98 (1990=100, CPI ADJUSTED)
Income Electricity Natural Gas District Heat
1990 100 100 100 100
1991 106 147 323 176
1992 105 151 474 352
1993 104 161 483 488
1994 108 170 487 597
1995 114 152 467 480
1996 119 143 437 479
1997 127 145 450 475
1998 132 148 464 505
Source: Bank staff calculations based on official statistical data.

W o r l d B a n k A d v i c e a n d G o v e r n m e n t R e s p o n s e
29
fers to the most needy, since these could achieve the samedegree of income equalization as the prevailing system ofsubsidies at a cost that would have been 80-90% lower.
On January 1, 1990, the government freed manyprices from control, and sharply reduced subsidies. Mostutility tariffs were increased dramatically, although theyremained significantly below full cost recovery levels. Thegovernment recognized that across-the-board price subsi-dies to households that consumed network fuels were thesource of significant distortions in the pricing system, anddecided to gradually phase these out. The Bank’s advice(supported by the Bank’s first Structural Adjustment Loan70) was that the government should liberalize coalprices and regulate other energy prices in a way thatensured that the relative prices of oil, gas, electricity, anddistrict heat would not get out of line with the relativeprices of these goods on foreign markets.71 A follow-up energy sector adjustment operation provided additionalsupport to the energy sector reform and price adjustmentprocess.72 Residential and industrial prices of electricityand gas reached parity by mid-1991. District heat tariffadjustments followed a more gradual schedule, and districtheat tariff subsidies continued to impose a considerabledrain on the budget during 1992.
The Country Economic Memorandum (CEM) pub-lished by the Bank in 1992 pointed to mushroomingincreases in housing subsidies (which were expected torequire more than US$1.2 billion in 1992 alone), andurged a further reduction in district heating subsidies.73 Onthe social protection front, the CEM noted that the gov-ernment had introduced a multifaceted safety net com-prisinglabor market policies, income support, and provi-sion of health services, but also that Poland wasoverspending on income maintenance programs that didnot add much value to human capital. The themes thatdominated the Bank’s advice on social assistance in the1980s—that assistance should be targeted at the mostneedy groups and universal entitlements should be phasedout— were again underscored in the 1992 CEM.
Using 1993 household survey data, a policy researchworking paper74 concluded that across-the-board house-hold energy price subsidies, while providing assistance tosome poorer households in the form of cheaper energy,provided more benefit to wealthier households becausethey consumed more energy in absolute as well as in rela-tive terms. On this basis, the paper rejected the commonsocial welfare argument for delaying energy price increas-es, and noted that better targeting of the poor could beachieved through the general social assistance program. Ifsome utility-specific mechanism for subsidizing services tothe poor was deemed expedient for non-economic reasons,the study recommended the use of a life-line electricity tar-iff with the caveat that the initial subsidized block shouldbe kept small.
The 1994 CEM noted that most fuel prices were stillbelow the economic cost of production and recommend-ed further price adjustments, including the phasing out ofthe across-the-board subsidy for district heating.75 TheCEM also recommended the adoption of measures to safe-guard the ability of the most vulnerable to consume utili-ty services after adjustments to the level and structure ofenergy prices. Specific subsidy mechanisms mentionedincluded life-line tariffs, price discounts for the poor, andfuel coupons, but there was no discussion of the pros andcons of any of these. As an alternative to continued grad-ual energy price adjustments, the CEM mentioned thepossibility of implementing a one-time, “big bang”increase in energy prices with significant compensation formost of the population, since this approach would ensurethat households face the right price signals, and would alsoavoid the lengthy debates that occur every time energyprices are increased.
By 1997, the Bank’s primary role in Poland had shift-ed back from lending to analytical and technical support,with an emphasis on supporting the country’s aspirationsto accede to the European Union. The 1997 CEM dis-cussed the energy sector strictly in that context, includingachievements in the areas of regulation, competition
70Poland: Structural Adjustment Loan, President's Report No. P-5294-POL, July 10, 1990.71 oland: Energy Market Development, World Bank Report No. 8224-POL, February 8, 1991; Poland: Energy Sector RestructuringProgram, ESMAP Report No. 153/93.
72Poland—Heat Supply Restructuring and Conservation Project, President’s Report No. P-5418-POL, June 12, 1991. The project includ-ed investment loans to five district heating enterprises and a commercial bank, and a sector adjustment loan to the Republic of Poland.
73Poland: Economic Transformation at a Crossroads, World Bank Report No. 10305-POL, May 29, 1992.74Caroline Freund and Christine Wallich, Raising Household Energy Prices in Poland: Who Gains? Who Loses?, World Bank PolicyResearch Working Paper No. 1495, 1995.
75Poland: Growth with Equity—Policies for the 1990s, World Bank Report No. 13039-POL, September 28, 1994.
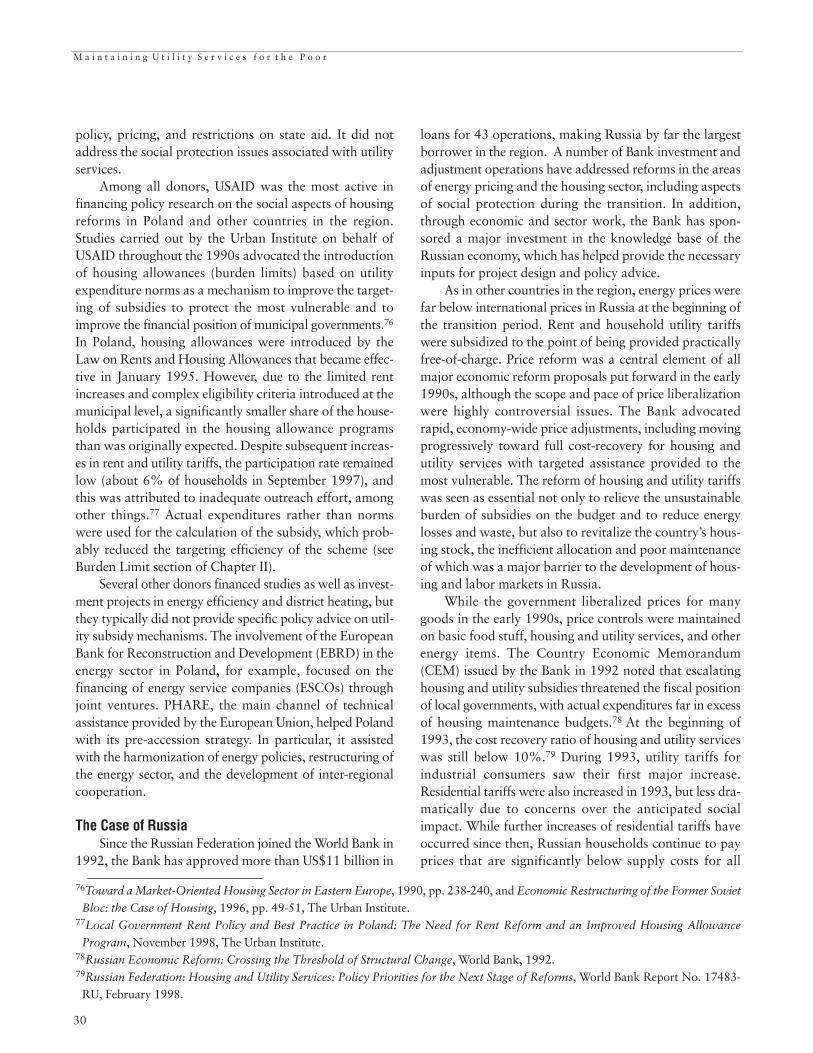
30
policy, pricing, and restrictions on state aid. It did notaddress the social protection issues associated with utilityservices.
Among all donors, USAID was the most active infinancing policy research on the social aspects of housingreforms in Poland and other countries in the region.Studies carried out by the Urban Institute on behalf ofUSAID throughout the 1990s advocated the introductionof housing allowances (burden limits) based on utilityexpenditure norms as a mechanism to improve the target-ing of subsidies to protect the most vulnerable and toimprove the financial position of municipal governments.76
In Poland, housing allowances were introduced by theLaw on Rents and Housing Allowances that became effec-tive in January 1995. However, due to the limited rentincreases and complex eligibility criteria introduced at themunicipal level, a significantly smaller share of the house-holds participated in the housing allowance programsthan was originally expected. Despite subsequent increas-es in rent and utility tariffs, the participation rate remainedlow (about 6% of households in September 1997), andthis was attributed to inadequate outreach effort, amongother things.77 Actual expenditures rather than normswere used for the calculation of the subsidy, which prob-ably reduced the targeting efficiency of the scheme (seeBurden Limit section of Chapter II).
Several other donors financed studies as well as invest-ment projects in energy efficiency and district heating, butthey typically did not provide specific policy advice on util-ity subsidy mechanisms. The involvement of the EuropeanBank for Reconstruction and Development (EBRD) in theenergy sector in Poland, for example, focused on thefinancing of energy service companies (ESCOs) throughjoint ventures. PHARE, the main channel of technicalassistance provided by the European Union, helped Polandwith its pre-accession strategy. In particular, it assistedwith the harmonization of energy policies, restructuring ofthe energy sector, and the development of inter-regionalcooperation.
The Case of RussiaSince the Russian Federation joined the World Bank in
1992, the Bank has approved more than US$11 billion in
loans for 43 operations, making Russia by far the largestborrower in the region. A number of Bank investment andadjustment operations have addressed reforms in the areasof energy pricing and the housing sector, including aspectsof social protection during the transition. In addition,through economic and sector work, the Bank has spon-sored a major investment in the knowledge base of theRussian economy, which has helped provide the necessaryinputs for project design and policy advice.
As in other countries in the region, energy prices werefar below international prices in Russia at the beginning ofthe transition period. Rent and household utility tariffswere subsidized to the point of being provided practicallyfree-of-charge. Price reform was a central element of allmajor economic reform proposals put forward in the early1990s, although the scope and pace of price liberalizationwere highly controversial issues. The Bank advocatedrapid, economy-wide price adjustments, including movingprogressively toward full cost-recovery for housing andutility services with targeted assistance provided to themost vulnerable. The reform of housing and utility tariffswas seen as essential not only to relieve the unsustainableburden of subsidies on the budget and to reduce energylosses and waste, but also to revitalize the country’s hous-ing stock, the inefficient allocation and poor maintenanceof which was a major barrier to the development of hous-ing and labor markets in Russia.
While the government liberalized prices for manygoods in the early 1990s, price controls were maintainedon basic food stuff, housing and utility services, and otherenergy items. The Country Economic Memorandum(CEM) issued by the Bank in 1992 noted that escalatinghousing and utility subsidies threatened the fiscal positionof local governments, with actual expenditures far in excessof housing maintenance budgets.78 At the beginning of1993, the cost recovery ratio of housing and utility serviceswas still below 10%.79 During 1993, utility tariffs forindustrial consumers saw their first major increase.Residential tariffs were also increased in 1993, but less dra-matically due to concerns over the anticipated socialimpact. While further increases of residential tariffs haveoccurred since then, Russian households continue to payprices that are significantly below supply costs for all
M a i n t a i n i n g U t i l i t y S e r v i c e s f o r t h e P o o r
76Toward a Market-Oriented Housing Sector in Eastern Europe, 1990, pp. 238-240, and Economic Restructuring of the Former Soviet
Bloc: the Case of Housing, 1996, pp. 49-51, The Urban Institute.77Local Government Rent Policy and Best Practice in Poland: The Need for Rent Reform and an Improved Housing Allowance
Program, November 1998, The Urban Institute.78Russian Economic Reform: Crossing the Threshold of Structural Change, World Bank, 1992.79Russian Federation: Housing and Utility Services: Policy Priorities for the Next Stage of Reforms, World Bank Report No. 17483-RU, February 1998.
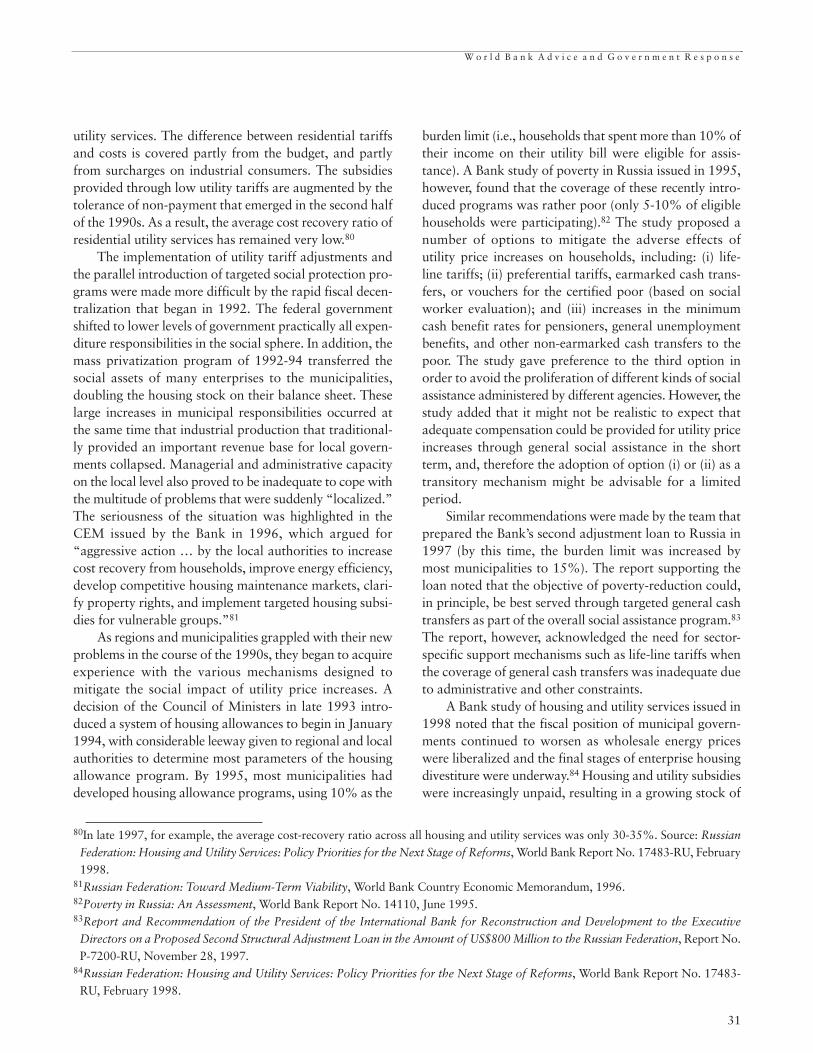
31
utility services. The difference between residential tariffsand costs is covered partly from the budget, and partlyfrom surcharges on industrial consumers. The subsidiesprovided through low utility tariffs are augmented by the tolerance of non-payment that emerged in the second halfof the 1990s. As a result, the average cost recovery ratio ofresidential utility services has remained very low.80
The implementation of utility tariff adjustments andthe parallel introduction of targeted social protection pro-grams were made more difficult by the rapid fiscal decen-tralization that began in 1992. The federal governmentshifted to lower levels of government practically all expen-diture responsibilities in the social sphere. In addition, themass privatization program of 1992-94 transferred thesocial assets of many enterprises to the municipalities,doubling the housing stock on their balance sheet. Theselarge increases in municipal responsibilities occurred atthe same time that industrial production that traditional-ly provided an important revenue base for local govern-ments collapsed. Managerial and administrative capacityon the local level also proved to be inadequate to cope withthe multitude of problems that were suddenly “localized.”The seriousness of the situation was highlighted in theCEM issued by the Bank in 1996, which argued for“aggressive action … by the local authorities to increasecost recovery from households, improve energy efficiency,develop competitive housing maintenance markets, clari-fy property rights, and implement targeted housing subsi-dies for vulnerable groups.”81
As regions and municipalities grappled with their newproblems in the course of the 1990s, they began to acquireexperience with the various mechanisms designed to mitigate the social impact of utility price increases. A decision of the Council of Ministers in late 1993 intro-duced a system of housing allowances to begin in January1994, with considerable leeway given to regional and localauthorities to determine most parameters of the housingallowance program. By 1995, most municipalities haddeveloped housing allowance programs, using 10% as the
burden limit (i.e., households that spent more than 10% oftheir income on their utility bill were eligible for assis-tance). A Bank study of poverty in Russia issued in 1995,however, found that the coverage of these recently intro-duced programs was rather poor (only 5-10% of eligiblehouseholds were participating).82 The study proposed anumber of options to mitigate the adverse effects of utility price increases on households, including: (i) life-line tariffs; (ii) preferential tariffs, earmarked cash trans-fers, or vouchers for the certified poor (based on socialworker evaluation); and (iii) increases in the minimumcash benefit rates for pensioners, general unemploymentbenefits, and other non-earmarked cash transfers to thepoor. The study gave preference to the third option inorder to avoid the proliferation of different kinds of socialassistance administered by different agencies. However, thestudy added that it might not be realistic to expect thatadequate compensation could be provided for utility priceincreases through general social assistance in the shortterm, and, therefore the adoption of option (i) or (ii) as atransitory mechanism might be advisable for a limitedperiod.
Similar recommendations were made by the team thatprepared the Bank’s second adjustment loan to Russia in1997 (by this time, the burden limit was increased bymost municipalities to 15%). The report supporting theloan noted that the objective of poverty-reduction could,in principle, be best served through targeted general cashtransfers as part of the overall social assistance program.83
The report, however, acknowledged the need for sector-specific support mechanisms such as life-line tariffs whenthe coverage of general cash transfers was inadequate dueto administrative and other constraints.
A Bank study of housing and utility services issued in1998 noted that the fiscal position of municipal govern-ments continued to worsen as wholesale energy priceswere liberalized and the final stages of enterprise housingdivestiture were underway.84 Housing and utility subsidieswere increasingly unpaid, resulting in a growing stock of
W o r l d B a n k A d v i c e a n d G o v e r n m e n t R e s p o n s e
80In late 1997, for example, the average cost-recovery ratio across all housing and utility services was only 30-35%. Source: Russian
Federation: Housing and Utility Services: Policy Priorities for the Next Stage of Reforms, World Bank Report No. 17483-RU, February1998.
81Russian Federation: Toward Medium-Term Viability, World Bank Country Economic Memorandum, 1996.82Poverty in Russia: An Assessment, World Bank Report No. 14110, June 1995.83Report and Recommendation of the President of the International Bank for Reconstruction and Development to the Executive
Directors on a Proposed Second Structural Adjustment Loan in the Amount of US$800 Million to the Russian Federation, Report No.P-7200-RU, November 28, 1997.
84Russian Federation: Housing and Utility Services: Policy Priorities for the Next Stage of Reforms, World Bank Report No. 17483-RU, February 1998.

32
overdue payables to utility companies and the rapid dete-rioration of the housing stock due to insufficient mainte-nance. The study argued for an immediate increase of costrecovery up to 50-60%. It was expected that this tariffincrease would set in motion serious saving efforts on theconsumer side, and would also help the local authorities topinpoint the real demand for social support. The studyemphasized the urgency of improving the targeting ofsocial assistance to needy households and the phase-out ofcounter-equalizing price discounts provided to privilegedconsumers.
A Bank analysis completed in 1999 that relied on1996 household survey and price data found that raisingtariffs to full-cost recovery levels would have increasedthe share of households with medium to high housing-util-ity burdens (defined as 20% or more of total householdexpenditures) from 12% to 54%.85 After taking intoaccount the cost of subsidies to bring the burden of all thesefamilies down to 20%, the net effect on municipal budgetswould have been a saving of more than 50% of the actualcost of across-the-board subsidies. The study also provid-ed a brief overview of the advantages and disadvantages ofsector-specific mechanisms to help the poor to cope withincreased housing and utility costs (life-line tariffs, vouch-ers, and earmarked and non-earmarked cash transfers).The study recommended the application of earmarkedcash transfers, such as the existing housing allowance pro-gram, with the caveat of significant improvements in theselection procedure. To improve the coverage and targetingof the poor, the study proposed the use of the followingproxies for poverty status: (i) the number of children andelderly in a household; (ii) whether a household is female-headed; (iii) the lack of ownership of a private plot of landor other assets and durable goods; (iv) the location of thehousehold's residence; and (v) unemployment of household members.
USAID, through its Russian Federation HousingSector Reform Project, sponsored a number of studies car-ried out by the Urban Institute in the 1990s.86 These stud-ies were devoted to implementing the housing allowanceprogram in Russia, and provided the theoretical and
analytical background for the program as well as practicaladvice for implementation. The studies argued that hous-ing allowances served several policy objectives: (i) protect-ing the poor during the transition period; (ii) providing analternative to across-the-board subsidies that imposed asmaller burden on municipal budgets; (iii) contributing tothe development of an efficient housing market by encour-aging the free movement of families between the privateand state housing sectors as a result of better services andlower rents; (iv) promoting the use of a market pricingmechanism for the allocation and reallocation of housing;and (v) facilitating the establishment of an independent andefficient system of housing maintenance. While the UrbanInstitute recommended that the calculation of the subsidybe based on normative utility expenditures (in order toensure that the allowance received was inversely related toincome), most municipalities decided to implement a bur-den limit scheme based on actual utility expenditures. As inPoland, this modification reduced the targeting efficiencyof the housing allowance program considerably.Assessments of the coverage achieved by the housingallowances found that the initial forecasts were overlyoptimistic. A low level of awareness coupled with the lowlevel of benefits was highlighted as the main reason behindthe worse-than-expected result in Russia.87
Although a number of other multi- and bilateraldonors financed studies on selected utility services (e.g., ondistrict heating), these were typically engineering assess-ments of rehabilitation requirements or demand-side man-agement options, and seldom addressed the social impactof increased cost recovery. In addition, the TACIS pro-gram, the main instrument of the European Union to chan-nel technical assistance to the former Soviet Union,financed the establishment of energy information centers ina number of Russian cities, and EBRD financedwater/municipal services projects with some associatedtechnical assistance for municipal capacity-building. Itappears that none of these donors engaged the governmentin a discussion of the pros and cons of various subsidymechanisms to maintain utility services to the poor.
M a i n t a i n i n g U t i l i t y S e r v i c e s f o r t h e P o o r
85Russia: Affordability of Cost Recovery—Housing and Communal Services, World Bank, 1999 (mimeo).86 Implementing Housing Allowances in Russia (1993); Economic Restructuring of the Former Soviet Bloc: the Case of Housing (1996);Restructuring Russia’s Housing Sector: 1991-1997 (1997), edited by Raymond Struyk, et. al., The Urban Institute.
87An Assessment of Administrative Practices in Russia’s Housing Allowance Program, prepared by R. Struyk, et. al., The Urban Institute,September 1998.

33
Annex 1 - Household SurveyData and Poverty Lines
he main data sources for the study were household budget surveys conducted in ECA coun-tries between 1996 and 1999. The survey instruments were designed for poverty assessmentpurposes and hence have very detailed data on household income and consumption as well
as on basic demographic and labor market characteristics (the instruments were based on or similarto the Living Standard Measurement Survey, a standardized tool developed by the World Bank forpoverty assessment).
TData
TABLE A1-1. HOUSEHOLD SURVEYS USED FOR THE ANALYSIS
Sample Size:Name of the Survey Agency Conducting the Survey Number of Households
Russia, Longitudinal Monitoring Research Triangle Institute 3,750
1996 Survey (North Carolina)
Institute of Sociology (Moscow)
Hungary, Household Budget Survey Central Statistics Office 7,560
1997
Kyrgyz Household Energy Survey London Economics and National 3,006
Republic, Statistics Committee
1999
Ukraine, “Ukraina-96” Project Kiev International Institute of 2,322
1996 Sociology
Latvia, Household Budget Survey Central Statistical Bureau 7,707
1997
Moldova, Household Budget Survey Department of Statistics 1,584
1997
Croatia, Household Budget Survey Central Bureau of Statistics 3,123
1998
Armenia, Living Standards Survey State Department of Statistics 4,920
1996
The surveys typically combine a household expendi-ture diary and questionnaires for all family members. Thediary is used to keep track of everyday household expen-ditures and provide basic data for measuring household
consumption. The questionnaires are used to obtain infor-mation on income, investment, and certain types of con-sumption that are different from those that are recorded inthe diary.

34
The samples are representative, based on the methodof stratified sampling. For some of the surveys (when thesample could not be fully stratified at the time of the inter-views), we used the sampling weights provided by the sur-vey teams (Ukraine, Moldova, Hungary, and Latvia).
All the surveys that we used include a section on util-ities. Unfortunately, because the questionnaires weredesigned for poverty assessment purposes and not for sub-sidy estimation, these sections sometimes contain incom-plete data.
Methodologya) Main definitions
Poverty is the status of a person who falls short of alevel of economic welfare deemed to constitute a reason-able minimum, either in some absolute sense or relative tothe standards of a specific society. The general concepts of(i) measuring the well-being (using income or consump-tion), (ii) choosing the unit of analysis (individuals orhouseholds), and (iii) setting the poverty line (defining thelevel of income or consumption below which the house-hold is considered poor) are briefly discussed below.b) Measuring well-being
The main issue in measuring well-being is to select anappropriate household welfare indicator. Typical measuresof well-being are income and consumption. We used as anindicator of household living standard a comprehensivemeasure of current consumption.
The current consumption indicator for measuring liv-ing standards and poverty based on household dataincludes:
• monetary non-business and non-investment expen-ditures
• gifts, earnings, and transfers in-kind • consumption from stock-piled goods (when the
information is available)• consumption from own production The current consumption aggregate does not include
imputed rent for owner-occupied housing and does notreflect the market value of subsidized goods, leading to theunderestimation of consumption and overestimation ofabsolute poverty incidence. Since we rely on relative pover-ty lines, these problems probably did not have a significant
impact on the quality of the analysis.c) Unit of analysis and poverty line
The analysis in this paper focuses on poverty amonghouseholds; if a household is deemed to be poor, all itsmembers are counted as poor. The implicit assumptionhere is that all individual members of a household benefitequally (or in a constant proportion, depending on theirage and gender, called equivalence scale) from the house-hold's expenditure or income.
Although we use relative poverty lines for the analysisin the paper, absolute poverty lines are also mentioned forillustration purposes. Absolute poverty lines producepoverty estimates that make international comparison pos-sible, but are less relevant for country-specific policy analy-sis. The absolute poverty line was calculated as the cost inlocal currency of the basket of goods that is equivalent toUS$2.15 per day per capita (in 1996 PPP terms).
We set the relative poverty line for each country attwo-thirds of the monthly median expenditure per equiv-alent adult. Households with monthly consumption (divid-ed by their effective size) that is less than the correspond-ing relative poverty line are called relatively poor.
There are some economies of scale in consumption;therefore, the per capita cost of reaching a certain welfarelevel is lower in large households than in small ones. Theparameter O was used to measure such economies of scale.We assumed that the effective number of household memberswho share a certain welfare should be adjusted using thiseconomies of scale parameter, that is, welfare per member (w)in a household with N members equals total householdwelfare (W) divided by N to the power of O, i.e.,
In countries where joint multigenerational families arenot rare, taking into account the economies of scale is cru-cial. For the purpose of this study, following the method-ology adopted in Making Transition Work for Everyone:Poverty and Inequality in Europe and Central Asia, WorldBank, 2000, we set the value of O at 0.75.
The following summarizes the approaches used tomeasure poverty:
M a i n t a i n i n g U t i l i t y S e r v i c e s f o r t h e P o o r
Welfare Measure perWelfare Aggregate Household Member Poverty Line
Relative Current consumption Household consumption/N0.75 2/3 of the nationalPoverty consumption per
equivalent adultAbsolute Current consumption Household consumption/N $2.15 per day Poverty (in 1996 PPP terms)
Ww=
NO

35
The data provided by the authorities included thenumber of beneficiaries, their estimated electricity con-sumption, electricity tariffs, and the percentage of pricereduction for these privileged groups. The incidence ofpoverty among the privileged groups was estimated usinghousehold survey data, as described below.
Household surveys provided detailed information onthe social and economic status of respondents. Using thisinformation, we constructed sub-samples of respondentsrepresentative of privileged groups (i.e., the groups thatreceive electricity price discounts in Ukraine and Moldova),and calculated the incidence of poverty within these sub-samples. In cases when the questionnaire contained a ques-tion on the respondent’s affiliation with a certain privileged
group, the sub-sample was constructed using responses tothis question. For example, to construct a sub-sample ofdisabled people from the Ukraine data set, the question“Did you receive disability or sickness pension during thelast 30 days?” was used. In other cases, when such a ques-tion was not asked in the survey, we constructed sub-sam-ples based on proxies, i.e., we selected groups from the sur-vey that we assumed had characteristics similar to thecharacteristics of privileged groups. Tables A2-1 and A2-2 list the groups from the surveys that were used thatway. The data received from the authorities and the cal-culation of coverage and targeting ratios are presented inTables A2-3 and A2-4.
Annex 2 - Privileges and PovertyStatus in Moldova and Ukraine
n order to evaluate the system of utility price discounts for privileged consumers that is in effectin many former Soviet Union countries, we estimated the coverage and targeting ratios of thepoor achieved through this subsidy mechanism in the electricity sector in Moldova and
Ukraine. The calculations were based on data received from Ukrainian and Moldovan governmentagencies overseeing the electricity sector, and also on data obtained from household surveys (see Annex1 for general information on household surveys).
I
TABLE A2-1. UKRAINE: REPRESENTATIVE/PROXY GROUPS FOR PRIVILEGED HOUSEHOLDS HOUSEHOLD SURVEY, 1996
Groups from the Survey Used as Representative/proxyPrivileged Groups for Privileged Groups
Militia workers and military officers Military servicemen
Veterans of military service and war veterans Receive elderly age pension on privileged terms
Veterinarians (health care + rural) Work in health care, or physical culture, or social security and ‘live in rural area’
Disabled Receive disability or sickness pension
Victims of Chernobyl catastrophe Receive compensation for Chernobyl accident
Firemen Employees of municipal utilities and municipal services

Maintaining Utility Services for the Poor
36
TABLE A2-2. MOLDOVA: REPRESENTATIVE/PROXY GROUPS FOR PRIVILEGED HOUSEHOLDS HOUSEHOLD SURVEY, 1997
Groups from the Survey Used as Representative/proxy
Privileged Categories for Privileged Groups
Invalids Invalids
Second World War participants, fascist camp Invalids, age 65 and abovevictims, victims of Leningrad blockade, victimsof political repressions
Families with an invalid, families of Chernobyl Families that receive compensationvictims, families of Transnistria victims, childrenof the military deceased while on duty
Afganistan war participants, Transnistria events Military servantsparticipants
Public workers Employees of education, health care, and social serviceinstitutions
Police personnel, military police, firemen, judges, Employees of defense and military services, state securitysecurity staff management

37
TABL
E A2
-3.
MOL
DOVA
: ELE
CTRI
CITY
PRI
VILE
GES,
DIS
TRIB
UTIO
N BE
TWEE
N PO
OR A
ND N
ON-P
OOR
*
Ann
ual P
rice
of
Ann
ual
Tar
iff,
lei/k
Wh
Ele
ctri
city
Pro
vide
d to
Sum
of
Ben
efic
iari
es (
lei)
Ben
efit
sB
elow
Ann
ual
Ave
rage
(lei
)P
over
tySu
bsid
ies
Cat
agor
ies
Num
ber
Mon
thly
Lin
e, %
of
Rec
eive
dof
Ben
efit
s, %
ofC
onsu
mpt
ion,
Full
Am
ount
Pri
ce a
t P
eopl
e in
by t
heB
enef
icia
ries
of
Tar
iff
Ben
efic
iari
eskW
hT
arif
fB
illed
Full
Tar
iff
Am
ount
Bill
edth
e G
roup
Poo
r, le
i
1In
valid
s
I G
roup
Fam
ilies
con
sist
ing
100
2,16
660
0.42
065
4,99
80
654,
998
of d
isab
led
peop
le
wit
h m
inor
chi
ldre
n
Lab
or in
valid
s50
17,1
2460
0.42
0.21
5,17
8,29
82,
589,
149
2,58
9,14
9
Inva
lids
who
wer
e 50
3,60
260
0.42
0.21
1,08
9,24
554
4,62
254
4,62
2di
sabl
ed s
ince
ch
ildho
od
Arm
y in
valid
s50
9860
0.42
0.21
29,6
3514
,818
14,8
18
Seco
nd W
orld
War
5053
060
0.42
0.21
160,
272
80,1
3680
,136
inva
lids
Tra
nsni
stri
a in
valid
s50
1960
0.42
0.21
5,74
62,
873
2,87
3
Che
rnob
yl in
valid
s50
1,30
060
0.42
0.21
393,
120
196,
560
196,
560
Afg
anis
tan
inva
lids
5012
600.
420.
213,
629
1,81
41,
814
Subt
otal
24,8
514,
084,
970
301,
227,
848
II G
roup
Lab
or in
valid
s25
83,0
0860
0.42
0.31
525
,101
,619
18,8
26,2
146,
275,
405
Inva
lids
who
wer
e 25
12,4
0460
0.42
0.31
53,
750,
970
2,81
3,22
793
7,74
2di
sabl
ed s
ince
child
hood
Arm
y in
valid
s50
807
600.
420.
2124
4,03
712
2,01
812
2,01
8
Seco
nd W
orld
War
504,
679
600.
420.
211,
414,
930
707,
465
707,
465
inva
lids
Tra
nsni
stri
a in
valid
s50
145
600.
420.
2143
,848
21,9
2421
,924
Mem
bers
of
the
high
50
250
600.
420.
2175
,600
37,8
0037
,800
risk
sub
divi
sion
s w
ho
wer
e re
nder
ed s
ick
of
dise
ases
or
beca
me
inva
lids
Afg
anis
tan
inva
lids
5013
860
0.42
0.21
41,7
3120
,866
20,8
66
Subt
otal
101,
431
8,12
3,22
028
2,24
2,62
7

38
TABL
E A2
-3.
MOL
DOVA
: ELE
CTRI
CITY
PRI
VILE
GES,
DIS
TRIB
UTIO
N BE
TWEE
N PO
OR A
ND N
ON-P
OOR
*con
tinue
d
Ann
ual P
rice
of
Ann
ual
Tar
iff
lei/k
Wh
Ele
ctri
city
; Pro
vide
d to
Sum
of
Ben
efic
iare
s (l
ei)
Ben
efit
sB
elow
Ann
ual
Ave
rage
(lei
)P
over
tySu
bsid
ies
Cat
agor
ies
Num
ber
Mon
thly
Lin
e, %
of
Rec
eive
dof
Ben
efit
s, %
ofC
onsu
mpt
ion,
Full
Am
ount
Pri
ce a
t P
eopl
e in
by t
heB
enef
icia
ries
of
Tar
iff
Ben
efic
iari
eskW
hT
arif
fB
illed
Full
Tar
iff
Am
ount
Bill
edth
e G
roup
Poo
r, le
i
III
Gro
up
Lab
or in
valid
s25
83,0
0860
0.42
0.31
525
,101
,619
18,8
26,2
146,
275,
405
Arm
y in
valid
s50
337
600.
420.
2110
1,90
950
,954
50,9
54
Seco
nd W
orld
War
5033
360
0.42
0.21
100,
699
50,3
5050
,350
inva
lids
Tra
nsni
stri
a in
valid
s50
2460
0.42
0.21
7,25
83,
629
3,62
9
Mem
bers
of
the
high
50
8,07
160
0.42
0.21
2,44
0,67
01,
220,
335
1,22
0,33
5ri
sk s
ubdi
visi
ons,
who
w
ere
rend
ered
sic
k of
di
seas
es o
r be
cam
e in
valid
s
Afg
anis
tan
inva
lids
5039
600.
420.
2111
,794
5,89
75,
897
Subt
otal
91,8
121,
331,
165
1824
0,01
3
2Po
lice
pers
onne
l50
17,5
1260
0.42
0.21
5,29
5,62
92,
647,
814
2,64
7,81
48
218,
325
3C
arab
inee
rs (
mili
tary
50
1,48
860
0.42
0.21
449,
971
224,
986
224,
986
818
,551
polic
4Fi
rem
en50
1,90
060
0.42
0.21
574,
560
287,
280
287,
280
823
,688
5Ju
dges
5029
160
0.42
0.21
87,9
9843
,999
43,9
998
3,62
8
6Pe
nite
ntia
ry s
yste
m s
taff
501,
900
600.
420.
2157
4,56
028
7,28
028
7,28
026
74,8
65
7Pu
blic
wor
kers
5010
,000
600.
420.
213,
024,
000
1,51
2,00
01,
512,
000
1623
6,97
6
8Se
cond
Wor
ld W
ar
5023
,879
600.
420.
217,
221,
010
3,61
0,50
53,
610,
505
291,
043,
620
part
icip
ants
9Fa
mili
es t
hat
have
one
50
10,0
0060
0.42
0.21
3,02
4,00
01,
512,
000
1,51
2,00
024
360,
687
Gro
up I
inva
lid o
r a
child
in
valid
10Pa
rtic
ipan
ts t
o th
e 50
25,0
0060
0.42
0.21
7,56
0,00
03,
780,
000
3,78
0,00
020
746,
963
Tra
nsni
stri
a ev
ents
11A
fgan
ista
n w
ar
508,
071
600.
420.
212,
440,
670
1,22
0,33
51,
220,
335
2024
1,15
0pa
rtic
ipan
ts
12Fa
scis
m c
amp
vict
ims
501,
074
600.
420.
2132
4,77
816
2,38
916
2,38
929
46,9
3913
Fam
ilies
of
dece
ased
50
5,54
660
0.42
0.21
1,67
7,11
083
8,55
583
8,55
526
218,
527
Seco
nd W
orld
War
in
valid
s14
Fam
ilies
of
dece
ased
50
234
600.
420.
2170
,762
35,3
8135
,381
248,
440
Tra
nsni
stri
a ev
ents
in
divi
dual
s

39
TABL
E A2
-3.
MOL
DOVA
: ELE
CTRI
CITY
PRI
VILE
GES,
DIS
TRIB
UTIO
N BE
TWEE
N PO
OR A
ND N
ON-P
OOR
*con
tinue
d
Ann
ual P
rice
of
Ann
ual
Tar
iff
lei/k
Wh
Ele
ctri
city
; Pro
vide
d to
Sum
of
Ben
efic
iare
s (l
ei)
Ben
efit
sB
elow
Ann
ual
Ave
rage
(lei
)P
over
tySu
bsid
ies
Cat
agor
ies
Num
ber
Mon
thly
Lin
e, %
of
Rec
eive
dof
Ben
efit
s, %
ofC
onsu
mpt
ion,
Full
Am
ount
Pri
ce a
t P
eopl
e in
by t
heB
enef
icia
ries
of
Tar
iff
Ben
efic
iari
eskW
hT
arif
fB
illed
Full
Tar
iff
Am
ount
Bill
edth
e G
roup
Poo
r, le
i
15C
hild
ren
of t
he m
ilita
ry
5080
060
0.42
0.21
241,
920
120,
960
120,
960
2428
,855
dece
ased
dur
ing
the
Seco
nd W
orld
War
or
whi
le o
n m
ilita
ry d
uty,
w
ho b
ecam
e in
valid
sbe
fore
com
ing
of a
ge
16Fa
mili
es o
f th
ose
who
5039
600.
420.
2111
,794
5,89
75,
897
241,
407
died
dur
ing
the
Che
rnob
yl
cata
stro
phe
and
who
die
das
a r
esul
t of
the
act
inic
di
seas
e
17V
icti
ms
of L
enin
grad
50
200
600.
420.
2160
,480
30,2
4030
,240
298,
741
bloc
kade
18Pa
rtic
ipan
ts t
o th
e 50
1,05
060
0.42
0.21
317,
520
158,
760
158,
760
2437
,872
liqui
dati
on o
f th
e C
hern
obyl
cat
astr
ophe
19V
icti
ms
of t
he p
olit
ical
50
10,4
4060
0.42
0.21
3,15
7,05
61,
578,
528
1,57
8,52
829
456,
275
repr
essi
ons
of t
he c
omm
unis
t re
gim
e (p
ensi
oner
s an
din
valid
s)
20Se
curi
ty s
taff
5095
060
0.42
0.21
287,
280
143,
640
143,
640
811
,844
21L
ow in
com
e pe
nsio
ners
3045
,327
600.
420.
294
13,7
06,8
859,
594,
819
4,11
2,06
510
04,
112,
065
TO
TA
L38
3,79
535
,851
,969
3511
,609
,906
Dat
a on
num
ber
of b
enef
icia
ries
, con
sum
ptio
n, t
arif
fs, a
nd p
erce
ntag
e of
pri
ce r
educ
tion
for
pri
vile
ged
grou
ps w
ere
prov
ided
by
staf
f of
Mol
dova
Red
side
nt m
issi
on. D
ata
on p
over
ty
inci
denc
e fo
r pr
ivile
ged
grou
ps w
as c
alcu
late
d fo
r th
is p
aper
usi
ng h
ouse
hold
sur
vey
data
.

40
TABL
E A2
-4.
UKRA
INE:
ELE
CTRI
CITY
PRI
VILE
GES,
DIS
TRIB
UTIO
N BE
TWEE
N PO
OR A
ND N
ON-P
OOR*
Bel
owA
nnua
lA
vera
geM
onth
lyA
nnua
lP
over
tySu
bsid
ies
Mon
thly
Ave
rage
Ben
efit
s,Su
m o
fM
onth
sSu
m o
fL
ine,
% o
fR
ecei
ved
Pri
vile
ged
Num
ber
ofC
onsu
mpt
ion,
Tar
iff
% o
fB
enef
its,
of T
arif
f B
enef
its,
P
eopl
e in
by t
heC
ateg
orie
sB
enef
icia
ries
kWh
UA
H/k
Wh
Tar
iff
UA
HU
sage
UA
Hth
e G
roup
Poo
r, U
AH
1M
iliti
a w
orke
rs20
7,19
613
50.
1252
501,
751,
013
1221
,012
,161
347,
163,
23
2V
eter
ans
of m
ilita
ry71
,430
900.
1252
5040
2,43
712
4,82
9,23
923
%**
**1,
114,
440
serv
ice
3Ju
dges
3,31
213
50.
1252
5027
,990
1233
5,87
70*
*0
4In
vest
igat
ors
and
5,44
013
50.
1252
5045
,973
1255
1,68
10*
*0
pros
ecut
ors
5M
ilita
ry o
ffic
ers
209,
288
900.
1252
501,
179,
129
1214
,149
,543
34**
*4,
823,
708
6V
eter
inar
y w
orke
rs7,
044
135
0.12
5210
011
9,05
812
1,42
8,69
24
57,1
48
7Fi
rem
en30
,344
135
0.12
5250
256,
437
123,
077,
246
2680
0,08
4
8W
ar V
eter
ans
4,34
4,08
790
0.12
5258
28,4
12,9
9212
340,
955,
905
23**
**78
,682
,132
War
/labo
r he
roes
6,87
713
50.
1252
100
116,
235
121,
394,
821
100%
pri
vile
ges
385,
667
900.
1252
100
4,34
5,69
612
52,1
48,3
4975
% p
rivi
lege
s67
6,54
990
0.12
5275
5,71
7,51
612
68,6
10,1
8750
% p
rivi
lege
s3,
274,
994
900.
1252
5018
,451
,316
1222
1,41
5,79
4
9D
isab
led
(as
per
36,3
3913
50.
1252
5030
7,10
112
3,68
5,21
134
1,25
6,32
2C
rim
ea’s
VR
ord
er)
10V
icti
ms
of p
olit
ical
51
,891
900.
1252
5029
2,35
412
3,50
8,24
725
877,
062
repr
essi
ons
of t
heco
mm
unis
t re
gim
e11
Che
rnob
yl v
icti
ms
246,
319
135
0.12
5250
2,08
1,64
212
24,9
79,7
0214
3,49
7,15
8
12C
hern
obyl
30-
km22
5,97
413
50.
1252
2595
4,85
312
11,4
58,2
3814
1,60
4,15
3zo
ne r
esid
ents
13E
mpl
oyee
s of
pro
tect
ion
100
na
‘pla
nts
(Che
rnob
yl)’
Tot
al p
rivi
lege
d co
nsum
ers
5,43
8,66
435
,830
,978
429,
971,
741
2399
,875
,443
* D
ata
on n
umbe
r of
ben
efic
iari
es, c
onsu
mpt
ion,
tar
iffs
, and
per
cent
age
of p
rice
red
ucti
on f
or p
rivi
lege
d gr
oups
wer
e pr
ovid
ed b
y th
e st
aff
of M
oldo
va R
esid
ent
Mis
sion
(or
igin
al s
ourc
e –
Min
ener
go).
Dat
a on
pov
erty
inci
denc
e fo
r pr
ivile
ged
grou
ps w
as c
alcu
late
d fo
r th
is p
aper
usi
ng h
ouse
hold
sur
vey
data
.
** a
ssum
ptio
n.
***
cate
gori
es 1
and
5 a
re g
roup
ed t
oget
her.
****
cat
egor
ies
2 an
d 8
are
grou
ped
toge
ther
.
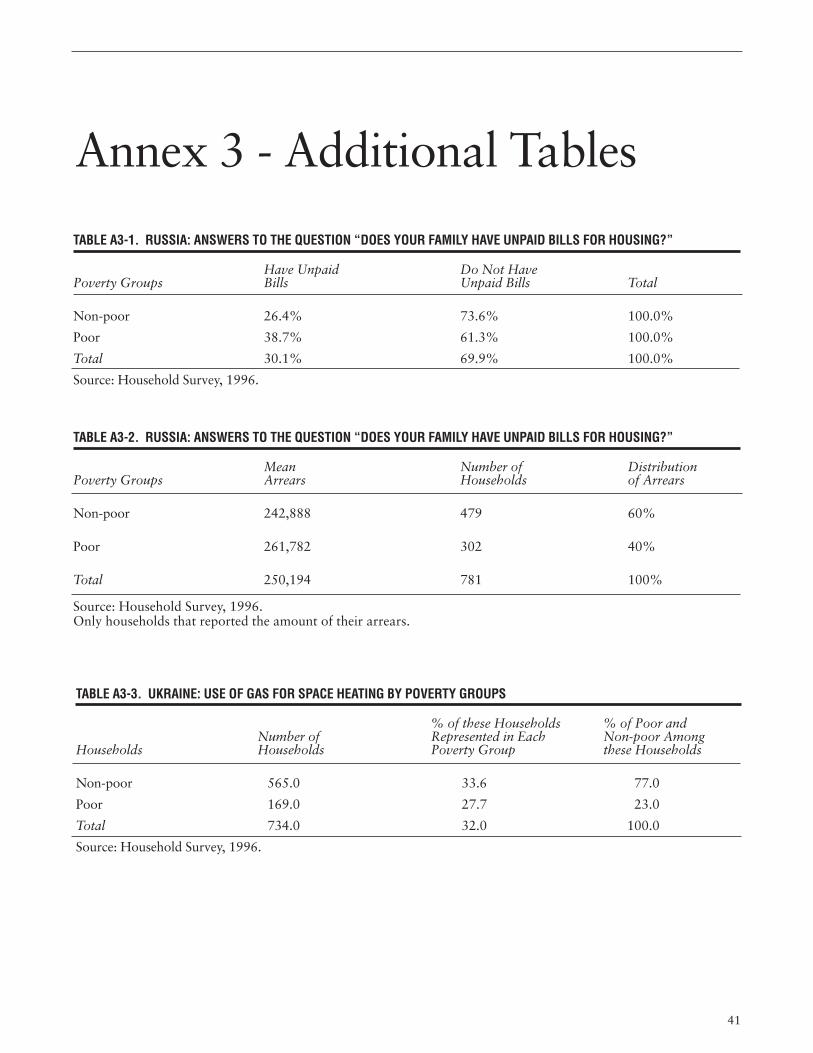
41
Annex 3 - Additional Tables
TABLE A3-1. RUSSIA: ANSWERS TO THE QUESTION “DOES YOUR FAMILY HAVE UNPAID BILLS FOR HOUSING?”
Have Unpaid Do Not HavePoverty Groups Bills Unpaid Bills Total
Non-poor 26.4% 73.6% 100.0%
Poor 38.7% 61.3% 100.0%
Total 30.1% 69.9% 100.0%
Source: Household Survey, 1996.
TABLE A3-2. RUSSIA: ANSWERS TO THE QUESTION “DOES YOUR FAMILY HAVE UNPAID BILLS FOR HOUSING?”
Mean Number of DistributionPoverty Groups Arrears Households of Arrears
Non-poor 242,888 479 60%
Poor 261,782 302 40%
Total 250,194 781 100%
Source: Household Survey, 1996.Only households that reported the amount of their arrears.
TABLE A3-3. UKRAINE: USE OF GAS FOR SPACE HEATING BY POVERTY GROUPS
% of these Households % of Poor andNumber of Represented in Each Non-poor Among
Households Households Poverty Group these Households
Non-poor 565.0 33.6 77.0
Poor 169.0 27.7 23.0
Total 734.0 32.0 100.0
Source: Household Survey, 1996.

M a i n t a i n i n g U t i l i t y S e r v i c e s f o r t h e P o o r
42
TABLE A3-4. UKRAINE: APARTMENT AND FAMILY SIZE BY POVERTY GROUPS
Mean Apartment Size (total area (m2)
Households Households Mean FamilyUsing Gas for Connected to Size
Households Heating District Heating
Non-poor 65.8 51.3 3.2
Poor 51.6 47.5 2.9
Source: Household Survey, 1996.
TABLE A3-5. RUSSIA: WATER AND WASTEWATER TARIFFS AND CONSUMPTION, 1997
Indices Units Values
Consumption - total t hs.m3 17,434,500.40
Of which: household t hs.m3 10,129,526.80
Of which: enterprises t hs.m3 4,890,672.40
Revenues - total mln.rub. 22,839,017.20
Of which: main activity mln.rub. 20,599,125.60
Of which: from households mln.rub. 4,956,115.20
Of which: from enterprises mln.rub. 9,631,462.40
Revenues from other activities mln.rub. 2,239,891.60
Expenditures - total mln.rub. 25,173,092.80
Of which: expenditures from main activity mln.rub. 22,191,088.40
Of which: materials expenditures mln.rub. 10,530,388.80
Average tariff for households rub/m3 489
Average tariff for enterprises rub/m3 1969
Source: State Statistics Committee.

43
TABL
E A3
-6.
RUSS
IA: R
ESID
ENTI
AL W
ATER
SUB
SIDI
ES, 1
996
Res
iden
tial
Cus
tom
ers,
Con
sum
er C
lass
esA
part
men
tw
ith
Apa
rtm
ent
Apa
rtm
ent
Wat
er,
No
Sing
leSi
ngle
wit
hw
ith
Gas
,C
onne
ctio
nH
ouse
wit
hH
ouse
wit
hW
ater
and
Wat
er,
Sew
erag
e,to
Wat
erW
ater
, No
Wat
er a
ndSe
wer
age,
Gas
,C
entr
alSu
pply
Gas
Gas
No
Gas
Sew
erag
eH
eati
ngTo
tal
Tota
l %
I. P
over
ty G
roup
sa
Non
-poo
r1,
128
265
403
1,00
438
42,
606
5,79
070
.2
Poor
775
150
204
245
268
819
2,46
129
.8
Tota
l1,
903
415
607
1,24
965
23,
425
8,25
110
0.0
II. R
esid
enti
al C
on-
35.0
45.0
70.0
117.
514
8.3
260.
0na
nasu
mpt
ion
Nor
ms
(lit
ers/
capi
ta/d
ay)b
III.
Res
iden
tial
Sub
sidy
55
4.0
554.
055
4.0
554.
055
4.0
554.
055
4.0
na(r
uble
s pe
r cu
bic
met
er)c
IV. R
esid
enti
al S
ubsi
dy
19.4
24.9
38.8
65.1
82.2
144.
0na
na(r
uble
s pe
r ca
pita
per
day
)
V. D
istr
ibut
ion
of S
ubsi
dy b
etw
een
Pov
erty
Gro
upsa
Am
ount
of S
ubsi
dy
21,8
71.9
26,
606.
4515
,628
.34
65,3
55.3
831
,555
.84
375,
368.
2451
6,38
6.17
73.9
that
Goe
s to
Non
-poo
r
Am
ount
of S
ubsi
dy
15,0
27.2
53,
739.
507,
911.
1215
,948
.28
22,0
23.3
511
7,96
8.76
182,
618.
2526
.1th
at G
oes
to P
oor
aSo
urce
: Hou
seho
ld S
urve
y, 1
996.
bSo
urce
: PA
DC
O, I
nc.,
1996
, Tec
hnic
al A
ssis
tanc
e fo
r L
ocal
Lev
el, C
omm
unal
Ser
vice
s P
rici
ng in
Rus
sia,
p.1
3.c
Subs
idy
is c
alcu
late
d as
dif
fere
nce
betw
een
budg
et o
rgan
izat
ions
' tar
iff,
whi
ch is
set
at c
ost r
ecov
ery
leve
l, an
d re
side
ntia
l tar
iff.
As
of J
anua
ry 1
996,
tari
ffs
for
resi
dent
ial c
usto
mer
s w
ere
370
rubl
es/m
3 , fo
r bu
dget
org
aniz
atio
ns -
924
rubl
es/c
u m
eter
, and
for
indu
stri
al c
usto
mer
s - 2
,691
rub
les/
cu m
eter
.So
urce
: PA
DC
O, I
nc.,
1996
, Tec
hnic
al A
ssis
tanc
e fo
r L
ocal
Lev
el, C
omm
unal
Ser
vice
s P
rici
ng in
Rus
sia,
p.1
0.
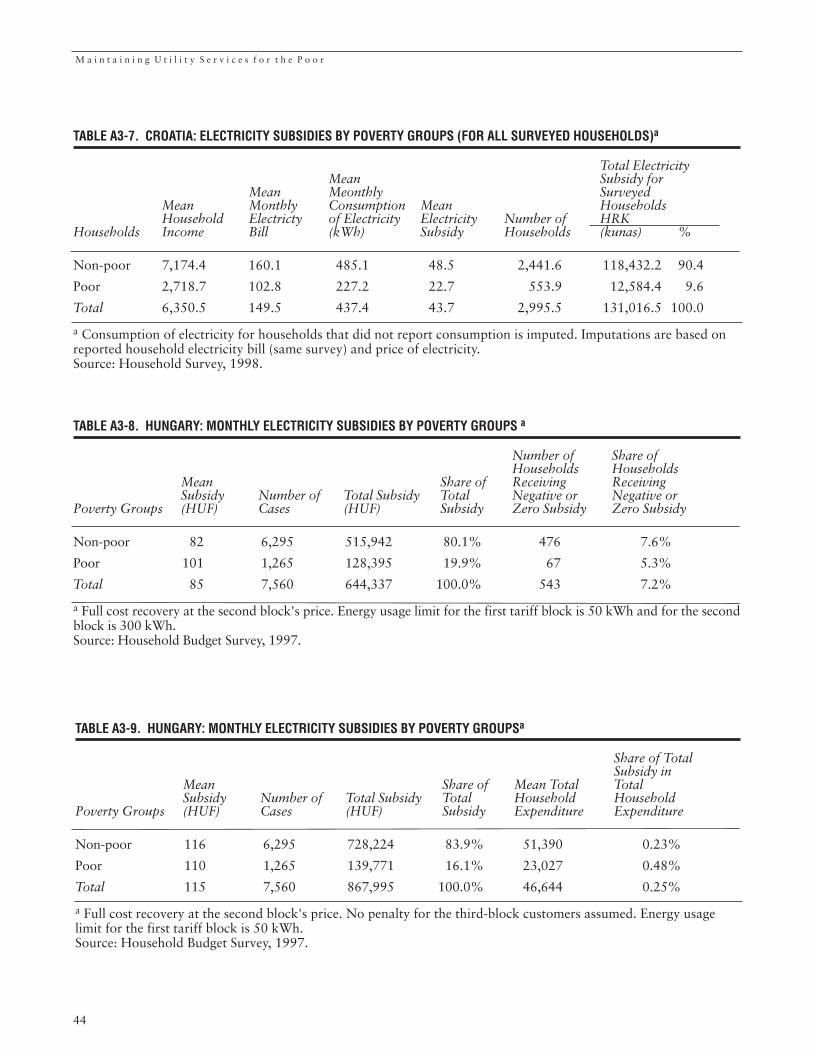
M a i n t a i n i n g U t i l i t y S e r v i c e s f o r t h e P o o r
44
TABLE A3-7. CROATIA: ELECTRICITY SUBSIDIES BY POVERTY GROUPS (FOR ALL SURVEYED HOUSEHOLDS)a
Total ElectricityMean Subsidy for
Mean Meonthly SurveyedMean Monthly Consumption Mean HouseholdsHousehold Electricty of Electricity Electricity Number of HRK
Households Income Bill (kWh) Subsidy Households (kunas) %
Non-poor 7,174.4 160.1 485.1 48.5 2,441.6 118,432.2 90.4
Poor 2,718.7 102.8 227.2 22.7 553.9 12,584.4 9.6
Total 6,350.5 149.5 437.4 43.7 2,995.5 131,016.5 100.0
a Consumption of electricity for households that did not report consumption is imputed. Imputations are based onreported household electricity bill (same survey) and price of electricity.Source: Household Survey, 1998.
TABLE A3-8. HUNGARY: MONTHLY ELECTRICITY SUBSIDIES BY POVERTY GROUPS a
Number of Share ofHouseholds Households
Mean Share of Receiving ReceivingSubsidy Number of Total Subsidy Total Negative or Negative or
Poverty Groups (HUF) Cases (HUF) Subsidy Zero Subsidy Zero Subsidy
Non-poor 82 6,295 515,942 80.1% 476 7.6%
Poor 101 1,265 128,395 19.9% 67 5.3%
Total 85 7,560 644,337 100.0% 543 7.2%
a Full cost recovery at the second block's price. Energy usage limit for the first tariff block is 50 kWh and for the secondblock is 300 kWh.Source: Household Budget Survey, 1997.
TABLE A3-9. HUNGARY: MONTHLY ELECTRICITY SUBSIDIES BY POVERTY GROUPSa
Share of TotalSubsidy in
Mean Share of Mean Total TotalSubsidy Number of Total Subsidy Total Household Household
Poverty Groups (HUF) Cases (HUF) Subsidy Expenditure Expenditure
Non-poor 116 6,295 728,224 83.9% 51,390 0.23%
Poor 110 1,265 139,771 16.1% 23,027 0.48%
Total 115 7,560 867,995 100.0% 46,644 0.25%
a Full cost recovery at the second block's price. No penalty for the third-block customers assumed. Energy usagelimit for the first tariff block is 50 kWh.Source: Household Budget Survey, 1997.

A n n e x 3
45
TABLE A3-10. HUNGARY: MONTHLY ELECTRICITY SUBSIDIES BY POVERTY GROUPSa
Number of Share ofHouseholds Households
Mean Share of Receiving ReceivingSubsidy Number of Total Subsidy Total Negative or Negative or
Poverty Groups (HUF) Cases (HUF) Subsidy Zero Subsidy Zero Subsidy
Non-poor -6 6,295 -35,073 -96.4% 2,094 33.3%
Poor 56 1,265 71,468 196.4% 243 19.2%
Total 5 7,560 36,395 100.0% 2,337 30.9%
a Full cost recovery at the second block's price. Energy usage limit for the first tariff block is 50 kWh and for thesecond block is 150 kWh.Source: Household Budget Survey, 1997.
TABLE A3-11. MOLDOVA: DISTRICT HEATING SUBSIDY, LIFELINE = 12M2
(ONLY HOUSEHOLDS WITH CENTRAL HEAT CONNECTION)
Subsidy as ShareTotal of Total Distribution
Mean Household Number of Household of TotalPoverty Groups Subsidy Expenditure Households Expenditure Subsidy
Non-poor 67.72 511.48 343,087 13.2% 84%
Poor 68.12 120.96 64,742 56.3% 16%
Total 67.78 449.49 407,829 15.1% 100%
Source: Household Survey, 1998.
TABLE A3-12. HUNGARY: MONTHLY ELECTRICITY SUBSIDIES BY POVERTY GROUPS a
Share of TotalSubsidy in
Mean Share of Mean Total TotalSubsidy Number of Total Subsidy Total Household Household
Poverty Groups (HUF) Cases (HUF) Subsidy Expenditure Expenditure
Non-poor 121 6,295 761,786 82.3% 51,390 0.24%
Poor 130 1,265 164,153 17.7% 23,027 0.56%
Total 122 7,560 925,939 100.0% 46,644 0.26%
a Full cost recovery at the second block's price. No penalty for the third-block customers assumed. Energy usagelimit for the first tariff block is 20 kWh*family size.Source: Household Budget Survey, 1997.

Maintaining Utility Services for the Poor
46
TABLE A3-13. UKRAINE: REPORTED HOUSING SUBSIDY BY POVERTY GROUPS
Households that MeanPoverty Groups Received the Subsidy Subsidy (karb.)
Non-poor 72% 1993
Poor 28% 1958
Source: Household Survey, 1996.
TABLE A3-14. UKRAINE: RENT AND UTILITY SUBSIDY BY POVERTY GROUPSBURDEN LIMIT EQUALS 15% OF HOUSEHOLD INCOMEa
Total Rent and UtilitySubsidy
Mean Rent and Utility Number ofPoverty Groups Subsidy, UAH Households UAH %
Above poverty line 1,784.5 342 610,289.5 77.6%
Below poverty line 1,268.6 139 176,331.1 22.4%
Total 1,635.4 481 786,620.6 100.0%
aSub-sample of 481 respondents, who gave an answer (either “yes” or “no”) to the question “Have you received ahousing subsidy?”Source: Household Survey, 1996.
TABLE A3-15. UKRAINE: RENT AND UTILITY SUBSIDY BY POVERTY GROUPS BURDEN LIMIT EQUALS 25% OF HOUSEHOLD INCOMEa
Total Rent and UtilitySubsidy
Mean Rent and Utility Number ofPoverty Groups Subsidy, UAH Households UAH %
Above poverty line 1,268.1 342 433,681.1 77.5%
Below poverty line 906.2 139 125,968.2 22.5%
Total 1,163.5 481 559,649.3 100.0%
aSub-sample of 481 respondents, who gave an answer (either “yes” or “no”) to the question “Have you received ahousing subsidy?”Source: Household Survey, 1996.

A n n e x 3
47
TABLE A3-16. UKRAINE: RENT AND UTILITY SUBSIDY BY POVERTY GROUPS BURDEN LIMIT EQUALS 35% OF HOUSEHOLD INCOME a
Total Rent and UtilitySubsidy
Mean Rent and Utility Number ofPoverty Groups Subsidy, UAH Households UAH %
Above poverty line 919.7 342 314,545.1 77.3%
Below poverty line 666.0 139 192,575.4 22.7%
Total 846.4 481 407,120.5 100.0%
aSub-sample of 481 respondents, who gave an answer (either “yes” or “no”) to the question “Have you received ahousing subsidy?”Source: Household Survey, 1996.
TABLE A3-17. UKRAINE: RENT AND UTILITY SUBSIDY BY POVERTY GROUPS BURDEN LIMIT EQUALS 45% OF HOUSEHOLD INCOMEa
Total Rent and UtilitySubsidy
Mean Rent and Utility Number ofPoverty Groups Subsidy, UAH Households UAH %
Above poverty line 668.3 342 228,561.9 76.1%
Below poverty line 516.6 139 71,804.6 23.9%
Total 624.5 481 300,366.5 100.0%
aSub-sample of 481 respondents, who gave an answer (either “yes” or “no”) to the question “Have you received ahousing subsidy?”Source: Household Survey, 1996.

Maintaining Utility Services for the Poor
48
TABLE A3-18. UKRAINE. HOUSEHOLD SURVEY 1996REGRESSION OF SHARE OF RENT AND UTILITY EXPENDITURE IN TOTAL HOUSEHOLD INCOMEON PER EQUIVALENT ADULT INCOME
Summary OutputRegression Statistics
Multiple R 0.239427
R Square 0.057325
Adjusted R 0.055032
Standard E 0.437102
Observation 413
ANOVAdf SS MS F Significance F
Regression 1 4.775211 4.775211 24.99351 8.53E-07
Residual 411 78.52487 0.191058
Total 412 83.30008
StandardCoefficient Error t Stat P-value Lower 95% Upper 95%
Intercept 0.271052 0.029108 9.312029 7.66E-19 0.213834 0.328271
X Variable -6.21E-06 1.24E-06 -4.999351 8.53E-07 -8.65E-06 -3.77E-06
Source: Bank staff calculations.

A n n e x 3
49
TABLE A3-19 UKRAINE. HOUSEHOLD SURVEY 1996REGRESSION OF SHARE OF RENT AND UTILITY EXPENDITURE IN TOTAL HOUSEHOLDEXPENDITURE ON PER EQUIVALENT ADULT EXPENDITURE
Summary OutputRegression Statistics
Multiple R 0.022307
R Square 0.000498
Adjusted R -0.001934
Standard E 0.450042
Observation 413
ANOVAdf SS MS F Significance F
Regression 1 0.041443 0.041443 0.204617 0.651258
Residual 411 83.24308 0.202538
Total 412 83.28452
StandardCoefficient Error t Stat P-value Lower 95% Upper 95%
Intercept 0.156656 0.042241 3.708632 0.000237 0.073621 0.239692
X Variable 1.38E-06 3.05E-06 0.452346 0.651258 -4.61E-06 7.37E-06
Source: Bank staff calculations.
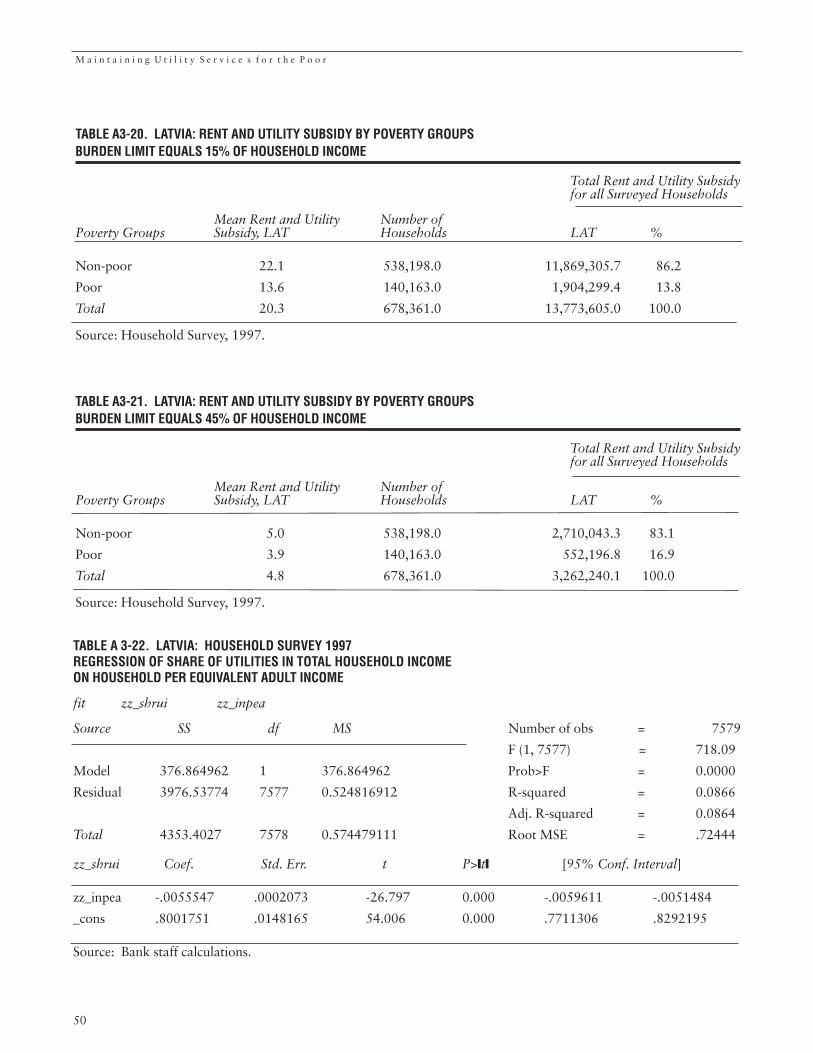
M a i n t a i n i n g U t i l i t y S e r v i c e s f o r t h e P o o r
50
TABLE A3-20. LATVIA: RENT AND UTILITY SUBSIDY BY POVERTY GROUPS BURDEN LIMIT EQUALS 15% OF HOUSEHOLD INCOME
Total Rent and Utility Subsidyfor all Surveyed Households
Mean Rent and Utility Number ofPoverty Groups Subsidy, LAT Households LAT %
Non-poor 22.1 538,198.0 11,869,305.7 86.2
Poor 13.6 140,163.0 1,904,299.4 13.8
Total 20.3 678,361.0 13,773,605.0 100.0
Source: Household Survey, 1997.
TABLE A3-21. LATVIA: RENT AND UTILITY SUBSIDY BY POVERTY GROUPSBURDEN LIMIT EQUALS 45% OF HOUSEHOLD INCOME
Total Rent and Utility Subsidyfor all Surveyed Households
Mean Rent and Utility Number ofPoverty Groups Subsidy, LAT Households LAT %
Non-poor 5.0 538,198.0 2,710,043.3 83.1
Poor 3.9 140,163.0 552,196.8 16.9
Total 4.8 678,361.0 3,262,240.1 100.0
Source: Household Survey, 1997.
TABLE A 3-22. LATVIA: HOUSEHOLD SURVEY 1997REGRESSION OF SHARE OF UTILITIES IN TOTAL HOUSEHOLD INCOME ON HOUSEHOLD PER EQUIVALENT ADULT INCOME
fit zz_shrui zz_inpea
Source SS df MS Number of obs = 7579
F (1, 7577) = 718.09
Model 376.864962 1 376.864962 Prob>F = 0.0000
Residual 3976.53774 7577 0.524816912 R-squared = 0.0866
Adj. R-squared = 0.0864
Total 4353.4027 7578 0.574479111 Root MSE = .72444
zz_shrui Coef. Std. Err. t P>❙t❙ [95% Conf. Interval]
zz_inpea -.0055547 .0002073 -26.797 0.000 -.0059611 -.0051484
_cons .8001751 .0148165 54.006 0.000 .7711306 .8292195
Source: Bank staff calculations.

A n n e x 3
51
TABLE A3-23. LATVIA: HOUSEHOLD SURVEY 1997REGRESSION OF SHARE OF UTILITIES IN TOTAL HOUSEHOLD EXPENDITUREON HOUSEHOLD PER EQUIVALENT ADULT EXPENDITURE
fit zz_shrue zz_expea
Source SS df MS Number of obs = 7704
F (1, 7702) = 1299.42
Model 28.3191217 1 28.3191217 Prob>F = 0.0000
Residual 167.855359 7702 .021793737 R-squared = 0.1444
Adj. R-squared = 0.1442
Total 196.174481 7703 .025467283 Root MSE = .14763
zz_shrue Coef. Std. Err. t P>❙t❙ [95% Conf. Interval]
zz_expea -.0015165 .0000421 -36.047 0.000 -.001599 -.001434
_cons .4168721 .003319 125.601 0.000 .4103659 .4233782
Source: Bank staff calculations.
TABLE A3-24. HUNGARY: REGRESSION OF HOUSEHOLD EXPENDITURE ON HOUSEHOLD INCOME
Source SS df MS Number of obs = 7560
F (1, 7558) = 7595.22
Model 5.8030e+14 1 5.8030e+14 Prob>F = 0.0000
Residual 5.7746e+14 7558 7.6403e+10 R-squared = 0.5012
Adj. R-squared = 0.5012
Total 1.1578e+15 7559 1.5316e+11 Root MSE = 2.8e+05
hh expend Coef. Std. Err. t P>❙t❙ [95% Conf. Interval]
hh income .7022839 .0080583 87.151 0.000 .6864875 .7180804
_cons 148110.1 6351.204 23.320 0.000 135660 160560.2
Source: Bank staff calculations.
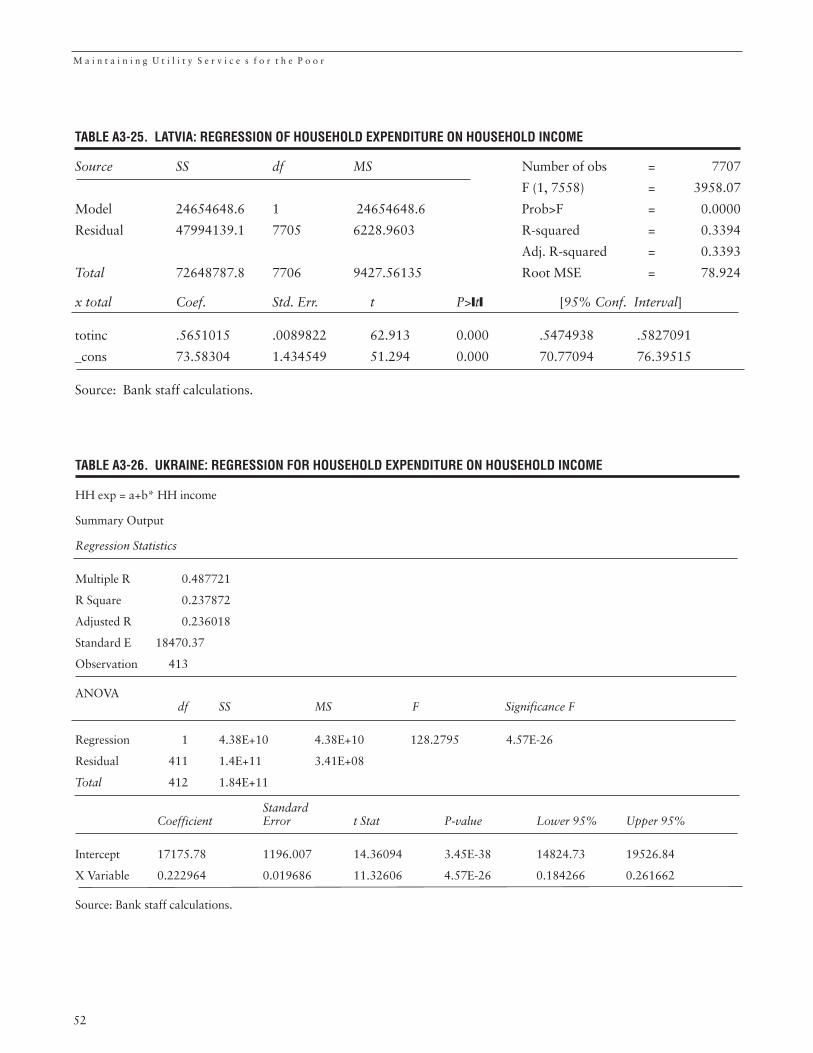
M a i n t a i n i n g U t i l i t y S e r v i c e s f o r t h e P o o r
52
TABLE A3-25. LATVIA: REGRESSION OF HOUSEHOLD EXPENDITURE ON HOUSEHOLD INCOME
Source SS df MS Number of obs = 7707
F (1, 7558) = 3958.07
Model 24654648.6 1 24654648.6 Prob>F = 0.0000
Residual 47994139.1 7705 6228.9603 R-squared = 0.3394
Adj. R-squared = 0.3393
Total 72648787.8 7706 9427.56135 Root MSE = 78.924
x total Coef. Std. Err. t P>❙t❙ [95% Conf. Interval]
totinc .5651015 .0089822 62.913 0.000 .5474938 .5827091
_cons 73.58304 1.434549 51.294 0.000 70.77094 76.39515
Source: Bank staff calculations.
TABLE A3-26. UKRAINE: REGRESSION FOR HOUSEHOLD EXPENDITURE ON HOUSEHOLD INCOME
HH exp = a+b* HH income
Summary Output
Regression Statistics
Multiple R 0.487721
R Square 0.237872
Adjusted R 0.236018
Standard E 18470.37
Observation 413
ANOVAdf SS MS F Significance F
Regression 1 4.38E+10 4.38E+10 128.2795 4.57E-26
Residual 411 1.4E+11 3.41E+08
Total 412 1.84E+11
StandardCoefficient Error t Stat P-value Lower 95% Upper 95%
Intercept 17175.78 1196.007 14.36094 3.45E-38 14824.73 19526.84
X Variable 0.222964 0.019686 11.32606 4.57E-26 0.184266 0.261662
Source: Bank staff calculations.

A n n e x 3
53
TABLE A-3-27. HUNGARY: HOUSEHOLD SURVEY 1997REGRESSION OF SHARE OF UTILITY EXPENDITURE IN TOTAL HOUSEHOLD INCOME ON HOUSEHOLD PER EQUIVALENT ADULT INCOME
fit zz_shuin zz_inpea
Source SS df MS Number of obs = 7560
F (1, 7558) = 10.47
Model 1.46038194 1 1.46038194 Prob>F = 0.0012
Residual 1054.35477 7558 .139501822 R-squared = 0.0014
Adj. R-squared = 0.0013
Total 1055.81516 7559 .139676565 Root MSE = .3735
zz_shuin Coef. Std. Err. t P>❙t❙ [95% Conf. Interva1]
zz_inpea -9.20e-08 2.84e-08 -3.236 0.001 -1.48e-07 -3.63e-08
_cons .0473854 .0105771 4.480 0.000 .0266513 .0681194
Source: Bank staff calculations.
TABLE A3-28. HUNGARY: HOUSEHOLD SURVEY 1997REGRESSION OF SHARE OF UTILITY EXPENDITURE IN TOTAL HOUSEHOLD EXPENDITURE ON HOUSEHOLD PER EQUIVALENT ADULT EXPENDITURE
fit zz_shuex zz_w
Source SS df MS Number of obs = 7560
F (1, 7558) = 101.43
Model .00644649 1 .00644649 Prob>F = 0.0000
Residual .480344924 7558 .000063555 R-squared = 0.0132
Adj. R-squared = 0.0131
Total .486791414 7559 .000064399 Root MSE = .00797
zz_shuex Coef. Std. Err. t P>❙t❙ [95% Conf. Interval]
zz_w -5.88e-08 5.84e-09 -10.071 0.000 -7.02e-08 -4.73e-08
_cons .0127693 .0001783 71.624 0.000 .0124198 .0131188
Source: Bank staff calculations.

M a i n t a i n i n g U t i l i t y S e r v i c e s f o r t h e P o o r
54
TABLE A3-29. KYRGYZ REPUBLIC: BURDEN LIMIT SCENARIOSBURDEN LIMIT EQUALS 23% OF HOUSEHOLD INCOME. FOR UTILITY BILL CALCULATION THE FORMULA THAT IS UTILIZED BY HOUSING ALLOWANCE PROGRAM IN BISHKEK WAS USED.a
Total Rent and Utility Subsidyfor all Surveyed Households
Mean Rent and Utility Number ofPoverty Groups Subsidy, som Households som %
Non-poor 764.0 296,595 226,605,508.5 81.3
Poor 1162.9 44,744 52,031,941.2 18.7
Total 816.3 341,339 278,637,449.7 100.0
a Subsidy = utility bill - (burden limit rate x total household income).Utility bill in this case is calculated using Housing Allowance Program formula and consists of norm-based expendi-tures on district heat, gas, cold water, hot water, maintenance, and refuse.
TABLE A3-30. KYRGYZ REPUBLIC: BURDEN LIMIT SCENARIOSBURDEN LIMIT EQUALS 23% OF HOUSEHOLD INCOME. FOR UTILITY BILL CALCULATION THE FORMULA THAT IS UTILIZEDBY HOUSING ALLOWANCE PROGRAM IN BISHKEK WAS USED WITH MODIFICATIONSa
Total Rent and Utility Subsidyfor all Surveyed Households
Mean Rent and Utility Number ofPoverty Groups Subsidy, som Households som %
Non-poor 547.8 296,595 162,488,276.4 82.2
Poor 787.4 44,744 35,232,156.7 17.8
Total 579.2 341,339 197,720,433.1 100.0
Household Energy Survey, 1999.a Subsidy = utility bill - (burden limit rate x total household income).Utility bill in this case consists of the same list of expenditures as used by Housing Allowance Program for subsidyeligibility formula, but calculated in a different way. The difference is that expenses on district heat and gas are notbased on norms. These are actual expenses reported by the household for the survey. Expenditures on cold water,hot water, maintenance, and refuse are calculated using the same norm-based formula that is utilized by HousingAllowance Program.

55
TABLE A3-31. KYRGYZ REPUBLIC: BURDEN LIMIT SCENARIOSBURDEN LIMIT EQUALS 23% OF HOUSEHOLD INCOME. FOR UTILITY BILL CALCULATION THE FORMULA THAT IS UTILIZEDBY HOUSING ALLOWANCE PROGRAM IN BISHKEK WAS USED WITH MODIFICATIONS. a
Total Rent and Utility Subsidyfor all Surveyed Households
Mean Rent and Utility Number ofPoverty Groups Subsidy, som Households som %
Non-poor 767.9 296,595 227,760,878.3 83.3
Poor 1017.9 44,744 45,543,644.7 16.7
Total 800.7 341,339 273,304,523.1 100.0
Household Energy Survey, 1999.a Subsidy = utility bill - (burden limit rate x total household income).The formula used for utility bill calculation is similar to Housing Allowance Program's subsidy eligibility formula.However, there are two differences: electricity expenditure is added to the list and expenses on electricity, districtheat, and gas are not based on norms. These are actual expenses reported by the household for the survey.Expenditures on cold water, hot water, maintenance, and refuse are calculated using the same norm-based formulathat is utilized by Housing Allowance Program.
TABLE A3-32. KYRGYZ REPUBLIC: BURDEN LIMIT SCENARIOS BURDEN LIMIT EQUALS 45% OF HOUSEHOLD INCOME. FOR UTILITY BILL CALCULATION THE FORMULA THAT IS UTILIZED BY HOUSING ALLOWANCE PROGRAM IN BISHKEK WAS USED. a
Total Rent and Utility Subsidyfor all Surveyed Households
Mean Rent and Utility Number ofPoverty Groups Subsidy, som Households som %
Non-poor 329.6 296,595 97,765,307.3 78.1
Poor 614.1 44,744 27,477,276.2 21.9
Total 366.9 341,339 125,242,583.5 100.0
Household Energy Survey, 1999.a Subsidy = utility bill – (burden limit rate X total household income).Utility bill in this case is calculated using Housing Allowance Program formula and consists of norm-based expendi-tures on district heat, gas, cold water, hot water, maintenance, and refuse.
A n n e x 3

M a i n t a i n i n g U t i l i t y S e r v i c e s f o r t h e P o o r
TABLE A3-33. UKRAINE: COVERAGE OF POPULATION BY RENT AND UTILITY SUBSIDYUNDER DIFFERENT BURDEN LIMIT SCENARIOS, % OF HOUSEHOLDS
Burden Limit
Poverty Groups 15% 25% 35% 45%
Above poverty line 43% 41% 36% 31%
Below poverty line 58% 55% 47% 42%
Total 47% 45% 40% 34%
Source: Household Survey, 1996.
56
TABLE A3-34. LATVIA: ELIGIBILITY FOR RENT AND UTILITY SUBSIDIES BY POVERTY GROUPS
Coverage ofTotal Number of Number of Households Households by
Poverty Groups Households Eligible for Subsidies Subsidies
Non-poor 538,198.0 202,248.0 37.6
Poor 140,163.0 80,427.0 57.4
Total 678,361.0 282,675.0 41.7
Source: Household Survey, 1997.
TABLE A3-35. LATVIA: RENT AND UTILITY SUBSIDIES BY POVERTY GROUPS
Total Rent and Utility Subsidyfor all Surveyed Households
Mean Household Mean Rent and Utility Number ofPoverty Groups Income Subsidy Households LATS %
Non-poor 114.3 14.2 538,198.0 7,653,374.7 66.7
Poor 80.0 27.2 140,163.0 3,818,546.1 33.3
Total 107.9 16.9 678.361.0 11,471,925.7 100.0
Source: Household Survey, 1997.

57
ReferencesEnergy Sector Management Programme Report (ESMAP)
Report No. 153/93; Poland: Energy SectorRestructuring Program
Freund, Caroline and Wallich, Christine, 1995, RaisingHousehold Energy Prices in Poland: Who Gains? WhoLoses?, World Bank Policy Research Working PaperNo. 1495
Milanovic, Branko, 1998, Income, Inequality and Povertyduring the Transition from Planned to MarketEconomy, The World Bank
PADCO, Inc., 1996, Technical Assistance for Local Level,Communal Services Pricing in Russia
The Urban Institute, 1990, Toward a Market-OrientedHousing Sector in Eastern Europe
The Urban Institute, 1996, Economic Restructuring ofthe Former Soviet Bloc: the Case of Housing
World Bank Report No. 7776-POL, 1989, Poland:Subsidies and Income Distribution
World Bank Report No. P-5294-POL, 1990, Poland:Structural Adjustment Loan
World Bank Report No. 8224-POL, 1991, Poland: EnergyMarket Development
World Bank Report No. P-5418-POL, 1991, Poland: HeatSupply Restructuring and Conservation Project
World Bank Report No. 10305-POL, 1992, Poland:Economic Transformation at a Crossroads
World Bank, 1992, Russian Economic Reform: Crossingthe Threshold of Structural Change
World Bank Report No. 13039-POL, 1994, Poland:Growth with Equity—Policies for the 1990s
World Bank Report No. 14110, 1995, Poverty in Russia:An Assessment
World Bank Report No. 17483-RU, 1998, RussianFederation: Housing and Utility Services: PolicyPriorities for the Next Stage of Reforms
World Bank, 1999 (mimeo), Russia: Affordability of CostRecovery—Housing and Communal Services
World Bank, 2000, Making Transition Work for Everyone:Poverty and Inequality in Europe and Central Asia(forthcoming)