maintaining its brand momentum… - icici...
TRANSCRIPT

August 8, 2016
ICICI Securities Ltd | Retail Equity Research
Result Update
Maintaining its brand momentum… • Arvind’s Q1FY17 consolidated revenue grew 18% YoY (down 9%
QoQ) to | 2104 crore (I-direct estimate: | 2100 crore). Due to implementation of IND-AS, it reclassified its segments, following which fabric retail (The Arvind store) would now be a part of standalone business. However, earnings from brands like Tommy Hilfiger, premium wholesale garments (Calvin Kline), etc, where Arvind does not have controlling interest, would now directly form part of PAT
• Revenue from brand & retail grew 26% YoY to | 553 crore. Revenues from ‘Power’ brands (excluding Tommy Hilfiger) grew 27% YoY to | 300 crore. EBITDA margins for the same were at 10% compared to 9.6% in Q1FY16. Following the effect of store closures, “Unlimited” revenues de-grew by 7% YoY
• Textile revenues for the quarter grew 14% YoY to | 1425 crore. The growth in the textile business cans mainly be attributed to higher growth in garments and woven, which grew 28% and 17%, respectively. The current quarter garmenting revenues include volumes from newly commenced capacities
• EBITDA for the quarter grew by 14% YoY (down 21% QoQ) to | 238 crore (I-direct estimate: | 263 crore). However, margins declined 40 bps YoY (down 170 bps QoQ) to 11.3% (I-direct estimate: 12.5%). Employee expenses were elevated due to costs related to new garmenting facility planned at Ethiopia
• Decline in interest expenses, coupled with forex gain of | 3.5 crore resulted PAT growth of 33.5% YoY (down 33.5% QoQ) to | 73.4 crore (I-direct estimate | 79 crore)
Higher discretionary spending; new stores to take charge In FY16, Arvind added 119 stores under its brands business whereas 20 stores were introduced for specialty retail. Restructuring of Megamart was through in FY16 and was re-christened Unlimited. Under “Unlimited” 48 stores were reduced during the year. Following this the distribution strength of ALBL businesses stands at 953 stores. With the current brand portfolio, the company is targeting its brands & retail business to achieve a CAGR of 25% by FY20-21. This would be achieved by rapidly expanding the distribution footprint covering 300 cities with over 3 million square feet retail space. Following the perfect portfolio of bridge to luxury brands like GAP, Aeropostale and The Children Place (TCP), we believe the company would be able achieve this growth rate. Better-than-expected monsoon and proceeds from Seventh Pay commission would trigger higher discretionary spending and better earnings for Arvind. Arvind Internet, to tap opportunity in world of “e-commerce” Over the past year, Arvind has been investing prudently to upgrade customer experience through Omni channel and leverage its global brands on a digital platform. With recently launched ‘nnnow.com’, Arvind attempts to move away from the discount driven e-commerce market to a brand led shopping. Online orders would be fulfilled by nearby available stores, enabling Arvind to save additional logistics costs. Debt reduction prudent step; remains preferred pick in textile retail space For FY17, Arvind has embarked upon its debt reduction plans by monetising non-core assets. The company has sold shares held as investments in the current quarter and would continue to dilute non-core assets. The proceeds would be used to reduce debt and partially fund its garmenting expansion plans. Subsequently, we continue to maintain BUY recommendation with a target price of | 370.
Arvind Ltd (ARVMIL) | 310 Rating matrix Rating : BuyTarget : | 370Target Period : 12 monthsPotential Upside : 19% What’s changed?
Target UnchangedEPS FY17E Changed from | 15.9 to | 15.2EPS FY18E Changed from | 19.7 to | 19.4Rating Unchanged
Quarterly performance | Crore Q1FY17 Q1FY16 YoY (%) Q4FY16 QoQ (%)EBITDA 238.0 209.0 13.9 301.0 (20.9)EBITDA (%) 11.3 11.7 -38 bps 13.0 -166 bpsPAT 73.4 55.0 33.5 110.3 (33.5)
Key financials | Crore FY15 FY16 FY17E FY18E
Net Sales 7,851 8,450 9,368 10,213 EBITDA 1,013 1,065 1,222 1,355 Net Profit 341.1 362.7 392.9 499.4
EPS (|) 13.2 14.1 15.2 19.4 Valuation summary
FY15 FY16 FY17E FY18E
P/E (x) 21.2 22.1 20.4 16.0 Target P/E (x) 19.6 26.3 24.3 19.1
EV/EBITDA (x) 10.4 10.8 9.5 8.6 P / BV (x) 2.7 2.5 2.2 0.9 RONW (%) 12.5 12.5 11.8 13.3 ROCE (%) 13.1 12.5 13.4 14.0 Stock data Particular AmountMarket Capitalization (| Crore) 8,005.4 Total Debt (FY16) (| Crore) 3,540.2 Cash (FY16) (| Crore) 65.1 EV (| Crore) 11,480.5 52 week H/L 366 / 236 Equity Capital (| Crore) 258.2 Face Value (|) 10.0
Peer Comparison
1M 3M 6M 12M
Kewal Kir.Cloth. 1.95 4.52 (7.59) (16.69)
Arvind Ltd (10.16) 9.82 5.43 (3.61)
Raymond (0.98) (0.33) 15.23 (3.52)K P R Mill Ltd (9.44) (7.95) 51.25 35.44
Research Analyst
Bharat Chhoda [email protected]
Ankit Panchmatia [email protected]

ICICI Securities Ltd | Retail Equity Research Page 2
Variance analysis | crore Q1FY17 Q1FY17E Q1FY16 YoY (%) Q4FY16 QoQ (%) CommentsRevenue 2,104.1 2,100.9 1,786.8 17.8 2,319.6 -9.3 Growth remained supportive of brand & retail (+26% YoY) and textile business
(+13.3%)
RM Cost 901.1 903.4 764.1 17.9 1,013.7 -11.1
Power & Fuel 123.7 126.1 123.1 0.5 118.2 4.7
Employee Benefit Expenses 265.6 235.6 217.4 22.2 249.6 6.4 Expansion of Ethopia garment facility resulted higher expenses
Other Expenditure 575.7 572.5 473.3 21.6 637.1 -9.6
Total Expense 1,866.1 1,837.6 1,577.8 18.3 2,018.6 -7.6
EBITDA 238.0 263.4 209.0 13.9 301.0 -20.9
EBITDA Margin (%) 11.3 12.5 11.7 -38 bps 13.0 -166 bps Increase in operating expenses and employee expenses led the decline inmargin
Depreciation 69.1 69.1 58.6 17.8 66.4 4.0
Interest 89.1 103.5 95.9 -7.0 94.5 -5.6 Decline in debt resulted in reduction interest expenses
Other Income 19.6 22.3 27.0 -27.4 20.8 -5.8
PBT 99.4 113.1 81.5 22.0 160.9 -38.2
Total Tax 31.7 33.9 23.3 36.0 45.4 -30.2
Reported PAT (Incld Minority Int) 73.4 79.2 55.0 33.5 110.3 -33.5
Key Metrics Q1FY17 Q1FY16 YoY (%) Q4FY16 QoQ (%)
Textiles 1,425.0 1,258.0 13.3 1,360.2 4.8 Growth was mainly due to 27% growth in the garments business and 17% growth in wovens
Brand & Retail 552.7 438.3 26.1 762.8 -27.5 With new IND-AS, Tommy Hilfilger revenues would now not form a part of Brands & retail. Adjusting for the same, power brands grew by 27% YoY; however overall Brand & Retail grew by 26%
Real Estate & Others - - NA 3.48 NA Due to de-merger of real estate business
Source: Company, ICICIdirect.com Research Change in estimates
(| Crore) Old New % Change Old New % Change CommentsRevenue 8,450.4 9,406.1 9,367.6 -0.4 10,210.7 10,212.6 0.0 Continue to maintain the growth estimates
EBITDA 1,065.4 1,231.4 1,222.0 -0.8 1,354.7 1,355.2 0.0
EBITDA Margin (%) 12.6 13.1 13.0 -5 bps 13.3 13.3 0 bps Continue to remain at the higher band of the guidance
PAT 362.7 421.4 392.9 -6.8 519.4 499.4 -3.9
EPS (|) 14.1 16.3 15.2 -6.8 20.1 19.4 -3.9 Estimates adjusted accordingly
FY17E
FY16
FY18E
Source: Company, ICICIdirect.com Research Assumptions
EV/EBITDA EV EBITDA Multiple EV EBITDA MultipleStandalone 3,586 894 4.0 4,172 1,043 4.0
Market Cap/Sales Sales Market Cap MCap/Sales Sales Market Cap MCap/SalesBrands & Retail 3,637 8,364 2.3 3,370 7,784 2.3
Current Earlier
Current (FY18E) Earlier (FY17E)
Source: Company, ICICIdirect.com Research

ICICI Securities Ltd | Retail Equity Research Page 3
Company Analysis India to keep up promising growth for textile Industry The Indian textile and apparel industry is at ~13% of the global industry, which is estimated at ~$110 billion. India is the world’s second largest textile and garment manufacturer world's sixth largest apparel market by value and substantially contributes to the country’s GDP, employment generation and merchandise exports. According to Ficci, the industry is expected to grow at a CAGR of 8.7% to $223 billion by 2021. Currently of the total industry, ~$70 billion is domestic consumption and remaining $40 billion is exports. However, majority of the growth is expected from exports, which is expected at $82 billion. The domestic market is expected at $141 billion by 2021.
Advantage India – Favourable scenario to attain 2021 estimates Over the years, the Indian textile industry has continued to maintain its strategic importance in the country’s development. Apart from contributing ~4% of total GDP, the industry accounts for 14% of the country’s industrial production and constitutes 13% of export earnings. India is considered to be the second largest producer of textile and garments which is on the back of its manufacturing capacities currently quoted at 24% of the world’s spindle capacity and 8% of the global rotor capacity. India has the highest loom capacity (including handlooms) with 63% of the world’s market share. Apart from the manufacturing capabilities, India has a head-on advantage in terms of raw material availability. The country’s geographic capabilities are well suited for cotton cultivation, which makes it the second largest producer of cotton and largest in terms of area under cultivation. Moreover, India’s favourable demographic capabilities, which are more skewed towards younger population, supports the man-power intensive industry. Further the higher number of younger population would commit strong domestic demand. Textile industry is the second largest employer after agriculture. The textile sector is further boosted by favourable government policies which would harness entrepreneurial capabilities in the country. We believe India would leverage these capabilities to enhance its share in the global textile trade and enable it to cope up with the growing domestic demand. India’s per capita textile consumption is only 7.5 kg, which is even lower than the world average of about 11 kg and is much lower than the average of 31 kg in North America, 22 kg in Western Europe and 17 kg in China. Thus, Indian textile consumption is bound to grow rapidly with increasing per capita income, organised retail, young population, etc. Additionally, rupee depreciation makes Indian products more competitive in the global markets, which adds extra spice to the sector.
Exhibit 1: Indian Favourable Population
Source: Indian Census Bureau, ICICIdirect.com Research Exhibit 2: Target 2021 – Indian textile on a cusp of high growth phase
Source: Company, ICICIdirect.com Research

ICICI Securities Ltd | Retail Equity Research Page 4
Indian textile market to be dominated by apparels The large population base of China and India has led to their inclusion among top apparel markets, even ahead of several developed economies. Though India is the sixth largest market by value, very often comparisons are drawn between the markets of China and India. However, it is interesting to note that India’s per capita spend on apparel is only a third of China’s $109 and a mere 3% of Australia’s per capita spend. Indian per capita spend on apparel is just $36, which is significantly below the global average of $153. According to India Brand Equity Foundation (IBEF), the current retail market is worth ~$525 billion and is expected to grow at a CAGR of 13% by 2020. Food & groceries (F&G) contribute the largest with 69% of the total retail market. Apparel is way behind with 8% of the retail pie. On the back of this, the current Indian apparel market is estimated at $42 billion (| 250000 crore). The Indian apparel market is expected to grow at a CAGR of 10% from the current $42 billion to $115 billion over CY14-25. The organised apparel market is expected to grow at a comparatively faster CAGR of 17% over the period compared to the unorganised market, which is expected to grow at a CAGR of 8%. Branded apparel is expected to outpace industry growth and grow at a CAGR of 22% in CY14-25. This would result in the share of branded garments of the organised apparel industry going up from 27% in CY12 to 50% in CY25.
Exhibit 3: Apparel market expected to touch US$115 billion…
42.054.4
79.4
115.8
0
20
40
60
80
100
120
140
2014 2017 2021 2025
US$
Bn
Indian Apparel market (US$ Bn)
Source: Images yearbook 2014, ICICIdirect.com Research
Arvind - One stop shop for apparel requirements
Arvind possesses key ingredients that would enable it to capture the high trajectory growth opportunity in the apparel segment. Having diversity in offerings across menswear, women’s wear and kidswear; positions the company as a one stop to shop for all the apparel requirements of a family. The company is equipped with probably the best portfolio of brands (both owned and licensed) in the Indian apparel industry coupled with a nationwide reach that would enable it to reach a large quantum of customers across various price points. The company has products with a price range starting from as low as | 400 to as high as | 15000, which provides a variety of choices and entry points for each and every customer.
Exhibit 4: Apparel market growth outpacing unorganised segment
8 11.2
20.7
44.7
32.838.4
51.6
71.1
0
10
20
30
40
50
60
70
80
2014 2016 2020 2025
US$
Bn
Organised apparel market Unorganised Apparel Market
Source: Images yearbook 2014, ICICIdirect.com Research
ICICI Securities Ltd | Retail Equity Research Page 5
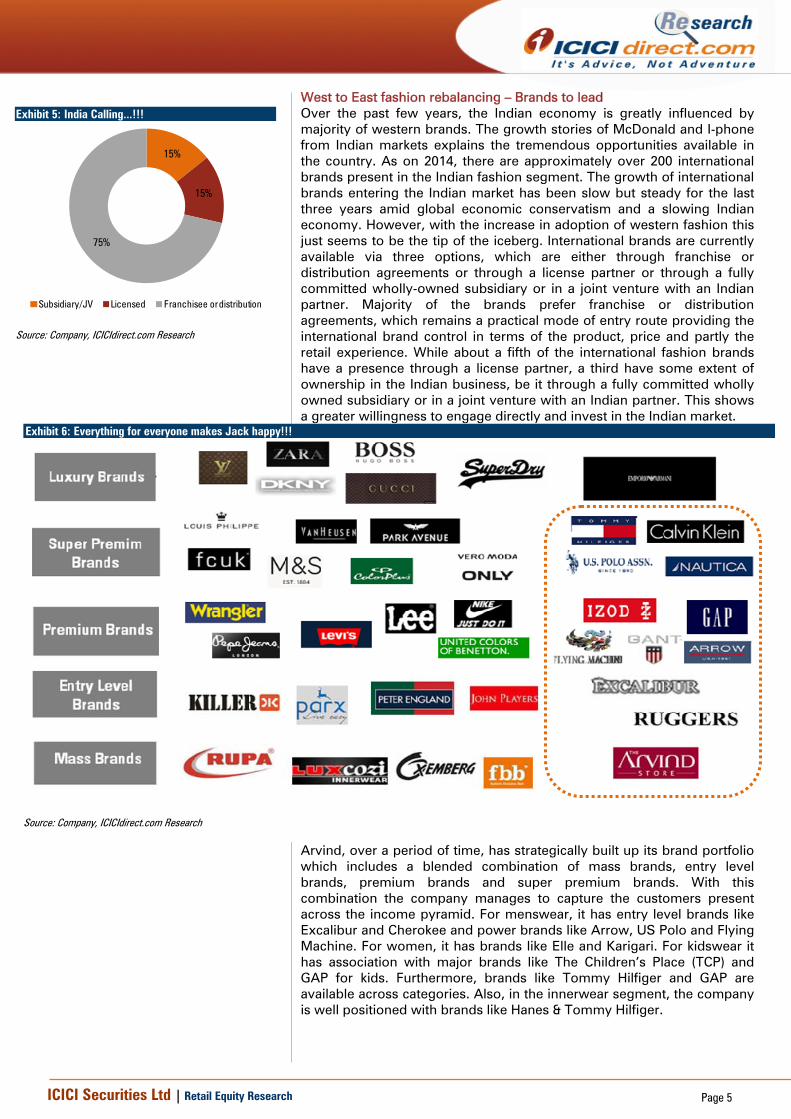
West to East fashion rebalancing – Brands to lead Over the past few years, the Indian economy is greatly influenced by majority of western brands. The growth stories of McDonald and I-phone from Indian markets explains the tremendous opportunities available in the country. As on 2014, there are approximately over 200 international brands present in the Indian fashion segment. The growth of international brands entering the Indian market has been slow but steady for the last three years amid global economic conservatism and a slowing Indian economy. However, with the increase in adoption of western fashion this just seems to be the tip of the iceberg. International brands are currently available via three options, which are either through franchise or distribution agreements or through a license partner or through a fully committed wholly-owned subsidiary or in a joint venture with an Indian partner. Majority of the brands prefer franchise or distribution agreements, which remains a practical mode of entry route providing the international brand control in terms of the product, price and partly the retail experience. While about a fifth of the international fashion brands have a presence through a license partner, a third have some extent of ownership in the Indian business, be it through a fully committed wholly owned subsidiary or in a joint venture with an Indian partner. This shows a greater willingness to engage directly and invest in the Indian market.
Exhibit 6: Everything for everyone makes Jack happy!!!
Source: Company, ICICIdirect.com Research
Arvind, over a period of time, has strategically built up its brand portfolio which includes a blended combination of mass brands, entry level brands, premium brands and super premium brands. With this combination the company manages to capture the customers present across the income pyramid. For menswear, it has entry level brands like Excalibur and Cherokee and power brands like Arrow, US Polo and Flying Machine. For women, it has brands like Elle and Karigari. For kidswear it has association with major brands like The Children’s Place (TCP) and GAP for kids. Furthermore, brands like Tommy Hilfiger and GAP are available across categories. Also, in the innerwear segment, the company is well positioned with brands like Hanes & Tommy Hilfiger.
Exhibit 5: India Calling...!!!
15%
15%
75%
Subsidiary/JV Licensed Franchisee or distribution
Source: Company, ICICIdirect.com Research

ICICI Securities Ltd | Retail Equity Research Page 6
Q1FY17, garmenting added to consolidated revenue growth For Q1FY17, as the textile business gear up for the new garmenting facility at Ethiopia, revenues from garments increased 26% YoY to | 552 crore. Also, due to incorporation of IND-AS, the company has integrated the revenues from fabric sale in the Arvind store with the textile business. Following which, the contribution of textiles in the consolidated business was now at 68% compared to 64% in the earlier quarters. Arvind plans to leverage its manufacturing capabilities by aggressive forward integration in the brand & retail space. It has been focusing on international bridge to premium brands in India. Currently, its power brands comprise US Polo, Tommy Hilfiger, Flying Machine & Arrow comprising 58% revenues of B&R segment. Overall, the B&R segment registered stellar growth of CAGR 45% in FY12-16. Revenues of the B&R segment have grown from 22% in FY11 to 32% in FY16, which is further expected to grow up to 36% of the total consolidated revenues by FY18E. Exhibit 7: Segment wise revenue
27% 27% 28% 26% 33% 32% 29% 30% 28% 34% 34% 33%32% 26% 35% 36%
4% 4% 3% 4% 4% 5% 6% 7% 6% 5% 5% 6% 8%4% 6% 4% 4%
74% 70% 70% 68% 70%63% 62% 64% 65% 67%
62% 60% 59%64% 68%
62% 60%
22%
0%10%20%30%40%50%60%70%80%90%
100%
FY11
FY12
FY13
FY14
Q1FY
15
Q2FY
15
Q3FY
15
Q4FY
15
FY15
Q1FY
16
Q2FY
16
Q3FY
16
Q4FY
16
FY16
Q1FY
17
FY17
E
FY18
E
Textiles B&R Others
Source: Company, ICICIdirect.com Research
Exhibit 8: New reporting segment-wise
Source: Company, ICICIdirect.com Research

ICICI Securities Ltd | Retail Equity Research Page 7
Accelerating pan-India presence; scale up in revenues key…
Arvind has a strong distribution network of ~1000 stores across 200 cities with a total retail space of ~1.60 million square feet (sq ft) in India, which enables it to reach a large number of consumers and a huge potential market to sell its products. The company has been aggressive in retail space expansion in its brands business. Over FY12-16, brand retail space has grown at a CAGR of 24% to 0.9 million sq ft. The company is now planning category extension of its existing brands and rapid expansion of its distribution footprint. In the next four or five years, Arvind is planning to cover almost 300 cities with over 3 million square feet retail space.
Arvind has big plans on speciality retail formats, which enables it to offer multiple products. Among its extensive reach, ~35% consists of exclusive brand outlets (EBOs) in the name of respective brands. Further, the company also distributes through key channel partners like Lifestyle, Shoppers Stop, etc, forming another 30-35% of the distribution channel. Moreover, multi-brand outlets (MBOs) form 25-27% and e-commerce ~5% of the distribution channel.
“Unlimited” to take in charge of “Megamart”; LTL of 16% impressive To counter the decline in margins, the management has repositioned Megamart from a discount store to value retail with a higher proportion of private labels. Megamart was rechristened “Unlimited”, which would not take charge of Arvind’s value retail business that has been struggling with sluggish revenue growth and low margins over the last couple of years. The strategy is to attract customers by offering discounts on reputed brands like Arrow, Park Avenue, Van Heusen and try and convert them into buying its own private labels. To improve its margins, Unlimited is looking to increase the share of private labels from 40% to 60%. Also, several small stores have been closed while some large format stores have been opened resulting in a reduction in the number of “Unlimited” stores from 216 in FY12 to 92 stores in FY16. The large format “Unlimited” stores have been positioned as a size of 10000 sq ft per store. Arvind currently has ~20% area under the power Unlimited format and is planning to scale up the area under power Unlimited format to 50% over the next two years. The shift in favour of large format stores has led the area per store for Unlimited to increase from 3100 sq ft in FY12 to 6866 sq ft in Q1FY17. The repositioning of Unlimited as value retail is expected to boost revenue growth and enhance margins, going ahead. Ramping up of its garmenting capacity - Ethiopia to be a keenly watched Arvind is planning to increase its garment capacity to 40 million pieces over the next three years from 24 million pieces as on FY16. Revenues from garments are likely to be higher next year as the new plant at Ethiopia is expected to be stabilised. On the back of this, the company plans to increase its current contribution from garments from 17% in FY16 to 20% by FY18. The increase in garmenting capacity would mainly be on account of replication of the Chinese dormitory model. The company provides residential accommodation and other livelihood facilities to migrant workers. It implemented this model at two of its manufacturing units in Chhatral and Dehgam in Gujarat.
Exhibit 9: Pan-India presence for brands & retail
Total Stores
Sq Ft (mn)
Total Stores
Sq Ft (mn)
Total Stores
Sq Ft (mn)
Total Stores
Sq Ft (mn)
Total Stores
Sq Ft (mn)
Total Stores
Sq Ft (mn)
Total Stores
Sq Ft (mn)
Brands 611 0.61 671 0.59 816 0.74 858 0.82 903 0.87 857 0.63 898 0.89MM 166 0.75 140 0.83 126 0.78 125 0.78 95 0.73 92 0.78 91 0.69Total 777 1.36 811 1.42 942 1.52 983 1.60 998 1.60 949 1.41 989 1.58Key A/c's
Q1FY17
11631025
Q1 2015-16
810
2013-14 Q4FY16
1566
Q2 2015-16
1025
2014-15
692 989
Q3 2015-16
Source: Company, ICICIdirect.com Research

ICICI Securities Ltd | Retail Equity Research Page 8
Valuation Standalone business valued at 4x EV/EBITDA Given the company’s expertise in manufacturing garments, coupled with its positioning as the most preferred franchisee/distribution partner in India, it is poised to benefit from an increase in apparel demand. Arvind’s standalone revenue, which includes textiles and garments, grew at a CAGR of 17% in FY11-16. Majority of this growth was driven by growth in its fabric division, which grew at 16% CAGR in FY11-16. The increase in fabrics revenues was mainly supported by 16% CAGR in woven, followed by denim revenues, which grew at a modest CAGR of 4%. Apart from fabrics, the company manufactures garments for brands like Tommy Hilfiger, Calvin Klein, H&M, M&S, FCUK and Jack & Jones. Revenues from the same grew at a CAGR of 17% in 2012-16. Over the past few years, the company’s investments in augmenting its garmenting capacities were insignificant. The company now intends to double its garmenting capacity and has targeted 40 million capacity by 2020. Further, currently only 7% of the fabrics produced are used for production of garments that the company intends to increase to 25%. With the enhancement of capacities, standalone revenues would be mainly driven by garments. Garment revenues have increased at a CAGR of 17% in 2012-16, which is further expected to grow at a CAGR of 30% over two years. Majority of the revenues would be driven by volumes on the back of capacity enhancement with realisation at current levels. We believe the standalone business has different dynamics and has very different working capital cycle. Thus, we value the standalone business on the basis of EV/EBITDA in comparison to the industry. Exhibit 10: Peer comparison for standalone business….
Figures (Rs crs)Company Price Sales EBIDTA OPM PAT PAT % FY17E FY18E
Nandan Denim 133.0 1,156.7 191.2 16.5 63.3 5.5 4.4 3.9 KPR Mills 1,090.0 2,500.4 469.6 18.8 210.1 8.4 8.1 8.6 Vardhman Textiles 1,075.0 6,723.3 1,401.8 20.8 578.6 8.6 5.9 5.5
Average EV/EBIDTA 6.1 6.0
FY16 EV/EBIDTA
Source: ICICIdirect.com Research
Though the peer are quoting at a multiple of 6x FY18 EV/EBITDA, due to Arvind’s less focus on the same, warrant our lower multiple of 4x EV/EBITDA, arriving at an SOTP value of the standalone business at | 46 per share. Exhibit 11: Valuing standalone business….
SOTP
Arvind Standalone
Target EV/EBITDA (x) 4.0
EBITDA (FY18E) 894.3
Net Debt 2,399.5
Enterprise Value (| Crore) 3,586.0
Target Market cap Core business (| crore) 1,186.4
Value/Share 46
Source: ICICIdirect.com Research

ICICI Securities Ltd | Retail Equity Research Page 9
Brands & retail business valued at 2.3x market capitalization to sales The theme around brands and positioning apparel as a ‘bridge to luxury’ segment has seen only a handful of players like Madura and Page getting it right and being successful. The growth from branded apparel has been lumpy with close to 200 international brands currently present in the India fashion segment. Currently, Arvind has four power brands with each having a turnover of ~| 2000 crore. The company estimates that each of these brands would be scaled up to | 5000 crore. Over a decade, the company believes it has added sufficient number of brands and now wants to focus on its monetisation. In addition, the garmenting capabilities of the company position it as the most preferred partner in India. Majority of the brands in India, though not profitable, are targeting revenue growth. However, profitability will creep in once significant scale is achieved. To quote the management, “When a brand attains a turnover of | 100-150 crore it gets out of negative EBITDA. By the time it touches | 250 crore, RoCE becomes attractive. By the time it gets to | 350 crore, a brand makes tonnes of money”. With the currently successful launch of GAP store and target audience for Aeropostale, it is well poised to create a number of powerbrands by 2020. We believe that one of the brands would be converted into a powerbrand in 2018. On account of this, powerbrand revenues are expected to grow at 33% CAGR while due to the shift the growth of other brands would be lower at a CAGR of 11% in 2016-18. We believe this business would be valued on the basis of sales that the company is able to achieve and following this the estimated market capitalisation it would demand. We value its brands & retail business using the market capitalisation to sales method. Thus, we value the company at an average multiple of 2.3x and arrive at a value of | 324 per share.
Exhibit 12: Peer comparison brands & retail business….
Figures (Rs crs)
Company
Market Capitalization FY14 FY15 FY16 FY17E FY18E FY17E FY18E
Kewal Kiran 2,287.8 363.9 405.1 453.1 564.5 616.0 4.1 3.7 Monte Carlo 971.3 501.7 581.1 620.0 686.1 845.4 1.4 1.1 Raymond 2,799.8 4,548.0 5,332.6 5,594.7 5,963.1 6,533.2 0.5 0.4 Trent 6,127.6 2,984.4 2,496.1 2,469.3 3,272.3 4,205.9 1.9 1.5 Average P/E 2.0 1.8
Sales Market Cap/Sales
Source: ICICIdirect.com Research
Exhibit 13: Valuing brands & retail business….
SOTP
Arvind Lifestyle & Brands
Target Market Cap/Sales (x) 2.3
Sales (FY18E) 3,638
Market Capitalization (FY18E) 8,366.6
No. of Shares 25.8
Price target (|) 324.3
Source: ICICIdirect.com Research
Consolidated valuation Applying the EV/EBITDA multiple of 4x to its standalone business and market capitalisation to sales multiple of 2.3x to its brands & retail business, we arrive at a consolidated target price of | 370/share. We have a BUY recommendation on the stock.

ICICI Securities Ltd | Retail Equity Research Page 10
Company snapshot
0
50
100
150
200
250
300
350
400
Aug-16May-16Mar-16Dec-15Oct-15Jul-15May-15Mar-15Dec-14
(|)
72.0
74.0
76.0
78.0
80.0
82.0
84.0
86.0
(%)
Series1 Idirect target Consensus Target Mean % Consensus with BUY
Source: Bloomberg, Company, ICICIdirect.com Research Key events
D ate E ventD ec-04 Arvind B rands L td made subsidia ry company of Arvind
Jul-10 L aunches T he Arvind S tore and its first ma jor rea l esta te project
O ct-11 S ets up jo int venture for marketing T om my H ilfiger brand
Aug-12 S igns distribution agreement with B illabong Arvind acquires India operations of D ebenhams, Next, Nautica
S ep-13 S igns agreement for licenses of H anes E nters long te rm licensing agreement with Iconix L ifestyle India
O ct-14 Buys 49% stake in C a lvin K le in in India S et up jo int venture (JV ) with G oodhill C orpora tion of Japan for launch of form a l suits
May-15 L aunches the first G AP store in D e lh i; the company ties up with Am erican specia lty re ta ile r - Aeroposta le
Jul-15 R eports Q 1F Y 16 results with 6% growth in revenues; brands & re ta il revenues a t | 527 crore
O ct-15 R eports Q 2F Y 16 results in line with estimates. T extiles grew by 5% Y oY and B rands & R eta il grew by 9% Y oY
F eb-16 R eports Q 3F Y 16 results in line with expecta tion. T extiles rem ained stagnant and brand & re ta il grow 12%
May-16 L aunch of nnnow.com
Aug-16 R eports Q 1F Y 17 results in line with expecta tion. T extiles grew by 13% ; brand & re ta il grew by 26%
Source: Company, ICICIdirect.com Research Top 10 Shareholders Shareholding Pattern R ank Nam e atest F iling D ate % O /S P osition (m)C hange (m )1 Aura S ecurities P vt. L td. 31-Mar-16 0.38 97.4 -0.52 L ife Insurance C orpora tion of India 31-Mar-16 0.05 12.2 -3.03 Multiples Alternate Asset Managem ent P rivate L i 31-Mar-16 0.04 10.8 0.04 AML E mployees Welfa re T rust 31-Mar-16 0.02 6.3 0.05 F ranklin T empleton Asset Management (India ) P 31-May-16 0.02 5.9 0.56 D imensiona l F und Advisors, L .P . 30-S ep-15 0.02 4.6 1.17 L a lbha i G roup 31-Mar-16 0.02 4.1 0.08 S undaram Asset Management C ompany L im ited 30-Apr-16 0.02 4.1 0.19 U T I Asset Management C o. L td. 30-Jun-16 0.01 3.7 0.010 S chroder Investm ent Management L td. (S IM) 30-Apr-16 0.01 3.2 0.0
(in %) Jun-15 Sep-15 Dec-15 Mar-16 Jun-16Promoter 43.8 43.8 43.8 43.8 43.8FII 14.7 15.2 23.1 22.6 22.9DII 15.8 16.1 16.6 16.4 16.1Others 25.7 24.9 16.5 17.2 17.2
Source: Reuters, ICICIdirect.com Research Recent Activity
Investor nam e V a lue S hares Investor name V a lue S haresF ranklin T em pleton Asset Managem ent (India ) P vt. L td. 2.377 0.500 L ife Insurance C orporation of India -12.351 -2.993E xce l F unds Managem ent Inc. 1.962 0.402 T ata Asset Management L im ited -4.119 -0.845Jyske Invest F und Managem ent A/S 0.867 0.182 K otak Mahindra Asset Managem ent C om pany L td. -3.981 -0.817P ram erica Asset Managers P vt. L td. 0.626 0.150 Aura S ecurities P vt. L td. -1.877 -0.455IC O N Advise rs, Inc. 0.475 0.100 C anara R obeco Asset Managem ent C om pany L td. -1.582 -0.325
Buys S e lls
Source: Reuters, ICICIdirect.com Research

ICICI Securities Ltd | Retail Equity Research Page 11
.
Financial summary Profit and loss statement | Crore (Year-end March) FY15 FY16 FY17E FY18ETotal operating Income 7,851.4 8,450.4 9,367.6 10,212.6 Growth (%) 14.4 7.6 10.9 9.0 Raw Material Expenses 3,494.0 3,677.4 4,145.2 4,519.1 Employee Expenses 802.3 928.0 1,071.8 1,238.0 Manufacturing Expenses 1,449.2 2,750.6 1,764.7 1,878.0 Selling & Distribution Expenses 497.2 - 515.2 510.6 Admin & Other Expenses 525.3 - 616.5 676.7 Project Expenses 70.6 29.0 32.1 35.0 Total Operating Expenditure 6,838.6 7,385.0 8,145.6 8,857.4 EBITDA 1,012.8 1,065.4 1,222.0 1,355.2 Growth (%) 8.4 5.2 14.7 10.9 Depreciation 212.4 256.0 290.0 312.6 Interest 394.6 381.1 434.4 442.1 Other Income 93.2 96.4 101.2 106.3 PBT 499.0 524.7 598.8 706.8 Growth (%) 17.8 5.1 14.1 18.0 Total Tax 107.1 151.9 153.7 195.1 PAT (adj. exceptional gains/loss) 341.1 362.7 392.9 499.4 Growth (%) (3.6) 6.3 8.3 27.1 EPS (|) 13.2 14.1 15.2 19.4
Source: Company, ICICIdirect.com Research
Cash flow statement | Crore (Year-end March) FY15 FY16 FY17E FY18EProfit before Tax 444.7 516.7 548.8 696.8 Add: Depreciation 212.4 256.0 290.0 312.6 (Inc)/dec in Current Assets (485.5) (294.3) (0.0) (594.8) Inc/(dec) in CL and Provisions 52.4 522.6 (173.1) 221.5 Taxes Paid (107.1) (151.9) (153.7) (195.1) Interest on borrowings 394.6 381.1 434.4 442.1 CF from operating activities 511.5 1,230.2 946.5 883.1 (Inc)/dec in Investments 70.9 (11.9) (6.9) (7.6) (Inc)/dec in Fixed Assets (509.8) (369.4) (443.8) (451.6) (Inc)/dec in Intangible Assets (107.2) (46.2) (27.7) (22.5) Others 36.1 (2.8) 37.7 4.0 CF from investing activities (510.0) (430.3) (440.7) (477.7) Issue/(Buy back) of Equity 0.1 - - - Inc/(dec) in loan funds 404.6 143.5 80.0 64.0 Dividend paid & dividend tax 79.0 94.8 94.8 94.8 Interest paid & Others (568.2) (1,056.6) (671.7) (608.2) CF from financing activities (84.5) (818.2) (496.9) (449.4) Net Cash flow (83.0) (18.3) 8.8 (44.0) Opening Cash 166.3 83.3 65.1 73.9 Closing Cash 83.3 65.1 73.9 30.0
Source: Company, ICICIdirect.com Research
Balance sheet | Crore (Year-end March) FY15 FY16 FY17E FY18ELiabilitiesEquity Capital 258.2 258.2 258.2 258.2 Reserve and Surplus 2,463.8 2,653.5 3,058.3 3,487.7 Total Shareholders funds 2,722.1 2,911.7 3,316.5 3,746.0 Total Debt 3,396.7 3,540.2 3,620.2 3,684.2 Deferred Tax Liability 47.1 69.9 47.1 47.1 Minority Interest / Others 34.8 52.9 34.8 34.8 Total Liabilities 6,200.4 6,574.7 7,018.5 7,512.0 AssetsGross Block 5,287.5 5,703.1 6,174.6 6,648.7 Less: Acc Depreciation 2,079.6 2,243.5 2,486.9 2,821.6 Net Block 3,207.9 3,459.5 3,687.7 3,827.1 Capital WIP 95.6 98.4 60.7 56.7 Intangible WIP 4.4 48.5 4.4 4.4 Total Fixed Assets 3,303.5 3,557.9 3,748.4 3,883.8 Investments 57.1 69.1 76.0 83.6 Inventory 1,845.0 1,832.0 1,668.2 1,818.7 Debtors 1,165.8 1,417.3 1,283.2 1,399.0 Loans and Advances 1,244.4 1,248.0 1,497.6 1,752.2 Other Current Assets 269.3 321.6 369.8 443.8 Cash 83.3 65.1 73.9 30.0 Total Current Assets 4,607.9 4,883.9 4,892.8 5,443.6 Trade Payables 1,349.4 1,575.0 1,360.1 1,499.1 Provisions 129.0 116.0 127.6 146.8 Other Current Liabilities 294.2 293.7 215.3 257.7 Total Current Liabilities 1,772.6 1,984.7 1,703.1 1,903.5 Net Current Assets 2,835.3 2,899.2 3,189.7 3,540.1 Application of Funds 6,200.4 6,574.7 7,018.5 7,511.9
Source: Company, ICICIdirect.com Research
Key ratios (Year-end March) FY15 FY16 FY17E FY18EPer share data (|)EPS 13.2 14.1 15.2 19.4Cash EPS 21.4 24.0 26.4 31.4BV 105.4 112.8 128.4 145.1DPS 3.1 3.1 3.1 3.1Cash Per Share 3.2 2.5 2.9 1.2Operating RatiosEBITDA Margin (%) 12.9 12.6 13.0 13.3PBT Margin (%) 5.7 6.1 5.9 6.8PAT Margin (%) 4.3 4.3 4.2 4.9Inventory days 85.8 79.1 65.0 65.0Debtor days 54.2 61.2 50.0 50.0Creditor days 62.7 68.0 53.0 53.6Return Ratios (%)RoE 12.5 12.5 11.8 13.3RoCE 14.4 13.8 14.7 15.3RoIC 13.4 12.8 13.7 14.3Valuation Ratios (x)P/E 22.5 20.9 19.3 15.2EV / EBITDA 10.8 10.4 9.1 8.3EV / Net Sales 1.4 1.3 1.2 1.1Market Cap / Sales 1.0 0.9 0.8 0.7Price to Book Value 2.8 2.6 2.3 2.0Solvency RatiosDebt/EBITDA 3.4 3.3 3.0 2.7Debt / Equity 1.2 1.2 1.1 1.0Current Ratio 2.6 2.1 2.3 2.3Quick Ratio 1.5 1.3 1.5 1.5
Source: Company, ICICIdirect.com Research

ICICI Securities Ltd | Retail Equity Research Page 12
ICICIdirect.com coverage universe (Retail & Textile) CMP M Cap
(|) TP(|) Rating (| Cr) FY16 FY17E FY18E FY16 FY17E FY18E FY16 FY17E FY18E FY16 FY17E FY18E FY16 FY17E FY18EKewal Kiran Clothing (KEWKIR) 1860 2025 Buy 2292 55.0 68.5 81.0 33.8 27.2 23.0 22.0 19.2 15.6 32.2 40.3 41.6 22.7 25.4 26.9
Page Industries (PAGIND) 13940 11950 Hold 15509 208.5 245.0 290.6 66.9 56.9 48.0 38.3 33.5 28.3 61.0 55.0 54.7 46.0 44.2 43.0Rupa & Company 295 - Unrated 2343 8.3 10.4 12.2 35.6 28.4 24.2 18.8 15.2 13.3 18.3 17.1 17.8 17.9 18.8 19.1
Vardhman Textiles (MAHSPI) 1063 910 Hold 6808 92.6 129.3 124.2 11.5 8.2 8.6 6.4 5.6 4.6 11.7 17.6 16.8 15.0 17.3 14.5
Arvind Ltd (ARVMIL) 310 370 Buy 7986 14.1 15.2 19.4 22.1 20.4 16.0 10.4 9.1 8.3 13.8 14.7 15.3 12.5 11.8 13.3
RoCE (%) RoE (%)
Sector / Company
EPS (|) P/E (x) EV/EBITDA (x)
Source: Company, ICICIdirect.com Research
ICICI Securities Ltd | Retail Equity Research Page 13
RATING RATIONALE ICICIdirect.com endeavours to provide objective opinions and recommendations. ICICIdirect.com assigns ratings to its stocks according to their notional target price vs. current market price and then categorises them as Strong Buy, Buy, Hold and Sell. The performance horizon is two years unless specified and the notional target price is defined as the analysts' valuation for a stock. Strong Buy: >15%/20% for large caps/midcaps, respectively, with high conviction; Buy: >10%/15% for large caps/midcaps, respectively; Hold: Up to +/-10%; Sell: -10% or more;
Pankaj Pandey Head – Research [email protected]
ICICIdirect.com Research Desk, ICICI Securities Limited, 1st Floor, Akruti Trade Centre, Road No 7, MIDC, Andheri (East) Mumbai – 400 093
ICICI Securities Ltd | Retail Equity Research Page 14
ANALYST CERTIFICATION We /I, Bharat Chhoda, MBA and Ankit Panchmatia, MBA, Research Analysts, authors and the names subscribed to this report, hereby certify that all of the views expressed in this research report accurately reflect our views about the subject issuer(s) or securities. We also certify that no part of our compensation was, is, or will be directly or indirectly related to the specific recommendation(s) or view(s) in this report.
Terms & conditions and other disclosures: ICICI Securities Limited is a Sebi registered Research Analyst having registration no. INH000000990. ICICI Securities Limited (ICICI Securities) is a full-service, integrated investment banking and is, inter alia, engaged in the business of stock brokering and distribution of financial products. ICICI Securities is a wholly-owned subsidiary of ICICI Bank which is India’s largest private sector bank and has its various subsidiaries engaged in businesses of housing finance, asset management, life insurance, general insurance, venture capital fund management, etc. (“associates”), the details in respect of which are available on www.icicibank.com. ICICI Securities is one of the leading merchant bankers/ underwriters of securities and participate in virtually all securities trading markets in India. We and our associates might have investment banking and other business relationship with a significant percentage of companies covered by our Investment Research Department. ICICI Securities generally prohibits its analysts, persons reporting to analysts and their relatives from maintaining a financial interest in the securities or derivatives of any companies that the analysts cover. The information and opinions in this report have been prepared by ICICI Securities and are subject to change without any notice. The report and information contained herein is strictly confidential and meant solely for the selected recipient and may not be altered in any way, transmitted to, copied or distributed, in part or in whole, to any other person or to the media or reproduced in any form, without prior written consent of ICICI Securities. While we would endeavour to update the information herein on a reasonable basis, ICICI Securitiesis is under no obligation to update or keep the information current. Also, there may be regulatory, compliance or other reasons that may prevent ICICI Securities from doing so. Non-rated securities indicate that rating on a particular security has been suspended temporarily and such suspension is in compliance with applicable regulations and/or ICICI Securities policies, in circumstances where ICICI Securities might be acting in an advisory capacity to this company, or in certain other circumstances. This report is based on information obtained from public sources and sources believed to be reliable, but no independent verification has been made nor is its accuracy or completeness guaranteed. This report and information herein is solely for informational purpose and shall not be used or considered as an offer document or solicitation of offer to buy or sell or subscribe for securities or other financial instruments. Though disseminated to all the customers simultaneously, not all customers may receive this report at the same time. ICICI Securities will not treat recipients as customers by virtue of their receiving this report. Nothing in this report constitutes investment, legal, accounting and tax advice or a representation that any investment or strategy is suitable or appropriate to your specific circumstances. The securities discussed and opinions expressed in this report may not be suitable for all investors, who must make their own investment decisions, based on their own investment objectives, financial positions and needs of specific recipient. This may not be taken in substitution for the exercise of independent judgment by any recipient. The recipient should independently evaluate the investment risks. The value and return on investment may vary because of changes in interest rates, foreign exchange rates or any other reason. ICICI Securities accepts no liabilities whatsoever for any loss or damage of any kind arising out of the use of this report. Past performance is not necessarily a guide to future performance. Investors are advised to see Risk Disclosure Document to understand the risks associated before investing in the securities markets. Actual results may differ materially from those set forth in projections. Forward-looking statements are not predictions and may be subject to change without notice. ICICI Securities or its associates might have managed or co-managed public offering of securities for the subject company or might have been mandated by the subject company for any other assignment in the past twelve months. ICICI Securities or its associates might have received any compensation from the companies mentioned in the report during the period preceding twelve months from the date of this report for services in respect of managing or co-managing public offerings, corporate finance, investment banking or merchant banking, brokerage services or other advisory service in a merger or specific transaction. ICICI Securities or its associates might have received any compensation for products or services other than investment banking or merchant banking or brokerage services from the companies mentioned in the report in the past twelve months. ICICI Securities encourages independence in research report preparation and strives to minimize conflict in preparation of research report. ICICI Securities or its analysts did not receive any compensation or other benefits from the companies mentioned in the report or third party in connection with preparation of the research report. Accordingly, neither ICICI Securities nor Research Analysts have any material conflict of interest at the time of publication of this report. It is confirmed that Bharat Chhoda, MBA and Ankit Panchmatia, MBA, Research Analysts of this report have not received any compensation from the companies mentioned in the report in the preceding twelve months. Compensation of our Research Analysts is not based on any specific merchant banking, investment banking or brokerage service transactions. ICICI Securities or its subsidiaries collectively or Research Analysts do not own 1% or more of the equity securities of the Company mentioned in the report as of the last day of the month preceding the publication of the research report. Since associates of ICICI Securities are engaged in various financial service businesses, they might have financial interests or beneficial ownership in various companies including the subject company/companies mentioned in this report. It is confirmed that Abhishek Bharat Chhoda, MBA and Ankit Panchmatia, MBA, Research Analysts do not serve as an officer, director or employee of the companies mentioned in the report. ICICI Securities may have issued other reports that are inconsistent with and reach different conclusion from the information presented in this report. Neither the Research Analysts nor ICICI Securities have been engaged in market making activity for the companies mentioned in the report. We submit that no material disciplinary action has been taken on ICICI Securities by any Regulatory Authority impacting Equity Research Analysis activities. This report is not directed or intended for distribution to, or use by, any person or entity who is a citizen or resident of or located in any locality, state, country or other jurisdiction, where such distribution, publication, availability or use would be contrary to law, regulation or which would subject ICICI Securities and affiliates to any registration or licensing requirement within such jurisdiction. The securities described herein may or may not be eligible for sale in all jurisdictions or to certain category of investors. Persons in whose possession this document may come are required to inform themselves of and to observe such restriction.