mainstreet equity corp. q1 report 2017
TRANSCRIPT

Q1 2017For the three months ended December 31, 2016 and 2015

MAINSTREET EQUITY CORP. is a Canadian real estate company focused on acquiring and managing mid-market rental apartment buildings primarily in Western Canada. Founded in 1997, Mainstreet creates value by purchasing under-performing properties, renovating them to a branded standard, improving operating efficiencies and repositioning them in the market for greater returns.
For additional information about Mainstreet Equity Corp., see the Corporation’s profile at SEDAR (www.sedar.com).
Forward-Looking InformationCertain statements contained herein constitute “forward-looking statements” as such term is used in applicable Canadian securities laws. These statements relate to analysis and other information based on forecasts of future results, estimates of amounts not yet determinable and assumptions of management. In particular, statements concerning estimates related to future acquisitions, dispositions and capital expenditures, reduction of vacancy rates, increase of rental rates and rental revenue, future income and profitability, timing of refinancing of debt, access to low-cost, long-term Canada Mortgage and Housing Corporation (“CMHC”) insured mortgage loans, completion, timing and costs of renovations, increased funds from operations and cash flow, minimization of operating costs, the Corporation’s liquidity and financial capacity, improved rental conditions, potential increases in rental revenue if optimal operations achieved, the period of time required to stabilize a property, future environmental impact ,the Corporation’s strategy and goals and the steps it will take to achieve them, the Corporation’s anticipated funding sources to meet various operating and capital obligations, key accounting estimates and assumptions used by the Corporation, and other factors and events described in this document should be viewed as forward-looking statements to the extent that they involve estimates thereof. Any statements that express or involve discussions with respect to predictions, expectations, beliefs, plans, projections, objectives, assumptions of future events or performance (often, but not always, using such words or phrases as “expects” or “does not expect”, “is expected”, “anticipates” or “does not anticipate”, “plans”, “estimates” or “intends”, or stating that certain actions, events or results “may”, “could”, “would”, “might” or “will” be taken, occur or be achieved) are not statements of historical fact and should be viewed as forward-looking statements.
Such forward-looking statements are not guarantees of future events or performance and by their nature involve known and unknown risks, uncertainties and other factors, including those risks described in the Corporation’s Annual Information Form, dated December 6, 2016 under the heading “Risk Factors”, that may cause the actual results, performance or achievements of the Corporation to be materially different from any future results, performance or achievements expressed or implied by such forward-looking statements. Such risks and other factors include, among others, costs and timing of the development or renovation of existing properties, availability of capital to fund stabilization programs, other issues associated with the real estate industry including availability of labour and costs of renovations, fluctuations in vacancy rates, general economic conditions, competition for tenants, unoccupied units during renovations, rent control, fluctuations in utility and energy costs, environmental and other liabilities, credit risks of tenants, fluctuations in interest rates and availability of capital, and other such business risks as discussed herein. Material factors or assumptions that were applied in drawing a conclusion or making an estimate set out in the forward-looking statements include, among others, the rental environment compared to several years ago, relatively stable interest costs, access to equity and debt capital markets to fund (at acceptable costs) and the availability of purchase opportunities for growth in Canada. Although the Corporation has attempted to identify important factors that could cause actual actions, events or results to differ materially from those described in forward-looking statements, other factors may cause actions, events or results to be different than anticipated, estimated or intended. There can be no assurance that such statements will prove to be accurate as actual results and future events could vary or differ materially from those anticipated in such forward- looking statements. Accordingly, readers should not place undue reliance on forward-looking statements contained herein.
Forward-looking statements are based on management’s beliefs, estimates and opinions on the date the statements are made, and the Corporation undertakes no obligation to update forward-looking statements if these beliefs, estimates and opinions should change except as required by applicable securities laws.
Management closely monitors factors that could cause actual actions, events or results to differ materially from those described in forward-looking statements and will update those forward-looking statements where appropriate in its quarterly financial reports.
Certain information set out herein may be considered as “financial outlook” within the meaning of applicable securities laws. The purpose of this financial outlook is to provide readers with disclosure regarding the Corporation’s reasonable expectations as to the anticipated results of its proposed business activities for the periods indicated. Readers are cautioned that the financial outlook may not be appropriate for other purposes.
Message from the President & CEO ....................................................................................................... 1
Management’s Discussion and Analysis................................................................................................ 5
Condensed Consolidated Statements of Financial Position ............................................................. 31
Condensed Consolidated Statements of Net Profit and Total Comprehensive Income .................. 32
Condensed Consolidated Statements of Changes in Equity ............................................................ 33
Condensed Consolidated Statements of Cashflows .......................................................................... 34
Notes to the Condensed Financial Statements .................................................................................. 35
Corporate Information ......................................................................................................................... IBC

Q1 2017 1
Mainstreet Equity Corp. (“Mainstreet” or the “Corporation), an add-value, mid-market consolidator of apartments in Western Canada, is announcing its operating and financial results for the three months ended December 31, 2016.
As we begin fiscal year 2017, Mainstreet continues to pursue a series of strategic plans that were crafted over 12 months ago in response to macro economic challenges in some of our core markets. These strategies included acquiring assets at low cost; refinancing significant portions of our pre-maturity debts at lower interest rates; and continuing to buy back our own shares under our normal course issuer bid (“NCIB”) on an opportunistic basis, as we believe our common shares are trading significantly below their true net asset value (“NAV”). Below, we outline the highly beneficial results of these strategies.
FINANCIAL HIGHLIGHTS FOR Q1 2017:
• For the first time since Q2 2015 – a time when the economic recessions in Alberta and Saskatchewan were intensifying – Mainstreet saw an uptick in same-asset revenues in Q1 2017, a 2% increase to $23.2 million from $22.8 million in Q4 2016. This occurred despite Q1 typically being a season of low activity in the rental market.
• We continued to demonstrate the effectiveness of our 100% organic, non-dilutive growth model by growing our portfolio without increasing share capital. Since its inception Mainstreet’s portfolio has surpassed 10,000 units (we now have a total 10,181 units) while our total number of issued and outstanding shares has remained at 8.8 million – the same as when Mainstreet began trading on the TSX in 2000.
KEY METRICS | Q1 PERFORMANCE HIGHLIGHTSRental Revenue from operations | Up 2% to $25.8 million (vs. $25.4 million in Q1 2016)Rental Revenue – Same Assets Properties | Down 3% to $24.7 million (vs. $25.4 million in Q1 2016)
Net Operating Income (NOI)
From operations | Down 6% to $15.7 million (vs. $16.6 million in Q1 2016)Same Assets Properties | Down 9% to $15.1 million (vs. $16.6 million in Q1 2016)
Funds from operations | Down 44% to $4.3 million (vs. $7.7 million in Q1 2016)FFO per share | Down 36% to $0.48 per share (vs. $0.75 per share in Q1 2016) FFO before pay-out penalties | Down 20% to $6.2 million (vs. $7.8 million in Q1 2016)FFO before pay-out penalties per share | Down 9% to $0.70 per share (vs. $0.77 per share in Q1 2016)
Operating Margin
From operations | 61% (vs. 66% in Q1 2016)Same Assets Properties | 61% (vs. 66% in Q1 2016)
Total Acquisition & Capital Expenditures | $10.5 million in Q1 2017 (vs. $4.6 million in Q1 2016)Stabilized Units | 214 properties (9,137 units) out of 228 properties (9,936 units)Acquisitions | 58 units for $5.3 million ($91,000/unit) Acquisitions – subsequent to Dec. 31, 2016 | 245 units for $23 million ($94,000/unit)
Vacancy rate | 9.7% (vs.7.8% in Q1 2016)Same Asset Vacancy rate | 8.2% (vs. 7.8% Q1 2016)
MESSAGE FROM THE PRESIDENT & CEOFor the 3 months ended December 31, 2016 and 2015

MAINSTREET EQUITY CORP.2
• Refinanced $50.1 million in pre-maturity debt with an average interest rate of 5.24% into mostly 10-year long-term CMHC-insured mortgage loans for $101.5 million at an average interest rate of 2.44% and financed four clear title assets with a 10-year long-term CMHC-insured mortgage loans for $39.8 million at an interest rate of 2.34%. These financings resulted in an annualized interest savings of $1.5 million, totalling $15 million for 10 years and raised $89 million in additional funds after pay-out penalties.
• We continue to grow through strategic and opportunistic acquisitions in our core markets. Year to day, we required 303 residential units for a total consideration of $28.3 million-an average cost of $93,000 per unit.
• Maintained our sizeable year-to-date estimated liquidity position of $151 million, including a cash balance of $45 million, to pursue further potential growth opportunities.
Despite encouraging financial highlights, Mainstreet continued to face challenges in Q1 2017 due to broader economic forces. Net operating income (“NOI”) from operations was down 6% YTD, while funds from operations (“FFO”) was down 20% (excluding one time pay-out penalties of $1.9 million).
This was due to slower economic activity in the Alberta and Saskatchewan markets, resulting in increased vacancies, lower rental rates and increased concessions to tenants. The province of Alberta was especially impacted by uncertain economic conditions.
However, lower returns in the Prairie provinces were partially offset by our Vancouver/Lower Mainland assets, which comprises 30% of our portfolio. The region steadily grew in performance over the year, maintaining a vacancy rate below 1% and NOI growth of 7% YTD. We believe there will be substantial potential for further increases in market rental rates in the region, which could raise our NOI and FFO in future quarters.
For more detailed analysis of Mainstreet operating results for Q1 2017, please refer to the sections titled “Funds from Operations” and “Rental Operations” in our MD&A.
RESULTS
In Q1 2017, FFO excluding one-time pay-out penalties decreased 20% to $6.2 million, compared with $7.8 million in Q1 2016. FFO excluding one-time pay-out
penalties per basic share decreased 9% to $0.70, compared with $0.77 in Q1 2016. Rental revenues increased 2% to $25.8 million, compared with $25.4 million in Q1 2016; this came alongside a 3% fall in same asset rental revenues to $24.7 million, from $25.4 million in Q1 2016. NOI decreased 6% to $15.7 million, while falling 9% to $15.1 million on a same asset basis. Operating margins dropped to 61% compared to 66% in Q1 2016.
The same asset vacancy rate increased year-over-year to 8.2% from 7.8% in Q1 2016. The overall Q1 2017 vacancy rate, which includes vacant units as apartments undergo stabilization, increased year-over-year to 9.7% from 7.8% in Q1 2016. As of the year end date, 799 units, or 8% of the portfolio, remained in the stabilization process.
During Q1 2017, Mainstreet refinanced $50.1 million of pre-maturity debts with an average interest rate of 5.24% into 10-year, long-term CMHC-insured mortgage loans totalling $101.5 million at an average rate of interest of 2.44%. We also financed 4 clear-title asset properties for $39.8 million at an average rate of interest of 2.34%. Together, this refinancing activity raised approximately $89 million in additional funds after a pay-out penalty of $1.9 million, and resulted in an annualized savings in interest expense of approximately $1.5 million, totalling $15 million for 10 years.
Subsequent to the Q1 2017, Mainstreet has obtained approval to refinance an additional $10 million of pre-matured debts with an average rate of interest of 4.95% into 10-year, long-term CMHC-insured mortgage loans for $19 million at an average rate of interest of 2.78%. Mainstreet also obtained approval for a $28 million, 10-year CMHC-insured mortgage on 8 clear titled assets at an estimated average interest rate of 2.9%. Together, this subsequent refinancing activity raised approximately $37 million in additional funds after a pay-out penalty of $185,000, and resulted in an annualized savings in interest expense of approximately $218,000, totalling $2.2 million for 10 years.
Management is well aware that the one-time pay-out penalty of $2.2 million, paid in the first and second quarters of financial year 2017, would have an adverse effect on the Corporation’s financial performance in the respective reporting periods. However, with total interest savings of over $17.2 million in the next 10 years; the raising of over $126 million of low cost capital for potential future acquisitions and share buy backs; and reduction of the Corporation’s overall

Q1 2017 3
interest risk exposure, Management expects that the long-term benefits will far outweigh the short-term effect on the financial performance of the Corporation.
CHALLENGES
Ongoing volatility of petroleum, natural gas and other commodity prices continues to create economic uncertainty in some of our core markets. This uncertainty is compounded by the introduction of the Alberta carbon tax, which was rolled out in January 2017. The economy-wide tax is structured in a way that charges the owners of buildings while offering rebates to tenants, which in turn raises our heating and electrical costs. Mainstreet currently has its electricity costs in Alberta contractually locked in at a fixed rate until April 2018. However, our internal research suggests that the provincial carbon tax will add additional costs in fiscal 2018 of roughly $8.8 per unit. Additionally, increase in rent concessions, tenant turnover and bad debts also created additional anticipated operating cost pressures in Q1 2017.
Mainstreet’s vacancy rate was above average over the quarter. This was largely a result of a high level of vacancy across the Prairie provinces, coupled with the $78 million in acquisitions of unstabilized properties, the Corporation has completed over the past 15 months. While we view this vacancy rate as high (9.7%), we see this as a short-term trend as we continue to undergo our stabilization process.
Negative macro economic forces have likewise caused significant short positions in respect of the trading of Mainstreet common stock. We believe this is partly responsible for our common share trading price being well below NAV. As of December 31, 2016, the short position on Mainstreet totaled 752,600 common shares.
Broadly speaking, the impact of lower commodity prices and market volatility is difficult to measure in precise terms. However, we believe the current situation also creates a series of opportunities that are discussed at greater length in the Outlook section below.
OUTLOOK
Mainstreet saw its same-asset revenues, vacancy rate and funds from operations excluding utility cost increase in Q1 2017 compared with Q4 2016. This marked a positive quarterly movement for the first time in six quarters. The uptick occurred despite that Q1, historically, is a winter season of low activity in the apartment rental market.
We believe this revenue increase could be an early indication of market stabilization in the Alberta and
Saskatchewan markets. Ideally, this is a signal that we are nearing the tail end of the downward curve in revenues on a same-asset basis. However, we maintain a cautious perspective in this regard, as the macro economic picture in those markets remains uncertain. In addition, the performance of our BC portfolio, which accounts for approximately 30% of Mainstreet’s portfolio, maintained an average vacancy rate below 1%. We anticipate that rental revenues from our BC portfolio will continue to grow through rent increases and further improvements in occupancy rates.
We see several key indicators of positive movement in the Alberta and Saskatchewan markets. According to recent Canadian census data, Alberta’s population grew 11.6% between 2011 and 2016—the highest rate in the country and more than twice the national average. The population growth over the period was even higher than it was from 2006 to 2011, when Alberta’s economic situation was, on balance, healthier. Saskatchewan’s population growth was the second highest in the country at 6.3%. Overall, the 2016 census marked the first time in Canadian history that the three Prairie provinces (Alberta, Saskatchewan and Manitoba) had the highest population growth in the country.
Mainstreet views this demographic shift as a highly positive indicator for our Alberta and Saskatchewan markets in the long term. We see this trend continuing in the future, provided economic activity continues to improve. In Alberta, the provincial population is expected to grow by 1.6% in 2017 and by 1.7% in 2018, according to CMHC data. Saskatchewan’s population also continues to grow, and is expected to rise by 1.3% in 2017 and 2018.
Steady in-migration levels come as the rental market begins to show signs of absorption. During recent years of high economic growth, there was a rapid build out of condominiums, particularly in Alberta, which began coming onto the market in mid-2015. We believe this led to a lot of condominium units being owned by investors with the intention for the higher-end rental market. The economic recession and the lower in-migration level, which resulted in an oversupply of condominium rental units, created a spillover effect and caused an increase in vacancy rate in the apartment rental market. However, Mainstreet believes this oversupply will continue to absorb through fiscal 2017 and 2018.
Additionally, we expect the recent relaxation of Canadian immigration policies to attract a number of foreign workers, foreign students, immigrants and refugees to some of our core regions—most of whom are likely to enter the rental market.
MAINSTREET EQUITY CORP.4
With immigration numbers anticipated to rise, we also believe stricter requirements on CMHC-insured mortgages implemented by the federal government in 2016 are favourable to the rental market. The new legislation may serve to deter first-time homebuyers in particular, who could be more exposed to higher interest rates and therefore more likely to rent rather than buy. This has the additional benefit of helping to absorb the aforementioned excess capacity in the condominium market.
Moreover, Mainstreet is well positioned to capitalize on this apartment rental market growth. In times of economic uncertainty, renters tend to favour middle market prices as they delay major investments like new homes. Our price point average rental rate between $900 and $1,000 perfectly aligns with that mid-market demand.
We also believe that the oil and gas industry in Western Canada is showing indications of improvement early in 2017. US President Donald Trump signed an executive order in January 2017 to move ahead with the Keystone XL pipeline, which is seen as a highly positive development for the sector. The decision is complemented by the Canadian government’s approval of two major oil pipelines in the later part of October 2016. The approval of the three pipelines is expected to aid in attracting investment to Canada’s oil and gas industry.
In addition, the global oil cartel known as OPEC agreed to collectively cut back their oil production in November 2016, potentially putting a floor on prices. Oil prices in early 2017 have increased significantly above their 2016 lows, and the consensus among commodity analysts seems to be that these commodity prices will continue to rise in 2017 and 2018.
Mainstreet believes these broader market conditions create substantial opportunities for growth, and we are pushing the reset button on our approach to acquisitions. The current environment of low interest rates and slower GDP growth makes this an ideal time to expand our portfolio on an opportunistic basis.
Lastly, we expect to benefit from lower costs and availability of labour. With the easing of labour market pressures, we believe this will provide an opportunity to bulk up on senior and middle management personnel at a cost that would have been impossible when economic activity was at its peak.
RUNWAY ON EXISTING PORTFOLIO
1) Closing the NOI gap: Over Q1 2017, 10% of the Mainstreet portfolio remained unstabilized, which contributed to higher vacancy rates. While this is a normal part of the Mainstreet business model, our continual work in renovating and improving properties before releasing them back to the market provides, in our opinion, potential to improve NOI and FFO performance. This inherent challenge in our business model is further increased by recent acquisitions, which causes higher rates of unstabilized properties that affect our NOI and FFO.
2) Renegotiating long-term debt: Interest rates, which account for Mainstreet’s single largest expense, are among the lowest we have ever experienced. We expect to cut these expenses further by refinancing our remaining $10 million in mortgage loans maturing in 2017 and debts maturing in 2018 at an expected average interest rate that will be much lower than the current average rate of 5.2%.
3) Buying back shares at discount to NAV: We believe Mainstreet‘s common shares continue to trade well below their NAV. Additionally, the current discount, in our opinion, does not fully account for numerous intangible assets, including Mainstreet’s diversified asset base and non-dilutive growth model. We will therefore continue to buy back our own common shares on an opportunistic basis under our NCIB.
4) Leveraging our ample liquidity: Finally, we maintain a substantial year to date liquidity position that will allow us to capitalize on opportunities for acquisitions and the repurchasing of our common shares. We anticipate that our estimated year to date liquidity of $151 million will translate into roughly $600 million in acquisition opportunities based on a leverage level of 75%. Following any future acquisitions, this could significantly boost our NOI per share and FFO per share in the long term.
[Signed]
“Bob Dhillon” Calgary, Alberta President & CEO February 14, 2017

Q1 2017 5
MANAGEMENT’S DISCUSSION AND ANALYSIS
The following Management’s Discussion and Analysis (“MD&A”) provides an explanation of the financial position, operating results, performance and outlook of Mainstreet Equity Corp. (“Mainstreet” or the “Corporation”) as at and for the three months ended December 31, 2016 and 2015, respectively. This discussion should not be considered all-inclusive, as it excludes changes that may occur in general economic and political conditions. Additionally, other events may occur that could affect the Corporation in the future. This MD&A should be read in conjunction with the Corporation’s unaudited interim condensed consolidated financial statements for the three months ended December 31, 2016 and 2015, respectively, and the MD&A and audited consolidated financial statements and accompanying notes for the years ended September 30, 2016 and 2015. These unaudited interim condensed consolidated financial statements have been prepared in accordance with International Financial Reporting Standards (“IFRS”). This MD&A has been reviewed and approved by the Audit Committee and Board of Directors of the Corporation and is effective as of February 9, 2017. All amounts are expressed in Canadian dollars. Additional information regarding the Corporation including the Corporation’s annual information form is available under the Corporation’s profile at SEDAR (www.sedar.com).
Unless indicate otherwise, reference herein to 2017 and 2016 refers to the three month periods ended December 31, 2016 and 2015, respectively.
BUSINESS OVERVIEW
Based in Calgary, Alberta, Mainstreet is a Canadian real estate corporation focused on the acquisition, redevelopment, repositioning and management of mid-market rental apartment buildings in four major Canadian markets: Vancouver/Lower Mainland, Calgary (including the City of Lethbridge and the Town of Cochrane), Edmonton (including the City of Fort Saskatchewan) and Saskatoon.
Mainstreet is listed on the Toronto Stock Exchange (“TSX”) and its common shares are traded under the symbol “MEQ”.
BUSINESS STRATEGY
Mainstreet’s goal is to become Canada’s leading provider of affordable mid-sized, mid-market rental accommodations – typically properties with fewer than 100 units. In pursuit of this goal, the Corporation adheres to its six-step “Value Chain” business model:
DIVESTITURES
• Acquisitions: Identify and purchase underperforming rental units at prices well below replacement costs.
• Capital improvements: Increase the asset value of Mainstreet’s portfolio by renovating acquired properties.
• Operational efficiencies: Minimize operating costs through professional management, efficient technology and energy-saving equipment.
• Value enhancement: Reposition renovated properties in the market as Mainstreet branded products for higher rents, and build and sustain customer loyalty through high levels of service.
• Financing: Maintain a sound capital structure with access to low-cost, long-term Canada Mortgage and Housing Corporation (“CMHC”) insured mortgage loans.
• Divestitures: Occasionally sell mature real estate properties to redirect capital into newer, higher potential properties.
The Mainstreet
VALUE CHAIN

MAINSTREET EQUITY CORP.6
INTERNATIONAL FINANCIAL REPORTING STANDARDS
The condensed consolidated financial statements of the Corporation prepared in conjunction with this MD&A have been prepared in accordance with IFRS as issued by the International Accounting Standards Board (“IASB”).
Investment properties
Investment properties are properties held to earn rental income and are initially measured at cost. Cost includes the initial purchase price and any direct attributable expenditure related to the acquisition and improvement of the properties. All costs associated with upgrading the quality and extending the economic life of the investment properties are capitalized as an additional cost of investment properties.
After initial recognition, the Corporation adopts the fair value model to account for the carrying value of investment properties in accordance with International Accounting Standard (“IAS”) 40 Investment Property (“IAS 40”).
Method used in determining the Fair Value of investment properties
The fair value of investment properties held by the Corporation as of September 30, 2016, was determined by independent qualified real estate appraisers who are members of the Appraisal Institute of Canada and have appropriate qualifications and experience in the valuation of the Corporation’s investment properties in relevant locations. The direct capitalization method was used to convert an estimate of a single year’s income (net operating income) expectancy into an indication of value in one direct step by dividing the income (net operating income) estimated by an appropriate capitalization rate.
The appraisers also reviewed changes in market conditions affecting the underlying assumptions used for the fair value assessment during the period and management estimated the fair value of the investment properties based on the current market conditions at December 31, 2016 except for three properties acquired during the three months ended December 31, 2016 for which the cost of acquisition was used as the best estimate of the fair market value as of December 31, 2016.
The fair values are most sensitive to changes in net operating income and capitalization rates. Mainstreet’s total portfolio is valued at $1,463 million as of December 31, 2016 ($1,460 million as of September 30, 2016). The following is the breakdown of market value by city and average capitalization rates used in determining the fair value of investment properties at December 31, 2016 and September 30, 2016, respectively. Average capitalization Number Number Market value Average value rate as at As of December 31, 2016 of properties of units ($ million) per unit ($000) Dec. 31, 2016
Surrey, BC 10 1,775 $ 272 $ 153 4.56%
Abbotsford, BC 15 975 $ 128 $ 131 5.13%
Calgary, Alberta (Note 1) 34 1,813 $ 389 $ 215 4.86%
Edmonton, Alberta (Note 2) 123 3,939 $ 507 $ 129 5.92%
Saskatoon, Saskatchewan 46 1,434 $ 167 $ 116 6.77%
Total investment properties 228 9,936 $ 1,463 $ 147 5.41%
Note (1) – includes the City of Lethbridge and the Town of Cochrane
Note (2) – includes the City of Fort Saskatchewan Average capitalization Number Number Market value Average value rate as at As of September 30, 2016 of properties of units ($ million) per unit ($000) Sep. 30, 2016
Surrey, British Columbia 10 1,775 $ 272 $ 153 4.56%
Abbotsford, British Columbia 15 975 $ 128 $ 131 5.13%
Calgary, Alberta (Note 1) 34 1,813 $ 390 $ 215 4.86%
Edmonton, Alberta (Note 2) 120 3,883 $ 503 $ 130 5.92%
Saskatoon, Saskatchewan 46 1,432 $ 167 $ 117 6.77%
Total investment properties 225 9,878 $ 1,460 $ 148 5.41%
Note (1) – includes the City of Lethbridge and the Town of Cochrane
Note (2) – includes the City of Fort Saskatchewan
Q1 2017 7
Acquisitions & Growth
(000s of dollars)
Three months ended December 31, 2016 2015
Edmonton & Saskatoon Saskatoon
Number of rental units 58 2
Total costs $ 5,281 $ 115
Average price per unit ($000) $ 91 $ 58
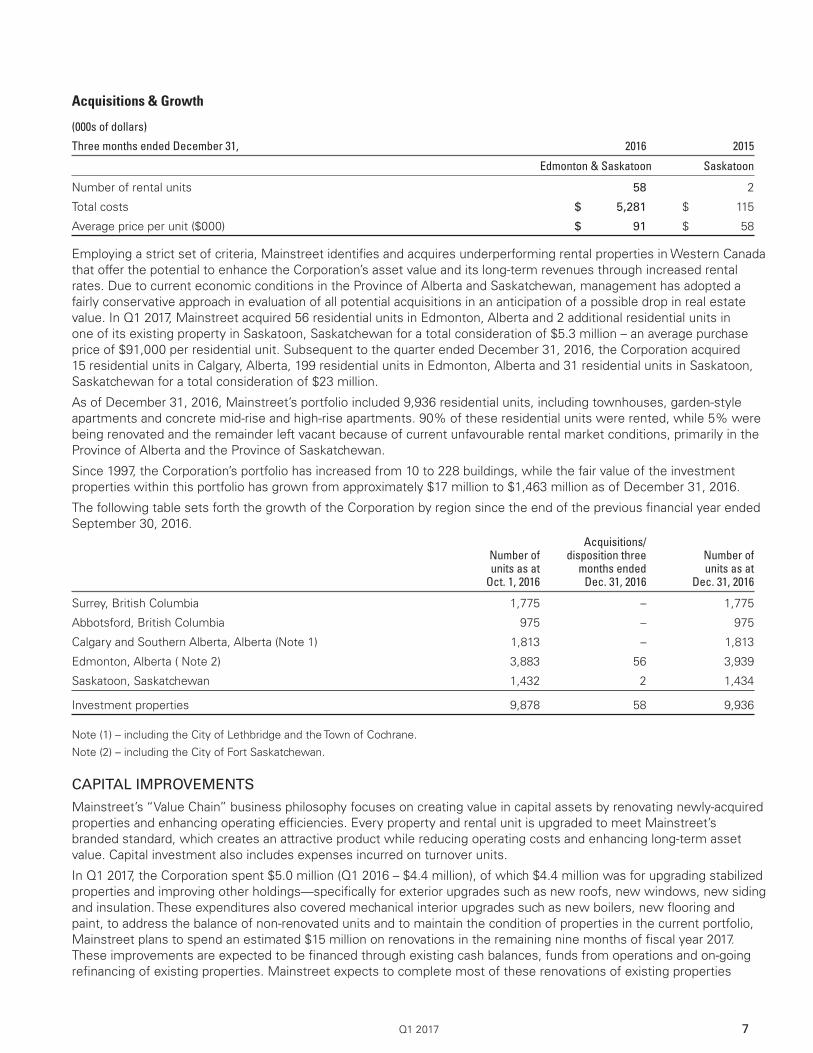
Employing a strict set of criteria, Mainstreet identifies and acquires underperforming rental properties in Western Canada that offer the potential to enhance the Corporation’s asset value and its long-term revenues through increased rental rates. Due to current economic conditions in the Province of Alberta and Saskatchewan, management has adopted a fairly conservative approach in evaluation of all potential acquisitions in an anticipation of a possible drop in real estate value. In Q1 2017, Mainstreet acquired 56 residential units in Edmonton, Alberta and 2 additional residential units in one of its existing property in Saskatoon, Saskatchewan for a total consideration of $5.3 million – an average purchase price of $91,000 per residential unit. Subsequent to the quarter ended December 31, 2016, the Corporation acquired 15 residential units in Calgary, Alberta, 199 residential units in Edmonton, Alberta and 31 residential units in Saskatoon, Saskatchewan for a total consideration of $23 million.
As of December 31, 2016, Mainstreet’s portfolio included 9,936 residential units, including townhouses, garden-style apartments and concrete mid-rise and high-rise apartments. 90% of these residential units were rented, while 5% were being renovated and the remainder left vacant because of current unfavourable rental market conditions, primarily in the Province of Alberta and the Province of Saskatchewan.
Since 1997, the Corporation’s portfolio has increased from 10 to 228 buildings, while the fair value of the investment properties within this portfolio has grown from approximately $17 million to $1,463 million as of December 31, 2016.
The following table sets forth the growth of the Corporation by region since the end of the previous financial year ended September 30, 2016. Acquisitions/ Number of disposition three Number of units as at months ended units as at Oct. 1, 2016 Dec. 31, 2016 Dec. 31, 2016
Surrey, British Columbia 1,775 – 1,775
Abbotsford, British Columbia 975 – 975
Calgary and Southern Alberta, Alberta (Note 1) 1,813 – 1,813
Edmonton, Alberta ( Note 2) 3,883 56 3,939
Saskatoon, Saskatchewan 1,432 2 1,434
Investment properties 9,878 58 9,936
Note (1) – including the City of Lethbridge and the Town of Cochrane.
Note (2) – including the City of Fort Saskatchewan.
CAPITAL IMPROVEMENTS
Mainstreet’s “Value Chain” business philosophy focuses on creating value in capital assets by renovating newly-acquired properties and enhancing operating efficiencies. Every property and rental unit is upgraded to meet Mainstreet’s branded standard, which creates an attractive product while reducing operating costs and enhancing long-term asset value. Capital investment also includes expenses incurred on turnover units.
In Q1 2017, the Corporation spent $5.0 million (Q1 2016 – $4.4 million), of which $4.4 million was for upgrading stabilized properties and improving other holdings—specifically for exterior upgrades such as new roofs, new windows, new siding and insulation. These expenditures also covered mechanical interior upgrades such as new boilers, new flooring and paint, to address the balance of non-renovated units and to maintain the condition of properties in the current portfolio, Mainstreet plans to spend an estimated $15 million on renovations in the remaining nine months of fiscal year 2017. These improvements are expected to be financed through existing cash balances, funds from operations and on-going refinancing of existing properties. Mainstreet expects to complete most of these renovations of existing properties

MAINSTREET EQUITY CORP.8
within the next 3 to 18 months. Revenue and income are expected to increase over time as more units are renovated and reintroduced to the market at anticipated higher rental rates.
Uncertainties affecting future revenue and income include the rate of turnover of existing tenants, availability of renovation workers and building materials, and increases in labour and material costs, all of which could have a material impact on the timing and cost of completing these renovations.
REVIEW OF FINANCIAL & OPERATING RESULTS
Summary of Financial Results
(000s of dollars except per share amounts)
Three months ended December 31, 2016 2015 % change
Gross revenue $ 25,957 $ 25,426 2%
Loss and comprehensive loss from operations $ (3,698) $ (8,484) (56%)
Fair value loss 7,748 16,053 (52%)
Depreciation 88 82 7%
Deferred income tax expense 156 – 100%
Funds from operations (Note 1) $ 4,294 $ 7,651 (44%)
Interest income $ (114) $ (34) 235%
General and administrative expenses 2,398 2,169 11%
Mortgage interest 8,305 6,286 32%
Financing cost 807 562 44%
Net operating income (Note 2) $ 15,690 $ 16,634 (6%)
Operating margin from operations 61% 66%
Loss per share
Basic $ (0.42) $ (0.83) (49%)
Fully diluted $ (0.42) $ (0.83) (49%)
Funds from operations per share
Basic $ 0.48 $ 0.75 (36%)
Fully diluted $ 0.45 $ 0.71 (37%)
Weighted average number of shares
Basic 8,883,333 10,171,744
Fully diluted 9,571,308 10,850,765
December 31, 2016
Total Assets $ 1,520,845
Total Long term liabilities $ 901,119
1. Funds from operations (“FFO”) is calculated as profit before fair value gain (loss), depreciation of property, plant and equipment and deferred income taxes. FFO is a widely accepted supplemental measure of a Canadian real estate company’s performance but is not a recognized measure under IFRS. The IFRS measurement most directly comparable to FFO is profit (for which reconciliation is provided above). FFO should not be construed as an alternative to profit or cash flow from operating activities, determined in accordance with IFRS, as an indicator of Mainstreet’s performance. Readers are cautioned that FFO may differ from similar calculations used by other comparable entities.
2. Net operating income (“NOI”) is rental revenue minus property operating expenses. While Mainstreet uses NOI to measure its operational performance, it is not a recognized measure under IFRS. The IFRS measure most directly comparable to NOI is profit. NOI should not be construed as an alternative to profit determined in accordance with IFRS. Readers are cautioned that NOI may differ from similar calculations used by other comparable entities. A reconciliation of profit to net operating income from continuing operations for the period is provided above.

Q1 2017 9
REVENUE
In Q1 2017, revenue was primarily comprised of rental and ancillary rental income totalling $25.8 million (Q1 2016 – $25.4 million) and interest income. The 2% increase in revenue over Q1 2016 is mainly due to increases in the rental and ancillary rental income from newly acquired properties, which is discussed and analysed in the session entitled “Rental Operations” below.
LOSS
For the three months ended December 31, 2016, Mainstreet reported a loss from operations of $3.7 million ($0.42 per basic share) as compared to a loss of $8.5 million ($0.83 per basic share) in Q1 2016. The loss from operations in Q1 2017 included fair value loss of $7.7 million (Q1 2016 – $16.1 million). The fair value loss comprised an adjustment of $2.7 million to the fair value of the Corporation’s Alberta and Saskatoon properties due to weakening of the local real estate market and the capital expenditure incurred in the quarter written off against the fair value of the properties in accordance with the IFRS. The loss from operations in Q1 2017 also included pay-out penalties of $1.9 million incurred for refinancing of pre-maturity debts, comparing to pay-out penalties of $173,000 in Q1 2016.
The losses in Q1 2017 and Q1 2016 will be further discussed and analysed in the following session entitled “Funds From Operations”.
FUNDS FROM OPERATIONS
Management believes that FFO rather than profit, as defined in the preceding footnote, is a more meaningful performance measurement for a real estate company’s operating performance as FFO excludes these non-operating income and expenses namely fair value gain (loss), depreciation and deferred income taxes. Mainstreet generates FFO from three sources: rental revenue and ancillary rental income from investment properties, sale of properties acquired for resale purposes and the periodic sale of investment properties. Mainstreet generally reinvests the proceeds from the latter into investment properties with greater potential for long-term returns.
In Q1 2017, Mainstreet’s FFO decreased by 44% to $4.3 million as compared to $7.7 million in Q1 2016. The decrease in FFO was mainly attributable to the increased mortgage interest expenses of $2.0 million (including pay-out penalties of $1.9 million). Excluding these one-time pay-out penalties, FFO before pay-out penalties decreased by 20% to $6.2 million in Q1 2017 from $7.8 million in Q1 2016.
(000s of dollars)
Three months ended December 31, 2016 2015 % change
Funds from operations $ 4,294 $ 7,651 (44%)
Pay-out penalties 1,933 173 1,017%
Funds from operations before pay-out penalties $ 6,227 $ 7,824 (20%)
The net operating income decreased by $0.9 million, which also attributed to the decreased FFO and will be discussed and analysed in the following session entitled “Rental Operations”.
FFO in Q1 2017 was further affected by increased G&A expenses of $229,000 from Q1 2016, which will be discussed and analysed in the session entitled “General & Administrative (G&A) Expenses” below.
GENERAL & ADMINISTRATIVE (G&A) EXPENSES
G&A expenses mainly include corporate costs such as office overheads, legal and professional fees and salaries. In Q1 2017, G&A expenses increased by 11% to $2.4 million as compared to $2.2 million in Q1 2016, mainly resulting from increase of salaries expenses. During this period of economic recession, the Corporation has taken opportunities from availability of labour to continue build up the senior and middle management team to support further growth of the company.
MORTGAGE INTEREST
Mortgage interest expenses increased by $2.0 million (32%) to $8.3 million in Q1 2017 compared to $6.3 million in Q1 2016. The rise is mainly attributable to pay-out penalties of $1.9 million incurred for refinancing of pre-maturity debts. To take advantage of current low interest rates, Management decided to refinance all pre-maturity mortgages which would

MAINSTREET EQUITY CORP.10
become due prior to the end of the calendar year ending December 2017. During Q1 2017, the Corporation refinanced $50.1 million of pre-maturity mortgages and incurred pay-out penalties in an aggregate amount of $1.9 million. The refinancing reduced the average interest rate from 5.24% to 2.44% resulting in annualized interest savings of $1.5 million and raised additional low cost capital of $49.5 million after pay-out penalty for further growth of the Corporation.
Management believes that the reduction of the FFO in Q1 2017 resulting from the pay-out penalty is justified by a long-term gain in future savings in interest expense and reduction in the over interest risk exposure of the Corporation.
RENTAL OPERATIONS
(000s of dollars except per unit data)
Total Portfolio Same Asset Acquisition
3 months ended December 31, 2016 2015 % change 2016 2015 % change 2016 2015 % change
Rental revenue and ancillary rental income $ 25,843 $ 25,392 2% $ 24,725 $ 25,392 (3%) $ 1,118 – –
Operating expenses 10,153 8,758 16% 9,642 8,758 10% 511 – –
Net operating income $ 15,690 $ 16,634 (6%) $ 15,083 $ 16,634 (9%) $ 607 – –
Operating margin 61% 66% 61% 66% 54% – –
Average vacancy rate 9.7% 7.8% 24% 8.2% 7.8% 5% 34.1% – –
Weighted average number of units 9,898 9,295 6% 9,295 9,295 0% 603 – –
Average rental rate per unit per month $ 870 $ 911 (4%) $ 887 $ 911 (3%) $ 618 – –
Average operating expense per unit per month $ 342 $ 314 9% $ 346 $ 314 10% $ 282 – –
Despite of the increase in the vacancy rate to 9.7% in Q1 2017 from 7.8% in Q1 2016 and a drop in the average monthly rental rate to $870 per unit in Q1 2017 from $911 per unit in Q1 2016, the overall rental revenue and ancillary rental income increased by 2% to $25.8 million in Q1 2017 from $25.4 million in Q1 2016. This was due to the continued growth of the Corporation’s portfolio during the period of economic recession. The weighted average number of units increased by 6% to 9,898 units in Q1 2017 from 9,295 units in Q1 2016.
For the same asset properties, which refer to properties owned by the Corporation for the entire three month period ended December 31, 2016 and 2015, the rental revenue dropped by 3% to $24.7 million in Q1 2017 from $25.4 million in Q1 2016. This was mainly due to the increased vacancy loss and rental incentive expenses in the Alberta portfolio. Overall, the average rental rate per unit per month decreased by 3% to $887 in Q1 2017 from $911 per unit in Q1 2016. The vacancy rate increased to 8.2% in Q1 2017 from 7.8% in Q1 2016.
Mainstreet’s operating expenses have also increased substantially. The overall and same asset properties average operating cost per month per unit has increased by 9% and 10% over Q1 2016, respectively.
The increase in operating expenses was mainly due to increased property tax, repair and maintenance expenses. Mainstreet has also increased spending related to the upkeep of its properties in an attempt to remain competitive in the rental market.
In addition, substantial amounts of building improvement expenses have been incurred on improving the conditions of the properties that are ready for refinancing. Management intends to refinance all remaining outstanding mortgage loans maturing in 2017 at anticipated lower interest rates by the end of Q2 2017.
As a result, the net operating income decreased by 6% to $15.7 million in Q1 2017 from $16.6 million in Q1 2016 and the net operating margin dropped to 61% in Q1 2017 from 66% in Q1 2016.
For the same asset properties, the net operating income decreased by 9% to $15.1 million in Q1 2017 from $16.6 million in Q1 2016 and the net operating margin dropped to 61% in Q1 2017 from 66% in Q1 2016.
RENTAL OPERATIONS BY PROVINCE
Mainstreet manages and tracks the performance of rental properties in each of its geographic markets.
British Columbia
Mainstreet achieved a unit growth of 1% of its British Columbia portfolio in Q1 2017; the average number of rental units grew to 2,750 units compared to 2,712 units in Q1 2016. The average vacancy rate also improved significantly from 2.9% in Q1 2016 to 0.9% in Q1 2017 mainly due to an improved occupancy rate in both the Surrey and Abbotsford markets.

Q1 2017 11
A better than average vacancy rate could also be attributed to overall economic performance in British Columbia, which is the strongest in economic performance among all provinces, according to Statistics Canada. Due to the strong economy and continuously improved vacancy rate, Mainstreet also increased market rent in its BC portfolio in Q1 2017. As a result, rental revenue per unit increased by 8% to $887 per month in Q1 2017 from $821 per month in Q1 2016.
The operating expense per unit increased from $319 per month compared to $282 per month in Q1 2016, due mainly to increased property taxes and repair and maintenance expenses aimed to improve conditions of the properties which are ready for refinancing. The unusual cold weather in Q1 2017 also incurred higher utilities and snow removal expenses. As a result, the net operating income increased by 7% and the net operating margin decreased to 64% as compared to 66% Q1 2016.
(000s of dollars except per unit data)
Three months ended December 31, 2016 2015 % change
Rental revenue and ancillary rental income $ 7,321 $ 6,679 10%
Operating expenses 2,630 2,295 15%
Net operating income $ 4,691 $ 4,384 7%
Weighted average number of units 2,750 2,712 1%
Average rent per unit per month $ 887 $ 821 8%
Operating cost per unit per month $ 319 $ 282 13%
Average vacancy rate 0.9% 2.9%
Operating margin 64% 66%
AlbertaMainstreet achieved a unit growth of 4% in its Alberta portfolio in Q1 2017; the average number of rental units grew to 5,715 units, compared to 5,516 units in Q1 2016. The average vacancy rate increased to 12.4% in Q1 2017 from 8.3% in Q1 2016. The overall vacancy rate was negatively affected by the recent acquisitions of new properties with substantial vacancy rates. Excluding those newly acquired properties, the average same asset vacancy rate is 10.3% in Q1 2017. The increased vacancy rate from Q1 2016 is due to the weakened economic conditions in the province during 2016. Commodity prices have been volatile over the past two years, but in recent months have levelled off around $50 per barrel. The oil and gas industry in Western Canada is showing early indications of improvement. The same asset vacancy rate in Alberta has improved from 12.1% in Q4 2016 to 10.3% in Q1 2017.
Rental revenue per unit decreased by 10% to $891 per month in Q1 2017 from $985 per month in Q1 2016 as a result of the increased vacancy rate, rental incentives and bad debts during the period.
The operating expense per unit increased by 9% to $364 per month in Q1 2017 from $333 per month in Q1 2016. The increase in operating expense was mainly due to increased repairs and maintenance expenses to improve conditions of the properties which are ready for refinancing, property tax expenses and utility expenses in the quarter. As a result, the net operating income dropped by 16% and the net operating margin decreased to 59% as compared to 66% in Q1 2016.
(000s of dollars except per unit data)
Three months ended December 31, 2016 2015 % change
Rental revenue and ancillary rental income $ 15,278 $ 16,298 (6%)
Operating expenses $ 6,237 $ 5,503 13%
Net operating income $ 9,041 $ 10,795 (16%)
Weighted average number of units 5,715 5,516 4%
Average rent per unit per month $ 891 $ 985 (10%)
Operating cost per unit per month $ 364 $ 333 9%
Average vacancy rate 12.4% 8.3%
Operating margin 59% 66%
MAINSTREET EQUITY CORP.12
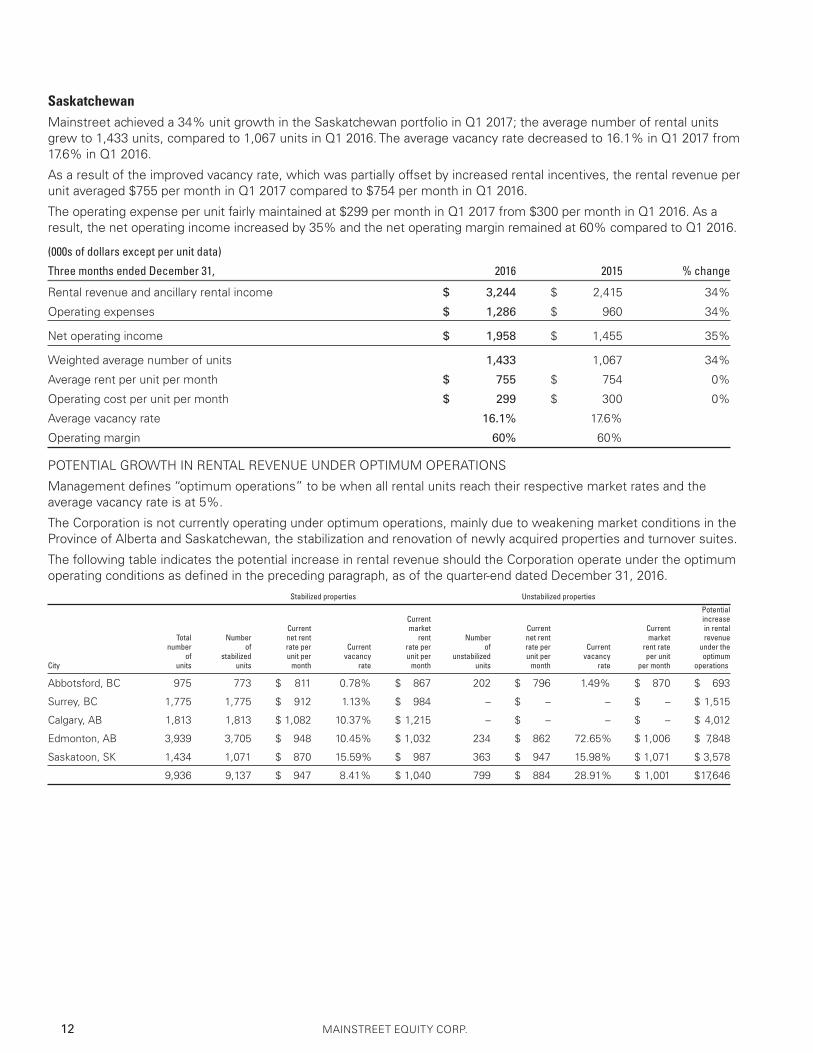
SaskatchewanMainstreet achieved a 34% unit growth in the Saskatchewan portfolio in Q1 2017; the average number of rental units grew to 1,433 units, compared to 1,067 units in Q1 2016. The average vacancy rate decreased to 16.1% in Q1 2017 from 17.6% in Q1 2016.
As a result of the improved vacancy rate, which was partially offset by increased rental incentives, the rental revenue per unit averaged $755 per month in Q1 2017 compared to $754 per month in Q1 2016.
The operating expense per unit fairly maintained at $299 per month in Q1 2017 from $300 per month in Q1 2016. As a result, the net operating income increased by 35% and the net operating margin remained at 60% compared to Q1 2016.
(000s of dollars except per unit data)
Three months ended December 31, 2016 2015 % change
Rental revenue and ancillary rental income $ 3,244 $ 2,415 34%
Operating expenses $ 1,286 $ 960 34%
Net operating income $ 1,958 $ 1,455 35%
Weighted average number of units 1,433 1,067 34%
Average rent per unit per month $ 755 $ 754 0%
Operating cost per unit per month $ 299 $ 300 0%
Average vacancy rate 16.1% 17.6%
Operating margin 60% 60%
POTENTIAL GROWTH IN RENTAL REVENUE UNDER OPTIMUM OPERATIONS
Management defines “optimum operations” to be when all rental units reach their respective market rates and the average vacancy rate is at 5%.
The Corporation is not currently operating under optimum operations, mainly due to weakening market conditions in the Province of Alberta and Saskatchewan, the stabilization and renovation of newly acquired properties and turnover suites.
The following table indicates the potential increase in rental revenue should the Corporation operate under the optimum operating conditions as defined in the preceding paragraph, as of the quarter-end dated December 31, 2016. Stabilized properties Unstabilized properties
Potential Current increase Current market Current Current in rental Total Number net rent rent Number net rent market revenue number of rate per Current rate per of rate per Current rent rate under the of stabilized unit per vacancy unit per unstabilized unit per vacancy per unit optimum City units units month rate month units month rate per month operations
Abbotsford, BC 975 773 $ 811 0.78% $ 867 202 $ 796 1.49% $ 870 $ 693
Surrey, BC 1,775 1,775 $ 912 1.13% $ 984 – $ – – $ – $ 1,515
Calgary, AB 1,813 1,813 $ 1,082 10.37% $ 1,215 – $ – – $ – $ 4,012
Edmonton, AB 3,939 3,705 $ 948 10.45% $ 1,032 234 $ 862 72.65% $ 1,006 $ 7,848
Saskatoon, SK 1,434 1,071 $ 870 15.59% $ 987 363 $ 947 15.98% $ 1,071 $ 3,578
9,936 9,137 $ 947 8.41% $ 1,040 799 $ 884 28.91% $ 1,001 $ 17,646
Q1 2017 13
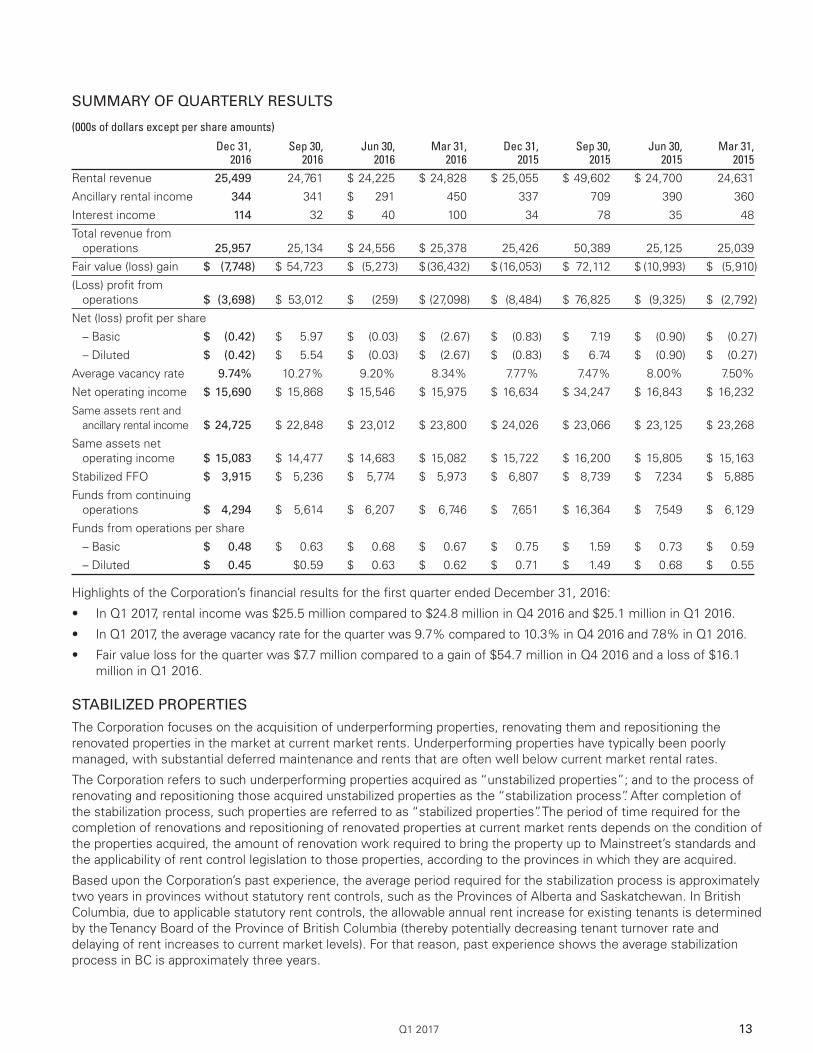
SUMMARY OF QUARTERLY RESULTS
(000s of dollars except per share amounts)
Dec 31, Sep 30, Jun 30, Mar 31, Dec 31, Sep 30, Jun 30, Mar 31, 2016 2016 2016 2016 2015 2015 2015 2015
Rental revenue 25,499 24,761 $ 24,225 $ 24,828 $ 25,055 $ 49,602 $ 24,700 24,631
Ancillary rental income 344 341 $ 291 450 337 709 390 360
Interest income 114 32 $ 40 100 34 78 35 48
Total revenue from operations 25,957 25,134 $ 24,556 $ 25,378 25,426 50,389 25,125 25,039
Fair value (loss) gain $ (7,748) $ 54,723 $ (5,273) $ (36,432) $ (16,053) $ 72,112 $ (10,993) $ (5,910)
(Loss) profit from operations $ (3,698) $ 53,012 $ (259) $ (27,098) $ (8,484) $ 76,825 $ (9,325) $ (2,792)
Net (loss) profit per share
– Basic $ (0.42) $ 5.97 $ (0.03) $ (2.67) $ (0.83) $ 7.19 $ (0.90) $ (0.27)
– Diluted $ (0.42) $ 5.54 $ (0.03) $ (2.67) $ (0.83) $ 6.74 $ (0.90) $ (0.27)
Average vacancy rate 9.74% 10.27% 9.20% 8.34% 7.77% 7.47% 8.00% 7.50%
Net operating income $ 15,690 $ 15,868 $ 15,546 $ 15,975 $ 16,634 $ 34,247 $ 16,843 $ 16,232
Same assets rent and ancillary rental income $ 24,725 $ 22,848 $ 23,012 $ 23,800 $ 24,026 $ 23,066 $ 23,125 $ 23,268
Same assets net operating income $ 15,083 $ 14,477 $ 14,683 $ 15,082 $ 15,722 $ 16,200 $ 15,805 $ 15,163
Stabilized FFO $ 3,915 $ 5,236 $ 5,774 $ 5,973 $ 6,807 $ 8,739 $ 7,234 $ 5,885
Funds from continuing operations $ 4,294 $ 5,614 $ 6,207 $ 6,746 $ 7,651 $ 16,364 $ 7,549 $ 6,129
Funds from operations per share
– Basic $ 0.48 $ 0.63 $ 0.68 $ 0.67 $ 0.75 $ 1.59 $ 0.73 $ 0.59
– Diluted $ 0.45 $0.59 $ 0.63 $ 0.62 $ 0.71 $ 1.49 $ 0.68 $ 0.55
Highlights of the Corporation’s financial results for the first quarter ended December 31, 2016:
• In Q1 2017, rental income was $25.5 million compared to $24.8 million in Q4 2016 and $25.1 million in Q1 2016.
• In Q1 2017, the average vacancy rate for the quarter was 9.7% compared to 10.3% in Q4 2016 and 7.8% in Q1 2016.
• Fair value loss for the quarter was $7.7 million compared to a gain of $54.7 million in Q4 2016 and a loss of $16.1 million in Q1 2016.
STABILIZED PROPERTIES
The Corporation focuses on the acquisition of underperforming properties, renovating them and repositioning the renovated properties in the market at current market rents. Underperforming properties have typically been poorly managed, with substantial deferred maintenance and rents that are often well below current market rental rates.
The Corporation refers to such underperforming properties acquired as “unstabilized properties”; and to the process of renovating and repositioning those acquired unstabilized properties as the “stabilization process”. After completion of the stabilization process, such properties are referred to as “stabilized properties”. The period of time required for the completion of renovations and repositioning of renovated properties at current market rents depends on the condition of the properties acquired, the amount of renovation work required to bring the property up to Mainstreet’s standards and the applicability of rent control legislation to those properties, according to the provinces in which they are acquired.
Based upon the Corporation’s past experience, the average period required for the stabilization process is approximately two years in provinces without statutory rent controls, such as the Provinces of Alberta and Saskatchewan. In British Columbia, due to applicable statutory rent controls, the allowable annual rent increase for existing tenants is determined by the Tenancy Board of the Province of British Columbia (thereby potentially decreasing tenant turnover rate and delaying of rent increases to current market levels). For that reason, past experience shows the average stabilization process in BC is approximately three years.

MAINSTREET EQUITY CORP.14
As of December 31, 2016, 214 properties (9,137 units) out of 228 properties (9,936 units) were stabilized. The following table summarizes the change of the Corporation’s stabilized and unstabilized units since the beginning of fiscal year 2017. October 1, Up to current period Number of Dec. 31, 2016 Acquisition Disposition units stabilized 2016
Stabilized units 8,714 – – 423 9,137 Unstabilized units 1,164 58 – (423) 799 Total units 9,878 58 – – 9,936
The following table summarizes the progress of the Corporation’s stabilization progress since the beginning of fiscal year 2017. No. of unstabilized No. of units units acquired/ stabilized disposed during Oct. 1, 2016 during the period the period Dec. 31, 2016
Numbers of unstabilized units held for renovation 1,164 (423) 58 799
Numbers of unstabilized units held for redevelopment – – – –
Total no. of unstabilized units 1,164 (423) 58 799
Number of months
Average time spent on stabilization 13 25 1 11
Estimated remaining time for stabilization 17 – 23 16
During the three month period ended December 31, 2016, the Corporation acquired 58 unstabilized units in Edmonton, Alberta that required substantial renovation and with rents considered well below the market for stabilized units. The Corporation has stabilized 423 units with renovation work substantially completed, resulting in rent increases to or near current market levels.
FUNDS FROM OPERATIONS OF STABILIZED PROPERTIES
For Q1 2017, FFO from operations of Mainstreet’s stabilized property portfolio amounted to $3.9 million ($0.44 per basic share and $0.41 per fully diluted share).
(000s of dollars except per share amounts) Stabilized Unstabilized Three months ended December 31, 2016 properties properties Total
Rental and ancillary rental income $ 24,267 $ 1,576 $ 25,843
Property operating expenses 9,470 683 10,153
Net operating income $ 14,797 $ 893 $ 15,690
Operating margin 61% 57% 61%
Vacancy rate 8.3% 27.0% 9.8%
Interest income $ 105 $ 9 $ 114
General & administrative expenses 2,207 191 2,398
Mortgage interest 8,050 255 8,305
Financing cost 730 77 807
Funds from operations $ 3,915 $ 379 $ 4,294
Funds from operations per share
– Basic $ 0.44 $ 0.04 $ 0.48
– Diluted $ 0.41 $ 0.04 $ 0.45
Weighted average number of shares
– Basic 8,883,333
– Diluted 9,571,308

Q1 2017 15
In Q1 2017, FFO of the stabilized property portfolio decreased 42% to $3.9 million as compared to $6.8 million in Q1 2016, while the number of stabilized units increased by 11% to 9,137 units as of December 31, 2016 compared to 8,243 units as of December 31, 2015. Excluding the one time pay-out penalties of $1.9 million, FFO of the stabilized portfolio decreased 12% to $5.8 million as compared to $6.6 in Q1 2016.
(000s of dollars) Three months ended December 31, 2016 2015 % change
Stabilized FFO $ 3,915 $ 6,807 (42%)
Number of stabilized units 9,137 8,243 11%
LIQUIDITY & CAPITAL RESOURCES
Working Capital Requirement
Mainstreet requires sufficient working capital to cover day-to-day operating and mortgage expenses as well as income tax payments. In Q1 2017, after payments of all required expenses, the Corporation generated funds from operations of $4.3 million.
Management expects funds generated from operations will continue to grow when more units are renovated and re-introduced to the market at higher rental rates and management believes that these funds should be sufficient to meet the Corporation’s working capital requirements on a year-to-year basis going forward.
Other Capital Requirements
Mainstreet also needs sufficient capital to finance continued growth and capital improvement. In Q1 2017, the Corporation spent approximately $5.0 million on capital improvement. Management expects the following capital resources to be sufficient to meet the capital requirements on a year-to-year basis.
Financing
Debt financing after property stabilization and maturity of initial loans is a cornerstone of Mainstreet’s business strategy. Management believes this unlocks the value added through stabilization and liberates capital for future growth. Management also believes this mitigates the risk of anticipated interest rate hikes and minimizes the costs of borrowing. Mainstreet continually refinances as much floating and maturing debt as possible into long-term, primarily CMHC insured mortgages at lower interest rates.
In Q1 2017, Mainstreet refinanced $50.1 million in pre-maturity debt with an average interest rate of 5.24% into mostly 10-year long-term CMHC-insured mortgage loans for $101.5 million at an average interest rate of 2.44%. Mainstreet also refinanced four clear title assets with a 10-year long-term CMHC-insured mortgage loans for $39.8 million at an interest rate of 2.34%.These financings resulted in an annualized interest savings of $1.5 million and raised $89 million in additional funds after pay-out penalties.
Mainstreet also takes advantage of current low interest rates by continuing to evaluate the financial viability of early refinancing on the remaining mortgages maturing in 2017 and 2018 taking into consideration pay-out penalties, should savings opportunities arise.
Subsequent to the quarter ended December 31, 2016, approval has been obtained from the CMHC to refinance $10 million in pre-maturity mortgage loans with an average interest rate of 4.95% to long-term, 10-year CMHC insured mortgages for $19 million at an average interest rate of 2.78%. These refinancings will raise $9 million in additional funds after payment penalties of $185,000, resulting in an annualized savings in interest expenses of approximately $218,000.
Mainstreet also obtained approval of a $28 million 10-year CMHC-insured mortgage on eight clear titled assets at an estimated average interest rate of 2.9%.
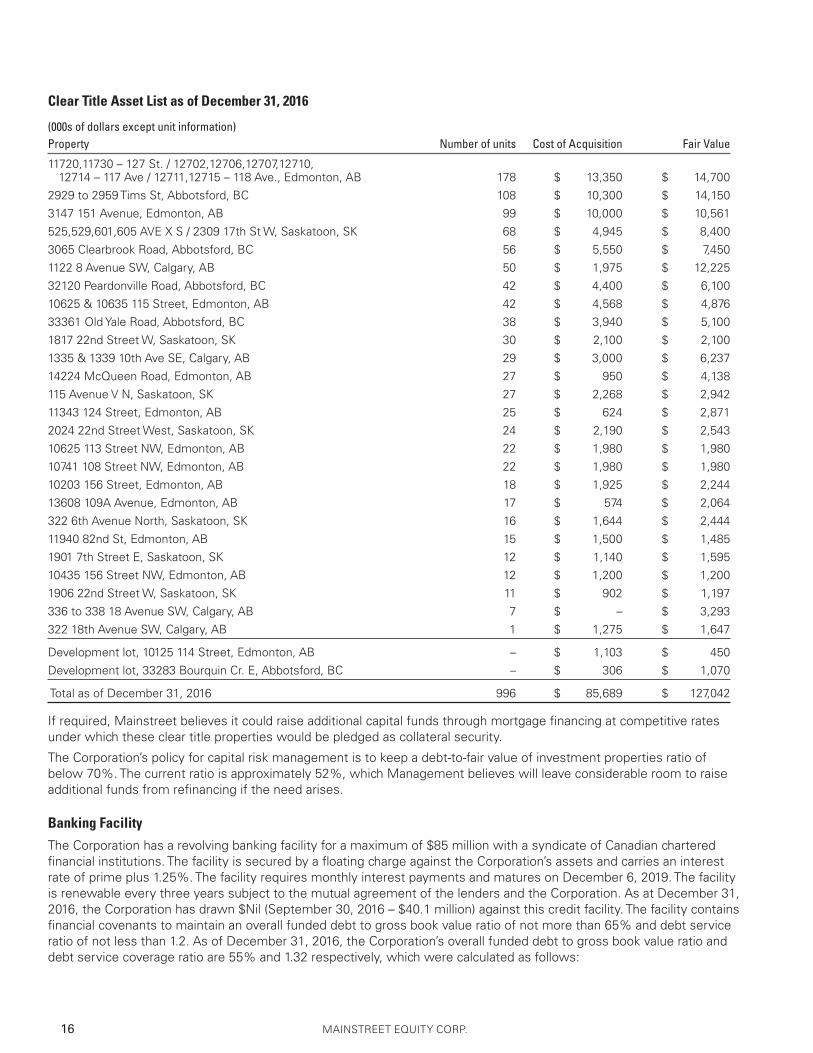
As of December 31, 2016, the Corporation owned title to the following 26 clear title properties and two development lots having an aggregate fair value of approximately $127 million:
MAINSTREET EQUITY CORP.16
Clear Title Asset List as of December 31, 2016
(000s of dollars except unit information) Property Number of units Cost of Acquisition Fair Value
11720,11730 – 127 St. / 12702,12706,12707,12710, 12714 – 117 Ave / 12711,12715 – 118 Ave., Edmonton, AB 178 $ 13,350 $ 14,700
2929 to 2959 Tims St, Abbotsford, BC 108 $ 10,300 $ 14,150
3147 151 Avenue, Edmonton, AB 99 $ 10,000 $ 10,561
525,529,601,605 AVE X S / 2309 17th St W, Saskatoon, SK 68 $ 4,945 $ 8,400
3065 Clearbrook Road, Abbotsford, BC 56 $ 5,550 $ 7,450
1122 8 Avenue SW, Calgary, AB 50 $ 1,975 $ 12,225
32120 Peardonville Road, Abbotsford, BC 42 $ 4,400 $ 6,100
10625 & 10635 115 Street, Edmonton, AB 42 $ 4,568 $ 4,876
33361 Old Yale Road, Abbotsford, BC 38 $ 3,940 $ 5,100
1817 22nd Street W, Saskatoon, SK 30 $ 2,100 $ 2,100
1335 & 1339 10th Ave SE, Calgary, AB 29 $ 3,000 $ 6,237
14224 McQueen Road, Edmonton, AB 27 $ 950 $ 4,138
115 Avenue V N, Saskatoon, SK 27 $ 2,268 $ 2,942
11343 124 Street, Edmonton, AB 25 $ 624 $ 2,871
2024 22nd Street West, Saskatoon, SK 24 $ 2,190 $ 2,543
10625 113 Street NW, Edmonton, AB 22 $ 1,980 $ 1,980
10741 108 Street NW, Edmonton, AB 22 $ 1,980 $ 1,980
10203 156 Street, Edmonton, AB 18 $ 1,925 $ 2,244
13608 109A Avenue, Edmonton, AB 17 $ 574 $ 2,064
322 6th Avenue North, Saskatoon, SK 16 $ 1,644 $ 2,444
11940 82nd St, Edmonton, AB 15 $ 1,500 $ 1,485
1901 7th Street E, Saskatoon, SK 12 $ 1,140 $ 1,595
10435 156 Street NW, Edmonton, AB 12 $ 1,200 $ 1,200
1906 22nd Street W, Saskatoon, SK 11 $ 902 $ 1,197
336 to 338 18 Avenue SW, Calgary, AB 7 $ – $ 3,293
322 18th Avenue SW, Calgary, AB 1 $ 1,275 $ 1,647
Development lot, 10125 114 Street, Edmonton, AB – $ 1,103 $ 450
Development lot, 33283 Bourquin Cr. E, Abbotsford, BC – $ 306 $ 1,070
Total as of December 31, 2016 996 $ 85,689 $ 127,042
If required, Mainstreet believes it could raise additional capital funds through mortgage financing at competitive rates under which these clear title properties would be pledged as collateral security.
The Corporation’s policy for capital risk management is to keep a debt-to-fair value of investment properties ratio of below 70%. The current ratio is approximately 52%, which Management believes will leave considerable room to raise additional funds from refinancing if the need arises.
Banking Facility
The Corporation has a revolving banking facility for a maximum of $85 million with a syndicate of Canadian chartered financial institutions. The facility is secured by a floating charge against the Corporation’s assets and carries an interest rate of prime plus 1.25%. The facility requires monthly interest payments and matures on December 6, 2019. The facility is renewable every three years subject to the mutual agreement of the lenders and the Corporation. As at December 31, 2016, the Corporation has drawn $Nil (September 30, 2016 – $40.1 million) against this credit facility. The facility contains financial covenants to maintain an overall funded debt to gross book value ratio of not more than 65% and debt service ratio of not less than 1.2. As of December 31, 2016, the Corporation’s overall funded debt to gross book value ratio and debt service coverage ratio are 55% and 1.32 respectively, which were calculated as follows:

Q1 2017 17
Overall funded debt to gross book value ratio
(000s of dollars)
As at December 31, 2016
Total funded debt
Mortgages payable $ 803,477
Bank indebtedness –
$ 803,477
Gross book value of assets
Investment properties $ 1,462,665
Property, plant and equipment 4,840
$ 1,467,505
Overall funded debt to gross book value ratio 55%
Debt service coverage ratio
Earnings before interest, tax, depreciation and amortization For 12 months ended December 31, 2016
Net income $ 21,957
Add (deduct):
Mortgage interest 28,052
Income tax 5,802
Depreciation 372
Amortization of finance cost 2,624
Fair value gain (5,270)
$ 53,537
Principal and interest payments $ 40,582
Debt service coverage ratio 1.32
CONTRACTUAL OBLIGATIONS
As of December 31, 2016, the Corporation had the following contractual obligations, which are anticipated to be met using the existing revolving credit facility, funds from operations and proceeds from the refinancing of maturing and floating mortgage loans.
PAYMENTS DUE BY PERIOD
Estimated principal payments required to retire the mortgage obligations as of December 31, 2016 are as follows: 12 months ending December 31, Amount
2017 $ 28,257
2018 40,666
2019 34,625
2020 74,320
2021 60,004
Subsequent 585,209
823,081
Deferred financing costs (19,604)
$ 803,477

MAINSTREET EQUITY CORP.18
LONG-TERM DEBT
(000s of dollars)
Average Amount % of debt interest rate (%)
Fixed rate debt
– CMHC-insured $ 795,534 97% 3.09%
– non-CMHC-insured $ 27,547 3% 3.62%
Total fixed rate debt $ 823,081 100% 3.10%
Deferred financing costs $ (19,604)
$ 803,477
Mainstreet’s long-term debt consists of low-rate, fixed-term mortgage financing. All individual mortgages are secured with their respective real estate assets. Based largely on the fair value of properties, Management believes this financing reflects the strength of its property portfolio. The maturity dates for this debt are staggered to mitigate overall interest rate risk.
As of December 31, 2016, total mortgages payable was $803 million compared to $714 million on September 30, 2016 – an increase of 12% due to financing activity during the three months ended December 31, 2016.
At December 31, 2016, Management believes the Corporation’s financial position to be stable, with overall mortgage levels reported at 55% of fair value of investment properties. About 97% of the Corporation’s mortgage portfolio was CMHC-insured, providing Mainstreet with interest rates lower than those available through conventional financing.
To maintain cost-effectiveness and flexibility of capital, Mainstreet continually monitors short-term and long-term interest rates. When doing so is expected to provide a benefit, the Corporation intends to convert short-term floating-rate debt to long-term, CMHC-insured fixed-rate debt.
MORTGAGE MATURITY SCHEDULE
(000s of dollars) Balance % of debt Weighted average Maturing during the following financial year end maturing maturing rate on expiry (%)
2017 $ 12,895 2% 4.96%
2018 $ – 0% 0.00%
2019 $ 29,451 4% 5.06%
2020 $ 48,068 6% 3.66%
2021 $ 74,705 9% 3.98%
Subsequent $ 657,962 79% 2.84%
$ 823,081 100% 3.10%
The average maturing term of mortgage loans is 7.8 years as of December 31, 2016 compared to 7.0 years as of September 30, 2016.
All mortgage loans maturing in 2017 are expected to be refinanced to long-term CMHC-insured mortgages by the end of the fiscal year 2017.
INTERNAL CONTROL
Disclosure controls and procedures (“DC & P”) are designed to provide reasonable assurances that all material information is gathered and reported to senior management of the Corporation, including the Chief Executive Officer (“CEO”) and the Chief Financial Officer (“CFO”) on a timely basis and that all information required to be disclosed in Mainstreet’s annual filings, interim filings or other reports filed or submitted by it under securities legislation is recorded, processed, summarized and reported within the time periods specified in securities legislation.
The preparation of this information is supported by an internal control and procedure framework designed by management to provide reasonable assurances regarding the reliability of financial reporting and the preparation of financial statements for external purposes in accordance with IFRS. The control and procedure framework related to the Corporation’s Internal Control over Financial Reporting (“ICFR”) and DC&P were designed in accordance with Risk

Q1 2017 19
Management and Governance – Guidance on Control, published by the Canadian Institute of Chartered Accountants and the requirements of National Instrument 52 109 of the Canadian Securities Administrators entitled, “Certification of Disclosure in Issuer’s Annual and Interim Filings”.
In Q1 2017, the CEO and the CFO evaluated, or caused to be evaluated under their supervision, the effectiveness of the Corporation’s DC&P and ICFR as at December 31, 2016. This evaluation confirmed that the Corporation’s DC&P and ICFR were effective as at December 31, 2016.
No changes were made to the Corporation’s DC & P during the quarter ended December 31, 2016.
As at December 31, 2016, Mainstreet confirmed the design of ICFR to provide reasonable assurances regarding the reliability of the financial reporting and the preparation of financial statements and information for external purposes in accordance with IFRS and that the ICFR operated effectively throughout the reported period. The Corporation may, from time to time, make changes aimed at enhancing their effectiveness and ensuring that these systems evolve with the Corporation’s business. There were no changes in the Corporation’s ICFR during the quarter ended December 31, 2016, which have materially affected, or are reasonably likely to materially affect, the Corporation’s ICFR.
Financial Instruments & Risk Management
Fair value of financial assets and liabilities
The Corporation’s financial assets and liabilities comprise restricted cash, cash and cash equivalents, trade and other receivables, mortgages receivable, bank indebtedness, mortgages payable, trade and other payables, and refundable security deposits. Fair values of financial assets and liabilities, summarized information related to risk management positions, and discussion of risks associated with financial assets and liabilities are presented as follows.
The fair values of restricted cash, cash and cash equivalents, trade and other receivables, bank indebtedness, trade and other payables, and refundable security deposits approximate their carrying amounts due to the short-term maturity of those instruments.
The fair values of mortgages receivable and payable are determined using the current market interest rates as discount rates, the net present value of principal balances and future cash flows over the terms of the mortgages. In identifying the appropriate level of fair value, the Corporation performs a detailed analysis of financial assets and liabilities. The inputs used to measure fair value determine different levels of the fair value hierarchy categorized as follows:
– Level 1: Values based on unadjusted quoted prices in active markets that are accessible at the measurement date for identical assets or liabilities;
– Level 2: Values based on quoted prices in markets that are not active or model inputs that are observable either directly or indirectly for substantially the full term of the asset or liability; and
– Level 3: Values based on valuation techniques for which any significant input is not based on observable market data.
The fair values of financial assets and liabilities were as follows:
(000s of dollars)
December 31, 2016 September 30, 2016
Carrying Fair Carrying Fair amount value amount value
Financial assets:
Restricted cash Level 1 $ 2,674 $ 2,674 $ 2,858 $ 2,858
Cash and cash equivalents Level 1 44,707 44,707 1,095 1,095
Trade and other receivables Level 2 1,381 1,381 1,614 1,614
Mortgage receivable Level 2 – – 2,500 2,498
Financial liabilities:
Bank indebtedness Level 1 – – 40,148 40,148
Mortgages payable Level 2 803,477 822,519 714,481 769,086
Trade and other payables Level 2 5,766 5,766 6,898 6,898
Refundable security deposits Level 1 4,007 4,007 4,100 4,100

MAINSTREET EQUITY CORP.20
The Corporation’s non-financial assets comprise investment properties. The fair values of non-financial assets were as follows:
(000s of dollars) December 31, 2016 September 30, 2016
Carrying Fair Carrying Fair amount value amount value
Non-financial assets:
Investment properties Level 3 $ 1,462,665 $ 1,462,665 $ 1,460,080 $ 1,460,080
Risk Associated with Financial Assets & Liabilities
The Corporation is exposed to risks arising from its financial assets and liabilities. These include market risk related to interest rates, credit risk and liquidity risk. For detailed explanations of these risks, refer to the section entitled “Risk Assessment and Management”.
SHARE CAPITALAuthorized:
Unlimited number of common voting shares with no par value
Unlimited number of preferred shares with no par value
Issued, outstanding and fully paid: Three months ended December 31, 2016 Year ended September 30, 2016
Number of Amount Number of Amount common shares (000s) common shares (000s)
Issued and outstanding,
– beginning of the period 8,883,333 $ 24,315 10,271,251 $ 28,114
Shares purchased for cancellation – – (1,387,918) (3,799)
Issued and outstanding,
– end of the period 8,883,333 $ 24,315 8,883,333 $ 24,315
All common shares share an equal right to dividends.
On May 30, 2016, the Corporation obtained approval from the Toronto Stock Exchange (“TSX”) to repurchase up to 487,890 common shares under a Normal Course Issuer Bid (“NCIB”) commencing June 1, 2016. The Corporation’s previous NCIB expired on April 20, 2016. During the three months ended December 31, 2016 and 2015, the Corporation purchased and cancelled Nil shares (2016 – 138,336) common share under the NCIB at an average price of $Nil per common share (2016 – $31.72).
On April 22, 2016, Mainstreet purchased for cancellation 1.2 million of its common shares at a purchase price of $36 per common share for an aggregate purchase price of $43.2 million (not including fees and expenses), pursuant to a substantial issuer bid made in accordance with applicable securities laws.
Given the discount between its current trading share price and net asset value (“NAV”), Management believes that the re-purchase of its common shares is returning capital to shareholders in a tax-efficient manner that is accretive to NAV. Mainstreet will continue to assess on an ongoing basis as to whether increased purchases of its common shares is warranted.
STOCK OPTION
A summary of the Corporation’s stock option plan as of December 31, 2016, and September 30, 2016 and changes during the periods are presented below: December 31, 2016 September 30, 2016
Number Weighted average Number Weighted average Stock option of shares exercise price of shares exercise price
Outstanding and exercisable – beginning of the period 828,200 $ 5.51 828,200 $ 5.51
Outstanding and exercisable – end of the period 828,200 $ 5.51 828,200 $ 5.51
Weighted average contractual life-years 2.19 2.44
Prices $ 5.51 $ 5.51
Q1 2017 21
Under the stock option plan adopted by the shareholders on April 24, 2007 and renewed on March 26, 2010, March 21, 2013 and March 18, 2016, the Corporation may grant options to its directors, officers, employees and consultants of the Corporation, subsidiary and affiliated company for up to 20% of the issued and outstanding common shares until but not after March 26, 2017. The exercise price of the option shall equal the market-trading price of the Corporation’s common share on the date of grant. The stock options are fully vested at the time of issue. The fair value of the stock options is determined at the date of grant using the Black-Scholes Model. The assumptions used in determining the fair value of the stock options included estimated risk free interest rate; expected life of the stock options; expected volatility rate and expected dividend rate. The fair value is recognized as stock compensation expense over the vesting period of the options with a corresponding increase to contributed surplus. Any consideration received by the Corporation on exercise of stock options is credited to share capital as well as the amounts previously credited to contributed surplus for services rendered that were charged to compensation cost. The stock option plan will remain in place until the termination of the annual general meeting of the Corporation in 2019 unless renewed and approved by the shareholders of the Corporation on or before that date, provided that no further stock option may be granted under the stock option plan after March 26, 2017.
Shareholder Rights Plan
Effective February 21, 2013, the board of directors of the Corporation approved the adoption of a shareholder rights plan agreement (the “Rights Plan”) dated February 21, 2013 between the Corporation and Computershare Trust Company of Canada. The Rights Plan was ratified and approved by shareholders of the Corporation on March 21, 2013 and subsequently amended and renewal by the shareholders of the Corporation on March 18, 2016.
Until recently securities legislation in Canada required a take over bid to be open for at least 35 days, resulting in the board of directors of the Corporation being concerned that this was too short a period of time for companies that are subject to unsolicited take over bids to be able to respond to ensure that shareholders are offered full and fair value for their shares. The Rights Plan is designed to give the Corporation’s shareholders sufficient time to properly assess a take over bid without undue pressure and to give the board of directors time to consider alternatives designed to allow the Corporation’s shareholders to receive full and fair for their common shares.
The Rights Plan is not intended to prevent a take over bid or deter offers for the common shares of the Corporation. It is designed to encourage any bidder to provide shareholders with equal treatment and full and fair value for their common shares.
Immediately upon the Rights Plan coming into effect, one right (“Right”) was issued and attached to each common share of the Corporation outstanding and will continue to attach to each common share subsequently issued.
The Rights will separate from the common shares of the Corporation and will be exercisable on the close of business on the 10th trading day after the earlier of the date on which a person has acquired 20% or more of, or a person commences or announces a take over bid for, the Corporation’s outstanding common shares, other than an acquisition pursuant to a Permitted Bid or a Competing Permitted Bid as such terms are defined under the Rights Plan.
The acquisition by a person of 20% or more of the common shares of the Corporation is referred to as a “Flip In Event”. When a Flip In Event occurs, each Right (except for Rights beneficially owned by an Acquiring Person or certain transferees of an Acquiring Person, which Right will be void pursuant to the Rights Plan) becomes a right to purchase from the Corporation, upon exercise thereof, in accordance with the terms of the Rights Plan, that number of common shares having an aggregate market price on the date of consummation or occurrence of such Flip In Event equal to twice the Exercise Price for an amount in cash equal to the Exercise Price. The Exercise Price for the Rights provided in the Rights Plan is $100. As an example, if at the time of the Flip-in Event the Common Shares have a market price of $25, the holder of each Right would be entitled to receive $200 (twice the Exercise Price) in market value of the Common Shares (8 Common Shares) for $100, ie. at a 50% discount.
Certain exemptions exist under the Rights Plans for Portfolio Managers and Grandfathered Persons as such terms are defined in the Rights Plan.
A complete copy of the Rights Plan as amended and renewed, including the specific provisions thereof, is available under the Corporation’s profile filed on SEDAR.
Key accounting estimates and assumptions
The following are the key accounting estimates and assumptions concerning the future, and other key sources of estimation uncertainty at the end of the reporting period that have significant risk of causing a material adjustment to the carrying amounts of assets and liabilities within the next financial year:

MAINSTREET EQUITY CORP.22
i) Significant estimates used in determining the fair value of investment properties include capitalization rates, market rent, vacancy rate and operating expenses. A change to any one of these inputs could significantly alter the fair value of an investment property;
ii) Significant estimates used in determining the fair value of financial instruments include the discount rate used to discount the future cash flows for similar loans with similar credit ratings and the same maturities;
iii) Significant estimates used in determining the fair value of share-based compensation include the estimated risk free interest rate, expected life of the stock options, expected volatility rate of and expected dividend rates;
iv) Allocation of purchase cost in the acquisition of property, plant and equipment into different components, estimation of their useful life and impairment on property, plant and equipment; and
v) The amount of temporary differences between the book carrying value of the assets and liabilities versus the tax basis values and the future income tax rate at which these differences will be realized.
Actual results could differ from estimates.
Transactions with Related Parties
a) The President and Chief Executive Officer receives commissions at commercial rates in his capacity as a licensed broker for the property transactions conducted by the Corporation in its normal course of business. Commissions are determined on an exchange value basis. These commissions are not incurred or paid by the Corporation but rather by the other selling party or parties to the transaction. The commissions received during the three months ended December 31, 2016 were $51,600 (2016 – $Nil) and form part of the President and Chief Executive Officer’s total remuneration for the year.
b) The Corporation paid legal and professional fees and reimbursements for the transactions conducted by the Corporation in its normal course of business for the three months ended December 31, 2016 amounting to $113,000 (2016 – $29,000) to a law firm of which a director and officer of the Corporation is a partner. Professional fees and reimbursements are determined on an exchange value basis. As at December 31, 2016, the amounts payable to the law firm were $800 (September 30, 2016 – $600).
Off Balance Sheet Arrangements
No off balance sheet arrangement was made by the Corporation for Q1 2017.
Subsequent Events
Subsequent to the quarter ended December 31, 2016, the Corporation acquired 15 residential units in Calgary, Alberta, 199 residential units in Edmonton, Alberta and 31 residential units in Saskatoon, Saskatchewan for a total consideration of $23 million.
Subsequent to the quarter ended December 31, 2016, approval has been obtained from the CMHC to refinance $10 million in pre-maturity mortgage loans with an average interest rate of 4.95% to long-term, 10-year CMHC insured mortgages for $19 million at an average interest rate of 2.78%. Mainstreet also obtained approval of a $28 million 10-year CMHC-insured mortgage on eight clear titled assets at an estimated average interest rate of 2.9%.
Mainstreet has accepted an offer to settle the insurance claim on the fire damage of the property in Edmonton for $2.4 million.
Risk Assessment & Management
Management defines risk as the evaluation of the probability that an event that could negatively affect the financial condition or results of the Corporation may happen in the future. The following section describes specific and general risks that could affect the Corporation. As it is difficult to predict whether any risk will occur or what its related consequences might be, the actual effect of any risk on the business of the Corporation could be materially different than anticipated. The following discussion of risk does not include all possible risks as there may be other risks of which the Corporation is currently unaware.
Vacancy Risk
The Corporation is subject to tenant vacancy risk when, in some markets and under certain economic conditions, housing/condominiums are affordable, financing is readily available and interest rates are low, making it easier for renters to become homebuyers. This increases vacancy rates and decreases rental revenue cash flow.

Q1 2017 23
Vacancy rates can also be affected negatively by increased supply of multi-family units in the Corporation’s core markets. Numerous other residential developers and apartment owners compete for potential tenants. Although it is Mainstreet’s strategy to own multi-family residential properties in premier locations in each market in which it operates, some of the apartments or its competitors may be newer, better located or offer lower rents. In addition, an increase in alternative housing could have a material adverse effect on the Corporation’s ability to lease units and in the rents charged and could adversely affect the Corporation’s revenues and ability to meet its obligations.
Accordingly, the Corporation’s performance will always be affected by the supply and demand for multi-family rental real estate in Western Canada. The potential for reduced rental revenue exists in the event that Mainstreet is not able to maintain its properties at a high level of occupancy, or in the event of a downturn in the economy, which could result in lower rents or higher vacancy rates. Mainstreet has minimized these risks by:
• attempting to increase customer satisfaction;
• diversifying its portfolio across Western Canada, thus lowering its exposure to regional economic swings;
• acquiring properties only in desirable locations, where vacancy rates for properties are higher than city-wide averages but can be reduced by repositioning the properties through better management and selective upgrades;
• holding a balanced portfolio which includes a variety of multi-family building types including high-rise, townhouse, garden and walk-ups, each with its own market niche;
• maintaining a wide variety of suites, including bachelor suites, one, two and three bedroom units;
• building a broad and varied customer base, thereby avoiding economic dependence on larger-scale tenants;
• focusing on affordable multi-family housing, which is considered a stable commodity;
• advertising and offering competitive market pricing to attract new tenants;
• developing a specific rental program characterized by rental adjustments that are the result of enhanced services and superior product; and
• developing regional management teams with significant experience in the local marketplace, and combining this experience with its existing operations and management expertise.
Economic Uncertainty
Any worldwide or regional economic slowdown, stock market uncertainty and international political credit crisis or uncertainty could adversely impact the business and the future profitability of the Corporation. In addition, worldwide falling petroleum and natural gas commodity prices have resulted in an economic slowdown in Western Canada. During any period of economic uncertainty tenants may experience financial difficulty and may default in payment of rent or possibly look for less expensive accommodations. In addition, Mainstreet’s ability to obtain financing or renegotiate line of credit financing may be negatively affected.
Interest Risk
Mainstreet is exposed to interest rate risk to the extent of any upward revision in prime lending rates. Mortgages totalling approximately $13 million are subject to renewal in the next 12 months. Increases in the interest rate have the potential to adversely affect the profitability of the Corporation. However, the Corporation attempts to mitigate this risk by staggering the maturity dates of its mortgages. The majority of Mainstreet’s mortgages are insured by CMHC under the National Housing Association (“NHA”) mortgage program. This added level of insurance offered to lenders allows the Corporation to receive the best possible financing and interest rates, significantly reducing the possibility of a lender calling a loan prematurely.
Utilities Risk
Mainstreet’s business is exposed to fluctuating utility and energy costs such as electricity and natural gas (heating) prices. Management continues to monitor these costs very closely. In order to mitigate this risk, Mainstreet has entered into a rate-protected natural gas contract with a maturity date of November 30, 2019 that caps future natural gas costs at $3.50 per Gigajoule in Alberta, but permits the Corporation to purchase natural gas at lower market rates.
Risks of Real Estate Property Ownership
Real estate investments and projects are, generally, subject to numerous risks depending on the nature and location of the property that can affect attractiveness and sale ability of real estate assets to potential purchasers or other investors, or the owner’s use of such real estate assets, all of which are beyond the control of the Corporation. Such risks include:

MAINSTREET EQUITY CORP.24
• the highly competitive nature of the real estate industry;
• changes in general economic conditions (such as the availability and cost of the property or widespread fluctuations in adjacent property values);
• changes in general or local conditions (such as the supply of competing real estate assets or the possibility of competitive overbuilding or the inability to obtain full occupancy or other usage of any real estate assets);
• governmental regulation, rules or policies (such as increased taxation on the sale of or profits from real estate property, environmental legislation or municipal approvals for usage, development or subdivision); and
• changes in costs or operating expenses anticipated for real estate assets.
Each segment in the real estate industry is capital intensive and is typically sensitive to interest rates. Any proceeds generated by the sale of real estate assets depend upon general economic conditions and, accordingly, the ability to repay its financing may be affected by changes in those conditions. The Corporation will be required to make certain significant expenditures in respect of its business including, but not limited to, the payment of property taxes, mortgage payments, property management costs, insurance costs and related charges which must be made regardless of whether real estate assets are producing sufficient income to service such expenses. If the Corporation is unable or unwilling to meet the payment obligations on such loans, losses could be sustained as a result of the exercise by the lenders of their rights of foreclosure or sale. As a result, the Corporation’s ability to make interest payments or distributions of cash could be adversely affected.
In addition, real estate property investments are relatively illiquid. This illiquidity will tend to limit the ability of the Corporation to vary its property portfolio promptly in response to changes in economic or investment conditions. If the Corporation were required to quickly liquidate its assets, there is risk that the Corporation would realize sale proceeds of less than the stated value of the properties of the Corporation. The Corporation’s property portfolio is concentrated in British Columbia, Alberta and Saskatchewan. As a result, economic and real estate conditions in Western Canada will significantly affect the Corporation’s revenues and the value of its properties.
Renovation Risks
The Corporation is subject to the financial risk of having unoccupied units during extended periods of renovations. During renovations, these properties are unavailable for occupancy and do not generate income. Certain significant expenditures, including property taxes, maintenance costs, interest payments, insurance costs and related charges must be made throughout the period of ownership of real estate property regardless of whether the property is producing revenue. Delays in the renovation of a building or individual apartment units as a result of labour shortages and similar risks could delay the renting of such building or units resulting in an increased period of time where the building is not producing revenue or produces less revenue than a fully tenanted building. As the Corporation intends to source labour from other countries and renovation supplies directly from manufacturers in China and elsewhere, the Corporation will be subject to related immigration expenses, possible changes in laws related to the use of migrant or immigrant labour, shipping risks and currency fluctuations, all of which may result in unexpected or higher costs or possible delays. The Corporation intends to address these risks by acquiring financing to fund renovations, staggering renovations and by carrying out a detailed capital expenditures budget to monitor its cash position on a monthly basis. However, recent and possible new changes in federal immigration laws related to migrant or immigrant labour may have a negative impact regarding mitigating an increase in labour costs and expenses.
Credit Risk
Credit risk is the risk that the counterparty to a financial asset will default, resulting in a financial loss for the Corporation. The Corporation is exposed to credit risk as some tenants may experience financial difficulty and may default in payment of rent. However, the Corporation attempts to minimize possible risks by conducting in-depth credit assessments of all tenants and collecting security deposits from tenants. The Corporation’s tenants are numerous, which also reduces the concentration of credit risk. As tenants’ rent is due at the beginning of the month, all amounts in accounts receivable are considered overdue by the Corporation. As of December 31, 2016, rents due from current tenants amounted to $286,000 (September 30, 2016 – $336,000). The possibility of not receiving payment of rent due from current tenants was covered by security deposits of $4.0 million (September 30, 2016 – $4.1 million) and provisions for bad debts of $130,000 (September 30, 2016 – $130,000).
In relation to cash, cash equivalents and restricted cash, the Corporation believes that its exposure to credit risk is low. The Corporation places its cash, cash equivalents and restricted cash only with reputable Canadian financial institutions.
Q1 2017 25
Liquidity Risk
Liquidity risk is the risk that the Corporation will encounter difficulties in meeting its financial liability obligations. The Corporation manages its liquidity risk by monitoring forecast cash flows on a regular basis to meet expected operating expenses, by maintaining financial adequate banking facilities and by matching the maturity profiles of assets and liabilities.
Financing Risk
Mainstreet anticipates that it will make substantial capital expenditures for the acquisition of properties in the future. There can be no assurance that debt or equity financing or cash generated by operations will be available or sufficient to meet these requirements or for other corporate purposes or, if debt or equity financing is available, that it will be on terms acceptable to Mainstreet. Moreover, future activities may require Mainstreet to alter its capitalization significantly. The inability of Mainstreet to access sufficient capital for its operations could have a material adverse effect on Mainstreet’s financial condition, the result of its operations or its overall prospects.
Reliance on Key Employees
Mainstreet’s success depends in large measure on certain key executive personnel. The loss of the services of such key personnel could have a material adverse effect on the Corporation. Mainstreet does not have key person insurance in effect for management. The contributions of these individuals to the immediate operations are likely to be of central importance. In addition, competition for qualified personnel in the industry is intense, and there can be no assurance that the Corporation will be able to continue to attract and retain all personnel necessary for the development and operation of its business. Investors must rely upon the ability, expertise, judgment, discretion, integrity and good faith of the management of Mainstreet.
Income Tax Risk
Mainstreet intends to file all required income tax returns and believes that it will be in full compliance with the provisions of the Income Tax Act (Canada) and all applicable provincial tax legislation. However, such returns are subject to reassessment by the applicable taxation authority. In the event of a successful reassessment of Mainstreet, whether by re-characterization and development expenditures or otherwise, such reassessment may have an impact on current and future taxes payable.
Market Risks
The economic performance and value of the Corporation’s investments in real estate assets will be subject to all of the risks associated with investing in real estate, including, but not limited to:
• changes in the national, regional, provincial and local economic climates;
• local conditions, including an oversupply of properties or a reduction in demand for properties;
• the attractiveness of all or parts of real estate assets to renters or purchasers;
• competition from other available real estate assets and
• changes in laws and governmental regulations, including those governing usage, zoning, the environment and taxes.
The Corporation’s performance will be affected by the supply and demand for property in its geographic area(s) of ownership. Key drivers of demand include employment levels, population growth, demographic rents and consumer confidence. The potential for reduced rental revenue exists in the event that demand diminishes or supply becomes overabundant thereby driving down prices for real estate assets.
Acquisitions Risks
Mainstreet’s growth depends in large part on identifying suitable acquisition opportunities, pursuing such opportunities and consummating acquisitions. It is not possible to manage all risks associated with such acquisitions in the terms and conditions contained in commercial agreements pertaining to such acquisitions. The real estate assets may be subject to unknown, unexpected or undisclosed liabilities that may materially and adversely affect the Corporation’s operations, financial condition and results. The representations and warranties, if any, given by arm’s length third parties to the Corporation may not adequately protect against these liabilities and any recourse against third parties may be limited by the financial capacity of such third parties. Moreover, real estate assets acquired by the Corporation may not meet expectations of operational or financial performance due to unexpected costs associated with developing an acquired property, as well as the general investment risks inherent in any real estate investment.

MAINSTREET EQUITY CORP.26
Environmental, Health and Safety Matters
Under various environmental, health and safety laws, ordinances and regulations, the current or previous owner or operator of properties acquired or refinanced by the Corporation, may be liable for the costs of removal or remediation of hazardous or toxic substances on, under or in such properties. These costs could be substantial. Such laws could impose liability whether or not the Corporation knew of, or was responsible for, the presence of such hazardous or toxic substances when it acquired a property.
The presence of hazardous or toxic substances, or the failure to remove or remediate such substances, if any, or restrictions imposed by environmental, health and safety laws on the manner in which such properties may be operated or developed could adversely affect the Corporation’s ability to sell such properties and could potentially also result in claims against the Corporation.
Environmental, health and safety laws provide for sanctions for non compliance and may be enforced by governmental agencies or, in certain circumstances, by private parties. Certain environmental, health and safety laws and common law principles could be used to impose liability for release of and exposure to hazardous substances into the air. Third parties may seek recovery from real property owners or operators for personal injury or property damage associated with exposure to released hazardous substances. The cost of defending against claims of liability, of complying with environmental, health and safety regulatory requirements, of remediating any contaminated property or of paying personal injury claims could be substantial.
The Corporation may be subject to liability for undetected pollution or other environmental hazards against which it cannot insure, or against which it may elect not to insure where premium costs are disproportionate to the Corporation’s perception of relative risk. Such factors may have an adverse impact on the Corporation.
Mainstreet has policies and procedures to review and monitor environmental exposure, including the completion of environmental audits in connection with the Corporation’s due diligence procedures when looking at potential acquisitions when the Corporation deems if advisable.
Cyber Security Risk
Cyber security has become an increasingly issue for Corporations and businesses. Cyber-attack is an intentional attack can include gaining unauthorized access to information systems to disrupt business operations, corrupt data or steal confidential information. Such an attack could compromise Mainstreet, its employees and tenants’ confidential information , and third parties with whom Mainstreet interacts and may result in negative consequences, including remediation costs, loss of revenue, data corruption, additional regulatory scrutiny, litigation and reputational damage. As a result, Mainstreet has implemented processes, procedures and controls to help mitigate these risks, but these measures do not guarantee that Cyber-attack can be totally avoided due to increasing in sophistication of Cyber-attack.
Workforce Availability
Mainstreet’s ability to provide services to its existing tenants is somewhat dependent on the availability of well-trained employees and contractors to service such tenants as well as complete required maintenance and capital upgrades on its buildings. The Corporation must also balance requirements to maintain adequate staffing levels while balancing the overall cost to the Corporation.
Within Mainstreet, its most experienced employees are employed full-time; this full-time force is supplemented by, seasonal and full-time immigrant labour, additional part-time employees, and specific contract services needed by the Corporation. Mainstreet constantly reviews existing overall market factors to ensure that its compensation program is in line with existing levels of responsibility and, if warranted, adjusts the program accordingly. Mainstreet also encourages employees’ feedback in these areas to ensure existing programs are meeting their personal needs.
Uninsured Losses
The Corporation carries comprehensive general liability, fire, flood, earthquake, tornado, natural disaster, extended coverage, rental loss and vacancy insurance with policy specifications, limits and deductibles customarily carried for similar properties. However, there are certain types of risks, generally of a catastrophic nature, such as wars, terrorist attacks or environmental contamination, which are either uninsurable or not insurable on an economically viable basis. Should an uninsured or underinsured loss occur, the Corporation could lose its investment in, and anticipated profits and cash flows from, one or more of its properties, but would continue to be obligated to repay any recourse mortgage indebtedness on such properties.

Q1 2017 27
From time to time the Corporation may be subject to lawsuits as a result of the nature of its business. The Corporation intends to maintain business and property insurance policies in amounts and with such coverage and deductibles as are deemed appropriate, based on the nature and risks of the businesses, historical experience and industry standards. However, there can be no assurance that claims in excess of the insurance coverage or claims not covered by the insurance coverage will not arise or that the liability coverage will continue to be available on acceptable terms. A successful claim against the Corporation that is not covered by, or in excess of, the Corporation’s insurance could materially affect such entity’s operating results and financial condition, which would have an adverse effect on the Corporation. Claims against the Corporation, regardless of their merit or eventual outcome, will require the Corporation’s management to devote time to matters unrelated to the operation of the business. To the extent possible the Corporation intends to minimize these risks by creating a separate entity for each separate property to be acquired.
Substitutions for Residential Rental Units
Demand for residential rental properties is impacted by and inversely related to the relative cost of home ownership. The cost of home ownership depends upon, among other things, interest rates offered by financial institutions on mortgages and similar home financing transactions. Recently, interest rates offered by financial institutions for financing home ownership have been at very low levels. If the interest rates offered by financial institutions for home ownership financing remain low, demand for rental properties may be adversely affected. A reduction in the demand for rental properties may have a material adverse effect on the Corporation’s ability to lease suites and on the rents charged. This, in turn, may have a material adverse effect on the Corporation’s business, cash flows, financial condition and results from operations.
Litigation Risks
In the normal course of the Corporation’s operations, whether directly or indirectly, it may become involved in, named as a party to or the subject of, various legal proceedings, including regulatory proceedings, tax proceedings and legal actions relating to personal injuries, property damage, property taxes, land rights, the environment and contract disputes. The outcome with respect to outstanding, pending or future proceedings cannot be predicted with certainty and may be determined in a manner adverse to the Corporation and as a result, could have a material adverse effect on the Corporation’s assets, liabilities, business, financial condition and results from operations. Even if the Corporation prevails in any such legal proceeding, the proceedings could be costly and time consuming and may divert the attention of management and key personnel from the Corporation’s business operations, which could have a material adverse effect on the Corporation’s business, cash flows, financial condition and results of operations and ability to make dividends to shareholders.
Rent Control
The Corporation may be subject to legislation that exists or is enacted in certain jurisdictions, which restricts the right of landlords to increase rents charged to tenants. As a result, the inability to adjust rents to address higher operating costs or to improve margins on certain properties may have an adverse effect on the returns available from such properties.
Currently, the Corporation operates in Canada in the Provinces of Alberta, British Columbia and Saskatchewan. Neither Alberta nor Saskatchewan is subject to rent control legislation; however, under Alberta rent legislation, a landlord is only entitled to increase rents once every twelve months.
Under British Columbia’s rent control legislation, a landlord is entitled to increase the rent for existing tenants once every twelve months by no more than the “guideline amount” established by regulations. The current guideline amount is 2% over annual inflation. When a unit is vacant, however, the landlord is entitled to lease the unit to a new tenant at any rental amount, after which annual increases are limited to the applicable guideline amount. The landlord may also be entitled to a greater increase in rent for a unit under certain circumstances, including, for example, where extra expenses have been incurred as a result of a renovation of that unit.
To manage this risk, prior to entering a market where rent controls are in place, extensive time is spent researching existing rules, and, where possible, the Corporation will ensure it utilizes employees who are experienced in working in these controlled environments. In addition, the Corporation adjusts forecast assumptions on new acquisitions to ensure they are reasonable given the rent control environment.

MAINSTREET EQUITY CORP.28
Operational Risks
Operational risk is the risk that a direct or indirect loss may result from an inadequate or failed infrastructure, from a human process or from external events. The impact of this loss may be financial loss, loss of reputation or legal or regulatory proceedings. Mainstreet endeavours to minimize losses in this area by ensuring that effective infrastructure and controls exist. These controls are constantly reviewed and, if deemed necessary, improvements are implemented.
Public Market Risk
It is not possible to predict the price at which Mainstreet’s common shares will trade and there can be no assurance that an active trading market for the common shares will be sustained. The common shares will not necessarily trade at values determined solely by reference to the value of the properties of the Corporation. Accordingly, the common shares may trade at a premium or a discount to the value implied by the value of the Corporation’s properties. The market price for common shares may be affected by changes in general market conditions, fluctuations in the markets for equity securities and numerous other factors beyond the control of the Corporation.
Potential Conflicts of Interest
Mainstreet may be subject to various conflicts of interest because of the fact that directors and officers of the Corporation are engaged in other real estate-related business activities. The Corporation may become involved in transactions which conflict with the interests of the foregoing. Directors may from time to time deal with persons, firms, institutions or corporations with which the Corporation may be dealing, or which may be seeking investments similar to those desired by the Corporation. The interests of these persons could conflict with those of the Corporation. In addition, from time to time, these persons may compete with Mainstreet for available investment opportunities. Directors and officers of the Corporation are required to disclose material interests in material contracts and transactions and to refrain from voting thereon. See also “Related Party Transactions” above.
Appraisals of Properties
An appraisal is an estimate of market value and caution should be used in evaluating data with respect to appraisals. It is a measure of value based on information gathered in the investigation, appraisal techniques employed and quantitative and qualitative reasoning, leading to an opinion of value. The analysis, opinions and conclusions in an appraisal are typically developed based on and in conformity with, interpretations of the guidelines and recommendations set forth in the Canadian Uniform Standards of Appraisal Practice. Appraisals are based on various assumptions of future expectations of property performance and while the appraiser’s internal forecast of net income for the properties appraised are considered to be reasonable at that time, some of the assumptions may not materialize or may differ materially from actual experience in the future.
CHALLENGES
Ongoing volatility of petroleum, natural gas and other commodity prices continues to create economic uncertainty in some of Mainstreet’s core markets. This uncertainty is compounded by the introduction of the Alberta carbon tax, which was rolled out in January 2017. The economy-wide tax is structured in a way that charges the owners of buildings while offering rebates to tenants, which in turn raises the heating and electrical costs. Mainstreet currently has its electricity costs in Alberta contractually locked in at a fixed rate until April 2018. However, Mainstreet’s internal research suggests that the provincial carbon tax will add additional costs in fiscal 2018 of roughly $8.8 per unit. Additionally, increase in rent concessions, tenant turnover and bad debts also created additional anticipated operating cost pressures in Q1 2017.
Mainstreet’s vacancy rate was above average over the quarter. This was largely a result of a high level of vacancy across the Prairie provinces, coupled with the $78 million in acquisitions of unstabilized properties ,the Corporation has completed over the past 15 months. While Mainstreet views this vacancy rate as high (9.7%), it sees this as a short-term trend as Mainstreet continues to undergo our stabilization process.
Negative macro economic forces have likewise caused significant short positions in respect of the trading of Mainstreet common stock. We believe this is partly responsible for our common share trading price being well below NAV. As of December 31, 2016, the short position on Mainstreet totaled 752,600 common shares.
Broadly speaking, the impact of lower commodity prices and market volatility is difficult to measure in precise terms. However, Management believes the current situation also creates a series of opportunities that are discussed at greater length in the Outlook section below.

Q1 2017 29
OUTLOOK
Mainstreet saw its same-asset revenues, vacancy rate and funds from operations excluding utility cost increase in Q1 2017 compared with Q4 2016. This marked a positive quarterly movement for the first time in six quarters. The uptick occurred despite that Q1, historically, is a winter season of low activity in the apartment rental market.
Mainstreet believes this revenue increase could be an early indication of market stabilization in the Alberta and Saskatchewan markets. Ideally, this is a signal that Mainstreet is nearing the tail end of the downward curve in revenues on a same-asset basis. However, Management maintains a cautious perspective in this regard, as the macro economic picture in those markets remains uncertain. In addition, the performance of Mainstreet’s BC portfolio, which accounts for approximately 30% of Mainstreet’s portfolio, maintained an average vacancy rate below 1%. Management anticipates that rental revenues from our BC portfolio will continue to grow through rent increases and further improvements in occupancy rates.
Mainstreet sees several key indicators of positive movement in the Alberta and Saskatchewan markets. According to recent Canadian census data, Alberta’s population grew 11.6% between 2011 and 2016—the highest rate in the country and more than twice the national average. The population growth over the period was even higher than it was from 2006 to 2011, when Alberta’s economic situation was, on balance, healthier. Saskatchewan’s population growth was the second highest in the country at 6.3%. Overall, the 2016 census marked the first time in Canadian history that the three Prairie provinces (Alberta, Saskatchewan and Manitoba) had the highest population growth in the country.
Mainstreet views this demographic shift as a highly positive indicator for the Alberta and Saskatchewan markets in the long term. Management sees this trend continuing in the future, provided economic activity continues to improve. In Alberta, the provincial population is expected to grow by 1.6% in 2017 and by 1.7% in 2018, according to CMHC data. Saskatchewan’s population also continues to grow, and is expected to rise by 1.3% in 2017 and 2018.
Steady in-migration levels come as the rental market begins to show signs of absorption. During recent years of high economic growth, there was a rapid build out of condominiums, particularly in Alberta, which began coming onto the market in mid-2015. Management believes this led to a lot of condominium units being owned by investors with the intention for the higher-end rental market. The economic recession and the lower in-migration level, which resulted in an oversupply of condominium rental units, created a spillover effect and caused an increase in vacancy rate in the apartment rental market. However, Mainstreet believes this oversupply will continue to absorb through fiscal 2017 and 2018.
Additionally, Management expects the recent relaxation of Canadian immigration policies to attract a number of foreign workers, foreign students, immigrants and refugees to some of its core regions—most of whom are likely to enter the rental market.
With immigration numbers anticipated to rise, Mainstreet also believes stricter requirements on CMHC-insured mortgages implemented by the federal government in 2016 are favourable to the rental market. The new legislation may serve to deter first-time homebuyers in particular, who could be more exposed to higher interest rates and therefore more likely to rent rather than buy. This has the additional benefit of helping to absorb the aforementioned excess capacity in the condominium market.
Moreover, Mainstreet is well positioned to capitalize on this apartment rental market growth. In times of economic uncertainty, renters tend to favour middle market prices as they delay major investments like new homes. Mainstreet’s price point average rental rate between $900 and $1,000 perfectly aligns with that mid-market demand.
Management also believes that the oil and gas industry in Western Canada is showing indications of improvement early in 2017. US President Donald Trump signed an executive order in January 2017 to move ahead with the Keystone XL pipeline, which is seen as a highly positive development for the sector. The decision is complemented by the Canadian government’s approval of two major oil pipelines in the later part of October 2016. The approval of the three pipelines is expected to aid in attracting investment to Canada’s oil and gas industry.
In addition, the global oil cartel known as OPEC agreed to collectively cut back their oil production in November 2016, potentially putting a floor on prices. Oil prices in early 2017 have increased significantly above their 2016 lows, and the consensus among commodity analysts seems to be that these commodity prices will continue to rise in 2017 and 2018.
Mainstreet believes these broader market conditions create substantial opportunities for growth, and it is pushing the reset button on our approach to acquisitions. The current environment of low interest rates and slower GDP growth makes this an ideal time to expand its portfolio on an opportunistic basis.
Lastly, Mainstreet expects to benefit from lower costs and availability of labour. With the easing of labour market pressures, Management believes this will provide an opportunity to bulk up on senior and middle management personnel at a cost that would have been impossible when economic activity was at its peak.
MAINSTREET EQUITY CORP.30
RUNWAY ON EXISTING PORTFOLIO
1) Closing the NOI gap: Over Q1 2017, 10% of the Mainstreet portfolio remained unstabilized, which contributed to higher vacancy rates. While this is a normal part of the Mainstreet business model, Mainstreet’s continual work in renovating and improving properties before releasing them back to the market provides, in Management’s opinion, potential to improve NOI and FFO performance. This inherent challenge in Mainstreet’s business model is further increased by recent acquisitions, which causes higher rates of unstabilized properties that affect its NOI and FFO.
2) Renegotiating long-term debt: Interest rates, which account for Mainstreet’s single largest expense, are among the lowest the Corporation has ever experienced. Mainstreet expects to cut these expenses further by refinancing our remaining $10 million in mortgage loans maturing in 2017 and debts maturing in 2018 at an expected average interest rate that will be much lower than the current average rate of 5.2%.
3) Buying back shares at discount to NAV : Mainstreet believes its common shares continue to trade well below its NAV. Additionally, the current discount, in our opinion, does not fully account for numerous intangible assets, including Mainstreet’s diversified asset base and non-dilutive growth model. Mainstreet will therefore continue to buy back its own common shares on an opportunistic basis under the NCIB.
4) Leveraging the Corporation’s ample liquidity: Finally, Mainstreet maintains a substantial year to date liquidity position that will allow Mainstreet to capitalize on opportunities for acquisitions and the repurchasing of its common shares. Mainstreet anticipates that its estimated year to date liquidity of $151 million will translate into roughly $600 million in acquisition opportunities based on a leverage level of 75%. Following any future acquisitions, this could significantly boost Mainstreet’s NOI per share and FFO per share in the long term.
ADDITIONAL INFORMATION
Additional information about Mainstreet is available on the Corporation’s website at www.mainst.biz and on Sedar at www.sedar.com.

Q1 2017 31
CONDENSED CONSOLIDATED STATEMENTS OF FINANCIAL POSITION
Unaudited
($000s of Canadian dollars)
Dec. 31, 2016 Sep. 30, 2016
Assets Non-current assets Investment properties [Note 4] $ 1,462,665 $ 1,460,080 Property, plant and equipment 4,840 4,822 Intangible assets 437 423
1,467,942 1,465,325
Current assets Prepaid assets 2,576 1,774 Prepaid current income tax 1,261 1,261 Trade and other receivables 1,381 1,614 Restricted cash 2,674 2,858 Inventory 304 338 Mortgage receivable – 2,500 Cash and cash equivalents 44,707 1,095
52,903 11,440
Total Assets $ 1,520,845 $ 1,476,765
Liabilities Non-current liabilities Mortgages payable [Note 5] $ 777,802 $ 666,824 Deferred tax liabilities 123,317 123,162
901,119 789,986
Current liabilities Mortgages payable [Note 5] 25,675 47,657 Trade and other payables 5,766 6,898 Refundable security deposits 4,007 4,100 Bank indebtedness [Note 6] – 40,148
35,448 98,803
Total Liabilities 936,567 888,789
Equity Share capital [Note 7] 24,315 24,315 Contributed surplus 2,404 2,404 Retained earnings 557,559 561,257
Total Equity 584,278 587,976
Total Liabilities and Equity $ 1,520,845 $ 1,476,765
See accompanying notes to these condensed consolidated financial statements.
[Signed] [Signed]
“Bob Dhillon” “Joe Amantea” Director Director
February 14, 2016

MAINSTREET EQUITY CORP.32
CONDENSED CONSOLIDATED STATEMENTS OF NET LOSS AND TOTAL COMPREHENSIVE LOSS
Unaudited
($000s of Canadian dollars, except per share amounts)
3 months ended December 31, 2016 2015
Rental revenue $ 25,499 $ 25,055
Ancillary rental income 344 337
25,843 25,392
Property operating expenses 10,153 8,758
Net operating income 15,690 16,634
Interest income 114 34
15,804 16,668
Mortgage interest 8,305 6,286
Amortization of deferred financing cost 807 562
General and administrative expenses 2,398 2,169
Depreciation 88 82
11,598 9,099
Profit before other items and income tax 4,206 7,569
Fair value (loss) [Note 4] (7,748) (16,053)
Loss before income tax (3,542) (8,484)
Deferred income tax expense 156 –
Net loss and total comprehensive loss $ (3,698) $ (8,484)
Loss per share [Note 8]
– Basic $ (0.42) $ (0.83)
– Diluted $ (0.42) $ (0.83)
See accompanying notes to these condensed consolidated financial statements.

Q1 2017 33
CONDENSED CONSOLIDATED STATEMENTS OF CHANGES IN EQUITY
Unaudited
($000s of Canadian dollars)
Total Share Contributed Retained Shareholders’ Capital Surplus Earnings Equity
Balance, October 1, 2015 $ 28,114 $ 2,404 $ 589,888 $ 620,406
Shares purchased for cancellation (379) – (4,010) (4,389)
Loss for the period – – (8,484) (8,484)
Balance, December 31, 2015 $ 27,735 $ 2,404 $ 577,394 $ 607,533
Shares purchased for cancellation (3,420) – (41,792) (45,212)
Profit for the period – – 25,655 25,655
Balance, September 30, 2016 $ 24,315 $ 2,404 $ 561,257 $ 587,976
Balance, October 1, 2016 $ 24,315 $ 2,404 $ 561,257 587,976
Loss for the period – – (3,698) (3,698)
Balance, December 31, 2016 $ 24,315 $ 2,404 $ 557,559 $ 584,278
See accompanying notes to these condensed consolidated financial statements.

MAINSTREET EQUITY CORP.34
CONDENSED CONSOLIDATED STATEMENTS OF CASH FLOWS
Unaudited
($000s of Canadian dollars)
3 months ended December 31, 2016 2015
Cash obtained from (used in) operating activities
Net profit (loss) $ (3,698) $ (8,484)
Adjustments for:
Amortization of deferred financing cost 807 562
Depreciation 88 82
Fair value loss 7,748 16,053
Deferred income tax expense 156 –
Mortgage interest 8,305 6,286
Interest paid on mortgages payable (8,305) (6,284)
5,101 8,215
Change in working capital
Prepaid assets (802) (1,038)
Trade and other receivables 233 (587)
Inventory 34 (118)
Restricted cash 184 238
Trade and other payables (875) (2,660)
Refundable security deposits (93) (123)
Cash from operating activities 3,782 3,927
Financing activities
Bank indebtedness (40,148) (36,836)
Financing of investment properties 145,282 55,855
Repayment of mortgages payable (57,093) (11,793)
Repurchase of shares – (4,388)
Cash from financing activities 48,041 2,838
Investing activities
Purchase of and additions to investment properties (10,591) (4,914)
Purchase of and additions to property, plant and equipment (106) (106)
Purchase of and additions to intangible assets (14) (62)
Mortgage receivable 2,500 –
Cash used in investing activities (8,211) (5,082)
Net increase in cash and cash equivalents 43,612 1,683
Cash and cash equivalents, beginning of period 1,095 1,526
Cash and cash equivalents, end of period $ 44,707 $ 3,209
Cash and cash equivalents are comprised of:
Cash $ 1,524 $ 126
Short-term deposits 43,183 3,083
$ 44,707 $ 3,209
See accompanying notes to these condensed consolidated financial statements.

Q1 2017 35
NOTES TO THE CONDENSED CONSOLIDATED FINANCIAL STATEMENTS
Unaudited
(Thousands of Canadian dollars, except share and per share amounts and amounts within narrative)
For the 3 months ended December 31, 2016 and 2015
1. GENERAL
Mainstreet Equity Corp. (the “Corporation”) is a Canadian real estate corporation, incorporated under the Business Corporations Act (Alberta), focused on acquiring and managing mid-market residential rental apartment buildings in major markets primarily in Western Canada. The registered office and head office of the Corporation are located at 1413 2nd Street SW Calgary, Alberta T2R 0W7 and 305 10th Avenue SE Calgary, Alberta T2G 0W2, respectively.
2. SIGNIFICANT ACCOUNTING POLICIES
a) Statement of compliance
The condensed consolidated financial statements of the Corporation have been prepared in compliance with International Accounting Standards (“IAS”) 34 Interim Financial Reporting (“IAS 34”) as issued by the International Accounting Standards Board (“IASB”) and adopted by the Chartered Professional Accountants of Canada (“CPA”). Accordingly, certain information and footnote disclosure normally included in the annual financial statements prepared in accordance with International Financial Reporting Standards (“IFRS”) have been omitted or condensed and, therefore, should be read in conjunction with the annual audited consolidated financial statements for the fiscal year ended September 30, 2016.
b) Basis of presentation
These condensed consolidated financial statements have been prepared using the same accounting policies and methods as those used in the consolidated financial statements for the year ended September 30, 2016.
These condensed consolidated financial statements have been prepared on the historical cost basis except for investment properties, which are measured at fair value. The condensed consolidated financial statements are prepared on a going concern basis and have been prepared in Canadian dollars rounded to the nearest thousand. The accounting policies set out below have been applied consistently in all material respects.
c) Basis of consolidation
The consolidated financial statements include the accounts of the Corporation and its wholly owned controlled subsidiary, Mainstreet Equity USA Corp. All inter-company transactions, balances, revenue and expenses have been eliminated on consolidation.
d) Key accounting estimates and assumptions
The following are the key accounting estimates and assumptions concerning the future, and other key sources of estimation uncertainty at the end of the reporting period that have significant risk of causing a material adjustment to the carrying amounts of assets and liabilities within the next financial year:
i) Significant estimates used in determining the fair value of investment properties include capitalization rates, market rent, vacancy rate and operating expenses. A change to any one of these inputs could significantly alter the fair value of an investment property. Please refer to Note 4 for sensitivity analysis;
ii) Significant estimates used in determining the fair value of financial instruments include the discount rate used to discount the future cash flows of mortgages for similar loans with similar credit ratings and the same maturities;
iii) Significant estimates used in determining the fair value of share-based compensation include the estimated risk free interest rate, expected life of the stock options, expected volatility rate of and expected dividend rates;
iv) Allocation of purchase cost in the acquisition of property, plant and equipment into different components, estimation of their useful life and impairment on property, plant and equipment; and
v) The amount of temporary differences between the book carrying value of the assets and liabilities versus the tax basis values and the future income tax rate at which these differences will be realized.
Actual results could differ from estimates.

MAINSTREET EQUITY CORP.36
3. NEW ACCOUNTING POLICIES AND CHANGES TO ACCOUNTING POLICIES
The new IFRS policies which are effective for annual periods beginning on or after January 1, 2018 are discussed below:
Certain new IFRSs which are related to accounting periods beginning on January 1, 2018 or later are not expected to have a significant effect on the consolidated financial statements. The following accounting policies have not yet been adopted by Mainstreet.
IFRS 9 – Financial Instruments – Effective for periods beginning on or after January 1, 2018
The IASB has undertaken a three-phase project to replace IAS 39 Financial Instruments: Recognition and Measurement (“IAS 39”) with IFRS 9 Financial Instruments (“IFRS 9”). In November 2009, the IASB issued the first phase of IFRS 9, which details the classification and measurement requirements for financial assets. Requirements for financial liabilities were added to the standard in October 2010. The new standard replaces the current multiple classification and measurement models for financial assets and liabilities with a single model that has only two classification categories: amortized cost and fair value. In November 2013, the IASB issued the third phase of IFRS 9 which details the new general hedge accounting model. Hedge accounting remains optional and the new model is intended to allow reporters to better reflect risk management activities in the financial statements and provide more opportunities to apply hedge accounting. IFRS 9 is still available for early adoption. The full impact of the standard on the Company’s financial statements will not be known until the assessment by the Company is complete.
IFRS 15 – Revenue from Contracts with Customers – Effective for periods beginning on or after January 1, 2018
The IASB issued IFRS 15 which outlines a single comprehensive model for entities to use in accounting for revenue arising from contracts with customers. The model requires an entity to recognize revenue as the goods or services are transferred to the customer in an amount that reflects the expected consideration. IFRS 15 is effective for annual periods beginning on or after January 1, 2018. The Corporation is currently evaluating the impact of the new Standard on its financial statements.
IFRS 16 – Leases – Effective for periods beginning on or after January 1, 2019
The new standard on leases supersedes IAS 17, Leases and Related Interpretations. IFRS 16 eliminates the current dual accounting model for lessees, which distinguishes between on-balance sheet finance leases and off-balance sheet operating leases. Instead, there is a single, on-balance sheet accounting model that is similar to current finance lease accounting. From a lessee perspective, IFRS 16 eliminates the classification of leases as either operating leases or finance leases as is required by IAS 17. From a lessor perspective, the accounting remains similar to current practice of classifying leases as finance and operating leases. The Corporation is currently evaluating the impact of the new Standard on its financial statements.
4. INVESTMENT PROPERTIES Three months ended Year ended Dec. 31, 2016 Sep. 30, 2016
Balance, beginning of period $ 1,460,080 $ 1,386,035
Additions 6,477 63,938
Building improvements 3,856 13,142
Fair value loss (7,748) (3,035)
Balance, end of period $ 1,462,665 $ 1,460,080
The fair value of investment properties held by the Corporation as of September 30, 2016, was determined by independent qualified real estate appraisers who are members of the Appraisal Institute of Canada and have appropriate qualifications and experience in the valuation of the Corporation’s investment properties in relevant locations. The direct capitalization method was used to convert an estimate of a single year’s income (net operating income) expectancy into an indication of value in one direct step by dividing the income (net operating income) estimated by an appropriate capitalization rate.
The appraisers also reviewed changes in market conditions affecting the underlying assumptions used for the fair value assessment during the period and management estimated the fair value of the investment properties based on the current market conditions at December 31, 2016 except for three properties acquired during the three months ended December 31, 2016 for which the cost of acquisition was used as the best estimate of the fair market value as of December 31, 2016.
The average capitalization rates used in determining the fair value of investment properties are set out below:
Dec. 31, 2016 Sep. 30, 2016
Surrey, BC 4.56% 4.56%
Abbotsford, BC 5.13% 5.13%
Calgary, AB 4.86% 4.86%
Edmonton, AB 5.92% 5.92%
Saskatoon, SK 6.77% 6.77%
Investment properties 5.41% 5.41%

Q1 2017 37
The direct capitalization method requires that an estimated forecasted net operating income (“NOI”) be divided by a capitalization rate (“Cap Rate”) to determine a fair value. As such changes in both NOI and Cap Rate would significantly alter the fair value of investment properties. The tables below set out the impact of changes in both NOI and Cap Rate on the Corporation’s fair values.
As at December 31, 2016
Net operating income -3% -1% As estimated +1% +3%
$ 76,758 $ 78,340 $ 79,132 $ 79,923 $ 81,506
Capitalization rate
-0.25% 5.16% $ 24,858 $ 55,529 $ 70,864 $ 86,199 $ 116,870
Cap rate used 5.41% $ (43,880) $ (14,627) $ 1,462,665 $ 14,627 $ 43,880
+0.25% 5.66% $ (106,546) $ (78,585) $ (64,604) $ (50,624) $ (22,662)
As at September 30, 2016
Net operating income -3% -1% As estimated +1% +3%
$ 76,621 $ 78,200 $ 78,990 $ 79,780 $ 81,360
Capitalization rate
-0.25% 5.16% $ 24,816 $ 55,432 $ 70,740 $ 86,049 $ 116,665
Cap rate used 5.41% $ (43,802) $ (14,601) $ 1,460,080 $ 14,601 $ 43,802
+0.25% 5.66% $ (106,359) $ (78,447) $ (64,491) $ (50,535) $ (22,624)
5. MORTGAGES PAYABLE
Mortgages payable bear interest at a weighted average interest rate of 3.10% (September 30, 2016 – 3.39%) per annum and are payable in monthly principal and interest installments totaling $3.4 million (September 30, 2016 – $3.2 million), maturing from 2017 to 2026 and are secured by specific charges against specific investment properties, having a fair value of $1,336 million (September 30, 2016 – $1,282 million).
Dec. 31, 2016 Sep. 30, 2016
Non-current $ 777,802 $ 666,824
Current 25,675 47,657
$ 803,477 $ 714,481
Estimated principal payments required to retire the mortgage obligations as of December 31, 2016 are as follows:
12 months ending December 31, Amount
2017 $ 28,257
2018 40,666
2019 34,625
2020 74,320
2021 60,004
Subsequent 585,209
823,081
Deferred financing costs (19,604)
$ 803,477
6. BANK INDEBTEDNESS
Effective January 2014, the Corporation was granted a new banking facility to a maximum of $85 million with a syndicate of chartered financial institutions. The facility is secured by a floating charge against the Corporation’s assets and carries an interest rate of prime plus 1.25%. The facility requires monthly interest payments and is renewable every three years subject to the mutual agreement of the lenders and the Corporation. The Corporation has extended the maturity date to December 6, 2019. As at December 31, 2016, the Corporation has drawn $Nil (September 30, 2016 – $40.1 million) against this credit facility. The facility contains financial covenants to maintain an overall funded debt to gross book value ratio of not more than 65% and debt service ratio of not less than 1.2. As of December 31, 2016, the Corporation’s overall funded debt to gross book value ratio and debt service coverage ratio are 55% and 1.32, respectively.

MAINSTREET EQUITY CORP.38
(000s of dollars)
As at December 31, 2016
Total funded debt
Mortgages payable $ 803,477
Bank indebtedness –
$ 803,477
Gross book value of assets
Investment properties $ 1,462,665
Property, plant and equipment 4,840
$ 1,467,505
Overall funded debt to gross book value ratio 55%
Debt service coverage ratio
Earnings before interest, tax, depreciation and amortization For 12 months ended December 31, 2016
Net income $ 21,957
Add (deduct):
Mortgage interest 28,052
Income tax 5,802
Depreciation 372
Amortization of finance cost 2,624
Fair value gain (5,270)
$ 53,537
Principal and interest payments $ 40,582
Debt service coverage ratio 1.32
7. SHARE CAPITALAuthorized:
Unlimited number of common voting shares with no par value
Unlimited number of preferred shares with no par value
Issued, outstanding and fully paid:
Three months ended December 31, 2016 Year ended September 30, 2016
Number of Amount Number of Amount common shares (000s) common shares (000s)
Issued and outstanding,
– beginning of the period 8,883,333 $ 24,315 10,271,251 $ 28,114
Shares purchased for cancellation – – (1,387,918) (3,799)
Issued and outstanding,
– end of the period 8,883,333 $ 24,315 8,883,333 $ 24,315
All common shares have an equal right to dividends.
On May 30, 2016, the Corporation obtained approval from the Toronto Stock Exchange (“TSX”) to repurchase up to 487,890 common shares of the Corporation under a Normal Course Issuer Bid (“NCIB”) commencing June 1, 2016. The Corporation’s previous NCIB expired on April 20, 2016. During the three months ended December 31, 2016 and 2015, the Corporation purchased and cancelled Nil common share and 138,336 common shares, respectively at an average price of $Nil and $31.72 per common share.

Q1 2017 39
On April 22, 2016, Mainstreet purchased for cancellation 1.2 million of its common shares at a purchase price of $36 per common share for an aggregate purchase price of $43.2 million (not including fees and expenses), pursuant to a substantial issuer bid made in accordance with applicable securities laws.
8. LOSS PER SHARE
Basic loss per share is calculated using the weighted average number of common shares outstanding during the period.
The treasury stock method of calculating the diluted loss per share is used.
The following table sets forth the computation of basic and diluted loss per share:
Three months ended December 31, 2016 2015
Numerator
Net loss $ (3,698) $ (8,484)
Denominator
For basic loss per share
Weighted average shares 8,883,333 10,171,744
Dilutive effect – –
For diluted loss per share 8,883,333 10,171,744
Loss per share
– Basic $ (0.42) $ (0.83)
– Diluted $ (0.42) $ (0.83)
Due to reported loss for the three months ended December 31, 2016 and 2015, the dilution calculation does not include outstanding stock options. If included, these items would be anti-dilutive and therefore are not included in the computation of diluted loss per share.
9. STOCK OPTION PLAN
A summary of the Corporation’s stock option plan as of December 31, 2016 and September 30, 2016 and changes during the periods are presented below:
December 31, 2016 September 30, 2016
Number Weighted average Number Weighted average Stock option of shares exercise price of shares exercise price
Outstanding and exercisable,
– beginning of the period 828,200 $ 5.51 828,200 $ 5.51
Outstanding and exercisable,
– end of the period 828,200 $ 5.51 828,200 $ 5.51
Weighted average contractual life-years 2.19 2.44
Prices $ 5.51 $ 5.51
During the fiscal quarter ended December 31, 2016, no stock options were granted, exercised or cancelled. No stock options may be granted under the Corporation’s stock option plan after March 24, 2017.
10. FINANCIAL INSTRUMENT AND RISK MANAGEMENT
Fair value of financial assets and liabilities
The Corporation’s financial assets and liabilities comprise restricted cash, cash and cash equivalents, trade and other receivables, mortgage receivable, bank indebtedness, mortgages payable, trade and other payables, and refundable security deposits. Fair values of financial assets and liabilities, summarized information related to risk management positions, and discussion of risks associated with financial assets and liabilities are presented as follows.
The fair values of restricted cash, cash and cash equivalents, trade and other receivables, bank indebtedness, trade and other payables, and refundable security deposits approximate their carrying amounts due to the short-term maturity of those instruments.

MAINSTREET EQUITY CORP.40
The fair values of mortgages receivable and payable are determined using the current market interest rates as discount rates, the net present value of principal balances and future cash flows over the terms of the mortgages. In identifying the appropriate level of fair value, the Corporation performs a detailed analysis of the financial assets and liabilities. The inputs used to measure fair value determine different levels of the fair value hierarchy categorized as follows:
– Level 1: Values based on unadjusted quoted prices in active markets that are accessible at the measurement date for identical assets or liabilities;
– Level 2: Values based on quoted prices in markets that are not active or model inputs that are observable either directly or indirectly for substantially the full term of the asset or liability; and
– Level 3: Values based on valuation techniques for which any significant input is not based on observable market data.
The fair values of financial assets and liabilities were as follows:
December 31, 2016 September 30, 2016
Carrying Fair Carrying Fair amount value amount value
Financial assets:
Restricted cash Level 1 $ 2,674 $ 2,674 $ 2,858 $ 2,858
Cash and cash equivalents Level 1 44,707 44,707 1,095 1,095
Trade and other receivables Level 2 1,381 1,381 1,614 1,614
Mortgage receivable Level 2 – – 2,500 2,498
Financial liabilities:
Bank indebtedness Level 1 – – 40,148 40,148
Mortgages payable Level 2 803,477 822,519 714,481 769,086
Trade and other payables Level 2 5,766 5,766 6,898 6,898
Refundable security deposits Level 1 4,007 4,007 4,100 4,100
The Corporation’s non-financial assets comprise investment properties. The fair values of non-financial assets were as follows:
11. RISK ASSOCIATED WITH FINANCIAL ASSETS AND LIABILITIES
The Corporation is exposed to financial risks arising from its financial assets and liabilities. The financial risks include market risk relating to interest rates, credit risk and liquidity risk.
Market risk
Market risk is the risk that the fair value or future cash flows of financial assets or liabilities will fluctuate due to movements in market prices. Most of the Corporation’s financial assets and liabilities are short term in nature and, accordingly, the fluctuation in the fair value is therefore minimal.
Interest rate risk
The Corporation is exposed to interest rate risk to the extent of any upward or downward revision in prime lending rates. Mortgages totaling approximately $13 million are subject to renewal during the financial year ending September 30, 2017. Changes in the interest rate have the potential to adversely affect the profitability of the Corporation. However, the Corporation attempts to mitigate this risk by staggering the maturity dates for its mortgages. The majority of the Corporation’s mortgages are insured by Canada Mortgage and Housing Corporation (“CMHC”) under the National Housing Association (“NHA”) mortgage program. This added level of insurance offered to lenders allows the Corporation to receive the best possible financing and interest rates, and significantly reduces the potential for a lender to call a loan prematurely. A 1% change in the prime lending rate would not have resulted any change of in interest expense for the three months ended December 31, 2016.
Credit risk
Credit risk is the risk that the counterparty to a financial asset will default resulting in a financial loss for the Corporation. The Corporation is exposed to credit risk as some tenants may experience financial difficulty and may default in payment of rent. However, the Corporation attempts to minimize possible risks by conducting in-depth credit assessments of all tenants and collecting security deposits from tenants. The Corporation’s tenants are numerous which also reduces the concentration of credit risk. As tenants’ rent is due at the beginning of the month, all amounts in accounts receivable are considered overdue by the Corporation. As of December 31, 2016, rents due from current tenants amounted to $286,000 (September 30, 2016 – $336,000). The possibility of not receiving payment of rent due from current tenants was covered by security deposits of $4.0 million (September 30, 2016 – $4.1 million) and provisions for bad debts of $130,000 (September 30, 2016 – $130,000).

Q1 2017 41
In relation to cash, cash equivalents and restricted cash, the Corporation believes that its exposure to credit risk is low. The Corporation places its cash, cash equivalents, and restricted cash only with reputable Canadian chartered financial institutions.
Liquidity Risk
Liquidity risk is the risk the Corporation will encounter difficulties in meeting its financial liability obligations. The Corporation manages its liquidity risk by monitoring forecast and cash flows on a regular basis to meet expected operational expenses, by maintaining adequate banking facilities, and by matching the maturity profiles of financial assets and liabilities.
The timing of cash outflows relating to financial liabilities are outlined in the table below:
Beyond 1 year 2 years 3 years 4 years 4 years Total
Mortgages payable $ 28,257 40,666 34,625 74,320 645,213 $ 823,081
Mortgage interest payable $ 25,541 24,425 22,593 21,659 72,359 $ 166,577
Trade and other payables $ 5,766 – – – – $ 5,766
Refundable security deposits $ 4,007 – – – – $ 4,007
12. GUARANTEES, CONTINGENCIES, COMMITMENTS
In the normal course of business, the Corporation may enter into various agreements that may contain features that meet the definition of guarantees, contingencies or commitments in accordance with IAS 37 Provisions, Contingent Liabilities and Contingent Assets (“IAS 37”) that contingently require the Corporation to make payments to the guaranteed party based on: (i) changes in an underlying interest rate, foreign exchange rate, equity or commodity instrument, index or other variable, that is related to an asset, a liability or an equity security of the counterparty; (ii) failure of another party to perform under an obligating agreement; or (iii) failure of a third party to pay its indebtedness when due.
In the ordinary course of business, the Corporation provides indemnification commitments to counterparties in transactions such as credit facilities, leasing transactions, service arrangements, director and officer indemnification agreements and sales of assets. These indemnification agreements require the Corporation to compensate the counterparties for costs incurred as a result of changes in laws and regulations (including tax legislation) or as a result of litigation claims or statutory sanctions that may be suffered by counterparty as a consequence of the transaction. The terms of these indemnification agreements will vary based on the contract and do not provide any limit on the maximum potential liability. Historically, the Corporation has not made any significant payments under such indemnifications and no amount has been accrued in these condensed consolidated financial statements with respect to these indemnification commitments.
In the normal course of operations, the Corporation will become subject to a variety of legal and other claims against the Corporation. Management and the Corporation’s legal counsel evaluate all claims on their apparent merits, and accrue management’s best estimate of the estimated costs to satisfy such claims. Management believes that the outcome of legal and other claims filed against the Corporation will not be material.
As of December 31, 2016 and September 30, 2016, no amounts have been recorded and none are required to be disclosed in the condensed consolidated financial statements with respect to guarantees, contingencies and commitments.
13. RELATED PARTY TRANSACTIONS
a) The President and Chief Executive Officer receives commissions at commercial rates in his capacity as a licensed broker for the property transactions conducted by the Corporation in its normal course of business. Commissions are determined on an exchange value basis. These commissions are not incurred or paid by the Corporation but rather by the other selling party or parties to the transaction. The commissions received during the three months ended December 31, 2016 were $51,600 (2016 – $Nil) and form part of the President and Chief Executive Officer’s total remuneration for the year.
b) The Corporation paid legal and professional fees and reimbursements for the transactions conducted by the Corporation in its normal course of business for the three months ended December 31, 2016 amounting to $113,000 (2016 – $29,000) to a law firm of which a director and officer of the Corporation is a partner. Professional fees and reimbursements are determined on an exchange value basis. As at December 31, 2016, the amounts payable to the law firm were $800 (September 30, 2016 – $600).

MAINSTREET EQUITY CORP.42
14. SEGMENTED INFORMATION
The Corporation specializes in multi-family residential housing and operates primarily within one business segment in three provinces located in Canada. The following summary presents segmented financial information for the Corporation’s continuing operations by geographic location:
RENTAL OPERATIONS
(000s of dollars)
3 months ended December 31, 2016 2015
BRITISH COLUMBIA
Rental revenue $ 7,206 $ 6,592
Ancillary rental income 115 87
Fair value gain or (loss) (1,065) (1,095)
Property operating expenses 2,630 2,295
ALBERTA
Rental revenue $ 15,071 $ 16,066
Ancillary rental income 207 232
Fair value gain or (loss) (5,608) (14,508)
Property operating expenses 6,237 5,503
SASKATCHEWAN
Rental revenue $ 3,222 $ 2,397
Ancillary rental income 22 18
Fair value gain or (loss) (1,075) (450)
Property operating expenses 1,286 960
TOTAL
Rental revenue $ 25,499 $ 25,055
Ancillary rental income 344 337
Fair value loss (7,748) (16,053)
Property operating expenses 10,153 8,758
Unallocated revenue* 114 34
Unallocated expenses** 11,754 9,099
Profit (loss) for the period $ (3,698) $ (8,484)
* Unallocated revenue represents interest income.
** Unallocated expenses include general and administrative expenses, mortgage interest, financing cost, depreciation and income taxes.

Q1 2017 43
IDENTIFIABLE ASSETS AND LIABILITIES
(000s of dollars)
Dec. 31, 2016 Sep. 30, 2016
BRITISH COLUMBIA
Investment properties $ 400,400 $ 400,400
Property, plant and equipment 18 19
Mortgages payable 223,241 156,543
Refundable security deposits 1,285 1,290
ALBERTA
Investment properties $ 895,407 $ 892,480
Property, plant and equipment 4,810 4,794
Mortgages payable 490,334 467,555
Refundable security deposits 2,148 2,218
SASKATCHEWAN
Investment properties $ 166,858 $ 167,200
Property, plant and equipment 12 9
Mortgages payable 89,902 90,383
Refundable security deposits 574 592
TOTAL
Investment properties $ 1,462,665 $ 1,460,080
Property, plant and equipment 4,840 4,822
Mortgages payable 803,477 714,481
Refundable security deposits 4,007 4,100
IDENTIFIABLE CAPITAL EXPENDITURES Three months ended Year ended Dec. 31, 2016 Sep. 30, 2016
BRITISH COLUMBIA $ 1,065 $ 9,917
ALBERTA 8,651 28,044
SASKATCHEWAN 737 39,736
TOTAL $ 10,453 $ 77,697
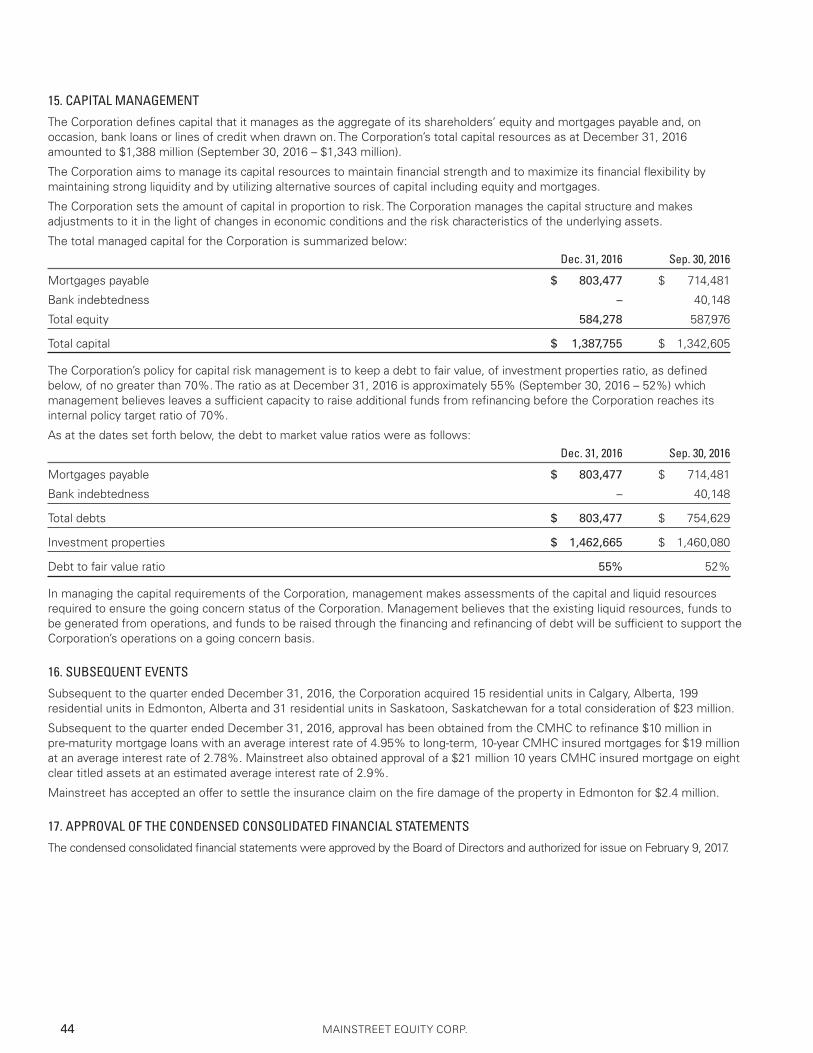
MAINSTREET EQUITY CORP.44
15. CAPITAL MANAGEMENT
The Corporation defines capital that it manages as the aggregate of its shareholders’ equity and mortgages payable and, on occasion, bank loans or lines of credit when drawn on. The Corporation’s total capital resources as at December 31, 2016 amounted to $1,388 million (September 30, 2016 – $1,343 million).
The Corporation aims to manage its capital resources to maintain financial strength and to maximize its financial flexibility by maintaining strong liquidity and by utilizing alternative sources of capital including equity and mortgages.
The Corporation sets the amount of capital in proportion to risk. The Corporation manages the capital structure and makes adjustments to it in the light of changes in economic conditions and the risk characteristics of the underlying assets.
The total managed capital for the Corporation is summarized below:
Dec. 31, 2016 Sep. 30, 2016
Mortgages payable $ 803,477 $ 714,481
Bank indebtedness – 40,148
Total equity 584,278 587,976
Total capital $ 1,387,755 $ 1,342,605
The Corporation’s policy for capital risk management is to keep a debt to fair value, of investment properties ratio, as defined below, of no greater than 70%. The ratio as at December 31, 2016 is approximately 55% (September 30, 2016 – 52%) which management believes leaves a sufficient capacity to raise additional funds from refinancing before the Corporation reaches its internal policy target ratio of 70%.
As at the dates set forth below, the debt to market value ratios were as follows:
Dec. 31, 2016 Sep. 30, 2016
Mortgages payable $ 803,477 $ 714,481
Bank indebtedness – 40,148
Total debts $ 803,477 $ 754,629
Investment properties $ 1,462,665 $ 1,460,080
Debt to fair value ratio 55% 52%
In managing the capital requirements of the Corporation, management makes assessments of the capital and liquid resources required to ensure the going concern status of the Corporation. Management believes that the existing liquid resources, funds to be generated from operations, and funds to be raised through the financing and refinancing of debt will be sufficient to support the Corporation’s operations on a going concern basis.
16. SUBSEQUENT EVENTS
Subsequent to the quarter ended December 31, 2016, the Corporation acquired 15 residential units in Calgary, Alberta, 199 residential units in Edmonton, Alberta and 31 residential units in Saskatoon, Saskatchewan for a total consideration of $23 million.
Subsequent to the quarter ended December 31, 2016, approval has been obtained from the CMHC to refinance $10 million in pre-maturity mortgage loans with an average interest rate of 4.95% to long-term, 10-year CMHC insured mortgages for $19 million at an average interest rate of 2.78%. Mainstreet also obtained approval of a $21 million 10 years CMHC insured mortgage on eight clear titled assets at an estimated average interest rate of 2.9%.
Mainstreet has accepted an offer to settle the insurance claim on the fire damage of the property in Edmonton for $2.4 million.
17. APPROVAL OF THE CONDENSED CONSOLIDATED FINANCIAL STATEMENTS
The condensed consolidated financial statements were approved by the Board of Directors and authorized for issue on February 9, 2017.

OFFICERSPresident & CEO Bob Dhillon Calgary, AB
Chief Financial Officer & Chief Operating Officer Johnny Lam Calgary, AB
Secretary Joe Amantea Calgary, AB
BOARD OF DIRECTORSJoe Amantea Calgary, AB
Ron B. Anderson Vancouver, BC
Bob Dhillon Calgary, AB
Karanveer Dhillon San Francisco, CA
Rich Grimaldi Westport, CT
John Irwin London, ON
DIRECTORS’ COMMITTEES
Executive Committee
Bob Dhillon Calgary, AB
Joe Amantea Calgary, AB
Audit Committee
Chair John Irwin London, ON
Rich Grimaldi Westport, CT
Ron B. Anderson Vancouver, BC
Human Resource Committee
Chair Joe Amantea Calgary, AB
Ron B. Anderson Vancouver, BC
REGISTRAR & TRANSFER AGENT
REGISTRAR & TRANSFER AGENTComputershare o/a Montreal Trust Company of Canada #600, 530 – 8 Ave SW Calgary, AB
AUDITORS Deloitte LLP 3000 Scotia Centre 700 – 2 St SW Calgary, AB
SOLICITORSWarren Benson Amantea LLP 1413 – 2 St SW Calgary, AB
Borden, Ladner & Gervais 1000 Canterra Tower 400 Third Ave SW Calgary, AB
BANKERSTD Canada Trust 335 – 4 Ave SW Calgary, AB
Alberta Treasury Branch Suite 600, 444 –7 Ave SW Calgary, AB
INVESTOR RELATIONSBob Dhillon Tel: 403 215-6063 Fax: 403 264-8870 [email protected]
Financial Inquiries
Johnny Lam Tel: 403 215-6067 Fax: 403 266-8867 [email protected]
HEAD OFFICEMainstreet Equity Corp.
305 – 10 Avenue SE Calgary, AB T2G 0W2
Tel: 403 215-6060 Fax: 403 266-8867
E-mail: [email protected] Web site: www.mainst.biz Twitter: @MEQ_IR
STOCK EXCHANGE Toronto Stock Exchange Trading symbol: MEQ
CORPORATE INFORMATION

MAINSTREET EQUITY CORP.46
How do we create value? By relying on the business model that Mainstreet pioneered in the mid-market rental apartment space, the “Mainstreet Value Chain”. It focuses on value creation by acquiring underperforming assets, renovating them to our higher standard and repositioning them in the market at a higher rent. As a result, the value of the property increases substantially due to the improved conditions of buildings and the higher rents that they can attract. This enables Mainstreet to unlock the value created by financing the stabilized property using long-term, low-interest CMHC insured mortgages. The capital that is unlocked by that process can then be used to fund additional growth. Since the day of incorporation in May 1997, we have grown our portfolio from 272 units with appraised values of $17 million to 10,181 units (YTD) with appraised values of approximately $1.5 billion with minimal equity dilution.
mainst.biz TSX: MEQ
© 2012-17 Mainstreet Equity Corp. All rights reserved.
The Mainstreet
VALUE CHAIN
DIVESTITURES
VALUE CREATION