mainland tanzania july 2006 – june · pdf file · 2015-08-13mainland tanzania...
TRANSCRIPT
MINISTRY OF HEALTH AND SOCIAL WELFARE
May 20, 2008
Health Sector Performance Profile Report
Mainland Tanzania July 2006 – June 2007
B

1
Health Sector Performance Profile Report | 5/20/2008
Health Sector Performance Profile ReportHealth Sector Performance Profile ReportHealth Sector Performance Profile ReportHealth Sector Performance Profile Report
Mainland Tanzania July 2006 – June 2007
Executive SummaryExecutive SummaryExecutive SummaryExecutive Summary
Monitoring and evaluation of health services delivery is an essential part of managing health. The Ministry of Health and Social
Welfare through the directorate of Policy and Planning has developed an analytical “Health Sector Performance Profile
Report” which is evidence based with the aim to provide a clear picture on the performance of health delivery systems in
Tanzania Mainland. The general objective is to assess and evaluate efficiency, effectiveness and impact of health delivery
services in the country. Specifically, the report provide an evaluation on: Thirty-three selected health performance indicators;
Milestones set during Joint Appraisal Health Sector Review for 2006; Public Expenditure Review report; Medium Term
Expenditure Framework for FY 2006/07 and Assessment of council health services.
The selected performance indicators are grouped in the following categories:
• Information on resources such as financial and human resources; • Information which assess the quality of services in the country (process indicators); • Output and outcome information; • Information on the health status of the population.
Milestones which were set during the Joint Appraisal Health Sector Review in 2006 were put in the following main groupings: -
• Drugs and Medical Supplies; • Availability of financial resources; • Public Private Partnership; • Availability of human resources; • Sector Evaluation and Monitoring; • HIV/AIDS; • Reproductive and child health; • SWAP; • Social Welfare.
The public expenditure review gives an assessment of sector financing in terms of sources of funds and financial expenditure for
FY 2006/07 at central and council levels. The assessment wanted to track if at all there is an improvement in health sector
financing from different sources.
For the medium term expenditure review the report covers FY 2006/07 whereby the performance takes into consideration
problems and constraints/limitations to effective implementation of planned activities.
Assessment of council health services the main objective was to evaluate the annual implementation of the comprehensive
council health plan reports; they have six specific objectives to be evaluated: -
• To review and evaluate the Annual (2006/07) Comprehensive Council Health Plans Implementation Reports from 121
Councils to see if the implemented planned health interventions are addressing health problems and are achieving set
objectives and targets through compilation of performance indicators.
• To review and evaluate 1st quarter (July- Sept 2007) implementation reports from 132 Councils to see if they have
met the requirements, both physical & financial criteria.

2
Health Sector Performance Profile Report | 5/20/2008
• To assess RS/RHMT capabilities and commitment in assessing Councils’ progress reports submitted to (PMORALG
and MoHSW)
• To short list and summarize observations derived from the evaluation exercise for improvement of the reports
prepared by Councils in future and recommend to the management of the Ministries, for decision making to improve
overall performance of Councils and Regional Secretariats.
• To evaluate quality of the assessment/evaluation criterion in respect of completeness, consistence, accuracy and relevance in measuring the desired results in the implementation of CCHP(s) by LGAs
• To consolidate and recommend to the Basket Financing Committee the evaluation results of the first quarter (July – September 2007) technical and financial implementation reports of the LGAs for approval and funding of third and fourth quarters 2007/08 CCHPs.
Key f indings from the assessmentKey f indings from the assessmentKey f indings from the assessmentKey f indings from the assessment
HHHHealth resourcesealth resourcesealth resourcesealth resources
• Public allocation to health per capita: Total overall budget allocation increased from Tsh 5,332 in financial year
2005/6 to Tsh. 7,819 in financial year 2006/7. The increase is equivalent to about 47 percent over financial year
2005/6.
• Total Government and Donor allocation to health per capita: It is estimated that the development partners provide
more than 40 percent of funding towards the health sector in Tanzania. At the moment it’s not easy to estimate this
because some donor funds are not captured in the MTEF or the external aid database.
• Fund allocation within districts: At the local government level between 2003 and 2006, the share allocated to health
centres and dispensaries has declined a little, and the share allocated to council hospital / CHMT has increased a little.
• Human resource situation: A recent study shows that about half of all doctors were employed in Dar es Salaam
region (52 percent), which had a doctor density per 10,000 populations which was 6 times higher than the national
average. The majority of Assistant Medical Officers are working in the public sector (74 percent) most of them are
working in other regions excluding Dar es Salaam. Many nurses and midwives are concentrated in Dar es Salaam
region (8.5 nurses per 10,000) where as for the remaining 20 mainland regions the nurses-midwife density` ranges
between 1.4 and 5 per 10,000 populations.
• Proportion of public health facilities in a good state of repair and other important service supplies: There is
appreciable improvement in the quality of health facility buildings. 13 out of 16 councils reported improvements in
physical infrastructure. Although cleanliness of facilities was judged by community members to have improved, only a
minority of facilities have electricity supply from the grid and even fewer have running water.
• Availability of drugs: According to the joint annual external evaluation report, the supply of drugs provided by the
medical stores department has improved over the evaluation period of 1999-2006. First the indent and now the
integrated logistics system have been an improvement over the kit system for ordering drugs
Disease controlDisease controlDisease controlDisease control
• The data information from the TB and Leprosy programme shows a steady improvement in treatment completion (cure) rate. In 2006 the cure rate for smear positive cases was 82.6%.
• Although immunization coverage (DPT-HB3) reached as high as 94% in 2004, it has since slipped over each of the last three years, to reach 83% in 2007 (below the MKUKUTA target of 85%).
• HIV prevalence for female 15-24 age group was last measured during the 2004 Tanzania HIV Indicator Survey and was found to be 4.0. Data from sentinel ANC surveillance indicates a significant decline in HIV prevalence among 15-25 year old ANC clients – from 7.6% in 2000/01 to 6.8% in 2005/6. Prevalence decline in this (youngest) age group is an encouraging signal that HIV incidence may also be declining. New nationally-representative, population-based HIV prevalence data is expected in 2008.

3
Health Sector Performance Profile Report | 5/20/2008
Health services ut il izationHealth services ut il izationHealth services ut il izationHealth services ut il ization
• Information reported through Health Management Information System (HMIS) shows an increase in total and per
capital OPD visits (2001-2006). However, this may only reflect an increase in the reporting rather than a true increase
in OPD cases.
• According to the TDHS 2004/5, only 47% of all births take place in a health facility. The incompleteness of HMIS records makes it difficult to reliably estimate trends in institutional delivery on a year-to-year basis.
• Information on morbidity/mortality was generated from the routine data system. The trend shows no changes on top six causes of OPD diagnosis since year 2000 to 2006. For both over-fives and under-fives, malaria, pneumonia and acute respiratory infection are the leading causes of illness. Malaria is also the leading cause of death in both age groups. Among over-fives, HIV/AIDS is the second most common cause of death.
Demographic indicesDemographic indicesDemographic indicesDemographic indices
• Infant mortality rate from 2004/05 Tanzania Demographic and Health Survey (TDHS) reported infant mortality at 68 per 1000 live births, and under-five mortality at 112 per1000 live births. This represents a decline of about 30% compared to the previous (1999) survey.
• Annual disaggregation of the TDHS data shows an even steeper decline within the survey period. For the latest year (2004) under-five mortality was estimated at 83 per 1,000, very close to the MKUKUTA target of 79.
• Life expectancy at birth stood at 51 years (males and females) in 2002 and had barely improved over the previous decade. Slow increase in life expectancy most likely is due to the HIV/AIDS especially among the adult population.
• According to the DHS 2004/5, the latest estimate of total fertility rate (5.7) shows no statistical decline as compared to previous estimates for 1999 and 1996 (5.6 and 5.8 respectively). The estimate of TFR from the 2002 census is not strictly comparable as it is calculated using a slightly different methodology.
Assessment of the 2006 milestonesAssessment of the 2006 milestonesAssessment of the 2006 milestonesAssessment of the 2006 milestones
Most of the milestones were either completed or implementation process reached an advanced level. Out of the 11 milestones, 7
are judged to have been fully achieved and four partially achieved.
Public Expenditure ReviewPublic Expenditure ReviewPublic Expenditure ReviewPublic Expenditure Review
• Huge increase on Development Budget: o Per capita increase of basket fund allocation from $0.5 to $0.75 o Inclusion of Global Fund in the MTEF o Increased Government allocation to Regional Hospitals
• The observed increase in recurrent expenditure is due to more funds allocated to PE and slight increase of OC.
MTEF Performance AnalysisMTEF Performance AnalysisMTEF Performance AnalysisMTEF Performance Analysis
This analysis shows that in FY06/07, 49 percent of activities were fully implemented while 27 percent were partially implemented.
Generally performance level of MTEF was generally good but an improvement is required especially on the development budget
where some funding was not released.
Assessment of counci l health servicesAssessment of counci l health servicesAssessment of counci l health servicesAssessment of counci l health services
StrengthStrengthStrengthStrengthssss
• According to the annual performance indicators reported by 44 (36.4 percent) out of 121 councils shows that there are significant performance improvement in some of the priority areas, namely Reproductive and child health (obstetric care and immunization), Communicable diseases control, Non Communicable diseases and Community Health promotion and other areas.
• Out of 44 Councils, only 5 Councils, Muleba DC, Dodoma DC, Lushoto DC, Ruangwa DC and Tarime DC included in the submitted annual progress reports, the achievements related to performance indicators and remaining 39 councils have reported their annual performance status for the year 2006/07 responding to the request that was made to Councils during the compilation of this report.

4
Health Sector Performance Profile Report | 5/20/2008
• The following RS/RHMTs of Lindi, Tanga, Tabora, Kilimanjaro, Iringa, Arusha and Kigoma Regions have managed to carry out the assessment of the progress reports and compiled results and recommendations.
WeaknWeaknWeaknWeaknessesessesessesesses
• Most of the Councils reports of July –September 2007 have been prepared according to the previous CCHP guideline (March 2004), 98 percent of the Councils have not contributed funds to the CCHP from their own sources in fulfillment of their commitment set for CCHP budget. Such situation is making future sustainability of the anticipated improved delivery of health service initiatives uncertain.
• The requirement of producing the annual implementation reports was interpreted differently from the previous guideline by Councils this has led Councils submit reports as follows, 28 Councils or (23 percent) have prepared and submitted the quarterly reports (April – June 2006/07), 17 Councils or (14 percent) have submitted semi annual reports (January- June 2006/07) and 76 Councils or (63 percent) have submitted the annual reports of July 2006 - June 2007.
• Some of the Councils submitted reports containing arithmetical errors; inconsistencies of figures reported between different tables.

5
Health Sector Performance Profile Report | 5/20/2008
AcronymsAcronymsAcronymsAcronyms
AIDS Acquired Immune Deficiency Syndrome CCHP Comprehensive Council Health Plans CHMTs Council Health management Team CIA Chief Internal Auditor CO Clinical Officer CMO Chief Medical Officer CGCA Chief Government Chemist Agency DED District Executive Director DMOs District Medical Officers DAP Director of Administration and Personnel DPP Director of Policy and Planning DHS Director of Human Resources DPS Director of Priventive Services DPT Diphtheria, Tetanus and Polio Vaccine EPI Expanded Programme of Immunization HIV Humane Immunodeficiency Virus HMIS Health Management Information System HMIS Health Management Information System HRH Human Resources for Health HSPS Health Sector Programme Support HSSP Health Sector Strategic Plan IMCI Integrated Management of Childhood Illnesses IMR Infant Mortality Rate MCH Mother and Child Health MDGs Millennium Development Goals MoF Ministry of Finance MoH Ministry of Health MTEF Medium Term Expenditure Framework NACP National AIDS Control Programme NHI National Health Insurance NIMR National Institute for Medical Research NMCP National Malaria Control Programme NSGRP National Strategy for Growth and Reduction of Poverty NSS National Sentinel Sites NTLP National Tuberculosis and Leprosy Programme PER Public Expenditure Review PHN Public Health Nurse PMO-RALG Prime Ministers Office, Regional Administration and Local Government PRS Poverty Reduction Strategy SWS Social Welfare Services TBAs Traditional Birth Attendants TDHS Tanzania Demographic and Health Survey TFNC Tanzania Food and Nutrition Centre TFR Total Fertility Rate TRCHS Tanzania Reproductive and Child Health Survey U5MR Under-Five Mortality Rate

6
Health Sector Performance Profile Report | 5/20/2008
Table of ContentsTable of ContentsTable of ContentsTable of Contents EXECUTIVE SUMMARY ....................................................................................................... 1
KEY FINDINGS FROM THE ASSESSMENT.................................................................................. 2
HEALTH RESOURCES ................................................................................................... 2
DISEASE CONTROL ..................................................................................................... 2
HEALTH SERVICES UTILIZATION...................................................................................... 3
DEMOGRAPHIC INDICES ............................................................................................... 3
ASSESSMENT OF THE 2006 MILESTONES ............................................................................. 3
PUBLIC EXPENDITURE REVIEW ...................................................................................... 3
MTEF PERFORMANCE ANALYSIS .................................................................................... 3
ASSESSMENT OF COUNCIL HEALTH SERVICES ....................................................................... 3
ACRONYMS .................................................................................................................... 5
CHAPTER 1: INTRODUCTION ............................................................................................... 8
BACKGROUND INFORMATION ............................................................................................ 8
HEALTH SECTOR PERFORMANCE INDICATORS ........................................................................ 8
REVIEW OF THE HEALTH SECTOR MILESTONES ....................................................................... 8
HEALTH SECTOR PUBLIC EXPENDITURE REVIEW ..................................................................... 9
REVIEW OF THE MEDIUM TERM EXPENDITURE FRAMEWORK (MTEF) OF MOHSW ............................ 9
REVIEW OF THE IMPLEMENTATION OF THE COMPREHENSIVE COUNCIL HEALTH PLANS ....................... 10
DATA SOURCES AND QUALITY ........................................................................................... 10
ROUTINE DATA SYSTEM .............................................................................................. 10
ADMINISTRATIVE DATA SYSTEMS ................................................................................... 10
POPULATION BASED INFORMATION ................................................................................ 11
CHAPTER 2: ASSESSMENT OF INDICATORS ............................................................................... 12
FINANCIAL RESOURCES .................................................................................................. 12
PUBLIC ALLOCATION TO HEALTH PER CAPITA ...................................................................... 12
TOTAL GOT AND DONOR ALLOCATION (BUDGET AND OFF-BUDGET) TO HEALTH PER CAPITA ............ 13
PER CAPITA GOVERNMENT OF TANZANIA RECURRENT EXPENDITURE .......................................... 13
ALLOCATION OF GOT RECURRENT HEALTH FUNDING WITHIN COUNCILS ...................................... 14
DISTRIBUTION OF MEDICAL OFFICERS AS A PROPORTION OF THE STAFFING NORMS BY HEALTH FACILITIES14
DISTRIBUTION OF ASSISTANT MEDICAL OFFICERS AS A PROPORTION OF THE STAFFING NORMS BY HEALTH FACILITIES ................................................................................................................. 15 DISTRIBUTION OF PUBLIC HEALTH NURSE AS A PROPORTION OF THE STAFFING NORMS ..................... 15
PROCESS INDICATORS ................................................................................................... 17
NUMBER OF DISTRICTS REPORTING AND SHOWING USE OF HEALTH INFORMATION DATA ................ 17
PROPORTION OF PUBLIC HEALTH FACILITIES IN A GOOD STATE OF REPAIR ................................. 17
NUMBER OF OUTPATIENT ATTENDANCE PER CAPITA ............................................................ 18
PERCENTAGE OF PUBLIC HEALTH FACILITIES WITHOUT ANY STOCK-OUTS OF FOUR TRACER DRUGS AND ONE VACCINE ............................................................................................................... 18
OUTPUTS AND OUTCOME OF HEALTH SERVICES PERFORMANCES ................................................ 18
TB TREATMENT SUCCESS RATE ..................................................................................... 18
TOTAL NUMBER OF FAMILY PLANNING ACCEPTORS (NEW) ................................................... 19
PROPORTION OF POPULATION REPORTING TO BE SATISFIED WITH HEALTH SERVICES ..................... 19
7
Health Sector Performance Profile Report | 5/20/2008
PROPORTION OF CHILDREN WHO RECEIVE THREE DOSES OF DPT3 ......................................... 19
FEMALE HIV PREVALENCE 15-24 AGE GROUP .................................................................... 20
PROPORTION OF BIRTHS ATTENDED BY A SKILLED HEALTH WORKER ........................................ 20
TOP 6 CAUSES OF MORBIDITY AND MORTALITY .................................................................. 21
HEALTH STATUS .......................................................................................................... 22
PERCENTAGE OF MORTALITY ATTRIBUTABLE TO MALARIA AMONG CHILDREN UNDER-FIVE .................. 22
INFANT AND UNDER FIVE MORTALITY RATE (IMR & U5MR) ..................................................... 22
LIFE EXPECTANCY AT BIRTH ............................................................................................ 23
MATERNAL MORTALITY ................................................................................................. 24
PROPORTION OF CHILDREN UNDER-FIVE STUNTED (HEIGHT FOR AGE) ........................................ 24
PROPORTION OF CHILDREN UNDER-FIVE WASTED (WEIGHT FOR HEIGHT) ................................... 24
PROPORTION OF CHILDREN UNDER-FIVE UNDERWEIGHT (WEIGHT-FOR-AGE) ............................... 24
TOTAL FERTILITY RATE ................................................................................................. 25
CHAPTER 3: ASSESSMENT OF THE 2006 MILESTONES ................................................................... 26
CHAPTER 4: ASSESSMENT OF SECTOR FINANCING (WORKPLAN AND BUDGET) .................................... 30
PUBLIC EXPENDITURE REVIEW ......................................................................................... 30
CHAPTER 5: ASSESSMENT OF THE 2006/2007 MTEF .................................................................. 33
MTEF PERFORMANCE ANALYSIS ....................................................................................... 33
CHAPTER 6: ASSESSMENT OF COUNCIL HEALTH SERVICES............................................................ 35
GENERAL FINDINGS AND COMMENTS ON THE REVIEW OF TECHNICAL AND FINANCIAL REPORTS:.......... 35
STRENGTHS ............................................................................................................ 35
WEAKNESSES .......................................................................................................... 35
DETAILED STATISTICAL ANALYSIS OF EVALUATION REPORTS BOTH CCHP AND FINANCIAL PROGRESS .... 36
MEAN, MAXIMUM, MINIMUM AND STANDARD DEVIATION POINTS FOR -1ST QUARTER – JULY – SEPTEMBER 2007. .......................................................................................................................... 36 TECHNICAL AND FINANCIAL PROGRESS REPORTS- JULY – JUNE 2006/07. ................................... 39
MEAN, MAXIMUM, MINIMUM AND STANDARD DEVIATION POINTS FOR JUNE – JULY 2006/07 ........... 39
OVERALL PERFORMANCE ............................................................................................ 41
ANNEXES .................................................................................................................... 43
BIBLIOGRAPHY ............................................................................................................... 74

8
Health Sector Performance Profile Report | 5/20/2008
Chapter 1: IntroductionChapter 1: IntroductionChapter 1: IntroductionChapter 1: Introduction
Background InformationBackground InformationBackground InformationBackground Information
This is a second attempt to produce an analytical report, which provides an assessment on performance of the health
sector in Tanzania Mainland. The first report of this kind was produced in 2004 by a group of local consultants and it
was presented during the Joint Annual Health Sector Review in April, 2005. The report contained trend analysis up to
2004 on selected indicators. Unlike the previous report the current report evaluates progress over a one year period
of health sector performance for FY 2006/2007.
In this report, health sector performance for FY 06/07 has been assessed using selected sector performance
indicators; milestones set during JAHSR 2006; performance against the MTEF annual work plan and assessment of
the Comprehensive Council Health Plans. The key findings from the Public Expenditure Review (PER) are also
included. The purpose of health sector annual review and performance report is to have a snapshot of whether things
are going as expected.
Health Sector Performance IndicatorsHealth Sector Performance IndicatorsHealth Sector Performance IndicatorsHealth Sector Performance Indicators
The health sector has several systems that generate health indicators for various purposes. Since it is not possible to
employ all indicators to assess the sector’s performance, 33 indicators were selected and accepted by stakeholders.
They assess progress towards targets included in the MKUKUTA and MDGs, among others. The general objective is
to assess and evaluate efficiency, effectiveness and impact of health delivery services in the country. Also, some of
the selected indicators are used to assess strategic initiatives. The indicators are grouped into four major categories,
as follows:
1. Input indicators (financial and human resources)
2. Process indicators (infrastructure, supplies, use of information etc)
3. Output indicators (services delivered)
4. Impact indicators (health status outcomes)
Review of the Health Sector MilestonesReview of the Health Sector MilestonesReview of the Health Sector MilestonesReview of the Health Sector Milestones
Because different strategies need to be implemented in order to attain the desired results over the short term, each
Joint Annual Health Sector Review (JAHSR) agrees upon annual “milestones”, which are evaluated in the following
health sector review. Health Sector Milestones basically have been targeting very challenging areas, and identify
where all parties expected to see progress over next year. For year 2006 (to report on attainment in 2007) milestones
were set on the following areas: -
• Drugs and medical supplies
• Availability of financial resources
• Public Private Partnership
• Availability of Human Resources

9
Health Sector Performance Profile Report | 5/20/2008
• Sector Evaluation and Monitoring
• HIV/AIDS
• Reproductive and child health
• SWAP
• Social Welfare
Health Sector Health Sector Health Sector Health Sector Public Expenditure Review Public Expenditure Review Public Expenditure Review Public Expenditure Review
The main objectives of PER FY07 are to:
• Strengthen Ministry of Health and Social Welfare's position in tracking health allocation and expenditure
trends with the view of improving equity and efficiency in resource allocation within the sector;
• Improve ex-ante coverage of program support and development partner funded projects in the Ministry of
Health and Social Welfare budget;
• Provide support to the implementation and monitoring of the MKUKUTA;
• Review the PER Health FY06 findings and actions taken by the Sector in response to those findings,
indicating unaccomplished/pending actions and reasons;
• Analyze the recurrent and development budget performance for the past three-years (aggregate actual
versus budget);
• Establish trends of government allocation and expenditures to the health sector at sectoral and sub-sectoral
level and assess whether and how far these trends reflect policy objectives;
• Review deviations in overall budget performance and factors constraining the allocations of resources;
• Determine the extent of off-budget spending and suggest way to improve its coverage within the budget;
• Provide estimates to feed into budget guidelines for 2008/09;
• Compare the financial requirements for meeting MKUKUTA targets to project resource availability for the
sector using mainly the ESRF Health Sector MKUKUTA Costing Document;
• Assess the impact on the adoption of more expensive technologies for existing activities in the Health
Sector;
• Undertake a detailed analysis of health income and expenditure at the council level which should provide a
good overview on financial flows and how the resources are being allocated in the assessed councils.
Review of the Medium Term Expenditure Framework (MTEF) of MoHSW Review of the Medium Term Expenditure Framework (MTEF) of MoHSW Review of the Medium Term Expenditure Framework (MTEF) of MoHSW Review of the Medium Term Expenditure Framework (MTEF) of MoHSW
In Tanzania, the MTEF is a 3-year rolling work plan and budget. In order to plan strategically, it is important to
analyze the performance of MTEF for the just concluded financial year. This report looks at the MTEF of FY06/07,
assessing implementation progress and limitations encountered. The assessment is very important because the
Ministry has been allocating resources to strategic interventions with greatest impact in promoting health status of the
population in the country.

10
Health Sector Performance Profile Report | 5/20/2008
Review of the Implementat ion of thReview of the Implementat ion of thReview of the Implementat ion of thReview of the Implementat ion of the Comprehensive Council Health Planse Comprehensive Council Health Planse Comprehensive Council Health Planse Comprehensive Council Health Plans
At district level, the CCHPs describe their annual work plans and budgets. Councils report quarterly on their
performance. An improvement in the quality of the CCHPs year on year is one measure of improvement. A summary
assessment is presented of the quality of annual plans (FY2006/7) and first quarter progress reports. The intention is
to identify how the quality of planning and reporting can be improved in subsequent years.
Data Data Data Data Sources and Sources and Sources and Sources and QualityQualityQualityQuality
The Statistics used in this report have originated from different sources. Each source has its own strengths and
weaknesses which need to be known in order to make a meaningful interpretation to the information provided.
Source of data include: Routine data systems; Administrative Data Systems and Population Based Surveys.
Routine Data SystemRoutine Data SystemRoutine Data SystemRoutine Data System
A number of indicators have been generated from routine data systems. These include Health Management
Information System (HMIS), TB & Leprosy, NACP and others. The advantage of HMIS is that it is expected to collect
data from all health facilities (public, private, faith-based and parastatal).
Although HMIS is well established system it has its own limitations. Most of the information generated through HMIS
is facility-based which is biased in terms of coverage since not all people seek health services from health facilities.
Another problem of HMIS information is that the system is faced with operational problems which cause under-
reporting, incompleteness of the reports, poor timeliness and weak capacity in data analysis at all levels of health
delivery systems. This has resulted in poor data quality. In this regard, indicators from HMIS need to be interpreted
cautiously.
Programs like TB & Leprosy, EPI and NACP have their own systems, which collect more detailed information. Since
these systems are well-funded and closely monitored, the quality of data is of acceptable standard.
The NACP system provides information on the magnitude of HIV/AIDS which is monitored using two main indicators;
HIV prevalence among women aged 15 to 24 years and percentage of children born to HIV infected mothers who are
HIV positive. Data for calculating the former are available through a biannual survey at (a growing number of)
sentinel antenatal clinics. However, data for the latter is lacking because it is impractical to determine the true HIV
status of the newborns of HIV+ mothers.
According to the NTLP, patients completing treatment are those who have used anti-tuberculosis drugs continuously
for a period of 8 months regardless of their outcome. In contrast, the “cure rate” measures the proportion of smear
positive cases certified smear negative on the conclusion of their treatment. The HIV epidemic in Tanzania has
resulted in a growing number of smear-negative cases, so that the traditional “cure rate” indicator comprises only a
fraction of all TB patients. The proportion of smear-positive TB cases treated successfully (cured) has risen from
around 80% in 2001 and 2002 to 82.6% in 2005.
Administrative Data SystemsAdministrative Data SystemsAdministrative Data SystemsAdministrative Data Systems
Administrative records involve information on financial statistics. Information from accounts are among of the
administrative records and it is widely used to develop National Health Accounts Reports as well as Public
Expenditure Review (PER).
11
Health Sector Performance Profile Report | 5/20/2008
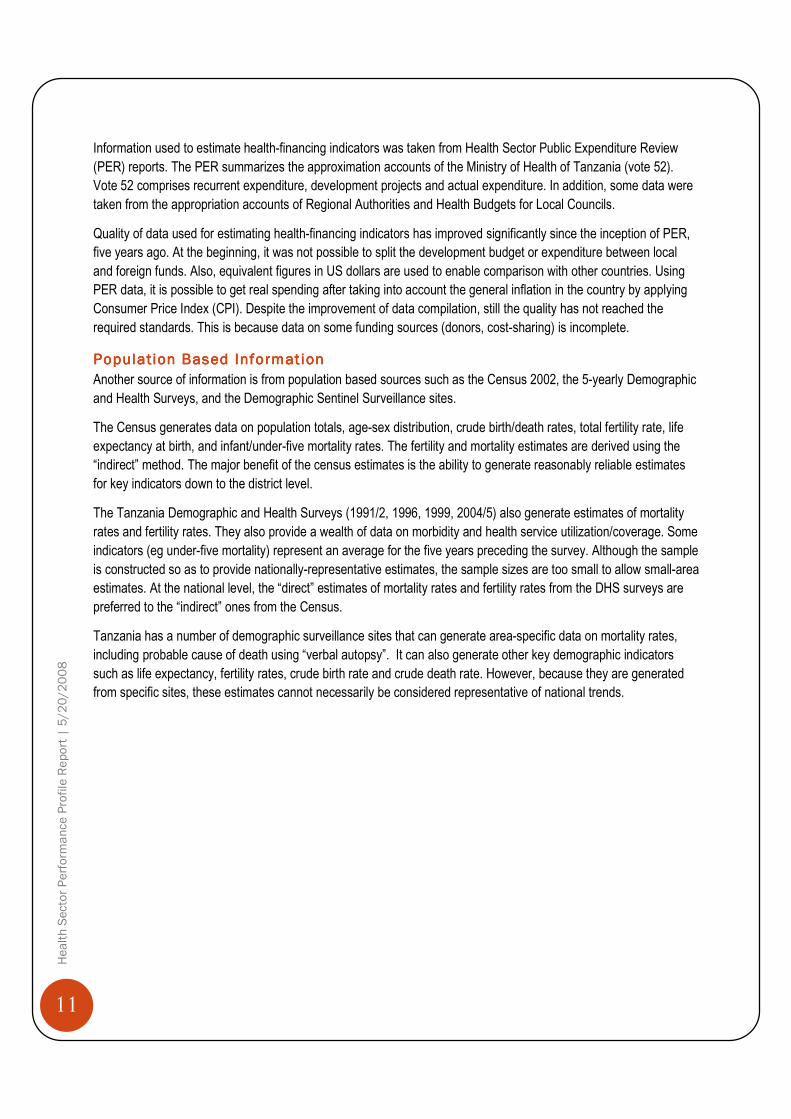
Information used to estimate health-financing indicators was taken from Health Sector Public Expenditure Review
(PER) reports. The PER summarizes the approximation accounts of the Ministry of Health of Tanzania (vote 52).
Vote 52 comprises recurrent expenditure, development projects and actual expenditure. In addition, some data were
taken from the appropriation accounts of Regional Authorities and Health Budgets for Local Councils.
Quality of data used for estimating health-financing indicators has improved significantly since the inception of PER,
five years ago. At the beginning, it was not possible to split the development budget or expenditure between local
and foreign funds. Also, equivalent figures in US dollars are used to enable comparison with other countries. Using
PER data, it is possible to get real spending after taking into account the general inflation in the country by applying
Consumer Price Index (CPI). Despite the improvement of data compilation, still the quality has not reached the
required standards. This is because data on some funding sources (donors, cost-sharing) is incomplete.
Population Based InformationPopulation Based InformationPopulation Based InformationPopulation Based Information
Another source of information is from population based sources such as the Census 2002, the 5-yearly Demographic
and Health Surveys, and the Demographic Sentinel Surveillance sites.
The Census generates data on population totals, age-sex distribution, crude birth/death rates, total fertility rate, life
expectancy at birth, and infant/under-five mortality rates. The fertility and mortality estimates are derived using the
“indirect” method. The major benefit of the census estimates is the ability to generate reasonably reliable estimates
for key indicators down to the district level.
The Tanzania Demographic and Health Surveys (1991/2, 1996, 1999, 2004/5) also generate estimates of mortality
rates and fertility rates. They also provide a wealth of data on morbidity and health service utilization/coverage. Some
indicators (eg under-five mortality) represent an average for the five years preceding the survey. Although the sample
is constructed so as to provide nationally-representative estimates, the sample sizes are too small to allow small-area
estimates. At the national level, the “direct” estimates of mortality rates and fertility rates from the DHS surveys are
preferred to the “indirect” ones from the Census.
Tanzania has a number of demographic surveillance sites that can generate area-specific data on mortality rates,
including probable cause of death using “verbal autopsy”. It can also generate other key demographic indicators
such as life expectancy, fertility rates, crude birth rate and crude death rate. However, because they are generated
from specific sites, these estimates cannot necessarily be considered representative of national trends.
12
Health Sector Performance Profile Report | 5/20/2008
Chapter 2: Chapter 2: Chapter 2: Chapter 2: Assessment of IndicatorsAssessment of IndicatorsAssessment of IndicatorsAssessment of Indicators
FinancialFinancialFinancialFinancial ResourcesResourcesResourcesResources
Amongst key and important monitoring and evaluation indicators are those related to health financing. By understanding the problem, the Government of Tanzania has explored a number of ways in an attempt to bridge the existing financial gaps to support the government’s main source, which is through taxation. New additional sources for revenue that have been adopted are Health Insurance, Community Health Fund and Cost-Sharing. The essence of having financial indicators is to permit close monitoring to ensure availability of adequate resources that are channelled to the health sector by both Government of Tanzania and development partners.
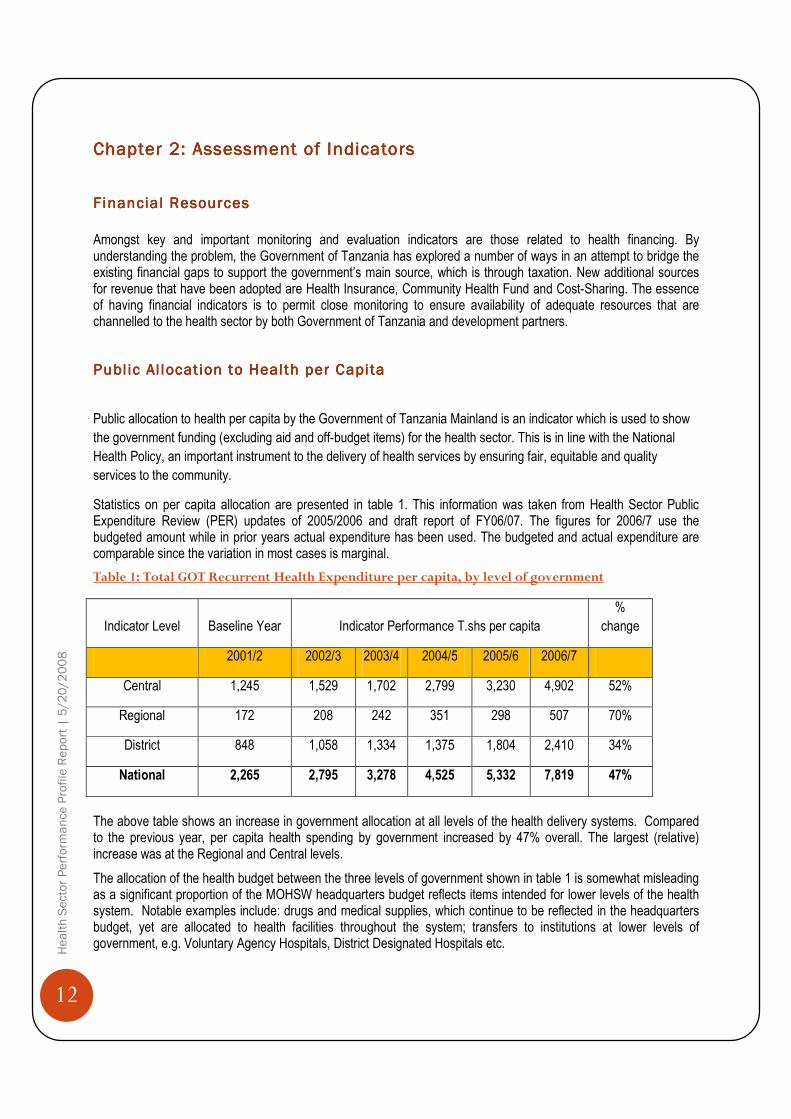
Public Al locat ion to Health per CapitaPublic Al locat ion to Health per CapitaPublic Al locat ion to Health per CapitaPublic Al locat ion to Health per Capita
Public allocation to health per capita by the Government of Tanzania Mainland is an indicator which is used to show
the government funding (excluding aid and off-budget items) for the health sector. This is in line with the National
Health Policy, an important instrument to the delivery of health services by ensuring fair, equitable and quality
services to the community.
Statistics on per capita allocation are presented in table 1. This information was taken from Health Sector Public Expenditure Review (PER) updates of 2005/2006 and draft report of FY06/07. The figures for 2006/7 use the budgeted amount while in prior years actual expenditure has been used. The budgeted and actual expenditure are comparable since the variation in most cases is marginal.
Table 1: Total GOT Recurrent Health Expenditure per capita, by level of government
Indicator Level Baseline Year Indicator Performance T.shs per capita
%
change
2001/2 2002/3 2003/4 2004/5 2005/6 2006/7
Central 1,245 1,529 1,702 2,799 3,230 4,902 52%
Regional 172 208 242 351 298 507 70%
District 848 1,058 1,334 1,375 1,804 2,410 34%
National 2,265 2,795 3,278 4,525 5,332 7,819 47%
The above table shows an increase in government allocation at all levels of the health delivery systems. Compared to the previous year, per capita health spending by government increased by 47% overall. The largest (relative) increase was at the Regional and Central levels.
The allocation of the health budget between the three levels of government shown in table 1 is somewhat misleading as a significant proportion of the MOHSW headquarters budget reflects items intended for lower levels of the health system. Notable examples include: drugs and medical supplies, which continue to be reflected in the headquarters budget, yet are allocated to health facilities throughout the system; transfers to institutions at lower levels of government, e.g. Voluntary Agency Hospitals, District Designated Hospitals etc.

13
Health Sector Performance Profile Report | 5/20/2008
Total GoT and Donor Allocation (Budget and OffTotal GoT and Donor Allocation (Budget and OffTotal GoT and Donor Allocation (Budget and OffTotal GoT and Donor Allocation (Budget and Off ----budget) to Health per capitabudget) to Health per capitabudget) to Health per capitabudget) to Health per capita
This indicator assesses trends in expenditure on health services by government and donors combined. It includes
“off-budget” aid. Table 2 shows that total funding (GOT plus Donor) for health has doubled between 2002/3 and
2007/8. The last year in the series shows a 9% increase compared to 2006/71. It is estimated that the Development
Partners approximately provide more than 40 percent of funding towards the health sector in Tanzania.
Table 2. Total GoT and Donor Allocation to health per Capita T.Shs
Baseline Year Indicator Performance % change
2001/2 2002/3 2003/4 2004/5 2005/6 2006/7 2007/8
5,100 6,361 6,868 8,815 12,389 12,130 13,193 9%
Per Capita Per Capita Per Capita Per Capita Government of TanzaniaGovernment of TanzaniaGovernment of TanzaniaGovernment of Tanzania Recurrent Expenditure Recurrent Expenditure Recurrent Expenditure Recurrent Expenditure
This indicator looks at the allocation of government recurrent expenditure between three main categories. The “Administration” category comprises MOHSW HQ administration, NIMR and TFNC. “Hospitals” comprises the national, referral, regional, council and FBO hospitals. “Preventive” includes the preventive component of recurrent budgets at central, regional and council level (PER update FY06, Annex G, Table 15). Updated figures for 2005/6 and 2006/7 are not available pending the completion of the PER update 2007.
FIGURE 1 MOHSW RECURRENT SPENDING BY CATEGORY, FY03-FY05
SOURCE: HEALTH SECTOR PER UPDATE FY06, FIG.6
The indicator tracks over-time the levels of resources being spent on PHC in comparison to hospital services as well as identifying any significant shift of Government of Tanzania resources between two services/levels.
1 Figures for 2007/8 and the comparison to FY2006/7 are provisional, pending finalisation of the PER.
16% 14% 13%
41% 43% 43%
44% 42% 44%
0%
10%
20%
30%
40%
50%
60%
70%
80%
90%
100%
FY03 FY04 FY05
Total Preventive/Primary
Total hospitalsMOH Admin, NIMR and TFNC
14
Health Sector Performance Profile Report | 5/20/2008
The share of government recurrent expenditure on health devoted to preventive/primary care shows no consistent trend over the period FY2003-2005, although the proportion spent on central administration has diminished a little. It should be noted that this analysis excludes expenditures funded by aid and cost-sharing.
Allocat ion of GOT recurrent health funding within CouncilsAl locat ion of GOT recurrent health funding within CouncilsAl locat ion of GOT recurrent health funding within CouncilsAl locat ion of GOT recurrent health funding within Councils
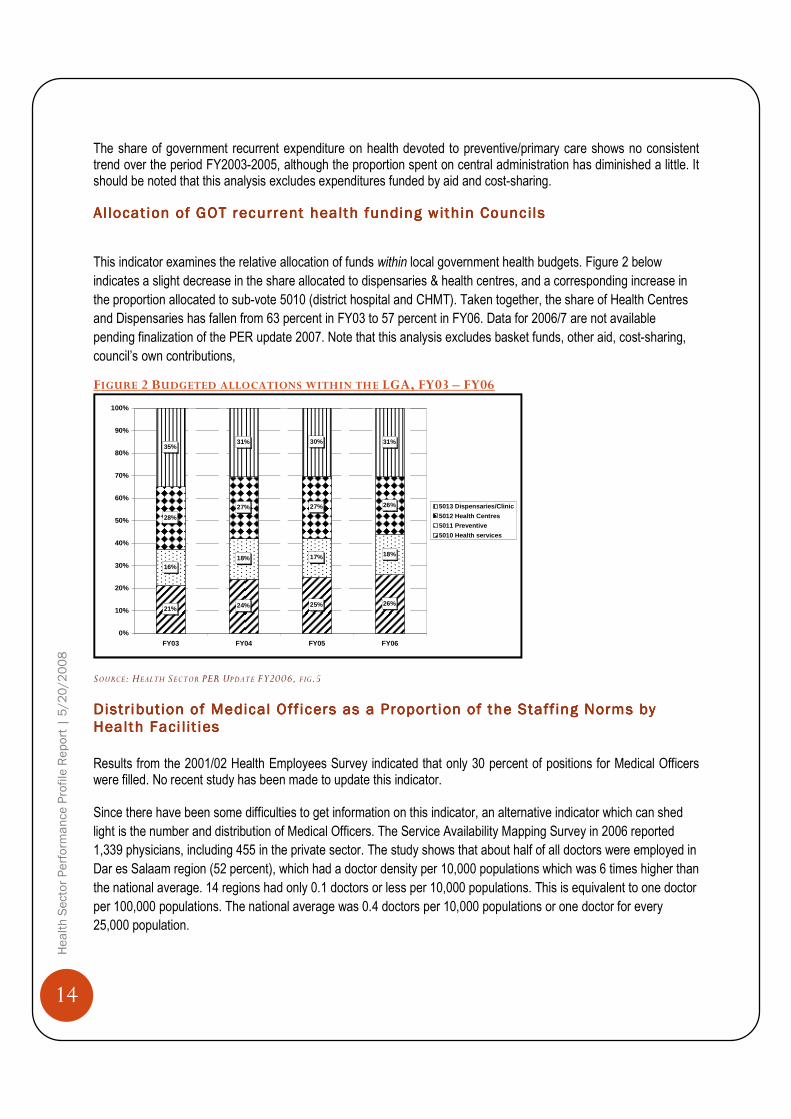
This indicator examines the relative allocation of funds within local government health budgets. Figure 2 below
indicates a slight decrease in the share allocated to dispensaries & health centres, and a corresponding increase in
the proportion allocated to sub-vote 5010 (district hospital and CHMT). Taken together, the share of Health Centres
and Dispensaries has fallen from 63 percent in FY03 to 57 percent in FY06. Data for 2006/7 are not available
pending finalization of the PER update 2007. Note that this analysis excludes basket funds, other aid, cost-sharing,
council’s own contributions,
FIGURE 2 BUDGETED ALLOCATIONS WITHIN THE LGA, FY03 – FY06
SOURCE: HEALTH SECTOR PER UPDATE FY2006, F IG.5
Distribution of Medical Off icers as a Proportion of the Staff ing Norms by Distribution of Medical Off icers as a Proportion of the Staff ing Norms by Distribution of Medical Off icers as a Proportion of the Staff ing Norms by Distribution of Medical Off icers as a Proportion of the Staff ing Norms by Health Faci l it iesHealth Faci l it iesHealth Faci l it iesHealth Faci l it ies
Results from the 2001/02 Health Employees Survey indicated that only 30 percent of positions for Medical Officers were filled. No recent study has been made to update this indicator. Since there have been some difficulties to get information on this indicator, an alternative indicator which can shed
light is the number and distribution of Medical Officers. The Service Availability Mapping Survey in 2006 reported
1,339 physicians, including 455 in the private sector. The study shows that about half of all doctors were employed in
Dar es Salaam region (52 percent), which had a doctor density per 10,000 populations which was 6 times higher than
the national average. 14 regions had only 0.1 doctors or less per 10,000 populations. This is equivalent to one doctor
per 100,000 populations. The national average was 0.4 doctors per 10,000 populations or one doctor for every
25,000 population.
21% 24% 25% 26%
16%18% 17% 18%
28%
27% 27% 26%
35%31% 30% 31%
0%
10%
20%
30%
40%
50%
60%
70%
80%
90%
100%
FY03 FY04 FY05 FY06
5013 Dispensaries/Clinic
5012 Health Centres
5011 Preventive
5010 Health services

15
Health Sector Performance Profile Report | 5/20/2008
Figure 3 shows Doctors plus Assistant Medical Officers per 10,000 populations in each region. Here the assumption is that many of the functions of doctors are performed by assistant medical officers (AMOs), who have received a clinical training similar to that of general physicians. The total number of AMOs in Tanzania was about the same as physicians, and the majority are working in the public sector. Regions with the fewest MO/AMO per population were Shinyanga, Tabora, Kagera, Mbeya and Rukwa regions. Figure 3 Doctors and Assistant Medical Officers (AMO) per 10 000 population, Tanzania SAM 2006
Distribution of Assistant Medical Officers as a Proportion of the Staffing Distribution of Assistant Medical Officers as a Proportion of the Staffing Distribution of Assistant Medical Officers as a Proportion of the Staffing Distribution of Assistant Medical Officers as a Proportion of the Staffing Norms by Health Faci l i t iesNorms by Health Faci l i t iesNorms by Health Faci l i t iesNorms by Health Faci l i t ies
The 2001/02 Health Employees Survey shows that 23 percent of positions for Assistant Medical Officers were filled leaving a gap of 75+ percent of all positions still vacant. No recent study has been conducted to update this indicator. The combined situation for MO and AMO is portrayed in the figure above.
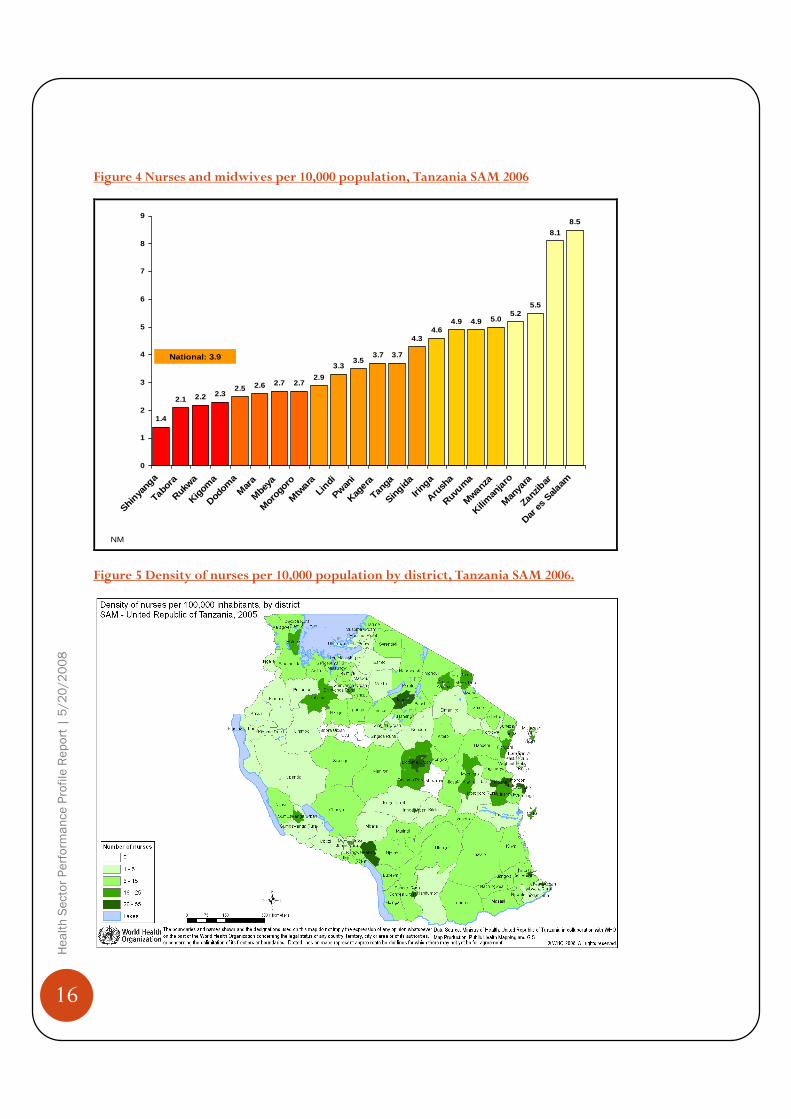
Distribution of Distribution of Distribution of Distribution of Public Health Nurse as a Proportion of the Staffing NormsPublic Health Nurse as a Proportion of the Staffing NormsPublic Health Nurse as a Proportion of the Staffing NormsPublic Health Nurse as a Proportion of the Staffing Norms
The SAM results show that a total of 4,841 nurses and 9,990 nurse-midwives were found at district level,
corresponding to 1.3 nurses and 2.6 nurse-midwives per 10,000 population. The combined cadre of nurses and
midwives shows that there is a density of nearly 4 per 10,000 populations. Many nurses and midwives are
concentrated in Dar es Salaam region (8.5 nurses per 10,000) whereas for the remaining 20 mainland regions the
nurse-midwife density ranges between 1.4 and 5 per 10,000 populations. Figures 4 and 5 show that Shinyanga,
Tabora ,Rukwa and Kigoma regions are in a critical situation.
0.2 0.3 0.3 0.3 0.3 0.4 0.4 0.4 0.4 0.4 0.5 0.5 0.5 0.50.6
0.60.8
0.8
1.0 1.0
1.2
3.3
0
0.5
1
1.5
2
2.5
3
3.5
Shinya
nga
Tabo
ra
Kagera
Mbe
ya
Rukwa
Kigom
aLin
di
Mtw
ara
Dodom
a
Man
yara
Singida
Mar
aIrin
g a
Mor
ogor
o
Ruvum
a
Tang
a
Kiliman
jaro
Pwani
Mwanz
a
Zanz
ibar
Arush
a
Dar es
Salaam
Doc
tors
& A
MO
per
10
000
popu
latio
n
National: 0.7
Doctors
16
Health Sector Performance Profile Report | 5/20/2008
Figure 4 Nurses and midwives per 10,000 population, Tanzania SAM 2006
1.4
2.1 2.2 2.32.5 2.6 2.7 2.7
2.9
3.33.5
3.7 3.7
4.34.6
4.9 4.9 5.05.2
5.5
8.1
8.5
0
1
2
3
4
5
6
7
8
9
Shiny
anga
Tabor
a
Rukwa
Kigom
a
Dodom
aM
ara
Mbe
ya
Mor
ogoro
Mtw
araLin
di
Pwani
Kagera
Tanga
Singida
Irin ga
Arush
a
Ruvum
a
Mwan
za
Kil im
anja
ro
Man
yara
Zanzib
ar
Dar e
s Sala
am
National: 3.9
NM
Figure 5 Density of nurses per 10,000 population by district, Tanzania SAM 2006.

17
Health Sector Performance Profile Report | 5/20/2008
Process IndicatorsProcess IndicatorsProcess IndicatorsProcess Indicators
Process indicators in health care are used to monitor and measure implementation of activities in a program setting; usually on an annual basis. These are proxy indicators which provide information on the quality of health services in the country.
Number of districts report ing and showing use of Number of districts report ing and showing use of Number of districts report ing and showing use of Number of districts report ing and showing use of Health Information DHealth Information DHealth Information DHealth Information Dataataataata
This particular indicator examines the extent to which district authorities use data including HMIS, NSS and performance monitoring to make evidence-based plans. The study by Mboera et al in 12 districts of Tanzania in 2004 concluded that reporting systems in Tanzania were generally weak - indicating only 33 percent completeness for monthly and quarterly reports. None of the 12 districts met the national target of receiving 80 percent of the expected reports on time. So far, no systematic evaluation has been done at the district level to assess the use of data for planning. Using information provided by Joint External Evaluation, consultants revealed that all Councils use the HMIS data for preparing their CCHP. Unfortunately, the collected information is largely forwarded without in-depth analysis at lower level. The district self-assessment found that only five out of 16 districts claim that the HMIS enhances planning while six out of 16 claimed that it facilitates drug procurement. In general it can be concluded that there have been slight improvement in data utilization in different aspects of health services delivery. The likely reason for lack of data analysis and utilization by CHMT members is that they do not have sufficient experience needed for data analysis and interpretation.
Proportion of Public Health Facil i t ies in a Good State of RepairProportion of Public Health Facil i t ies in a Good State of RepairProportion of Public Health Facil i t ies in a Good State of RepairProportion of Public Health Facil i t ies in a Good State of Repair
One key indication of improvement of quality of care in the implementation of reforms includes renovation and repair of health facilities as well as availability of electricity, water and communication services. The MoHSW envisages rationalizing health facilities infrastructure network, facilitating rehabilitation and promoting maintenance systems for health facilities, equipment and instruments. One key issue is existence of good preventive maintenance plans. A portion of the basket funds and a small amount of money that is set aside by the department of health at the district level have enabled districts to develop good maintenance plans. Information from JAHR consultants and SAM results provide a general picture on the status of infrastructure. For example, in all districts visited by a team of consultants they noted significant construction, renovation and upgrading of health facilities. Based on self assessment, 13 out of 16 councils saw renovation and construction as a positive change. However, important issues such as water and electricity supply have not been resolved, hampering health service delivery considerably. According to SAM results of 2006 all districts were asked to estimate the proportion of health facilities that have water supply from an improved source, defined as piped water, protected spring or well, rain water or tanker truck. There were four options: all, over 50 percent; less than 50 percent, and none. Overall, 11 districts (9 percent) responded that all health facilities had access to improved water supplies. Another 43 districts (35 percent) indicated that more than half of facilities had safe water supplies. The majority of districts (52 percent) reported that less than half of the facilities had access to safe water. Four districts (3 percent) reported no access. On the availability of electricity, only 50 percent of government HFs receives electricity from the grid. Some health centers do not have a solar panel and most of public hospitals do not get continuous electricity supply. On the side of communication equipment there is a notable improvement. The presence of good communication
facilities enables the district health services to communicate effectively and efficiently within and outside the district.
The SAM included questions on the presence of computers, internet, and different telephone services. Availability of
18
Health Sector Performance Profile Report | 5/20/2008
communication equipment in districts is that four out of five districts had (working) landline telephones. Among the
128 districts nearly all had access to cellular networks, and almost all reportedly had cellular phones. Only one
district did not have any type of telephone connection (Namtumbo). Just over half of districts had shortwave radio. All
but four districts had computers (97 percent), but the majority did not have internet connections. About 1 in 5 health
management teams in Tanzania's districts were connected to the internet.
Number of outpatient attendance per capitaNumber of outpatient attendance per capitaNumber of outpatient attendance per capitaNumber of outpatient attendance per capita
Health service utilization is a key indicator in assessing performance of the heath sector. High utilisation implies good access to services. Although annual data on the number of OPD consultations indicates an upward trend, this data is subject to significant omissions, making it difficult to conclude that there has been a “real” increase in OPD consultations per capita. Nonetheless, the estimate from the Household Budget Survey 2001/2 of 1.2 outpatient visits per capita per year at government clinics was already quite high by international comparison. The forthcoming household budget survey in 2008/9 will provide a new estimate of health service utilization.
Percentage of Public Health faci l it iesPercentage of Public Health faci l it iesPercentage of Public Health faci l it iesPercentage of Public Health faci l it ies without any Stockwithout any Stockwithout any Stockwithout any Stock----outs of Four Tracer outs of Four Tracer outs of Four Tracer outs of Four Tracer Drugs and One Vaccine Drugs and One Vaccine Drugs and One Vaccine Drugs and One Vaccine
This indicator is supposed to measure the proportion of facilities experiencing stock-outs of tracer commodities. This information is not systematically available from the HMIS. However, the Joint External Evaluation concludes that the supply of drugs provided by the Medical Stores Department has improved over the evaluation period of 1999 – 2006. First the Indent and now the Integrated Logistics System have been an improvement over the kit system for ordering drugs. Also, the availability of the alternative sources like NHI, CHF and user fees has improved the availability of drugs, especially in hospitals. However, shortages and delays in a delivery are still common.
Outputs and Outcome of HealtOutputs and Outcome of HealtOutputs and Outcome of HealtOutputs and Outcome of Health Services Performances h Services Performances h Services Performances h Services Performances
TB Treatment Success RateTB Treatment Success RateTB Treatment Success RateTB Treatment Success Rate
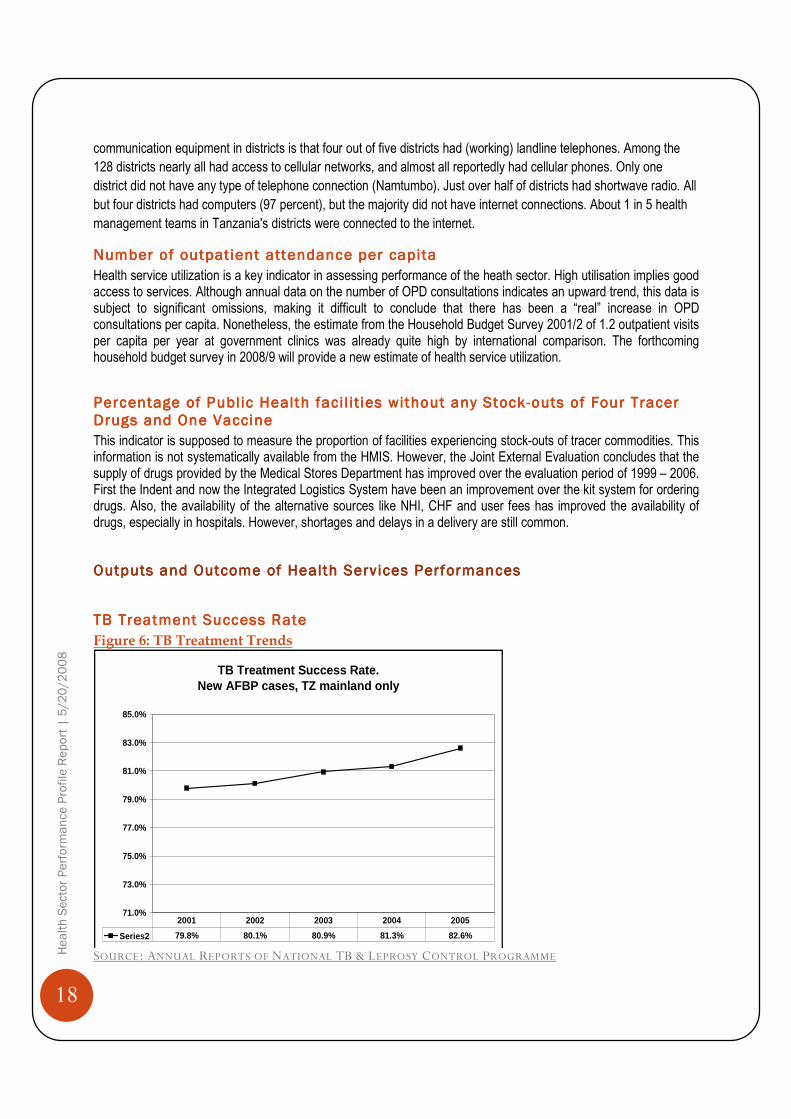
Figure 6: TB Treatment Trends
SOURCE: ANNUAL REPORTS OF NATIONAL TB & LEPROSY CONTROL PROGRAMME
TB Treatment Success Rate. New AFBP cases, TZ mainland only
71.0%
73.0%
75.0%
77.0%
79.0%
81.0%
83.0%
85.0%
Series2 79.8% 80.1% 80.9% 81.3% 82.6%
2001 2002 2003 2004 2005

19
Health Sector Performance Profile Report | 5/20/2008
Performance in TB/Leprosy Programme is measured using proportion of TB “treatment completion rate”. A patient is said to have completed treatment after using anti-tuberculosis continuously for eight months. In contrast, the “cure rate” measures the proportion of smear-positive cases certified cured on the conclusion of their treatment. The HIV epidemic in Tanzania has resulted in a growing number of smear-negative cases, so that the traditional “cure rate” indicator comprises only a fraction of all TB patients. The proportion of smear-positive TB cases treated successfully (cured) has risen from around 80% in 2001 and 2002 to 82.6% in 2005 (shown in Figure 6, below).There is a lag period on the data reported of about one year awaiting treatment completion results of the patients enrolled at the end of the previous reporting year.
Total Number of Family PlanTotal Number of Family PlanTotal Number of Family PlanTotal Number of Family Planning Acceptors (New)ning Acceptors (New)ning Acceptors (New)ning Acceptors (New)
This indicator is used to measure family planning services. It is reported by each facility through the HMIS monthly reports and compiled by the RCH Unit annually. In 2006, among the estimated 7.7 million women aged 15-49, 36% received modern family planning methods (vs. 23% in 2000), and 16% were registered as new contraceptive users. The financing and provision of contraceptives improved from 2005 when the MOHSW and MSD conducted their first large procurement of contraceptives with funds allocated within the MTEF increased.
Proportion of Populat ion report ing to be satisf ied with health servicesProportion of Populat ion report ing to be satisf ied with health servicesProportion of Populat ion report ing to be satisf ied with health servicesProportion of Populat ion report ing to be satisf ied with health services
A high percentage of clients expressing satisfaction of health services are an indication of improvement in the quality of care of health care services. Information on clients’ satisfaction was collected from various surveys in the past such as TDHS, TRCHS, HHBS and NIMR/MOH. The only recent information on general client satisfaction was revealed by a team of consultants who did Joint Annual Health Sector Evaluation. In their assessment they identified evidence of improvements in service quality in the areas of an improved ability of health facilities to deal with malaria and HIV/AIDS, improved vitamin supplement programmes, some improvements in drug supply, improved cleanliness of facilities, and improved staff attitudes and capacities. However, the absence a standardised method for assessing client satisfaction means that it is not possible to make direct comparison of survey results or provide a definitive assessment of trends in satisfaction.
Proportion of Chi ldren who receive Proportion of Chi ldren who receive Proportion of Chi ldren who receive Proportion of Chi ldren who receive TTTThree hree hree hree DDDDoses ofoses ofoses ofoses of DPT3DPT3DPT3DPT3
Immunization is one of the preventive strategies of disease control. This indicator enables monitoring of immunization of children against the five preventable diseases. Also, immunization is considered to have high impact on child mortality reduction. Results from the EPI Unit, collects monthly HMIS data which is validated at annual EPI meetings. The denominator population (below 12 months of age) is recalculated using official NBS population projections. Figure 7: Immunisation Coverage Trends
SOURCE: EPI UNIT
87%89% 89%
94%
90%87%
83%
75%
80%
85%
90%
95%
2001 2002 2003 2004 2005 2006 2007
DPT-HB3 coverage 0-11 months

20
Health Sector Performance Profile Report | 5/20/2008
Routine EPI data indicates an upward trend between 2000 and 2004. However, the data suggest there has been significant slippage in 2005, 2006 and 2007 and this is a cause for concern. The latest figure of 83% has slipped below the MKUKUTA target of 85%.
Female Female Female Female HIV Prevalence 15HIV Prevalence 15HIV Prevalence 15HIV Prevalence 15 ----24 age group24 age group24 age group24 age group
This indicator is a proxy for new infections. The first and only population-based estimate comes from the 2004 Tanzania HIV Indicator Survey and was found to be 4.0% (females), 3.0% (males), 3.55% (all). The results of the second THIS will be reported upon in the 2007/08 Annual Performance Report. NACP monitors HIV prevalence through sero-survey of antenatal clients at a growing number of sentinel ANC clinics. The data show a significant decline in HIV+ rates for all ANC clients between 2000/1 and 2005/6. Figure 8: HIV prevalence in ANC clients
Source: NACP. HIV/AIDS/STI Surveillance Report, Report #20, 2007
Proportion of births attended by a skil led Health WorkerProportion of births attended by a skil led Health WorkerProportion of births attended by a skil led Health WorkerProportion of births attended by a skil led Health Worker
Although the DHS data can report deliveries according to the person who assisted, this data is not available from the HMIS. According to the TDHS 2004/5, the proportion of women (Mainland Tanzania) who delivered with skilled assistance2 in the five years before the survey was 46% (81% urban; 38% rural). This represents no change on the rates measured in 1999 and 1996. The proportion of births that take place in a health facility3 and is almost the same as the skilled assistance figures (mainland total 47%; urban 81%; rural 39%). It should be feasible to estimate the latter indicator on an annual basis, taking all facility-based deliveries recorded by the HMIS as the nominator, and the expected number of births that year (from NBS Population Projections, Volume 12, December 2006) as the denominator. However, reliable nominator figures are not presently available.
2 MO/AMO, CO/ACO, Nurse/Midwife, MCH Aide. 3 Public, voluntary or private health facility
HIV Prevalence ANC Attendees
8.2%8.7%9.6%
6.8%7.4%7.6%
0.0%
2.0%
4.0%
6.0%
8.0%
10.0%
12.0%
2000/01 2003/04 2005/06
All Ages15-24yrs
24 sites 92 sites57 sites

21
Health Sector Performance Profile Report | 5/20/2008
Top 6 causes of morbidity Top 6 causes of morbidity Top 6 causes of morbidity Top 6 causes of morbidity and mortal ityand mortal ityand mortal ityand mortal ity
Information on morbidity and mortality was generated from routine data. Top six leading diseases in OPD
attendances and top six leading killer diseases are shown in tables 3 and 4.
Table 3 Top Six Causes of Morbidity among OPDs Year Top six causes of morbidity among OPDs
Age < 5 years Age 5 years and above
2000
(Baseline
Year)
1. Malaria 2. Acute Respiratory Infections 3. Pneumonia 4. Diarrhea diseases 5. Eye Infections 6. Intestinal Worms
38.5% 14.4%
8.8% 7.4% 5.6% 4.4%
1. Malaria 2. Acute Respiratory Infections 3. Pneumonia 4. Intestinal Worms 5. Eye Infections 6. Minor Surgical Conditions
35.6% 13.3%
5.7% 5.7% 4.2% 2.8%
2006 1. Malaria 2. Acute Respiratory Infections 3. Pneumonia 4. Diarrhoeal diseases 5. Intestinal worms 6. Eye infections
44% 14%
7.5% 7% 4%
3.7%
1. Malaria 2. Acute Respiratory Infections 3. Pneumonia 4. Diarrheoal diseases 5. Intestinal worms 6. Minor surgical conditions
33.5% 14%
7% 4.9% 3.7%
3%
Table 4 Top Six Causes of Deaths
Year Top six causes of deaths
Age < 5 years Age 5 years and above
2000
(Baseline
Year)
1. Malaria 2. Anemia 3. Pneumonia 4. Perinatal & Neonatal Condition 5. Severe Protein Energy malnutrition 6. Urinary Tract Infections
37.9% 23.4% 14.9%
6.8% 4.5% 4.0%
1. Malaria 2. Tuberculosis 3. Anemia 4. Pneumonia 5. Meningitis 6. Complications of pregnancy
45.3% 13.9% 11.8% 11.2%
5.6% 4.6%
2005 1. Malaria 2. Anemia 3. Pneumonia 4. Diarrhoea 5. HIV/AIDS 6. Per natal Conditions
48% 10%
9% 5% 3% 3%
1. Malaria 2. HIV/AIDS 3. Pneumonia 4. Typhoid 5. Tuberculosis 6. Anemia
25.9% 12.0%
6.4% 6.2% 5.9%
5.0% 2006 1. Malaria – severe/complicated
2. Pneumonia 3. Anaemia 4. Malaria – uncomplicated 5. Diarrhoeal diseases 6. Poisoning
32.5% 12.5%
12% 7.5% 3.8%
3%
1. Malaria – severe/complicated 2. HIV/AIDS 3. Malaria – uncomplicated 4. Tuberculosis 5. Anaemia 6. Sickle diseases

22
Health Sector Performance Profile Report | 5/20/2008
The pattern shows no major change in the top six causes of morbidity among OPD attendances between 2000 and
2006 for either age group. It should be noted that recent research shows reveals significant over-diagnosis of malaria
and that a substantial proportion of fevers may not be malaria-related, even if they are reported as such.
For the under-fives, Malaria, Anaemia and Pneumonia have remained the top three major causes of death. However,
whereas they accounted for 76% of all deaths recorded at health facilities in 2000, this proportion dropped to 65% in
2006. For the older age group, malaria is still the leading cause of death, followed by HIV/AIDS.4 Other important
causes of over-five deaths are pneumonia and TB. In both age groups the proportion of deaths attributed to anemia
has fallen sharply.
Note that these figures come from deaths recorded at health facilities. As such, they are not necessarily a true
representation of cause specific mortality for the population as a whole.
Health StatusHealth StatusHealth StatusHealth Status
Percentage of Mortal ity attributable to malaria among children underPercentage of Mortal ity attributable to malaria among children underPercentage of Mortal ity attributable to malaria among children underPercentage of Mortal ity attributable to malaria among children under ---- f ivefivefivefive
The target in the prevention and control of malaria is to reduce morbidity and mortality due to malaria by 50 percent
by the year 2010. In the Malaria Medium Term Strategic Plan (2002-2007), the Ministry of Health aims to reduce
morbidity and mortality in all the regions by 20 percent by the year 2007.
The percentage of deaths recorded by health facilities and attributed to malaria in 2006 was around 40 percent. This
information was obtained from 85.7 percent of all the districts in Tanzania Mainland for the year 2006. This indicator
is difficult to interpret, even if quality data can be obtained. We suggest that the SWAp partners consider replacement
of this indicator with an alternative indicator of progress in malaria control, possibly including ITN coverage and
prompt & effective treatment.
Infant and Under Five Mortal ity Rate (IMR & U5MR) Infant and Under Five Mortal ity Rate (IMR & U5MR) Infant and Under Five Mortal ity Rate (IMR & U5MR) Infant and Under Five Mortal ity Rate (IMR & U5MR)
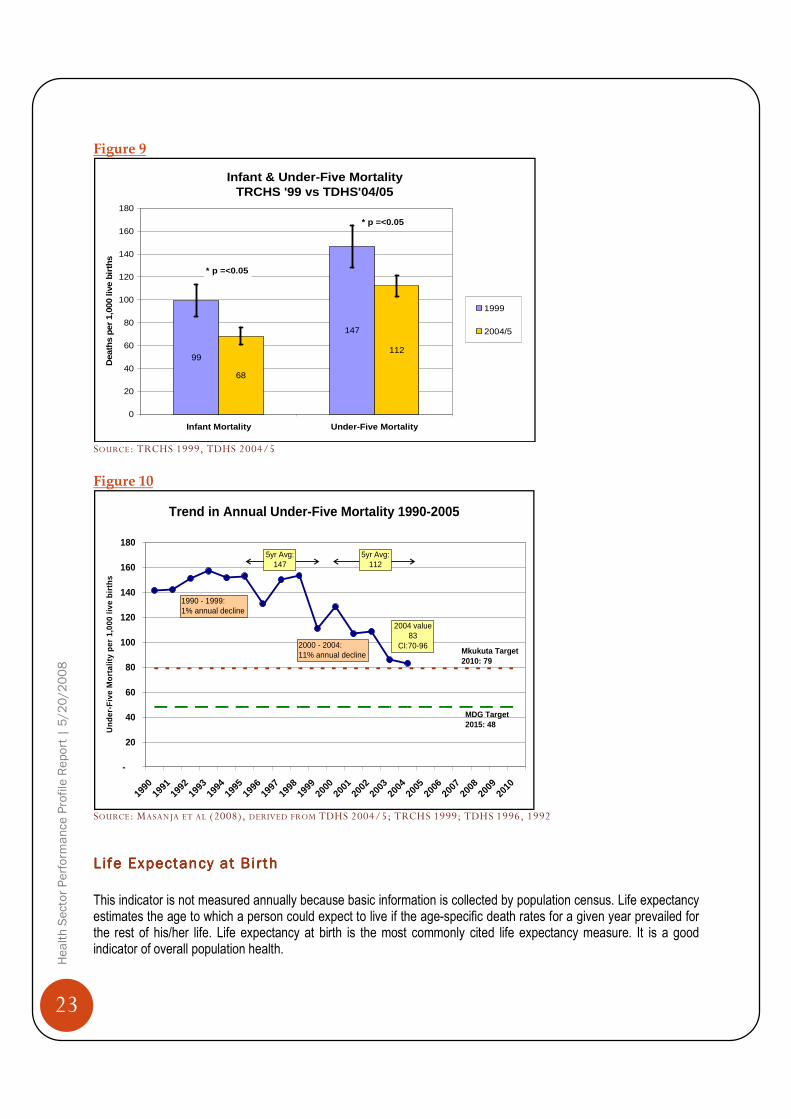
The Infant Mortality Rate (IMR) measures the probability of a child dying before its first birthday while Under-Five Mortality Rate (U5MR) measures the probability of a child dying before attaining age five. These indicators reflect a country’s level of socio-economic development and quality of life. They are commonly used to assess the overall performance of the health sector. Results from the 2004/05 TDHS found that IMR was 68 per 1000 live births and U5MR was 112/1000 live births. In both cases this represented a statistically significant improvement over the respective rates in the 1999 TRCHS survey (Figure 9).
These figures represent an average for births occurring in the five years before the survey. If the survey data are disaggregated (Figure 10), it becomes clear that an even steeper mortality decline has occurred, with the latest annual estimate for under-five mortality now standing at 83.2 per 1,000 in 2004. Although the estimate includes a 95% confidence interval (70.1 to 96.3) it is clear that the latest mortality is substantially lower than the headline figure published in the TDHS 2004/5. On the current trajectory, Tanzania’s prospects for meeting MDG4 look promising (Masanja et al, 2008).
4 In 2000 HIV/AIDS was not commonly used in the HMIS classification of causes of mortality.
23
Health Sector Performance Profile Report | 5/20/2008
Figure 9
SOURCE: TRCHS 1999, TDHS 2004/5
Figure 10
SOURCE: MASANJA ET AL (2008), DERIVED FROM TDHS 2004/5; TRCHS 1999; TDHS 1996, 1992
Life Expectancy at BirthLife Expectancy at BirthLife Expectancy at BirthLife Expectancy at Birth
This indicator is not measured annually because basic information is collected by population census. Life expectancy estimates the age to which a person could expect to live if the age-specific death rates for a given year prevailed for the rest of his/her life. Life expectancy at birth is the most commonly cited life expectancy measure. It is a good indicator of overall population health.
Infant & Under-Five MortalityTRCHS '99 vs TDHS'04/05
99
147
68
112
0
20
40
60
80
100
120
140
160
180
Infant Mortality Under-Five Mortality
Dea
ths
per
1,00
0 liv
e bi
rths
1999
2004/5
* p =<0.05
* p =<0.05
Trend in Annual Under-Five Mortality 1990-2005
-
20
40
60
80
100
120
140
160
180
1990
1991
1992
1993
1994
1995
1996
1997
1998
1999
2000
2001
2002
2003
2004
2005
2006
2007
2008
2009
2010
Und
er-F
ive
Mor
talit
y pe
r 1,
000
live
birt
hs
2000 - 2004: 11% annual decline
1990 - 1999: 1% annual decline
Mkukuta Target2010: 79
5yr Avg: 147
5yr Avg: 112
MDG Target2015: 48
2004 value83
CI:70-96

24
Health Sector Performance Profile Report | 5/20/2008
The MKUKUTA has set a life expectancy target of 52 for the year 2010. Previous population censuses show that life expectancy rate has been increasing, though at a slow pace. In the 1978 Population Census, life expectancy at birth was recorded at 44 years, rose to 50 in 1988 and increased slightly to 51 in 2002. The current HIV/AIDS prevalence rate may also have been one of the major causes behind the slow increase of the life expectancy for Tanzania.
Maternal Mortal ityMaternal Mortal ityMaternal Mortal ityMaternal Mortal ity
No reliable estimate of the maternal mortality ratio can be obtained from routine data. The latest estimate comes from the TDHS 2004/5, which in turn reflects maternal deaths during the 10 year period before the survey. This estimated the maternal mortality ratio at 578 maternal deaths per 100,000 live births – and showed no significant change from the previous estimate (529) made in the 1996 TDHS. Because of this, the government, in collaboration with different stakeholders, has developed a strategic plan which would help to increase a number of mothers delivering at health facilities. This includes encouraging skilled attendance at delivery, improving the availability of emergency obstetric care, strengthening emergency referral, creating awareness among community members and reducing the shortage of skilled staff. All these strategies are aiming at attaining the ambitious MKUKUTA target MMR of 265 by 2010 and the MDG of 133 by 2015.
Proportion of Chi ldren UnderProportion of Chi ldren UnderProportion of Chi ldren UnderProportion of Chi ldren Under ----Five Five Five Five StuntedStuntedStuntedStunted ((((Height for AgeHeight for AgeHeight for AgeHeight for Age))))
This indicator is not measured annually. Stunting is a condition that reflects failure to receive adequate food intake over a long period of time and is also affected by repeated episodes of illness. The MKUKUTA has set the target to reduce the prevalence of stunting in under-fives from 43.4% to 20% percent by 2010. Results show that the proportion of children under age five years who are stunted has declined from 44% in 1996 to 38% in 2004/05. There is still a long way to go to meet the MKUKUTA target for stunting of 20% by 2010.
Proportion of Chi ldren UProportion of Chi ldren UProportion of Chi ldren UProportion of Chi ldren Undernderndernder ----FiveFiveFiveFive Wasted (Weight for Height)Wasted (Weight for Height)Wasted (Weight for Height)Wasted (Weight for Height)
This indicator is not measured annually. Weight for height index describes current nutritional status. Children who are below –2 SD from the median of the reference population are considered “wasted” or too thin for their height, a condition that reflects acute or recent nutritional deficit. Children whose weight-for-height is below –3 SD from the median of the reference population are considered “severely wasted”. Wasting represents the failure to receive adequate nutrition and may be the result of recent episodes of illness. Severe wasting is closely linked to mortality risk and may reflect acute shortage of food. The MKUKUTA has set the target to reduce prevalence of wasting from 7.2 percent to 2.0 percent by 2010. Results show that the proportion of children under age five years who are wasted (weight-for-height) lay between 5% and 7% throughout the 1990s, but had decreased to 3% in 2004/5. Severe wasting was found in 0.4% of under-fives.
Proportion of Chi ldren UnderProportion of Chi ldren UnderProportion of Chi ldren UnderProportion of Chi ldren Under ----Five Underweight (WeightFive Underweight (WeightFive Underweight (WeightFive Underweight (Weight ---- forforforfor ----Age)Age)Age)Age)
This indicator is not measured annually. Weight-for-age is primarily a composite index of weight-for-height and height-for-age and thus does not distinguish between acute malnutrition (wasting) and chronic malnutrition (stunting). A child can be underweight for his/her age because he/she is stunted, wasted or both. Children whose weight-for-age is below –2 SD from the median of the reference population are classified as “underweight” and those below –3 SD from the median of the reference population are classified as ‘severely underweight. Weight-for-age is a useful tool in clinical settings for continuous assessment of nutritional progress and growth. There is no specific target set by the MKUKUTA to reduce underweight among children under age five years.

25
Health Sector Performance Profile Report | 5/20/2008
Results show that the proportion of children under five who are underweight was around 30% throughout the 1990s.
The TDHS 2004/5 found a much lower rate of moderate underweight (22%), while 3.7% of under-fives were severely
underweight.
Total Ferti l i ty RateTotal Ferti l i ty RateTotal Ferti l i ty RateTotal Ferti l i ty Rate
This indicator is not measured annually. Total Fertility Rate (TFR) is the average number of children that would be born to a woman by the time she ends childbearing if she were to pass through all her childbearing years conforming to the age-specific fertility rates of a given year. The TFR sums up, in a single number, the fertility of all women at a given point in time. This usually applies to women in the reproductive age group 15-49 years. Although TFR is measured by the Census as well as by the Demographic and Health Surveys, the National Bureau of Statistics regards the latter as the more reliable estimate. The latest estimate (TDHS 2004/5) of 5.7 shows no significant change when compared to 1999 (5.6) or 1996 (5.8).

26
Health Sector Performance Profile Report | 5/20/2008
Chapter 3: Chapter 3: Chapter 3: Chapter 3: Assessment Assessment Assessment Assessment of the 2006 Milestonesof the 2006 Milestonesof the 2006 Milestonesof the 2006 Milestones
During the JAHSR of FY06/07 a number of milestones were presented by a Review Technical Team. Following
discussion these milestones were adopted for implementation up to the next review. This section presents a brief
review of progress in achieving these, as presented in the September 2007 Joint Annual Health Sector Review.
Table 5 Milestones for FY06/07 S/N MILESTONE PROGRESS & REMARKS Status
1 Drugs and Medical Supplies
Undertake drug tracking study including assessment of feasibility of devolving 20% of drugs budget to district level
Study completed and report submitted to MoHSW. The Pharmaceutical sub-committee brought relevant issues for forward to the JAHSR.
A consultant for development of Resource Allocation Formula for Drugs in Place.
Proposal on how to move forward is in the Technical Review report 2007 page 13 and 14.
Achieved
2 Financing
Put in place Financing Committee that will commission and oversee; long term financing Strategy, assessment of complementary financing options; monitoring of MTEF throughout the budget cycle and bid for additional resources for the health sector.
The TOR for Health Sector Financing Committee has been prepared and the Technical Financing Committee is formed. The committee is expected to start implementing the TOR after conclusion of the JAHSR 2007.
Achieved
3 Public Private Partnership (PPP)
Deploy full time officer and assistant to spearhead PPP, with clear TORs, and complete the service agreement.
Service Agreement completed. Advocacy for implementation started. Full time Officer and assistant have been appointed to spearhead PPP.
Status of Service Agreement to be presented in the Joint Health Sector Review.
Achieved
4 Human Resource Hire No. 1
Establish an Human Resource for health. (HRH) Special Initiative (or Project) in the Directorate of Human Resource (DHR) responsible for rapid recruitment and deployment of front line health workers.
Special recruitment initiative for the remote and high HIV/AIDS prevalence areas is on-going. By 21st September 2007 a total of 121 new hire has been posted and reported to 19 districts. The target is to recruit 176 by the end of September 2007.
HRH –Steering Committee and TC supported by DPG is working on this area and propose solutions to the crisis.
The establishment of a fast hiring project has not been effected.
Partially Achieved
5 Human Resource Hire No.2
Fill 80% of funded posts in the In 2006/07 Ministry of Health and Social Welfare received employment permit with Ref. No. BC

27
Health Sector Performance Profile Report | 5/20/2008
S/N MILESTONE PROGRESS & REMARKS Status
councils 97/128/010/15 dated 18th December 2006. The permit allowed recruitment of 3,890 health employee countrywide. Up to 30th June 2007 a total of 3,699 employees were posted to different regions and councils based on request as forwarded to the Ministry. This is equivalent to 95.09% of the total allocated posts.
The MoHSW is waiting for the progress report from the LGAs through PMORALG.
Note MoHSW recruit but hiring is done by LGAs including placement and retention.
Achieved up to 95.1%
6 Sector Evaluation
Early agreement reached on TOR and methodology; full participation of MOHSW HQ, Regions, Districts, and Partners and complete Evaluation for discussion in September 2007
Successfully completed on time.
Achieved
7 HIV/AIDS
Costed Health Sector HIV Strategy including prevention, care and treatment and impact mitigation completed and presented on September 2007.
1. A team of 14 consultants 11 from within and 3 from outside the country were engaged in the process of writing the strategy for 40 days starting from May 2nd 2007.
2. Consultative meeting of consultants and experts was conducted in order to get consensus on key issues regarding the past Health Sector / HIV Strategy and way forward before starting the actual writing. The meeting took place on 2nd - 4th May 2007 in which 70 participants attended.
3. The first draft of the strategy was then shared among stakeholders /experts in 2 days meeting held in June 2007
4. The new Health Sector HIV/AIDS strategy 2008 - 2012 was finalized by consultants and submitted to NACP. The NACP staffs are carefully editing it before submission to the MoHSW management for endorsement.
Partially Achieved
8 Reproductive and Child Health
Translate roadmap into operational plan and budget, mobilize resources ( as a matter of urgency ) and integrate into MOHSW MTEF and CCHPs for FY 2007/8
1. A two year prioritized plan of action is in place (2006-08).
2. All RMOs, DMOs and other stakeholders were oriented on Road Map doc in October 2006.
3. The road map is also positioned in the Primary Health Service Development Programme (MMAM). This programme has

28
Health Sector Performance Profile Report | 5/20/2008
S/N MILESTONE PROGRESS & REMARKS Status
been endorsed by the government.
4. Resource mobilization is on going through various levels. Currently African Development Bank will provide 4 year support in Mara, Tabora, and Mtwara. EU/WHO will provide support to Lindi, Rukwa, Mbeya (3 districts) and Coast region for 4 years. There is upcoming potential support from Norway, focusing of MDG 4+5. Also there are other partners who are supporting selected components of the road map e.g. JHPIEGO in a phased approach will scale up focused ANC country wide from (2007-09).
5. Inclusion of road map activities was done during MTEF planning. Basket funds were approved by DPGs for procurement of medical supplies and equipment for 50 health centers and family planning contraceptives and for training of trainers in reproductive health in life saving skills.
Partially Achieved
9 Infrastructure
In collaboration with PMO-RALG LGRP, and LGAs, complete assessment of needs for and location of, additional Health sector facilities in light of PPP
The needs assessment report is completed and submitted to PMORALG. Dissemination of the results is expected to be done in the first week of October, 2007. Nevertheless negotiations with CSSC and NBS with MoHSW are going on for Geo Survey joint undertaking.
This activity is linked with MMAM.
Achieved
10 SWAp;
SWAp Committee to revisit the timing of JAHSR to harmonizes with the national budget cycle and propose to the MOHSW management so that a decision can be made.
Done. The TC of the SWAP will continue to oversee this process, with other National processes.
Continued harmonisation is essential.
Achieved
11 Social Welfare:
Development of operational plan and identification of resources to address specific needs of most vulnerable children by August 2007.
The operational plan for most vulnerable children is in place and will be availed to all members through the MOHSW website (www.moh.go.tz)
Partially Achieved
The progress report on milestone demonstrated that most of the milestones were either completed or in the process
of implementation. With regards to the Human Resource Hire (HRH) No 2 milestone, personnel were hired equivalent
to 95% of the funded posts. However, a survey conducted in 46 districts revealed that only 64% reported to their duty
station and a further 12% later left. Thus the actual posts filled (staff recruited, posted and retained) was nearer 50%
of the funded posts. Also, it was noted that private/faith-based organizations have been losing staff to the public

29
Health Sector Performance Profile Report | 5/20/2008
sector creating acute shortage of manpower in those organization. Both areas point to the need to track HRH
migration, both in terms of maximizing the benefit of new recruitment as well as overseeing HR issues within the
sector as a whole.

30
Health Sector Performance Profile Report | 5/20/2008
Chapter 4: Chapter 4: Chapter 4: Chapter 4: Assessment of Sector FinancingAssessment of Sector FinancingAssessment of Sector FinancingAssessment of Sector Financing (Work(Work(Work(Workplan and budget)plan and budget)plan and budget)plan and budget)
Health sector financing is a crucial sector in the improvement of the health status in the country. Tanzania is following a mixed type of financing the health system. It is largely relying upon a tax financial system of which about 70 percent is from public financing. Taxation is complemented by user fees in the form of cost sharing in government health facilities. Also, the ministry has introduced Community Health Fund and National Health Insurance Scheme to supplement government efforts to bridge financial gaps in health sector. Domestic funds drive the recurrent budget, while the foreign funding more heavily influences the development budget. Off-budget funds are predominantly foreign, with the domestic contributions made by cost-sharing schemes in the sector (excluding NHIF) contributing 10 - 20 percent. The government funding is channelled through four sources, namely the Ministry of Health and Social Welfare
Budget, the Ministry of Local Government budget, revenues of the District and Urban Councils from development
levy and other locally generated sources and finally the Prime Minister’s budget.
The Public Expenditure Review provides an analysis of all these various sources of funding and their application. It
also assesses recent trends in overall public expenditure on health and its components.
The MTEF Analysis focuses on the MOHSW only and reports upon the execution of the activities that were planned
for the year.
Public Expenditure Review Public Expenditure Review Public Expenditure Review Public Expenditure Review
The Public Expenditure Review (PER) in Tanzania has become an established component of the government
planning and budgeting process, with one of its key objectives being to ensure that the expenditure patterns of the
government match the policy priorities as stipulated in the Poverty Reduction Strategy Paper (PRSP). In this regard
presentation of the Public Expenditure Review (PER) provide important information on the following sub-sections:
� The sector’s share of total government budget and expenditure; � Absolute levels of spending, both nominal and real; � Per capita allocation for health � Allocation of funds between programmes, cost-items and levels of care.
The figures presented here come from the draft PER update 2007. Because this report has not yet been finalized, some of the details may be subject to change, although the broad magnitudes and conclusions should remain valid.
Table 6 Trend in Nominal Health Spending (TSh Million)
Recurrent Exp. FY05/06 Actual FY06/07 Actual FY07/08 Budget
MOHSW 180,306 189,094 199,929
Regions 11,532 19,209 28,761
Local Govt. Auth. 75,314 119,000 137,699
Health Insurance Fund 20,457 29,550 33,177
Total Rec. Exp. 287,609 356,853 399,567

31
Health Sector Performance Profile Report | 5/20/2008
Development Exp.
MOHSW 90,863 78,040 181,936
PMO-RALG 39,975 36,154 2,942
Regions 7,594 5,463 53,838
Local Govt. Auth.(BF) 20,137 23,094 44,361
Total Dev 158,568 142,751 283,077
Total 446,177 499,604 682,644
Table 6 shows a 37% increase in total funding for health between 2006/7 and 2007/8. Most of this increase comes
from a sharp rise in the foreign component of the MOHSW development budget. Some of this is attributable to a real
increase in aid, while some is attributable to inclusion of items (eg Global Fund) that were previously not reflected in
the budget. The Regional level has also seen a substantial increase for both recurrent and development elements. At
the local government level, there has been an increase, much of it devoted to personnel costs. The basket funds for
local government have also increased, from $0.50 to $0.75 per capita equivalent.
Figure 11 Trend in Nominal Health Spending
SOURCE: DRAFT HEALTH SECTOR PER UPDATE 2007
2005/6 act. 2006/7 act. 2007/8 budget
Development 158.6 142.8 283.1
Recurrent 287.6 356.9 399.6
0.0
100.0
200.0
300.0
400.0
500.0
600.0
700.0
800.0
Health Sector Expenditure Trend, T.Sh Billions

32
Health Sector Performance Profile Report | 5/20/2008
Figure 12 Trends In Health as % of Total Government Spending
SOURCE: DRAFT HEALTH SECTOR PER UPDATE 2007
Preliminary analysis indicates that in FY2007/8 the share of the total government budget allocated to health fell
slightly as compared to the previous year. These figures may be subject to revision pending the finalization of the
Draft Health Sector PER 2007.
Table 7 Trend in Health Spending Per Capita, US Dollars (FY06-FY08)
FY06 FY07 FY08
Real Per capita spending (US Dollars) 5.96 8.00 9.92
Nominal per capita US dollars 6.78 10.27 13.76
Population Projections from Population Census (Thousand) 36,784 37,869 38,983
Exchange rates (BoT, 2007) 1,139 1,285 1,273
This preliminary analysis shows that trends in health spending are broadly positive. Further analysis during main PER exercise will look in more depth.
8.5%
9.0%
9.5%
10.0%
10.5%
11.0%
11.5%
12.0%
as % GOT (incl CFS) 9.7% 9.6% 10.8% 9.8%
as % GOT (excl CFS) 10.9% 10.9% 11.4% 10.8%
FY05 actual FY06 budget FY07 budget FY08 budget

33
Health Sector Performance Profile Report | 5/20/2008
Chapter Chapter Chapter Chapter 5555: : : : Assessment of the 2006/2007 MTEFAssessment of the 2006/2007 MTEFAssessment of the 2006/2007 MTEFAssessment of the 2006/2007 MTEF
The assessment of the 2006/2007 MTEF reviews the Ministry’s proposed objectives as implemented by all
directorates and its institutions. Each objective was expected to be achieved through targets and planned activities
stated within the MTEF.
Vision of the Ministry is: “To be a model of excellence in the delivery of quality and equitable health and social
welfare services” and the Mission is: “To facilitate the provision of quality health and social welfare to all people to
enable them improve their well-being”.
In this financial year, the priorities were set according to the following objectives: -
• To improve services and reduce HIV/AIDS infections; • To reduce morbidity and mortality rates in vulnerable groups with special focus on infants, under five children,
pre-school and school age children, youths, people with disability, elderly and women of reproductive age, to increase life expectancy;
• To ensure availability of basic essential health care services backed up with an effective referral system, action oriented research, gender disaggregated health data and active participation and involvement of the community;
• To monitor and control quality and safety of food, drugs, chemicals and cosmetics to safeguard health of the public and environment;
• To plan, train and provide competent and adequate number of health staff, with skill mix that is gender focused; • To rationalize and rehabilitate the health infrastructure taking into consideration services for people with disability
and provide a maintenance system for health facilities, equipment and instruments. • To review, develop, disseminate monitor and evaluate the National Health policy, policy guidelines, legislation,
standards, processes, regulations, plans and budgets that ensure delivery of quality health services with a gender perspective;
• To improve the Social Welfare of vulnerable groups through promotion improved and protection of rights access; • To create an inductive and gender responsive environment for efficient and effective delivery supportive
services.
MTEF Performance AnalysisMTEF Performance AnalysisMTEF Performance AnalysisMTEF Performance Analysis
The above objectives for FY06/07 were key factors for developing recurrent and development budget in the MTEF.
Each objective had a number of activities that were implemented by different departments and agencies. Since each
activity was allocated certain amount of money the performance of the budget is evaluated by looking at the
availability of that money as well as the utilization rate of the money allocated for each activity. Nevertheless, it
should be noted that this is not the best indicator as other factors like time frame of performance and actual output
versus intended output are important but have not been put into account in this analysis.
The performances of activities are categorized in four levels as follows:-
• Level 1. Activities that its utilization rate is from 90 and above percent that activity is considered to be fully implemented
• Level 2. Activities that its utilization rate is between 50 – 89 percent that activity is considered as partially Implemented
• Level 3. Activities that its utilization rate is between 1 – 49 percent that activity is considered as partially implemented below 50 percent
• Level 4. Activities that its utilization rate is 0 percent are considered as not implemented.

34
Health Sector Performance Profile Report | 5/20/2008
Table 8. Summary of MTEF Analysis
Department/Agency Implemented Partially Implemented
Partially Implemented below 50%
Not implemented Number of activities
implemented
Director of Administration and Personnel
3
50%
3
50%
0
0%
0
0%
6
100%
Director of Policy and Planning
8
22%
14
38%
14
38%
1
2%
37
100%
Director of Hospital
Services
39
58%
9
14%
11
16%
8
12%
67
100%
Director of Preventive Services
6
50%
5
42%
0
0%
1
8%
12
100%
Director of Human Resources
16
44%
11
31%
9
25%
0
0%
36
100%
Social Welfare Services
7
54%
6
46%
0
0%
0
0%
13
100%
Chief Medical Officer
4
50%
3
38%
0
0%
1
12%
8
100%
Chief Internal Auditor
2
67%
1
33%
0
0%
0
0%
3
100%
National Institute of Medical Research
1
33%
2
67%
0
0%
0
0%
3
100%
Tanzania Drugs and Food Authority
6
55%
3
27%
2
18%
0
0%
11
100%
CGHA 2
100%
0
0%
0
0%
0
0%
2
100%
Total 94
47%
57
29%
36
18%
11
6%
198
100%
Table 8 shows that in the FY06/07 on average 47 percent of activities were fully implemented while 29 percent were
partially implemented. This means 76 percent of all activities its implementation was above 50 percent. Generally
performance level of MTEF is generally good but still there is a room for more improvements. This is because 18
percent of implementation was below 50 percent and planned activities which were completely not implemented were
around 6 percent. In this regard it can be concluded that on average all objectives were fulfilled by 76 percent. A
factor behind this situation is because the actual funding was below than what was in the budget. Activities which did
not get any funding are those which were in the development budget. Detailed analysis is in Appendix A

35
Health Sector Performance Profile Report | 5/20/2008
Chapter Chapter Chapter Chapter 6666: : : : Assessment of Council Health ServicesAssessment of Council Health ServicesAssessment of Council Health ServicesAssessment of Council Health Services
This assessment was conducted by a team of technical staff from the Ministry of Health and Social Welfare, Prime
Minister’s Office Regional Administration and Local Government and Regional Health Management Teams. The
broad objective was to evaluate the annual (2006/07) implementation Comprehensive Council Health Plan Reports
from 121 Councils and first quarter (July – September 2007/08) progress reports from 132 Councils and come up
with a collated national report for funding the third and fourth quarter planned activities. Specific objectives were: -
• To review and evaluate the Annual (2006/07) Comprehensive Council Health Plans Implementation Reports from 121 Councils to see if the implemented planned health interventions are addressing health problems and are achieving set objectives and targets through compilation of performance indicators;
• To review and evaluate 1st quarter (July- Sept 2007) implementation reports from 132 Councils to see if they have met the requirements (physical & financial criteria);
• To assess RS/RHMT capabilities and commitment in assessing Councils’ progress reports submitted to (PMORALG and MoHSW);
• To summarize observations derived from the evaluation exercise for improvement of the reports prepared by Councils in future and make recommendations to the management of the Ministries.
• To evaluate quality of the assessment/evaluation criterion in respect of completeness, consistency, accuracy and relevance in measuring the desired results in the implementation of CCHP(s) by LGAs;
• To consolidate and recommend to the Basket Financing Committee the evaluation results of the first quarter (July – September 2007) technical and financial implementation reports of the LGAs for approval and funding of third and fourth quarters 2007/08 CCHPs.
GGGGeneral Findings and Comments on the Review of Technical and Financial eneral Findings and Comments on the Review of Technical and Financial eneral Findings and Comments on the Review of Technical and Financial eneral Findings and Comments on the Review of Technical and Financial Reports:Reports:Reports:Reports:
Strengths Strengths Strengths Strengths
• According to the annual performance indicators reported by 44 (36.4 percent) out of 121 councils shows that there are significant performance improvement in some of the priority areas, namely Reproductive and child health (obstetric care and immunization), Communicable diseases control, Non Communicable diseases and Community Health promotion and other areas.
• Out of 44 Councils, only 5 Councils, Muleba DC, Dodoma DC, Lushoto DC, Ruangwa DC and Tarime DC included in the submitted annual progress reports, the achievements related to performance indicators and remaining 39 councils have reported their annual performance status for the year 2006/07 responding to the request that was made to Councils during the compilation of this report;
• Due to inadequate availability of data from all councils implementing CCHP, rendered the exercise of establishing the national overall performance status impossible;
• The RS/RHMTs of Lindi, Tanga, Tabora, Kilimanjaro, Iringa, Arusha and Kigoma Regions have managed to carry out the assessment of the progress reports, compiled and bound results and recommendations;
WeaknessesWeaknessesWeaknessesWeaknesses
• Most of the Councils reports of July –September 2007 have been prepared according to the previous CCHP guideline (March 2004), 98 percent of the Councils have not contributed funds to the CCHP from their own sources in fulfillment of their commitment set forth in the CCHP budget. Making future sustainability of the anticipated improved delivery of health service initiatives uncertain;

36
Health Sector Performance Profile Report | 5/20/2008
• The requirement of producing the annual implementation reports was interpreted differently from the previous guideline by Councils this has led Councils submit reports as follows, 28 Councils (23 percent) have prepared and submitted the quarterly reports (April – June 2006/07), 17 Councils (14 percent) have submitted semi-annual reports (January- June 2006/07) and 76 Councils (63 percent) have submitted the annual report of July 2006 - June 2007.
• Some of the Councils have submitted reports in photocopy instead of the originals. Some of the Councils submitted reports containing arithmetical errors; inconsistencies of figures reported between different tables
• Late disbursement of Basket funds for July- September 2007/08 was reported to be the major constraint that
affected implementation of the planned activities in due time in all Councils.
• Some of the RS/RHMTs observed to be not serious in supporting the LGAs in the preparation, assessment,
correction and timely submission of the reports. In addition the RS/RHMTs are not interpreting the revised
Guideline of February 2007 for compliance by the LGAs.
• Some of the RS/RHMTs have used the previous assessment forms in assessing the reports instead of the new
one, which has detailed information to meet the desired results of the assessment.
• Generally it has been observed that report writing skills are inadequate in most of the LGAs and RS/ RHMTs as
a result expected quality performance technical and financial reports cannot be produced as per requirement.
• Also, most of the councils lack qualified personnel and in some places there are new employed staffs that have
never been trained in preparation of the CCHP plans and writing progress reports.
Detai led Statistical Analysis of Evaluation Reports both CCHP and Financial Detai led Statistical Analysis of Evaluation Reports both CCHP and Financial Detai led Statistical Analysis of Evaluation Reports both CCHP and Financial Detai led Statistical Analysis of Evaluation Reports both CCHP and Financial ProgressProgressProgressProgress
Reports -1st Quarter – July – September 2007. Evaluation of Technical and financial reports were done in line with
Comprehensive Council Health Planning (CCHP) guidelines (of February 2007). The maximum score for technical
report was set to 30; in this regard, any report which scores a total of less than 22 points will be rejected, sent back
for rectification, before being considered for further disbursement of funds. On the other hand the maximum point for
financial report was 85; nevertheless, any report which scores total of less than 70 points will be rejected.
The score for each Council was assigned; the data were then processed using Microsoft Office Excel and SPSS
software. Furthermore, the average for each region was calculated to find out the representing point for each region
aiming to examine the trend of the result at region level.
Mean, maximum, minMean, maximum, minMean, maximum, minMean, maximum, min imum and standard Deviat ion Points for imum and standard Deviat ion Points for imum and standard Deviat ion Points for imum and standard Deviat ion Points for ----1111 s ts ts ts t Quarter Quarter Quarter Quarter –––– July July July July –––– September 2007.September 2007.September 2007.September 2007.
Mean point enable one to find out the general performance of councils, it indicates how generally all councils has
achieved. The analysis has shown that the technical mean point was 23.4 while that of financial was 69.7. The mean
scores of both categories were very close to cut-off points; this is the indication of existence of un-recommended
councils. The maximum and minimum scores for financial report were 81 and 41 respectively while those of technical
were 28 and 5 respectively.
The standard Deviation for technical was 27.05 while that financial was 8.7. The technical points seem to have
discrepancy, and it can be concluded that the scores were scattered apart,

37
Health Sector Performance Profile Report | 5/20/2008
Table 9: Average Scores of aggregated data of both technical and financial by Region
Region Technical Score Financial Score Average
ARUSHA 26.0 78.3 52.1
LINDI 25.7 75.2 50.4
SHINYANGA 25.4 74.8 50.1
DSM 27.0 73.2 50.1
TABORA 24.5 75.5 50.0
MOROGORO 24.7 73.0 48.8
MANYARA 23.2 73.5 48.3
MARA 23.0 73.5 48.3
DODOMA 24.5 71.8 48.2
MBEYA 22.8 73.3 48.0
KILIMANJARO 25.1 70.8 47.9
RUVUMA 22.0 70.8 46.4
IRINGA 23.8 68.8 46.3
KAGERA 25.3 64.9 45.1
MWANZA 24.0 65.7 44.9
TANGA 19.1 68.9 44.0
SINGIDA 23.8 63.5 43.6
COAST 20.3 66.9 43.6
KIGOMA 22.5 61.3 41.9
RUKWA 20.2 58.8 39.5
MTWARA 19.7 55.3 37.5

38
Health Sector Performance Profile Report | 5/20/2008
Figure 13: Average points for technical and financial report by region: 1st Quarter July – September 2007
Arusha, Lindi, Shinyanga, Dar es Salaam, and Tabora, regions have performed well, while Mtwara Rukwa,
Coast and Tanga have score below cut points in both reports. This has been contributed by low points gained by
some Council in those regions, for instance, Masasi DC scored 5 in technical report, Sumbawanga MC and
Mpanda DC (Rukwa) gained 14, and 16 respectively.
The evaluation has also proved that “the higher the performance in technical the `higher the score in financial
reports”, and vice versa.
Table 10: Ten best and last 10 councils for technical and financial report
Council Phase
Technical
Score
Council Financial Score
Kinondoni MC I 28 Lindi DC 81
Bukoba MC I 27 Liwale DC 81
Ilala MC I 27 Meru DC 81
Kahama DC II 27 Arusha MC 80
Karagwe DC III 27 Kondoa DC 80
Karatu DC III 27 Longido DC 80
Kilwa DC I 27 Mbozi DC 80
0.0
10.0
20.0
30.0
40.0
50.0
60.0
70.0
80.0
90.0
Technical Score Finacial Score

39
Health Sector Performance Profile Report | 5/20/2008
Council Phase
Technical
Score
Council Financial Score
Moshi DC III 27 Morogoro DC 80
Mvomero DC IV 27 Morogoro MC 80
Tabora MC I 27 Mpwapwa DC 80
Korogwe DC II 17 Kilindi DC 55
Mpanda TC IV 16 Kilolo DC 55
Kigoma Ujiji MC II 15 Nkasi DC 51
Korogwe TC VI 14 Biharamulo DC 50
Sumbawanga MC II 14 Masasi DC 47
Tunduru DC II 14 Newala DC 47
Kibaha TC IV 13 Sumbawanga MC 45
Mkuranga DC III 9 Mwanza CC 41
Masasi DC I 5 Nanyumbu DC 41
Muheza DC II 0 Muheza DC 0
Technical and Financial progress reportsTechnical and Financial progress reportsTechnical and Financial progress reportsTechnical and Financial progress reports ---- July July July July –––– June 2006/07. June 2006/07. June 2006/07. June 2006/07.
Evaluation of Comprehensive Council Health reports both technical and financial were done with Comprehensive
Council Health Planning (CCHP) guidelines (of March 2004). The maximum score for technical report was set to 30;
in this regard, any report which scores a total of less than 22 points was rejected, sent back for rectification, before
being considered for further disbursement of funds. On the other hand the maximum point for financial report was 85;
nevertheless, any report which scores total of less than 70 points was rejected. The score for each Council was
assigned; the data were then processed using Microsoft Office Excel and SPSS software. Furthermore, the average
for each region was calculated to find out the representing point for each region aiming to examine the trend of the
result at region level.
Mean, maximum, minimum and standard Deviat ion Points for June Mean, maximum, minimum and standard Deviat ion Points for June Mean, maximum, minimum and standard Deviat ion Points for June Mean, maximum, minimum and standard Deviat ion Points for June –––– July July July July 2006/072006/072006/072006/07
These are the central tendencies which usually enable one to find out the general performance of councils, it
indicates how generally all councils has achieved. The analysis has shown that the technical mean point was 24.1
while that of financial report was 71.5. The mean scores of financial report were slightly close to the cut point (70);
this is the indication of existence of un-recommended councils. The maximum and minimum scores for financial
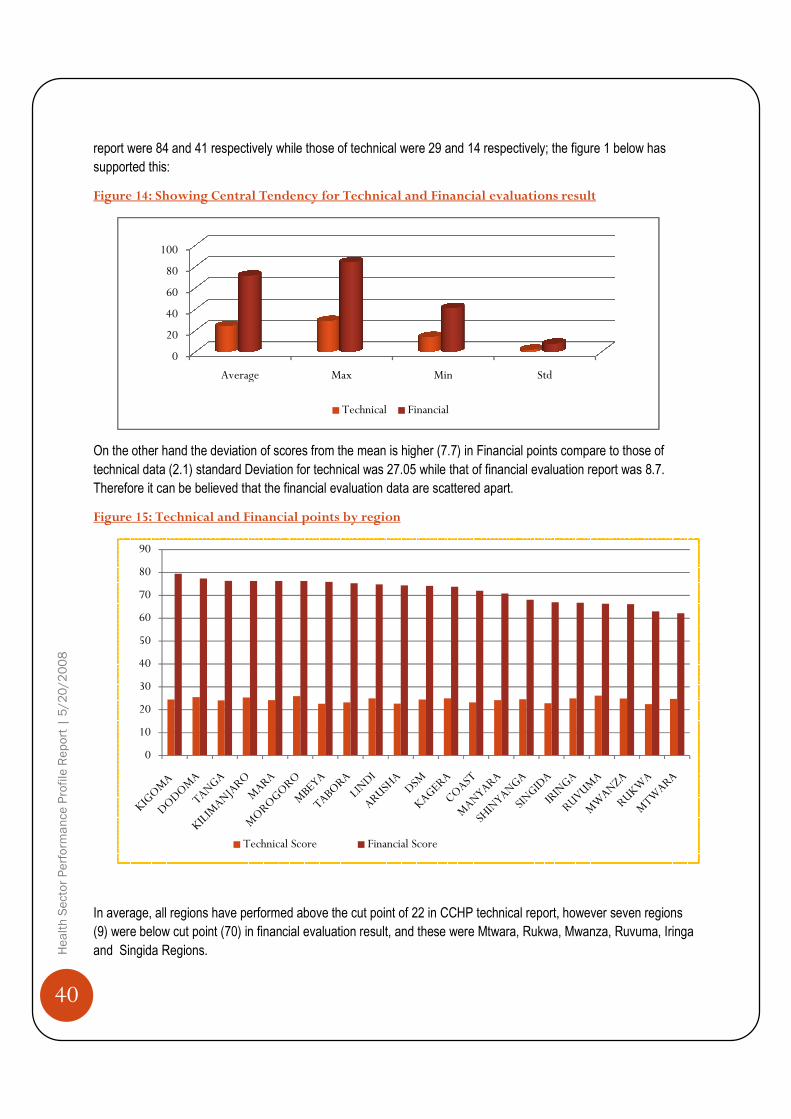
40
Health Sector Performance Profile Report | 5/20/2008
report were 84 and 41 respectively while those of technical were 29 and 14 respectively; the figure 1 below has
supported this:
Figure 14: Showing Central Tendency for Technical
On the other hand the deviation of scores from the mean is higher (7.7) in Financial points compare to those of
technical data (2.1) standard Deviation for technical was 27.05 while that of financial evaluation report was
Therefore it can be believed that the financial evaluation data are scattered apart.
Figure 15: Technical and Financial points by region
In average, all regions have performed above the cut point of 22 in CCHP technical report, however seven
(9) were below cut point (70) in financial evaluation result, and these were Mtwara, Rukwa, Mwanza
and Singida Regions.
0
20
40
60
80
100
Average
0
10
20
30
40
50
60
70
80
90
Technical Score
report were 84 and 41 respectively while those of technical were 29 and 14 respectively; the figure 1 below has
: Showing Central Tendency for Technical and Financial evaluations result
On the other hand the deviation of scores from the mean is higher (7.7) in Financial points compare to those of
technical data (2.1) standard Deviation for technical was 27.05 while that of financial evaluation report was
Therefore it can be believed that the financial evaluation data are scattered apart.
: Technical and Financial points by region
In average, all regions have performed above the cut point of 22 in CCHP technical report, however seven
(9) were below cut point (70) in financial evaluation result, and these were Mtwara, Rukwa, Mwanza
Max Min Std
Technical Financial
Technical Score Financial Score
report were 84 and 41 respectively while those of technical were 29 and 14 respectively; the figure 1 below has
and Financial evaluations result
On the other hand the deviation of scores from the mean is higher (7.7) in Financial points compare to those of
technical data (2.1) standard Deviation for technical was 27.05 while that of financial evaluation report was 8.7.
In average, all regions have performed above the cut point of 22 in CCHP technical report, however seven regions
(9) were below cut point (70) in financial evaluation result, and these were Mtwara, Rukwa, Mwanza, Ruvuma, Iringa
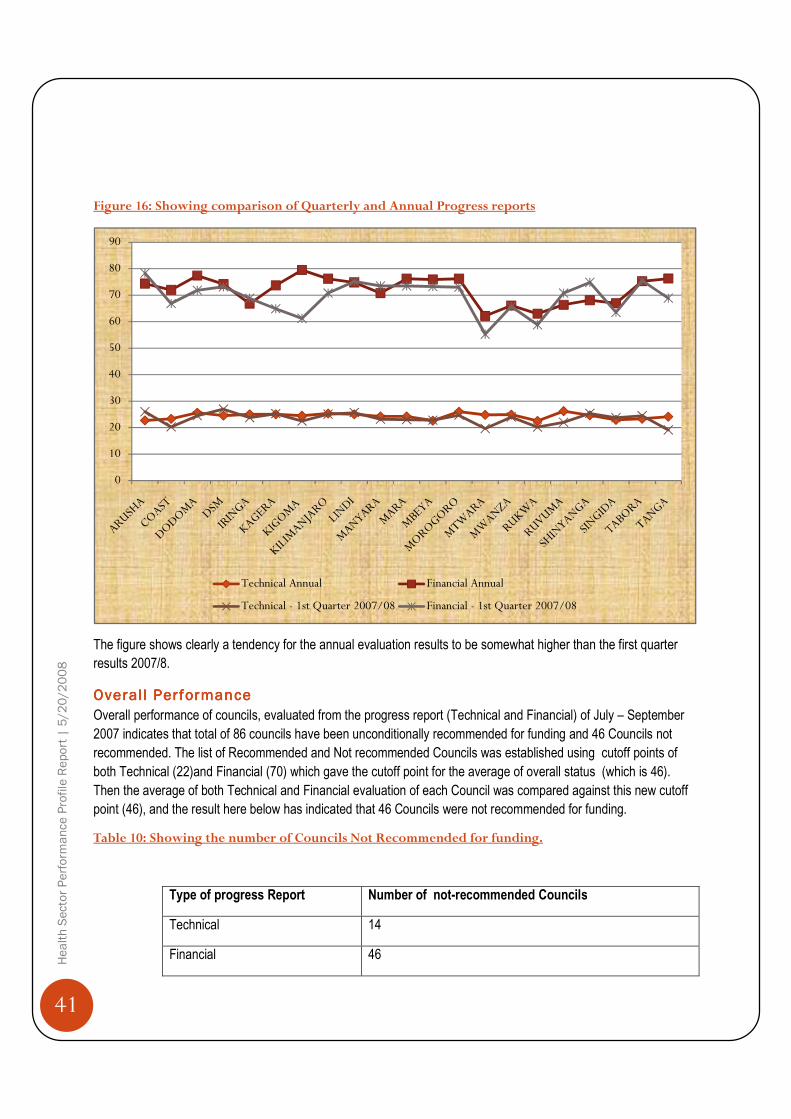
41
Health Sector Performance Profile Report | 5/20/2008
Figure 16: Showing comparison of Quarterly and Annual Progress reports
The figure shows clearly a tendency for the annual evaluation results to be somewhat higher than the first quarter
results 2007/8.
Overal l PerformanceOveral l PerformanceOveral l PerformanceOveral l Performance
Overall performance of councils, evaluated from the progress report (Technical and Financial) of July – September
2007 indicates that total of 86 councils have been unconditionally recommended for funding and 46 Councils not
recommended. The list of Recommended and Not recommended Councils was established using cutoff points of
both Technical (22)and Financial (70) which gave the cutoff point for the average of overall status (which is 46).
Then the average of both Technical and Financial evaluation of each Council was compared against this new cutoff
point (46), and the result here below has indicated that 46 Councils were not recommended for funding.
Table 10: Showing the number of Councils Not Recommended for funding.
Type of progress Report Number of not-recommended Councils
Technical 14
Financial 46
0
10
20
30
40
50
60
70
80
90
Technical Annual Financial Annual
Technical - 1st Quarter 2007/08 Financial - 1st Quarter 2007/08

42
Health Sector Performance Profile Report | 5/20/2008
Overall
Figure 17 Indicating both percents of Recommended and Not Recommended Councils for funding
35%
Recommended
46
Indicating both percents of Recommended and Not Recommended Councils for funding
65%
Recommended Not Recommended
Indicating both percents of Recommended and Not Recommended Councils for funding

43
Health Sector Performance Profile Report | 5/20/2008
ANNEXESANNEXESANNEXESANNEXES
Annex A: MTEF Performance Analysis
SN Objectives Targets Target Implemented by
Actual Achievement Category of Funding
Remarks Performance
Status
1 To improve services and reduce HIV/AIDS infections
Development of HIV/AIDS work place programs
Directorate of Administration and Personnel (DAP)
HIV /AIDS Intervention and program for the Ministry of Health and Social Welfare workers was developed
Recurrent
The budgeted amount was reduced by 21% and reallocated for other important commitments
Implemented
Facilitate provision of adequate and timely quality diagnostic and health care technical services in 8 referral, 24 regional and municipal, and 120 districts hospitals and 20 voluntary agencies by June, 2009.
Directorate of Hospital Services
(DHS)
219 laboratory technologist and clinicians were trained on HIV rapid testing (Master trainers 45, TOT 151, Regional Health Lab I/c 23). 223 lab technologists were trained on CD4, Chemistry and Hematology analyzer (MT 6, TOT 38, and Roll out 179). 10 laboratory technologists trained for IDSR (Ref hosp 4 Regional hospitals 6).
Recurrent
Implemented under Laboratory Support program
Implemented
DHS National and Zonal sub-committees for laboratory quality assurance was established for implementation of laboratory quality assurance scheme.
Recurrent
Implemented under Laboratory Support program
Implemented
DHS Laboratory registers, requisition and report forms for both paper based and electronic information system were developed and distributed to referral and regional hospitals. 37 computers for electronic based lab information system donated by PEPFAR through CDC distributed to Bugando and Mbeya Referral Hospitals, and Ruvuma and Shinyanga Regional Hospitals. UCC
Recurrent
Implemented under Laboratory Support program
Implemented
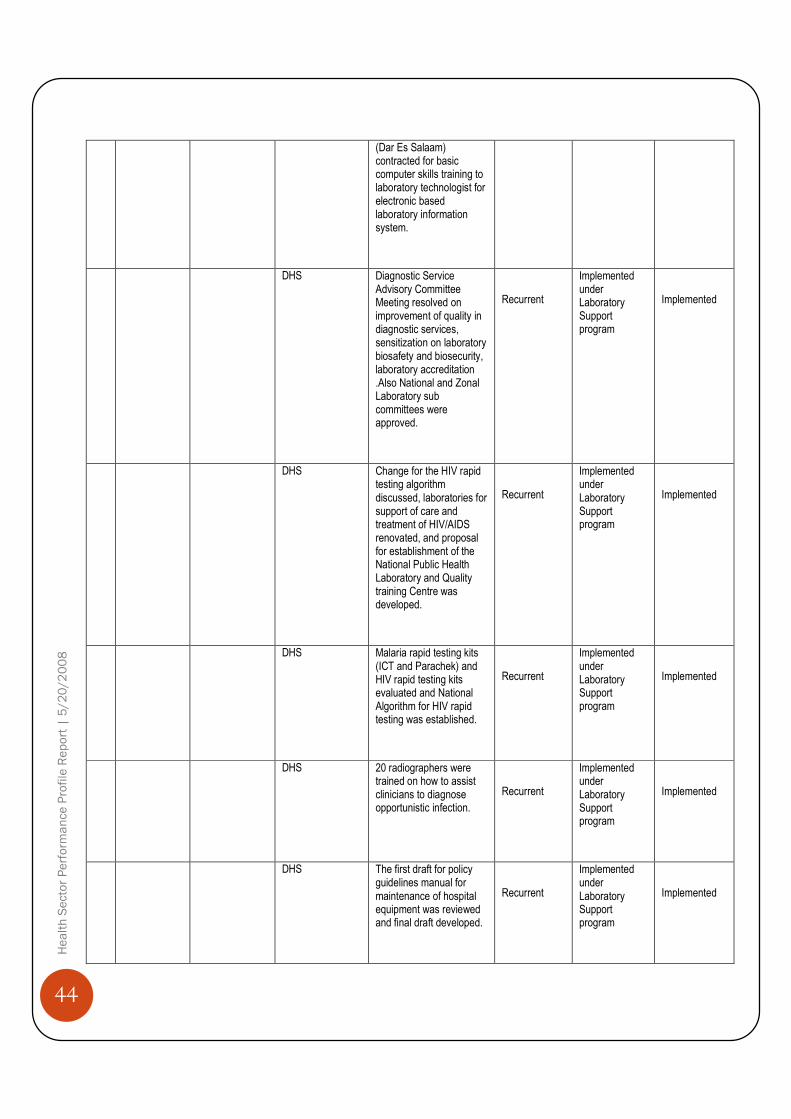
44
Health Sector Performance Profile Report | 5/20/2008
(Dar Es Salaam) contracted for basic computer skills training to laboratory technologist for electronic based laboratory information system.
DHS Diagnostic Service Advisory Committee Meeting resolved on improvement of quality in diagnostic services, sensitization on laboratory biosafety and biosecurity, laboratory accreditation .Also National and Zonal Laboratory sub committees were approved.
Recurrent
Implemented under Laboratory Support program
Implemented
DHS Change for the HIV rapid testing algorithm discussed, laboratories for support of care and treatment of HIV/AIDS renovated, and proposal for establishment of the National Public Health Laboratory and Quality training Centre was developed.
Recurrent
Implemented under Laboratory Support program
Implemented
DHS Malaria rapid testing kits (ICT and Parachek) and HIV rapid testing kits evaluated and National Algorithm for HIV rapid testing was established.
Recurrent
Implemented under Laboratory Support program
Implemented
DHS 20 radiographers were trained on how to assist clinicians to diagnose opportunistic infection.
Recurrent
Implemented under Laboratory Support program
Implemented
DHS The first draft for policy guidelines manual for maintenance of hospital equipment was reviewed and final draft developed.
Recurrent
Implemented under Laboratory Support program
Implemented

45
Health Sector Performance Profile Report | 5/20/2008
DHS The first draft of Standard Operating Procedures for maintenance of equipments to support HIV care and treatment was developed.
Recurrent
Implemented under Laboratory Support program
Implemented
DHS 6 Zonal workshop tool kits were procured and distributed to all 5 Zonal Workshops and MOHSW - HCTS HQ.The zones are Mwanza, Mtwara, Mbeya, Kilimanjaro and DSM.
Recurrent
Implemented under Laboratory Support program
Implemented
DHS 3 rounds of CD4 external quality assessment panels from QASI Canada were sent to 53 participating laboratories in the country.
Recurrent
Implemented under Laboratory Support program
Implemented
DHS
Laboratory quality assurance manuals developed as a quality assurance framework document (August 2006) and distributed to all referral and regional Hospital laboratories (June 2007). Radiology and imaging quality system manual developed to a zero draft stage in, May 2007, in Dodoma.
Recurrent
Implemented under Laboratory Support program
Implemented
CMO The association of Pathologist in East, Central and Sub-Sahara African Congress was successfully conducted
Implemented
To contribute to the national response to HIV/AIDS in reducing further spread to form prevalence rate of 9.7% to 8.0% by 2009
Chief Medical Office
(CMO)
Implementation of activities did not take place
Recurrent
Training not conducted, funds were returned to Treasury to cater for National issues
Not implemented
To Contribute to Directorate of ART providing sites Recurrent and Funds for Partially

46
Health Sector Performance Profile Report | 5/20/2008
national response in HIV/AIDS in reducing further spread of HIV infection from the current prevalence rate of 9.7% to 8.0% by June 2009 (Ensure equitable, sustainable and cost effective access to Ant Retro Viral (ARVs)
Preventive Services
(DPS)
increased from 96 to 200, about 85,000 people started treatment with more than 170,000 been put on care, about 1,427 HCW trained on ART provision; First and Second line ARV drugs were procured; Training of 189 regional ART trainers
Development implementation of this activity are also contributed by development partners including CDC, Sweden, Norway and Global Fund.
implemented
DPS
voluntary counseling and testing provided to about 680,520 between Dec. 2005 and June. 2007. Established 1024 VCT sites and trained. Procurement of Laboratory reagents for STI, VCT, PMTCT, Blood safety and HIV diagnosis and Monitoring and Care and Treatment
Recurrent and
Development
Delay in receiving funds, however some activities were supported by funds from partners
Partially implemented
DPS
Procurement of Female and male condoms was done using funds from Government and Partners; STI drugs for STI treatment was procured and distributed to health facility.
Recurrent
Implemented
Twenty one regions and 113 local government authorities technically and financial supported to implement national Essential Health Interventions effectively and efficiently by the year 2009 (Guided planning,
DPS
The feedback working session involving all District Medical Offices ( DMOs) in the country through sharing of experience in the delivery of health services conducted
Recurrent
Implemented

47
Health Sector Performance Profile Report | 5/20/2008
budgeting and reporting of nation
Twenty one regions and 113 local government authorities technically and financial supported to implement national Essential Health Interventions effectively and efficiently by the year 2009 (Enhance program integration for a rationalized
DPS
Updating and merging the Database and Network for districts Health services
Recurrent The Database and Network for districts Health services have been developed. For the puporse of strengthening DHS information system.
Partially implemented
Twenty one regions and 113 local government authorities technically and financial supported to implement national Essential Health Interventions effectively and efficiently by the year 2009 (Provision of adequate and dynamic support for country
DPS
Twenty one regions and 113 local government authorities technically and financial supported to implement national Essential Health Interventions effectively and efficiently by the year 2009 (Provision of adequate and dynamic support for country
Recurrent Funds was not released for Joint technical back up supportive supervision and monitoring between PMORALG, MOH, RS/RHMTs, Partners for improvement of delivery of quality health services at the district level.
Not implemented
DHS
Re assessment of the annual report for implementation of Comprehensive Council Health Plan (CCHP) was done, which was a basis for approval of the third and fourth quarter allocation
Recurent Implemented
DHS
Response to HIV / AIDS in Level I, II and III Hospitals effectively
Recurrent Partially Implemented

48
Health Sector Performance Profile Report | 5/20/2008
coordinated by June 2009
2
To reduce morbidity and mortality rates in vulnerable groups with special focus on infants, under five children, pre-school and school age children, youths, people with disability, elderly and women of reproductive age, to increase life expectancy
Facilitate provision of adequate and timely quality diagnostic and health care technical services in 8 level III hospitals, 18 level II hospital II hospitals and 122 level I hospitals.
DHS
Implementation plans prepared for training of 25 primary care workers per district for 30 districts in the management of common mental disorders, alcohol and other drug- abuse.Three regions of DSM, Dodoma, and Kilimanjaro are in the process of conducting
Recurrent
Partially implemented
3
To ensure availability of basic essential health care services backed up with an effective referral system, action oriented research, gender disaggregated health data and active participation and involvement of the community
Health systems Research, health information and utilization of gender disaggregated data for evidence based planning and decision-making promoted at national to district levels by June 2007
DPP
MTUHA and NSS data collection tools were printed and distributed throughout the country and are in use. The capacity building for Mtwara, Lindi and Manyara Region CHMT, RHMT on operational research Methodology was conducted. Assessment of district health systems operationality was done in Sengerema and Magu districts and Musoma Municipality. NSS Census training was conducted for Verbal Autopsy Informers for Morogoro sites.
Recurrent Routine data not disaggregated according to genda
Partially implemented
Facilitate provision of quality and efficient health services in 8 Referral, 24 Regional & Municipal and 121 District
DHS
Funds were released from the Treasury and disbursed to Medical Stores Department (MSD) for provision of drugs, medical equipment, medical supplies, dental supplies, diagnostic supplies and ORET
Recurrent Implemented
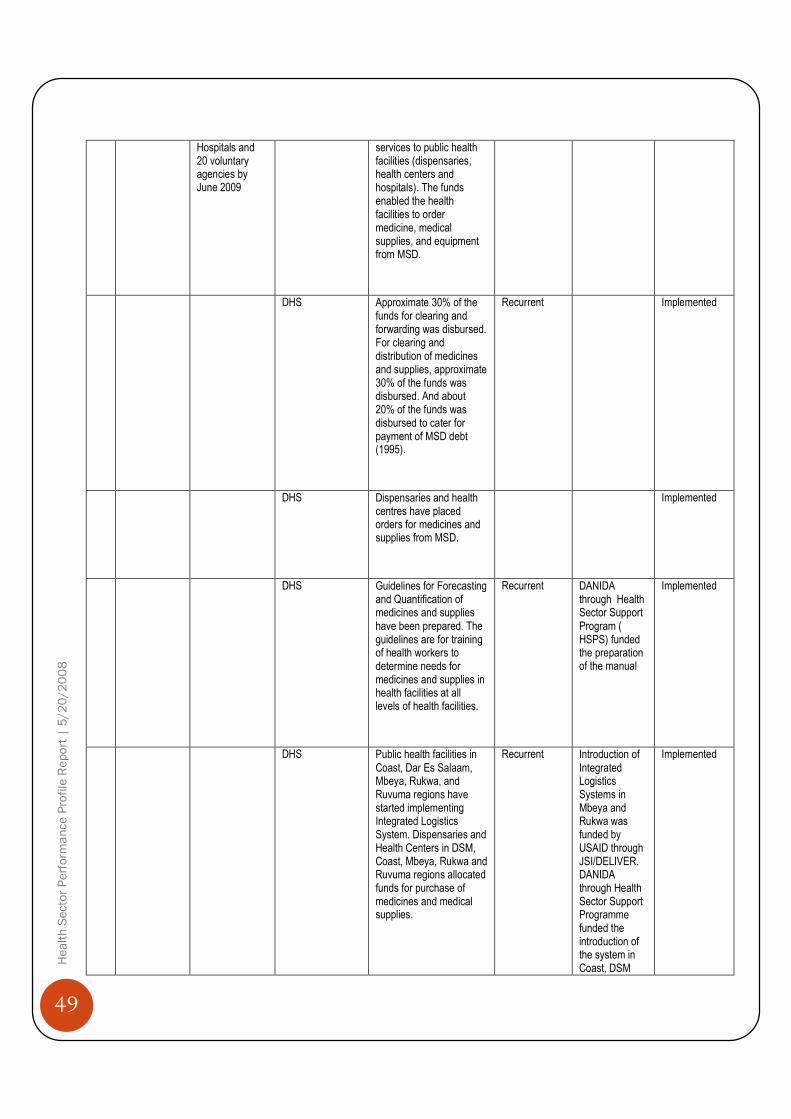
49
Health Sector Performance Profile Report | 5/20/2008
Hospitals and 20 voluntary agencies by June 2009
services to public health facilities (dispensaries, health centers and hospitals). The funds enabled the health facilities to order medicine, medical supplies, and equipment from MSD.
DHS
Approximate 30% of the funds for clearing and forwarding was disbursed. For clearing and distribution of medicines and supplies, approximate 30% of the funds was disbursed. And about 20% of the funds was disbursed to cater for payment of MSD debt (1995).
Recurrent Implemented
DHS
Dispensaries and health centres have placed orders for medicines and supplies from MSD.
Implemented
DHS
Guidelines for Forecasting and Quantification of medicines and supplies have been prepared. The guidelines are for training of health workers to determine needs for medicines and supplies in health facilities at all levels of health facilities.
Recurrent
DANIDA through Health Sector Support Program ( HSPS) funded the preparation of the manual
Implemented
DHS
Public health facilities in Coast, Dar Es Salaam, Mbeya, Rukwa, and Ruvuma regions have started implementing Integrated Logistics System. Dispensaries and Health Centers in DSM, Coast, Mbeya, Rukwa and Ruvuma regions allocated funds for purchase of medicines and medical supplies.
Recurrent Introduction of Integrated Logistics Systems in Mbeya and Rukwa was funded by USAID through JSI/DELIVER. DANIDA through Health Sector Support Programme funded the introduction of the system in Coast, DSM
Implemented

50
Health Sector Performance Profile Report | 5/20/2008
and Ruvuma regions.
DHS
There is a backload of about 1,115 patients awaiting for treatment abroad during the period of 2006 / 2007 85 patients were treated abroad accompanied by 19 escorters and 30 care takers. 75% of patients treated abroad had cardiac diseases both congenital and acquired.4% kidney transplants. 20% were having other serious conditions. Interns were paid their respective allowances according to the government scales. All referral Hospitals were paid their other charges funds according to the budget in time. Two 4FWD cars purchased
Recurrent Partially implemented
DHS
17 dental officers and 3 regional dental officers were trained on training of clinical officers (TOT) in emergency oral care. Oral health quality improvement resolutions were developed. Dissemination of factors affecting utilization of oral health services in the country conducted to regional dental officers and heads of training institutions. Essential dental list (surgical instruments, restorative instruments, dental materials and equipment) was reviewed. 4,000 dental manuals printed. Ten dental surgeons trained in research methodology.
Recurrent Implemented
DHS
Commemoration of African Traditional Day conducted in Mbeya region for exhibition of
Recurrent Implemented

51
Health Sector Performance Profile Report | 5/20/2008
tradition medicines, and promoting the collaboration between traditional and conventional health practitioners on prevention of HIV infection. Draft guidelines on Intellectual Property Rights (IPR) for traditional medicine developed. Draft guidelines for stakeholder’s collaboration on traditional medicine development developed.
To raise awareness of private health service providers in participation of Public Private Partnership
DHS
Voluntary Hospitals (VAH) and Designated District Hospitals (DDH) adjusted salaries for their staff. Funds approved for new salaries and arrears relased and disbursed to all 65 and 21 health facilities.
Recurrent Implemented
DHS
Advocacy workshop to top Government leaders on hospital reforms conducted at regional and district levels.
Recurrent Implemented
DHS
33 TOT from 4 regions and 8 districts trained on hospital reform
Recurrent Implemented
DHS
Grant in Aid Advisory committee approved St Artman Memorial Hospital and Mbalizi hospital to became Designated District Hospitals(DDH) making DDH to a total of 24 countrywide.
Recurrent Implemented
DHS
60 stakeholders gained awareness on Public private partnership and recommend on continuous advocacy on PPP.
Recurrent Implemented
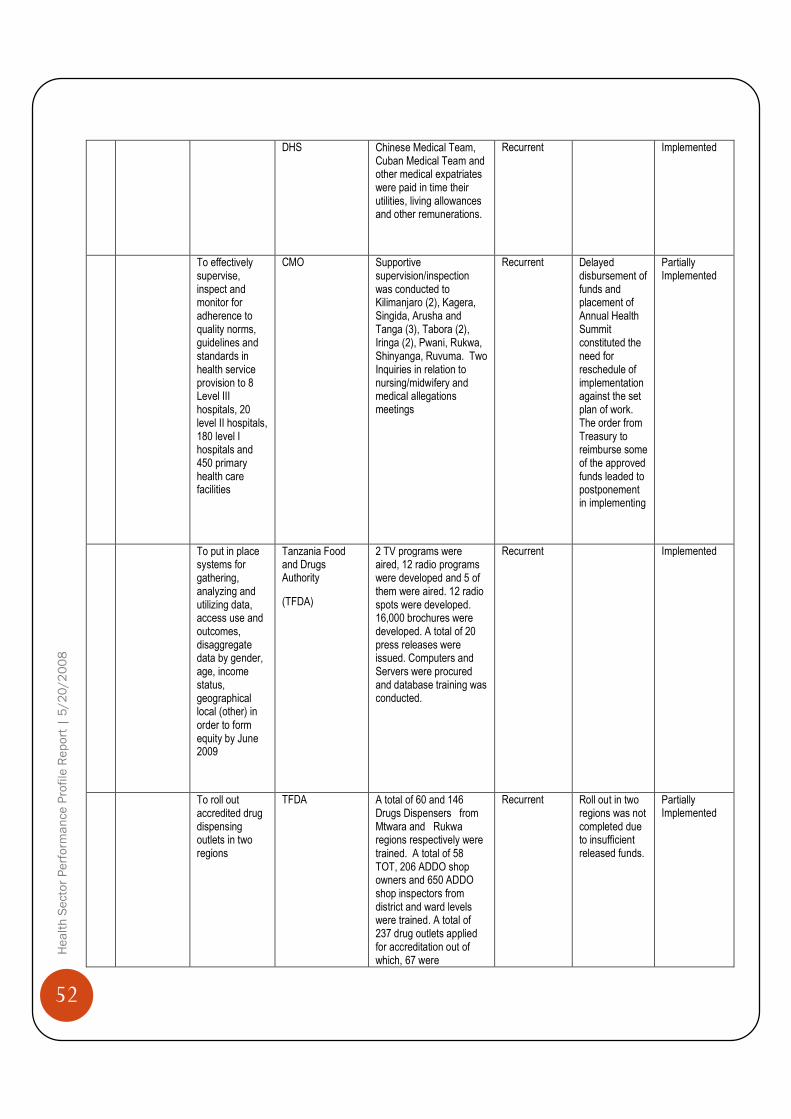
52
Health Sector Performance Profile Report | 5/20/2008
DHS
Chinese Medical Team, Cuban Medical Team and other medical expatriates were paid in time their utilities, living allowances and other remunerations.
Recurrent Implemented
To effectively supervise, inspect and monitor for adherence to quality norms, guidelines and standards in health service provision to 8 Level III hospitals, 20 level II hospitals, 180 level I hospitals and 450 primary health care facilities
CMO
Supportive supervision/inspection was conducted to Kilimanjaro (2), Kagera, Singida, Arusha and Tanga (3), Tabora (2), Iringa (2), Pwani, Rukwa, Shinyanga, Ruvuma. Two Inquiries in relation to nursing/midwifery and medical allegations meetings
Recurrent Delayed disbursement of funds and placement of Annual Health Summit constituted the need for reschedule of implementation against the set plan of work. The order from Treasury to reimburse some of the approved funds leaded to postponement in implementing
Partially Implemented
To put in place systems for gathering, analyzing and utilizing data, access use and outcomes, disaggregate data by gender, age, income status, geographical local (other) in order to form equity by June 2009
Tanzania Food and Drugs Authority
(TFDA)
2 TV programs were aired, 12 radio programs were developed and 5 of them were aired. 12 radio spots were developed. 16,000 brochures were developed. A total of 20 press releases were issued. Computers and Servers were procured and database training was conducted.
Recurrent Implemented
To roll out accredited drug dispensing outlets in two regions
TFDA
A total of 60 and 146 Drugs Dispensers from Mtwara and Rukwa regions respectively were trained. A total of 58 TOT, 206 ADDO shop owners and 650 ADDO shop inspectors from district and ward levels were trained. A total of 237 drug outlets applied for accreditation out of which, 67 were
Recurrent Roll out in two regions was not completed due to insufficient released funds.
Partially Implemented

53
Health Sector Performance Profile Report | 5/20/2008
accredited. IMCI was Implemented in 210 ADDO shops in Ruvuma.
Capacity building CHMT, RHMT Manyara Region on Operational Research methods and methodologies. Training on proposal development, Data collection and Training on Data Analysis and Report writing.
DPP
CHMT, RHMT of Manyara Region were trained on Operational Research methodologies. Also training was conducted on proposal development, Data collection and Training on Data Analysis and Report writing.
Development Implementation was around 90%
Implemented
4
To monitor and control quality and safety of food, drugs, chemicals and cosmetics to safeguard health of the public and environment
Compliance to quality, safety and efficacy standards, procedures and handling practices of food, drugs, cosmetics and medical devices by manufacturers, importers, exporters, distributors and sellers improved and maintained by June 2009
TFDA
Total 1927of applications for products registration were evaluated. Out of these 1228 were human drugs, 118 veterinary drugs, 3 herbal drugs, 6 clinical trials and 572 repacked food including food supplements. Total 4391 notification were evaluated. Out these 3139 repacked food and 1252 cosmetics. 107 promotion materials for food and drugs were evaluated.
Recurrent A total of 58 banned cosmetics,18 human medicines were withdrawn from the market.
Implemented
Effective and efficient system for inspection, surveillance, import and export control of regulated products developed and implemented by June 2009
TFDA
Food outlets 163, drug outlets 1768, Pharmacies 64, Cosmetics outlets 462, veterinary drugs 92 , hospitals 18, food manufacturing plants 109, drug manufacturing plants 4, Drug Dispensing outlets (ADDO) 155 were inspected. 33 ports of entry inspectors were trained. Unfit products for intended use worth Tsh 488,588,322 were destroyed.
Recurrent Premises found not complying with specified requirements were issued warning letters and directed to rectify the identified defects
Partially
Implemented
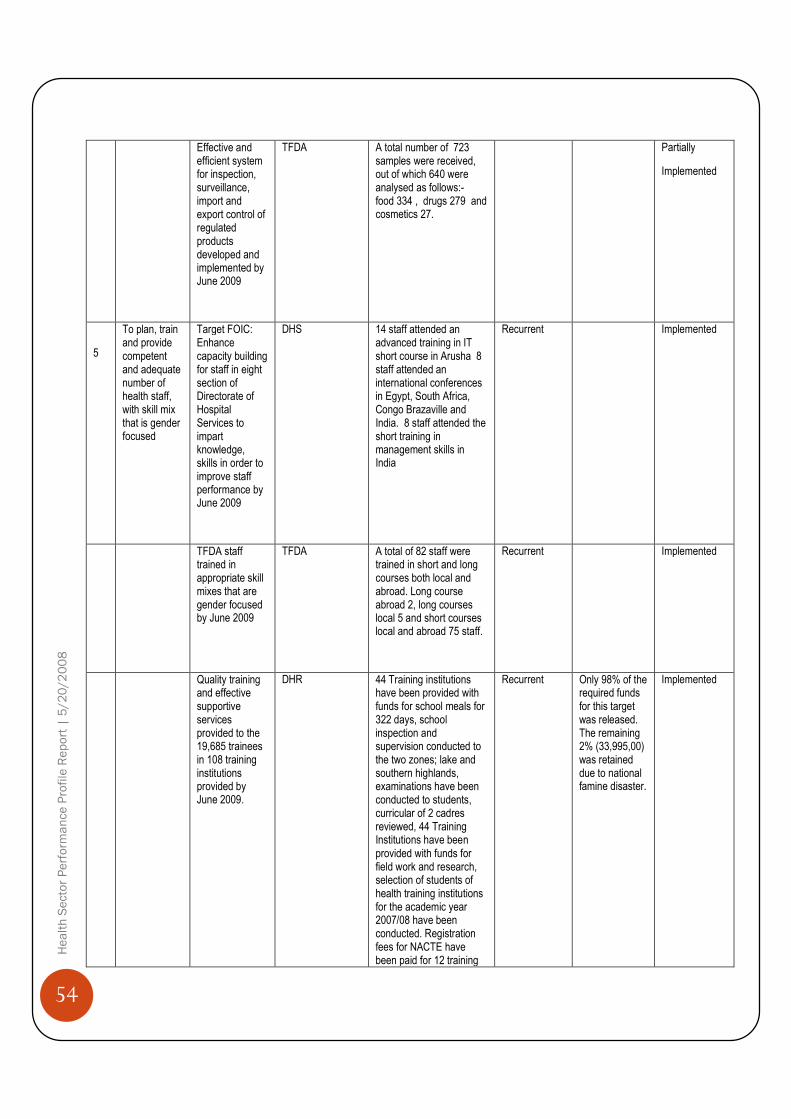
54
Health Sector Performance Profile Report | 5/20/2008
Effective and efficient system for inspection, surveillance, import and export control of regulated products developed and implemented by June 2009
TFDA
A total number of 723 samples were received, out of which 640 were analysed as follows:- food 334 , drugs 279 and cosmetics 27.
Partially
Implemented
5
To plan, train and provide competent and adequate number of health staff, with skill mix that is gender focused
Target FOIC: Enhance capacity building for staff in eight section of Directorate of Hospital Services to impart knowledge, skills in order to improve staff performance by June 2009
DHS
14 staff attended an advanced training in IT short course in Arusha 8 staff attended an international conferences in Egypt, South Africa, Congo Brazaville and India. 8 staff attended the short training in management skills in India
Recurrent Implemented
TFDA staff trained in appropriate skill mixes that are gender focused by June 2009
TFDA A total of 82 staff were trained in short and long courses both local and abroad. Long course abroad 2, long courses local 5 and short courses local and abroad 75 staff.
Recurrent Implemented
Quality training and effective supportive services provided to the 19,685 trainees in 108 training institutions provided by June 2009.
DHR
44 Training institutions have been provided with funds for school meals for 322 days, school inspection and supervision conducted to the two zones; lake and southern highlands, examinations have been conducted to students, curricular of 2 cadres reviewed, 44 Training Institutions have been provided with funds for field work and research, selection of students of health training institutions for the academic year 2007/08 have been conducted. Registration fees for NACTE have been paid for 12 training
Recurrent Only 98% of the required funds for this target was released. The remaining 2% (33,995,00) was retained due to national famine disaster.
Implemented

55
Health Sector Performance Profile Report | 5/20/2008
institutions.
Health workers competences and professional development for improved performance and service delivery developed at all levels by June, 2009
DHR
Training expenses have been paid to the 78 specialized and postgraduate students inside the country and 41 outside the country. Annual training grants have been provided to the institutions under MNH, KCMC, BMC, Kibaha and Bumbuli COTC, IMCI TOT conducted to 88 tutors teaching methodology course have been conducted to the 23 newly employed teachers.
Recurrent Only 98% of the required funds for this target was released. The remaining 2% (59,000,000) was retained due to national famine disaster.
Implemented
Technical equipment, teaching materials and working tools for 49 training institutions for improving teaching and learning replaced or acquired by June, 2009.
DHR
44 Training Institutions have been provided with funds for stationary and cleaning supplies, teaching materials, vehicle maintenance, minor works and fumigation.
Recurrent Only 75% of the required funds for this target was released. The remaining 25% (351,730,000) was retained due to national famine disaster.
Partially
Implemented
Human Resources Planning and Managerial Capacity for Health services delivery of entire health sector at all levels strengthened by June, 2009.
DHR
26 principals trained on MTEF and MKUKUTA and participated on the review of annual three year plans and budgets, tracer study on utilization of Vector Control graduates conducted.
Recurrent Only 40% of the required funds for this target was released. The remaining 60% (231,925,000) was retained due to national famine disaster.
Partially Implemented
Capacity Building Plan to support effective and efficient delivery of services for the department of human resources implemented by
DHR
Induction course conducted to 230 new graduands, 15 health workers were sponsored to attend short courses for the development of their competencies, funds provided to the 6 zonal continuing education centers to strengthen their capacities, library of
Recurrent Only 90% of the required funds for this target was released. The remaining 10% (62,000,000) was retained due to national famine disaster.
Implemented
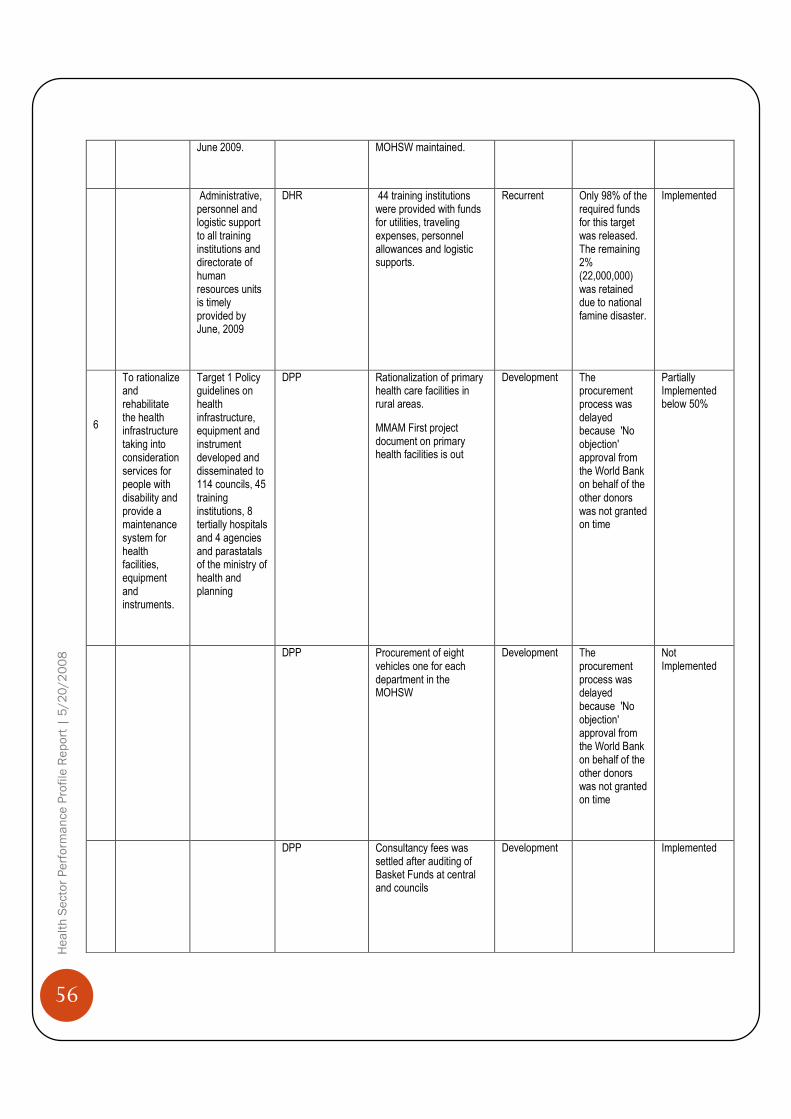
56
Health Sector Performance Profile Report | 5/20/2008
June 2009.
MOHSW maintained.
Administrative, personnel and logistic support to all training institutions and directorate of human resources units is timely provided by June, 2009
DHR
44 training institutions were provided with funds for utilities, traveling expenses, personnel allowances and logistic supports.
Recurrent Only 98% of the required funds for this target was released. The remaining 2% (22,000,000) was retained due to national famine disaster.
Implemented
6
To rationalize and rehabilitate the health infrastructure taking into consideration services for people with disability and provide a maintenance system for health facilities, equipment and instruments.
Target 1 Policy guidelines on health infrastructure, equipment and instrument developed and disseminated to 114 councils, 45 training institutions, 8 tertially hospitals and 4 agencies and parastatals of the ministry of health and planning
DPP
Rationalization of primary health care facilities in rural areas.
MMAM First project document on primary health facilities is out
Development The procurement process was delayed because 'No objection' approval from the World Bank on behalf of the other donors was not granted on time
Partially Implemented below 50%
DPP
Procurement of eight vehicles one for each department in the MOHSW
Development The procurement process was delayed because 'No objection' approval from the World Bank on behalf of the other donors was not granted on time
Not Implemented
DPP
Consultancy fees was settled after auditing of Basket Funds at central and councils
Development Implemented

57
Health Sector Performance Profile Report | 5/20/2008
DPP
Support to district activities
by transferring funds allocated to the districts.
Development Partially Implemented
Policy guidelines on health infrastructure, equipment and instrument developed and disseminated to 114 councils, 45 training institutions, 8 tertially hospitals and 4 agencies and parastatals of the ministry of health.
DHS
Rehabilitation of Muhimbili National Hospital and Construction and Extension of Dar es Salaam Urban Health Facilities (DUHFs) is about to be completed
Development Implemented
DPP
Government paid part of its contribution to the project as counterpart fund
Development Partially Implemented
DHS
Strengthening of Mbeya Referral Hospitals by
Rehabilitation of 9 wards at main hospital, Theater and medical records
Development This activity was not done, instead funds were used for Construction of interns hostel
Not Implemented
DHS
Completion of extension of Laboratory at Mbeya referral hospital
Development Partially implemented
DHS
Expansion of Mbeya Referral Hospital X Ray department
Development Partially implemented
DHS
Furniture, fixtures and fittings for Mbeya referral hospital
Development Not Implemented
DHS Completion of upgrading of Lupaso Health center
Development Payment was used to meet consultancy
Partially implemented

58
Health Sector Performance Profile Report | 5/20/2008
fees of the district engineers office
below 50%
DHS
Support to introduction of open heart surgery centre
Development Specialized supplies for the open heart surgery center in procurement process, payment done against suppliers
Partially implemented below 50%
DHS
Rehabilitation of Interns Hostel at St. Gasper, Peremiho, and Surian
Development Construction of intern hostel at Mount Meru Hospital was completed
Partially implemented below 50%
DHS
Rehabilitation of treatment centre for alcohol and drugs abuse and other addicts at Milembe hospital
Development Partially implemented
DHS
Construction of new fence and reception building at Milembe Hospital
Development Partially implemented
DHS
Finalization of installation of water system at Mirembe and Isanga
Development Not implemented
DHS
Rehabilitation of internal sewage system at Isanga Institution
Development Implemented
DHS
Rehabilitation of unit block - male compound of four wards at Milembe Hospital
Development Not implemented
DHS
Rehabilitation of Isanga Institution and Administration Block
Development Not implemented

59
Health Sector Performance Profile Report | 5/20/2008
DHS
Improvement of security system at Mirembe
Development Not implemented
DHS Rehabilitation and repair of Unit C Block at Mirembe hospital
Development Slow progress due to funding problems
Implemented
DHS
Rehabilitation of three staff quarters at Mirembe hospital
Development Slow progress due to funding problems
Implemented
DHS
Rehabilitation of Occupational Therapy Ward at Milembe hospital
Development Not Implemented
DHS
Renovation of electrical system at Isanga and Mirembe
Development Partially implemented
DHS
Rehabilitation of staff canteen at Mirembe
Development Not Implemented
DHS
Construction of new Kitchen
at Kibong’oto hospital
Development The contractor is finalizing extension and rehabilitation of the kitchen. Commitment of funds for remaining contractual liabilities done
Implemented
DHS
Construction of Pediatric ward at Kibong’oto hospital
Development The contractor is finalizing construction of pediatric ward. Commitment of funds for the upcoming contractual liabilities done
Implemented
DHS
Construction of hospital fence at Kibong’oto hospital
Development Partially implemented below 50%
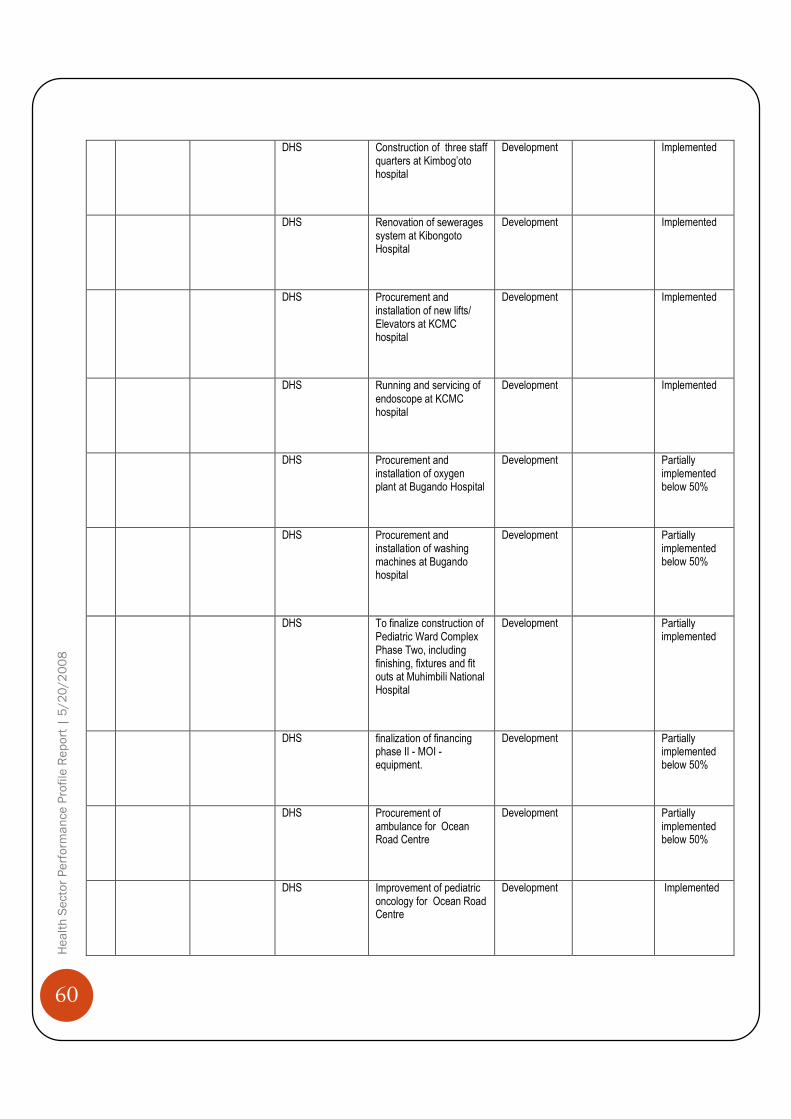
60
Health Sector Performance Profile Report | 5/20/2008
DHS
Construction of three staff quarters at Kimbog’oto hospital
Development Implemented
DHS
Renovation of sewerages system at Kibongoto Hospital
Development Implemented
DHS
Procurement and installation of new lifts/ Elevators at KCMC hospital
Development Implemented
DHS
Running and servicing of endoscope at KCMC hospital
Development Implemented
DHS
Procurement and installation of oxygen plant at Bugando Hospital
Development Partially implemented below 50%
DHS
Procurement and installation of washing machines at Bugando hospital
Development Partially implemented below 50%
DHS
To finalize construction of Pediatric Ward Complex Phase Two, including finishing, fixtures and fit outs at Muhimbili National Hospital
Development Partially implemented
DHS
finalization of financing phase II - MOI - equipment.
Development Partially implemented below 50%
DHS
Procurement of ambulance for Ocean Road Centre
Development Partially implemented below 50%
DHS
Improvement of pediatric oncology for Ocean Road Centre
Development Implemented

61
Health Sector Performance Profile Report | 5/20/2008
DHS
Pediatric Care Improvement
at Ocean Road Centre
Development Implemented
Chief Government Chemist Agency
CGCA
Completion of Quality Control Lab Headquarters at Chief Government Chemist Agency
Development Implemented
CGCA Provision of Laboratory equipment for Chief Government Chemist Agency at the Mwanza lab branch
Development Implemented
Director of Preventive Services (DPS)
Improving access to basic services to women and adolescence - sexual reproductive health(Vaccines)
Development Implemented
DPS
Procurement of essential commodities for RCH services (Condoms and contraceptives)
Development Implemented
DPS
Procurement of Minbus to strengthen service delivery at central ministry
Development Implemented
DHS
Procurement of 2 Vehicles for new District Councils
Development Not Completed
NACP/DPS
Support to HIV/AIDS Programme. Voluntary counseling and testing provided to about 680,520 between Dec. 2005 and June. 2007 established 1024 VCT sites and trained. Procuremnt of Laboratory reagents for STI, VCT, PMTCT, Blood safety and HIV diagnocisis and Monitoring and Care and Treatment was done
Development Partially implemented

62
Health Sector Performance Profile Report | 5/20/2008
NACP/DPS
Procurement of Female and male condoms was done using funds from Government and Partiners; STI drungs for STI tretment was procured and distributed to health facility.
Development Implemented
TDFA
Vertical extension of offices on plot !st Floor on the top of Finance and Library Building at TFDA
Development Implemented
TDFA
Rehabilitation of building at Mikocheni Plot No. 510-540 for TDFA
Development Partially implemented below 50%
TDFA
Renovation of Mikocheni Offices and Laboratory
Development Partially implemented below 50%
NIMR
Construction of Mabibo Traditional Medicine Laboratory and construction of Tabora laboratory.
Development Partially implemented
NIMR
Government contribution to research Trust Funds
Development Implemented
NIMR
Completion of Rehabilitation of Gonja field station
Development Partial Completed
TFDA
Completion of construction of TFDA Headquarters’ Offices.
Development Implemented
Social Welfare Services (SWS)
Support to orphans and other vulnerable groups
Development Partially implemented
SWS
Rehabilitation of 5 remand homes, 2 homes for the elderly, Ilonga mother and child welfare and
Development Partially implemented

63
Health Sector Performance Profile Report | 5/20/2008
approved school
SWS
Construction of Student Library at Institute of Social Work
Development Partially implemented
DHR
Completion of rehabilitation of building (workshop, toilets, dormitories, dining hall and teachers houses at Newala Nursing Training School
Development Partially implemented
DHR
Construction of classroom and finalization of dormitory at Kahama Nursing School
Development Partially implemented below 50%
DHR
Construction of students dormitory at Kahama Nursing School
Development Partially implemented
DHR
Construction of underground water collection tank at Kahama Nursing School
Development Implemented
DHR
Renovation of Dormitory, classroom and library at Njombe Nursing School
Development Implemented
DHR
Procurement of 17 vehicles for services improvement in training institutions
Development Partially implemented below 50%
DHR
Construction of dormitory at Mtwara Nursing School
Development Construction work is still going on
Implemented
DHR
Rehabilitation of student's hostel at Muhimbili Nursing School
Development Partially implemented below 50%
DHR Completion of construction of dormitory
Development Partially
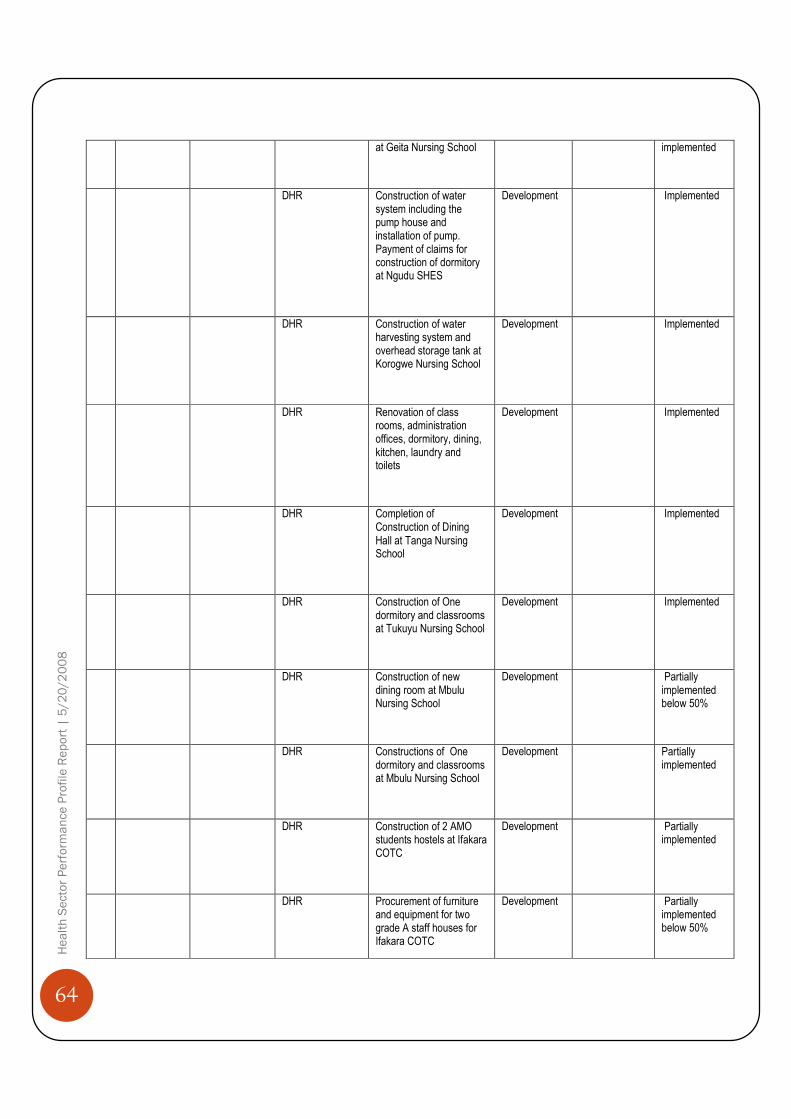
64
Health Sector Performance Profile Report | 5/20/2008
at Geita Nursing School
implemented
DHR
Construction of water system including the pump house and installation of pump. Payment of claims for construction of dormitory at Ngudu SHES
Development Implemented
DHR
Construction of water harvesting system and overhead storage tank at Korogwe Nursing School
Development Implemented
DHR
Renovation of class rooms, administration offices, dormitory, dining, kitchen, laundry and toilets
Development Implemented
DHR
Completion of Construction of Dining Hall at Tanga Nursing School
Development Implemented
DHR
Construction of One dormitory and classrooms at Tukuyu Nursing School
Development Implemented
DHR
Construction of new dining room at Mbulu Nursing School
Development Partially implemented below 50%
DHR
Constructions of One dormitory and classrooms at Mbulu Nursing School
Development Partially implemented
DHR
Construction of 2 AMO students hostels at Ifakara COTC
Development Partially implemented
DHR
Procurement of furniture and equipment for two grade A staff houses for Ifakara COTC
Development Partially implemented below 50%

65
Health Sector Performance Profile Report | 5/20/2008
DHR
Procurement and Installation of submersible pump for the water supply system at Ifakara COTC
Development Partially implemented below 50%
DHR
Rehabilitation of student dormitories and construction of shallow wells at Bagamoyo Nursing School
Development Implemented
DHR
Completion of Construction of students hostel at Vector Control Training Centre
Development Implemented
DHR
Completion of Students dormitory at Kondoa Nursing School
Development Implemented
DHR
Completion of construction of Administration block and Construction of Class room and dormitory at Same Nursing School
Development Partially implemented below 50%
Construction of dormitory, classroom and Library at Tarime Nursing School
Development Implemented
7
To review, develop, disseminate monitor and evaluate the National Health policy, policy guidelines, legislation, standards, processes, regulations, plans and budgets that ensure delivery of quality health services with a gender
DPP
Review exemption / waivers guidelines for cost sharing schemes and dissemination to different stakeholders
Development Partially implemented

66
Health Sector Performance Profile Report | 5/20/2008
perspective.
DPP
Publicize and advocate HSR to Regions, Councils and public by developing electronic programmes and advert spots for production in TV and Radio media.
Development Partially implemented
DPP
Support for HSRS in reviewing forwarded Council Health Plans and Reports from the Regions.
Development
Partially implemented below 50%
DPP
Review and develop HSR Advocacy handbooks, pamphlets, handouts, leaflets, posters and wall charts and distribute to councils every year up to 2007.
Development
Partially implemented below 50%
Support to 121 Councils in Advocating and updating lower level facilities (Health Center & Dispensaries)on HSR and delivery of Quality services every year up to 2009.
Development
Partially implemented
DPP
Production and airing of HSR AFYA MAMBO MAPYA, AFYA YAKO, IJUE AFYA YAKO programmes and 140 spots in RTD, TVT, ITV, R.ONE, RFA and local media.
Development
Partially implemented
DPP
Conduct HSR advocacy to zonal consultant/special and regional hospitals staff for effective delivery of quality of health services.
Development
Partially implemented
National Health Insurance
Support NHIF on Rehabilitation of NHIF
Development Implemented

67
Health Sector Performance Profile Report | 5/20/2008
(NHI)/DPP Head Office and Archive, Actuarial Valuation and statistical bulletin and Computerization of funds operations
NHI/DPP Supportive supervision visits in 121 to monitor CHF/TIKA implementation performance 25 annually up to 2009.
Development Partially implemented below 50%
DPP
Provision of Matching funds and contribution of government for exemption and waivers for all Districts implementing cost sharing contributions annually up to June 2009.
Development Partially implemented below 50%
DPP
TIKA - Training and sensitization of the remaining 6 Municipal/Urban Councils by June 2009.
Development Partially implemented below 50%
DPP
TIKA establishment/ inaugurations and social marketing by 2009
Development Partially implemented below 50%
DPP
Conduct training of CHF/TIKA zonal and council coordinators and support zonal facilitative supevision to councils by 2009
Development Partially implemented below 50%
DPP
CHF consultative meetings with key stakeholders to be held in three (3) zones, Iringa, Arusha and Dodoma by 2007.
Development Partially implemented
DPP
Support the councils in the establishment and inauguration of CHF and CHSB
Development Partially implemented
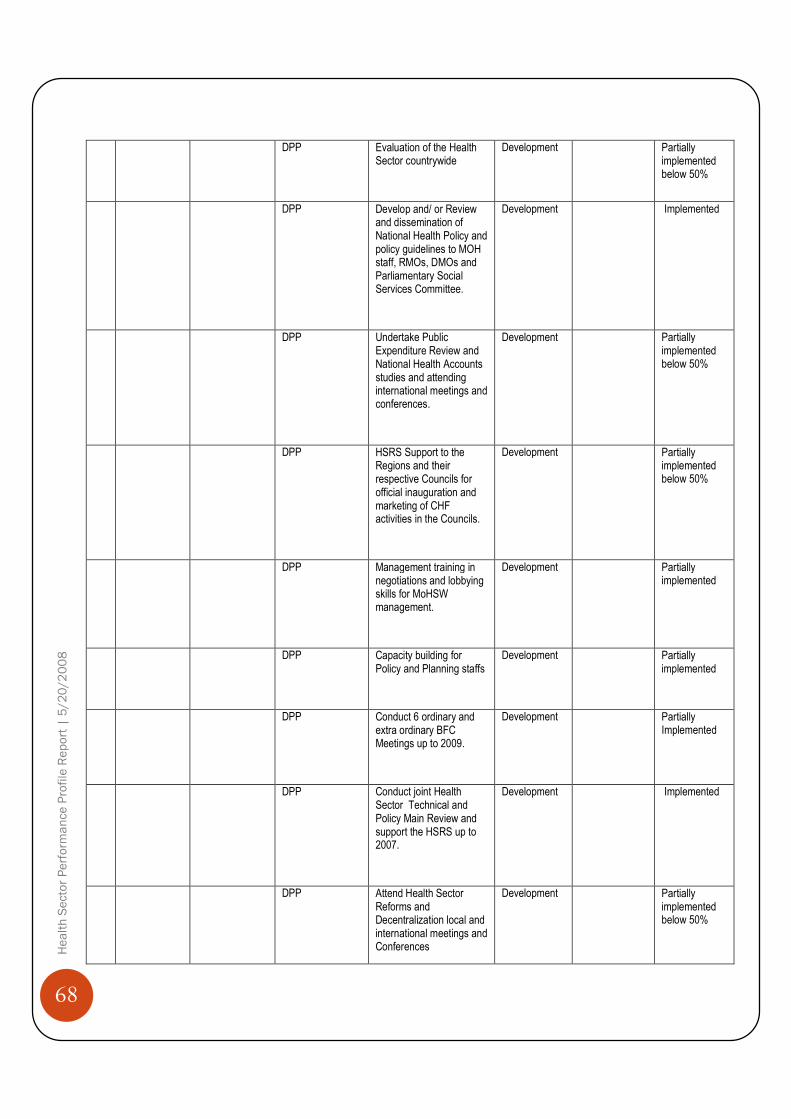
68
Health Sector Performance Profile Report | 5/20/2008
DPP
Evaluation of the Health Sector countrywide
Development Partially implemented below 50%
DPP
Develop and/ or Review and dissemination of National Health Policy and policy guidelines to MOH staff, RMOs, DMOs and Parliamentary Social Services Committee.
Development Implemented
DPP
Undertake Public Expenditure Review and National Health Accounts studies and attending international meetings and conferences.
Development Partially implemented below 50%
DPP
HSRS Support to the Regions and their respective Councils for official inauguration and marketing of CHF activities in the Councils.
Development Partially implemented below 50%
DPP
Management training in negotiations and lobbying skills for MoHSW management.
Development Partially implemented
DPP
Capacity building for Policy and Planning staffs
Development Partially implemented
DPP
Conduct 6 ordinary and extra ordinary BFC Meetings up to 2009.
Development Partially Implemented
DPP
Conduct joint Health Sector Technical and Policy Main Review and support the HSRS up to 2007.
Development Implemented
DPP
Attend Health Sector Reforms and Decentralization local and international meetings and Conferences
Development Partially implemented below 50%
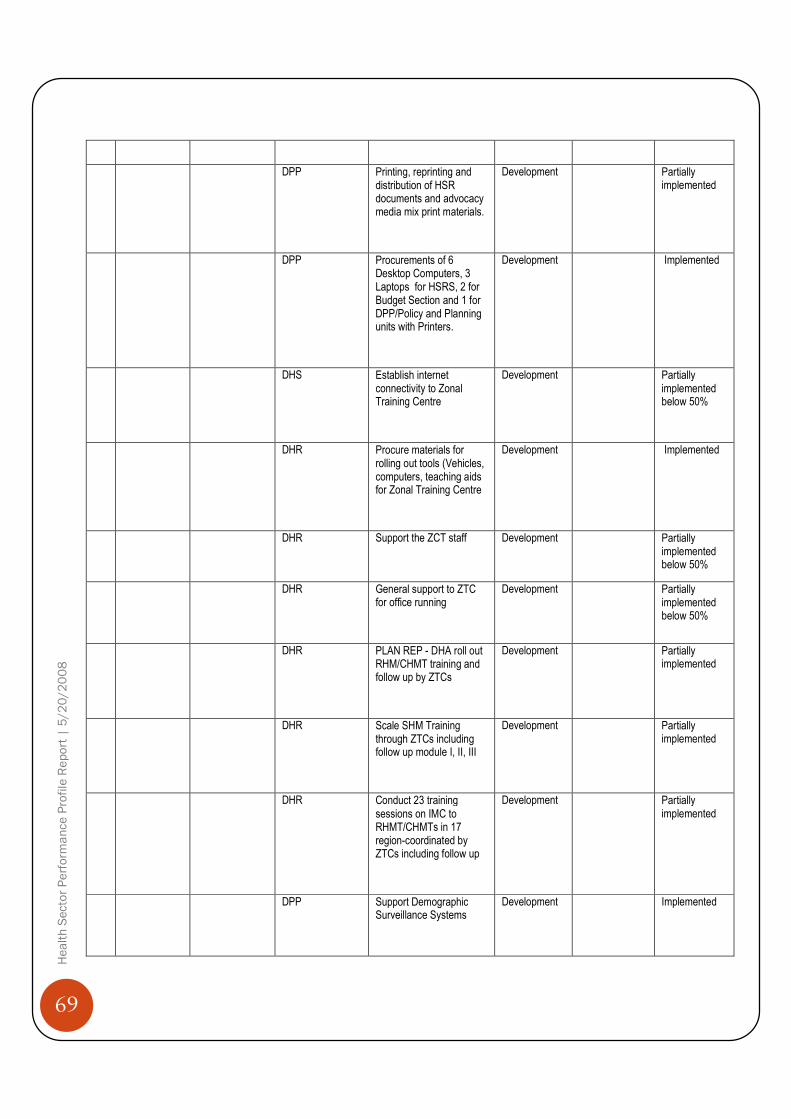
69
Health Sector Performance Profile Report | 5/20/2008
DPP
Printing, reprinting and distribution of HSR documents and advocacy media mix print materials.
Development Partially implemented
DPP
Procurements of 6 Desktop Computers, 3 Laptops for HSRS, 2 for Budget Section and 1 for DPP/Policy and Planning units with Printers.
Development Implemented
DHS
Establish internet connectivity to Zonal Training Centre
Development Partially implemented below 50%
DHR
Procure materials for rolling out tools (Vehicles, computers, teaching aids for Zonal Training Centre
Development Implemented
DHR
Support the ZCT staff
Development Partially implemented below 50%
DHR
General support to ZTC for office running
Development Partially implemented below 50%
DHR
PLAN REP - DHA roll out RHM/CHMT training and follow up by ZTCs
Development Partially implemented
DHR
Scale SHM Training through ZTCs including follow up module I, II, III
Development Partially implemented
DHR
Conduct 23 training sessions on IMC to RHMT/CHMTs in 17 region-coordinated by ZTCs including follow up
Development Partially implemented
DPP
Support Demographic Surveillance Systems
Development Implemented

70
Health Sector Performance Profile Report | 5/20/2008
DPS
Support scale up of intervention - IMCI
Development Partially implemented
DHR
Purchases of Stationery for ZTCs.
Development Partially implemented
DPP
Implementation of National Health Policy, Guidelines and 5 plans advocated, supported, monitored, evaluated and reviewed at all levels by June 2007.
Recurrent Partially implemented
DPP
Implementation of Health Sector Reforms promoted and coordinated at all levels
Recurrent Partially implemented below 50%
DPP
Timely and efficient administrative services and logistics support for 5 sections of Directorate of Policy and Planning delivered by June 2007
Recurrent Partially implemented below 50%
CMO
Institutionalize at National, regional and district level guidelines and standards on Tanzania quality improvement framework, integration of health services, emergency and nursing services by June 2007
Recurrent Partially implemented
CMO
Guide, coordinate and support 5 regulatory ad statutory bodies to perform their function effectively
Recurrent Implemented
8
To improve the Social Welfare of vulnerable groups through promotion improved and
TFDA
Personnel , administrative services, financial, procurement and logistics supports providing timely and efficiency to support monitoring and evaluation of implemented activities
Recurrent Implemented

71
Health Sector Performance Profile Report | 5/20/2008
protection of rights access
SWS Capacity of 7 VTC tailored to people with disabilities and other vulnerable groups improved
Recurrent Partially implemented
SWS 10 Region have capacity and resettlement programs tailored to the needs of vulnerable groups
Recurrent Implemented
SWS Installation Electrical and rehabilitation of classroom at Luanzari VTC and Sewage system for Yombo VTCw
Recurrent Partially implemented
SWS
To implement National Programs that promote education for MVC and early childhood development
Recurrent Partially implemented
SWS
To provide entrepreunship skill to 150 older people from the Institution's for the elderly by June 2007
Recurrent 80 Elderly at Nunge Home were provided with interprounaship.
Partially implemented
SWS
Learning environment at Kisangara Day Care Centre training centers improved.
Recurrent Electrical wiring at Kisangara Training Centre was done and Day Care Centre Training curriculum was reviewed.
Implemented
SWS
Orphaned and other Vulnerable Children (OVC/MVC) in 15 Regions Identified for effective social protection.
Recurrent Implemented
SWS Basic needs of people with disabilities, elderly
Recurrent Implemented
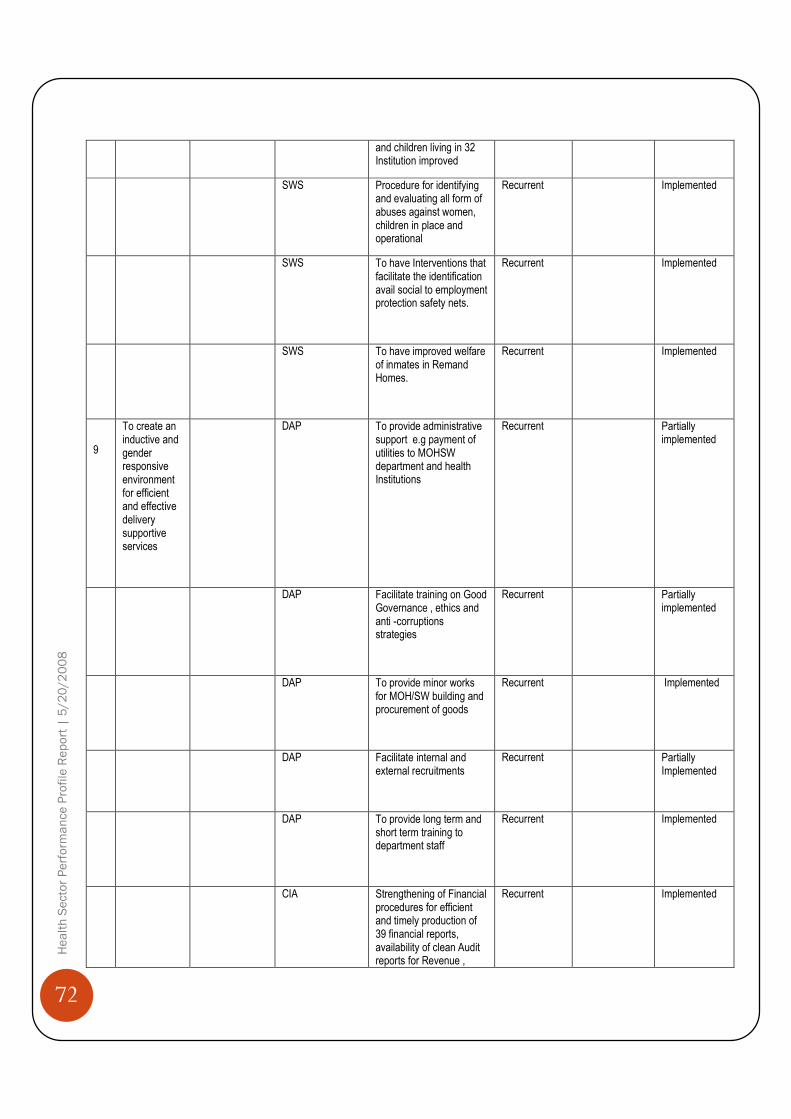
72
Health Sector Performance Profile Report | 5/20/2008
and children living in 32 Institution improved
SWS
Procedure for identifying and evaluating all form of abuses against women, children in place and operational
Recurrent Implemented
SWS
To have Interventions that facilitate the identification avail social to employment protection safety nets.
Recurrent Implemented
SWS
To have improved welfare of inmates in Remand Homes.
Recurrent Implemented
9
To create an inductive and gender responsive environment for efficient and effective delivery supportive services
DAP
To provide administrative support e.g payment of utilities to MOHSW department and health Institutions
Recurrent Partially implemented
DAP
Facilitate training on Good Governance , ethics and anti -corruptions strategies
Recurrent Partially implemented
DAP
To provide minor works for MOH/SW building and procurement of goods
Recurrent Implemented
DAP
Facilitate internal and external recruitments
Recurrent Partially Implemented
DAP
To provide long term and short term training to department staff
Recurrent Implemented
CIA
Strengthening of Financial procedures for efficient and timely production of 39 financial reports, availability of clean Audit reports for Revenue ,
Recurrent Implemented

73
Health Sector Performance Profile Report | 5/20/2008
Development ,Deposit and Recurrent Account hence Reduction of Audit queries by 80%
CIA
To conduct audit to social welfare elderly homes, juvenile prisons and social welfare training centers
Recurrent Implemented
CIA
Provision of Administrative and logistics services to improve performance of finance and Accounts Department
Recurrent Partially implemented
DHS
Administrative and logistic support to 8 sections of the Directorate of Hospital Services timely provided by June 2009
Recurrent Partially implemented below 50%
CMO
To strengthen capacity of 3 units (Quality Assurance, Emergency preparedness and response, Nursing Services), National AIDS Control Program, CMO's administration and 6 Councils
Recurrent Implemented
CMO
Recurrent Implemented
CMO
To effectively develop and implement capacity building plan to support delivery of services to the office of CMO
Recurrent Partially implemented

74
Health Sector Performance Profile Report | 5/20/2008
Bibliography Bibliography Bibliography Bibliography
Joint External Evaluation. The Health Sector in Tanzania, 1999 – 2006, Cowi, Goss Gilroy, EPOS Health
Consultants.
Masanja H, et al. Child survival gains in Tanzania: analysis of data from demographic and health surveys. Lancet
2008; 371: 1276-83
URT, Health Sector Performance Profile in Tanzania, 2004 (Unpublished Report)
URT, Ministry of Health, Health Information, Research and Statistics Section Health Statistics Abstract 2007
(Unpublished Report)
URT/WHO, Tanzania Service Availability Mapping, 2005 – 2006
URT, Tanzania HIV/AIDS Indicator Survey, 2003 – 04, NBS/ORC Macro International
URT, Health Sector PER Update FY06 Summary Report
URT, Health Sector PER Update 2007, Draft (unpublished)
URT, Tanzania Demographic and Health Survey 1996, 1996, 2004/05, NBS/ORC Macro International
URT, MTEF for Tanzania, 2006/07
URT, Report on Evaluation of CCHP Annual Implementation Report for The Year 2006/07 From 121 and First
Quarter Progress Reports (July – September 2007) From 132 Councils
URT, Country Health Profile, 2007