maine medicaid expansion report - jan 6. 2013 revision
DESCRIPTION
Third draft.TRANSCRIPT

Feasibility of Medicaid Expansion
under the Affordable Care Act:
A Review Submitted to the
Maine Department of Health & Human Services
Interim Report
Monday, January 6, 2014
The Alexander Group, LLC Providence, R.I.
Philadelphia, Pa.
Washington, D.C.
Maine State Capitol 1965
Library of Congress, Prints & Photographs Division, ME, 6-AUG, 2-1

Creating and Delivering Innovative Global Solutions
Providence, R.I. ■ Philadelphia, Pa. ■ Washington, D.C.

Table of Contents
Page i
TABLE OF CONTENTS
TABLE OF CONTENTS ............................................................................................... i
TABLE OF FIGURES ................................................................................................ iii
LIST OF ACRYONYMS ............................................................................................. v
Foreword ............................................................................................................. vii
Executive Summary .............................................................................................. ix
Background ..................................................................................................................................... ix
How States Are Deciding ................................................................................................................ ix
Results from the Financial Model .................................................................................................... x
Risk Analysis .................................................................................................................................... xi
Conclusion ...................................................................................................................................... xii
Section I: Introduction ........................................................................................... 1
Overview .......................................................................................................................................... 1
Medicaid in Brief .............................................................................................................................. 1
The ACA and the Court Decision ...................................................................................................... 2
Importance of Feasibility ................................................................................................................. 4
Section II: Medicaid Finance and Outcomes—National Perspective ....................... 7
Overview .......................................................................................................................................... 7
Official US Government Forecast .................................................................................................... 7
Federal Budget Deficit and National Debt ..................................................................................... 11
Perspective from the States .......................................................................................................... 16
Less Funds for Vulnerable Populations.......................................................................................... 19
Inadequate Payment to Providers ................................................................................................. 20
Poor Health Outcomes .................................................................................................................. 24
Section III: How States Are Deciding .................................................................... 27
What States Are Doing................................................................................................................... 27
Eligibility Determination Challenges .............................................................................................. 28
Medicaid Realizes Largest Increases with the ACA ....................................................................... 29
Selected State Highlights of Recent Activity .................................................................................. 30
Section IV: MaineCare Overview .......................................................................... 35
Demographic Impact ..................................................................................................................... 35
Table of Contents
Page: ii
Federal Medical Assistance Percentage (FMAP) ........................................................................... 43
Maine Private Health Insurance Premium Program (PHIP) ........................................................... 44
Initial Issues with Quality ............................................................................................................... 45
Policy Changes on the Uninsured and Uncompensated Care ....................................................... 49
Section V: Results of the Financial Model............................................................. 53
Overview of Financial Model ......................................................................................................... 53
Population ...................................................................................................................................... 54
Fiscal Cost ...................................................................................................................................... 58
Fiscal Impact ................................................................................................................................... 63
Conclusion on Results of Financial Model ...................................................................................... 67
Section VI: Risk Analysis ....................................................................................... 69
Overview ........................................................................................................................................ 69
The Risk Factors Considered .......................................................................................................... 69
Poverty Growth Risk Factor ........................................................................................................... 71
PMPM Risk Factor .......................................................................................................................... 79
Private Drop Risk Factor ................................................................................................................ 83
FMAP Risk Factor ........................................................................................................................... 88
Best Case / Worst Case Scenarios ................................................................................................. 90
Section VII: Conclusion and Next Steps ................................................................ 97
Appendix A: Summary of Medicaid-Expansion Decisions by the States ................ 99
Appendix B: Methodology, Assumptions, Data, and Other Technical
Information ....................................................................................................... 109
Appendix C: Key AG Team Members Who Contributed to This Report ............... 115
Bibliography ...................................................................................................... 119

Table of Figures
Page: iii
TABLE OF FIGURES
FIGURE 1: PROJECTED MEDICAID ENROLLMENT – MILLIONS OF PERSONS .......................................................................................... 8
FIGURE 2: PROJECTED MEDICAID EXPENDITURES – IN BILLIONS OF DOLLARS ....................................................................................... 9
FIGURE 3: MEDICAID EXPENDITURES AS SHARE OF GDP ............................................................................................................... 10
FIGURE 4: TOP 10 LARGEST FEDERAL DEFICITS RANKED IN TWO WAYS ........................................................................................... 12
FIGURE 5: COMPARE US DEBT/ GDP RATIO TO EU COUNTRIES ..................................................................................................... 13
FIGURE 6: TOTAL OUTLAYS FROM FEDERAL GOVERNMENT 2011-2013 .......................................................................................... 15
FIGURE 7: STATE RANKS FOR SPENDING ON BASIC EDUCATION / MEDICAID ..................................................................................... 18
FIGURE 8: COMPARING MAINE TO THE NATIONAL AVERAGE FOR MAJOR EXPENDITURES .................................................................... 18
FIGURE 9: CENTS ON THE DOLLAR MEDICAID PAYS RELATIVE TO PRIVATE INSURERS BY STATE .............................................................. 21
FIGURE 10: SUMMARY OF WHAT THE STATES ARE DOING ............................................................................................................ 27
FIGURE 11: PROJECTED CHANGES IN MAINE'S AGE PROFILE FROM 2012 TO 2022 ........................................................................... 35
FIGURE 12: POVERTY IS A CRITICAL ISSUE FOR MAINE .................................................................................................................. 36
FIGURE 13: MAINE POPULATION AND POVERTY TRENDS FOR YEARS 2000 - 2012 ............................................................................ 36
FIGURE 14: MAINE POVERTY AS PERCENT OF POPULATION ........................................................................................................... 37
FIGURE 15: STATE BY STATE MEAN UNHEALTHY DAYS IN LAST 30 DAYS .......................................................................................... 38
FIGURE 16: MAINE DHHS BUDGET—ALL FUNDS ....................................................................................................................... 39
FIGURE 17: MAINE DHHS BUDGET—GENERAL FUND ONLY ......................................................................................................... 39
FIGURE 18: MAINECARE AS PERCENT OF FUNDING SOURCE .......................................................................................................... 40
FIGURE 19: COMPARING MAINECARE TO PUBLIC SCHOOLS SUPPORT .............................................................................................. 41
FIGURE 20: PERCENT SPENT OF BUDGETARY FUNDS .................................................................................................................... 41
FIGURE 21: TEN YEAR ANNUAL BUDGET GROWTH COMPARISONS .................................................................................................. 42
FIGURE 22: NEW ENGLAND STATES’ EXPENDITURES ON MEDICAID - PERCENT OF TOTAL .................................................................... 42
FIGURE 23: THE HISTORY OF FMAP IN MAINE ........................................................................................................................... 44
FIGURE 24: PERCENT OF FAMILIES ENROLLED IN HIPP ................................................................................................................. 45
FIGURE 25: MAINE READMISSION RATES BY MEDICAL AREA ......................................................................................................... 46
FIGURE 26: STATE AND MAINECARE PROGRAM WAITLISTS ........................................................................................................... 47
FIGURE 27: AGE BY LTC FACILITY STATISTICS .............................................................................................................................. 48
FIGURE 28: MAINECARE ENROLLMENT—TOTAL MEMBERS AND PMPM ........................................................................................ 49
FIGURE 29: MAINE UNINSURED RATES ...................................................................................................................................... 50
FIGURE 30: ANNUAL AVERAGE PROJECTED GROWTH RATES .......................................................................................................... 54
FIGURE 31: MAINE ACTUARIAL FORECAST OF PERSONS IN POVERTY ............................................................................................... 54
FIGURE 32: BASELINE ENROLLMENT FORECASTS .......................................................................................................................... 55
FIGURE 33: MAINECARE ENROLLMENT WITH EXPANSION ............................................................................................................. 56
FIGURE 34: MAINECARE ENROLLMENT SFY 2014-15 EXPANSION FORECAST .................................................................................. 57
FIGURE 35: MAINECARE ENROLLMENT FORECASTS COMPARISON .................................................................................................. 58
FIGURE 36: MAINECARE TOTAL COST FORECAST ......................................................................................................................... 60
FIGURE 37: ESTIMATED STATE COST OF EXPANSION OVER BASELINE ............................................................................................... 61
FIGURE 38: THE ALEXANDER GROUP FINANCIAL MODEL RESULTS .................................................................................................. 62
FIGURE 39: MAINECARE AS PERCENT OF STATE POPULATION ........................................................................................................ 63
FIGURE 40: MAINECARE SERVICES AND BUDGET GROWTH COMPARISON ........................................................................................ 64
FIGURE 41: MAINECARE SERVICES AS PERCENT OF MAINE STATE BUDGET BY FUND .......................................................................... 65
FIGURE 42: MAINECARE ENROLLEES TO EMPLOYED MAINERS RATIO .............................................................................................. 66
FIGURE 43: MAINECARE ENROLLMENT TO EMPLOYMENT COMPARISON .......................................................................................... 66
FIGURE 44: RISK FACTORS EXAMINED ....................................................................................................................................... 69

Table of Figures
Page: iv
FIGURE 45: POVERTY GROWTH RISK FACTORS ............................................................................................................................ 71
FIGURE 46: POVERTY GROWTH RISK FACTOR CHANGES TO ASSUMED MIDDLE VALUES ...................................................................... 71
FIGURE 47: EXPANSION IMPACT OF POVERTY GROWTH RISK FACTORS ............................................................................................ 71
FIGURE 48: RANGE OF ACTUARIAL FORECAST OF PERSONS IN POVERTY ........................................................................................... 72
FIGURE 49: RANGE OF ACTUARIAL FORECAST OF CHILDREN IN POVERTY .......................................................................................... 73
FIGURE 50: POVERTY RISK FACTOR IMPACT ON MAINECARE ENROLLMENT ...................................................................................... 74
FIGURE 51: POVERTY RISK FACTOR IMPACT ON MAINECARE AS PERCENT OF STATE POPULATION ......................................................... 75
FIGURE 52: POVERTY RISK FACTOR IMPACT ON TOTAL COST OF MAINECARE.................................................................................... 76
FIGURE 53: POVERTY RISK FACTOR IMPACT ON TOTAL COST OF EXPANSION RELATIVE TO THE BASELINE ................................................ 77
FIGURE 54: POVERTY RISK FACTOR IMPACT ON STATE COST OF EXPANSION RELATIVE TO THE BASELINE ................................................ 78
FIGURE 55: PMPM GROWTH RISK FACTOR ............................................................................................................................... 79
FIGURE 56: PMPM RISK FACTOR TO ASSUMED MIDDLE VALUES ................................................................................................... 79
FIGURE 57: EXPANSION IMPACT OF PMPM RISK FACTORS ........................................................................................................... 79
FIGURE 58: PMPM RISK FACTOR IMPACT ON TOTAL COST OF MAINECARE ..................................................................................... 80
FIGURE 59: PMPM RISK FACTOR IMPACT ON TOTAL COST OF EXPANSION RELATIVE TO THE BASELINE ................................................. 81
FIGURE 60: PMPM RISK FACTOR IMPACT ON STATE COST OF EXPANSION RELATIVE TO THE BASELINE ................................................. 82
FIGURE 61: DROPPED PRIVATE INSURANCE RISK FACTOR .............................................................................................................. 83
FIGURE 62: PRIVATE DROP RISK FACTOR CHANGES TO ASSUMED MIDDLE VALUES ............................................................................ 83
FIGURE 63: EXPANSION IMPACT OF PRIVATE DROP RISK FACTORS .................................................................................................. 83
FIGURE 64: PRIVATE DROP RISK FACTOR IMPACT ON ENROLLMENT ................................................................................................ 84
FIGURE 65: PRIVATE DROP RISK FACTOR IMPACT ON MAINECARE AS A PERCENT OF STATE POPULATION ............................................... 85
FIGURE 66: PRIVATE DROP RISK FACTOR IMPACT ON TOTAL COST OF MAINECARE RELATIVE TO THE BASELINE ....................................... 86
FIGURE 67: PRIVATE DROP RISK FACTOR IMPACT ON STATE COST OF EXPANSION RELATIVE TO BASELINE ............................................... 87
FIGURE 68: FMAP RISK FACTORS ............................................................................................................................................ 88
FIGURE 69: FMAP RISK FACTOR CHANGES TO ASSUMED OF MIDDLE VALUES .................................................................................. 88
FIGURE 70: EXPANSION IMPACT OF FMAP RISK FACTORS ............................................................................................................ 88
FIGURE 71: FMAP RISK FACTOR IMPACT ON STATE COST OF EXPANSION RELATIVE TO THE BASELINE ................................................... 89
FIGURE 72: BEST AND WORST CASE SCENARIOS .......................................................................................................................... 90
FIGURE 73: BEST AND WORST CASE RISK FACTOR CHANGES TO ASSUMED MIDDLE VALUES ................................................................ 90
FIGURE 74: EXPANSION IMPACT OF BEST CASE AND WORST CASE RISK FACTORS .............................................................................. 90
FIGURE 75: BEST CASE / WORST CASE RISK FACTOR IMPACT ON ENROLLMENT ................................................................................. 91
FIGURE 76: BEST CASE / WORST CASE RISK FACTOR IMPACT ON MAINECARE AS A PERCENT OF STATE POPULATION ............................... 92
FIGURE 77: BEST CASE / WORST CASE RISK FACTOR IMPACT ON TOTAL COSTS OF MAINECARE ........................................................... 93
FIGURE 78: BEST CASE / WORST CASE RISK FACTOR IMPACT ON TOTAL COST OF EXPANSION RELATIVE TO THE BASELINE ......................... 94
FIGURE 79: BEST CASE / WORST CASE RISK FACTOR IMPACT ON STATE COST OF EXPANSION RELATIVE TO THE BASELINE ......................... 95
FIGURE 80: POPULATION GROWTH FACTORS............................................................................................................................ 111
FIGURE 81: ACTUAL PMPMS PER CATEGORY .......................................................................................................................... 112
FIGURE 82: ASSUMED FMAP RATES ...................................................................................................................................... 113

List of Acronyms
Page: v
LIST OF ACRYONYMS
ACA Affordable Care Act of 2010
AG The Alexander Group
ARRA American Recovery and Reinvestment Act of 2009
ASPE Assistant Secretary for Planning and Evaluation, USDHHS
BIP Balancing Incentives Program Grant
CBO Congressional Budget Office
CDC Centers for Disease Control and Prevention
CHIP Children’s Health Insurance Program. Also known as SCHIP.
CMS U.S. Center on Medicare and Medicaid Services
CY Calendar Year
ESI Employer-sponsored Insurance
DSH Disproportionate Share Hospital
FFY Federal Fiscal Year
FMAP Federal Medical Assistance Percentage
FPL Federal Poverty Level
GDP Gross Domestic Product
HCBS Home and Community-Based Services
HIPP Health Insurance Premium Payment
LTSS Long Term Services and Support
MAGI Modified Adjusted Gross Income
MDHHS Maine Department of Health and Human Services

List of Acronyms
Page: vi
MMIS Medicaid Management Information Systems
NASBO National Association of State Budget Officers
NFIB National Federation of Independent Business
OADS Maine’s Office of Aging and Disability Services
OMS Office of MaineCare Services
PHIP Maine Private Health Insurance Premium Program
PMPM Average cost, Per-Month Per-Member
SAIPE Small Area Income and Poverty Estimates
SFY State Fiscal Year
SCHIP State’s Children Health Insurance Program. Also known as CHIP.
SPA State Plan Amendment
USDHHS United States Department of Health and Human Services

Foreword
Page: vii
Foreword
Although an essential program for the poor and vulnerable, Medicaid has for years represented a
significant budget challenge for state governments. As the assistance program has expanded,
policymakers have attempted to limit or rein in funding to slow its growth; yet today Medicaid has
replaced K-12 education as the largest financial item in states’ budgets when all funds are counted.
To lessen the fiscal impact, government officials have implemented numerous initiatives, including
rate reductions, managed care to moderate utilization, pharmaceutical restrictions, and even
imposing co-payments and cost sharing to introduce personal responsibility. Further, as the federal
government has sought to reduce its share of payment, state governments have attempted to
increase revenue by using practices that increase federal Medicaid spending with limited or no real
state contribution. Despite these efforts, Medicaid remains a fiscal challenge to state policymakers
as they also grapple with funding other budgetary priorities, such as education, transportation, and
the environment.
Maine is no different; yet its case is more acute. Years of system changes, expansions, modifications,
and even some achievements to more appropriately serve the physically and medically fragile, have
left Medicaid’s growth outpacing other major budget items, such as funding for K-12 education,
which is necessary to achieve future economic growth and stability. Maine’s Medicaid system, called
MaineCare, is suffering from inadequate financial resources to maintain current commitments.
Thousands of persons with intellectual disabilities are waiting for necessary services to help them
live healthy and safely; physicians lack adequate reimbursement and are becoming scarcer for
MaineCare enrollees; information-technology systems are in need of enhancements; and the elderly
population is fast growing.
Like most states, Maine is in the midst of making a decision whether or not to expand Medicaid. For
those states that have chosen to expand Medicaid, the Affordable Care Act (ACA), signed into law
in 2010, transforms the program from a traditional program that serves the most needy and
vulnerable to one that provides health-care coverage for everyone under the income threshold of
138% of the Federal Poverty level.
To ensure that the State considers all aspects of this important decision, the State of Maine’s
Department of Health and Human Services has engaged the Alexander Group to prepare a feasibility
study and analyze the complexities associated with making this determination. Consequently, this
feasibility study is offered to help policymakers make a more informed decision based on the
evidence and the merits. Although we have reviewed the most salient aspects of expansion to date,
new findings and information will continue to emerge that may influence our overall understanding
of the issue.

Foreword
Page: viii
Going forward, the Alexander Group will review such data and may apply those findings to improve
our analysis and forecasts. Subsequently, the Alexander Group may periodically update this review
to reflect such new information.
This feasibility study would never have materialized without the help of Mary Mayhew,
commissioner of Maine’s Department of Health and Human Service. She and her staff were
invaluable in assisting us to obtain data and other information necessary for our analysis. Her
department also reviewed a draft of this study. Pursuant to standard practice, we incorporated
those recommendations from the department that we believed improved the report before
submitting this final version. While we are indeed grateful for the assistance of the department, the
Alexander Group takes full responsibility for all statements, opinions, evaluations, and analysis
contained herein. As we worked diligently to adhere to the facts, we are prepared to support every
statement made therein. If any factual errors are found, we take full responsibility and will
issue corrective statements, if necessary.

Executive Summary
Page: ix
Executive Summary
Background
Maine’s Department of Health and Human Services has engaged the Alexander Group to prepare a
feasibility study and analyze the complexities associated with expanding eligibility to its Medicaid
program, i.e., MaineCare, pursuant to the Affordable Care Act of 2010 (ACA).
The Office of the Actuary of the U.S. Department of Health and Human Services predicts that if all
states expand eligibility to Medicaid total enrollment would increase to an estimated 84.8 million in
FFY 2021, for a 52.2% increase. The total cost would grow to $830.9 billion in FFY 2021, an increase
of 94.4%. The actuaries noted that even if only those states comprising 65% of the Medicaid
population decide to expand that Medicaid will grow faster than GDP, and they predicted that by
2020 it would comprise 3.2% of GDP, up from 2.8% in 2011.
For states, Medicaid has become the largest expenditure when all funding sources—including
federal—are considered. Data from the National Association of State Budget Officers show Medicaid
spending holds a substantial lead over the second largest state-budget category, i.e., primary and
secondary education: 24.5% versus 20.0%. Maine’s spending pattern preceded the national pattern
by more than ten years when MaineCare overtook basic education spending as a percentage of the
total budget in 1992. Also, Maine spends the third-highest percent of its total budget on Medicaid
of all the states.
Fiscal issues are not the only challenge. A number of specialized Medicaid programs, including those
in MaineCare, have long waiting lists. The low rate of payment to physicians has diminished the
number of doctors willing to accept new Medicaid patients, and empirical studies on health-care
quality have consistently ranked Medicaid on the bottom relative to Medicare and commercial
coverage. Finally, federal Medicaid policy has historically favored costly institutional care, even in
cases where individuals would be more appropriately served in less-restrictive home- and
community-settings.
How States Are Deciding
According to the most recent information available, twenty-two states are not expanding eligibility
for their Medicaid programs, three states are currently undecided, and twenty-five states are
expanding in some form or another. All 13 states that have both a Democratic governor and a
Democrat-controlled legislature are expanding eligibility. Of the 24 states with Republican
governors and GOP-controlled legislatures: 18 are not expanding, 2 are considering, and 4 are
expanding. The decisions are mixed for the remaining states.

Executive Summary
Page: x
To date, states that are expanding are experiencing challenges with their eligibility systems.
However, states are reporting higher enrollment in Medicaid than in private insurance since the
Affordable Care Act exchanges opened October 1, 2013. The report provides brief reviews of the
experience of 25 states and the District of Columbia.
Results from the Financial Model
The Alexander Group developed a customized financial model to forecast enrollment and the
associated fiscal costs of MaineCare. The Baseline assumes two programs are discontinued: (1)
parents 101% to 138% of FPL, and (2) the Childless Adult Waiver.
Because of high poverty growth, the model predicts a significant growth in the Baseline. Thus, even
without expanding eligibility, MaineCare enrollment is projected to grow by an annual average rate
of 2.8%. Over nine years, this growth rate is a total increase of nearly 29%, which would add 79,135
persons to the enrollment, bringing the SFY 2023-24 Baseline enrollment to 354,918.
Under the Expansion Scenario, the average annual growth for enrollment is estimated to be 5.7%
over ten years, which is total increase of 74.7%. This would add a total of 204,800 persons onto the
rolls over the ten year period, including the enrollment growth for the Baseline.
The AG Financial Model shows the total cost (all state funds plus federal funds) for the Baseline and
Expansion Scenario will be significant. For the Baseline, total costs will increase on average of 5.3%
per year, which increases the total cost by 67.2% over a ten-year period. Under the Baseline, the
total cost for MaineCare increases by $1.8 billion, from $2.7 billion in SFY 2013-14 to $4.5 billion in
SFY 2023-24.
For the Expansion Scenario, the total cost of MaineCare doubles by $2.7 billion in SFY 2013-14 to
$5.4 billion in SFY 2023-24, an increase of 101%.
For the Expansion Scenario, state costs would be $33.5 million in SFY 2014–15, or $45.3 million if
the higher FMAP is denied for the childless adult waiver population when compared to the Baseline.
The state costs are projected to grow to $125.0 million in SFY 2023–24, for a ten-year total of $807
million, or $840 million if the higher FMAP is denied.
Maine had 21.5% of its overall state population enrolled in MaineCare in SFY 2012-13. This
percentage will grow to 25.4% by SFY 2023-24 under the Baseline. Under the Expansion Scenario,
however, 34.3% of the overall state population will be enrolled in Medicaid, or one in every three
persons. These percentages do not include the approximately 45,000 individuals who receive partial
benefits from MaineCare.
In terms of state funds, the budget for MaineCare services has been growing faster than the rest of
the state budget (6.0% average annual growth versus 2.2%). The AG Financial Model forecasts that

Executive Summary
Page: xi
the Baseline average annual growth rate will be 5.2%. However, if Maine elects to expand
MaineCare eligibility, the forecasted growth rate becomes 5.9%.
The percentage of the General Fund budget dedicated to MaineCare services is projected to grow
from 24.2% in SFY 2012–13 to 35.0% under the Baseline. Under the Expansion Scenario, however,
MaineCare will require 37.4% of the General Fund budget. For the overall budget, including federal
funds, MaineCare will require 44.6% of the total budget under expansion in SFY 2023-24 as opposed
to 39.5% under the Baseline.
One quick way to evaluate the economic impact is to compare MaineCare enrollment to
employment. In SFY 2012–13, the ratio was 1 to 2.0, meaning that each person on MaineCare was
supported by 2 employed persons. That ratio will drop to 1 to 1.4 in 2020 under the Expansion
Scenario.
Risk Analysis
The scenarios generated by the financial model are based on a number of key assumptions on values
of factors that will determine what trends will prevail in the future. Each value chosen was in the
middle of an expected range of possibilities. There is risk, however, that the actual values that will
be realized in the future will fall toward either end of the ranges as opposed to in the middle. Low-
end values are defined as those values that would cause enrollment and costs to be lower than
forecasted. High-end values are those values that would cause enrollment and cost to be more than
forecasted.
Four risk factors chosen to be analyzed are the poverty growth rates, Per Member Per Month
(PMPM) cost growth rates, individuals with private insurance losing coverage (private drop), and
FMAP rate changes. In addition, a best case scenario and a worst-case scenario were run, assuming
that the three of those four risk factors will have values that fall on either the low-end or high-end
of their respective ranges.
Variance in the poverty growth risk factor would cause enrollment for the Baseline to vary from -
6.8% to +7.3% off the middle by SFY 2023-24, and it would cause the state cost over the ten years
for the Baseline to vary from -3.4% to +3.6% off the middle. Total expansion enrollment would vary
from 117,144 to 131,344 in SFY 2023-24 as measured from the Baseline. State costs over ten years
for the expansion would vary from $777.2 million to $837 million relative to the Baseline.
Variance in the PMPM cost risk factor would cause the state cost of the Baseline to vary from -5.6%
to +6.0% off the middle over the ten years. The ten-year state cost for the expansion would vary
from $750.4 million to $867 million as measured from the Baseline.

Executive Summary
Page: xii
Variance in the private drop risk factor would cause the expansion enrollment to vary from 115,999
to 144,194 by SFY 2023-24. State costs over ten years for the Expansion Scenario would vary from
$763.6 million to $920 million relative to the Baseline.
Variance in the FMAP risk factor would cause the state cost of the Baseline to vary from -9.0% to
+1.5% off the middle over the ten years. State costs over ten years for the Expansion Scenario would
vary from $765.7 million to $2.45 billion relative to the Baseline.
The best-case scenario assumed low-end values for the following risk factors: poverty growth,
PMPM growth, and private drop. The worst-case scenario assumed high-end values for PMPM
growth, private drop, and FMAP. Variance in the best case / worst-case scenarios would cause
enrollment for the Baseline to vary from -6.8% to 0% off the middle by SFY 2023-24, and it would
cause the ten-year state costs for the Baseline to vary from -8.9% to +21.8% off the middle. Total
expansion enrollment would vary from 109,526 to 144,194 in SFY 2023-24 relative to the Baseline.
State costs over ten years for the expansion would vary from $684.7 million to $3.05 billion relative
to the Baseline.
Conclusion
The AG Financial Model demonstrates that it will be challenging for Maine to afford MaineCare in
the future even without expansion. Given current trends, MaineCare will comprise larger shares of
Maine’s General Fund budgets. Expanding eligibility will only exacerbate the trend, whereby
MaineCare will comprise 37.4% of the General Fund budget in ten years. In addition, risk analysis
shows that the best-case Expansion Scenario would still cost the state $684.7 million over the next
ten years in addition to the cost of the Baseline. In total funds (all state and federal funds), the best-
case scenario for expansion would have a ten-year cost of $6.3 billion. The worst-case scenario,
however, would cost the state $3.05 billion over the next ten years in addition to the cost of the
Baseline. In total funds, the worst-case scenario for expansion would have a ten-year cost of $9.1
billion.
The more pressing needs are restructuring and streamlining to make MaineCare more efficient and
to deliver better quality outcomes. While health-care access and improved health outcomes remain
an imperative, expansion of Medicaid may not be the best policy choice to achieve those goals.
Other viable alternatives may allow Maine to improve access and quality while prioritizing needs
and saving tax dollars. Consequently, Maine needs a state-based solution with flexibility from the
federal government that focuses on access, transparency, quality, personal responsibility, and
efficiency. That alternative would offer executive and legislative policymakers greater budgetary
certainty, and allow them to focus on other fiscal and policy priorities.

Section I: Introduction
Page: 1
Section I: Introduction
Overview
The Alexander Group (AG) was asked to “review the proposed Medicaid expansion currently offered
under the Affordable Care Act and offer a feasibility study for Maine.” MaineCare1 is the Medicaid
program for the State of Maine. The Affordable Care Act of 2010 (ACA)2 mandates that states expand
eligibility for their Medicaid programs to include all persons with incomes equal to or less than 133%
of the Federal Poverty Level (FPL)3 as defined by the law, plus a 5% income disregard effectively
extending eligibility to 138% of FPL ($15,856 for an individual; $32,499 for a family of four in 2013.)
The U.S. Supreme Court ruled that Congress exceeded its authority in mandating the expansion of
eligibility, thus giving each state the choice on whether it wants to expand eligibility as defined by
the ACA.
Medicaid in Brief
Medicaid4 is a cooperative program between states and the federal government to provide health
care benefits to low-income individuals who also meet eligibility requirements of predefined
categories. In order to receive federal matching funds, states must provide benefits for numerous
mandatory eligibility categories, which are often summarized as pregnant women, infants and
children, low-income families, disabled individuals, and the elderly. Each mandatory population has
its own set of eligibility rules.
States may also receive federal matching funds for programs that cover optional categories of
individuals, and there is considerable variation and complexity in how these optional categories are
defined. Federal law further provides for waivers to allow states some flexibility in designing
programs outside current program parameters. These waivers require approval of the U.S.
Department of Health and Human Services (USDHHS) in order to receive federal matching funds.
States also are allowed to modify their Medicaid State Plan (the contract between the state and the
Federal government that describes the state’s Medicaid program) through something called the
1 As used in this report, MaineCare includes all means-tested medical assistance programs administered by the Maine Department
of Health and Human Services, including CubCare.
2 The Patient Protection and Affordable Care Act, Public Law No. 111-148, was amended by the Health Care and Education Reconciliation Act of 2010, Public Law No. 111-152, and is referred to in this study as the Affordable Care Act (ACA).
3 The U.S. Department of Health and Human Services annually publishes poverty guidelines in the Federal Register for administrative purposes of determining eligibility for various federal programs. These guidelines are often referred to as the Federal Poverty Level (FPL).
4 Enacted in 1965, Medicaid is found in Title XIX of the Social Security Act. The Balanced Budget Act of 1997, Public Law 105-33, established the State Children’s Health Insurance Program (SCHIP), which became known as the Children’s Health Insurance Program (CHIP) after March 2009. Found in Title XXI of the Social Security Act, it is common to use CHIP and SCHIP interchangeably. Often, and in most contexts, CHIP is considered part of Medicaid.

Section I: Introduction
Page: 2
State Plan Amendment (SPA) process. SPAs allow states to request basic program changes, make
corrections, or send the federal government updates on their programs. Although waivers allow for
more flexibility to test new and innovative models of care or new ways to deliver care, both the
waiver and the SPA are referred to as the legal authority states possess to change their Medicaid
programs.5
State participation in Medicaid is optional, but all states do participate.6 The federal government
provides matching funds via a formula using a three year average of state per capita income7, known
as the Federal Medical Assistance Percentage (FMAP). States with lower per capita incomes relative
to the national average receive higher FMAPs while states with higher per capita income receive
lower FMAPs. However, no state receives less than fifty percent. Generally, FMAPs vary from year-
to-year based not only on annual fluctuations of per capita income but also due to changes in
Federal law.8
The ACA and the Court Decision
The ACA is a complex piece of legislation having ten separate titles that comprise 907 pages in the
consolidated version published by the U.S. House Office of the Legislative Counsel for the use of its
attorneys and its clients. In its implementation, it has generated thousands of pages of federal
regulations, and it impacts Medicare9, Medicaid, the states that administer Medicaid, health-care
providers, health-care device manufacturers, and potentially every citizen because of the
5 Each time a state wants to make changes to its existing Medicaid system, it must go through these administrative processes with
the Federal government. These processes are often times tedious, laborious, and outmoded.
6 Arizona was the last state in the Union to implement Medicaid, doing so in 1982, 17 years after President Lyndon Johnson signed the program into law.
7 Per capita income is mathematically determined by dividing total income by total population.
8 A few examples include changes to the FMAP in the Patient Protection and Affordable Care Act (ACA, P.L. 111-148 as amended), federal deficit reduction proposals originally offered in late 2011, which would amend the FMAP rate, and the disaster-related FMAP adjustment.
9 Medicare and Medicaid should not be confused. Medicare is a federally run program to provide basic health care coverage for most Americans age 65 or older and certain groups of disabled individuals under 65 who are receiving social security benefits. Medicaid is a federal program to provide support to the states to run means-tested programs for specific categories of low income individuals and is the subject of this study and described in greater detail throughout this report. More formerly titled HEALTH INSURANCE FOR THE AGED AND DISABLED found in Title XVIII of the Social Security Act, Medicare was created as part of the Social Security Amendments of 1965 to provide health care coverage for aged persons to complement retirement, survivors, and disability benefits under Title II of the Social Security Act. In 1973, the program was expanded to include groups of individuals with disabilities, including those entitled to Social Security or Railroad Retirement disability cash benefits for at least 24 months and most persons with end-stage renal disease. The Program was expanded again in 2001 and 2010 to other small groups of individuals. Although Medicare has an established Trust Fund that initially was to be funded primarily from revenues collected from payroll deductions, currently at 2.9% of earnings, this is no longer the case. According to the 2013 Annual Report of the Boards of Trustees of the Federal Hospital Insurance and Federal Supplementary Medical Insurance Trust Fund, total expenses for Calendar Year 2012 were $574.2 billion, but revenue from payroll deductions equaled only $205.7 billion. The Trust Fund received $214.4 billion from general revenue of the federal government, $8.4 million from transfers from the states, and it still ran a $37.2 billion deficit. According to the report, the Trust Fund ended the year with assets of $287.6 billion, which are mostly held as Treasury notes and bonds guaranteed by the federal government. There were 42.1 million aged persons and 8.4 million disabled persons on Medicare for the calendar year.

Section I: Introduction
Page: 3
widespread impact on the health-care industry and the many changes to the Internal Revenue Code
that create new taxes and penalties. The impact on the states is quite extensive, requiring states to
determine Medicaid eligibility by a new Modified Adjusted Gross Income (MAGI) methodology, to
make numerous system changes to their Medicaid Management Information System (MMIS) for
both claims and providers, and to adopt a new national coding system, to name a few.10
Title II, of the ACA, called the “Role of Public Programs,” is a section of the law that makes significant
changes to Medicaid. Most important for this study is the pre-Supreme Court ruling mandate that
states must expand Medicaid eligibility to include all persons at 138% of FPL or below. When the
ACA was passed into law, no state covered all persons at or below that defined income level. The
penalty for states choosing not to expand would be the loss of all federal matching funds.
To the crafters of the ACA, Medicaid was an important piece of the law. It was the chosen
mechanism to provide health insurance for all individuals at 138% of FPL or below as part of a plan
to provide health care for all Americans. The ACA introduces new standards for employer-based
insurance plans, and it mandated the creation of health care insurance exchanges, either federally
or state run. These exchanges are intended to help individuals, families, and small businesses obtain
health care insurance coverage.
The ACA has numerous financial incentives and disincentives. For example, employers with fifty or
more employees will be penalized if they do not provide health care benefits. Notwithstanding some
exceptions, individuals without health insurance as defined by the law would be subject to a tax
penalty. It provides tax incentives for persons with income between 100% and 400% of FPL to
purchase health care insurance. It provides significantly higher levels of FMAPs for states to help
cover the cost of new populations enrolling in Medicaid, and it penalizes states who do not expand
by denying them federal assistance for Medicaid.
Twenty-six states, several individuals, and the National Federation of Independent Business brought
suit in Federal District Court, challenging the constitutionality of two aspects of the law: the
individual mandate and the requirement that states must expand their Medicaid program.
On June 28, 2012, the Supreme Court issued its decision in National Federation of Independent
Business v. Sebelius (NFIB v. Sebelius).11 The issues were separately addressed. In a 5-4 decision, the
Court ruled that the individual mandate penalty was not a penalty, as defined by the law, but rather
a tax for constitutional purposes and thus was constitutional under the general taxing power of
10 The American Action Forum provides one calculation on Maine’s regulatory impact to be upwards of $119 million dollars through
October 2012 requiring the equivalent of 97 workers to deal with the new work mandated by the ACA. See Sam Batkins, “State by State Impact of ACA Regulations,” American Action Forum, October 2012, accessed at: http://americanactionforum.org/sites/default/files/ACA_regs.pdf.
11 National Federation of Independent Business v. Sebelius, 567 U.S.11-393, June 2012.

Section I: Introduction
Page: 4
Congress. In a 7-2 decision, however, the Court ruled in favor of the claimants saying that the
requirement that states expand Medicaid was unconstitutional.
In striking down the mandatory Medicaid expansion
requirement, the Court underscored the fact that the Medicaid
program was established to assist vulnerable citizens, defined as
“pregnant women, children, needy families, the blind, the
elderly, and the disabled,” in obtaining medical care. While it is
common for Congress to place limitations on federal funding,
the Court has ruled over the years that the nature of the
limitations must maintain a voluntary action on the part of the
states or else it risks violating the state-federal relationship
guaranteed by the Constitution. The following quote from the
decision summarizes the legal logic.
“Therefore, if States really have no choice other than to accept the package, the offer is
coercive, and the conditions cannot be sustained under the spending power. . . . In sum, it is
perfectly clear from the goal and structure of the ACA that the offer of the Medicaid
Expansion was one that Congress understood no State could refuse. The Medicaid
Expansion therefore exceeds Congress' spending power and cannot be implemented.”12
The effect of the court decision in NFIB v. Sebelius is that states have a choice on whether or not to
transform their Medicaid program from a program to assist mandatory and optional categories of
individuals into a program to provide health-care coverage for everyone under the federally
established income level, and Congress is prohibited from penalizing states that decline the offer.
Importance of Feasibility
The decision to expand eligibility for Medicaid involves multiple layers of complexities. MaineCare
is very complex as is the ACA and the health care industry itself, especially as configured in the
United States. In addition, MaineCare is just one part of a larger welfare assistance system,
compounding the complexity. Overlaying these complexities are a fundamental policy controversy
over what kind of health care system can best provide for society, not only in regard to providing
health care but also on its impact on the economy. The opinions on the matter vary widely, ranging
from those who prefer pure market forces to those who advocate for a command system totally run
by the government.13 The question has become highly politicized, as expected, but the politicization
12 Ibid, pp. 35 and 46.
13 To read opposing views of a free market system and a single payer government system, See D. Eric Schansberg, “Envisioning a Free Market in Health Care,” Cato Journal. Vol. 31. No.1 (2011) and “How Single-Payer Health System Reform Improves Quality.” Dr. Gordon Schiff and the Physicians for a National Health Program (PNHP) Working Group on Quality. Adapted from “A Better Quality Alternative: Single-Payer Health System Reform,” Journal of the American Medical Association, September 1994. Accessed at: www.pnhp.org/facts/quality.pdf.
Although the Supreme Court
in NFIB v Sebelius decided
that states possess a choice
to expand or not, the
expansion provision in the
ACA still fundamentally
transforms the program from
one that covers the most
vulnerable to one covering all
citizens under 138% of the
federal poverty level.

Section I: Introduction
Page: 5
can become problematic if policymakers begin to ignore facts and empirical findings in favor of
philosophical notions.
Although the ACA became politically divisive from its inception, it seems to align well with those
who have philosophical leanings toward expansive government-run systems. The purpose of this
study, however, is to provide factual, analytical, and empirically-based evidence to help the
Governor and policymakers understand the potential financial, operational, and performance
implications and challenges that will have longstanding effects on the economic future of the State
of Maine and its citizens.

Section I: Introduction
Page: 6
This Page Intentionally Left Blank

Section II: Medicaid Finance and Outcomes – National Perspective
Page: 7
Section II: Medicaid Finance and Outcomes—National Perspective
Overview
This section provides a high-level overview of the finances, outcomes, and special issues relating to
Medicaid programs from a national perspective as well as the view from the states, with a special
emphasis on the State of Maine.
Official US Government Forecast
The Office of the Actuary of the U.S. Department of Health and Human Services annually publishes
an actuarial report on Medicaid that provides a forecast on both enrollment and Medicaid costs.
While there are competing forecasts available, and perhaps some may ultimately prove to be more
accurate, the official forecast is nonetheless appropriate to use for the purpose of obtaining a
picture of how enrollment and costs will track and trend in the future. Clearly, the predictions may
not all turn out to be completely accurate, but forecasting is not an exact science and it would be
difficult to know which other forecasts may be more reliable.14
An important challenge faced by the USDHHS actuaries in producing this report15 was determining
the number of states that would decide to expand eligibility pursuant to the ACA. They resolved the
issue by assuming “55% of potentially newly eligible enrollees reside in States that would expand
Medicaid eligibility in 2014 and that 65% reside in States that would expand eligibility in 2015 and
later years.” Thus, three scenarios were created: (1) no states expand pursuant to the ACA (labeled
as the “no expansion” scenario), (2) some states comprising ultimately 65% of the eligible population
expand (labeled the “baseline” scenario), and (3) all states expand (labeled the “full expansion”
scenario).
As shown on the chart in Figure 1,16 the Office of the Actuary forecasts that the Medicaid enrollment
will expand from 55.7 million in Federal Fiscal Year (FFY) 2011 to 77.9 million in FFY 2021 under the
baseline scenario, which is a 39.8% increase. Under full expansion, total enrollment would increase
to an estimated 84.8 million in FFY 2021, for a 52.2% increase.
14 Forecasting allows states to adjust future expectations based on past and or recent performance.
15 Office of the Actuary, Centers for Medicare & Medicaid Services, United States Department of Health & Human Services, 2012 Actuarial Report on the Financial Outlook for Medicaid, by Christopher J. Truffer, F.S.A., John D. Klemm, Ph.D., A.S.A., M.A.A.A. Christian J. Wolfe, A.S.A., Kathryn E. Rennie and Jessica F. Shuff. 2012. Accessed at: http://medicaid.gov/Medicaid-CHIP-Program-Information/By-Topics/Financing-and-Reimbursement/Downloads/medicaid-actuarial-report-2012.pdf
16 Ibid, p. 40.

Section II: Medicaid Finance and Outcomes – National Perspective
Page: 8
According to the actuarial report, the total program cost of Medicaid is projected to increase by 86%
from $427.4 billion in FFY 2011 to $796 billion in FFY 2021 under the baseline scenario. However, it
would grow to $830.9 billion in FFY 2021, under the full expansion scenario, which is nearly double—
an increase of 94.4%. The forecasted growth of the three scenarios are illustrated in the chart in
Figure 2.17
As is obvious from studying the previous two charts, the expansion
population cannot explain the entire increase in the expenditure
growth. The actuaries identified what they called the most important
three causal factors: expansion of the eligible population, inflationary
pressures within the health-care industry, and utilization. To quote
from the report: “During 2012 through 2021, Medicaid expenditure
growth is projected to be 6.4% per year on average, 1.1 percentage
points higher than it would be if the Affordable Care Act impacts were
excluded (5.3% average growth).”18
17 Ibid, p. 39.
18 Ibid, p. 42.
Figure 1: Projected Medicaid Enrollment – Millions of Persons
According to the 2012
USDHHS Actuarial Report
the total program cost of
Medicaid, if all states
expand, is projected to
nearly double from
$427.4 billion in FFY 2011
to $830.9 billion in FFY
2021, an increase of
94.4%.

Section II: Medicaid Finance and Outcomes – National Perspective
Page: 9
While the projected growth may be startling to some, USDHHS actually lowered its forecast
significantly from its 2011 report for the following reasons in order of importance: (1) states’
extensive efforts to lower costs and reduce payments in 2012 were
greater than anticipated, and these reductions were incorporated
into the forecast; (2) The actuarial report reduced its estimates on
the number of states that would expand pursuant to the ACA; and
(3) USDHHS is expecting slower overall healthcare expenditure
growth.19
The report further compares Medicaid growth to the Gross Domestic
Product (GDP), which is produced by the U.S. Bureau of Economic
Analysis and measures the total market values of all final goods and services produced within U.S.
borders. Medicaid, both in federal and state resources, has been requiring steadily more economic
resources over the years: in 1970, it represented 0.5% of GDP; in 1980, 0.9%; in 1990, 1.2%; in 2000,
2.1%, and in 2011, 2.8%. The actuaries noted that even if only those states comprising 65% of the
19 Ibid, pp. 44-45.
Figure 2: Projected Medicaid Expenditures – in Billions of Dollars
By 2020, Medicaid will
reach 3.2% of GDP with
only a partial expansion
by the states
representing 65% of the
Medicaid population.

Section II: Medicaid Finance and Outcomes – National Perspective
Page: 10
Medicaid population decide to expand that Medicaid will grow faster than GDP, and they predicted
that by 2020 it would comprise 3.2% of GDP, up from 2.8% in 2011. The report also noted that while
Medicaid expenditures have declined somewhat from earlier projections, they are still projected to
increase at an average annual rate of 6.4% per year through 2021. GDP, however, is anticipated to
grow annually by only 5%. Even this assumption may be optimistic because GDP has not grown
annually by 5% since prior to the 2007 recession. The chart shown in Figure 3 illustrates how
Medicaid expenditures have been outpacing GDP.20
20 Ibid, p. 50. For 2013, health care spending growth is projected to remain under 4% because of the sluggish economic recovery,
continued increases in cost-sharing requirements for the privately insured, and slower growth for Medicare and Medicaid spending. Starting in 2014, however, growth in national health spending will accelerate to 6.1%, reflecting expanded insurance coverage and growth through the ACA, through either Medicaid or the marketplaces. The use of medical services and goods, especially prescription drugs and physician and clinical services, among the newly insured is expected to contribute significantly to spending increases in Medicaid (12.2%) and private health insurance (7.7%). Out-of-pocket spending is projected to decline 1.5% in 2014 due to the new coverage and lower cost sharing for those with improved coverage. C. Fleming. “US Health Spending Growth Projected to Average 5.8 Percent Annually Through 2022,” Health Affairs Blog online, September 18, 2013.
Figure 3: Medicaid Expenditures as Share of GDP
Section II: Medicaid Finance and Outcomes – National Perspective
Page: 11
Federal Budget Deficit and National Debt
Forty-eight states, including Maine, have constitutional or
statutory provisions requiring balanced budgets, and the two
without such provisions have balanced their budgets in
practice.21 The federal government, however, has no such
constitutional restriction, and in practice it has not exercised
the discipline to balance the budget on a consistent basis since
the 1920’s, with two exceptions. From FFYs 1947 through
1960, the federal government ran surpluses half the time and the aggregated surpluses nearly
equaled the aggregated deficits. The second exception is a brief period from FFY 1998 through FFY
2001 when the federal government ran surpluses.
Although there is disagreement among economists on the effectiveness of deficit spending to
stimulate the economy during recessionary times, economists do seem to agree on a number of
other principles relating to deficits and debt. Economists, in general, are not against federal deficits
or the national government assuming debt, provided (1) those deficits do not become the norm and
(2) the magnitude of the debt remains manageable. They usually describe their concerns in terms
of structural deficits, that is, when there is consistent deficit spending on an annual basis during
good economic times and bad. They are not alarmed if the federal government carries debt, but
they become concerned when that debt becomes so large relative to the economy that it begins to
restrict fiscal flexibility and causes unwelcomed economic consequences.
For example, most people can carry a debt load. They can afford to borrow money to buy a house
and a car as long as they have adequate income to make loan payments. They can spend more in a
year than they make, provided they manage their finances over their lifetime and make more money
than they spend in other years. The federal government has a greater ability to carry debt and run
deficits for at least two important reasons. First, it has no expected lifespan when all debt must be
repaid, that is, when a person dies. Second, it has a number of tools available to it to maneuver
financially that are not available to individuals, such as monetizing debt.
Governments, however, can still overextend themselves, and they certainly do. On the first point of
not allowing deficits to become the norm, it is commonly accepted that the federal government has
a structural deficit problem.
21 Forty-three states have constitutional provisions relating to a balanced budget, five states have statutes but no constitutional
provisions, and just two have neither. Of the two that have neither: Indiana may carry over annual deficits but cannot assume debt, which has the effect of forcing budgetary discipline; and Vermont, in practice, has not carried deficits from one budget year to the next. Restrictions relating to balanced budgets may be on the Governor when he introduces the budget (44 states), on the Legislature to pass a balanced budget (41 states), or on the Governor when he signs the budget (37 states). National Association of State Budget Officers, “Budget Processes in the States,” Summer 2008.
Economists, in general, are not
against federal deficits provided
(1) those deficits do not become
the norm and (2) the magnitude
of the debt remains
manageable.

Section II: Medicaid Finance and Outcomes – National Perspective
Page: 12
Over the last fifty years, the federal government ran deficits ninety percent of the time, during good
economic times and bad. In inflation adjusted dollars, the six of the ten largest federal deficits since
1940 include FFYs 2008 through 2013, and five of those years hold the top five spots. As shown on
the left half of the table in Figure 4, the largest federal budget ever was FFY 2009, which was -$1.5
trillion when adjusted for inflation in 2013 dollars.22 Economists generally believe, however, that
comparing magnitudes of inflation-adjusted deficits over time may be misleading because it does
not account for the growth of the economy. Therefore, they like to compare deficits to the Gross
Domestic Product (GDP). As shown on the right half of the table in Figure 4, recent deficits are still
enormously large. The top four years with the largest deficits were during trying times of World War
II: 1942 through 1945. The next three years, however, are 2009, 2010, and 2011.
On the second point, relating to having a national debt that is
manageable, economists like to compare total national debt to
GDP. Against this metric, the United States does not do well at
all. For the second quarter of 2013, the debt-to-GDP ratio was
100.6%. Five years ago, the debt-to-GDP ratio was only 64.8%.
This calculation uses both debt held by the public and by the
government itself, which is known as intra-governmental debt.
The latter debt consists of true obligations held by various government agencies, including the trust
funds of Social Security and Medicare.
22 Data here and in the chart come from three sources: U.S. Office of Management and Budget, Fiscal Year 2014 Historical Tables,
Budget of the U.S. Government, Table 1.3; Congressional Budget Office, Monthly Budget Review—Summary for Fiscal Year 2013, November 7, 2013; and Gross Domestic Product data from the U.S. Bureau of Economic Analysis. All values were converted to base FFY 2013 using GDP price deflators.
It is commonly accepted that the federal government has a structural deficit problem. Over the last fifty years, the federal government ran deficits ninety percent of the time.
Rank FFY
Inflation Adjusted
Billion Dollars
Base Year 2013
Rank FFYPercent of
GDP
1 2009 -1,517 1 1943 -30.3
2 2010 -1,373 2 1944 -22.7
3 2011 -1,351 3 1945 -21.5
4 2012 -1,104 4 1942 -14.2
5 2013 -680 5 2009 -10.1
6 1943 -632 6 2010 -9.0
7 1945 -625 7 2011 -8.7
8 1944 -596 8 1946 -7.2
9 2004 -509 9 2012 -7.0
10 2008 -494 10 1983 -6.0
Top 10 Largest Federal Deficits Since FFY 1940
Figure 4: Top 10 Largest Federal Deficits Ranked in Two Ways

Section II: Medicaid Finance and Outcomes – National Perspective
Page: 13
A comparison of the United States to other countries also
illustrates the point. If the United States were a member of the
European Union, it would have the sixth worst debt-to-GDP ratio
after Greece, Italy, Portugal,
Ireland, and Belgium, as
indicated in the table in
Figure 5 which compares
the second quarter of 2013,
the most recent data
available.23 Note on the list
that the countries closest to the U.S. are countries struggling with
serious economic problems.
The history of Congressional actions to solve the continual deficit
challenges, which have been mostly unsuccessful, is long and will not be covered here. However, it
is important to know about recent attempts that may have an impact on future spending on
Medicaid.
First proposed by President Bill Clinton24 as part of his 1997 budget proposal, per capita caps would
transform Medicaid’s financing mechanism by limiting each state to fixed dollar reimbursements for
each recipient as opposed to the current method of paying for a percentage share of the costs. In
essence, program spending growth would be linked to enrollment, not the overall cost of spending.
Although per capita caps have been utilized in select Medicaid demonstration projects to ensure
federal expenditures do not surpass a specified total, they have never been applied to the entire
program. While per capita caps are typically proposed to save the federal government money, states
would most likely have to make up the difference.25
Different methodologies can be utilized in determining per capita caps. One method would establish
a federal reimbursement limit per each recipient, and states would be responsible for any amount
spent over that limit. Some methods would take into account the historic per-recipient Medicaid
spending of the states, establishing limits on a state specific basis. Other methods would set up
separate caps based on specific population groups.
23 EuroStat, European Union, Luxembourg, “Euro area and EU28 government debt up to 93.4%and 86.8% of GDP,” EuroStat News
Release, 153/2013, October 23, 2013. U.S. Debt calculated using http://www.treasurydirect.gov/ website of the U.S. Department of Treasury. Accessed December 10, 2013. GDP data from U.S. Bureau of Economic Analysis.
24 When the GOP-controlled Congress passed a Medicaid block grant bill in the late 1990s, President Clinton vetoed it and in response proposed his per capita cap method as a compromise. Under the President’s proposal, the caps would be calculated for spending on specific eligibility groups, such as individuals with disabilities, non-disabled adults, children, and the elderly.
25 Edwin Park and Matt Broaddus, “Medicaid Per Capita Cap Would Shift Costs to States and Place Low-Income Beneficiaries at Risk,” Center for Budget and Policy Priorities, October 4, 2012.
Figure 5: Compare US Debt/ GDP Ratio to EU Countries
Rank Country %
1 Greece 169.1
2 Italy 133.3
3 Portugal 131.3
4 Ireland 125.7
5 Belgium 105.0
United States 100.6
6 Cyprus 98.3
7 France 93.5
8 Spain 92.3
9 United Kingdom 89.6
10 Hungary 81.6
Government Debt to GDP 2013 Q2
Comparing US to EU Countries
If the United States were a member of the European Union, it would have the sixth worst debt-to-GDP ratio after Greece, Italy, Portugal, Ireland, and Belgium.

Section II: Medicaid Finance and Outcomes – National Perspective
Page: 14
Although the implementation of per capita caps would provide states with stricter spending limits,
typical proposals have allowed increased flexibility to avoid federal rules around cost sharing and
the modification of benefits. Flexibility with federal eligibility rules however, would most likely not
be granted, thus assuring the continuation of historic caseload growth and a significant loss of
federal dollars to states.26
Congressman Bill Cassidy from Louisiana provides
a recent example of how this cost saving initiative
continues to resurface when in 2012 he proposed
to equalize Medicaid spending across all states
with a per capita cap that varied by Medicaid
category.27 His proposal called for per capita caps
that differed for eligibility groups, such as children, adults, the blind and individuals with disabilities,
and elderly individuals receiving long-term care services, based on the median cost of care.28
Payments under his proposal would be “risk adjusted for the population as well as down to the
recipient.”29 More recently, on May 1, 2013, Senator Orrin Hatch (R-Utah) and Representative Fred
Upton (R-Mich.) made public a plan for “Making Medicaid Work”. One of their blueprint’s key
proposals was to implement per capita caps.30
Historically, times of federal financial crises have been the main rationale for imposing per capita
caps. Certain policymakers, however, believe that in addition to saving money, they would improve
care. Although no per capita cap proposal has been implemented across the entire program to date,
the growing federal budget deficit—as well as a fundamental belief by certain policymakers that
caps incentivize improved outcomes—makes certain that per capita caps will continue to be offered
as a solution to the current fiscal challenges faced by the federal government.
In 2011, debate over raising the debt ceiling of the federal government led to a compromise. In
exchange for raising the ceiling, Congress created a Joint Select Committee on Deficit Reduction with
the enactment of the Budget Control Act of 2011. The Select Committee was charged with
26 Even though per capita caps normally impose a limitation on state flexibility to make significant changes to the system, it is
possible (although not probable) that Congress could amend federal law to allow modifications to enrollment and eligibility.
27 Bill Cassidy, “Cassidy Eyes Per Capita Caps For States As Part Of Medicaid Reform Proposal,” Inside Health Policy, March 6, 2012, accessed at: http://insidehealthpolicy.com/Inside-Health-General/Public-Content/cassidy-eyes-per-capita-caps-for-states-as-part-of-medicaid-reform-proposal/menu-id-869.html
28 Critics of per capita caps have argued that they do not take into consideration unanticipated health care cost growth or future demographic changes.
29 Idem. Also, Congressman Cassidy claimed that under his proposal the money would follow the patient and produce better outcomes.
30 Senators Fred Upton and Orin Hatch, “Making Medicaid Work: Protect the Vulnerable, Offer Individualized Care, and Reduce Costs,” May 1, 2013, accessed at:
http://energycommerce.house.gov/sites/republicans.energycommerce.house.gov/files/analysis/20130501Medicaid.pdf
Although Medicaid was exempted in the 2011
Deficit Reduction plans, there is no guarantee
that Congress will be able to exempt Medicaid
from budget cuts in the future.

Section II: Medicaid Finance and Outcomes – National Perspective
Page: 15
developing and proposing a bipartisan budget to reduce the budget by $1.5 trillion over ten years.
If the Select Committee failed by January 15, 2012, to have legislation enacted that would achieve
a $1.2 trillion deficit reduction, the Act triggered automatic reductions in defense and other
discretionary spending spread evenly over FFYs 2013 through 2021, also known as “sequestration.”
The Act exempted Medicaid from the automatic spending cuts. The Select Committee failed,
triggering the automatic spending cuts.31 With the help of sequestration, the current federal deficit
in FFY 2013 was reduced to $680 billion, which was the first time it fell below $1 trillion since FFY
2008. However, FFY 2013 is still the fifth largest budget deficit in inflation-adjusted dollars since
1940, and the 18th in terms of a percent of GDP.
Although Medicaid was exempted in the 2011 Act, there is no guarantee that Congress will be able
to continue exempting Medicaid from budget cuts in the future. Medicaid competes against other
priorities also considered to be very important, including Medicare, federal pensions, veteran
benefits, food assistance, and housing. Additionally, the continued cost escalation brings even
greater attention to Medicaid.
Figure 632 for example, lists Medicaid as having the highest percentage increase in expenditure
growth of all major budgetary categories for both FFYs 2012 and 2013. Considering that the national
31 The American Taxpayer Relief Act of 2012, which was passed on January 1, 2013, delayed sequestration from January 2, 2013,
until March 1, 2013.
32 Congressional Budget Office (CBO), Monthly Budget Review, November 7, 2013.
Figure 6: Total Outlays from Federal Government 2011-2013

Section II: Medicaid Finance and Outcomes – National Perspective
Page: 16
debt grew at 5.4% from December 2012 to December 2013 while GDP has only grown 3.3% (or 1.8%
if you adjust for inflation), the national debt continues to grow faster than GDP, placing pressure on
Congress to act on the deficit problem.
The numbers alone call attention to the Medicaid program, and the solution from the point of view
of the federal government is obvious. Federal
deficits continue to mount, adding to the national
debt at a faster rate than GDP growth, and
Medicaid is the fastest growing budget category.
Just recently, the Congressional Budget Office
suggested an option to impose a cap on federal
Medicaid spending to help bring the federal
deficit problem under control.
In November 2013, the Congressional Budget Office published the report Options for Reducing the
Deficit: 2014 to 2023, and the very first option listed under the category of health is capping
Medicaid spending.
The report points out that “CBO expects federal Medicaid to grow at a higher rate over the next
decade, an average of 8% a year.” Note that this forecast is almost two percentage points higher
than the forecast by the USDHHS’s Office of the Actuary covered earlier in this section. The quote
below is from the CBO report.
“Lawmakers could make various structural changes to Medicaid to decrease federal spending for the program. Those changes include reducing the scope of covered
services, eliminating eligibility categories, repealing the Medicaid expansion due to start in 2014, lowering the federal government’s share of total Medicaid spending,
or capping the amount that each state receives from the federal government to operate the program.”33
The report discusses in great length the pros and cons with specific recommendations on ways to
cut back on Medicaid spending. One obvious way would be to reduce FMAPs. Clearly, there is risk
that Congress may shift more costs of Medicaid to the states, and Section VI of this report will
address that risk more fully.34
Perspective from the States
Health care and its ancillary support services are the largest items in states’ budgets, and it is
33 Congressional Budget Office, Options for Reducing the Deficit: 2014 to 2023, November 2013.
34 Especially when one considers that the ACA’s Medicaid expansion funding is at 90% to 100%, it would be hard pressed for any Congress or President to increase funding. The only way to move at this point would be to reduce funding.
In November 2013, the Congressional Budget
Office Report states that Medicaid is expected
to grow at an average rate of 8% over the next
decade, nearly 2 percentage points higher
than the USDHHS’ Actuarial Report.
Section II: Medicaid Finance and Outcomes – National Perspective
Page: 17
noteworthy that one of the conclusions of the official actuarial report on Medicaid involves the
budgets of the states:
“Despite the amount of time that has passed since the end of the recession, some of its effects on Medicaid still remain. Enrollment is projected to have grown more
quickly than the U.S. population in 2012, albeit at slower rates than in recent years. The expiration of the temporary Federal matching rate increases led to substantial
increases in State Medicaid expenditures, but States’ budget revenues have not kept pace; these conflicting trends appear to have been a significant reason for the
relatively slow rate of Medicaid expenditure growth in 2012.” 35
As can be expected, Medicaid expenditures have been a
major concern of the states. The National Association of
State Budget Officers (NASBO) produces periodic
information on the fiscal situation of the states, and
Medicaid has played a central role in those publications.
The most recent State Expenditure Report, published in
November 2013, shows that once again Medicaid is the
largest component of states’ total budgets (consisting of all
funds, including federal funds), comprising on average 24.5%, i.e., almost one in every four dollars
that a state spends goes to Medicaid. The growth has been steady over time. In 1990, Medicaid
surpassed higher education as the second largest state program, and in 2003 it surpassed
elementary and secondary education (basic education) to become the largest program. For the next
several years, basic education and Medicaid traded places, but now Medicaid holds a substantial
lead over basic education: 24.5% versus 20.0%.36
Figure 7 is a chart that compares Maine’s spending that includes all funds to the national average.
Maine’s spending pattern preceded the national pattern by more than ten years. Medicaid overtook
basic education spending as a percentage of the total budget in 1992 for Maine. For State Fiscal Year
(SFY) 2012-13, Medicaid spending was 32.2% of the budget, nearly double the 16.6% for basic
education.
35 2012 Actuarial Report on the Financial Outlook for Medicaid, p. 52.
36 The growth of the Medicaid program and its crowding out of other important priorities has been a major concern for most governors, democrat and republican. As recently as 2012, Montana Governor Brian Schweitzer, a Democrat, told the Washington Post that, "unlike the federal government, Montana can't just print money. We have a budget surplus, and we're going to keep it that way." See N.C. Aizenman and Karen Tumulty, “Democrats Share Concerns over Medicaid Expansion,” Washington Post, July 13, 2012, p. A3.
According to the National
Association of State Budget Officers
(NASBO), in 2003 Medicaid
surpassed elementary and
secondary education (basic
education) to become the largest
state budgetary Program.

Section II: Medicaid Finance and Outcomes – National Perspective
Page: 18
Using estimated NASBO data showing all funds for SFY 2013, Maine
ranks low in basic education expenditures as a percentage of the
total state
budget and
very high in
Medicaid
expenditures
as a percentage
of the total state budget compared to other
states. (See Figure 8.)37
Figure 8 also shows the top five states for each of
these categories and provides the rankings for
Maine, New Hampshire, and the state average.
Vermont spends the most of any state on basic
education at 32.5%, followed by Indiana at 31.3%.
New Hampshire ranks 13th at 23.3%. The state average is 19.4%. Maine ranks 31st at 16.6%. For
Medicaid, Maine has the third highest expenditure at 32.2%, after Missouri and Pennsylvania. New
Hampshire is 15th at 25.6% and the state average is 22.8%.
37 National Association of State Budget Officers, State Expenditure Report: Examining Fiscal 2011–2013 State Spending. 2013.
Figure 7: State Ranks for Spending on Basic Education / Medicaid
State and Rank % State and Rank %1. Vermont 33 1. Missouri 36
2. Indiana 31 2. Pennsylvania 34
3. Georgia 31 3. Maine 32
4. Minnesota 27 4. Arizona 325. Texas 27 5. Indiana 32
13. New Hampshire 23 15. New Hampshire 26
State average 19 State average 23
31. Maine 17
Education
SFY 2013 Percentage of Total State Budget Medicaid
Maine ranks low in basic education expenditures as a percentage of the total state budget and very high in Medicaid expenditures as a percentage of the total state budget compared to other states.
Figure 8: Comparing Maine to the National Average for Major Expenditures

Section II: Medicaid Finance and Outcomes – National Perspective
Page: 19
The crowding out of state spending for K-12 education, both nationally and state-by-state, may help
explain why there have been only marginal gains in educational outcomes since the 1970s, when
the upward trend in high-school graduation rates of the 20th century — a pattern that had helped
to fuel worker productivity and economic growth — came to a halt. Although Maine, like other
states, has experienced an increase in high-school graduation rates since 2005, the recent uptick
represents mostly a return to the baseline of 40 years ago. At the same time, Maine has seen
significant declines in the mean SAT scores, both reading and math, of college-bound high-school
seniors, since the mid-1990s, according to data from the National Assessment of Educational
Progress.38
Public safety and corrections are two other priority areas where states are struggling to maintain
funding. Decreased budgets for police can result in less crimes being solved, if not higher crime
rates, due to reductions in manpower and other resources. Decreased budgets for corrections have
not only resulted in reduced staffing, raising safety concerns for correctional officers, but have also
forced some states to release prisoners early. For example, the U.S. Supreme Court ruled in May
2011 that California had to reduce its prison population by 32,000 over two years because its
overcrowding problem violated the Eighth Amendment to the U.S. Constitution.39 Yet putting
violent offenders back on the street poses clear dangers to the public. While Maine has experienced
a decline in rates of “index crime,” meaning the most serious and commonly reported crimes, it has
nonetheless experienced sharp jumps in rates of rape, domestic violence, and especially drug-
related crime. Moreover, offender recidivism rates are rising. According to the Maine Statistical
Analysis Center, a function of the University of Southern Maine’s Muskie School of Public Service,
arrests for drug-abuse violations have increased dramatically in the past 25 years. As a percentage
of all arrests in Maine, drug arrests have jumped from more than 4% in 1986 to nearly 11% in 2010.
Less Funds for Vulnerable Populations
Previous caseload expansions and burgeoning costs have also placed a strain on the capacity of the
Medicaid programs to serve the most vulnerable populations, as partially evidenced by waiting lists.
At a time when a number of states are moving increased numbers of healthy adults of working age
onto the Medicaid rolls, a number of state Medicaid programs possess waiting lists for current
programs serving the neediest population groups. These services, provided mainly through Section
1915(c) home and community based (HCBS) waivers,40 generally serve vulnerable populations that
38 National Center for Educational Statistics, Digest of Educational Statistics, Table 174, accessed at:
http://nces.ed.gov/programs/digest/d12/tables/dt12_174.asp.
39 Brown, Governor of California, et al. v. Plata et al.
40 The 1915(c) waivers are one of many options available to states to allow the provision of long term care services in home and community based settings under the Medicaid Program. States can offer a variety of services under an HCBS waiver program. Programs can provide a combination of standard medical services and non-medical services. Standard services include but are not limited to: case management (i.e., supports and service coordination), homemaker, home health aide, personal care, adult day health services, habilitation (both day and residential), and respite care. States can also propose “other” types of services
Section II: Medicaid Finance and Outcomes – National Perspective
Page: 20
require more intense services and supports, such as individuals with intellectual disabilities or the
elderly, to avoid institutional care.41 A 2011 Kaiser Foundation report showed the wait list for
Maine’s 1915(c) waiver programs to be almost two thousand while other New England States had a
lower number of citizens awaiting services. Some other states had no wait lists at the time of the
study.42 Pennsylvania was the closest state geographically with a wait list that exceeded Maine at
the time of the study, and there were twenty-two states in the report with wait list populations less
than that of Maine.43 By electing to change the purpose of Medicaid from a program to serve
vulnerable populations to one that serves everyone below a fixed income level, “expanding” states
seem to be giving little consideration of how to handle the populations that have had to endure
waiting lists. These populations represent, in most cases, individuals who cannot be easily served
through commercial health plans, unlike the expanded population.
Inadequate Payment to Providers
In addition to the issue of wait lists, many states are concerned about their ability to maintain
existing service levels or to provide for those entering the Medicaid program. Maine like all states,
struggles to pay physicians adequately. For every dollar that private insurers pay a physician,
MaineCare pays 42 cents on the dollar, the second lowest in New England. (See Figure 9.)44
In an attempt to address some of these issues, the ACA required
certain changes to provider rate structures. The ACA mandated that
Medicaid reimbursement rates to physicians in family Medicaid,
general internal medicine, pediatric medicine, and subspecialties who
provide primary care services be raised to 100% of Medicare rates but
only through calendar year 2014. Other parts of the ACA provide
increased funding to safety-net providers that serve low-income
individuals and families. This occurred at a time when most states
that may assist in diverting and/or transitioning individuals from institutional settings into their homes and community. See www.Medicaid.gov.
41 Medicaid is a lifeline for most people with significant disabilities who have greater medical needs and often require assistance with activities of daily living throughout their lifetimes, such as getting dressed, taking medication, preparing meals, and managing money. Medicaid is overwhelmingly the largest funding source of both acute health care and long term services and supports since people with disabilities who are covered by Medicaid generally do not have access to employer based or other private coverage.
42 According to the Kaiser 2011 State Health Facts on Waiting Lists, due to the limited number of HCBS slots in states, there are over 500,000 people on waiting lists for services, over 300,000 of whom are disabled. The wait can be as long as 8-10 years. This crisis results in unnecessary, unwanted and costly institutional care; family members being forced to quit jobs or take on second jobs to help care for their loved one; and families having to leave their loved ones unattended or in the care of unqualified persons.
43 In SFY 2013, the LePage Administration committed $10 million in total funds to reduce the waiting list for the intellectually disabled. Even with that commitment, Maine still has 1,328 individuals waiting for services.
44 Avik Roy, “How Do Blue States Expand Medicaid? By Paying Doctors,” Forbes, accessed December 1, 2013, at: http://www.forbes.com/sites/theapothecary/2012/07/23/how-do-blue-states-expand-medicaid-by-paying-doctors-less/.
Maine struggles to pay
physicians adequately. For
every dollar that private
insurers pay a physician,
MaineCare pays 42 cents
on the dollar, the second
lowest in New England.

Section II: Medicaid Finance and Outcomes – National Perspective
Page: 21
were struggling with revenue slumps due to the recession and because of budget deficiencies were
cutting reimbursement rates, not increasing them.
Despite these increases in rates, many reports, including one from the nonpartisan economic and
social research group Urban Institute,45 noted that most states believed that the temporary rate
increase would have little effect on attracting new physicians willing to accept new Medicaid
patients but believed it would help maintain provider participation in the short term.
The same report noted that the rate increases are estimated to increase provider participation by
11%, which would not be sufficient enough to cover the current existing shortage much less the
additional caseloads as a result of mandatory increases.46 HealthPocket, Inc., released a survey that
was conducted on more than 1 million health care professions, noting only 43% were listed as
accepting Medicaid. Consequently, while 75% of Maine doctors may be willing to accept new
Medicaid patients, another 10% are expected to drop Medicaid patients in the coming months.47
The lack of a sufficient number of providers is also affected by policy and regulation. As with many
45 Ian Hill, “Will There Be Enough Providers to Meet the Need? Provider Capacity and the ACA,” The Urban Institute, November
2012. http://www.urban.org/UploadedPDF/412699-Will-There-Be-Enough-Providers-to-Meet-the-Need.pdf. See also Institute, “Hard Question on Access to Healthcare – Will we have enough Doctors?” Urban http://www.urban.org/issues/hardquestions/accesstohealthcare.cfm, accessed December 10, 2013.
46 HealthPocket, “With Expansion Looming, Less than Half of Physicians Accept Medicaid,” http://www.healthpocket.com/healthcare-research/infostat/less-than-half-of-physicians-accept-medicaid, accessed December 10, 2013.
47 Health Affairs, August 2012, vol. 31, no. 8, pp. 1673-1679.
Figure 9: Cents on the Dollar Medicaid Pays Relative to Private Insurers by State

Section II: Medicaid Finance and Outcomes – National Perspective
Page: 22
large government agencies, Medicaid’s continuously growing bureaucratic and regulatory structure
has typically become difficult to manage and is outmoded.48 States that want to define goals
differently from federal standards or try innovative approaches are required to seek federal
approval in the form of waivers. The subsequent result for many states has become a cumbersome
set of rules and different services (and service definitions) that do not comport or transition across
the many operating waivers. They can also be difficult to navigate, manage, and monitor, and most
of the time have very little to do with improved overall health outcomes. Unfortunately, because
the administration and operation of Medicaid has become
so overly burdensome and complex, the very people who
the system is supposed to serve can become harmed in the
process by receiving inadequate or poor quality care.
Additional evidence of the cumbersome structure is
demonstrated by the years some states wait to obtain
waivers and the inability of the current federal
administration to implement several major policy
measures of the ACA in January 2013, like issuing guidance
on how states were to implement a new coverage option called the “basic health program” aimed
at helping low and middle income families who did not qualify for Medicaid gain coverage.
More Appropriate Care Setting Needed: Institutional Bias of Home and Community
Based Services (HCBS)
Federal Medicaid regulations still favor costly institutional care for individuals with disabilities and
the elderly when less expensive community and home-based
options would serve these individuals more appropriately.
Currently, close to 60% of Medicaid’s long term care funding
goes to institutional care.49 This federal bias towards
institutional care is due to the fact that nursing home services
are mandatory for states, while HCBS are optional. States
currently have two main options to fund HCBS through
Medicaid – the HCBS waiver (Section 1915(c)) or the HCBS
state plan option (Section 1915(i)). The 1915(c) waiver is only
available to individuals who qualify for an institutional level of
care. Under this waiver, states can cap the number of eligible people, maintain waiting lists, and
48 President Obama recently stated in an MSNBC interview with Chris Matthews that “we have these big agencies, some of which
are outdated, some of which are not designed properly,” accessed at: http://dyn.politico.com/printstory.cfm?uuid=048D0521-3FDE-4793-9939-7BEBAACB1C67.
49 Strides have been made over the past 15 years to change the institutional bias in Medicaid, however, the labyrinth of burdensome federal rules and regulations and the tedious waiver and state plan amendment process have made the undertaking of balancing the system and implementing appropriate care settings inconvenient and administratively burdensome for states.
As with many large government
agencies, Medicaid’s continuously
growing bureaucratic and
regulatory structure has typically
become cumbersome and archaic
with a myriad of disparate rules and
regulations across populations.
Federal regulations favor costly
institutional care when less
expensive community and home-
based options would serve
recipients more appropriately.
Close to 60% of Medicaid’s long
term care funding goes to
institutional care.

Section II: Medicaid Finance and Outcomes – National Perspective
Page: 23
limit services to certain geographic areas. Additionally,
states must apply for renewal of the waiver from Medicaid,
which is a burdensome and lengthy process. The 1915(i)
state plan option, on the other hand, allows states to have
eligibility that is below the institutional level of care before
people need nursing home care.50
Maine offers a number of different Medicaid services for
HCBS. In addition to mandatory and optional Medicaid State Plan services, there are currently five
approved home and community based waivers that serve elders, adults with physical and
intellectual disabilities, and children, including one recently received approved specific to adults
who have experienced Cerebral Palsy, Seizure Disorders, or other conditions during their first 21
years of life causing significant disabilities (referred to as “Other Related Conditions”). The Maine
Department of Health and Human Services (MDHHS) is also currently designing and submitting a
waiver to serve individuals with acquired brain injury in future years.51 Further, MDHHS together
with legislative support is in the midst of attempting to remediate and simplify the complex
operational long term care system that has been institutionalized in the department over the past
30 years or more. Although the MDHHS has begun to fix the system and with it properly allocate
funds across populations to begin addressing the impending aging of the population and the
complexities that go along with it, major structural reforms are still necessary to the current
enterprise to create fiscal stability and sustainability so that the current and future needs of people
with chronic and co-occurring long term support and service needs are met with quality and dignity.
Having recently received a grant called the Balancing Incentives Program Grant (BIP), Maine
undertook a major initiative that includes the following:
Working with community partners and stakeholders in a collaborative fashion to achieve the
goals of increasing home and community based supports,
Building upon the supports that Maine currently has in place to create a “No Wrong
Door/Single Entry Point” system,
Developing statewide core standardized assessments, and
Creating a conflict-free case management system.
50 The Affordable Care Act does provide a new state plan option to provide home and community-based services in Medicaid
Section, 1915(k). Also, as of April 2010, the 1915(i) state plan option no longer allows states to cap the number of eligible people, keep waiting lists, and limit services to certain geographic areas. They may target services to certain population groups.
51 See MDHHS’s Balancing Incentive Payment Program Application, May 2013, accessed at: http://www.medicaid.gov/Medicaid-CHIP-Program-Information/By-Topics/Long-Term-Services-and-Support/Balancing/Downloads/Maine-BIP.pdf.
MDHHS together with legislative
support is in the midst of attempting
to remediate and simplify the
complex operational long term care
system that has been
institutionalized in the department
over the past 30 years or more.

Section II: Medicaid Finance and Outcomes – National Perspective
Page: 24
This grant will complement other ongoing initiatives in
Maine aimed at system reform and rebalancing long-term
services and supports (LTSS) towards community living.
Despite the inclusion of these and other incremental
changes to MaineCare over the years and the current work
of the LePage Administration to bolster home and
community based services and balance the system, the
federal bias toward institutional care remains. Because
MDHHS’ operational resources are severely limited, it would seem proper that MaineCare continue
to focus on creating and implementing structural reforms, which are designed to offer more
appropriate care settings for elderly and vulnerable populations and which will improve the quality
of care for all recipients through current and future federal partnerships like BIP, without having the
additional burden of taking on new populations via the ACA at the current time.
Poor Health Outcomes
More disturbing and perhaps related to problems regarding access to doctors, Medicaid coverage
does not correlate with better health outcomes. Studies show that compared to Medicare patients,
privately insured patients, and surprisingly even uninsured individuals, Medicaid recipients have
poorer health outcomes. For example, a study conducted at the University of Virginia, and published
in the Annals of Surgery, found that Medicaid patients fared rather poorly, relative to those with
private insurance and even those without insurance, on a wide range of measures related to surgery
outcomes. Titled, “Primary Payer Status Affects Mortality for Major Surgical Operations,52” the study
had a very large sample size (893,658 major surgical operations occurring between 2003 and 2007)
and controlled for age, sex, income, geographic region, operation, and 30 comorbid conditions. Yet
it established that Medicaid patients experienced the least-desirable outcomes in terms of in-
hospital mortality, length of stay, and total costs. Likewise, a study published in the journal Cancer
found that the mortality rate for Medicaid patients undergoing surgery for colon cancer was more
than three times as high as for those with private insurance and more than one-fourth higher than
for those with no insurance.53 A study of patients undergoing lung transplants, in the Journal of
Heart and Lung Transplantation, found that Medicaid patients were 8.1% less likely to survive ten
years after the surgery than their privately insured and uninsured counterparts.54
52 Damien J. LaPar, M.D., and Castigliano M. Bhamidipati, D.O., Carlos M. Mery, M.D., M.P.H., George J. Stukenborg, Ph.D., David R.
Jones, M.D., Bruce D. Schirmer, M.D., Irving L. Kron, M.D., and Gorav Ailawadi, M.D., “Primary Payer Status Affects Mortality for Major Surgical Operations,” Annals of Surgery, September 2010; 252(3): pp. 544–551.
53 Siran M. Koroukian Ph.D., and Pual M. Bakaki M.D., M.S., Derek Raghavan M.D., Ph.D., “Survival Disparities by Medicaid Status,” Cancer, Published online December 2011, Volume 118, Issue 17, pp. 4271-3279.
54 Jeremiah G. Allen, M.D., and George J. Arnaoutakis, M.D., Jonathan B. Orens, M.D., John McDyer, M.D., John V. Conte, M.D., Ashish S. Shah, M.D., Christian A. Merlo, M.D., M.P.H., “Insurance Status is an independent predictor of long-term survival after
A study conducted at the University
of Virginia, and published in the
Annals of Surgery, found that
Medicaid patients fared poorly,
relative to those with private
insurance and even those without
insurance, on a wide range of
measures.
Section II: Medicaid Finance and Outcomes – National Perspective
Page: 25
Considering the poor results from scientific studies on health outcomes for Medicaid, the question
for policymakers is whether Medicaid ought to be the program of choice to expand health insurance
coverage.
lung transplantation in the United States,” The Journal of Heart and Lung Transplantation. Volume 30, Issue 1, pp. 45 – 53, January 2011.

Section II: Medicaid Finance and Outcomes – National Perspective
Page: 26
This Page Intentionally Left Blank
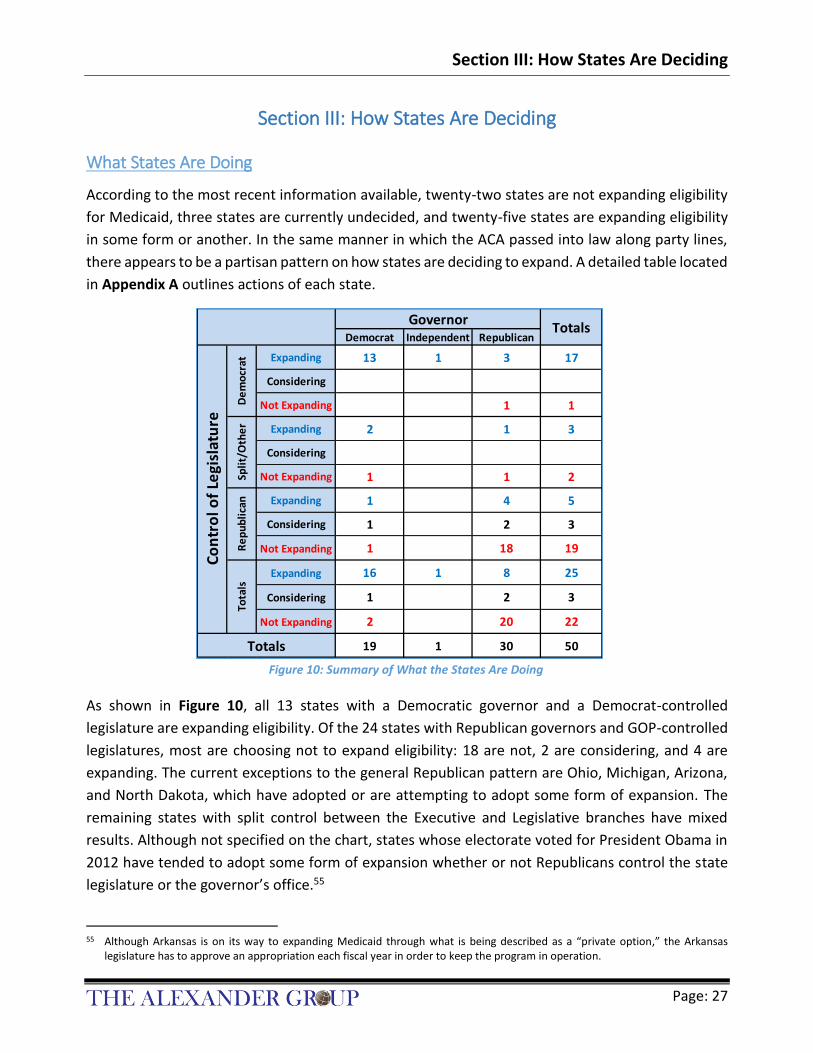
Section III: How States Are Deciding
Page: 27
Section III: How States Are Deciding
What States Are Doing
According to the most recent information available, twenty-two states are not expanding eligibility
for Medicaid, three states are currently undecided, and twenty-five states are expanding eligibility
in some form or another. In the same manner in which the ACA passed into law along party lines,
there appears to be a partisan pattern on how states are deciding to expand. A detailed table located
in Appendix A outlines actions of each state.
As shown in Figure 10, all 13 states with a Democratic governor and a Democrat-controlled
legislature are expanding eligibility. Of the 24 states with Republican governors and GOP-controlled
legislatures, most are choosing not to expand eligibility: 18 are not, 2 are considering, and 4 are
expanding. The current exceptions to the general Republican pattern are Ohio, Michigan, Arizona,
and North Dakota, which have adopted or are attempting to adopt some form of expansion. The
remaining states with split control between the Executive and Legislative branches have mixed
results. Although not specified on the chart, states whose electorate voted for President Obama in
2012 have tended to adopt some form of expansion whether or not Republicans control the state
legislature or the governor’s office.55
55 Although Arkansas is on its way to expanding Medicaid through what is being described as a “private option,” the Arkansas
legislature has to approve an appropriation each fiscal year in order to keep the program in operation.
Democrat Independent Republican
Expanding 13 1 3 17
Considering
Not Expanding 1 1
Expanding 2 1 3
Considering
Not Expanding 1 1 2
Expanding 1 4 5
Considering 1 2 3
Not Expanding 1 18 19
Expanding 16 1 8 25
Considering 1 2 3
Not Expanding 2 20 22
19 1 30 50
Spli
t/O
the
rR
ep
ub
lica
n
Co
ntr
ol o
f Le
gisl
atu
re
Tota
ls
Totals
GovernorTotals
De
mo
crat
Figure 10: Summary of What the States Are Doing

Section III: How States Are Deciding
Page: 28
Eligibility Determination Challenges
From an operational perspective, states that are relying on a federally administered health care
exchange, which includes Maine, are experiencing serious challenges with determining eligibility.
The USA Today recently reported that the:
“federal health care exchange is incorrectly determining that some people are eligible for Medicaid when they clearly are not, leaving them with little chance to
get the subsidized insurance they are entitled to as the Dec. 23 deadline for enrollment approaches. When consumers applying for insurance put their income information into subsidy calculators on HealthCare.gov — the exchange handling insurance sales for 36 states — it tells them how much financial assistance they
qualify for or that they are eligible for Medicaid. If it's the latter, consumers aren't able to obtain subsidies toward the insurance, although they could buy full-priced
plans.” 56
The article also reported that people making as much as $80,000 a year are being told that they
qualify for Medicaid on the federal site www.HealthCare.gov.57
According to the ACA, regardless of state decisions to expand Medicaid, all states must implement
new streamlined eligibility enrollment processes.58 These processes are designed to align eligibility
determinations for Medicaid, CHIP, and premium tax credits in the marketplace. These new systems
will use data sharing, drawing from various state and Federal data records, to populate and verify
information on Medicaid applications and re-certifications.
If executed properly, this will provide states with the ability
to make real-time eligibility and enrollment determinations,
and mitigate the need for applicants to provide in-person
paperwork to verify information provided to the state on
their applications. The challenge for many states is that they
do not possess a sophisticated enough system able to
handle the type of volume. Maine is included among those states.59
56 Jayne O’Donnell. “Federal exchange sends unqualified people to Medicaid,” USA Today, December 9, 2013.
57 Idem.
58 Although the federal government is providing time-limited 90% federal funding to support system development, state costs can still be significant depending upon the amount of upgrading necessary. The effectiveness of the new system will depend upon states’ ability to implement it successfully. Implementation will demand the following: significant changes to policy; comprehensive enhancements, if not full replacements, of state information technology systems; the making of new application and enrollment materials; the establishment of new outreach methods; the potential reorganization of state eligibility employees; and unprecedented coordination between organizations and entities.
59 Eligibility systems and staff are already enormously burdened. For example Illinois, a state with a sizeable Medicaid program, is just one state that is experiencing problems trying to remove ineligibles from their welfare system rolls. In fact, the early findings of an ongoing review of the Illinois Medicaid program revealed that half the people enrolled were not even eligible. A review of the Illinois Medicaid program confirms massive waste and fraud. A review was ordered more than a year ago-- because of concerns about waste and abuse. So far, the state says reviewers have examined roughly 712,000 people enrolled in Medicaid,
“.. the federal health care
exchange is incorrectly determining
that some people are eligible for
Medicaid when they clearly are
not.” USA TODAY.

Section III: How States Are Deciding
Page: 29
Medicaid Realizes Largest Increases with the ACA
States are reporting higher enrollment in Medicaid than in private insurance since the Affordable
Care Act exchanges opened October 1, 2013. A new report released by the Centers for Medicare
and Medicaid Services on December 3, 2013 reveals that close to 1.5 million people were
determined eligible in the month of October to enroll in Medicaid or the Children's Health Insurance
Program (CHIP).
As one example, in the state of Washington, in the first two months of enrollment, the state's health-
care exchange—Healthplanfinder—enrolled 176,468 Washingtonians in coverage. Over 91,000 are
newly eligible for expanded Medicaid. More than 65,900 were currently eligible but were not
enrolled, which left only 18,000 plus residents who purchased private policies.60
The number of applications for Medicaid has increased under the
Affordable Care Act, with growth more substantial in states that
have decided to expand Medicaid. In states that are not expanding
Medicaid, applications to Medicaid and CHIP increased 4.1% in
October over the previous few months, and the total number of
individuals determined to be eligible for Medicaid or CHIP was
697,019. In expansion states, applications jumped 15.5%, and
757,991 new eligibility determinations were made. The total
across all states was an 8.6% increase in applications and
1,460,367 new eligibility determinations.61
This data indicates that even without expansion, Maine will see a substantial increase of newly
eligible individuals from persons currently eligible for MaineCare.62
and found that 357,000, or about half of them shouldn't have received benefits. After further review, the state decided that the percentage of people who didn't qualify was actually about one out of four. "It says that we've had a system that is dysfunctional. Once people got on the rolls, there wasn't the will or the means to get them off,” said (state) Senator Bill Haines of Alton. A state spokesman insists that the percentage of unqualified recipients will continue to drop dramatically as the review continues because the beginning of the process focused on the people that were most likely to be unqualified for those benefits. Ted Dabrowski, Vice-President of The Illinois Policy Institute think tank, spoke with News 4 via SKYPE. He said the Medicaid review found two out of three recipients either got the wrong benefits, or didn't deserve any at all. “We added so many people to Medicaid rolls so quickly, we've lost control of who belongs there,” said Dabrowski. But regardless of how it ends, critics say it is proof that Illinois has done a poor job of protecting tax payers’ money, adapted from Channel 4 KMOV.com, St. Louis, accessed at: http://www.kmov.com/news/just-posted/Audit-reveals-half-of-people-enrolled-in-IL-Medicaid-program-not-eligible-230586321.html.
60 Washington Signing Up More People for Medicaid than Private Plans. Catholic Online. December 6, 2013.
61 Centers for Medicare and Medicaid Services. Medicaid and CHIP: October Monthly Applications and Eligibility Determinations. December 3, 2013.
62 Ibid, Table 1, October Applications and Eligibility Determinations.
States are reporting higher
enrollment in Medicaid than
in private insurance since the
Affordable Care Act
exchanges opened October 1,
2013. The growth is more
substantial in states that
have decided to expand
Medicaid.

Section III: How States Are Deciding
Page: 30
Selected State Highlights of Recent Activity63
Expansion states are already seeing a large number of individuals enrolled in Medicaid. Many of
these individuals are prequalified for expanded Medicaid because they are already enrolled in other
entitlement programs such as food stamps.64 For example, in Oregon, 70,000 residents have
enrolled as a result of aggressive outreach campaigns to those who receive food stamps in the state.
Other states have followed similar advertisement campaigns with varied success.
Arizona: The number of new applications is not available at this time. In total, Arizona expects
57,000 people to qualify for its expanded Medicaid program. In addition, the state expects 240,000
more individuals to enroll in its existing Medicaid program for childless adults with incomes at or
below the federal poverty level. Enrollment in that program was frozen in 2012 at 70,000.
Arkansas: Arkansas elected to expand its Medicaid program from 17% of FPL to 138% of FPL.65
Arkansas has received 70,595 applications for its expanded Medicaid program. Of those, 3,672 came
through the state's existing Medicaid website, 1,785 were paper or phone applications, and the rest
were positive responses to a mailing to 132,000 households that receive food stamps. Ultimately,
the state expects about 250,000 uninsured residents to qualify for Medicaid.66
California: Newly eligible enrollment in expanded Medicaid is expected to total about 1.4 million.
Of that number, 600,000 people will come from the state's early expansion program approved by
the federal government in 2011.
Colorado: Colorado has qualified more than 25,000 adults for its expanded Medicaid program. Of
that number, approximately 9,000 were on a waiting list for an existing Medicaid program that
covers adults with extremely low incomes. Another 10,000 people enrolled in that program will also
be transferred to expanded Medicaid coverage in January. Combined, that comes to 35,000
individuals, more than 20% of the 160,000 uninsured residents Colorado expects to be eligible for
its expanded Medicaid program.
63 Most information modified from Pewstates.org information on the states.
64 Expediting the eligibility process does not necessarily translate into program integrity.
65 States like Maine, Massachusetts, and Vermont already possessed expanded populations prior the ACA whereas states like Arkansas did not.
66 Arkansas is one of the first states to use a new tool for facilitating expedited Medicaid enrollment. The state is using information it already had on hand – such as Supplemental Nutritional Assistance Program (SNAP) income data– to conduct an expedited (express) “administrative transfers” to Medicaid. To implement the strategy, Arkansas sent letters to SNAP participants letting them know they are potentially eligible for Medicaid and inviting them to enroll by responding to the letter. To enroll, the person returns a simple form and the state conducts additional data checks, as appropriate. Since the state began sending letters in early September, Arkansas reports that 63,465 individuals have been “fast tracked” into Medicaid with little wait. During the same period of time, the state also found 3,000 unenrolled children who are eligible for ARKids First, the state’s Medicaid and CHIP programs. Centers for Medicare and Medicaid Services, Medicaid and CHIP: October Monthly Applications and Eligibility Determinations, December 3, 2013, p. 3.

Section III: How States Are Deciding
Page: 31
Connecticut: Connecticut has enrolled 3,550 new people in its expanded Medicaid program through
its state-run exchange and Medicaid website. In addition, at least 48,000 enrolled in a state-run low
income-health program have already been moved into expanded Medicaid. Connecticut expects a
total of 55,000 expanded Medicaid enrollees in 2014.
Delaware: No new enrollment data is available yet. Delaware already provides Medicaid coverage
for 30,000 adults with incomes up to the federal poverty level ($11,490). Its expanded Medicaid
program is expected to cover another 30,000 people with incomes between $11,490 and 138% of
the federal poverty level ($15,856).
District of Columbia: D.C. began expanding its Medicaid program in June 2010. By June 2013, nearly
50,000 new people were enrolled. The District has not estimated how many people will ultimately
enroll in expanded Medicaid.
Hawaii: Hawaii has approved 6,100 applications for expanded Medicaid. By 2014, the state expects
a total of 54,000 enrollees.
Illinois: The Illinois Medicaid agency has received 30,124 applications for expanded Medicaid
through its existing website. Illinois has an exchange partnership with the federal government so
applications are also being filed on the federally-run exchange. In addition to online applications,
46,000 people responded to an August mailing to 123,000 food stamp recipients. Illinois has enrolled
26,000 of those respondents and is processing the balance. In addition, 100,000 people in Cook
County who participated in a limited early Medicaid expansion enrollment group will automatically
be rolled over to the expansion program on January 1, 2014. Projected enrollment is 342,000.
Iowa: No new numbers are available on Medicaid applications. In all, 150,000 uninsured Iowans are
expected to qualify under the proposed expansion. About 63,000 residents with incomes up to 200%
of the federal poverty level ($22,980) are currently enrolled in a Medicaid health plan with limited
benefits. Most are expected to qualify for expanded Medicaid. Iowa has not yet received federal
approval for its Medicaid expansion plan, which is similar to Arkansas' so-called private option.
Iowa’s Medicaid expansion was recently granted partial approval on December 10, 2013.
Kentucky: Kentucky has received 25,654 applications for expanded Medicaid through its state-run
exchange. Ultimately, the state expects 308,000 low-income individuals to qualify.
Maryland: The number of applications from its state-run website is not yet available. However,
Maryland has an existing, limited-benefit health plan known as Primary Adult Care (PAC) available
to all adults with incomes up to 123% of the federal poverty level ($14,133). As of September 30,
enrollment in the plan was 82,423. Maryland expects enrollment in PAC to expand to 88,000 by
January 1, 2014, when the entire PAC population will automatically convert to full Medicaid benefits.
In addition, residents in a narrow income band (124% to 138% of poverty) can sign up for expanded

Section III: How States Are Deciding
Page: 32
Medicaid on the state exchange. Overall, Maryland expects 110,000 people to be enrolled by the
end of 2014.
Massachusetts: No enrollment numbers are available at this time. As a result of its own health care
reforms launched in 2006, Massachusetts has a 97% insured rate. Still, the state expects about
45,000 people to obtain Medicaid coverage as a result of the expansion.
Michigan: No enrollment numbers are available. The Michigan legislature approved Republican
Governor Rick Snyder's proposed Medicaid expansion in September but postponed implementation
until April 2014.
Minnesota: The federal government granted Minnesota special permission to enroll 84,000
individuals in the expanded Medicaid program in 2011. Another 2,496 newly eligible Medicaid
members completed applications on the state-run exchange in the first two weeks of October.
Ultimately, Minnesota expects to cover 265,000 adults in its expansion. In addition, it is the only
state that has opted to provide a so-called "Basic Health Plan" for people with incomes up to 200%
of the federal poverty line ($22,980). Under the ACA, the federal government will pay 85% of the
costs starting in 2015. That program is expected to grow to 160,000.
New Hampshire: The Governor called a special session to consider Medicaid Expansion and on
November 21, 2013, Special House Bill 1 to expand Medicaid, approved by the House early in the
day, was rejected by the Senate. However, spokespersons for both parties have stated that
negotiations would continue in the 2014 general session. They expressed interest in considering bills
that include provisions to use federal Medicaid funds to buy private insurance for most of the newly-
eligible adults as well as a new state-managed care program for other adults.
New Mexico: New Mexico has approved 2,507 applications for expanded Medicaid through the
federally operated exchange and its existing Medicaid website. In addition, 100,000 enrollees in two
limited-benefit state health care programs will be rolled into the expanded Medicaid. New Mexico
expects 130,000 people will be in the expanded program by 2015.
New York: No enrollment numbers are available yet. New York already covers parents with incomes
up to 150% of the federal poverty line ($17,235) and childless adults with incomes up to the federal
poverty level ($11,490).
North Dakota: The Medicaid agency has received 147 applications for expanded Medicaid. In
December, the state plans to send letters to 36,000 households that receive food stamps or home
heating assistance, inviting eligible adults to sign up for expanded Medicaid. Total enrollment in
expanded Medicaid is expected to reach 32,000.

Section III: How States Are Deciding
Page: 33
Ohio: The most recent state to expand Medicaid, Ohio expects to sign up 275,000 newly eligible
Medicaid enrollees. Republican Governor John Kasich sidestepped the state legislature and won
approval for expansion on October 21, 2013, from an executive branch Controlling Board. The state
has not yet begun enrollment. The Medicaid agency says it will announce soon when enrollment will
begin.
Oregon: Oregon has approved 70,000 applications for expanded Medicaid. Its state-run website had
some initial technical difficulties, but new applications were filed over the phone, in person, and
through the mail. The vast majority of enrollments came from a mailing in late September that went
to 260,000 residents who either receive food stamps or have children enrolled in Medicaid. The
state expects roughly 223,000 adults to be enrolled in its expanded Medicaid program by 2015.
Pennsylvania: As of the writing of this document, Pennsylvania’s plan had not formally been
crafted. Pennsylvania is planning to submit an 1115 waiver and model its reforms after the Arkansas
plan by; increasing access to private market coverage through the Healthy Pennsylvania Private
Coverage Options for Pennsylvanians 21 years of age or older but under 65 years of age with
incomes up to 138% of the Federal Poverty Level (FPL), realigning the existing Medicaid benefit plan
designs to provide health coverage based on health care needs, and promoting healthy behaviors
and improved health outcomes through a cost sharing design and work search activities.
Rhode Island: Rhode Island has approved 3,213 new applications for its expanded Medicaid
program. Another 835 are in progress. Projected enrollment is 23,428.
Vermont: About 1,000 individuals have signed up for Medicaid on Vermont's exchange or by
submitting paper applications. In addition, 30,000 adults enrolled in two state-run low-income
health plans will be rolled into the expanded Medicaid program. By 2015, Vermont expects
enrollment to reach 160,000.
Washington: Through its state-run exchange and Medicaid sites, Washington has signed up 26,336
people. Another 30,000 people enrolled in a low-income health program will be automatically
enrolled in expanded Medicaid, bringing the total to 56,336. The state expects 270,000 people to
qualify by the end of 2014.
West Virginia: West Virginia has pre-qualified 52,056 residents for its expanded Medicaid program.
Projected new enrollment is 63,000.

Section III: How States Are Deciding
Page: 34
This Page Intentionally Left Blank

Section IV: MaineCare Overview
Page: 35
Section IV: MaineCare Overview
Demographic Impact
Demographic changes are important factors not only for determining enrollment in Medicaid
programs but also for estimating the impact on specific programs within Medicaid. This is especially
true for the demographic factors of age distribution and poverty.
Muskie School Population Projections67
In the case of Maine, it has the third most aged populations in
the country, and as of 2012, one fifth, or 17%, of Maine’s
population was age sixty five and older.68 The Muskie School of
Public Service of the University of Southern Maine projects that
persons age 65 and older will grow by an estimated 46.5%, faster
than any other segment of the population, and it would
constitute most of the state’s population growth over the next
ten years.69 Figure 11 shows how the Maine population by age
67 J. Fralich, et. al., “Older Adults and Adults with Disabilities: Population and Service Use Trends in Maine,” Chartbook, 2012 Edition,
Figure 1–2, p. 2. 2012, accessed at: http://muskie.usm.maine.edu/DA/Adults-Disabilities-Maine-Service-Use-Trends-chartbook-2012.pdf
68 Ibid, pp. 1 and 4.
69 Idem. Note that the Chartbook reported nearly 99% of the state’s population growth would be in the age category of 65 and older. Although this calculation is correct when age brackets are aggregated in this manner, it may be misleading by giving the false impression that no category below 65 is projected to have growth when in fact four of those six age categories are projected to have significant growth. The calculation works that way because the age categories of 15-24 and 45-54 are projected to have
Figure 11: Projected Changes in Maine's Age Profile from 2012 to 2022
In the case of Maine, it has
the third most aged
population in the country, and
as of 2012, one fifth, or 17%,
of Maine’s population was
age sixty five and older.

Section IV: MaineCare Overview
Page: 36
category will change through 2022.70 The demographic distribution of age is an important
determinant on Medicaid expenditures whereas older individuals tend to have more chronic
illnesses and require more services.
In regard to poverty, Maine recently has had significant growth. According to data from the Small
Area Income and Poverty Estimates (SAIPE) of the U.S. Census Bureau, there were 186,484 persons
living in poverty, and 51,386 of them were children. (See Figure 12.)
Although Maine’s overall population growth has been somewhat slow, growing only 4.2% between
the last two decennial censuses for an average annual rate of 0.41%, its poverty level has been
increasing dramatically. Children had a poverty rate of 12.9% in 2000 but a poverty rate of 19.8% in
2012. Today one in five children in Maine lives in poverty. The poverty rates are also worsening for
the adult population as can be seen in Figure 13 and Figure 14.
The growth in poverty cannot be fully explained by the last economic recession. In order to reduce
the skewing of data due to the impact of economic recessions, two dates were chosen at similar
points along the business cycle: 2000 and 2007. These dates are immediately before the peaks of
the business cycles. The SAIPE data for 2000 was collected prior to the 2001 recession that began
month after the peak of March 2001, and the SAIPE data for 2007 preceded the recession that began
negative growth, which negates the growth in the remaining four categories under age 65. Perhaps a better way to represent the growth would be to exclude the two age categories with negative growth, giving the result of approximately 70% of the growth attributed to age category of 65 and older.
70 Ibid, p. 2.
All PovertyNot
PovertyAll Poverty
Not
PovertyAll Poverty
Not
Poverty
2000 to 2007 0.22% 3.23% -0.15% -0.47% 2.37% -0.94% 0.41% 3.57% 0.06% 4.96%
2007 to 2012 0.19% 3.67% -0.33% -1.09% 3.60% -2.07% 0.52% 3.69% 0.09% 2.17%
Total Population Children 0 - 17 Adults (18 & over)Traditional
MaineCare
Maine Average Annual Population GrowthSmall Area Income and Poverty Estimates of the U.S. Census Bureau
Figure 12: Poverty is a Critical Issue for Maine
Figure 13: Maine Population and Poverty Trends for Years 2000 - 2012
Year Total Adults Children
2000 124,727 88,187 36,540
2007 155,764 112,712 43,052
2010 169,076 120,342 48,734
2012 186,484 135,098 51,386
Persons in Poverty in MaineSmall Area Income and Poverty Estimates of the U.S. Census Bureau

Section IV: MaineCare Overview
Page: 37
the month after the peak of November 2007.71 However, over that time span, SAIPE data shows the
adult population in poverty grew 3.57% annually compared to 0.06% for those adults not in poverty.
(See Figure 14.) For children in poverty, the annual growth rate was 2.37% compared to negative
value of –0.94% for those children not in poverty. These trends have serious implications for Maine’s
welfare programs and significantly impact the outcome of scenarios generated by the financial
model discussed in Section V of this report.
The growth in poverty is more than simply a fiscal concern. There are no shortages of studies that
link poverty to increases in poor health. Studies indicate that poverty levels directly correlate with
low birth weights, which can result in increased infant mortality
rates as well as developmental issues in children. A study
completed by Dr. Barbara Starfield provided evidence that poverty
levels have long-term effects. The study noted that when “one
birth is of low birth weight and the mother is poor, the likelihood
of the next infant being of low birth weight exceeds 40%.”72 The
American Physiological Association found that children living in
poverty are at greater risk of behavioral and emotional problems
71 Dates used for the start of recessions are calculated by the Business Cycle Dating Committee of the National Bureau of Economic
Research.
72 Barbara Starfield, M.D. M.P.H., “Effects of Poverty on Health Status,” Bulletin of the New York Academy of Medicine, 2012, accessed at: http://www.ncbi.nlm.nih.gov/pmc/issues/142739/a.
Figure 14: Maine Poverty as Percent of Population
Studies indicate that poverty
levels directly correlate with
low birth weights, which can
result in increased infant
mortality rates as well as
developmental issues in
children.
20
00
9.9
%
20
00
9.0
%
20
00
12
.9%
20
07
12
.2%
20
07
11
.2%
20
07
15
.7%
20
10
13
.1%
20
10
11
.7%
20
10
18
.2%
20
12
14
.4%
20
12
13
.1%
20
12
19
.8%
0%
5%
10%
15%
20%
Total Adults Children
Pe
rce
nt
in P
ove
rty
Maine Poverty Rates
2000 2007 2010 2012
One in five children lives in poverty.
SAIPE data, U.S. Census Bureau

Section IV: MaineCare Overview
Page: 38
and developing other mental health issues, such as anxiety, depression, and attention
deficit/hyperactivity disorders.73 This study clearly supports why the costs of mental health and
neurological disorders are increasing. These two areas of service are MaineCare’s top two categories
of spending. Information obtained from MDHHS reveal that Mental Health services is the top clinical
condition for 95% of MaineCare members and second only to Neurological Disorders.74
Poverty may also be linked to the overall feeling of well-being. The Centers of Disease Control and
Prevention (CDC), USDHHS, captures data and reports on health-related quality of life. The CDC has
made correlations between well-being, i.e., how healthy a person feels, relative to medical costs.
They reported that on average in 2009 Mainers felt unhealthy, either physically or mentally, about
six days a month. The CDC also found that younger adults, aged 18-24, suffered the most mental
health distress and older adults suffered the most poor physical health and activity limitation. This
number increased as the income and education levels of adults dropped. The map in Figure 15
shows mean unhealthy days for the United States in 2009. These numbers are higher in 2010.75
73 Based on information accessed through the American Psychological Association website on the Effects of Poverty, Hunger, and
Homelessness on Children and Youth. See http://www.apa.org/pi/families/poverty.aspx.
74 Idem.
75 Centers for Disease Control and Prevention, Health-Related Quality of Life (HRQOL). “Figure 2: Mean number of reported physically unhealthy days in the past 30 days by state,” accessed at: http://www.cdc.gov/hrqol/data/maps/figure2-
Figure 15: State by State Mean Unhealthy Days in Last 30 Days

Section IV: MaineCare Overview
Page: 39
MaineCare Budgetary Overview
According to data provided by MDHHS, MaineCare spending in total funds, including federal funds,
for both services and administrative costs was $2.7 billion in SFY 2012-13, accounting for a total of
79% of the total MDHHS agency budget. (See Figure 16.)
For the General Fund only, MaineCare was $788 million or 73% of the department’s General Fund
budget. (See Figure 17.)
meanphysicallyunhealthy.htm.
Figure 16: Maine DHHS Budget—All Funds
Figure 17: Maine DHHS Budget—General Fund Only

Section IV: MaineCare Overview
Page: 40
In addition to receiving funding from the General Fund and the federal government, MaineCare also receives revenue in excess of $250 million from the other special revenue sources, which includes the following:
The Medical Care Services Tax Account
The Medical Care Hospital Tax Account
The Nursing Facilities Tax Account
The Fund for a Healthy Maine
MaineCare Services continue to comprise significant proportions of state revenue sources. For SFY
2012-13, 24.2% of the General Fund was expended on MaineCare Services; 19.0% of all state funds,
including the Highway Fund and other special revenue funds, were expended on MaineCare; 59.2%
of all federal funds received by the state government were dedicated to MaineCare Services; and,
32.2% of the total of all funds spent were expended on MaineCare Services. (See Figure 18.)
In total dollars spent, MaineCare is the largest budget item. When focusing on just the General Fund,
elementary and secondary education is the largest budget item. However, when the other special
revenue funds are added to the General Fund, it adds another $255 million in state funds to support
MaineCare, bringing the MaineCare state cost within ten percent of the total elementary and
secondary education budget. When federal funds are included, MaineCare spends $1.93 for every
dollar spent on elementary and secondary education. (See Figure 19.)
24.2%
19.0%
59.2%
32.2%
0%
10%
20%
30%
40%
50%
60%
General Fund All State Funds Federal Funds Total Funds
MaineCare Services as Percent of Funding Source
Figure 18: MaineCare as Percent of Funding Source

Section IV: MaineCare Overview
Page: 41
As a percent of total budgetary funds (all state funds
and federal funds), the two largest budgetary items
comprise 35.7% (elementary and secondary education)
and 24.2% (MaineCare) of the General Fund, leaving
only 40.1% of the General Fund for all remaining
government functions that need to be funded from the
General Fund. (See Figure 20). When the Highway Fund and other special revenue funds are
included, the two largest budgetary items comprise 21.0% and 19.0%, respectively, leaving only
60.0% for all other government functions. When federal funds are added, then the two largest
budgetary items switch places, with MaineCare accounting for 32.2% of all funding and elementary
24.2% 19.0%32.2%
35.7%
21.0%
16.7%
0%
10%
20%
30%
40%
50%
60%
70%
80%
90%
100%
General Fund General Fund PlusSpecial Revenue
Funds
All Funds, includingFederal
Percent Spent of Budgetary Funds
MaineCare Elementary and Secondary Education Rest of Budget
In SFY 2012-13 if federal funds are
included, the two largest budgetary
items are MaineCare at 32.2% of all
funding and elementary and secondary
education accounting for 16.7%.
$0.0
$0.5
$1.0
$1.5
$2.0
$2.5
$3.0
MaineCare Elementary andSecondary Education
Bill
ion
s Ex
pe
nd
ed
in S
FY 2
01
2-1
3
Comparing MaineCare Services to Support for Public Schools
Federal Funds
Other State Funds
General Fund
Figure 20: Percent Spent of Budgetary Funds
Figure 19: Comparing MaineCare to Public Schools Support

Section IV: MaineCare Overview
Page: 42
and secondary education accounting for 16.7%.
Maine’s level of Medicaid expenditures are high relative to what
other states are spending, Maine spends more of its total budget
on Medicaid. (See Figure 21.)76
Over the past ten years, state
funds supporting MaineCare
services have grown more rapidly than growth in Federal
expenditures supporting MaineCare. Average annual
expenditure growth for MaineCare Services has been nearly
triple the rest of the budget. For the General Fund, MaineCare
Services grew over the past ten years at an average rate of 3.7%,
compared to only 1.3% for the rest of the General Fund budget.
(See Figure 22.)77 For all state funds, the growth rate for
MaineCare Services was 6.0% compared to 2.2% for the rest of
the state budget. For federal funds, it was only 2.6% growth for MaineCare Services, compared to
2.5% growth for the rest of the budget. In total, including all funds, the growth rate for MaineCare
services was 3.8% compared to 2.2% for the rest of the budget.
76 National Association of State Budget Officers, “State Expenditure Report: Examining Fiscal 2011–2013 State Spending,” 2013.
Also, as already presented earlier in this report, Maine has the third highest spending on Medicaid in the nation.
77 Idem.
Figure 22: Ten Year Annual Budget Growth Comparisons
3.7%
6.0%
2.6%
3.8%
1.3%
2.2%2.5%
2.2%
0.0%
1.0%
2.0%
3.0%
4.0%
5.0%
6.0%
General Fund All State Funds Federal Funds Total Funds
Ten-Year Average Annual Budget Growth
MaineCare Services Rest of the BudgetMaineCare services exclude administrative costs. Data Source: National Association of State Budget Officers
Compared to other New
England states, Maine
spends more of its total
budget on Medicaid.
State Percent
Maine 32.2
Vermont 28.0
New Hampshire 25.6
Rhode Island 24.4
Connecticut 22.0
Massachusetts 21.3
Medicaid Expenditures as a
Percent of Total Expenditures
(NASBO 2013)
Figure 21: New England States’ Expenditures on Medicaid - Percent of Total

Section IV: MaineCare Overview
Page: 43
Federal Medical Assistance Percentage (FMAP)
The FMAP rate is the mechanism used by the federal government to assist states in funding their
Medicaid program. Section 1905(b) of the Social Security Act specifies a formula for calculating the
federal assistance percentages. The formula takes into account the average per capita income for
each state relative to the national average. By law, FMAP rates cannot be less than fifty percent.78
The federal government has used enhanced federal assistance percentages or increases to a state
base rate to assist the state in offsetting the budgetary demand for public welfare, but in recent
history due to its own budgetary demands, the federal government has reduced and eliminated
many enhanced match rates and lowered many states base rates.79
For example, in Maine, FMAP rates have declined
since 2000. A slight increase in 2010 was due to
additional federal funding available in the fourth
quarter and not an actual long-term increase in the
state’s FMAP rate. Each percentage-point drop in
the FMAP rate results in approximately $25 million
in reduced federal participation, which must be
made up with funds from the state’s revenue base. It is anticipated that states will again see a
reduction in FMAP rates as fiscal problems continue to plague the federal government. This position
is also backed with evidence that shows declining FMAP rates over past years, despite economic
conditions.
78 United States Assistant Secretary for Planning and Evaluation (ASPE) and United States Department of Health and Human Services
Federal Medicaid Assistance Percentages or Federal Financial Participation in State Assistance Expenditures FMAP, Accessed at http://aspe.hhs.gov/health/fmap.htm
79 During the federal debt ceiling debate in late 2011, the Obama administration issued a plan to cut $100 billion from federal Medicaid spending over the next decade by changing and replacing the traditional Federal Medical Assistance Percentages (FMAP) (and other funding formulas) to the states that determine how many federal dollars states get for Medicaid into a "blended rate" that would simplify the way federal money is divvied among the states. The blended-rate proposal would replace this mix of matching rates with a single (blended) matching rate for each state, which would apparently apply to all of a state’s Medicaid and CHIP expenditures, outside of administrative costs. This new formula would shift a greater share of Medicaid spending to the states. The blended rate would be set significantly below the combined effect of the various federal matching rates a state would otherwise receive (in essence a cut). The Obama Administration estimated that this package of changes would save $14.9 billion over 10 years starting in 2017. The federal government would pay a lower percentage of overall Medicaid and Children’s Health Insurance Program (CHIP) costs than under current law, and states would bear a greater share. Although this proposal is said to have been “tabled” for further study, the concept caught the attention of federal deficit reducers and could be “dusted off” for use in the near future. Certain policymakers also believe that reductions in federal matching assistance will deter expansions to health care access. Health Affairs: Health Policy Brief, January 12, 2012.
Calculations done using the blended rate formula as early as a year ago, had the State of Maine losing close to $700 million dollars between 2014 and 2022 from projected spending under the ACA FMAP formula. Drew Gonshorowski, “Medicaid Expansion Will Become More Costly to States,” Heritage Issue Brief No. 3709. August 30, 2012.
In Maine, FMAP rates have declined since
2000. Each percentage-point drop in the
FMAP rate results in approximately $25
million in reduced federal participation,
which must be made up with funds from the
state’s revenue base.

Section IV: MaineCare Overview
Page: 44
Figure 23 shows the trend line of FMAP, SCHIP FMAP, and ARRA FMAP. SCHIP FMAP is the State
Children’s Health Insurance Program, and rates are set under Title XXI for certain children of
expenditures for medical assistance described in portions of the Social Security Act. The rate is an
enhanced rate established through a formula established in Section 2105(b) of the Social Security
act and is calculated based upon the states base rate and a percent difference between that number
and one hundred. However, no state may have a rate that exceeds eighty-five percent. The ARRA
FMAP was temporary additional funding from the American Recovery and Reinvestment Act of 2009
to help states with revenue shortfalls and increased caseload due to the 2007-to-2009 recession.
Each state qualified for the FMAP increases based upon three separate areas: a hold-harmless
amount, a set 6.2% increase, and an increase related to unemployment.80
Maine Private Health Insurance Premium Program (PHIP)
States have pursued a number of strategies to leverage funding and stretch their health-care dollars
in order to avoid cutting eligibility for families. Authorized under Section 1906 of the Social Security
Act, Health Insurance Premium Payment (HIPP) programs subsidize enrollment in employer-
sponsored private health insurance for Medicaid-eligible individuals—and their families—who have
access to such coverage and for whom it is cost-effective.
80 See “ARRA - Medicaid FMAP Increase Provisions” available from the National Conference of State Legislatures, accessed at:
http://www.ncsl.org/print/statefed/ARRA-MedicaidFMAPIncreaseProvisions.pdf.
60%
62%
64%
66%
68%
70%
72%
74%
76%
78%
80%
19
85
19
86
19
87
19
88
19
89
19
90
19
91
19
92
19
93
19
94
19
95
19
96
19
97
19
98
19
99
20
00
20
01
20
02
20
03
20
04
20
05
20
06
20
07
20
08
20
09
20
10
20
11
20
12
20
13
20
14
Federal Fiscal Year
Maine FMAP History
Regular FMAP
SCHIP FMAP
ARRA Enhanced FMAP
Figure 23: The History of FMAP in Maine

Section IV: MaineCare Overview
Page: 45
PHIP is Maine’s premium assistance
program created in 1993. (See Figure 24.)
However, unlike the Rhode Island, Iowa,
and Pennsylvania programs, the Maine
PHIP program has shown low enrollment
and minimal cost-savings. Iowa has
highlighted HIPP as an essential strategy
for Medicaid expansion under the
Affordable Care Act (ACA) to both reduce costs per member and maintain provider capacity. The
three states’ program designs differ from Maine PHIP as follows:
Enrollment is mandated in the other states. Rhode Island, in particular, began with low enrollment under a voluntary program but was able to reach more than 6% of cases when enrollment in HIPP was mandated. MaineCare requires members to contact the PHIP administrator in order to be enrolled. Rhode Island also passed legislation to require Medicaid Providers to submit information on employer-sponsored health insurance (ESI) as a condition for enrollment. In addition, all other employers were required to submit timely filings on ESI (RIGL 40-6-9.1).
Cost effectiveness is determined on an employer-by-employer basis. Once determined, families are notified by mail that they have been enrolled in HIPP.
Administrators concentrate enrollment on families rather than eligible children. This may become more important for Maine since parent-income eligibility has dropped below that of children.
Initial Issues with Quality
In Section II of this report, a number of quality issues with Medicaid in general were highlighted.
The process of evaluating Maine’s performance measures is ongoing;
however, a number of performance measures have been examined in
several areas. Consistent with national studies, two areas that
surfaced immediately within MaineCare were readmission rates and
waitlists for waiver services. Both issues tend to have similar
demographics; they both tend to be older adults with multiple chronic
conditions whose care is uncoordinated.
State Program StartPercent of Families
Enrolled in HIPP
Maine 1993 Less than 1 percent
Rhode Island 2001 6
Iowa 1991 1.6
Pennsylvania 1994 1.9
Medicaid Health Insurance Premium Programs (HIPP)
Figure 24: Percent of Families Enrolled in HIPP
Two areas that surfaced
immediately for waiver
services are:
1. Readmission rates
2. Waitlists

Section IV: MaineCare Overview
Page: 46
Maine
Rate
U.S.
RatePregnancy, Childbirth 7.0% 3.8%
Mental Health 21.5% 11.8%
Circulatory 21.5% 10.4%
Respiratory 22.4% 11.4%
Digestive 22.6% 10.3%
Alcohol/Drug Use 21.1% 13.0%
Musculoskeletal 10.8% 8.3%
Nervous 17.1% 9.5%
Liver, Pancreas 25.5% 12.3%
Metabolic 20.2% 10.7%
Skin, Breast 17.4% 8.0%
Infections 27.4% 11.5%
Kidney 23.9% 12.4%
Injuries, Poisonings 16.8% 8.4%
Health Status 18.6% 9.9%
Female Reproductive 6.4% 6.4%
Ear, Nose, Mouth & Throat 12.6% 7.2%
Myeloproliferative Diseases 49.7% 37.4%
Blood 36.4% 14.1%
Male Reproductive 12.8% 7.2%
HIV Infections 24.4% 17.2%
Multiple Trauma 10.5% 7.9%
Eye 40.9% 6.9%
Burns 5.9% 6.1%
TOTAL 17.7% 9.4%
Hospital Readmissions within 30 days
Source: Table 16 (Maine Hospital Readmissions within 30
days), MaineCare Redesign Task Force Recommendation
Report , December 2012, pp. 26-27.
Maine readmission rates within 30 days for persons in many areas exceeded the national average.
(See Figure 25.) Readmission is defined as a secondary admission for the same admitting diagnosis
within a thirty day period.81 MaineCare has
attempted to curb these trends through an
existing policy. Currently MaineCare does not
reimburse for readmission within 72 hours and
in 2012 presented recommendations to extend
this period.82
In addition to high
readmission rates, there
is the issue of the large
waiting lists to get into
specific programs within
MaineCare. To be clear,
these waiting lists are for
persons who are already members of
MaineCare but are waiting for services more
appropriate to their needs. As of September
2013, MaineCare had waiting lists for these
services of approximately 3,100 members,
according to the Office of Aging and Disability
Services (OADS). These individuals are often
some of the most vulnerable citizens and
include the elderly, individuals with disabilities,
and persons with development disabilities.
These citizens have experienced wait times of
over two years in some cases in order to be
placed for services that include state-funded
home based care, assessment, and
homemakers services. They are generally low-
income families who have no other alternative
for medical and behavioral-health services and
for which resources will likely be unavailable when ACA expansion is adopted. Complicating the
matter of the waitlists are the numerous number of programs operated in order to effectively
provide service to Mainers. Maine currently has eight of these programs with waitlists.
81 MaineCare Redesign Task Force Recommendation Report, December 2012.
82 Idem.
Figure 25: Maine Readmission Rates by Medical Area
Maine currently
has eight
programs with
waitlists for the
most vulnerable
populations.

Section IV: MaineCare Overview
Page: 47
Figure 2683 highlights both waiver services for individuals with intellectual disabilities, physical disabilities and brain injuries along with state-only home-based services, the number of persons awaiting services, and the average costs to operate these programs. The chart indicates total waitlists for all programs to be slightly more than 3,900. This number is larger than the actual waitlist total of 3,100 due to the allowance for enrollment in more than one program. All programs listed offer a range of services that include personal assistance in the home with activities for daily living such as bathing, dressing, meal preparation, and basic housekeeping. Additional services include inpatient costs at nursing facilities and other residential care services.
83 Mary Mahew, “The MaineCare Program Right Size, Right Service, Right Priorities,” Table comes from MDHHS presentation, Fall
2013, slide 19.
Figure 26: State and MaineCare Program Waitlists

Section IV: MaineCare Overview
Page: 48
Muskie School Estimates of Average Age of Long-Term Care Users by Setting for SFY 201084
The number of MaineCare members using long-term care services is a significant cost factor that
needs to be considered. The bar chart was published by the Muskie School of Public Service and
Figure 27 depicts the average age of long-term care uses by setting for SFY 2010.
A worsening economy, an aging workforce and population, rising costs in health care, and increases
in poverty levels will without doubt increase utilization of current MaineCare services.
84 Muskie School Chartbook, Figure 5-1, p. 18.
Figure 27: Age by LTC Facility Statistics
A worsening economy, an aging workforce and population, rising costs in health care, and increases in poverty levels will without doubt increase the utilization of current MaineCare services.

Section IV: MaineCare Overview
Page: 49
Figure 28 shows the various categories qualifying for MaineCare. These categories fall into one of
two groups: traditional Medicaid and “other.” Categories under traditional Medicaid are mostly
groups that states are mandated to cover to qualify for FMAP funding. Categories under “other”
Medicaid groups are optional groups resulting from choices made by the state. The table shows per
member per month (PMPM) costs for each MaineCare category.
Policy Changes on the Uninsured and Uncompensated Care
Since 1998, Maine has adopted a number of policies in an attempt to reduce the number of people
without health insurance and curb uncompensated care costs.85 In 2002, Maine applied for and
received a Section 1115(a) demonstration waiver that allowed childless adults with income at or
below 100% of FPL to receive a comprehensive benefit package. The Centers for Medicare and
Medicaid (CMS) allowed the state to tap unused disproportionate share hospital (DSH) allotments
to make up the federal share of its waiver. Previously, a portion of the DSH allocation had been
85 The American Hospital Association defines uncompensated care as follows: “Uncompensated care is an overall measure of
hospital care provided for which no payment was received from the patient or insurer. It is the sum of a hospital's ‘bad debt’ and the charity care it provides. Charity care is care for which hospitals never expected to be reimbursed. A hospital incurs bad debt when it cannot obtain reimbursement for care provided; this happens when patients are unable to pay their bills, but do not apply for charity care, or are unwilling to pay their bills. Uncompensated care excludes other unfunded costs of care, such as underpayment from Medicaid and Medicare. Hospital Care Cost,” American Hospital Association Fact Sheet on Uncompensated Care, December 2010.
Figure 28: MaineCare Enrollment—Total Members and PMPM
Members PMPM Members PMPMTraditional MaineCare
Aged 22,932 $1,472 22,778 $1,527
Blind or Disabled 51,806 $1,579 52,015 $1,553
Children <100% FPL 110,732 $312 107,312 $321
Parents <100% FPL 50,494 $392 48,848 $392
Pregnancy 1,895 $887 1,922 $912
State Only 1,689 $2,226 767 $1,786
Other Traditional 10,889 $267 12,754 $254
Total Traditional MaineCare 250,438 $711 246,397 $712
Other Groups
Childless Adult Waiver 16,086 $458 10,689 $514
Children > 100% FPL 16,363 $214 14,178 $222
Parents (100%-150% FPL) 22,157 $280 19,702 $271
Total Other 54,607 $312 44,569 $314
Grand Totals 305,045 $639 290,965 $651
MaineCare Enrollment and Per Member Per Month (PMPM) Costs
CategorySFY 2011-12 SFY 2012-13

Section IV: MaineCare Overview
Page: 50
divided up among psychiatric hospitals and community hospitals,
neither of which traditionally met their DSH limit. The DSH
allocation, currently at $85 million (state and federal) became the
upper limit for the program. In the waiver proposal, the state
estimated that 11,000 new members would enroll in the first year.
However, by October 2003, fourteen months after implementation
– 16,854 newly eligible childless adults had enrolled in MaineCare.
Due to the subsequent State budget shortfalls and the risk of
exceeding the waiver cost neutrality terms, Maine requested to amend the waiver by reducing the
current demonstration benefit package and eliminating retroactive coverage for demonstration
populations. These amendments were approved on September 6, 2005 shortly after enrollment was
temporarily capped. Subsequently, enrollment caps were used to control spending and by 2013, the
cap reduced the program’s spending to approximately $50 million in combined annual federal and
state spending. As of September 2013, there were less than 8,500 enrolled childless adults. The
waiver to cover these individuals expired on December 31, 2013.86
While these policies did result in small and temporary decreases in the number of uninsured citizens,
it proved not to be a long-term solution in reducing the number of uninsured citizens, which has
remained fairly constant on an annual basis as a percentage of all individuals under 65 years of age,
as can be seen in Figure 29. Over the same period of time, from SFY 1999-2000 to SFY 2012-13, the
total MaineCare budget, including both state and federal funds, rose from $1.2 billion to almost $2.5
billion, an increase of 109%. In terms of state funds, the increase was even greater. It grew from
$403 million to $992 million, an increase of 146%.
Maine’s experience in expanding eligibility for MaineCare did not result in a noticeable reduction in
uncompensated care. Latest estimates by the Maine Hospital Association place charity care at
approximately $200 million. Just like enrollment and the MaineCare budget, hospital charity care
also exceeded budget targets as it grew by more than 200% from 2000 to 2013. As these numbers
clearly indicate, despite efforts to expand health coverage in order to reduce the number of
uninsured citizens and curb uncompensated care, both issues remain unsolved.
86 Center for Medicare and Medicaid Services, Waiver Information, accessed at http://www.medicaid.gov/Medicaid-CHIP-Program-
Information/By-Topics/Waivers/1115/downloads/me/me-childless-adults-fs.pdf.
2003 2004 2005 2006 2007 2008 2009 2010 201112 10 12 11 10 12 12 11 11
US Census Bureau
Maine Insurance Coverage for Individuals under 65 Years Old
Percent Uninsured
Figure 29: Maine Uninsured Rates
Even with expansions of
public programs over the
years, Maine’s percentage
of uninsured residents
under age 65 has
remained fairly constant
on an annual basis.

Section IV: MaineCare Overview
Page: 51
This lack of evidence linking Medicaid eligibility expansions with reductions in uncompensated care
costs may be explained by the results of several studies, including one by Jonathan Gruber and
Simon Kosali, (2007).87
As the study found:
“continued interest in public insurance expansions as a means of covering the uninsured highlights the importance of estimates of ‘crowd-out,’ or the extent to
which such expansions reduce private insurance coverage. Our results clearly show that crowd-out is significant; the central tendency in our results is a crowd-out rate
of about 60%.”
Recent evidence from employer-sponsored insurance (ESI) in Maine would support that research.
From 2000 to 2011, ESI coverage in Maine for the under-65 population fell from 69.6 to 61.3%.88
87 Jonathan Gruber and Simon Kosali. “Crowd-Out Ten Years Later: Have Recent Public Insurance Expansions Crowded Out Private
Health Insurance?” National Bureau Economic Research, January 2007. The continued interest in public insurance expansions as a means of covering the uninsured highlights the importance of estimates of "crowd-out", or the extent to which such expansions reduce private insurance coverage. Ten years ago, Cutler and Gruber (1996) suggested that such crowd-out might be quite large, but much subsequent research has questioned this conclusion. “We revisit this issue by using improved data and incorporating the research approaches that have led to varying estimates. We focus in particular on the public insurance expansions of the 1996–2002 period. Our results clearly show that crowd-out is significant; the central tendency in our results is a crowd-out rate of about 60%.”
88 Elise Gould, “Employer-Sponsored Health Insurance Coverage Continues to Decline in a New Decade., EPI Briefing Paper #353, Economic Policy Institute, December 5, 2012.

Section IV: MaineCare Overview
Page: 52
This Page Intentionally Left Blank

Section V: Results of the Financial Model
Page: 53
Section V: Results of the Financial Model
Overview of Financial Model
The Alexander Group developed and customized a financial model to forecast enrollment and the
associated fiscal costs of MaineCare. Various scenarios assuming current trends were run to help
Maine policymakers understand potential costs if Maine were to decide to expand eligibility for
MaineCare pursuant to the ACA that the U.S. Supreme Court ruled is optional for the states.
The first step in any financial model is to establish a baseline, without which there would be no basis
for knowing what the additional cost of a proposal would be. The second step is to incorporate
changes to the baseline to include a test case, i.e., a proposal being considered. The third step is to
compare the scenarios and evaluate the differences between the test case and the baseline.
The Baseline is a forecast of how the MaineCare will track in
the future without expansion and assuming pending changes
to MaineCare as approved by the Centers for Medicare and
Medicaid Services (CMS) of USDHHS. Although MaineCare
previously allowed enrollment of parents up through 138% of
FPL, beginning on January 1, 2014, MaineCare only allows
enrollment up to 100% of FPL. Also beginning on January 1,
2014, the Childless Adults Waiver expired. Although this waiver
allowed coverage for childless adults up to 100% of FPL, and as
explained earlier in this report, enrollment in the waiver was
capped for budgetary reasons. It is important to differentiate
the Baseline of the financial model from any baselines
established for purposes of Maine’s biennial budget.
For this analysis, the test case being evaluated is that Maine would expand eligibility of MaineCare
to allow enrollment of all individuals determined to have income equal to or less than 138% of FPL.
This test case is called the Expansion Scenario. The financial model assumes an effective date of July
1, 2014, for implementation of the expansion.
The Baseline and the Expansion scenarios presented in this section are based on current-trend
analysis that assumes the determining factors will continue their current trajectory; i.e., the values
chosen for these factors are in the middle of a possible range of options. As with all forecasts, there
are risks that these scenarios will not be realized and the actual path taken will vary above or below
the forecast. These possibilities will be dealt with in Section VI on risk analysis. More technical
information on methodology, key assumptions, and data sources are found in Appendix B.
The Scenarios
The Baseline assumes two
MaineCare programs are
discontinued: (1) parents
101% to 138% of FPL, and (2)
the Childless Adult Waiver.
The Expansion Scenario
assumes allowing everyone
at 138% of FPL to be eligible
for MaineCare.

Section V: Results of the Financial Model
Page: 54
Population
The financial model restricted its analysis to those individuals enrolled in MaineCare with full
benefits. In other words, other persons with partial benefits were excluded.89
The AG Financial Model utilizes standard actuarial analysis (See Figure 30) to predict potential
growth in the Baseline scenarios. An important factor used in the analysis is the poverty rate.
Because Maine has had a significant increase in its poverty rate, it impacts the forecast on the
number of individuals who will become eligible for MaineCare.
The graph in Figure 31 shows the estimated growth in poverty based on historical trends and
actuarial assumptions. The actuarial assumptions used for these scenarios are middle values, that
89 Low-income Medicare buy-in groups who meet the criteria for participation in Drugs for Elderly (DEL) program and/ or Maine Rx
were excluded in the forecast.
Figure 30: Annual Average Projected Growth Rates
Figure 31: Maine Actuarial Forecast of Persons in Poverty
Age Group Poverty Total Population
Under 18 0.0308 -0.0131
18-64 0.0248 0.0046
65 and Over 0.0361 0.0156
Total 0.0278 0.0024
Annual Average Projected Growth Rates
Based on Actuarial Analysis
124,727
169,076
186,484
245,317
36,540
48,73451,386
69,597
0
50,000
100,000
150,000
200,000
250,000
2000 2005 2010 2015 2020
Actuarial Forecast of Persons in Poverty
Census Bureau Population Estimates for 2012
Decennial Census Counts
Actuarial Forecast

Section V: Results of the Financial Model
Page: 55
is, the actual growth could be somewhat higher or lower than projected. The risks of higher or lower
growth are discussed in Section VI of this report. Importantly, the growth in poverty will impact both
the Baseline as well as the Expansion Scenario.
Because of the high poverty growth, the financial model predicts a significant growth in the Baseline
scenario, which can be seen in Figure 32. Thus, even without expanding eligibility, MaineCare
enrollment is projected to grow by an annual average of 2.8% for the Baseline. This may not seem
to be tremendous growth, and it is not over one or two years. However, growth rates when
sustained compound and grow exponentially. Therefore, a 2.8% annual growth rate over nine years
is a total increase of nearly 29%, which would add 79,135 persons to the enrollment, bringing the
SFY 2023-24 Baseline enrollment to 354,918.
Under the Expansion Scenario, the population will grow more dramatically. The average annual
growth becomes 5.7% over ten years, which would be a total increase of 74.7%.
Figure 32: Baseline Enrollment Forecasts
30
7,7
33
29
1,6
67
27
4,1
79
27
5,7
84
28
3,5
77
29
1,6
04
29
9,8
71
30
8,3
84
31
7,1
52
32
6,1
81
33
5,4
80
34
5,0
56
35
4,9
18
-
100,000
200,000
300,000
400,0002
01
1-1
2
20
12
-13
20
13
-14
20
14
-15
20
15
-16
20
16
-17
20
17
-18
20
18
-19
20
19
-20
20
20
-21
20
21
-22
20
22
-23
20
23
-24
State Fiscal Year
Baseline Enrollment

Section V: Results of the Financial Model
Page: 56
This would add a total of 204,800 persons onto the rolls over the ten year period, including the
enrollment growth for the Baseline. However, the average annual growth rate can be misleading
because there will initially be a large increase in SFY 2014-15.90 After SFY 2014-15, the average
annual growth rate is projected to be 2.8%. (See Figure 33.)
For this analysis, the following population groups were assumed to be added to MaineCare:
Childless adults up through 138% of FPL;
Parents between 101% and 138% of FPL;
Persons at 138% of FPL or below currently enrolled in private insurance who would
voluntarily drop or lose their coverage;
Parents at 100% or below FPL currently eligible for MaineCare but who will enroll because
of the so-called “woodwork effect”; and
Children at 200% of FPL or below who will enroll because of the “woodwork effect.”
90 It may take some time before the initial increase in enrollment will be accomplished, which may carry over into the succeeding
fiscal year. To keep the model from becoming too complicated, it was assumed all of the initial increase would incur in the first year.
Figure 33: MaineCare Enrollment with Expansion
30
7,7
33
29
1,6
67
27
4,1
79
37
4,9
35
38
5,2
28
39
5,8
17
40
6,7
11
41
7,9
18
42
9,4
48
44
1,3
09
45
3,5
11
46
6,0
65
47
8,9
79
-
100,000
200,000
300,000
400,000
500,000
20
11
-12
20
12
-13
20
13
-14
20
14
-15
20
15
-16
20
16
-17
20
17
-18
20
18
-19
20
19
-20
20
20
-21
20
21
-22
20
22
-23
20
23
-24
State Fiscal Year
Revised Enrollment with Expansion

Section V: Results of the Financial Model
Page: 57
Figure 34 gives the estimated number of new persons from those categories who will likely enroll in
MaineCare. The total initial enrollment is estimated to be 99,151 within the first program year,
assuming full implementation.91
The category of persons losing or voluntarily
dropping private coverage requires some
explanation. There are two subgroups within
this category. First, there are individuals with
non-group coverage. The ACA has made many
of these more affordable health care plans
illegal, and many insurers have recently sent
cancellation notices to holders of these
policies. Because of federal requirements that
plans must include all federally-defined
essential health benefits and other regulations,
such as community rating requirements,
replacement policies are significantly more expensive. That will likely make the costs of the new
policies unaffordable for these individuals. If eligibility for Medicaid were expanded, a significant
number of these individuals would qualify and likely come onto the MaineCare rolls. The second
subgroup is comprised of those individuals with employer-provided coverage. There is evidence
through scientific surveys as well as anecdotal evidence that some employers plan to drop
coverage,92 and those employers that decide against dropping coverage can effectively maneuver
to do the same for their low-income employees. Those employers with less than fifty employers are
not subject to any federal penalties if they do not offer insurance. From a small business firm’s point
of view, it makes financial sense to allow the government to pay for employee health coverage than
for the firm to incur that cost. Some of these smaller employers, therefore, will likely drop coverage.
For larger employers, there are penalties in the law if they do not provide health insurance to their
employees, but it may not be necessary for them to drop coverage and sustain the penalties in order
for them to encourage their low-income employees to enroll in Medicaid. These employers can
simply choose plans with premium cost sharing at high enough levels that make it financially
conducive for their low-income employees to enroll in Medicaid. This tactic also could be used by
smaller employers as well.
The last two categories of the expansion population in Figure 35 deserve further explanation.
Experience has shown that whenever Medicaid enrollment is expanded, people who are already
eligible also enroll. So, in addition to new categories that expand the enrolled population, there is
91 Idem.
92 Shubham Singhai, Jeris Stueland, and Drew Ungerman, “How US health care reform will affect employee benefits,” McKinsey Quarterly, June 2012, accessed at: http://www.mckinsey.com/insights/health_systems_and_services/how_us_health_care_reform_will_affect_employee_benefits
Figure 34: MaineCare Enrollment SFY 2014-15 Expansion Forecast
Expansion Enrollment ForecastSFY 2014-15
Estimate
Childless Adults up to 138% FPL 47,513
Parents between 101% -138% FPL 15,216
Persons 138% FPL and below who
would lose private insurance32,678
Parents 100% FPL and Below
("woodwork")1,638
Children ("woodwork") 2,106
Total Forecast 99,151

Section V: Results of the Financial Model
Page: 58
also an increase in established programs. This phenomenon has been crudely called the “woodwork
effect.” It comes from the expression that “they come out of the woodwork,” because Medicaid
administrators had not counted on the increased enrollment. This phenomenon is thought possible
because not everyone who qualifies for Medicaid signs
up, for whatever reason he or she might have for not
doing so. Some have suggested that the term
“woodwork effect” has a negative connotation and
have offered the term “welcome mat effect” as its
replacement.
Figure 35 provides an illustration comparing enrollment under the Baseline with the Expansion
Scenario. The difference in the lines gives the growth in enrollment due to the expansion.
Fiscal Cost
The AG Financial Model shows that in these scenarios the total cost for the Baseline and Expansion
Scenario will be significant. For the Baseline, total costs will increase on average of 5.3% per year,
354,918
274,179
478,979
250,000
300,000
350,000
400,000
450,000
500,000
550,000
20
11
-12
20
12
-13
20
13
-14
20
14
-15
20
15
-16
20
16
-17
20
17
-18
20
18
-19
20
19
-20
20
20
-21
20
21
-22
20
22
-23
20
23
-24
Mai
ne
Car
e E
nro
llme
nt
State Fiscal Year
MaineCare Enrollment1 Forecast
Note: 1Includes only enrollees with full benefits.
Figure 35: MaineCare Enrollment Forecasts Comparison
Experience has shown that whenever
Medicaid enrollment is expanded, people
who are already eligible also enroll. This
is called the “woodwork effect.”

Section V: Results of the Financial Model
Page: 59
which increases the total cost by 67.2% over a ten-year period. The average annual growth rate,
however, will be 5.5% in the latter years. Under the Baseline, the total cost for MaineCare increases
by $1.8 billion, from $2.7 billion in SFY 2013-14 to $4.5 billion in SFY 2023-24.
For the Expansion Scenario, the total cost of MaineCare doubles by $2.7 billion in SFY 2013-14 to
$5.4 billion in SFY 2023-24, an increase of 101%. The average annual increase over those ten years
is projected to be 7.3%, although in the latter years it would fall closer to 5.5%.
The results of these scenarios generated by the AG Financial Model estimate growth comparable to
the national average as estimated by the USDHHS Office of the Actuary, discussed earlier in this
report. Although Maine lacks the population growth of other states, its high poverty growth rate
makes up for the difference.
The federal government will be absorbing the lion’s share of the expansion cost in the early years.
However, it would be incorrect to assume that Maine would not have any costs. Quite to the
contrary, the costs will still be significant. The ACA provides 100% reimbursement for expenditures
in calendar years (CY) 2014 through 2016 only for new eligibility groups. Because MaineCare has
allowed more groups to become eligible prior to the enactment of the ACA, including parents above
100% of FPL, Maine would clearly receive 100% reimbursement for those years for only the childless-
adult population with one possible exception. At the time that the ACA became effective, Maine
had 10,500 childless adults enrolled in its Childless Adult Waiver program. These adults would likely
receive an enhanced FMAP but still lower than the FMAP for the newly eligible groups. However,
MDHHS is currently negotiating with CMS in order to receive the higher FMAP in the event the state
decides to expand.

Section V: Results of the Financial Model
Page: 60
Figure 36 illustrates the difference in the total MaineCare costs between the Baseline and Expansion
Scenario. Even for those categories that receive 100% reimbursement, the Federal commitment
would decrease beginning in CY 2017, until it becomes 90% in CY 2020. The Expansion Scenario
assumes the Federal government will continue to provide 90% after 2020, but this assumption is
not assured considering the fiscal situation of the federal government.
$4.5
$2.7
$5.4
$2.5
$3.0
$3.5
$4.0
$4.5
$5.0
$5.5
$6.0
20
11
-12
20
12
-13
20
13
-14
20
14
-15
20
15
-16
20
16
-17
20
17
-18
20
18
-19
20
19
-20
20
20
-21
20
21
-22
20
22
-23
20
23
-24
Bill
ion
s
State Fiscal Year
MaineCare Total Cost Forecast
Figure 36: MaineCare Total Cost Forecast
The expansion scenario assumes the Federal government will continue to provide 90% funding after
2020, but this assumption is not assured considering the fiscal situation of the federal government.

Section V: Results of the Financial Model
Page: 61
Given these assumptions, the AG Financial Model predicts state costs of $33.5 million in SFY 2014–
15, or $45.3 million if the higher FMAP is denied for the childless adult waiver population when
compared to the Baseline. (See Figure 37.) The state costs are projected to grow to $125.0 million
in SFY 2023–24, for a ten-year total of $807 million, or $840 million if the higher FMAP is denied.
33.5 31.3
44.8
66.3
75.7
92.1
106.8112.6
118.6125.0
$-
$50
$100
$150
20
14
-15
20
15
-16
20
16
-17
20
17
-18
20
18
-19
20
19
-20
20
20
-21
20
21
-22
20
22
-23
20
23
-24
Mill
ion
s
State Fiscal Year
Estimated State Cost of Expansion over Baseline
=GraphData!M14
Total Ten-Year State Cost: $807 Million
45.3 40.8
51.3
76.9 69.9
Revised Ten-Year State Cost if Higher FMAP is Denied: $840 Million
Revised Totals if Higher FMAP is Denied
Figure 37: Estimated State Cost of Expansion over Baseline

Section V: Results of the Financial Model
Page: 62
Figure 38 provides a more detailed summary of the scenario results of the AG Financial Model, which includes the Baseline, the Expansion
Scenario, and the impact. It gives the projected populations, total costs, federal costs, and state costs.
SFY: 2012-13
Actual
2013-14
Estimate
2014-15
Forecast
2015-16
Forecast
2016-17
Forecast
2017-18
Forecast
2018-19
Forecast
2019-20
Forecast
2020-21
Forecast
2021-22
Forecast
2022-23
Forecast
2023-24
Forecast
Ten Year
Total
Enrollees 291,667 274,179 275,784 283,577 291,604 299,871 308,384 317,152 326,181 335,480 345,056 354,918
Total Cost 2,659$ 2,702$ 2,794$ 2,941$ 3,102$ 3,272$ 3,452$ 3,642$ 3,843$ 4,055$ 4,280$ 4,517$ 35,897$
Fed Cost 1,612$ 1,625$ 1,667$ 1,769$ 1,870$ 1,974$ 2,084$ 2,200$ 2,322$ 2,452$ 2,590$ 2,735$ 21,663$
State Cost 1,047$ 1,077$ 1,127$ 1,172$ 1,231$ 1,298$ 1,368$ 1,442$ 1,520$ 1,603$ 1,690$ 1,783$ 14,234$
Enrollees 374,935 385,228 395,817 406,711 417,918 429,448 441,309 453,511 466,065 478,979
Total Cost 3,369$ 3,547$ 3,741$ 3,946$ 4,162$ 4,391$ 4,632$ 4,888$ 5,158$ 5,443$ 43,276$
Fed Cost 2,208$ 2,344$ 2,465$ 2,582$ 2,718$ 2,857$ 3,005$ 3,172$ 3,349$ 3,536$ 28,235$
State Cost 1,161$ 1,203$ 1,276$ 1,364$ 1,443$ 1,534$ 1,627$ 1,715$ 1,809$ 1,908$ 15,040$
Enrollees 99,151 101,650 104,213 106,840 109,534 112,296 115,128 118,032 121,009 124,061
Total Cost 575$ 606$ 639$ 674$ 710$ 749$ 790$ 833$ 878$ 926$ 7,379$
Fed Cost 541$ 575$ 594$ 607$ 635$ 657$ 683$ 720$ 759$ 801$ 6,573$
State Cost 33$ 31$ 45$ 66$ 76$ 92$ 107$ 113$ 119$ 125$ 807$
Bas
eli
ne
Pro
ject
ion
s
Exp
ansi
on
Sce
nar
io
Exp
ansi
on
Imp
act
The Alexander Group Financial Model Results for Medicaid Expansion in Maine: Dollars in Millions
Figure 38: The Alexander Group Financial Model Results

Section V: Results of the Financial Model
The Alexander Group Page: 63
Fiscal Impact
Maine already has a relatively high percentage of its overall
state population enrolled in MaineCare, which was 21.5% in SFY
2012-13. (See Figure 39.) Based on the actuarial assumptions
used in this financial model, 25.4% of the overall state
population will be enrolled in Medicaid by SFY 2023-24 under
the Baseline, or slightly more than one in every four persons.
Under the Expansion Scenario, however, 34.3% of the overall state population will be enrolled in
Medicaid, or more than one in every three persons. These percentages do not include the
approximately 45,000 individuals who receive partial benefits from MaineCare. (See Appendix B for
more details on assumptions).
Carrying the health-care needs of one third of the population will be challenging under any
circumstance. Average costs to fund healthcare for members enrolled in MaineCare vary greatly
among population groups, from as little as $3,848 annually in SFY 2012–13 for children under 100%
of FPL to $18,641 for individuals with disabilities.
Figure 39: MaineCare as Percent of State Population
With Medicaid expansion,
34.3% of Maine’s population
will be enrolled in Medicaid by
SFY 2023-24.
21.5% 20.7%
25.4%
7.4%
8.9%
0.0%
5.0%
10.0%
15.0%
20.0%
25.0%
30.0%
35.0%
2012-13Actual
2015-16Forecast
2023-24Forecast
MaineCare1 As Percent of State Population
Expansion
Baseline
Note: 1Includes only enrollees with full benefits.
28.1%
34.3%

Section V: Results of the Financial Model
The Alexander Group Page: 64
In terms of state funds, the budget for MaineCare
services has been growing faster than the rest of the
state budget, almost three times as fast over the past
ten years (6.0% average annual growth versus 2.2%).
The AG Financial Model forecasts that the Baseline
average annual growth rate will be slightly more at
5.2%. However, if Maine elects to expand the
MaineCare eligibility, the forecasted growth rate becomes 5.9%. Figure 40 illustrates the differences
in the growth rates, which are the financial obligations that must be paid for using state funds. The
large dip in the state obligation for MaineCare services seen on the chart occurred because the
federal government, through the American Recovery and Reinvestment Act of 2009, provided states
with one-time grants to help pay for Medicaid and balance their budgets during the last recession.
Importantly, these differences in the growth rates raise an obvious fiscal concern: the state will
continually have to generate additional revenue to support the program, even without the
expansion.
Figure 40: MaineCare Services and Budget Growth Comparison
In terms of state funds, the budget for
MaineCare services has been growing
faster than the rest of the state budget,
almost three times as fast over the past
ten years (6.0% average annual growth
versus 2.2%.)
1.0
1.5
2.0
2.5
3.0
3.5
20
02
-03
20
03
-04
20
04
-05
20
05
-06
20
06
-07
20
07
-08
20
08
-09
20
09
-10
20
10
-11
20
11
-12
20
12
-13
20
13
-14
20
14
-15
20
15
-16
20
16
-17
20
17
-18
20
18
-19
20
19
-20
20
20
-21
20
21
-22
20
22
-23
20
23
-24
Gro
wth
Fac
tor
fro
m B
ase
Fis
cal Y
ear
20
02
-03
State Fiscal Year
MaineCare Services and Rest of Budget Growth ComparisonState Funds Only
MaineCare Services
Baseline Forecast
Expansion Forecast
Rest of Budget (ROB)
ROB Trendline

Section V: Results of the Financial Model
The Alexander Group Page: 65
The varying growth rates will cause MaineCare services, i.e., excluding administrative costs, to
continually encompass a larger share of the state budget in regards to both state funds and federal
funds. Figure 41 shows the results of estimating the budget impact. Historic growth rates were used
to estimate the size of the rest of the budget along with the results of the AG Financial Model for
estimating the costs of MaineCare services. Examining just the General Fund, the percentage of the
General Fund budget dedicated to MaineCare services was 20.3% in SFY 2002–03. This percentage
grew to 24.2% in SFY 2012–13, and the AG Financial Model forecasts that it will become 35.0% in
SFY 2023–24 under the Baseline. It might be noted that the percentage for SFY 2012-13 would be
even higher if MaineCare were not supplemented with $255 million from other special revenue
accounts. Under the Expansion Scenario, however, MaineCare will require 37.4% of the General
Fund budget. For the overall budget, including federal funds, MaineCare will require 44.6% of the
total budget under the Expansion Scenario in SFY 2023-24 as opposed to 39.5% under the Baseline.
Although an economic impact statement is beyond the scope of this study, an observation is offered.
First, however, a word needs to be said about a number of recent economic studies that have been
produced predicting economic benefits for states that expand. These studies appear to use
theoretical assumptions from the Neo-Keynesian school of economic thought. They generally use
models that apply a multiplier to new spending to demonstrate increased economic activity. These
models are seriously deficient, however, because they do not adequately account for all economic
losses from the revenue side of the equation. A more viable model would also estimate the
opportunity costs due to the increased taxation, government borrowing, and other impacts. It is the
net of the benefits and losses that defines the economic impact.
One quick way to evaluate the economic impact is to compare MaineCare enrollment to
employment. This gives an indication of the burden placed on the employed who support the
system. This is not an exact indicator by any means, but it nevertheless provides a rough indication.
It is, after all, those who are employed who pay the bulk of taxes to support not only state
The enrollment to employment ratio changes under expansion. In SFY 2012–13, the ratio was 1 to
2.0, meaning that each person on MaineCare was supported by 2 employed persons. The forecasts
show that that ratio will drop to 1 to 1.4 in 2020 under the expansion scenario.
General
Fund
All State
FundsFederal Total
General
Fund
All State
FundsFederal Total
2002-03 (Actual) 20.3% 13.9% 59.0% 29.0% N/A N/A N/A N/A
2012-13 (Actual) 24.2% 19.0% 59.2% 32.2% N/A N/A N/A N/A
2023-24 (Forecast) 35.0% 24.8% 65.6% 39.5% 37.4% 26.6% 71.3% 44.6%
Percent MaineCare Services to Total Maine State Budget by Fund
Baseline Expansion
SFY
Figure 41: MaineCare Services as Percent of Maine State Budget by Fund

Section V: Results of the Financial Model
The Alexander Group Page: 66
government but the federal
government as well. Using data from
these sources—the U.S. Bureau of
Labor Statistics, the Center for
Workforce Research and Information
of the Maine Department of Labor, and
the Maine Department of Health and
Human Services—and forecasts from
the AG Financial Model, the
enrollment to employment ratio
changes under the Expansion Scenario.
In SFY 2012–13, the ratio was 1 to 2.0,
meaning that each person on
MaineCare was supported by 2
employed persons. The forecasts show
that that ratio will drop to 1 to 1.4 in 2020 under the Expansion Scenario. (See Figures 42 and 43.)
Figure 43: MaineCare Enrollment to Employment Comparison
Figure 42: MaineCare Enrollees to Employed Mainers Ratio
MaineCare Enrollee
Employed Mainers
Each MaineCare enrollee was supported by 2 employed Mainers in SFY 2012-13.
Each MaineCare enrollee will likely be supported by only
1.4 employed Mainers in 2020.
Under MaineCare Expansion:
515,825
321,666
496,967
291,667
99,950
113,712
100,767
0 100,000 200,000 300,000 400,000 500,000 600,000 700,000
Comparing MaineCare Enrollment1 to Employment
Enrollment to Employment Ratio:
Enrollment to Employment Ratio:
MaineCareEnrollmentin 2012-13
MaineCareEnrollment
in 2020
Employment in 2012-13
Employment in 2020
597,733
435,378
615,775
Private
Private
Government-->
Government-->
Expansion Population
1 to 1.4
1 to 2.0
Date Sources: Establishment data of the U.S. Bureau of Labor Statistics; 2020 Projections from the Maine Department of Labor, Center for Workforce Research and Information; Maine Department of Health & Human Services; and Alexander Group Forecasts.
Note: 1Includes only enrollees with full benefits.
Section V: Results of the Financial Model
The Alexander Group Page: 67
Conclusion on Results of Financial Model
From a financial standpoint, the results from the Baseline and
Expansion Scenarios are troublesome. Critical factors, such as
poverty growth, are causing MaineCare to continue to have
high-cost growth far in excess of other budgetary growth. In
other words, the State of Maine will be challenged to
generate additional revenue in state funds to keep up with
the growing demand for MaineCare under the Baseline, which
is projected to require 35.0% of the General Fund budget in SFY 2023-24 when it now requires 24.2%
of the General Fund budget. For the Expansion Scenario, the state of Maine would be required to
generate an additional $807 million to $840 million in state funds over the next ten years in addition
to what is required to support MaineCare under the Baseline. The next section examines risks to
these forecasts.
The results of the baseline and
expansion scenarios will
challenge Maine to generate
additional revenue in state funds
to keep up with the growing
demand for MaineCare.

Section V: Results of the Financial Model
The Alexander Group Page: 68
This Page Intentionally Left Blank

Section VI: Risk Analysis
The Alexander Group Page: 69
Section VI: Risk Analysis
Overview
The data generated by the financial model to forecast enrollment and costs for the Baseline and
Expansion Scenario are based on a number of key assumptions on values of factors that will
determine what trends will prevail in the future. Each value chosen was in the middle of an expected
range of possibilities. For example, the PMPM growth factor has an expected value range of 1.9% to
3.9%, and 2.9% was the chosen value for the forecast. There is risk, however, that the actual value
that will be realized in the future will fall toward either end of the range as opposed to in the middle.
Low-end values are defined as those values that would cause enrollment and costs to be lower than
forecasted. High-end values are those values that would cause enrollment and cost to be more than
forecasted. This section of the report provides analysis on the four most likely risk factors.
The Risk Factors Considered
The four risk factors chosen to be analyzed are the poverty growth rates, PMPM cost growth rates,
individuals with private insurance losing coverage (private drop), and FMAP rate changes. (See
Figure 44.)
Each of the succeeding pages presents three possibilities for each risk factor:
“Low end” values are those values that result in the overall decrease in costs, which may include reductions in enrollment, relative to what is expected.
“High-end” values are those values that result in the overall increase in costs, which may include increases in enrollment, relative to what is expected.
Risk Factor Explanation ImpactPoverty Growth Small changes in poverty growth influences welfare rolls. Impacts size of population eligible for
MaineCare and overall state budget.
PMPM Health care costs have been increasing, and Maine's fee
reimbursement rate relative to private insurers is one of
the lowest in the country.
Rising costs impact total program costs
and the state budget.
Private Drop Persons losing coverage within defined income ranges
can become eligible for MaineCare.
Impacts size of population eligible for
MaineCare and overall state budget.
FMAP FMAP rates determine cost sharing between the federal
government and state governments.
Changes in FMAP rates have significant
impact on state budgets.
Risk Factors Examined
Figure 44: Risk Factors Examined

Section VI: Risk Analysis
The Alexander Group Page: 70
‘Middle” values are values between the low-end and high-end and are subsequently considered to be more likely or “what is expected.” These middle values are also the assumptions that were chosen in the scenarios presented in Section V.
The above values impact both the Baseline and Expansion Scenarios.
The next four subsections provide analysis on the potential low-end and high-end values for the four
risk factors listed above. The fifth subsection below provides an analysis on what might be a best
case scenario and a worst case scenario, assuming that the three of those four risk factors will have
values that fall on either the low-end or high-end of their respective ranges. The three factors chosen
are those factors most likely to vary from the middle.
At the top of each subsection below are three summary boxes as follows:
Summary Box 1 provides the low-end, middle, and high-end values for the risk factor being
considered.
Summary Box 2 provides a summary of the impact assuming the low-end and high end
values on four program metrics as they relate to the Baseline and Expansion Scenarios. The
four program metrics are enrollment in SFY 2023-24, percent of the population on
MaineCare in SF 2023-24, the ten-year total cost in millions of dollars, and the ten-year state
cost in millions of dollars. This box shows the impact of those values on those metrics by
showing how results vary assuming the middle value, the low-end value, and the high-end
value. The box further shows the differences and percent changes from the middle value to
both the low-end and high-end results.
Summary Box 3 shows how the results change by assuming the low-end and high-end values
and their impact on the Expansion Scenario relative to the Baseline. For example, the result
of a low-end value assumption for Expansion Scenario would be compared to the Baseline
assuming the same low-end value. The four metrics considered are the additional enrollment
for SFY 2023-24, the additional percentage of the population on MaineCare in SFY 2023-24,
the additional ten-year total cost in millions of dollars, and the additional ten-year state cost
in millions of dollars.

Section VI: Risk Analysis
The Alexander Group Page: 71
Poverty Growth Risk Factor
Actuarial analysis was used to evaluate the poverty
growth factor in Maine, which has been very high as
explained earlier in the report. If the poverty rate
increases more than expected, it will lead to more
persons qualifying for MaineCare. Likewise, if it grows
less than expected, it can reduce the number. Figures
45, 46, and 47 summarize potential factors and results.
Middle
Result Result Difference % Result Difference %
Enrollment in SFY 2023-24 354,918 330,757 -24,161 -6.8% 380,704 25,786 7.3%
Percent of Population on
MaineCare in SFY 2023-2425.4% 23.7% -1.7% 27.2% 1.8%
10 Year Total Cost (Millions $) 35,896.5 34,598.5 (1,298.0) -3.6% 37,256.2 1,359.7 3.8%
10 Year State Cost (Millions $) 14,233.7 13,744.2 (489.5) -3.4% 14,746.5 512.7 3.6%
Enrollment in SFY 2023-24 478,979 447,900 -31,079 -6.5% 512,048 33,069 6.9%
Percent of Population on
MaineCare in SFY 2023-2434.3% 32.0% -2.2% 36.6% 2.4%
10 Year Total Cost (Millions $) 43,275.8 41,753.6 (1,522.2) -3.5% 44,867.7 1,592.0 3.7%
10 Year State Cost (Millions $) 15,040.4 14,521.4 (519.0) -3.5% 15,583.8 543.4 3.6%
Summary Box 2
Low End High EndScenario and Program Metric
Bas
elin
eEx
pan
sio
n
Poverty Growth Risk Factor Changes to Assumed Middle Values
Increase % Increase % Increase %
Additional Enrollment in SFY 2023-24 117,144 35.4% 124,061 35.0% 131,344 34.5%
Additional % of Population on MaineCare in SFY 2023-24 8.4% 8.9% 9.4%
Additional 10 Year Total Cost (Millions $) 7,155.1 20.7% 7,379.2 20.6% 7,611.5 20.4%
Additional 10 Year State Cost (Millions $) 777.2 5.7% 806.7 5.7% 837 5.7%
Summary Box 3
Imp
act
to
Bas
elin
e
Expansion Impact of Poverty Growth Risk FactorsLow End Middle High End
Scenario and Program Metric
Figure 47: Expansion Impact of Poverty Growth Risk Factors
Figure 45: Poverty Growth Risk Factors
Age Category Low End Middle High EndUnder 18 2.31% 3.08% 3.85%
18 to 64 1.86% 2.48% 3.10%
65 and over 2.71% 3.61% 4.51%
Total 2.09% 2.78% 3.48%
Population Growth Factors
Summary Box 1
Figure 46: Poverty Growth Risk Factor Changes to Assumed Middle Values

Section VI: Risk Analysis
The Alexander Group Page: 72
Poverty Growth Risk Factor Impact on Total Poverty Chart: A change in the growth factor will
impact the number of persons in poverty. Figure 48 summarizes the impact of the various growth
factors. The solid line indicates Census Bureau estimates on the number of persons in poverty. The
dotted lines are forecasts using actuarial assumptions.
Figure 48: Range of Actuarial Forecast of Persons in Poverty
124,727
169,076
245,317
229,224
186,484
262,419
100,000
120,000
140,000
160,000
180,000
200,000
220,000
240,000
260,000
280,000
2000 2005 2010 2015 2020
Actuarial Forecast of Persons in Poverty
Census Bureau Population Estimate for 2012
Decennial Census Counts
Range of Actuarial Forecast

Section VI: Risk Analysis
The Alexander Group Page: 73
Poverty Growth Risk Factor Impact on Children Chart: Figure 49 shows how the different growth
factors would impact the forecast for children living in poverty. The solid line indicates Census
Bureau estimates on the number of children in poverty. The dotted lines are forecasts using actuarial
assumptions.
36,540
48,734
69,597
64,569
51,386
74,974
30,000
35,000
40,000
45,000
50,000
55,000
60,000
65,000
70,000
75,000
80,000
2000 2005 2010 2015 2020
Actuarial Forecast of Children in Poverty
Decennial Census Counts
Census Bureau Population Estimate for 2012
Range of Actuarial Forecast
Figure 49: Range of Actuarial Forecast of Children in Poverty
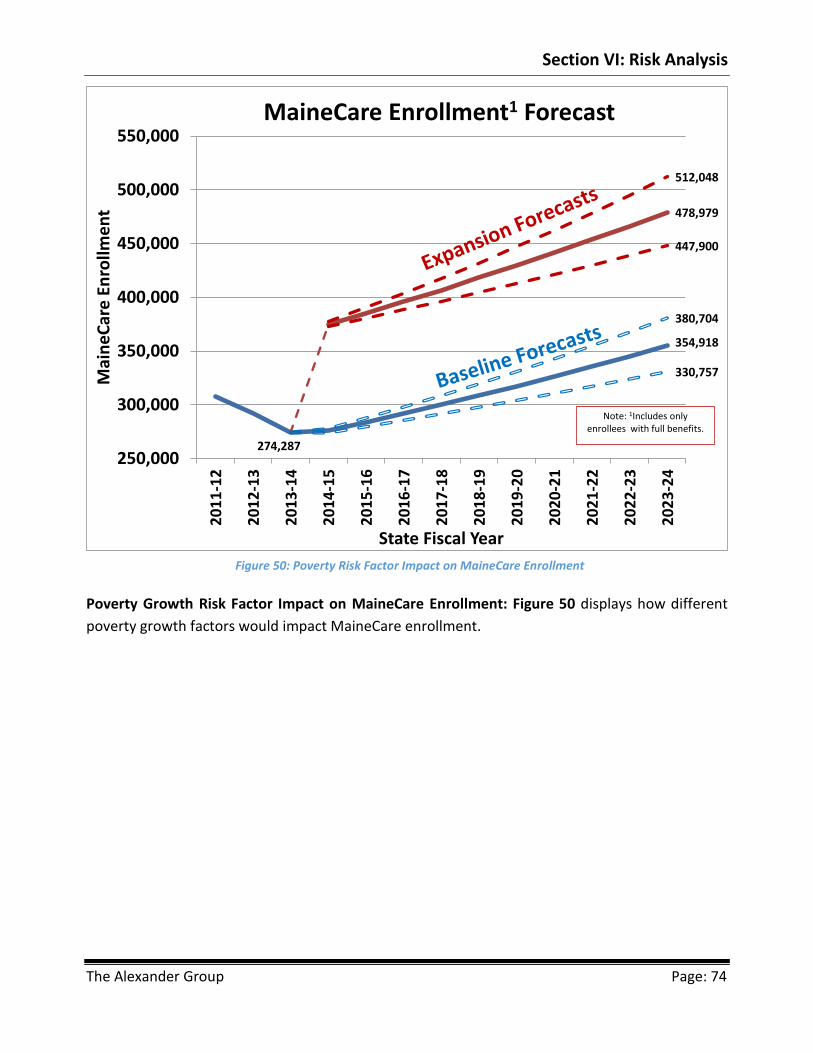
Section VI: Risk Analysis
The Alexander Group Page: 74
Poverty Growth Risk Factor Impact on MaineCare Enrollment: Figure 50 displays how different
poverty growth factors would impact MaineCare enrollment.
Figure 50: Poverty Risk Factor Impact on MaineCare Enrollment
354,918
478,979
330,757
274,287
380,704
447,900
512,048
250,000
300,000
350,000
400,000
450,000
500,000
550,000
20
11
-12
20
12
-13
20
13
-14
20
14
-15
20
15
-16
20
16
-17
20
17
-18
20
18
-19
20
19
-20
20
20
-21
20
21
-22
20
22
-23
20
23
-24
Mai
ne
Car
e E
nro
llme
nt
State Fiscal Year
MaineCare Enrollment1 Forecast
Note: 1Includes only enrollees with full benefits.
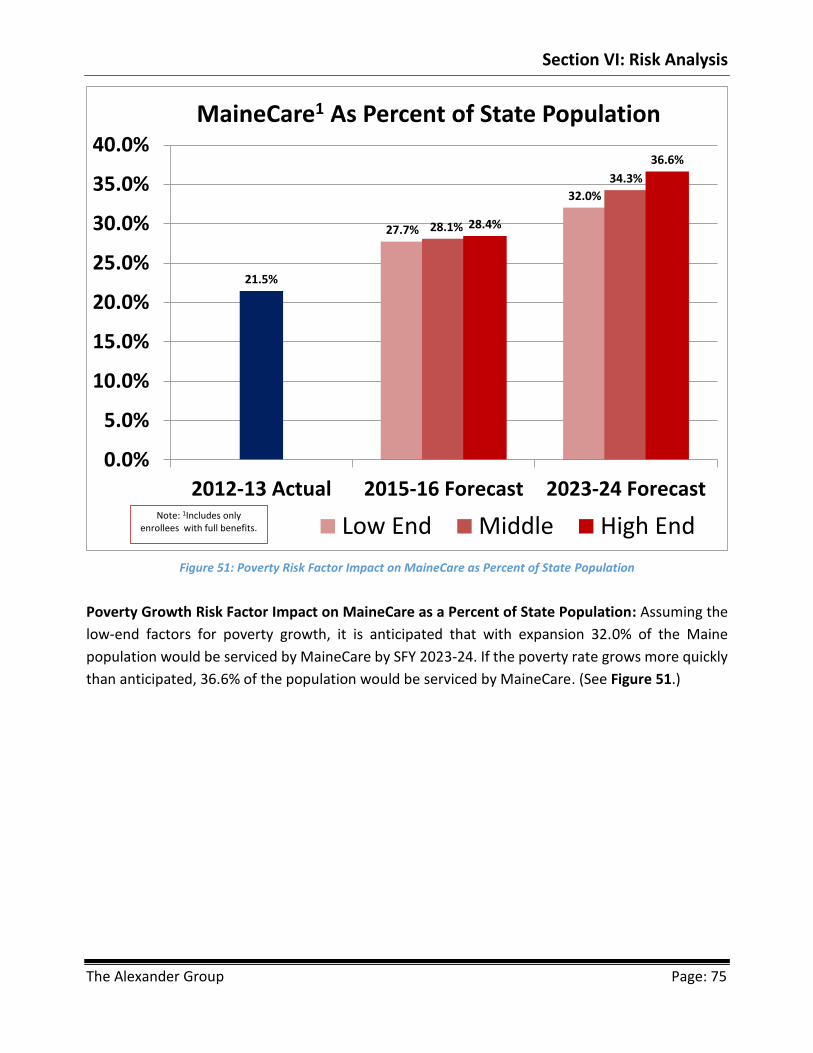
Section VI: Risk Analysis
The Alexander Group Page: 75
Poverty Growth Risk Factor Impact on MaineCare as a Percent of State Population: Assuming the
low-end factors for poverty growth, it is anticipated that with expansion 32.0% of the Maine
population would be serviced by MaineCare by SFY 2023-24. If the poverty rate grows more quickly
than anticipated, 36.6% of the population would be serviced by MaineCare. (See Figure 51.)
Figure 51: Poverty Risk Factor Impact on MaineCare as Percent of State Population
27.7%
32.0%
21.5%
28.1%
34.3%
28.4%
36.6%
0.0%
5.0%
10.0%
15.0%
20.0%
25.0%
30.0%
35.0%
40.0%
2012-13 Actual 2015-16 Forecast 2023-24 Forecast
MaineCare1 As Percent of State Population
Low End Middle High EndNote: 1Includes only
enrollees with full benefits.
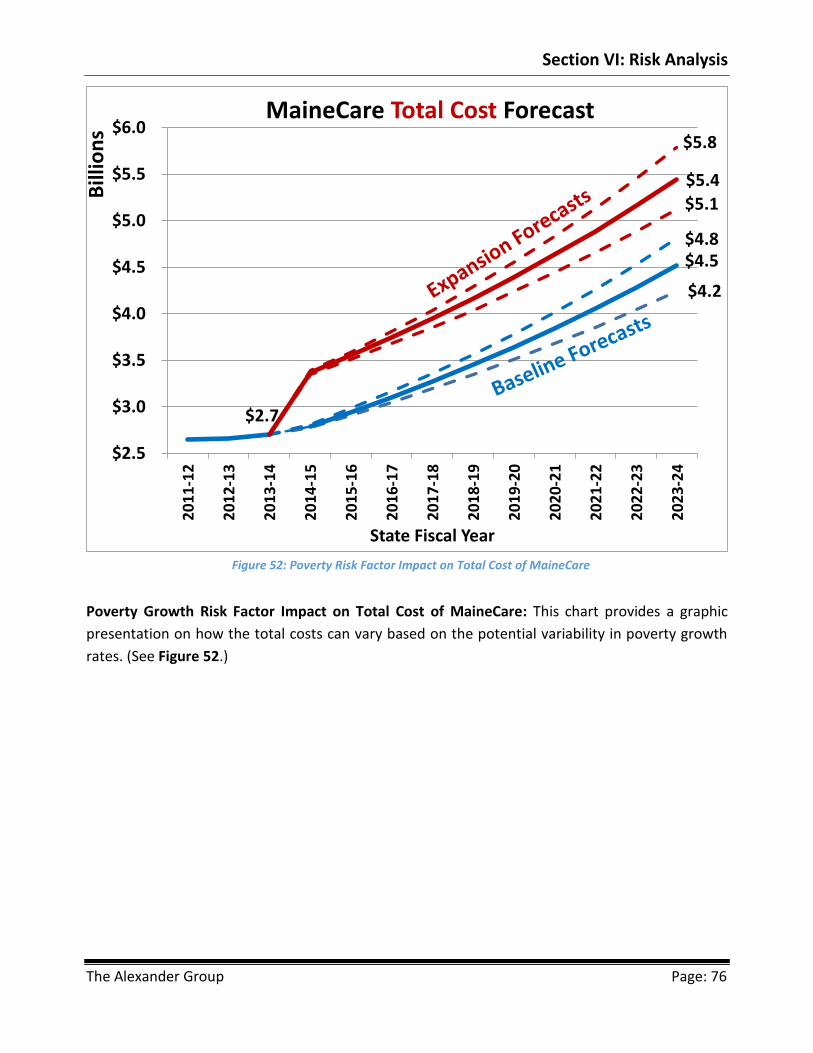
Section VI: Risk Analysis
The Alexander Group Page: 76
Poverty Growth Risk Factor Impact on Total Cost of MaineCare: This chart provides a graphic
presentation on how the total costs can vary based on the potential variability in poverty growth
rates. (See Figure 52.)
Figure 52: Poverty Risk Factor Impact on Total Cost of MaineCare
$4.2
$2.7
$4.5$4.8
$5.1
$5.4
$5.8
$2.5
$3.0
$3.5
$4.0
$4.5
$5.0
$5.5
$6.0
20
11
-12
20
12
-13
20
13
-14
20
14
-15
20
15
-16
20
16
-17
20
17
-18
20
18
-19
20
19
-20
20
20
-21
20
21
-22
20
22
-23
20
23
-24
Bill
ion
s
State Fiscal Year
MaineCare Total Cost Forecast

Section VI: Risk Analysis
The Alexander Group Page: 77
Poverty Growth Risk Factor Impact on Total Cost of Expansion Relative to the Baseline: This chart
provides a graphic presentation on how the total costs of the Expansion Scenario relative to the
Baseline can vary based on the potential variability in poverty growth rates. (See Figure 53.)
Figure 53: Poverty Risk Factor Impact on Total Cost of Expansion Relative to the Baseline
57
4.1
60
1.7
63
0.6
66
0.8
69
2.6
72
5.9
76
0.7
79
7.3
83
5.6
87
5.8
57
4.7
60
6.0
63
8.9
67
3.7
71
0.3
74
9.0
78
9.8
83
2.8
87
8.1
92
5.9
57
5.4
61
0.3
64
7.4
68
6.7
72
8.5
77
2.7
81
9.7
86
9.6 92
2.5 97
8.6
$0
$100
$200
$300
$400
$500
$600
$700
$800
$900
$1,000
$1,100
20
14
-15
20
15
-16
20
16
-17
20
17
-18
20
18
-19
20
19
-20
20
20
-21
20
21
-22
20
22
-23
20
23
-24
Mill
ion
s
State Fiscal Year
Estimated Total Cost of Expansion over Baseline
Low End Middle High End
Low End 10-Year Cost: $7.2 Billion
Middle Case 10-Year Cost: $7.4 Billion
High End 10-Year Cost: $7.6 Billion

Section VI: Risk Analysis
The Alexander Group Page: 78
Poverty Growth Risk Factor Impact on State Cost of Expansion relative to the Baseline: This chart
provides a graphic presentation on how the state costs of the Expansion Scenario relative to the
Baseline can vary based on the potential variability in poverty growth rates. (See Figure 54.)
Figure 54: Poverty Risk Factor Impact on State Cost of Expansion Relative to the Baseline
33
.2
30
.9
44
.0
64
.8 73
.6
89
.1 10
2.8
10
7.7
11
2.8
11
8.2
33
.5
31
.3
44
.8
66
.3 75
.7
92
.1 10
6.8
11
2.6
11
8.6
12
5.0
33
.7
31
.8
45
.6
67
.7 77
.7
95
.2
11
1.0
11
7.7
12
4.7 13
2.2
$-
$50
$100
$150
20
14
-15
20
15
-16
20
16
-17
20
17
-18
20
18
-19
20
19
-20
20
20
-21
20
21
-22
20
22
-23
20
23
-24
Mill
ion
s
State Fiscal Year
Estimated State Cost of Expansion over Baseline
Low End Middle High End
Low End 10-Year Cost: $777 Million
Middle Case 10-Year Cost: $807 Million
High End 10-Year Cost: $837 Million
Assumes Higher FMAP for Childless Adults under Waiver

Section VI: Risk Analysis
The Alexander Group Page: 79
PMPM Risk Factor
The second risk factor being considered is the PMPM growth
factor. The middle value was based on computations by the
USDHHS Office of the Actuary. The low-end value assumes
that costs would grow by a full percentage point below that
calculation. However, Maine’s fee reimbursement is one of
the lowest in the nation compared to private reimbursement
rates, which indicates there may be upward pressure to increase the rates. The high-end value is
based on historic inflation for medical services in New England states, as measured by the Consumer
Price Index. Figures 55, 56, and 57 summarize potential factors and results.
Middle
Result Result Difference % Result Difference %
Enrollment in SFY 2023-24 354,918 354,918 0 0.0% 354,918 0 0.0%
Percent of Population on
MaineCare in SFY 2023-2425.4% 25.4% 0.0% 25.4% 0.0%
10 Year Total Cost (Millions $) 35,896.5 33,870.9 (2,025.6) -5.6% 38,067.6 2,171.1 6.0%
10 Year State Cost (Millions $) 14,233.7 13,470.7 (763.0) -5.4% 15,051.5 817.8 5.7%
Enrollment in SFY 2023-24 478,979 478,979 0 0.0% 478,979 0 0.0%
Percent of Population on
MaineCare in SFY 2023-2434.3% 34.3% 0.0% 34.3% 0.0%
10 Year Total Cost (Millions $) 43,275.8 40,774.9 (2,500.9) -5.8% 45,956.2 2,680.4 6.2%
10 Year State Cost (Millions $) 15,040.4 14,221.1 (819.3) -5.4% 15,918.7 878.3 5.8%
Summary Box 2
Low End High EndScenario and Program Metric
Bas
elin
eEx
pan
sio
n
PMPM Risk Factor Changes to Assumed Middle Values
Increase % Increase % Increase %
Additional Enrollment in SFY 2023-24 124,061 35.0% 124,061 35.0% 124,061 35.0%
Additional % of Population on MaineCare in SFY 2023-24 8.9% 8.9% 8.9%
Additional 10 Year Total Cost (Millions $) 6,903.9 20.4% 7,379.2 20.6% 7,888.5 20.7%
Additional 10 Year State Cost (Millions $) 750.4 5.6% 806.7 5.7% 867 5.8%
Summary Box 3
Imp
act
to
Bas
elin
e
Expansion Impact of PMPM Risk FactorsLow End Middle High End
Scenario and Program Metric
Figure 56: PMPM Risk Factor to Assumed Middle Values
PMPM Growth Risk FactorLow End Middle High End
1.90% 2.90% 3.90%
Summary Box 1
Figure 55: PMPM Growth Risk Factor
Figure 57: Expansion Impact of PMPM Risk Factors

Section VI: Risk Analysis
The Alexander Group Page: 80
PMPM Risk Factor Impact on Total Cost of MaineCare: This chart provides a graphic presentation
on how the total costs can vary based on the potential variability in PMPM growth rates. (See Figure
58.)
Figure 58: PMPM Risk Factor Impact on Total Cost of MaineCare
$4.1
$2.7
$4.5
$5.0$4.9
$5.4
$6.0
$2.5
$3.0
$3.5
$4.0
$4.5
$5.0
$5.5
$6.0
20
11
-12
20
12
-13
20
13
-14
20
14
-15
20
15
-16
20
16
-17
20
17
-18
20
18
-19
20
19
-20
20
20
-21
20
21
-22
20
22
-23
20
23
-24
Bill
ion
s
State Fiscal Year
MaineCare Total Cost Forecast

Section VI: Risk Analysis
The Alexander Group Page: 81
PMPM Risk Factor Impact on Total Cost of Expansion Relative to the Baseline: This chart provides
a graphic presentation on how the total costs of the Expansion Scenario relative the Baseline can
vary based on the potential variability in PMPM growth rates. (See Figure 59.)
Figure 59: PMPM Risk Factor Impact on Total Cost of Expansion Relative to the Baseline
56
3.8
58
8.7
61
4.8
64
2.0
67
0.4
70
0.1
73
1.1
76
3.4
79
7.2
83
2.6
57
4.7
60
6.0
63
8.9
67
3.7
71
0.3
74
9.0
78
9.8
83
2.8
87
8.1
92
5.9
58
5.8
62
3.6
66
3.8
70
6.7
75
2.3
80
0.9
85
2.6 90
7.7 96
6.3
1,0
28
.8
$0
$100
$200
$300
$400
$500
$600
$700
$800
$900
$1,000
$1,100
20
14
-15
20
15
-16
20
16
-17
20
17
-18
20
18
-19
20
19
-20
20
20
-21
20
21
-22
20
22
-23
20
23
-24
Mill
ion
s
State Fiscal Year
Estimated Total Cost of Expansion over Baseline
Low End Middle High End
Low End 10-Year Cost: $6.9 Billion
Middle Case 10-Year Cost: $7.4 Billion
High End 10-Year Cost: $7.9 Billion

Section VI: Risk Analysis
The Alexander Group Page: 82
PMPM Risk Factor Impact on State Cost of Expansion Relative to the Baseline: This chart provides
a graphic presentation on how the state costs of the Expansion Scenario relative to the Baseline can
vary based on the potential variability in PMPM growth rates. (See Figure 60).
Figure 60: PMPM Risk Factor Impact on State Cost of Expansion Relative to the Baseline
32
.8
30
.4
43
.1
63
.2 71
.5
86
.2
99
.1
10
3.4
10
7.9
11
2.6
33
.5
31
.3
44
.8
66
.3 75
.7
92
.1 10
6.8
11
2.6
11
8.6
12
5.0
34
.1
32
.2
46
.6
69
.4 80
.0
98
.3
11
5.2
12
2.5 13
0.3 13
8.6
$-
$50
$100
$150
20
14
-15
20
15
-16
20
16
-17
20
17
-18
20
18
-19
20
19
-20
20
20
-21
20
21
-22
20
22
-23
20
23
-24
Mill
ion
s
State Fiscal Year
Estimated State Cost of Expansion over Baseline
Low End Middle High End
Low End 10-Year Cost: $750 Million
Middle Case 10-Year Cost: $807 Million
High End 10-Year Cost: $867 Million
Assumes Higher FMAP for Childless Adults under Waiver

Section VI: Risk Analysis
The Alexander Group Page: 83
Private Drop Risk Factor
The third risk factor considered is the
number of persons with incomes below the
ACA thresholds currently covered by health
insurance who would become eligible for
MaineCare if they would lose or voluntarily
drop their private healthcare coverage. The
percentages in Figure 61 are the factors used
to determine the number of those persons who would ultimately sign up for MaineCare. The
methodology for how these factors were chosen is discussed in more detail in Appendix B. Figures
62, and 63 summarize potential factors and results.
Middle
Result Result Difference % Result Difference %
Enrollment in SFY 2023-24 354,918 354,918 0 0.0% 354,918 0 0.0%
Percent of Population on
MaineCare in SFY 2023-2425.4% 25.4% 0.0% 25.4% 0.0%
10 Year Total Cost (Millions $) 35,896.5 35,896.5 - 0.0% 35,896.5 - 0.0%
10 Year State Cost (Millions $) 14,233.7 14,233.7 - 0.0% 14,233.7 - 0.0%
Enrollment in SFY 2023-24 478,979 470,917 -8,062 -1.7% 499,113 20,133 4.2%
Percent of Population on
MaineCare in SFY 2023-2434.3% 33.7% -0.6% 35.7% 1.4%
10 Year Total Cost (Millions $) 43,275.8 42,794.9 (480.8) -1.1% 44,419.9 1,144.1 2.6%
10 Year State Cost (Millions $) 15,040.4 14,997.3 (43.1) -0.3% 15,153.4 113.0 0.8%
Summary Box 2
Low End High EndScenario and Program Metric
Bas
elin
eEx
pan
sio
n
Private Drop Risk Factor Changes to Assumed Middle Values
Figure 63: Expansion Impact of Private Drop Risk Factors
Figure 61: Dropped Private Insurance Risk Factor
Coverage Type Low End Middle High EndNon-group 24.0% 30.8% 54.0%
Employer-based 80.2% 95.0% 98.0%
Dropped Private Insurance Risk Factor
Summary Box 1
Figure 62: Private Drop Risk Factor Changes to Assumed Middle Values
Increase % Increase % Increase %
Additional Enrollment in SFY 2023-24 115,999 32.7% 124,061 35.0% 144,194 40.6%
Additional % of Population on MaineCare in SFY 2023-24 8.3% 8.9% 10.3%
Additional 10 Year Total Cost (Millions $) 6,898.4 19.2% 7,379.2 20.6% 8,523.4 23.7%
Additional 10 Year State Cost (Millions $) 763.6 5.4% 806.7 5.7% 920 6.5%
Imp
act
to
Bas
elin
e
Expansion Impact of Private Drop Risk FactorsLow End Middle High End
Scenario and Program Metric
Summary Box 3
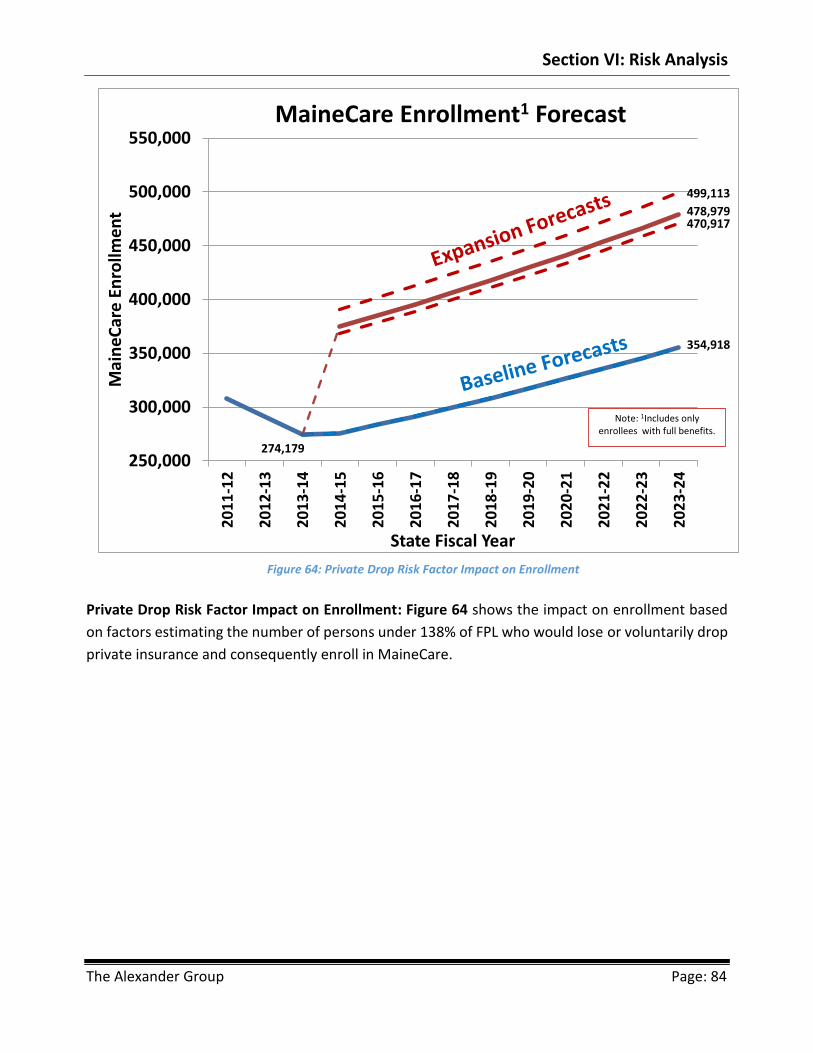
Section VI: Risk Analysis
The Alexander Group Page: 84
Private Drop Risk Factor Impact on Enrollment: Figure 64 shows the impact on enrollment based
on factors estimating the number of persons under 138% of FPL who would lose or voluntarily drop
private insurance and consequently enroll in MaineCare.
Figure 64: Private Drop Risk Factor Impact on Enrollment
354,918
274,179
478,979
325,384
354,918
470,917
499,113
250,000
300,000
350,000
400,000
450,000
500,000
550,000
20
11
-12
20
12
-13
20
13
-14
20
14
-15
20
15
-16
20
16
-17
20
17
-18
20
18
-19
20
19
-20
20
20
-21
20
21
-22
20
22
-23
20
23
-24
Mai
ne
Car
e E
nro
llme
nt
State Fiscal Year
MaineCare Enrollment1 Forecast
Note: 1Includes only enrollees with full benefits.

Section VI: Risk Analysis
The Alexander Group Page: 85
Private Drop Risk Factor Impact on MaineCare as a Percent of State Population: Figure 65 shows
the impact on the percent of persons enrolled in MaineCare as a percentage of the overall
population based on factors estimating the number of persons under 138% of FPL who would lose
or voluntarily drop private insurance and consequently enroll in MaineCare.
Figure 65: Private Drop Risk Factor Impact on MaineCare as a Percent of State Population
27.6%
33.7%
21.5%
28.1%
34.3%
29.3%
35.7%
0.0%
5.0%
10.0%
15.0%
20.0%
25.0%
30.0%
35.0%
40.0%
2012-13 Actual 2015-16 Forecast 2023-24 Forecast
MaineCare1 As Percent of State Population
Low End Middle High EndNote: 1Includes only
enrollees with full benefits.

Section VI: Risk Analysis
The Alexander Group Page: 86
Private Drop Risk Factor Impact on Total Cost of MaineCare Relative to the Baseline: This chart
shows how total costs of the Expansion Scenario relative to the Baseline can vary based on the
potential variability in the private drop rates. (See Figure 68.)
Figure 66: Private Drop Risk Factor Impact on Total Cost of MaineCare Relative to the Baseline
53
7.4
56
6.6
59
7.4
62
9.9
66
4.1
70
0.2
73
8.3
77
8.4
82
0.8
86
5.4
57
4.7
60
6.0
63
8.9
67
3.7
71
0.3
74
9.0
78
9.8
83
2.8
87
8.1
92
5.9
66
3.4
69
9.6
73
7.7
77
8.0
82
0.4
86
5.1
91
2.3
96
2.1
1,0
14
.6
1,0
70
.0
$0
$100
$200
$300
$400
$500
$600
$700
$800
$900
$1,000
$1,100
$1,200
20
14
-15
20
15
-16
20
16
-17
20
17
-18
20
18
-19
20
19
-20
20
20
-21
20
21
-22
20
22
-23
20
23
-24
Mill
ion
s
State Fiscal Year
Estimated Total Cost of Expansion over Baseline
Low End Middle High End
Low End 10-Year Cost: $6.9 Billion
Middle Case 10-Year Cost: $7.4 Billion
High End 10-Year Cost: $8.5 Billion

Section VI: Risk Analysis
The Alexander Group Page: 87
Private Drop Risk Factor Impact on State Cost of Expansion Relative to the Baseline: Figure 67
shows the impact on the state cost of the Expansion Scenario relative to the Baseline based on the
number of persons under 138% of FPL who would lose or voluntarily drop private insurance and
subsequently enroll in MaineCare.
Figure 67: Private Drop Risk Factor Impact on State Cost of Expansion Relative to Baseline
31
.5
29
.9
42
.7
62
.9 71
.8
87
.2 10
1.0
10
6.4
11
2.1
11
8.1
33
.5
31
.3
44
.8
66
.3 75
.7
92
.1 10
6.8
11
2.6
11
8.6
12
5.0
40
.1
36
.1
51
.0
75
.2 85
.9
10
4.7
12
1.5
12
8.0
13
4.9
14
2.2
$-
$50
$100
$150
20
14
-15
20
15
-16
20
16
-17
20
17
-18
20
18
-19
20
19
-20
20
20
-21
20
21
-22
20
22
-23
20
23
-24
Mill
ion
s
State Fiscal Year
Estimated State Cost of Expansion over Baseline
Low End Middle High End
Low End 10-Year Cost: $764 Million
Middle Case 10-Year Cost: $807 Million
High End 10-Year Cost: $920 Million
Assumes Higher FMAP for Childless Adults under Waiver

Section VI: Risk Analysis
The Alexander Group Page: 88
FMAP Risk Factor
FMAP continues to be a risk factor. The low-end
values assume that beginning in SFY 2016-17
Maine would receive the highest regular FMAP
rate Maine had received in the past twenty years
plus the enhanced FMAP rates per the ACA. The
high-end value assumes that the fiscal crisis of
the federal government causes Congress to cap
FMAP rates beginning in SFY 2016-17 to be
equivalent to Maine’s current regular FMAP across all groups, thus negating any enhanced rates.
Figures 68, 69, and 70 summarize potential factors and results.
Middle
Result Result Difference % Result Difference %
Enrollment in SFY 2023-24 354,918 354,918 0 0.0% 354,918 0 0.0%
Percent of Population on
MaineCare in SFY 2023-2425.4% 25.4% 0.0% 25.4% 0.0%
10 Year Total Cost (Millions $) 35,896.5 35,896.5 - 0.0% 35,896.5 - 0.0%
10 Year State Cost (Millions $) 14,233.7 12,952.0 (1,281.8) -9.0% 14,443.0 209.2 1.5%
Enrollment in SFY 2023-24 478,979 478,979 0 0.0% 478,979 0 0.0%
Percent of Population on
MaineCare in SFY 2023-2434.3% 34.3% 0.0% 34.3% 0.0%
10 Year Total Cost (Millions $) 43,275.8 43,275.8 - 0.0% 43,275.8 - 0.0%
10 Year State Cost (Millions $) 15,040.4 13,717.7 (1,322.7) -8.8% 16,891.1 1,850.7 12.3%
Summary Box 2
Low End High EndScenario and Program Metric
Bas
elin
eEx
pan
sio
n
FMAP Risk Factor Changes to Assumed Middle Values
Figure 70: Expansion Impact of FMAP Risk Factors
Figure 68: FMAP Risk Factors
FMAP Category Low End Middle High EndRegular 66.58% 61.55% 61.55%
CHIP 96.09% 96.09% 61.55%
Enhanced 90.00% 90.00% 61.55%
FMAP Risk Factor
Rates in the Out Years
Summary Box 1
Figure 69: FMAP Risk Factor Changes to Assumed of Middle Values
Increase % Increase % Increase %
Additional Enrollment in SFY 2023-24 124,061 35.0% 124,061 35.0% 124,061 35.0%
Additional % of Population on MaineCare in SFY 2023-24 8.9% 8.9% 8.9%
Additional 10 Year Total Cost (Millions $) 7,379.2 20.6% 7,379.2 20.6% 7,379.2 20.6%
Additional 10 Year State Cost (Millions $) 765.7 5.9% 806.7 5.7% 2,448 17.0%
Imp
act
to
Bas
elin
e
Expansion Impact of FMAP Risk FactorsLow End Middle High End
Scenario and Program Metric
Summary Box 3

Section VI: Risk Analysis
The Alexander Group Page: 89
FMAP Risk Factor Impact on State Cost of Expansion Relative to the Baseline: Figure 71 summarizes
the state cost based on the FMAP risks.
Figure 71: FMAP Risk Factor Impact on State Cost of Expansion Relative to the Baseline
33
.5
31
.3
40
.9 61
.7
70
.9 87
.1
10
1.6
10
7.0
11
2.8
11
8.9
33
.5
31
.3
44
.8 66
.3 75
.7 92
.1
10
6.8
11
2.6
11
8.6
12
5.0
33
.5
31
.3
24
5.7
25
9.0
27
3.1
28
8.0
30
3.7
32
0.2
33
7.6
35
6.0
$-
$50
$100
$150
$200
$250
$300
$350
$400
20
14
-15
20
15
-16
20
16
-17
20
17
-18
20
18
-19
20
19
-20
20
20
-21
20
21
-22
20
22
-23
20
23
-24
Mill
ion
s
State Fiscal Year
Estimated State Cost of Expansion over Baseline
Low End Middle High End
Low End 10-Year Cost: $766 Million
Middle Case 10-Year Cost: $807 Million
High End 10-Year Cost: $2.4 Billion
Assumes Higher FMAP for Childless Adults under Waiver

Section VI: Risk Analysis
The Alexander Group Page: 90
Best Case / Worst Case Scenarios
The best case scenario and worst case scenario
assume that three of the four risk factors occur for
each the low-end and high-end scenarios. Figure 72
summarizes the risk factors assumed by these
scenarios. Figures 73 and 74 summarize potential
factors and results.
The best case scenario assumes the following three
risk factors: the poverty rate does not grow as rapidly as expected, the PMPM cost rises more slowly,
and a smaller number of persons currently covered by private health insurance with incomes at or
below 138% of FPL will lose their health coverage. The worst case scenario assumes the following
three risk factors: PMPM costs rise more sharply, FMAP rates are reduced more drastically than
anticipated, and a smaller number of persons currently covered by private health insurance with
incomes at or below 138% of FPL will lose their health coverage.
Middle
Result Result Difference % Result Difference %
Enrollment in SFY 2023-24 354,918 330,757 -24,161 -6.8% 354,918 0 0.0%
Percent of Population on
MaineCare in SFY 2023-2425.4% 23.7% -1.7% 25.4% 0.0%
10 Year Total Cost (Millions $) 35,896.5 32,673.8 (3,222.7) -9.0% 38,067.6 2,171.1 6.0%
10 Year State Cost (Millions $) 14,233.7 13,019.3 (1,214.5) -8.5% 15,277.1 1,043.4 7.3%
Enrollment in SFY 2023-24 478,979 440,283 -38,696 -8.1% 499,113 20,133 4.2%
Percent of Population on
MaineCare in SFY 2023-2434.3% 31.5% -2.8% 35.7% 1.4%
10 Year Total Cost (Millions $) 43,275.8 38,935.2 (4,340.6) -10.0% 47,180.2 3,904.4 9.0%
10 Year State Cost (Millions $) 15,040.4 13,704.0 (1,336.5) -8.9% 18,322.1 3,281.7 21.8%
Summary Box 2
Low End High EndScenario and Program Metric
Bas
elin
eEx
pan
sio
n
Best Case / Worst Case Scenarios Risk Factor Changes to Assumed Middle Values
Increase % Increase % Increase %
Additional Enrollment in SFY 2023-24 109,526 33.1% 124,061 35.0% 144,194 40.6%
Additional % of Population on MaineCare in SFY 2023-24 7.8% 8.9% 10.3%
Additional 10 Year Total Cost (Millions $) 6,261.4 19.2% 7,379.2 20.6% 9,112.6 23.9%
Additional 10 Year State Cost (Millions $) 684.7 5.3% 806.7 5.7% 3,045 19.9%
Summary Box 3
Imp
act
to
Bas
elin
e
Expansion Impact of Best Case / Worst Case Scenarios Risk FactorsLow End Middle High End
Scenario and Program Metric
Figure 72: Best and Worst Case Scenarios
Risk Factor Best Case Worst CasePoverty Growth Considered Least Likely
PMPM Considered Considered
Private Drop Considered Considered
FMAP Least Likely Considered
Best Case/Worst Case Scenarios
Three out of Four Come True
Summary Box 1
Figure 74: Expansion Impact of Best Case and Worst Case Risk Factors
Figure 73: Best and Worst Case Risk Factor Changes to Assumed Middle Values

Section VI: Risk Analysis
The Alexander Group Page: 91
Best Case / Worst Case Risk Factor Impact on Enrollment: Figure 75 shows how MaineCare
enrollment would change under the best case and worst case scenarios.
Figure 75: Best Case / Worst Case Risk Factor Impact on Enrollment
354,918
274,179
478,979
330,757
354,918
440,283
499,113
250,000
300,000
350,000
400,000
450,000
500,000
550,000
20
11
-12
20
12
-13
20
13
-14
20
14
-15
20
15
-16
20
16
-17
20
17
-18
20
18
-19
20
19
-20
20
20
-21
20
21
-22
20
22
-23
20
23
-24
Mai
ne
Car
e E
nro
llme
nt
State Fiscal Year
MaineCare Enrollment1 Forecast
Note: 1Includes only enrollees with full benefits.

Section VI: Risk Analysis
The Alexander Group Page: 92
Best Case / Worst Case Risk Factor Impact on MaineCare as a Percent of State Population: Figure
76 shows how MaineCare enrollment as a percent of the overall population would change under
the best case and worst case scenarios. In the best case scenario, 31.5% of the population would be
on MaineCare by SFY 2023-24. In the worst case scenario, it would be 35.7%
Figure 76: Best Case / Worst Case Risk Factor Impact on MaineCare as a Percent of State Population
27.3%
31.5%
21.5%
28.1%
34.3%
29.3%
35.7%
0.0%
5.0%
10.0%
15.0%
20.0%
25.0%
30.0%
35.0%
40.0%
2012-13 Actual 2015-16 Forecast 2023-24 Forecast
MaineCare1 As Percent of State Population
Low End Middle High EndNote: 1Includes only
enrollees with full benefits.

Section VI: Risk Analysis
The Alexander Group Page: 93
Best Case / Worst Case Risk Factor Impact on Total Costs of MaineCare: This chart provides a
graphic presentation on how the total cost can vary under the best case and worst case scenarios.
(See Figure 77.)
Figure 77: Best Case / Worst Case Risk Factor Impact on Total Costs of MaineCare
$3.9
$2.7
$4.5
$5.0
$4.6
$5.4
$6.2
$2.5
$3.0
$3.5
$4.0
$4.5
$5.0
$5.5
$6.0
$6.5
20
11
-12
20
12
-13
20
13
-14
20
14
-15
20
15
-16
20
16
-17
20
17
-18
20
18
-19
20
19
-20
20
20
-21
20
21
-22
20
22
-23
20
23
-24
Bill
ion
s
State Fiscal Year
MaineCare Total Cost Forecast

Section VI: Risk Analysis
The Alexander Group Page: 94
Best Case / Worst Case Risk Factor Impact on Total Cost of Expansion Relative to the Baseline:
Figure 78 shows how total cost for MaineCare would change due to the Expansion Scenario relative
to the Baseline under the best case and worst case scenarios.
Figure 78: Best Case / Worst Case Risk Factor Impact on Total Cost of Expansion Relative to the Baseline
52
6.5
54
6.5
56
7.2
58
8.8
61
1.1
63
4.3
65
8.3
68
3.3
70
9.2
73
6.1
57
4.7
60
6.0
63
8.9
67
3.7
71
0.3
74
9.0
78
9.8
83
2.8
87
8.1
92
5.9
67
6.3
72
0.0
76
6.5
81
6.1
86
8.9
92
5.1
98
5.0
1,0
48
.8
1,1
16
.7
1,1
89
.1
$0
$100
$200
$300
$400
$500
$600
$700
$800
$900
$1,000
$1,100
$1,200
$1,300
20
14
-15
20
15
-16
20
16
-17
20
17
-18
20
18
-19
20
19
-20
20
20
-21
20
21
-22
20
22
-23
20
23
-24
Mill
ion
s
State Fiscal Year
Estimated Total Cost of Expansion over Baseline
Low End Middle High End
Low End 10-Year Cost: $6.3 Billion
Middle Case 10-Year Cost: $7.4 Billion
High End 10-Year Cost: $9.1 Billion

Section VI: Risk Analysis
The Alexander Group Page: 95
Best Case / Worst Case Risk Factor Impact on State Cost of Expansion Relative to the Baseline: Figure 79 shows how state costs of MaineCare under the Expansion Scenario relative to the Baseline would change under the best case and worst case scenarios. As can be seen they are radically different. Under the best case scenario, Maine still has a cost of $685 million over ten years. Under the worst case scenario, the cost would be $3.0 billion over ten years.
30
.7
28
.6
40
.3
58
.8
66
.0 79
.0
90
.1
93
.5
97
.0
10
0.6
33
.5
31
.3
44
.8
66
.3
75
.7 92
.1
10
6.8
11
2.6
11
8.6
12
5.0
40
.9
37
.2
29
4.7
31
3.8
33
4.1
35
5.7
37
8.7 40
3.3 42
9.4 45
7.2
$-
$50
$100
$150
$200
$250
$300
$350
$400
$450
$500
20
14
-15
20
15
-16
20
16
-17
20
17
-18
20
18
-19
20
19
-20
20
20
-21
20
21
-22
20
22
-23
20
23
-24
Mill
ion
s
State Fiscal Year
Estimated State Cost of Expansion over Baseline
Low End Middle High End
Low End 10-Year Cost: $685 Million
Middle Case 10-Year Cost: $807 Million
High End 10-Year Cost: $3.0 Billion
Assumes Higher FMAP for Childless Adults under Waiver
Figure 79: Best Case / Worst Case Risk Factor Impact on State Cost of Expansion Relative to the Baseline

Section VI: Risk Analysis
The Alexander Group Page: 96
This Page Intentionally Left Blank

Section VII: Conclusion and Next Steps
The Alexander Group Page: 97
Section VII: Conclusion and Next Steps
As this report reveals, expanding the Medicaid program in Maine involves fiscal, operational, and
qualitative issues. The AG Financial Model demonstrates that it will be challenging for Maine to
afford MaineCare in the future even without expansion. Given current trends, MaineCare will
comprise larger shares of Maine’s General Fund budgets, which will grow from 24.2% of the General
Fund budget to 35.0% in ten years. The state’s poverty growth rate is one causal factor driving the
difference between the state cost for MaineCare and the rest-of-the-state budget. Expanding
eligibility will only exacerbate the trend, whereby MaineCare will comprise 37.4% of the General
Fund budget in ten years.
In addition, the risk analysis in Section VI shows that in the best-case scenario, i.e., if three out of
four determining factors turn out to be more favorable than predicted, expansion of Medicaid
eligibility would still cost Maine in state funds at least $685 million over the next ten years on top of
the cost of the Baseline. In total funds (all state and federal funds), the best-case scenario for
expansion would have a ten-year cost of $6.3 billion. However, the worst-case scenario, i.e., if three
out of four determining factors turn out to be less favorable than predicted, would cost the state
$3.0 billion over the next ten years on top of the cost of the Baseline. In total funds, the worst-case
scenario for expansion would have a ten-year cost of $9.1 billion.
The qualitative issues are no less challenging. Consistent with national Medicaid trends,
performance measures indicate that the quality of care provided by MaineCare does not match
what is available elsewhere, including commercially available insurance. Expanding MaineCare does
not address any of these quality-of-care issues; moreover, expansion may leave those losing
commercial coverage with no other choice but to enroll in MaineCare. Expansion will also divert
resources from addressing serious program-integrity issues to protect the program against waste,
abuse, and fraud. Finally, expansion will allow those less vulnerable to access comprehensive care
while doing nothing to alleviate MaineCare's current challenge to eradicate the waiting lists for the
intellectually disabled and elderly populations.
The more pressing needs are restructuring and streamlining to make MaineCare more efficient and
to deliver better quality outcomes. As in most states, over time, the system has been so expanded
and changed in a piecemeal manner that it has become uncoordinated, difficult for many to
navigate, lacking in key program-integrity safeguards, and exhibiting cost factors that exceed the
growth of the rest of the General Fund budget. Expanding MaineCare at the current time will likely
divert resources away from reform efforts necessary to address these pressing issues and to
improve the program.

Section VII: Conclusion and Next Steps
The Alexander Group Page: 98
Health-care access and improved health outcomes remain a necessity. Expansion of Medicaid at the
present time however, may not be the best policy choice to attain those goals. Other viable
alternatives may allow Maine to improve access and quality while prioritizing needs and saving tax
dollars. Consequently, Maine needs a state-based solution with flexibility from the federal
government that focuses on access, transparency, quality, personal responsibility, and efficiency.
That kind of alternative would likely offer executive and legislative policymakers greater budgetary
certainty and allow them to focus on other fiscal and policy priorities.
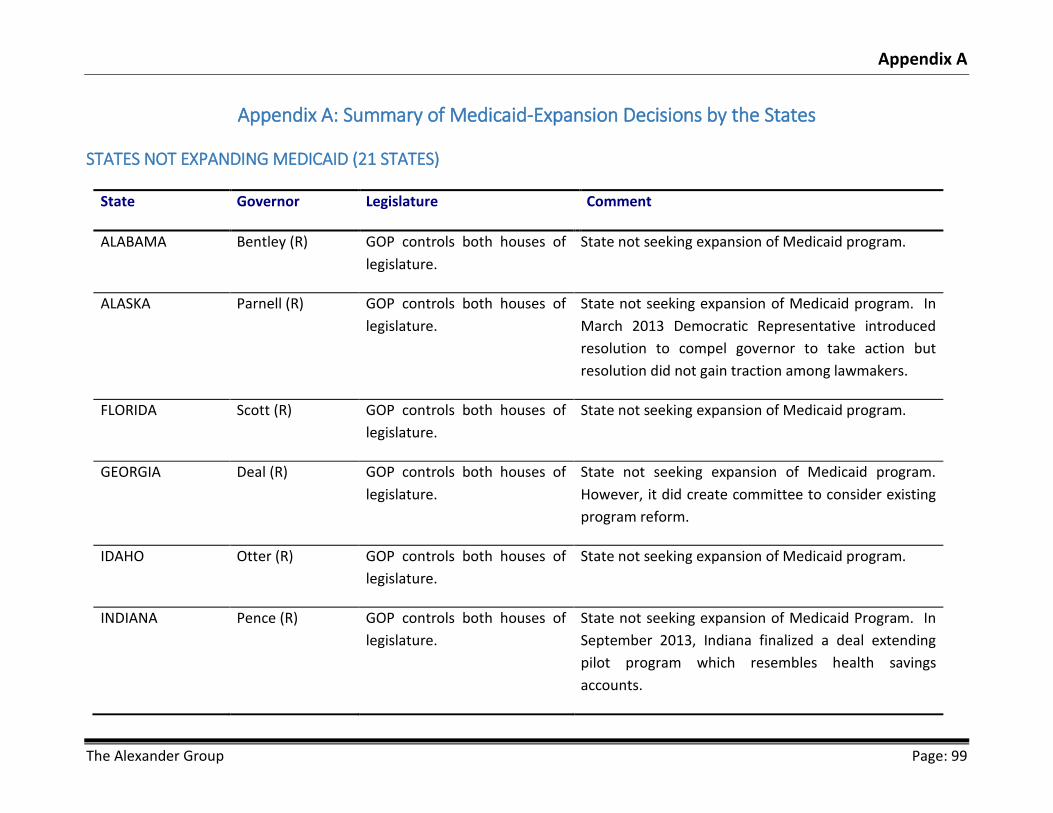
Appendix A
The Alexander Group Page: 99
Appendix A: Summary of Medicaid-Expansion Decisions by the States
STATES NOT EXPANDING MEDICAID (21 STATES)
State Governor Legislature Comment
ALABAMA Bentley (R) GOP controls both houses of
legislature.
State not seeking expansion of Medicaid program.
ALASKA Parnell (R) GOP controls both houses of
legislature.
State not seeking expansion of Medicaid program. In
March 2013 Democratic Representative introduced
resolution to compel governor to take action but
resolution did not gain traction among lawmakers.
FLORIDA Scott (R) GOP controls both houses of
legislature.
State not seeking expansion of Medicaid program.
GEORGIA Deal (R) GOP controls both houses of
legislature.
State not seeking expansion of Medicaid program.
However, it did create committee to consider existing
program reform.
IDAHO Otter (R) GOP controls both houses of
legislature.
State not seeking expansion of Medicaid program.
INDIANA Pence (R) GOP controls both houses of
legislature.
State not seeking expansion of Medicaid Program. In
September 2013, Indiana finalized a deal extending
pilot program which resembles health savings
accounts.
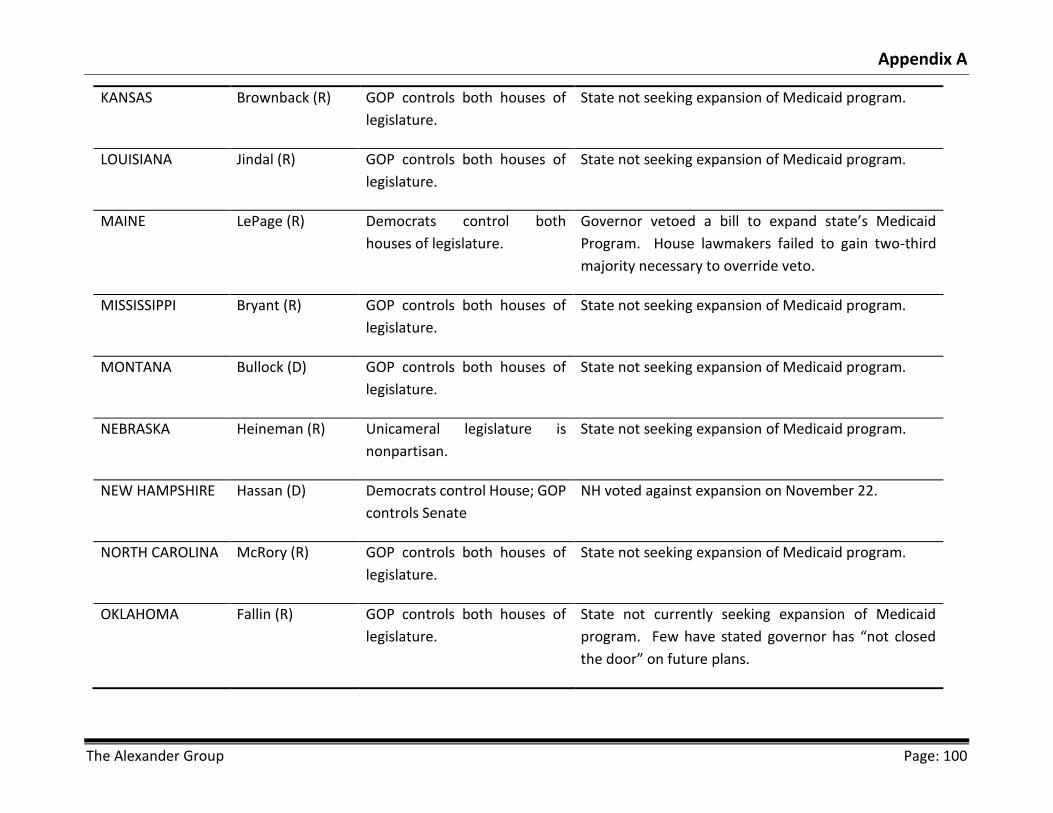
Appendix A
The Alexander Group Page: 100
KANSAS Brownback (R) GOP controls both houses of
legislature.
State not seeking expansion of Medicaid program.
LOUISIANA Jindal (R) GOP controls both houses of
legislature.
State not seeking expansion of Medicaid program.
MAINE LePage (R) Democrats control both
houses of legislature.
Governor vetoed a bill to expand state’s Medicaid
Program. House lawmakers failed to gain two-third
majority necessary to override veto.
MISSISSIPPI Bryant (R) GOP controls both houses of
legislature.
State not seeking expansion of Medicaid program.
MONTANA Bullock (D) GOP controls both houses of
legislature.
State not seeking expansion of Medicaid program.
NEBRASKA Heineman (R) Unicameral legislature is
nonpartisan.
State not seeking expansion of Medicaid program.
NEW HAMPSHIRE Hassan (D) Democrats control House; GOP
controls Senate
NH voted against expansion on November 22.
NORTH CAROLINA McRory (R) GOP controls both houses of
legislature.
State not seeking expansion of Medicaid program.
OKLAHOMA Fallin (R) GOP controls both houses of
legislature.
State not currently seeking expansion of Medicaid
program. Few have stated governor has “not closed
the door” on future plans.

Appendix A
The Alexander Group Page: 101
SOUTH CAROLINA Haley (R) GOP controls both houses of
legislature.
State not seeking expansion of Medicaid program.
State has allocated eighty million to hospital incentive
payment program.
SOUTH DAKOTA Daugaard (R) GOP controls both houses of
legislature.
State not currently seeking expansion of Medicaid
program.
TENNESSEE Haslam (R) GOP controls both houses of
legislature.
State not currently seeking expansion of Medicaid
program.
TEXAS Perry (R) GOP controls both houses of
legislature.
State not seeking expansion of Medicaid program.
VIRGINIA McDonnell (R) GOP controls house; makeup
of Senate for 2014 is unclear.
Governor-elect McAuliffe (D) supports expansion.
However, General Assembly is listed in opposition to
seeking expansion of Medicaid program...
WISCONSIN Walker (R) GOP controls both houses of
legislature.
State not seeking expansion of Medicaid program.
WYOMING Mead (R) GOP controls both houses of
legislature.
State not seeking expansion of Medicaid program.
STATES CONSIDERING EXPANSION (4 STATES)
State Governor Legislature Comment
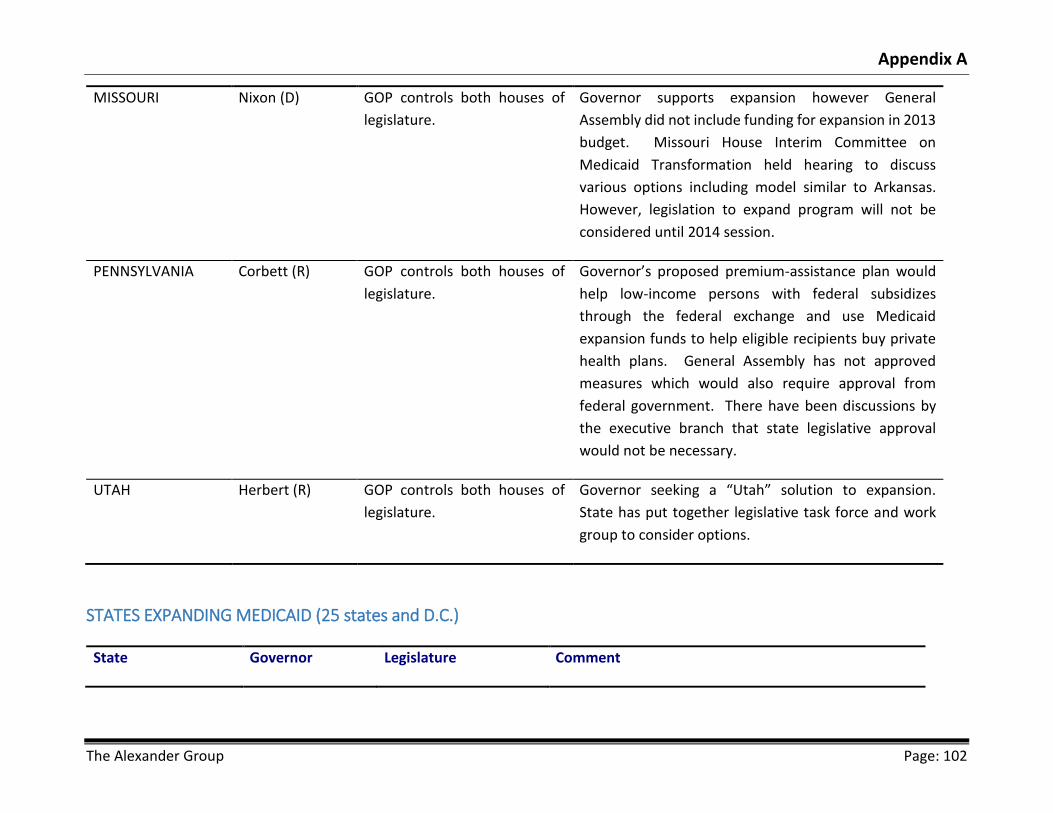
Appendix A
The Alexander Group Page: 102
MISSOURI Nixon (D) GOP controls both houses of
legislature.
Governor supports expansion however General
Assembly did not include funding for expansion in 2013
budget. Missouri House Interim Committee on
Medicaid Transformation held hearing to discuss
various options including model similar to Arkansas.
However, legislation to expand program will not be
considered until 2014 session.
PENNSYLVANIA Corbett (R) GOP controls both houses of
legislature.
Governor’s proposed premium-assistance plan would
help low-income persons with federal subsidizes
through the federal exchange and use Medicaid
expansion funds to help eligible recipients buy private
health plans. General Assembly has not approved
measures which would also require approval from
federal government. There have been discussions by
the executive branch that state legislative approval
would not be necessary.
UTAH Herbert (R) GOP controls both houses of
legislature.
Governor seeking a “Utah” solution to expansion.
State has put together legislative task force and work
group to consider options.
STATES EXPANDING MEDICAID (25 states and D.C.)
State Governor Legislature Comment

Appendix A
The Alexander Group Page: 103
ARIZONA Brewer (R) GOP controls both
houses of legislature.
Signed into law during Special session June 2013, plan to
cover approximately 300,000 eligible residents.
ARKANSAS Beebe (D) GOP controls both
houses of legislature.
Using Medicaid expansion money to purchase private
insurance for about 250,000 eligible residents.
CALIFORNIA Brown (D) Democrats control both
houses of legislature.
Signed into law June 2013, plan to cover approximately
1.4 million residents under states Medi-Cal program.
COLORADO Hickenlooper (D) Democrats control both
houses of legislature.
Signed into law May 2013, plan to cover an additional
160,000 adults.
CONNECTICUT Malloy (D) Democrats control both
houses of legislature.
One of five states that opted to expand early
DELAWARE Markell (D) Democrats control both
houses of legislature.
Approved 29.8 million in July 2013 to “fund the State’s
Medicaid commitment.”
D.C. Gray (D) Democrats control city
council.
Sought permission from federal government to expand
Medicaid to additional 35,000 residents.
HAWAII Abercrombie (D) Democrats control both
houses of legislature.
ILLINOIS Quinn (D) Democrats control both
houses of legislature.
Signed into law July 2013, plan to cover an additional
342,000 residents.
IOWA Branstad (R) GOP controls House;
Democrats control
Plan, which provides insurance subsidies, but not
Medicaid, to households between 101% and 138% of

Appendix A
The Alexander Group Page: 104
Senate. FPL, yet to be approved by feds.
KENTUCKY Beshear (D) Democrats control
House; GOP controls
Senate.
Sept. 3, 2013 federal judge ruled that the governor has
the authority to expand Medicaid and establish an
insurance exchange.
MARYLAND O’Malley (D) Democrats control both
houses of legislature.
Signed into law May 2013 bill to fully implement
Affordable Care Act.
MASSACHUSETTS Patrick (D) Democrats control both
houses of legislature.
July 2013, signed into law state SFY 2014 state budget
with support full implementation of affordable care act.
MICHIGAN Snyder (R) GOP controls both
houses of legislature.
Signed into law Sept. 2013 expansion of Medicaid
program beginning April 2014. Plan contains cost-
sharing provisions that require approval from federal
government.
MINNESOTA Dayton (D) Democrats control both
houses of legislature.
Signed into law February 2013 law expanding Medicaid
to approximately 35,000 childless, low-income adults.
NEVADA Sandoval (R) Democrats control both
houses of legislature.
December 2012 verbally committed to expanding
Medicaid to approximately 78,000 residents.
NEW JERSEY Christie (R) Democrats control both
houses of legislature.
Signed state budget that includes $227 million for
expansion but Governor vetoed legislation to make
expansion permanent.
NEW MEXICO Martinez (R) Democrats control both
houses of legislature.
Announced in January 2013 state would participate in
Medicaid expansion.

Appendix A
The Alexander Group Page: 105
NEW YORK Cuomo (D) Democrats control
House; GOP controls
Senate.
June 2012 announcement that state would participate in
expansion.
NORTH DAKOTA Dalrymple (R) GOP controls both
houses of legislature.
Signed legislation April 2013 expanding Medicaid in
state.
OHIO Kasich (R) GOP controls both
houses of legislature.
States Controlling board (special legislative panel)
approved 5-2 vote to expand. However, legislators have
pledged to mount legal campaign against expansion.
OREGON Kitzhaber (D) Democrats control both
houses of legislature.
State approved expansion up to 138% of FPL of all
residents.
RHODE ISLAND Chafee (I) Democrats control both
houses of legislature.
July 2013 signed fiscal year 2014 budget which included
plan to expand Medicaid.
VERMONT Shumlin (D) Democrats control both
houses of legislature.
State approved expansion plan to cover approximately
an additional 47,000 state residents.
WASHINGTON Inslee (D) Democrats control both
houses of legislature.
June 2013 signed state budget to expand Medicaid in
the state.
WEST VIRGINIA Tomblin (D) Democrats control both
houses of legislature.
May 2013 announced state would extend coverage to
approximately an additional 91,500 state residents.

Appendix A
The Alexander Group Page: 106
MEDICAID EXPANSION BY STATE PARTY CONTROL
Republican Governor Democratic Governor Independent
Not Expanding Alabama, Alaska, Florida, Georgia, Idaho,
Indiana, Kansas, Louisiana, Maine,
Mississippi, Nebraska, North Carolina,
Oklahoma, South Carolina, South Dakota,
Tennessee, Texas, Virginia, Wisconsin,
and Wyoming
Montana and New Hampshire
Considering
Expanding
Pennsylvania and Utah Missouri
Expanding Arizona, Iowa, Michigan, Nevada, New
Jersey, New Mexico, North Dakota, Ohio
Arkansas, California, Colorado,
Connecticut, Delaware, D.C., Hawaii,
Illinois, Kentucky, Maryland,
Massachusetts, Minnesota, New York,
Oregon, Vermont, Washington, and West
Virginia
Rhode Island
Republican Legislature Democratic Legislature Split Legislature or Other
Not Expanding Alabama, Alaska, Florida, Georgia,
Idaho, Indiana, Kansas, Louisiana,
Maine, Mississippi, Montana, North
Carolina, Oklahoma, South Carolina,
Maine Nebraska and New
Hampshire

Appendix A
The Alexander Group Page: 107
South Dakota, Tennessee, Texas,
Virginia, Wisconsin, and Wyoming
Considering
Expanding
Missouri, Pennsylvania, and Utah
Expanding Arizona, Arkansas, Michigan, North
Dakota, Ohio,
California, Colorado,
Connecticut, Delaware, D.C.,
Hawaii, Illinois, Maryland,
Massachusetts, Minnesota,
Nevada, New Jersey, New
Mexico, Oregon, Rhode Island,
Vermont, Washington, and West
Virginia
Iowa, Kentucky, and New
York
Sources: http://www.advisory.com/Daily-Briefing/Resources/Primers/MedicaidMap#lightbox/3/

Appendix A
The Alexander Group Page: 108
This Page Intentionally Left Blank
Appendix B
The Alexander Group Page: 109
Appendix B: Methodology, Assumptions, Data, and Other Technical
Information
Overview
The financial model used for this study was specifically developed and customized by The Alexander
Group for the State of Maine. Because each state is different, it is necessary to tailor a model to the
specific demographics of a state as well as the unique characteristics of its Medicaid program. No
two states are alike, and more generic models miss these nuances that produce less specific results.
There are numerous assumptions and data sources that were utilized in generating the Baseline and
Expansion scenarios. This appendix summarizes the more important ones.
Population Groups
For purposes of the financial model, only those enrollees with full membership were included. All
persons without full benefits, such as low-income Medicare buy-in groups who meet the criteria for
participation in Drugs for Elderly (DEL) program and/ or Maine Rx were excluded in the forecast.
The following populations groups were identified for use in the model:
Group A
Traditional MaineCare Major categories: o Aged
o Blind/Disabled
o Children with incomes up to 100% of FPL
o Parents with incomes up to 100% of FPL
o Pregnancy
o State only
o Other
Children on CHIP with incomes 101% to 138% of FPL
Children on CHIP with incomes 139% to 200% of FPL
Parents with incomes between 101% and 138% of FPL
Childless adults covered under the childless adult waiver
Foster children between the ages of 19 and 25
Group B
Children “woodwork effect”
Parents “woodwork effect”
Group C
Other childless adults not covered under the waiver with incomes up to 138% of FPL
Appendix B
The Alexander Group Page: 110
Group D
Children covered by private insurance with incomes up through 200% of FPL
Parents covered by private insurance with incomes up through 138% of FPL
Group A are those categories for which MDHHS was able to produce population data from internal
database systems.
Group B are the woodwork-effect populations. In these cases, population estimates were created
by multiplying 2011 Current Population Survey (CPS) data estimates issued by the U.S. Census
Bureau on the number of children and parents currently eligible for Medicaid but not enrolled with
take-up rates of 23.4% as published by the Kaiser Family Foundation for Health Policy Analysis.93
Group C are adults not on the childless adult waiver and with incomes up to 138% of FPL. This
estimate was derived by using data from the U.S. Census Bureau’s American Community Survey for
2012, multiplied by a take-up rate of 82% pursuant to a study for the Assistant Secretary for Planning
and Evaluation, USDHHS, by the RAND Corporation specifically on take-up rates for Medicaid
enrollment per the ACA.94
Group D are those persons who are currently covered by private insurance but would lose their
coverage due to the anticipated effect of employers dropping coverage, employers taking other
action encouraging low-wage employees to sign up for Medicaid as opposed to employer-provided
insurance, insurers cancelling policies due to requirements of the ACA, or other voluntary actions
by the policyholders. Estimates of children, childless adults, and parents at incomes below 138% of
FPL, in addition to children from 139% to 200% of FPL, were derived from CPS data, which were
further broken down into subcategories of those with employer health insurance coverage and non-
group coverage. The two different take-up rates applied were 95% for those with non-group
coverage and 30.8% for those with employer-based coverage. The assumption of 95% comes from
the USDHHS Office of the Actuary.95 The ACA was designed in a manner to increase insurance costs
for this segment of the population, which has the effect of making many of these policies illegal,
causing them to be withdrawn by insurers. It is likely that most of the childless adults in this category
would have their policies withdrawn and the replacement options made available to them will be
significantly more expensive. With the expansion of Medicaid, it would become the logical choice to
choose free coverage over non-group policies that will likely be out of their price range. Because
take-up rates never equal 100%, the model assumed the USDHHS assumption of 95% for the middle
93 John Holahan, Matthew Buettgens, Caitlin Carroll, and Stan Dorn, The Urban Institute, “The Cost and Coverage Implications of
the ACA Medicaid Expansion: National and State-by-State Analysis,” Sponsored and published by the Kaiser Commission on Medicaid and the Uninsured, November 2012
94 Ben Sommers, Rick Kronick, Kenneth Finegold, Rosa Po, Karyn Schwartz, and Sherry Glied, “Understanding Participation Rates in Medicaid: Implications for the Affordable Care Act,” ASPE Issue Brief, March 2012. Accessed at: http://aspe.hhs.gov/health/reports/2012/MedicaidTakeup/ib.shtml.
95 Idem.

Appendix B
The Alexander Group Page: 111
value. The RAND Corporation computation of 82% was used for the low-end risk analysis. 98% was
used the high-end risk analysis. The assumption of 30.8% comes from a published survey of
McKinsey & Company.96 The proprietary research that surveyed 1,329 employers in February 2011
assessed their attitudes and plans on the ACA. One of the many findings was that 24% of employers
with a low awareness of the ACA thought they might likely drop employee health coverage, 30.8%
of employers with medium awareness thought they likely might, and 54% of employers with a high
level of awareness thought they might likely drop. These values are used in the risk analysis In
Section VI of this report.
It is important to note that employers can easily deploy tactics other than dropping health insurance
coverage altogether to encourage their low-wage workers voluntarily drop coverage and sign up for
Medicaid. Employers with more than fifty employees are required under the ACA to offer health
insurance to its employees, and federal law97 requires them to have rational policies that do not
discriminate, therefore requiring them to offer health care to all employees if they offer it to some
employees of the same full-time or part-time status. However, by simply requiring employees to
make contributions to the cost of the premium, it can make the employer-based health insurance
significantly expensive to low income employees, especially when compared to Medicaid which has
no premium cost share.
Actuarial Growth Assumptions
The model used standard actuarial methodologies to
forecast population growth factors. Separate growth
factors were generated accounting for poverty by the
following age groups: under 18, 18-64, over 65, and an
overall growth factor. In addition, growth factors were
calculated for the total population. The low-end and high-
end values were calculated assuming a 25% variance.
The results of the actuarial growth factors were compared to historic MaineCare and poverty growth
between two similar points along the business cycle for comparability, and they were found to be
similar. Figure 80 shows the final change in population factors used.
PMPMs
The PMPMs were calculated for each category, using data for SFY 2012-13, and was provided by the
MDHHS Benefit Analytics team. Figure 81 shows the actual PMPMs per category.
96 McKinsey Quarterly., already cited.
97 See “Self-Compliance Tool for Part 7 of ERISA: HIPAA and Other Health Care-Related Provisions,” U.S. Department of Labor. http://www.dol.gov/ebsa/pdf/part7-1.pdf, accessed December 19, 2013.
Age Category Low End Middle High EndUnder 18 2.31% 3.08% 3.85%
18 to 64 1.86% 2.48% 3.10%
65 and over 2.71% 3.61% 4.51%
Total 2.09% 2.78% 3.48%
Population Growth Factors
Figure 80: Population Growth Factors

Appendix B
The Alexander Group Page: 112
Population groups without calculated PMPMs were matched
with the PMPMs of the closest population group that had a
calculated PMPM. For example, childless adults not covered by
the waiver were assumed to have the same PMPM as those
covered by the waiver.
PMPM Growth Factors
Projecting the growth rate for PMPMs is complex because so
many factors come into play. Inflation specific to the health
care industry influences the rise in costs. The Consumer Price
index for medical care for the Boston-Brockton-Nashua, MA-
NH-ME-CT area, which includes Maine, was 3.9% over the last
ten years. However, Medicaid reimbursement fees are
negotiated between CMS and the state and have been
notoriously low, thus creating the problem of not having enough doctors willing to serve Medicaid
clients. Lack of access can in turn cause political pressure to increase fees, but these efforts are
constrained by the reality of limited budgets. Consequently, Medicaid fees lag inflation. However,
utilization is also a cost determinant, and some Medicaid patients tend to use services more
frequently or in more costly settings, such as emergency rooms. The model assumed the 2.9% factor
used by the USDHHS Office of the Actuary, and is similar to national historic cost. This assumption
is conservative. The low-end and high-end risk factors assumed 1.9% and 3.9%.
Figure 81: Actual PMPMs Per Category
Category PMPMTraditional Medicaid 712.23
Aged 1,526.93
Blind/Disabled 1,553.38
Children < 100% of FPL 320.64
Parents < 100% of FPL 392.38
Pregnancy 912.29
State Only 1,785.96
Other Traditional 254.15
CHIP 222.04
Childless Adults (Waiver) 514.18
Parents to 138% of FPL 271.46
Foster Children 257.60

Appendix B
The Alexander Group Page: 113
FMAP
FMAP rates were provided by the MDHHS Benefits Analytic team. Because these are calculated
based on a federal formula whose factors vary on an annual basis and because they can change by
a whim of Congress, it is difficult to forecast FMAP rates. It was assumed that FMAP rates will remain
constant. The table in Figure 82 displays the assumed rates.
Because the FMAP rate for childless adult under 100% of FPL was unavailable at the time of writing
this report, the two potential FMAP rates for this category are listed as “Childless Adult (<=100% of
FPL)-1” and “Childless Adult (<=100% of FPL)-2.” These different reimbursement rates only impacts
state costs, not total costs. Both rates were considered in the financial model.
Disproportionate Share Hospital (DSH) Allotments
Maine’s disproportionate share hospital (DSH) allotments will be reduced over time using a
methodology based on state comparisons in uninsured populations and the targeting of payments
to hospitals with a high volume of Medicaid patients and high volume of uncompensated care costs.
CMS has not yet released revised DSH allotments at the time of the writing of this report. Maine’s
allotment was capped in SFY 2012-13 at $86 million, of which $50 million is used for the childless
adult waiver and $36 million for the state psychiatric hospitals at Riverview and Dorothea Dix. DSH
is included in the model as part of the overall budget cost to operate MaineCare, which is included
in both the Baseline and the Expansion Scenario. Because the childless adult waiver expired, the
assumption was to keep the value constant because no further information was available at the
time to assume otherwise. The impact, however, would likely be minor compared to the other
potential costs and risks identified by the model. If, for example, Maine continues to receive the $50
million, it could choose to use it for uncompensated care, which would require a match of $31.2
million at the current FMAP rate. In the Expansion Scenario, it could be assumed that the $50 million
would be phased out over a number of years, resulting in a loss of $50 million in federal money but
no state costs associated with that loss. It could be argued, therefore, that there is a potential state
cost of $31.2 million to the state for not expanding, if the state were to receive and accept $50
Figure 82: Assumed FMAP Rates
2013-14 2014-15 2015-16 2016-17 2017-18 2018-19 2019-20 2020-21 2021-22 2022-23 2023-24
Available Forecast Forecast Forecast Forecast Forecast Forecast Forecast Forecast Forecast Forecast
Traditional Medicaid 61.81% 61.55% 61.55% 61.55% 61.55% 61.55% 61.55% 61.55% 61.55% 61.55% 61.55%
CHIP 73.27% 73.09% 90.34% 96.09% 96.09% 96.09% 96.09% 96.09% 96.09% 96.09% 96.09%
Foster Children 61.81% 61.55% 61.55% 61.55% 61.55% 61.55% 61.55% 61.55% 61.55% 61.55% 61.55%
Parents 61.81% 61.55% 61.55% 61.55% 61.55% 61.55% 61.55% 61.55% 61.55% 61.55% 61.55%
Childless Adult (<=100% FPL)-1 80.78% 82.70% 86.54% 88.51% 89.56% 91.90% 91.50% 90.00% 90.00% 90.00% 90.00%
Childless Adult (<=100% FPL)-2 80.78% 100.00% 100.00% 97.50% 94.50% 93.50% 91.50% 90.00% 90.00% 90.00% 90.00%
Childless Adult (101%-138%) 100.00% 100.00% 97.50% 94.50% 93.50% 91.50% 90.00% 90.00% 90.00% 90.00%
Administration 61.56% 61.56% 61.56% 61.56% 61.56% 61.56% 61.56% 61.56% 61.56% 61.56% 61.56%
Administration (Enhanced) 90.00% 90.00% 90.00% 61.56% 61.56% 61.56% 61.56% 61.56% 61.56% 61.56%

Appendix B
The Alexander Group Page: 114
million from the federal government for DSH. However, this would be a voluntary cost and also a
political decision, which is beyond the scope of this study.
Administrative Costs
The model assumes administrative costs pursuant to an analysis and estimates by MDHHS.
Administrative costs for the Baseline used historic experience, and after adjusting for one-time
federal funds and other one-time payments, it estimated an annual growth rate of 2.46%. For the
Expansion Scenario, it assumed that 97 additional personnel would be required to determine
eligibility and manage the additional workload. These costs were estimated to be $7.44 million for
SFY 2014-15.

Appendix C: Key AG Members Who Contributed to This Report
The Alexander Group Page: 115
Appendix C: Key AG Team Members Who Contributed to This Report
Gary D. Alexander, J.D.
Mr. Alexander is the founder, president, and CEO of the Alexander Group. He is a nationally recognized
health-care and Medicaid expert, welfare reformer, and budget specialist. For over 16 years, he has
transformed underperforming state health and welfare agencies into accountable, value-oriented, and data
and performance-driven systems by pioneering structural reforms and state-of-the-art technology solutions
that have improved outcomes and quality, lowered health-care costs, reduced fraud and waste, re-
engineered employment programs, modernized access, and eliminated budget deficits. A pragmatic and
decisive leader, Alexander has a track record not only of identifying problems but also assembling the right
mix of talent, policy makers, and stakeholders to generate data-driven solutions with quantifiable results to
some of the most vexing challenges facing federal, state, and local governments.
Prior to founding the Alexander Group, Mr. Alexander served as Pennsylvania Governor Tom Corbett’s
secretary of public welfare and Governor Tom Corbett’s senior health and welfare advisor from 2011 to 2013.
In that dual role, he oversaw overall operations, management, and policy development for one of the largest
health and welfare agencies in the nation, a department with a budget of $27.5 billion, 6 hospitals, 5 state
intermediate facilities, 94 offices, 16,500 employees, and 2.2 million public-assistance recipients.
Upon arrival in Pennsylvania, Mr. Alexander faced double-digit growth, an uncoordinated service structure,
and a fragmented organization. To fix these problems, he crafted and implemented a cutting-edge plan to
eradicate fraud and waste called the Enterprise-wide Program Integrity and Improvement Initiative. This
program-integrity initiative has been lauded by Medicaid and welfare-reform experts and earned the
department a national innovation award for Excellence and Best Practice from the Council of State
Governments.
Prior to his tenure in the Keystone State, Mr. Alexander created and implemented similar reforms as Rhode
Island’s secretary of health and human services and human-services director from 2006 to 2011. He is the
author and architect of the 2009 landmark Rhode Island Global Medicaid Waiver that, for the first time,
delivered unprecedented flexibility to a state to redesign its Medicaid program. Relieving the state of
burdensome federal mandates and requirements, this groundbreaking reform improved care quality,
outcomes and access, lowered public costs, created more choices for recipients—including more appropriate
care settings—and properly aligned services and benefits. The waiver’s long-term care redesign is also being
used as a model of reform around the nation. In its first two years, the waiver not only saved approximately
$100 million but also kept total Medicaid spending at billions of dollars below the agreed-upon spending
limit. To this day, the waiver continues to help Rhode Island solve budget deficits and improve quality. By
improving quality, choice and access for recipients and introducing accountability into Medicaid, Alexander’s
initiative has been cited as a model of entitlement reform, particularly Medicaid and health care reform by
various experts and publications, including The Wall Street Journal and the Providence Journal.
Mr. Alexander has worked on both sides of the aisle and has a reputation for reaching consensus to solve
complex problems. Consequently, members of congress, elected officials, and policy makers consistently

Appendix C: Key AG Members Who Contributed to This Report
The Alexander Group Page: 116
seek his advice on entitlement reform. He holds a Bachelor of Arts degree from Northeastern University and
a Juris Doctor (J.D.) from Suffolk University School of Law.
Erik D. Randolph
Mr. Randolph spent 28 years of his professional career in government, including 21 years with experience in
fiscal analysis of legislation and government programs that involved determining fiscal impacts, forecasting
costs and revenues, budgeting, and working with financial and economic models. He began his career as a
program evaluator with the U.S. General Accounting Office, which was renamed the Government
Accountability Office in 2004. He then worked five years for two different states in the fields of economic
development and science and technology policy. Afterwards, he achieved the position of senior analyst for
Chairman Dwight Evans (D) of the Committee on Appropriations, Pennsylvania House of Representatives. He
also spent two years as a special policy and fiscal assistant advising Mr. Alexander when he served as
Secretary of Public Welfare for Pennsylvania Governor Tom Corbett (R). He has taught principles of
economics for 17 years. He has a Master of Science degree from Rensselaer Polytechnic Institute and two
Bachelor degrees from the Pennsylvania State University.
Murray M. Blitzer
Mr. Blitzer possesses over 30 years of experience in public administration and finance with a specialty in
Medicaid and human services. He was the Chief Financial Officer for the Rhode Island Department of Human
Services, overseeing a $1.5 billion budget and over 1,000 employees. He also served in the Rhode Island
Legislature as Deputy to the Senate Fiscal Officer. In the Senate, as an advisor to the Majority Leader, he
implemented a budget hearing and review process that allowed the membership equal participation in
formulating policy. Murray began his career in the Rhode Island State Budget Office where he designed and
implemented the structure for the state’s Consensus Medical Assistance and Caseload Estimating
Conference, applying professional forecasting tools to over $2 billion in health care and welfare spending.
Throughout his public career Murray has successfully worked with private entities to reduce the cost of
government and deliver services that have had a positive impact on the lives of many consumers. Murray
holds a Bachelor of Science Degree in Resource Technology and Economics from the University of Rhode
Island.
Jennifer M. Wier
Ms. Wier, C.P.A., has more than 17 years of experience. She has expertise in Medicaid and is also extremely
knowledgeable about information systems, systems modeling, and data mining. Ms. Wier has spent the past
five years dedicated solely to Medicaid assisting in the analysis of the program from both quantitative and
qualitative perspectives. She has audited both financial and policy components and is well versed in federal
regulations as they pertain to the program. She has assisted in the drafting of legislation affecting several
components of the Arkansas Medicaid program, including the creation of the Office of Medicaid Inspector
General for the State of Arkansas as well as legislation affecting provider enrollment. For the past five years
as a member of the Division of Arkansas Legislative Audit, she has been responsible for reporting on all
Medicaid and human service programs of interest to the General Assembly and has acted as an independent
Appendix C: Key AG Members Who Contributed to This Report
The Alexander Group Page: 117
liaison between the legislators and the program administrators. She has a Bachelor of Science in Accounting
from the University of Arkansas at Little Rock and is a member of the Arkansas Society of Professional
Accountants and the Arkansas Information System Audit and Control Association.
Kevin K. Gabriel
Mr. Gabriel is an actuary and has 30 years of experience and has worked in the healthcare and employee
benefits areas for over 20 years. He began his career with a national writer of group health insurance and
later moved to a pair of major reinsurers in the Health arena. In his last position before becoming a
consultant, Kevin ran the Accident and Health Reinsurance division for a major A-rated life insurer. Kevin’s
worked has included the pricing of a wide range of medical products, the evaluation of managed care
networks and managed care intervention programs, and the assessment of liabilities for insurers and
employers. More recently, he has worked on issues related to healthcare reform and has been involved in
the preparation of bids for demonstration projects related to new healthcare initiatives. Mr. Gabriel has a BA
from Wesleyan University in Middletown, Connecticut, and an MBA from the Wharton School of the
University of Pennsylvania. In addition, he is a Fellow of the Society of Actuaries and a member of the
American Academy of Actuaries.

Appendix C: Key AG Members Who Contributed to This Report
The Alexander Group Page: 118
This Page Intentionally Left Blank

Bibliography
The Alexander Group Page: 119
Bibliography
Aizenman N.C. and Karen Tumulty. ”Democrats Share Concerns Over Medicaid Expansion.”
Washington Post. July 13, 2012, p. A3.
Allen M.D., and George J. Arnaoutakis, M.D., Jonathan B. Orens, M.D., John McDyer, M.D., John
V. Conte, M.D., Ashish S. Shah, M.D., Christian A. Merlo, M.D., M.P.H. “Insurance Status is
an independent predictor of long-term survival after lung transplantation in the United
States.” The Journal of Heart and Lung Transplantation. Volume 30, Issue 1. pp. 45 – 53,
January 2011.
American Hospital Association. “Fact Sheet on Uncompensated Care.” December 2010. Accessed at:
http://www.aha.org/content/00-10/10medunderpayment.pdf.
American Psychological Association. “Effects of Poverty, Hunger, and Homelessness on Children and
Youth.” Accessed at: http://www.apa.org/pi/families/poverty.aspx.
Batkins, Sam. “State by State Impact of ACA Regulations 2012.” The American Action Forum. October
2012. Accessed at: http://americanactionforum.org/sites/default/files/ACA_regs.pdf.
Brown, Governor of California, et al. v. Plata et al. 09–1233. May 23, 2011.
Cassidy, Bill. “Cassidy Eyes per Capita Caps for States as Part of Medicaid Reform Proposal.” Inside
Health Policy. March 6, 2012. Accessed at: http://insidehealthpolicy.com/Inside-Health-
General/Public-Content/cassidy-eyes-per-capita-caaps-for-states-as-part-of-medicaid-
reform-proposal/menu-id-869.html.
Centers for Disease Control and Prevention, Health-Related Quality of Life (HRQOL). “Figure 2: Mean
number of reported physically unhealthy days in the past 30 days by state.” Accessed at:
http://www.cdc.gov/hrqol/data/maps/figure2-meanphysicallyunhealthy.htm.
Centers for Medicare and Medicaid Services. “Medicaid and CHIP: October Monthly Applications
and Eligibility Determinations.” December 3, 2013. Accessed at:
http://www.medicaid.gov/AffordableCareAct/Medicaid-Moving-Forward-
2014/Downloads/Medicaid-CHIP-Monthly-Enrollment-Report.pdf
Center for Medicare and Medicaid Services. “MaineCare for Childless Adults Section 1115
Demonstration.” Accessed at: http://www.medicaid.gov/Medicaid-CHIP-Program-
Information/By-Topics/Waivers/1115/downloads/me/me-childless-adults-fs.pdf.

Bibliography
The Alexander Group Page: 120
Channel 4 KMOV.com. “Audit reveals half of people enrolled in Ill. Medicaid program not eligible.”
St. Louis, Television. Accessed at: http://www.kmov.com/news/just-posted/Audit-reveals-
half-of-people-enrolled-in-IL-Medicaid-program-not-eligible-230586321.html.
Congressional Budget Office, “Monthly Budget Review—Summary for Fiscal Year 2013.” November
7 2013. http://www.cbo.gov/publication/44716.
Congressional Budget Office, “Options for Reducing the Deficit: 2014 to 2023.” November 2013.
EuroStat, “Euro area and EU28 government debt up to 93.4% and 86.8% of GDP.” EuroStat News
Release. 153/2013. October23, 2013.
Fralich J., et. al., “Older Adults and Adults with Disabilities: Population and Service Use Trends in
Maine.” Chartbook. 2012 Edition. P.1. University of Southern Maine, Muskie School of Public
Service. Accessed at: http://muskie.usm.maine.edu/DA/Adults-Disabilities-Maine-Service-
Use-Trends-chartbook-2012.pdf.
Fleming, C. “US Health Spending Growth Projected To Average 5.8 Percent Annually Through 2022.”
Health Affairs Blog online. September 18 2013. Accessed at; http://healthaffairs.org/blog/.
Gonshorowski, Drew. Medicaid Expansion Will Become More Costly to States. Issue Brief No. 3709.
30 August 2012. Accessed at: http://thf_media.s3.amazonaws.com/2012/pdf/ib3709.pdf.
Gould, Elise. “Employer-Sponsored Health Insurance Coverage Continues to Decline in a New
Decade.” EPI Briefing Paper #353. Economic Policy Institute. December 5 2012.
Gruber, Jonathan and Kosali Simon. “Crowd-Out Ten Years Later: Have Recent Public Insurance
Expansions Crowded Out Private Health Insurance?” National Bureau Economic Research,
January 2007.
HealthPocket. “With Expansion Looming, Less than Half of Physicians Accept Medicaid.” Accessed
at: http://www.healthpocket.com/healthcare-research/infostat/less-than-half-of-
physicians-accept-medicaid#.UrhaXd-A1pQ. December 10, 2013.
Health Affairs, August 2012 vol. 31. No. 8. pp. 1673-1679.
Hill, Ian. “Will There Be Enough Providers to Meet the Need? Provider Capacity and the ACA.” The
Urban Institute, November 2012. http://www.urban.org/UploadedPDF/412699-Will-There-
Be-Enough-Providers-to-Meet-the-Need.pdf
Holahan, John and Matthew Buettgens, Caitlin Carroll, and Stan Dorn. “The Cost and Coverage
Implications of the ACA Medicaid Expansion: National and State-by-State Analysis.” The

Bibliography
The Alexander Group Page: 121
Urban Institute, sponsored and published by the Kaiser Commission on Medicaid and the
Uninsured, November 2012.
Koroukian Ph.D., Siran M., Bakaki M.D., M.S., Pual M., Raghavan M.D., Ph.D., Derek. “Survival
Disparities by Medicaid Status.” Cancer. Volume 118. Issue 17. pp. 4271-3279. December
2011.
LaPar, M.D., Damien J. and Castigliano M. Bhamidipati, D.O., Carlos M. Mery, M.D., M.P.H., George
J. Stukenborg, Ph.D., David R. Jones, M.D., Bruce D. Schirmer, M.D., Irving L. Kron, M.D., and
Gorav Ailawadi, M.D. “Primary Payer Status Affects Mortality for Major Surgical Operations.”
Annals of Surgery. September 2010; 252(3): pp. 544–551.
MDHHS. “Balancing Incentive Payment Program Application.” May 2013. Accessed at:
http://www.medicaid.gov/Medicaid-CHIP-Program-Information/By-Topics/Long-Term-
Services-and-Support/Balancing/Downloads/Maine-BIP.pdf.
MDHHS. MaineCare Redesign Task Force Recommendation Report. December 2012. Accessed at:
http://www.maine.gov/dhhs/mainecare-task-force/documents/2012-report.pdf.
MDHHS provided data on waiting lists. “The MaineCare Program Right Size, Right Service, Right
Priorities,” Table comes from MDHHS presentation, Fall 2013, slide 19.
Muskie School Chartbook, “Average Age of Maine Long Term Care Users by Setting SFY 2010.” Figure
5-1, p. 18.
National Association of State Budget Officers, Budget Processes in the States. Summer 2008.
Accessed at: http://www.nasbo.org/sites/default/files/BP_2008.pdf.
National Association of State Budget Officers, State Expenditure Report: Examining Fiscal 2011–
2013 State Spending, 2013. Accessed at:
http://www.nasbo.org/sites/default/files/State%20Expenditure%20Report%20%28Fiscal%
202011-2013%20Data%29.pdf.
National Center for Educational Statistics, Digest of Educational Statistics. Table 174. Accessed at:
http://nces.ed.gov/programs/digest/d12/tables/dt12_174.asp.
National Conference of State Legislatures, “ARRA - Medicaid FMAP Increase Provisions.” Accessed
at: http://www.ncsl.org/print/statefed/ARRA-MedicaidFMAPIncreaseProvisions.pdf.
National Federation of Independent Business (NFIB) v. Sebelius, 567 U.S. 11-393 (June 28, 2013)

Bibliography
The Alexander Group Page: 122
O’Donnell, Jayne. “Federal exchange sends unqualified people to Medicaid.” USA Today. 9
December 2013. Accessed at:
http://www.usatoday.com/story/news/nation/2013/12/08/healthcaregov-medicaid-
eligibility-questions/3871113/.
Park, Edwin and Matt Broaddus. Center for Budget and Policy Priorities. “Medicaid Per Capita Cap
Would Shift Costs to States and Place Low-Income Beneficiaries at Risk”. 4 October 2012.
Roy, Avik. “How Do Blue States Expand Medicaid? By Paying Doctors.” Forbes. Accessed December
1, 2013. Accessed at: http://www.forbes.com/sites/theapothecary/2012/07/23/how-do-
blue-states-expand-medicaid-by-paying-doctors-less/.
Schansberg, D. Eric. “Envisioning a Free Market in Health Care.” Cato Journal. Vol. 31. No.1. Winter
2011.
Schiff, Gordon D., M.D. and Andrew B. Bindman, M.D.; Troyen A. Brennan, M.D., J.D., M.P.H.; Schiff;
Bindman; Thomas Bodenheimer, M.D., M.P.H.; Brennan; Carolyn Clancy, M.D.; Oliver Fein,
MD; Ida Hellander, M.D.; David U. Himmelstein, M.D.; Linda R. Murray, M.D., M.P.H.; T.
Donald Rucker, Ph.D.; Ron Sable, M.D.; Jeffrey Scavorn, M.D.; Ronald Shansky, M.D.; Ellen
Shaffer, M.P.H.; David Slobodkin, M.D., M.P.H.; Steve Tarzynski, M.D., M.P.H.; Steffie
Woolhandler, M.D., M.P.H.; Quentin D. Young, M.D. “A Better Quality Alternative: Single-
Payer Health System Reform,” Journal of the American Medical Association, September 14,
1994.
Schiff, Gordon D., M.D. and the Physicians for a National Health Program (PNHP) Working Group on
Quality. “How Single-Payer Health System Reform Improves Quality.” Adapted from: Schiff,
Gordon D., Bindman, Andrew B., Brennan, Troyen A. “A Better Quality Alternative: Single-
Payer Health System Reform.” Journal of the American Medical Association. September 14,
1994.
Singhai, Shubham, Stueland, Jeris and Ungerman, Drew. “How US Health Care Reform Will Affect
Employee Benefits.” McKinsey Quarterly. June 2012. Accessed at:
http://www.mckinsey.com/insights/health_systems_and_services/how_us_health_care_re
form_will_affect_employee_benefits.
Sommers, Ben and Rick Kronick, Kenneth Finegold, Rosa Po, Karyn Schwartz, and Sherry Glied.
“Understanding Participation Rates in Medicaid: Implications for the Affordable Care Act.”
ASPE Issue Brief. March 2012. Accessed at:
http://aspe.hhs.gov/health/reports/2012/MedicaidTakeup/ib.shtml.
Bibliography
The Alexander Group Page: 123
Starfield, M.D. M.P.H. Barbara. “Effects of Poverty on Health Status”. Presented as part of the 1991
Annual Health Conference, Children at Risk: Poverty and Health, held by the Committee on
Medicine in Society of the New York Academy of Medicine May 20 and 21, 1991.
United States Department of Health & Human Services. Office of the Actuary. Centers for Medicare
& Medicaid Services. 2012 Actuarial Report on the Financial Outlook for Medicaid, Truffer,
F.S.A., Christopher J. and John D. Klemm, Ph.D., A.S.A., M.A.A.A. Christian J. Wolfe, A.S.A,
Kathryn E. Rennie and Jessica F. Shuff. 2012.
U.S. Office of Management and Budget, “Fiscal Year 2014 Historical Tables, Budget of the U.S.
Government.” Table 1.3. http://www.whitehouse.gov/omb/budget/historicals.
Upton, Fred and Senator Orrin Hatch, “Making Medicaid Work: Protect the Vulnerable, Offer Individualized Care, and Reduce Costs,” May 1, 2013. Accessed at: http://energycommerce.house.gov/sites/republicans.energycommerce.house.gov/files/an
alysis/20130501Medicaid.pdf.
Urban Institute, “Hard Question on Access to Healthcare – Will we have enough Doctors?”
http://www.urban.org/issues/hardquestions/accesstohealthcare.cfm, December 10, 2013.
United States Assistant Secretary for Planning and Evaluation (ASPE) and United States Department
of Health and Human Services Federal Medicaid Assistance Percentages or Federal Financial
Participation in State Assistance Expenditures FMAP. October 2013. Accessed at:
http://aspe.hhs.gov/health/fmap.htm.
“Washington Signing Up More People for Medicaid than Private Plans.” Catholic Online. December
6, 2013. Accessed at: https://www.catholic.org/health/story.php?id=53450.

The Alexander Group, LLC (AG) is a government and business consulting firm that delivers cutting-edge data-driven solutions, strategic business development, and innovative health-care and technology platforms—to improve efficiency, effectiveness, and quality for our clients. AG possesses unique expertise in the government health-care marketplace, built upon two decades of not only operating large-scale health and human-services agencies but also pioneering reforms that saved states billions of dollars and improved service quality. Founded in 2013 by reformer Gary D. Alexander, the firm is the only group of public officials who have designed, implemented, and managed nationally acclaimed reforms like the Rhode Island Global Medicaid Waiver and, in Pennsylvania, The Enterprise-Wide Program Integrity Plan and The Health and Human Services County Block Grant.
The firm’s specialties range from health care and social welfare to management consulting — including but not limited to health care plan design, Medicaid, Medicare, long-term care and accreditation services — to organizational design and restructuring, transportation, transaction assistance, and legislative and fiscal analysis. AG helps states and localities navigate the intersection of business and public policy while identifying opportunities that enhance the bottom-line and advance the health and well-being of citizens. Rather than remediate complex and outdated health care plans or assistance programs piecemeal, we help states and localities reform and restructure their entire health and human services systems. Deploying cost-effective savings methodologies to ensure a value-, transparent-, and efficiency-based system, our reforms drive innovation, improve service quality and performance, incentivize accountability and consumer engagement, modernize operations, and root out fraud, waste, and abuse.22 Whispering Pine Terrace
Greenville, RI 02828