maine educational assessment (mea) for science · 2018-10-09 · 2 2017 - 2018 maine educational...
TRANSCRIPT
Maine Educational Assessment (MEA)
for Science
2017 - 2018: EQUATING REPORT
2
2017 - 2018 Maine Educational Assessment (MEA) for Science
Equating Report
The purpose of this document is to summarize the equating results obtained from Measured
Progress for MEA for Science. Presented in this report are various program summary
statistics and specific results related to the equating study.
The results of this report are organized as follows:
1. Aggregate Results
1. Percentage of Students by Achievement Level Categories
2. Raw Scores Associated with Cutpoints
3. Calibration Report
4. Equating Item Summary Statistics
5. Summary of Psychometric QC Activities
2. Grade Subject Results
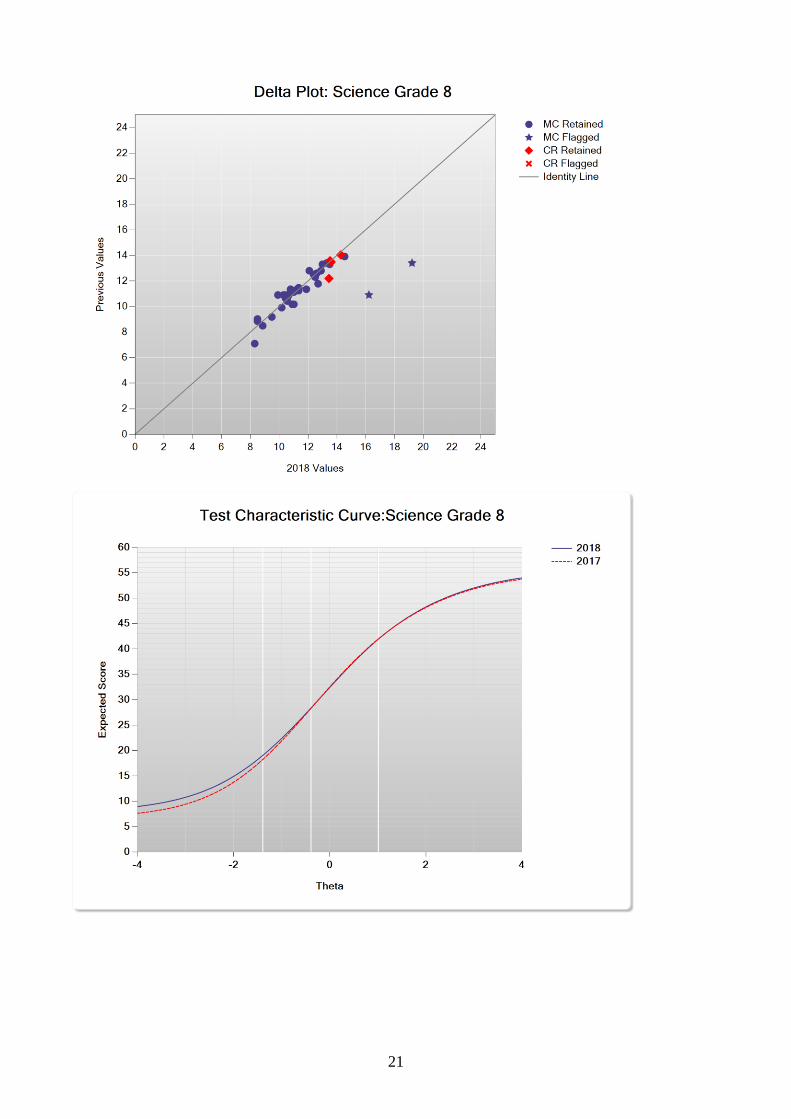
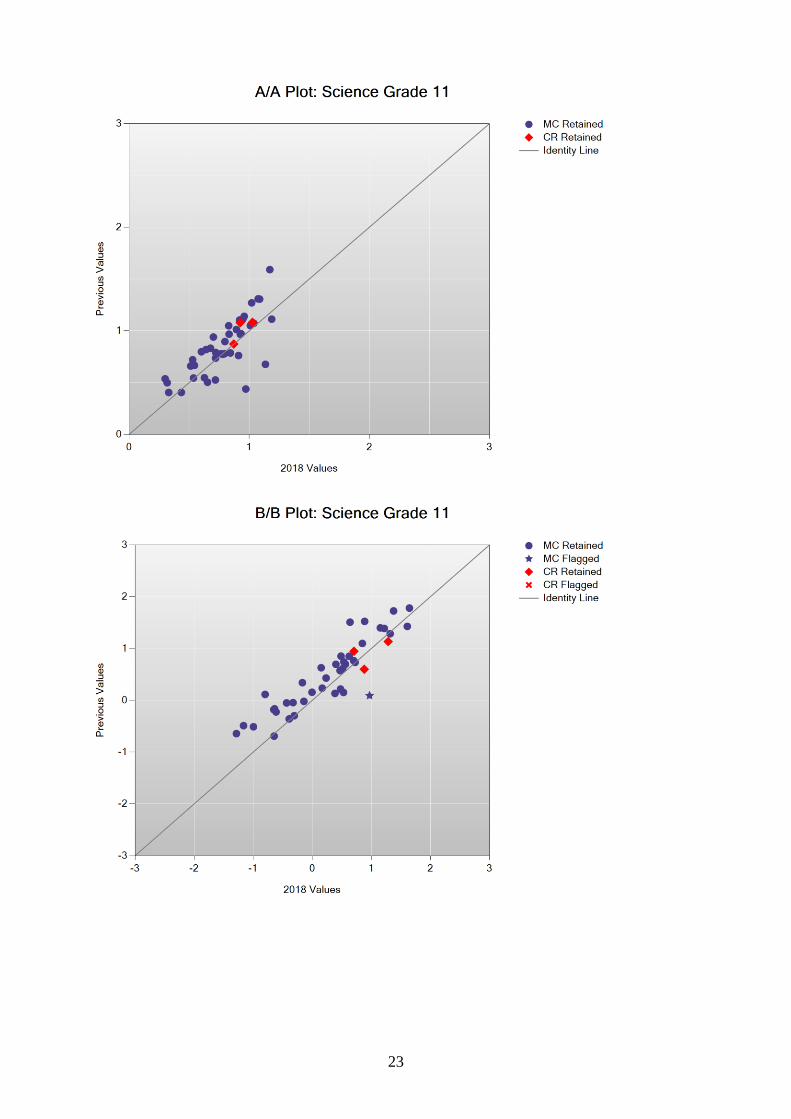
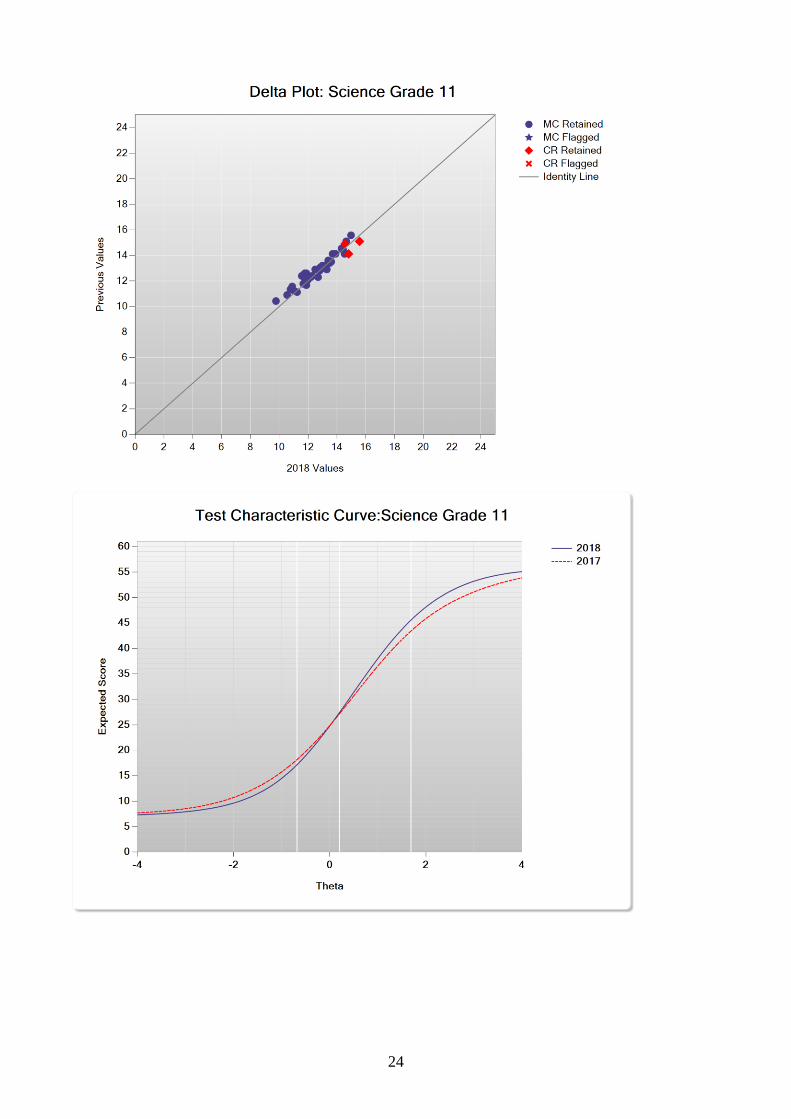
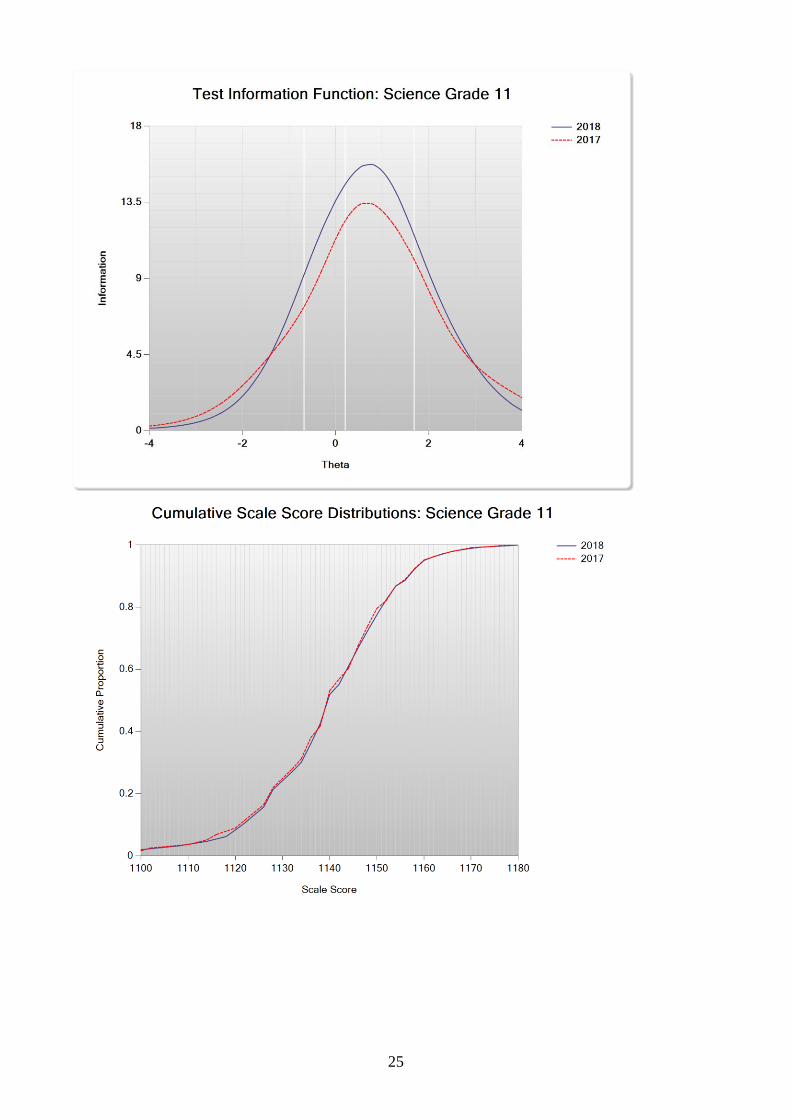
1. A/A, B/B, Delta, Test Characteristic Curve, Test Information Function, and
Cumulative Scale Score Distribution Plots
2. Lookup Tables
3. Cumulative Scale Score Distribution Tables
4. Rescore Analysis Results
5. Tabled Delta Analysis Results
6. Tabled B/B Analysis Results
7. Final Item Parameters
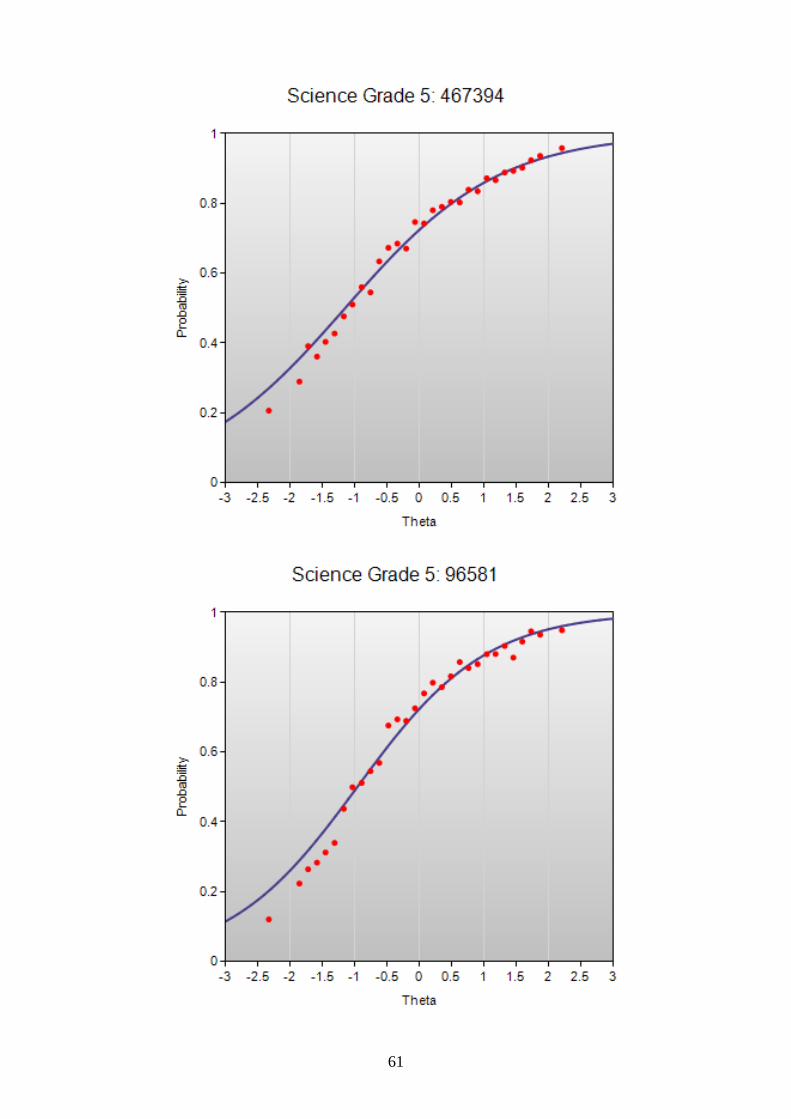
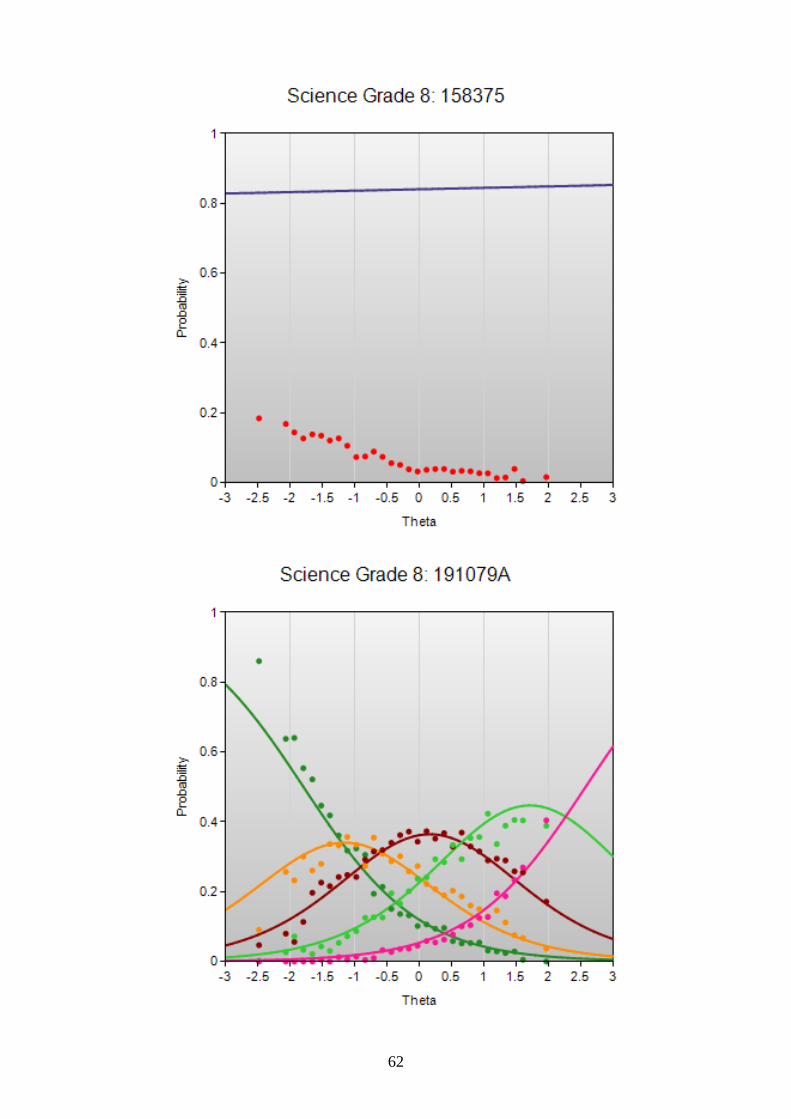
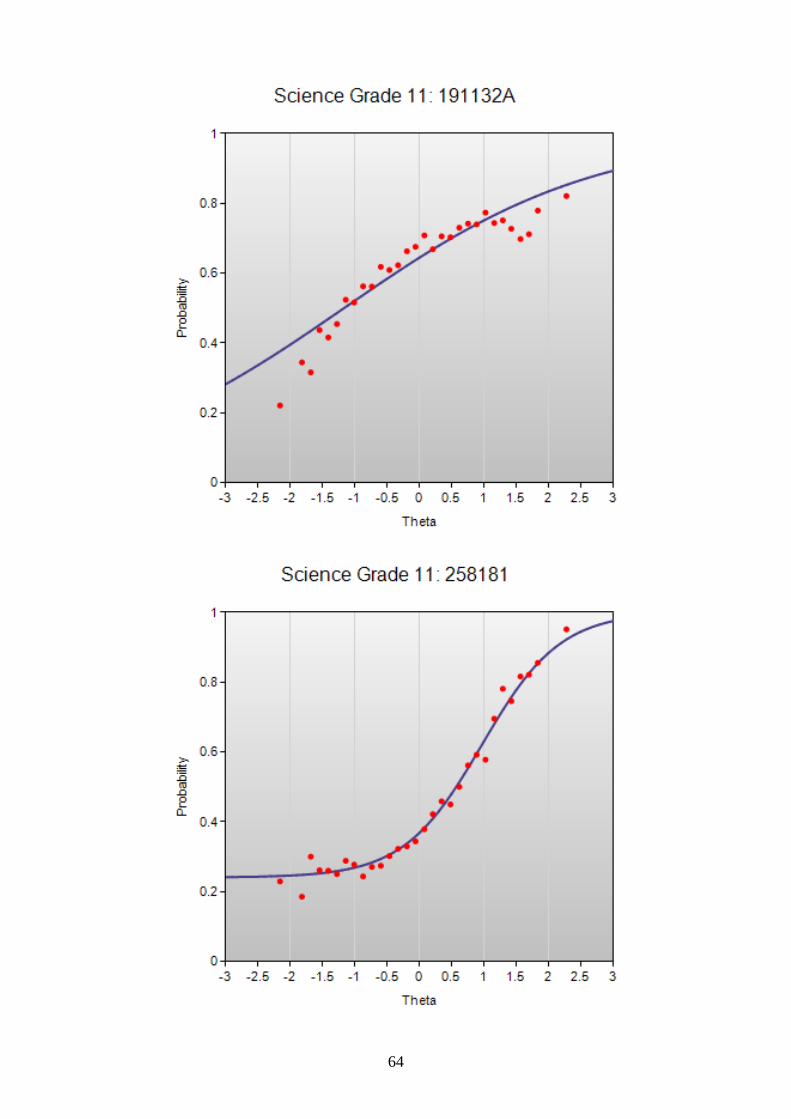
8. Fit Plots of Watchlist Items
The final results of this equating will be included as part of the 2017 - 2018 MEA for Science
Technical Manual. If requested, Measured Progress will distribute and/or present this report
at the next MEA TAC.
3
Section 1.1
Percentage of Students by Achievement Level Categories
4
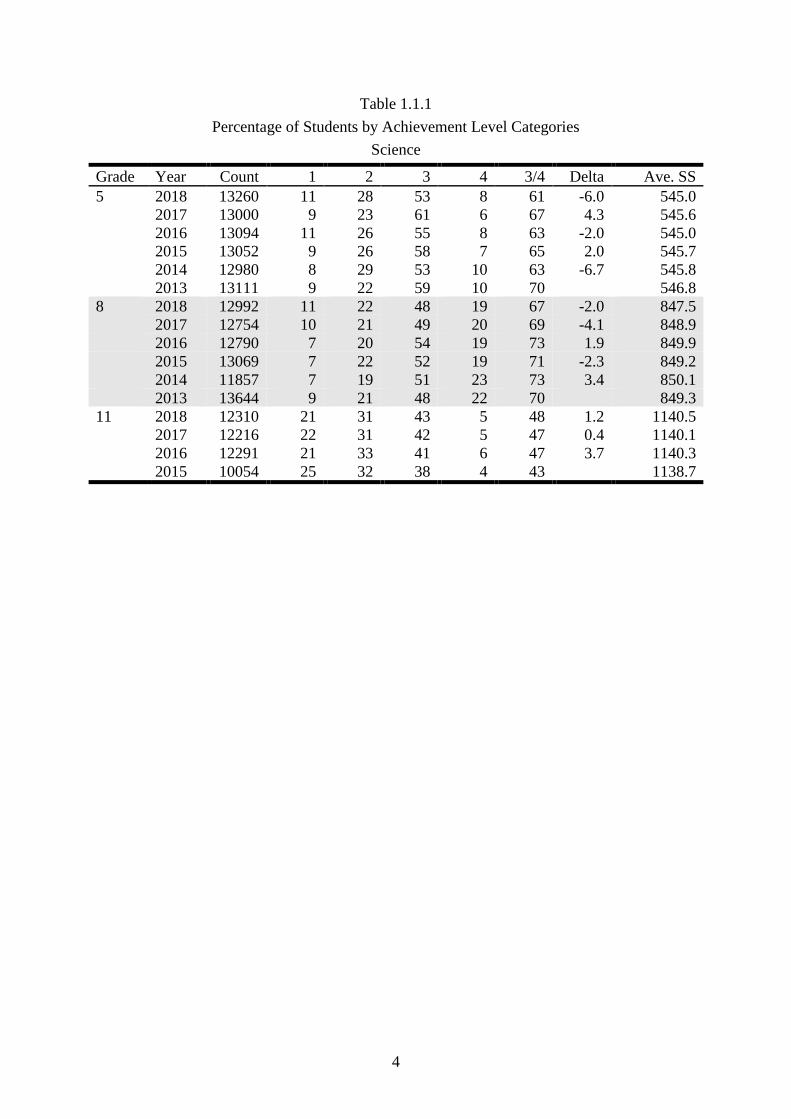
Table 1.1.1
Percentage of Students by Achievement Level Categories
Science
Grade Year Count 1 2 3 4 3/4 Delta Ave. SS
5 2018 13260 11 28 53 8 61 -6.0 545.0
2017 13000 9 23 61 6 67 4.3 545.6
2016 13094 11 26 55 8 63 -2.0 545.0
2015 13052 9 26 58 7 65 2.0 545.7
2014 12980 8 29 53 10 63 -6.7 545.8
2013 13111 9 22 59 10 70 546.8
8 2018 12992 11 22 48 19 67 -2.0 847.5
2017 12754 10 21 49 20 69 -4.1 848.9
2016 12790 7 20 54 19 73 1.9 849.9
2015 13069 7 22 52 19 71 -2.3 849.2
2014 11857 7 19 51 23 73 3.4 850.1
2013 13644 9 21 48 22 70 849.3
11 2018 12310 21 31 43 5 48 1.2 1140.5
2017 12216 22 31 42 5 47 0.4 1140.1
2016 12291 21 33 41 6 47 3.7 1140.3
2015 10054 25 32 38 4 43 1138.7

5
Section 1.2
Raw Scores Associated with Cutpoints
6
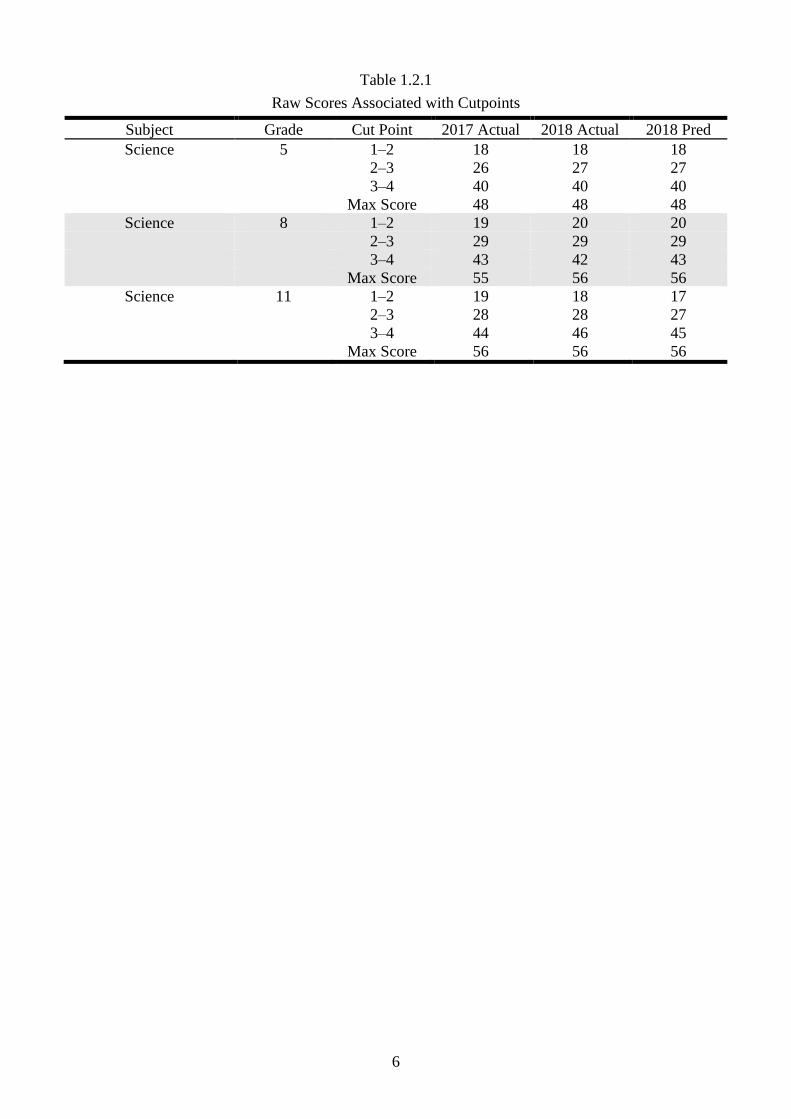
Table 1.2.1
Raw Scores Associated with Cutpoints
Subject Grade Cut Point 2017 Actual 2018 Actual 2018 Pred
Science 5 1–2 18 18 18
2–3 26 27 27
3–4 40 40 40
Max Score 48 48 48
Science 8 1–2 19 20 20
2–3 29 29 29
3–4 43 42 43
Max Score 55 56 56
Science 11 1–2 19 18 17
2–3 28 28 27
3–4 44 46 45
Max Score 56 56 56

7
Section 1.3
Calibration Report
8
Calibration Report—Executive Summary
PARSCALE 4.1 was used for all analyses. All command files were set up in a way that all general
settings were identical to last year. For example, the calibration statement reads:
CAL GRADED,LOGISTIC,CYCLE=(150,1,1,1,1),TPRIOR,SPRIOR,GPRIOR;
Thus, a 3PLM was used for all MC items, and a Graded Response Model was specified for the
polytomous items. The logistic version of the IRT models was used, and default priors were used for
all parameter estimates. Each item occupied its own unique block in the command file, and for most
items initial guessing parameters were set to 0.25.
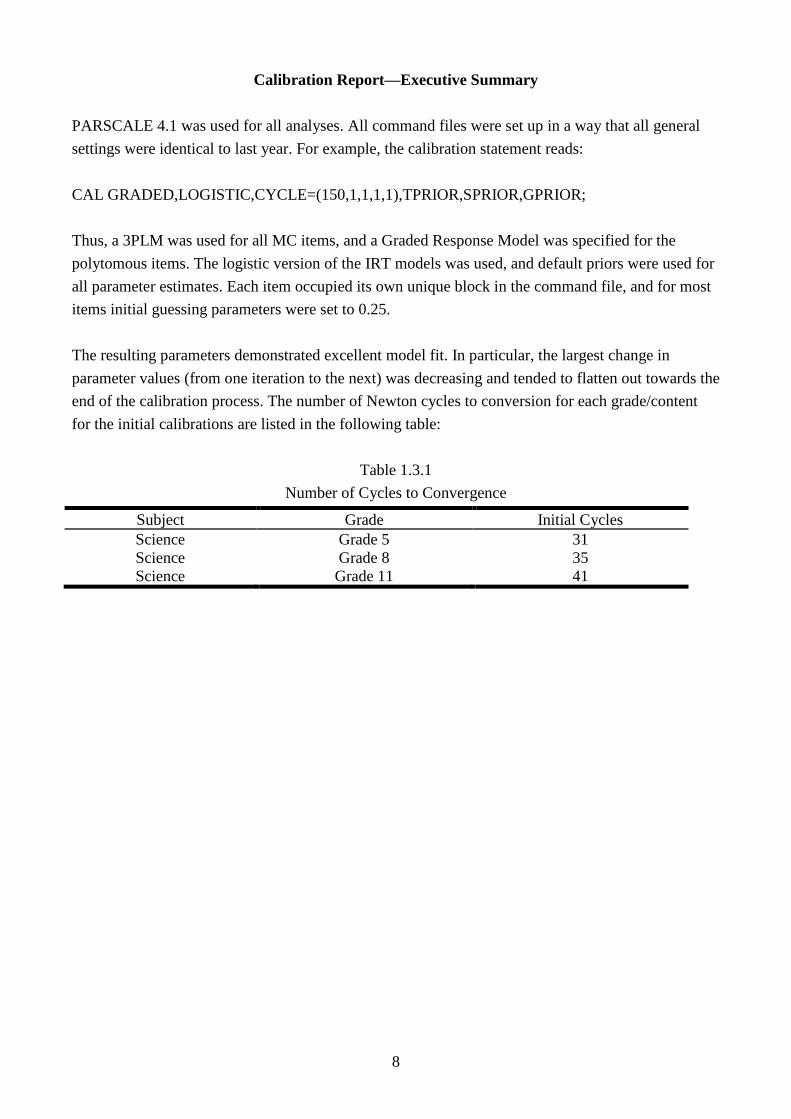
The resulting parameters demonstrated excellent model fit. In particular, the largest change in
parameter values (from one iteration to the next) was decreasing and tended to flatten out towards the
end of the calibration process. The number of Newton cycles to conversion for each grade/content
for the initial calibrations are listed in the following table:
Table 1.3.1
Number of Cycles to Convergence
Subject Grade Initial Cycles
Science Grade 5 31
Science Grade 8 35
Science Grade 11 41
9
For some items the guessing parameter was poorly estimated. This is not at all unusual as difficulty
in estimating the c-parameter has been well documented in the psychometric literature. This often
happens when item discrimination is low or the items are particularly easy. After carefully studying
these items we found that fixing the lower asymptote (for example to a value of 0.00) resulted in
stable and reasonable estimates for both the a and b parameters (relative to CTT statistics). This
technique also produced item parameters that resulted in excellent model fit (comparing theoretical
ICCs to observed ICCs).
Three methods of evaluating the suitability of the equating items were used: the delta analysis, the
b/b analysis and the rescore analysis. As a result of all three analyses very few items were removed
from the equating analysis. Results such as this are very common particularly, given the number of
grade/content combinations, and the number and types of items in the program. Results from these
analyses are included in Section II of this report.
Items flagged by the delta, b/b, or rescore analyses, or any item that required intervention during the
calibration process, were compiled and placed in our item watch list, which includes the final actions
taken on these items. The final watch list is presented in the following table:

10
Table 1.3.2
Final Items Watch List
Subject Grade ItemID Reason Action
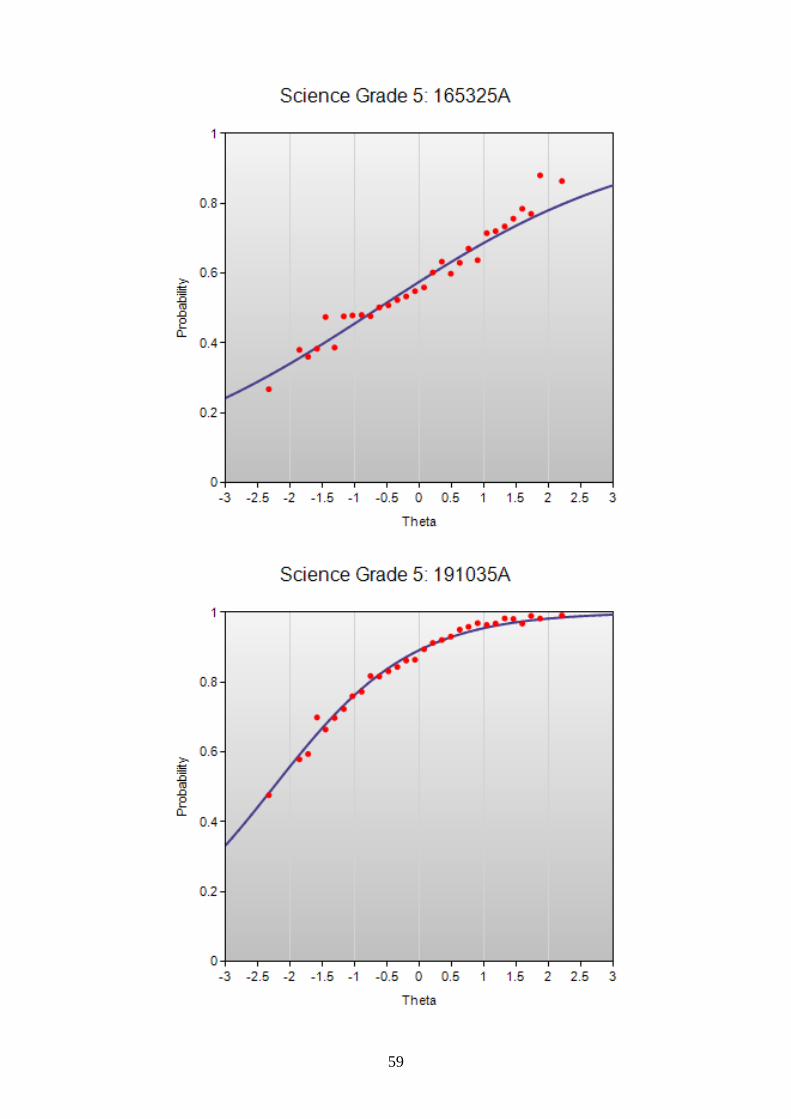
Science 5 165325A c-parameter set c = 0
Science 5 165325A b/b analysis removed from equating
Science 5 191035A c-parameter set c = 0
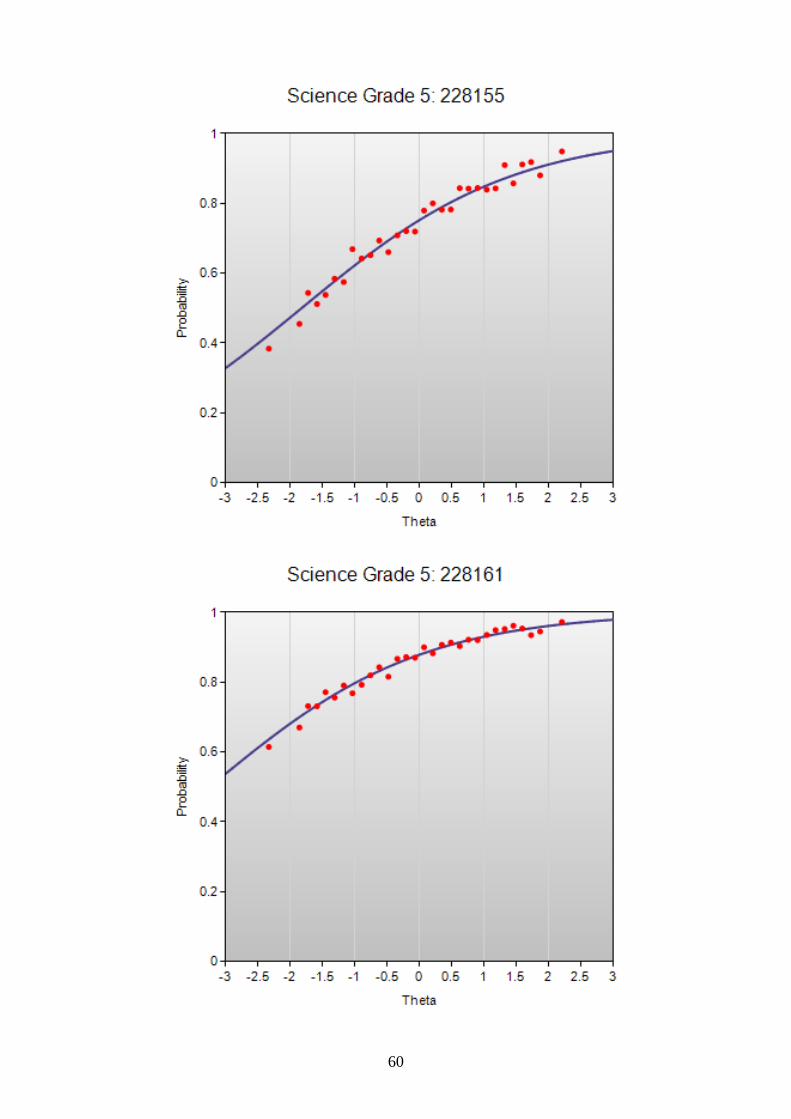
Science 5 228155 c-parameter set c = 0
Science 5 228161 c-parameter set c = 0
Science 5 467394 c-parameter set c = 0
Science 5 96581 c-parameter set c = 0
Science 8 158375 delta analysis removed from equating
Science 8 191079A rescore analysis removed from equating
Science 8 258090 b/b analysis removed from equating
Science 8 258090 delta analysis removed from equating
Science 11 166387A c-parameter set c = 0
Science 11 191132A c-parameter set c = 0
Science 11 258181 b/b analysis removed from equating
11
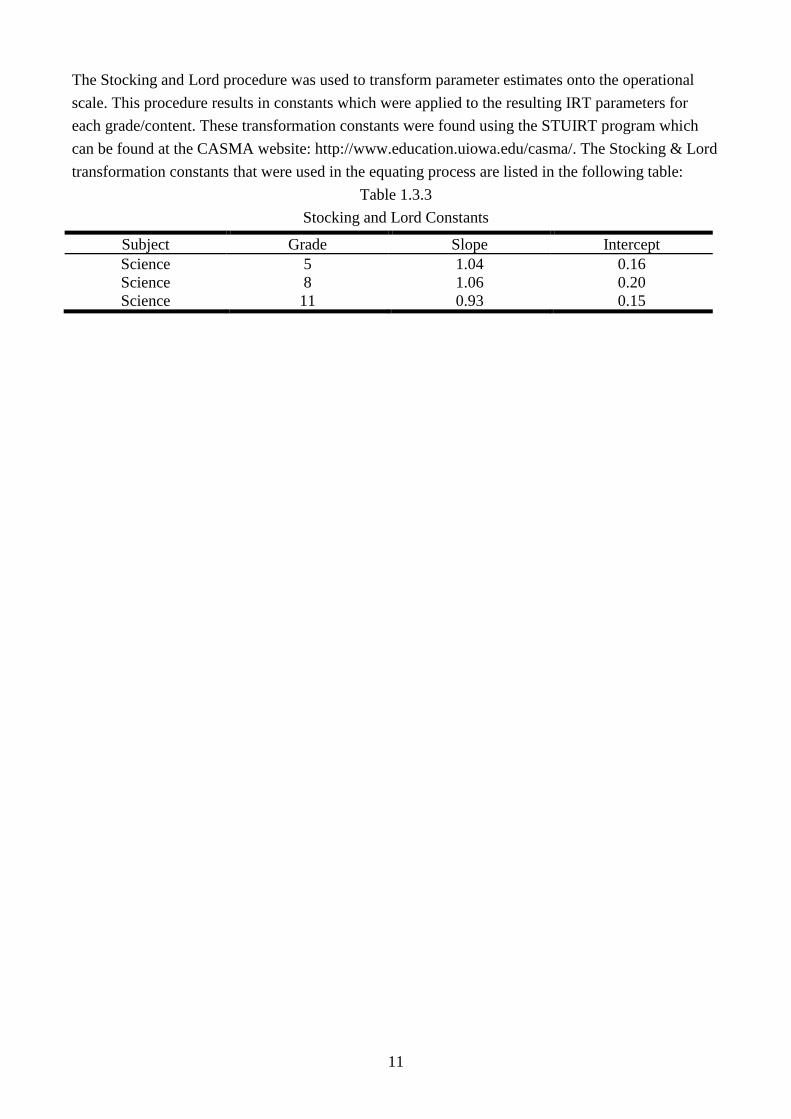
The Stocking and Lord procedure was used to transform parameter estimates onto the operational
scale. This procedure results in constants which were applied to the resulting IRT parameters for
each grade/content. These transformation constants were found using the STUIRT program which
can be found at the CASMA website: http://www.education.uiowa.edu/casma/. The Stocking & Lord
transformation constants that were used in the equating process are listed in the following table:
Table 1.3.3
Stocking and Lord Constants
Subject Grade Slope Intercept
Science 5 1.04 0.16
Science 8 1.06 0.20
Science 11 0.93 0.15
12
Section 1.4
Equating Item Summary Statistics
13
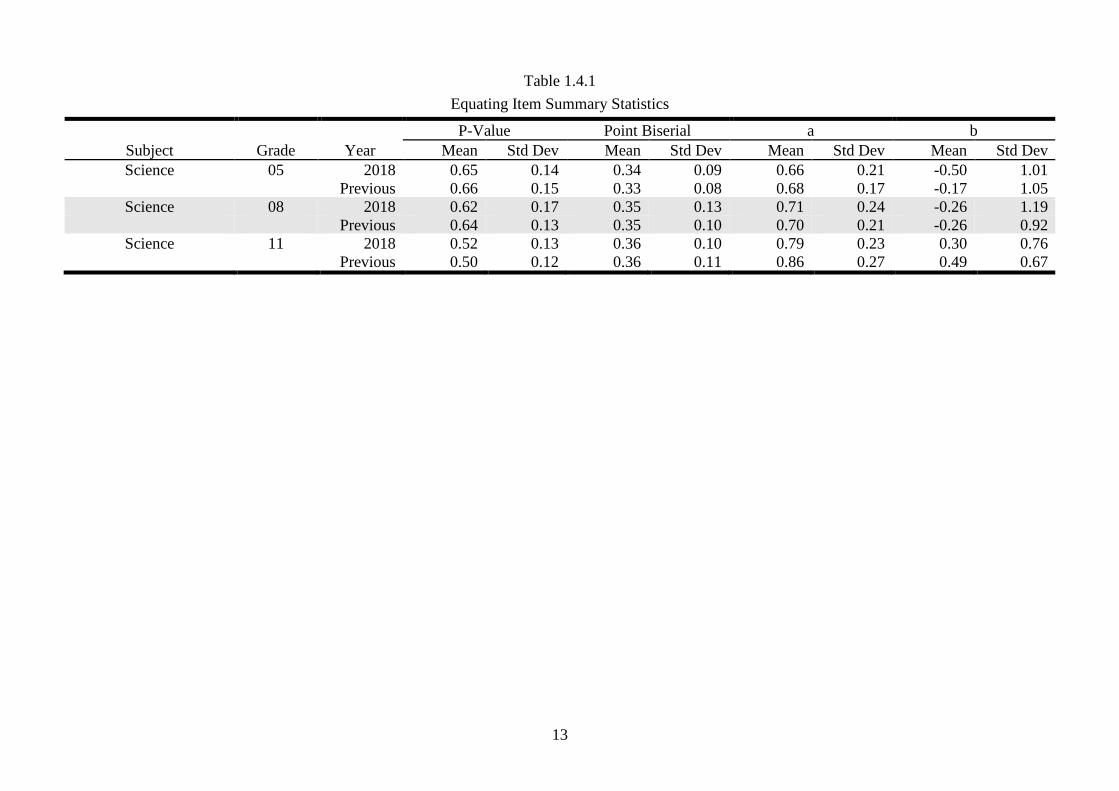
Table 1.4.1
Equating Item Summary Statistics
Subject Grade Year
P-Value Point Biserial a b
Mean Std Dev Mean Std Dev Mean Std Dev Mean Std Dev
Science 05 2018 0.65 0.14 0.34 0.09 0.66 0.21 -0.50 1.01
Previous 0.66 0.15 0.33 0.08 0.68 0.17 -0.17 1.05
Science 08 2018 0.62 0.17 0.35 0.13 0.71 0.24 -0.26 1.19
Previous 0.64 0.13 0.35 0.10 0.70 0.21 -0.26 0.92
Science 11 2018 0.52 0.13 0.36 0.10 0.79 0.23 0.30 0.76
Previous 0.50 0.12 0.36 0.11 0.86 0.27 0.49 0.67
14
Section 1.5
Summary of Psychometric QC Activities
15
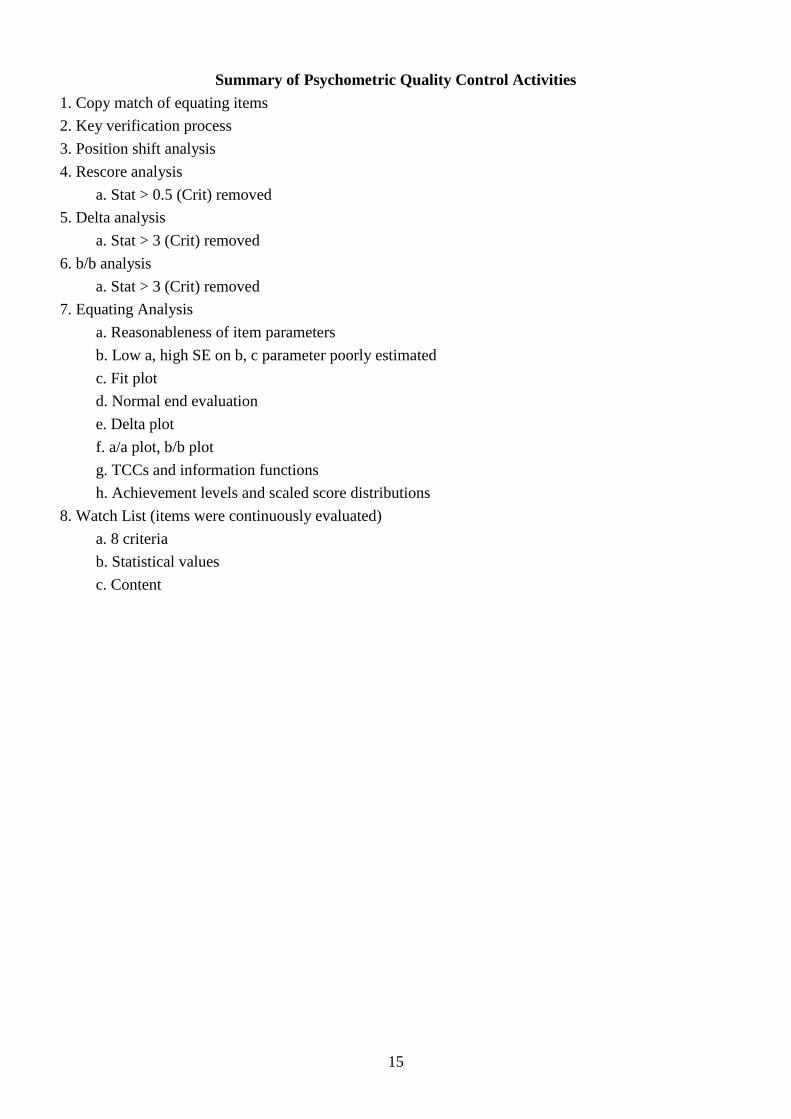
Summary of Psychometric Quality Control Activities
1. Copy match of equating items
2. Key verification process
3. Position shift analysis
4. Rescore analysis
a. Stat > 0.5 (Crit) removed
5. Delta analysis
a. Stat > 3 (Crit) removed
6. b/b analysis
a. Stat > 3 (Crit) removed
7. Equating Analysis
a. Reasonableness of item parameters
b. Low a, high SE on b, c parameter poorly estimated
c. Fit plot
d. Normal end evaluation
e. Delta plot
f. a/a plot, b/b plot
g. TCCs and information functions
h. Achievement levels and scaled score distributions
8. Watch List (items were continuously evaluated)
a. 8 criteria
b. Statistical values
c. Content
16
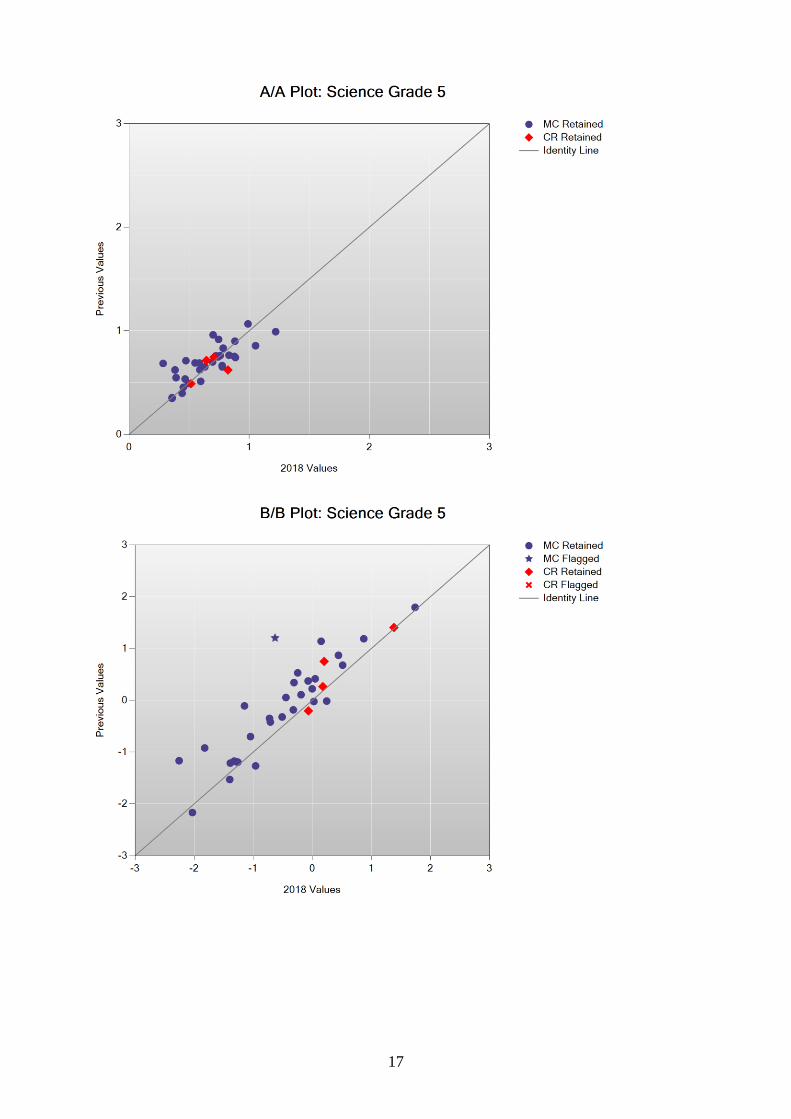
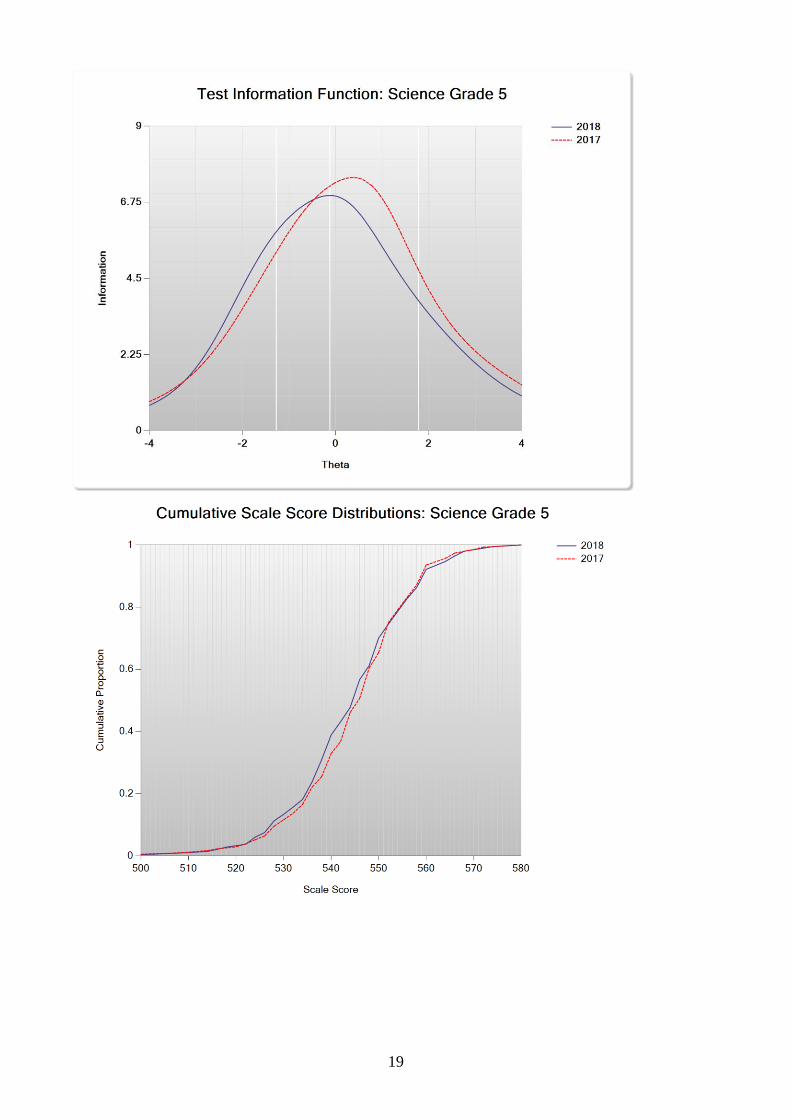
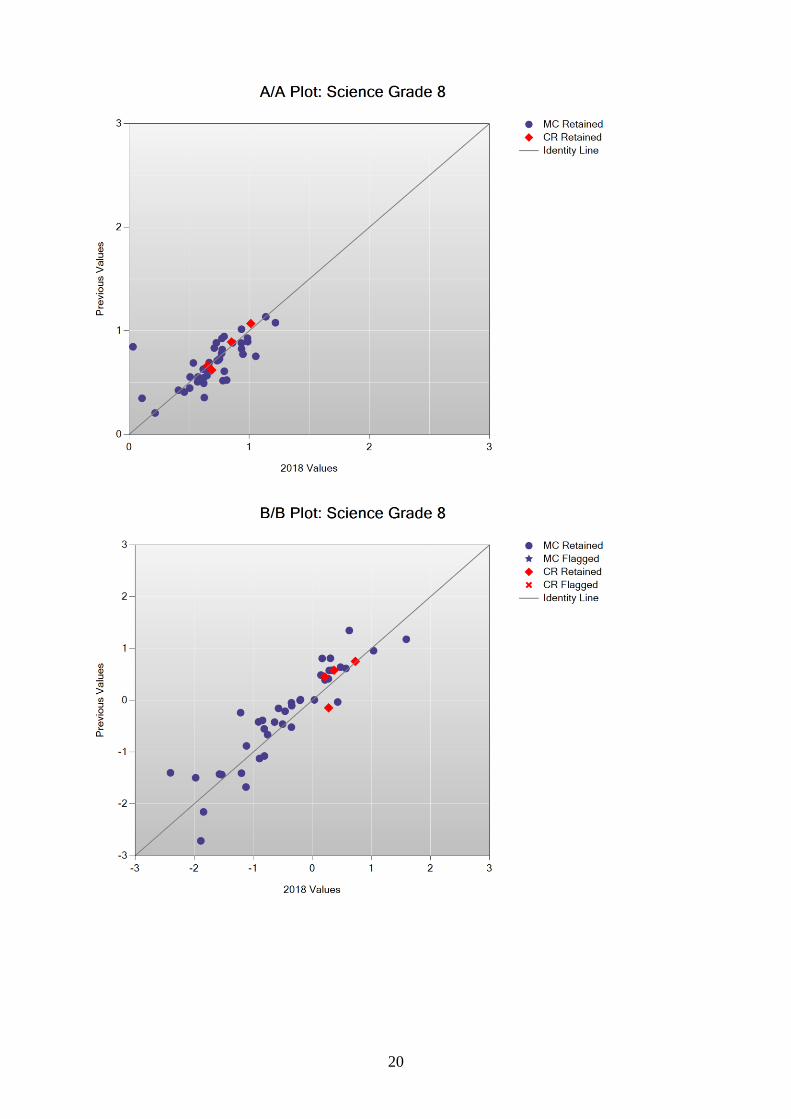
Section 2.1
A/A, B/B, Delta, Test Characteristic Curve, Test Information Function, and
Cumulative Scale Score Distribution Plots
17

18
19
20
21

22
23
24
25
26
Section 2.2
Lookup Tables
27
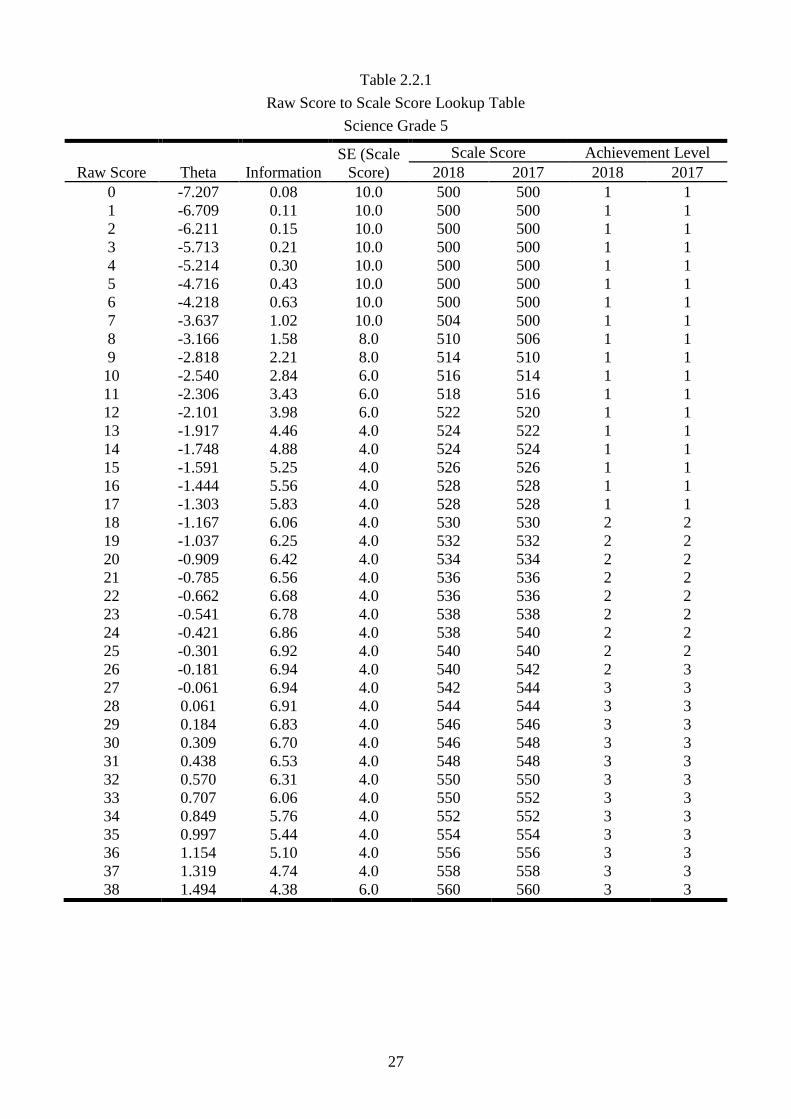
Table 2.2.1
Raw Score to Scale Score Lookup Table
Science Grade 5
Raw Score Theta Information
SE (Scale
Score)
Scale Score Achievement Level
2018 2017 2018 2017
0 -7.207 0.08 10.0 500 500 1 1
1 -6.709 0.11 10.0 500 500 1 1
2 -6.211 0.15 10.0 500 500 1 1
3 -5.713 0.21 10.0 500 500 1 1
4 -5.214 0.30 10.0 500 500 1 1
5 -4.716 0.43 10.0 500 500 1 1
6 -4.218 0.63 10.0 500 500 1 1
7 -3.637 1.02 10.0 504 500 1 1
8 -3.166 1.58 8.0 510 506 1 1
9 -2.818 2.21 8.0 514 510 1 1
10 -2.540 2.84 6.0 516 514 1 1
11 -2.306 3.43 6.0 518 516 1 1
12 -2.101 3.98 6.0 522 520 1 1
13 -1.917 4.46 4.0 524 522 1 1
14 -1.748 4.88 4.0 524 524 1 1
15 -1.591 5.25 4.0 526 526 1 1
16 -1.444 5.56 4.0 528 528 1 1
17 -1.303 5.83 4.0 528 528 1 1
18 -1.167 6.06 4.0 530 530 2 2
19 -1.037 6.25 4.0 532 532 2 2
20 -0.909 6.42 4.0 534 534 2 2
21 -0.785 6.56 4.0 536 536 2 2
22 -0.662 6.68 4.0 536 536 2 2
23 -0.541 6.78 4.0 538 538 2 2
24 -0.421 6.86 4.0 538 540 2 2
25 -0.301 6.92 4.0 540 540 2 2
26 -0.181 6.94 4.0 540 542 2 3
27 -0.061 6.94 4.0 542 544 3 3
28 0.061 6.91 4.0 544 544 3 3
29 0.184 6.83 4.0 546 546 3 3
30 0.309 6.70 4.0 546 548 3 3
31 0.438 6.53 4.0 548 548 3 3
32 0.570 6.31 4.0 550 550 3 3
33 0.707 6.06 4.0 550 552 3 3
34 0.849 5.76 4.0 552 552 3 3
35 0.997 5.44 4.0 554 554 3 3
36 1.154 5.10 4.0 556 556 3 3
37 1.319 4.74 4.0 558 558 3 3
38 1.494 4.38 6.0 560 560 3 3
28
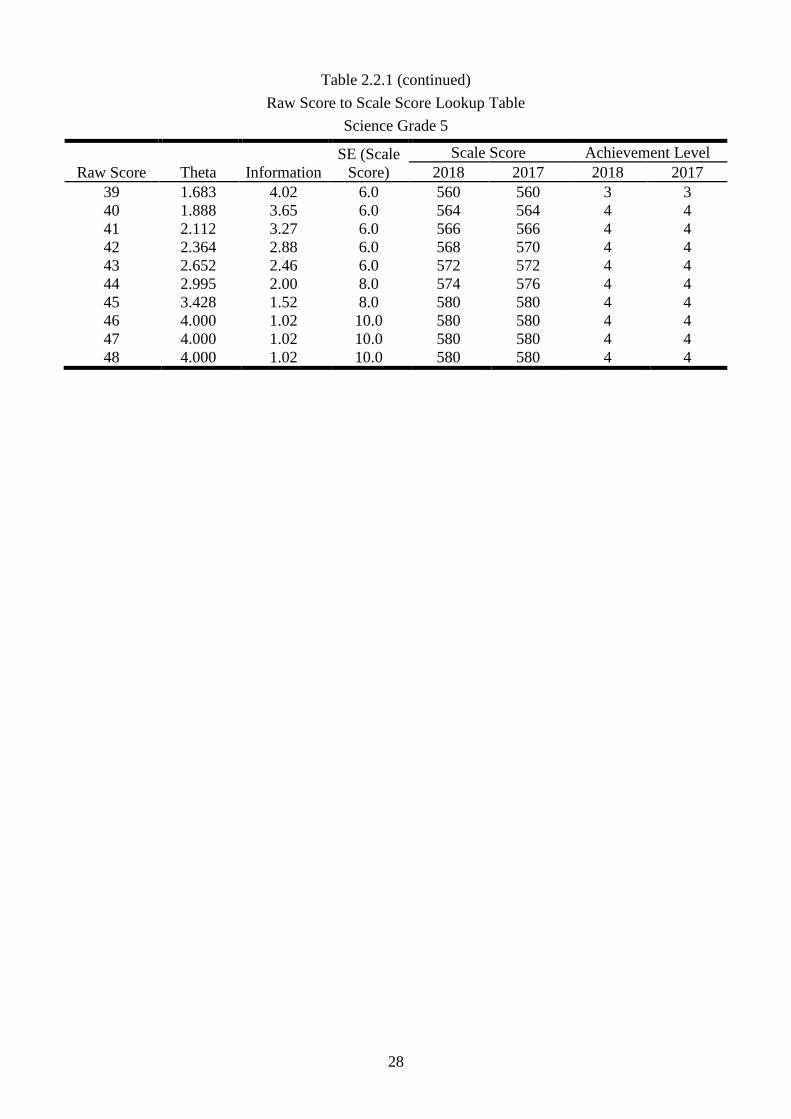
Table 2.2.1 (continued)
Raw Score to Scale Score Lookup Table
Science Grade 5
Raw Score Theta Information
SE (Scale
Score)
Scale Score Achievement Level
2018 2017 2018 2017
39 1.683 4.02 6.0 560 560 3 3
40 1.888 3.65 6.0 564 564 4 4
41 2.112 3.27 6.0 566 566 4 4
42 2.364 2.88 6.0 568 570 4 4
43 2.652 2.46 6.0 572 572 4 4
44 2.995 2.00 8.0 574 576 4 4
45 3.428 1.52 8.0 580 580 4 4
46 4.000 1.02 10.0 580 580 4 4
47 4.000 1.02 10.0 580 580 4 4
48 4.000 1.02 10.0 580 580 4 4
29
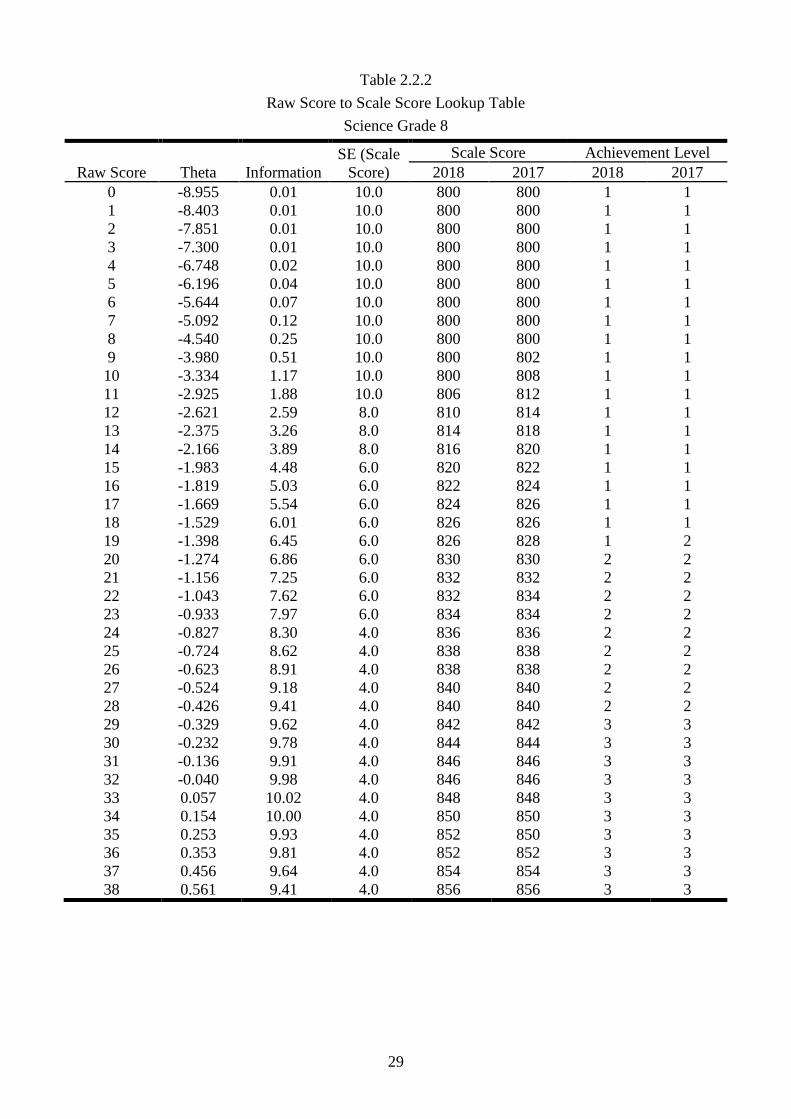
Table 2.2.2
Raw Score to Scale Score Lookup Table
Science Grade 8
Raw Score Theta Information
SE (Scale
Score)
Scale Score Achievement Level
2018 2017 2018 2017
0 -8.955 0.01 10.0 800 800 1 1
1 -8.403 0.01 10.0 800 800 1 1
2 -7.851 0.01 10.0 800 800 1 1
3 -7.300 0.01 10.0 800 800 1 1
4 -6.748 0.02 10.0 800 800 1 1
5 -6.196 0.04 10.0 800 800 1 1
6 -5.644 0.07 10.0 800 800 1 1
7 -5.092 0.12 10.0 800 800 1 1
8 -4.540 0.25 10.0 800 800 1 1
9 -3.980 0.51 10.0 800 802 1 1
10 -3.334 1.17 10.0 800 808 1 1
11 -2.925 1.88 10.0 806 812 1 1
12 -2.621 2.59 8.0 810 814 1 1
13 -2.375 3.26 8.0 814 818 1 1
14 -2.166 3.89 8.0 816 820 1 1
15 -1.983 4.48 6.0 820 822 1 1
16 -1.819 5.03 6.0 822 824 1 1
17 -1.669 5.54 6.0 824 826 1 1
18 -1.529 6.01 6.0 826 826 1 1
19 -1.398 6.45 6.0 826 828 1 2
20 -1.274 6.86 6.0 830 830 2 2
21 -1.156 7.25 6.0 832 832 2 2
22 -1.043 7.62 6.0 832 834 2 2
23 -0.933 7.97 6.0 834 834 2 2
24 -0.827 8.30 4.0 836 836 2 2
25 -0.724 8.62 4.0 838 838 2 2
26 -0.623 8.91 4.0 838 838 2 2
27 -0.524 9.18 4.0 840 840 2 2
28 -0.426 9.41 4.0 840 840 2 2
29 -0.329 9.62 4.0 842 842 3 3
30 -0.232 9.78 4.0 844 844 3 3
31 -0.136 9.91 4.0 846 846 3 3
32 -0.040 9.98 4.0 846 846 3 3
33 0.057 10.02 4.0 848 848 3 3
34 0.154 10.00 4.0 850 850 3 3
35 0.253 9.93 4.0 852 850 3 3
36 0.353 9.81 4.0 852 852 3 3
37 0.456 9.64 4.0 854 854 3 3
38 0.561 9.41 4.0 856 856 3 3
30
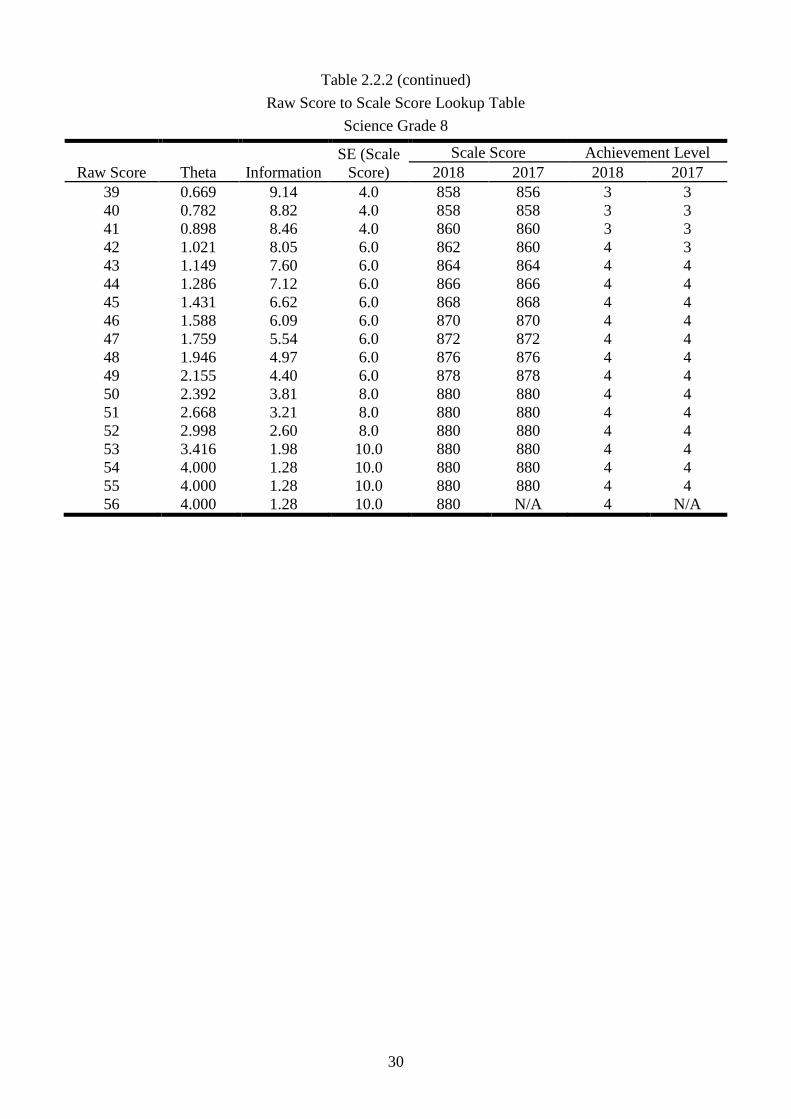
Table 2.2.2 (continued)
Raw Score to Scale Score Lookup Table
Science Grade 8
Raw Score Theta Information
SE (Scale
Score)
Scale Score Achievement Level
2018 2017 2018 2017
39 0.669 9.14 4.0 858 856 3 3
40 0.782 8.82 4.0 858 858 3 3
41 0.898 8.46 4.0 860 860 3 3
42 1.021 8.05 6.0 862 860 4 3
43 1.149 7.60 6.0 864 864 4 4
44 1.286 7.12 6.0 866 866 4 4
45 1.431 6.62 6.0 868 868 4 4
46 1.588 6.09 6.0 870 870 4 4
47 1.759 5.54 6.0 872 872 4 4
48 1.946 4.97 6.0 876 876 4 4
49 2.155 4.40 6.0 878 878 4 4
50 2.392 3.81 8.0 880 880 4 4
51 2.668 3.21 8.0 880 880 4 4
52 2.998 2.60 8.0 880 880 4 4
53 3.416 1.98 10.0 880 880 4 4
54 4.000 1.28 10.0 880 880 4 4
55 4.000 1.28 10.0 880 880 4 4
56 4.000 1.28 10.0 880 N/A 4 N/A
31
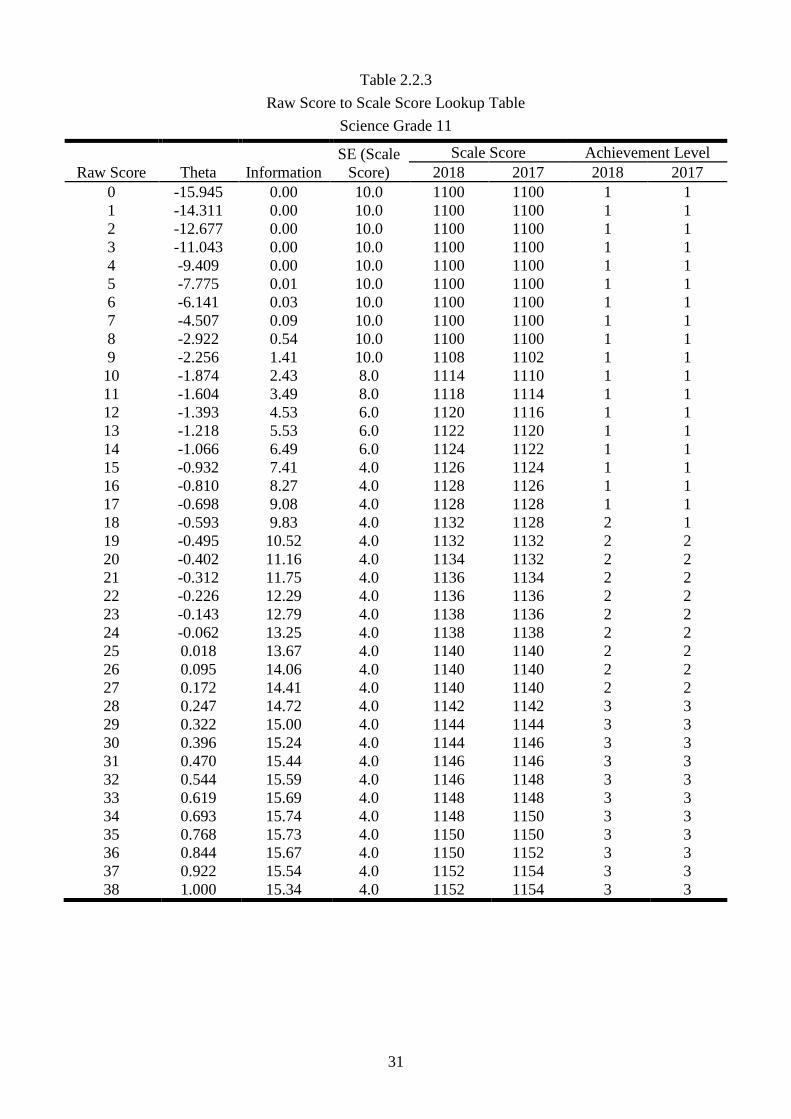
Table 2.2.3
Raw Score to Scale Score Lookup Table
Science Grade 11
Raw Score Theta Information
SE (Scale
Score)
Scale Score Achievement Level
2018 2017 2018 2017
0 -15.945 0.00 10.0 1100 1100 1 1
1 -14.311 0.00 10.0 1100 1100 1 1
2 -12.677 0.00 10.0 1100 1100 1 1
3 -11.043 0.00 10.0 1100 1100 1 1
4 -9.409 0.00 10.0 1100 1100 1 1
5 -7.775 0.01 10.0 1100 1100 1 1
6 -6.141 0.03 10.0 1100 1100 1 1
7 -4.507 0.09 10.0 1100 1100 1 1
8 -2.922 0.54 10.0 1100 1100 1 1
9 -2.256 1.41 10.0 1108 1102 1 1
10 -1.874 2.43 8.0 1114 1110 1 1
11 -1.604 3.49 8.0 1118 1114 1 1
12 -1.393 4.53 6.0 1120 1116 1 1
13 -1.218 5.53 6.0 1122 1120 1 1
14 -1.066 6.49 6.0 1124 1122 1 1
15 -0.932 7.41 4.0 1126 1124 1 1
16 -0.810 8.27 4.0 1128 1126 1 1
17 -0.698 9.08 4.0 1128 1128 1 1
18 -0.593 9.83 4.0 1132 1128 2 1
19 -0.495 10.52 4.0 1132 1132 2 2
20 -0.402 11.16 4.0 1134 1132 2 2
21 -0.312 11.75 4.0 1136 1134 2 2
22 -0.226 12.29 4.0 1136 1136 2 2
23 -0.143 12.79 4.0 1138 1136 2 2
24 -0.062 13.25 4.0 1138 1138 2 2
25 0.018 13.67 4.0 1140 1140 2 2
26 0.095 14.06 4.0 1140 1140 2 2
27 0.172 14.41 4.0 1140 1140 2 2
28 0.247 14.72 4.0 1142 1142 3 3
29 0.322 15.00 4.0 1144 1144 3 3
30 0.396 15.24 4.0 1144 1146 3 3
31 0.470 15.44 4.0 1146 1146 3 3
32 0.544 15.59 4.0 1146 1148 3 3
33 0.619 15.69 4.0 1148 1148 3 3
34 0.693 15.74 4.0 1148 1150 3 3
35 0.768 15.73 4.0 1150 1150 3 3
36 0.844 15.67 4.0 1150 1152 3 3
37 0.922 15.54 4.0 1152 1154 3 3
38 1.000 15.34 4.0 1152 1154 3 3
32
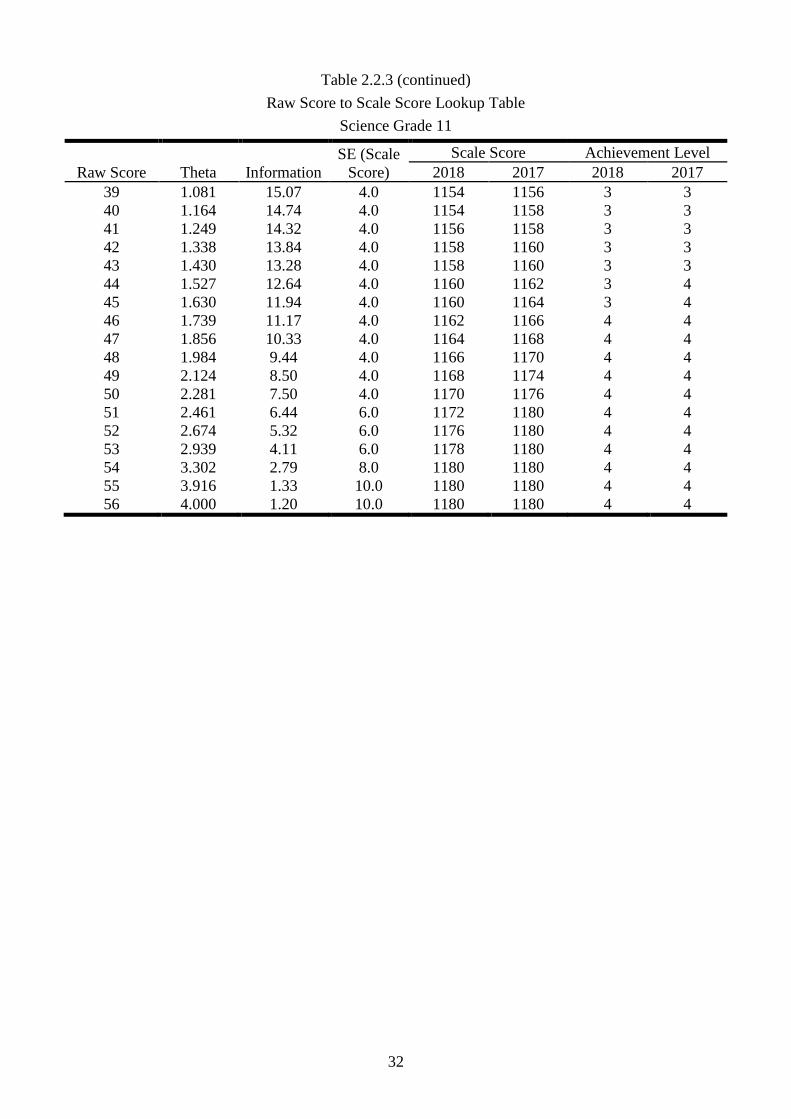
Table 2.2.3 (continued)
Raw Score to Scale Score Lookup Table
Science Grade 11
Raw Score Theta Information
SE (Scale
Score)
Scale Score Achievement Level
2018 2017 2018 2017
39 1.081 15.07 4.0 1154 1156 3 3
40 1.164 14.74 4.0 1154 1158 3 3
41 1.249 14.32 4.0 1156 1158 3 3
42 1.338 13.84 4.0 1158 1160 3 3
43 1.430 13.28 4.0 1158 1160 3 3
44 1.527 12.64 4.0 1160 1162 3 4
45 1.630 11.94 4.0 1160 1164 3 4
46 1.739 11.17 4.0 1162 1166 4 4
47 1.856 10.33 4.0 1164 1168 4 4
48 1.984 9.44 4.0 1166 1170 4 4
49 2.124 8.50 4.0 1168 1174 4 4
50 2.281 7.50 4.0 1170 1176 4 4
51 2.461 6.44 6.0 1172 1180 4 4
52 2.674 5.32 6.0 1176 1180 4 4
53 2.939 4.11 6.0 1178 1180 4 4
54 3.302 2.79 8.0 1180 1180 4 4
55 3.916 1.33 10.0 1180 1180 4 4
56 4.000 1.20 10.0 1180 1180 4 4
33
Section 2.3
Cumulative Scale Score Distribution Tables
34
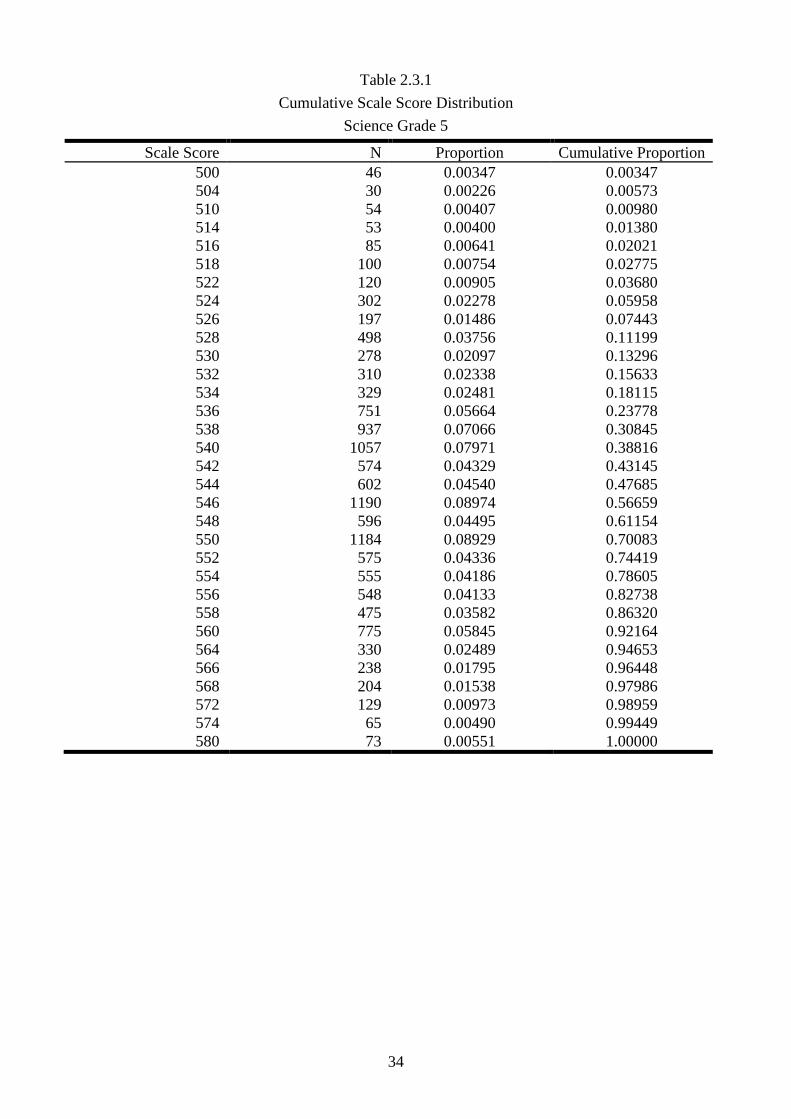
Table 2.3.1
Cumulative Scale Score Distribution
Science Grade 5
Scale Score N Proportion Cumulative Proportion
500 46 0.00347 0.00347
504 30 0.00226 0.00573
510 54 0.00407 0.00980
514 53 0.00400 0.01380
516 85 0.00641 0.02021
518 100 0.00754 0.02775
522 120 0.00905 0.03680
524 302 0.02278 0.05958
526 197 0.01486 0.07443
528 498 0.03756 0.11199
530 278 0.02097 0.13296
532 310 0.02338 0.15633
534 329 0.02481 0.18115
536 751 0.05664 0.23778
538 937 0.07066 0.30845
540 1057 0.07971 0.38816
542 574 0.04329 0.43145
544 602 0.04540 0.47685
546 1190 0.08974 0.56659
548 596 0.04495 0.61154
550 1184 0.08929 0.70083
552 575 0.04336 0.74419
554 555 0.04186 0.78605
556 548 0.04133 0.82738
558 475 0.03582 0.86320
560 775 0.05845 0.92164
564 330 0.02489 0.94653
566 238 0.01795 0.96448
568 204 0.01538 0.97986
572 129 0.00973 0.98959
574 65 0.00490 0.99449
580 73 0.00551 1.00000
35
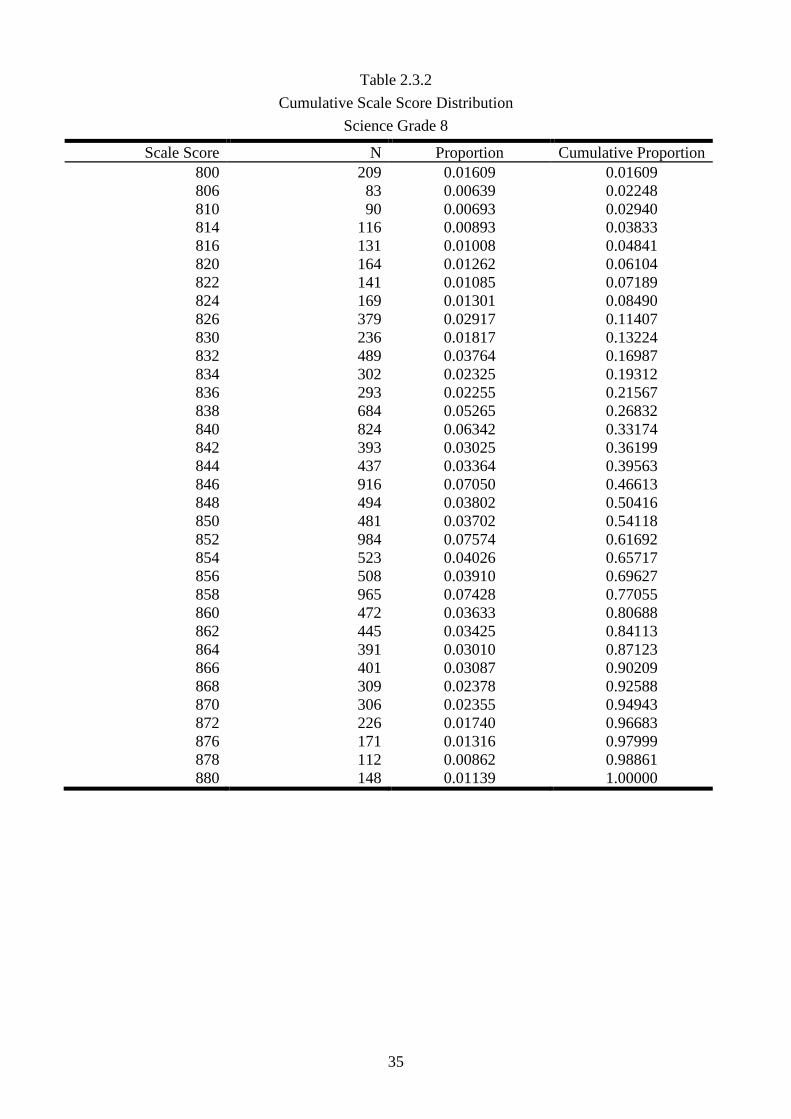
Table 2.3.2
Cumulative Scale Score Distribution
Science Grade 8
Scale Score N Proportion Cumulative Proportion
800 209 0.01609 0.01609
806 83 0.00639 0.02248
810 90 0.00693 0.02940
814 116 0.00893 0.03833
816 131 0.01008 0.04841
820 164 0.01262 0.06104
822 141 0.01085 0.07189
824 169 0.01301 0.08490
826 379 0.02917 0.11407
830 236 0.01817 0.13224
832 489 0.03764 0.16987
834 302 0.02325 0.19312
836 293 0.02255 0.21567
838 684 0.05265 0.26832
840 824 0.06342 0.33174
842 393 0.03025 0.36199
844 437 0.03364 0.39563
846 916 0.07050 0.46613
848 494 0.03802 0.50416
850 481 0.03702 0.54118
852 984 0.07574 0.61692
854 523 0.04026 0.65717
856 508 0.03910 0.69627
858 965 0.07428 0.77055
860 472 0.03633 0.80688
862 445 0.03425 0.84113
864 391 0.03010 0.87123
866 401 0.03087 0.90209
868 309 0.02378 0.92588
870 306 0.02355 0.94943
872 226 0.01740 0.96683
876 171 0.01316 0.97999
878 112 0.00862 0.98861
880 148 0.01139 1.00000
36
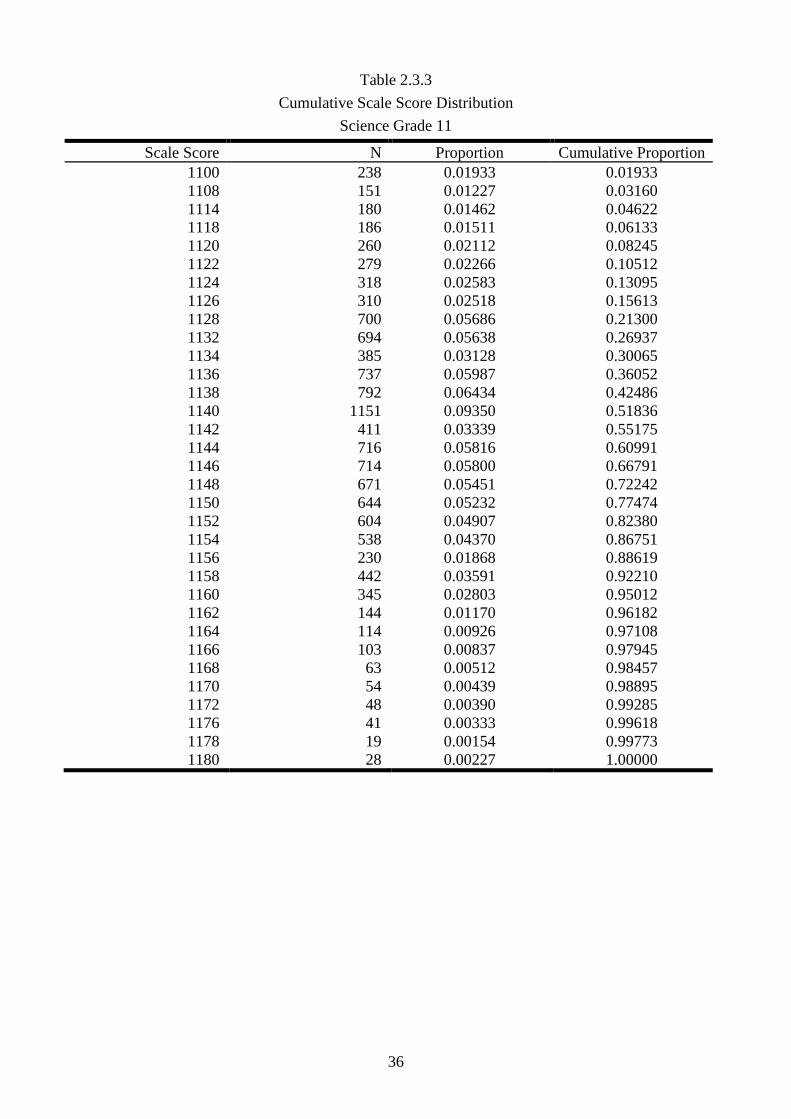
Table 2.3.3
Cumulative Scale Score Distribution
Science Grade 11
Scale Score N Proportion Cumulative Proportion
1100 238 0.01933 0.01933
1108 151 0.01227 0.03160
1114 180 0.01462 0.04622
1118 186 0.01511 0.06133
1120 260 0.02112 0.08245
1122 279 0.02266 0.10512
1124 318 0.02583 0.13095
1126 310 0.02518 0.15613
1128 700 0.05686 0.21300
1132 694 0.05638 0.26937
1134 385 0.03128 0.30065
1136 737 0.05987 0.36052
1138 792 0.06434 0.42486
1140 1151 0.09350 0.51836
1142 411 0.03339 0.55175
1144 716 0.05816 0.60991
1146 714 0.05800 0.66791
1148 671 0.05451 0.72242
1150 644 0.05232 0.77474
1152 604 0.04907 0.82380
1154 538 0.04370 0.86751
1156 230 0.01868 0.88619
1158 442 0.03591 0.92210
1160 345 0.02803 0.95012
1162 144 0.01170 0.96182
1164 114 0.00926 0.97108
1166 103 0.00837 0.97945
1168 63 0.00512 0.98457
1170 54 0.00439 0.98895
1172 48 0.00390 0.99285
1176 41 0.00333 0.99618
1178 19 0.00154 0.99773
1180 28 0.00227 1.00000
37
Section 2.4
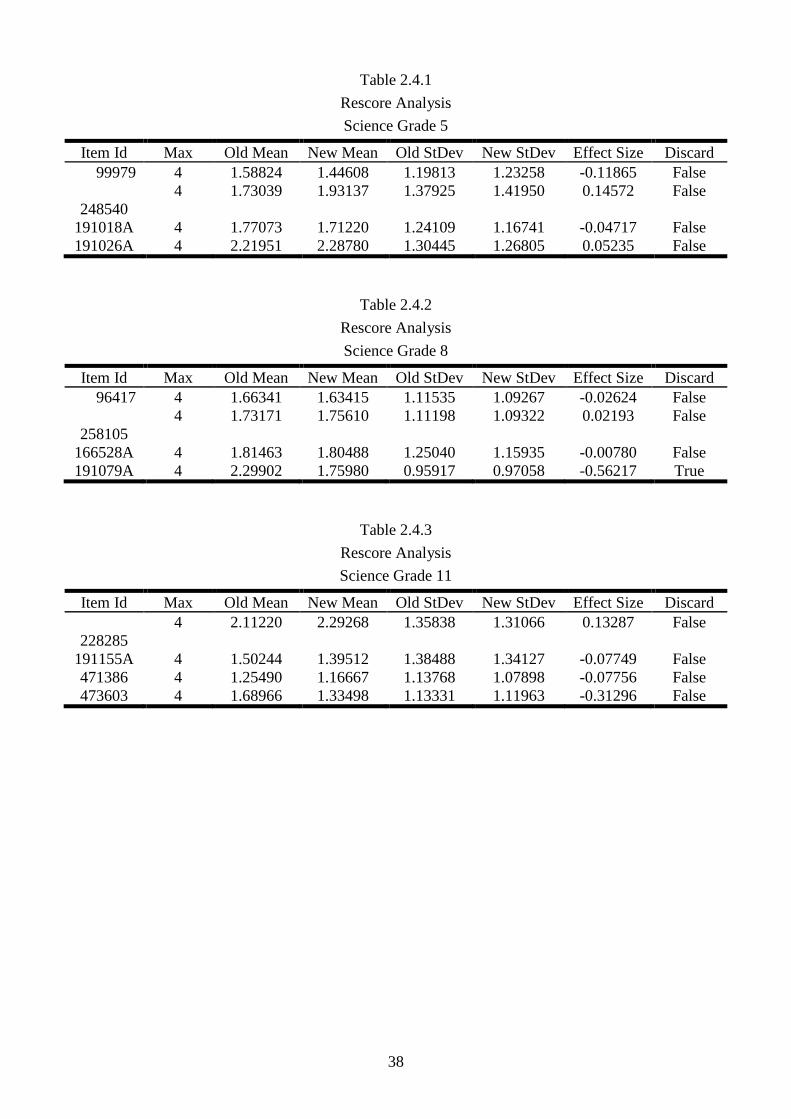
Rescore Analysis Results
38
Table 2.4.1
Rescore Analysis
Science Grade 5
Item Id Max Old Mean New Mean Old StDev New StDev Effect Size Discard
99979 4 1.58824 1.44608 1.19813 1.23258 -0.11865 False
248540
4 1.73039 1.93137 1.37925 1.41950 0.14572 False
191018A 4 1.77073 1.71220 1.24109 1.16741 -0.04717 False
191026A 4 2.21951 2.28780 1.30445 1.26805 0.05235 False
Table 2.4.2
Rescore Analysis
Science Grade 8
Item Id Max Old Mean New Mean Old StDev New StDev Effect Size Discard
96417 4 1.66341 1.63415 1.11535 1.09267 -0.02624 False
258105
4 1.73171 1.75610 1.11198 1.09322 0.02193 False
166528A 4 1.81463 1.80488 1.25040 1.15935 -0.00780 False
191079A 4 2.29902 1.75980 0.95917 0.97058 -0.56217 True
Table 2.4.3
Rescore Analysis
Science Grade 11
Item Id Max Old Mean New Mean Old StDev New StDev Effect Size Discard
228285
4 2.11220 2.29268 1.35838 1.31066 0.13287 False
191155A 4 1.50244 1.39512 1.38488 1.34127 -0.07749 False
471386 4 1.25490 1.16667 1.13768 1.07898 -0.07756 False
473603 4 1.68966 1.33498 1.13331 1.11963 -0.31296 False
39
Section 2.5
Tabled Delta Analysis Results
40
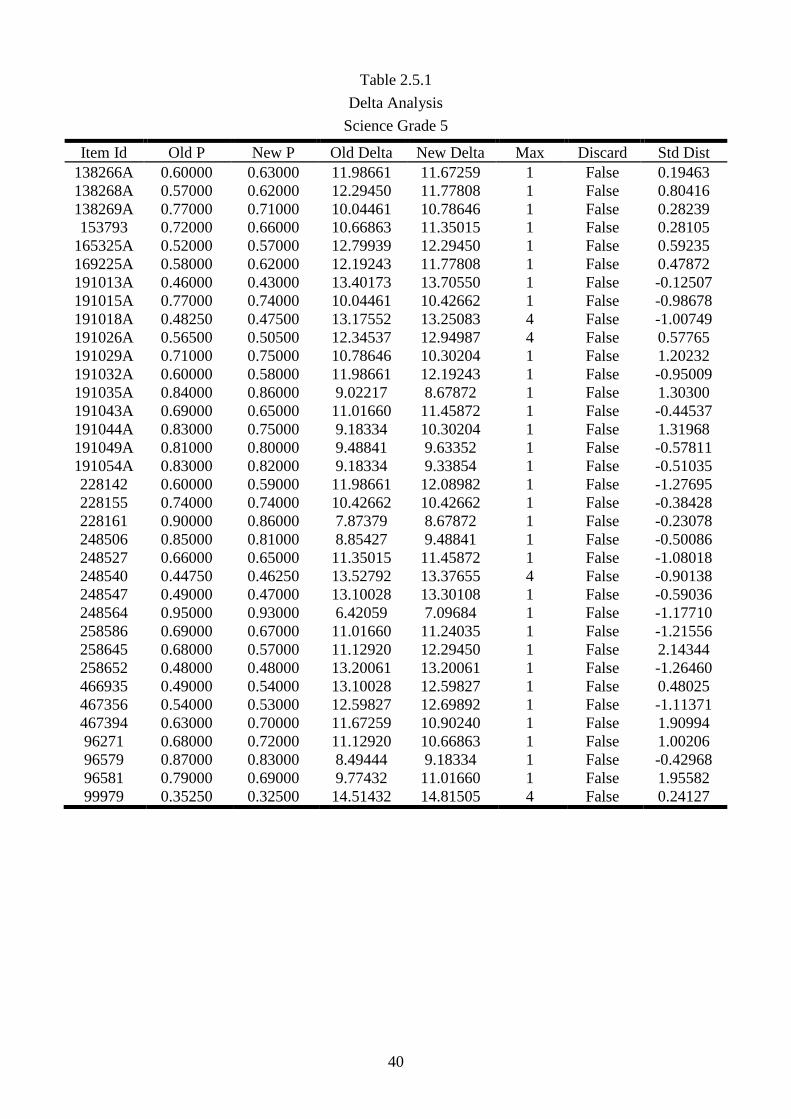
Table 2.5.1
Delta Analysis
Science Grade 5
Item Id Old P New P Old Delta New Delta Max Discard Std Dist
138266A 0.60000 0.63000 11.98661 11.67259 1 False 0.19463
138268A 0.57000 0.62000 12.29450 11.77808 1 False 0.80416
138269A 0.77000 0.71000 10.04461 10.78646 1 False 0.28239
153793 0.72000 0.66000 10.66863 11.35015 1 False 0.28105
165325A 0.52000 0.57000 12.79939 12.29450 1 False 0.59235
169225A 0.58000 0.62000 12.19243 11.77808 1 False 0.47872
191013A 0.46000 0.43000 13.40173 13.70550 1 False -0.12507
191015A 0.77000 0.74000 10.04461 10.42662 1 False -0.98678
191018A 0.48250 0.47500 13.17552 13.25083 4 False -1.00749
191026A 0.56500 0.50500 12.34537 12.94987 4 False 0.57765
191029A 0.71000 0.75000 10.78646 10.30204 1 False 1.20232
191032A 0.60000 0.58000 11.98661 12.19243 1 False -0.95009
191035A 0.84000 0.86000 9.02217 8.67872 1 False 1.30300
191043A 0.69000 0.65000 11.01660 11.45872 1 False -0.44537
191044A 0.83000 0.75000 9.18334 10.30204 1 False 1.31968
191049A 0.81000 0.80000 9.48841 9.63352 1 False -0.57811
191054A 0.83000 0.82000 9.18334 9.33854 1 False -0.51035
228142 0.60000 0.59000 11.98661 12.08982 1 False -1.27695
228155 0.74000 0.74000 10.42662 10.42662 1 False -0.38428
228161 0.90000 0.86000 7.87379 8.67872 1 False -0.23078
248506 0.85000 0.81000 8.85427 9.48841 1 False -0.50086
248527 0.66000 0.65000 11.35015 11.45872 1 False -1.08018
248540 0.44750 0.46250 13.52792 13.37655 4 False -0.90138
248547 0.49000 0.47000 13.10028 13.30108 1 False -0.59036
248564 0.95000 0.93000 6.42059 7.09684 1 False -1.17710
258586 0.69000 0.67000 11.01660 11.24035 1 False -1.21556
258645 0.68000 0.57000 11.12920 12.29450 1 False 2.14344
258652 0.48000 0.48000 13.20061 13.20061 1 False -1.26460
466935 0.49000 0.54000 13.10028 12.59827 1 False 0.48025
467356 0.54000 0.53000 12.59827 12.69892 1 False -1.11371
467394 0.63000 0.70000 11.67259 10.90240 1 False 1.90994
96271 0.68000 0.72000 11.12920 10.66863 1 False 1.00206
96579 0.87000 0.83000 8.49444 9.18334 1 False -0.42968
96581 0.79000 0.69000 9.77432 11.01660 1 False 1.95582
99979 0.35250 0.32500 14.51432 14.81505 4 False 0.24127
41
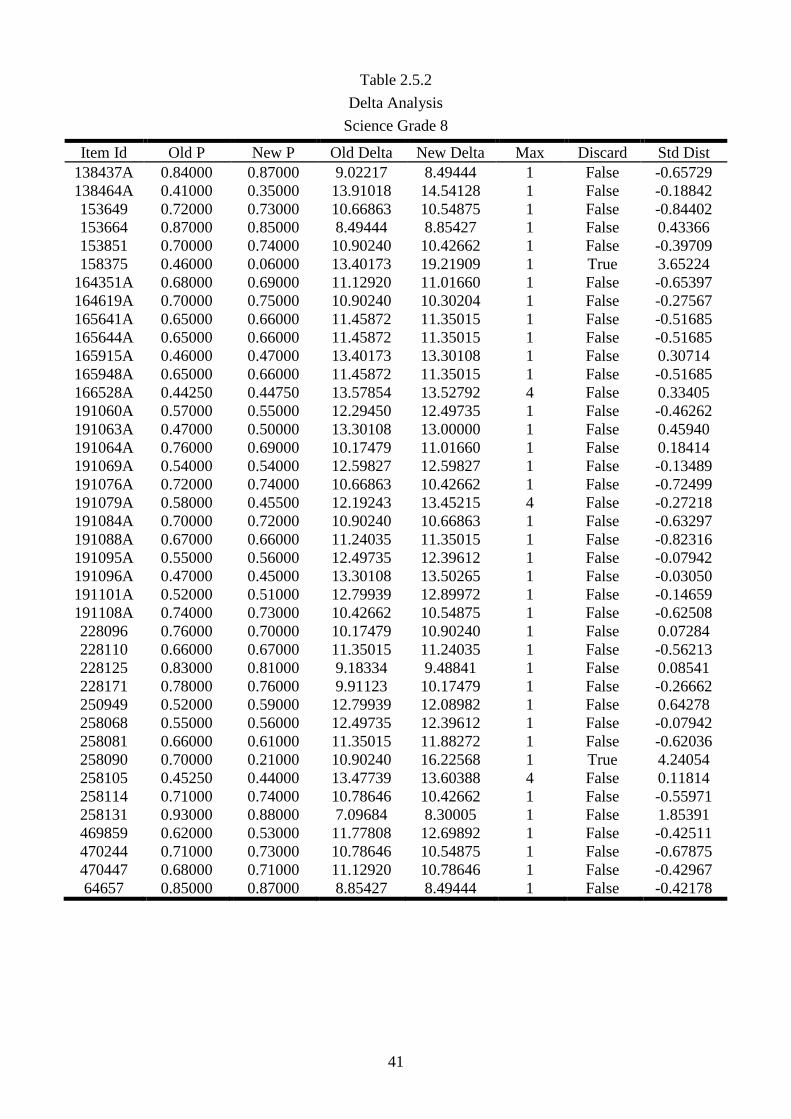
Table 2.5.2
Delta Analysis
Science Grade 8
Item Id Old P New P Old Delta New Delta Max Discard Std Dist
138437A 0.84000 0.87000 9.02217 8.49444 1 False -0.65729
138464A 0.41000 0.35000 13.91018 14.54128 1 False -0.18842
153649 0.72000 0.73000 10.66863 10.54875 1 False -0.84402
153664 0.87000 0.85000 8.49444 8.85427 1 False 0.43366
153851 0.70000 0.74000 10.90240 10.42662 1 False -0.39709
158375 0.46000 0.06000 13.40173 19.21909 1 True 3.65224
164351A 0.68000 0.69000 11.12920 11.01660 1 False -0.65397
164619A 0.70000 0.75000 10.90240 10.30204 1 False -0.27567
165641A 0.65000 0.66000 11.45872 11.35015 1 False -0.51685
165644A 0.65000 0.66000 11.45872 11.35015 1 False -0.51685
165915A 0.46000 0.47000 13.40173 13.30108 1 False 0.30714
165948A 0.65000 0.66000 11.45872 11.35015 1 False -0.51685
166528A 0.44250 0.44750 13.57854 13.52792 4 False 0.33405
191060A 0.57000 0.55000 12.29450 12.49735 1 False -0.46262
191063A 0.47000 0.50000 13.30108 13.00000 1 False 0.45940
191064A 0.76000 0.69000 10.17479 11.01660 1 False 0.18414
191069A 0.54000 0.54000 12.59827 12.59827 1 False -0.13489
191076A 0.72000 0.74000 10.66863 10.42662 1 False -0.72499
191079A 0.58000 0.45500 12.19243 13.45215 4 False -0.27218
191084A 0.70000 0.72000 10.90240 10.66863 1 False -0.63297
191088A 0.67000 0.66000 11.24035 11.35015 1 False -0.82316
191095A 0.55000 0.56000 12.49735 12.39612 1 False -0.07942
191096A 0.47000 0.45000 13.30108 13.50265 1 False -0.03050
191101A 0.52000 0.51000 12.79939 12.89972 1 False -0.14659
191108A 0.74000 0.73000 10.42662 10.54875 1 False -0.62508
228096 0.76000 0.70000 10.17479 10.90240 1 False 0.07284
228110 0.66000 0.67000 11.35015 11.24035 1 False -0.56213
228125 0.83000 0.81000 9.18334 9.48841 1 False 0.08541
228171 0.78000 0.76000 9.91123 10.17479 1 False -0.26662
250949 0.52000 0.59000 12.79939 12.08982 1 False 0.64278
258068 0.55000 0.56000 12.49735 12.39612 1 False -0.07942
258081 0.66000 0.61000 11.35015 11.88272 1 False -0.62036
258090 0.70000 0.21000 10.90240 16.22568 1 True 4.24054
258105 0.45250 0.44000 13.47739 13.60388 4 False 0.11814
258114 0.71000 0.74000 10.78646 10.42662 1 False -0.55971
258131 0.93000 0.88000 7.09684 8.30005 1 False 1.85391
469859 0.62000 0.53000 11.77808 12.69892 1 False -0.42511
470244 0.71000 0.73000 10.78646 10.54875 1 False -0.67875
470447 0.68000 0.71000 11.12920 10.78646 1 False -0.42967
64657 0.85000 0.87000 8.85427 8.49444 1 False -0.42178
42
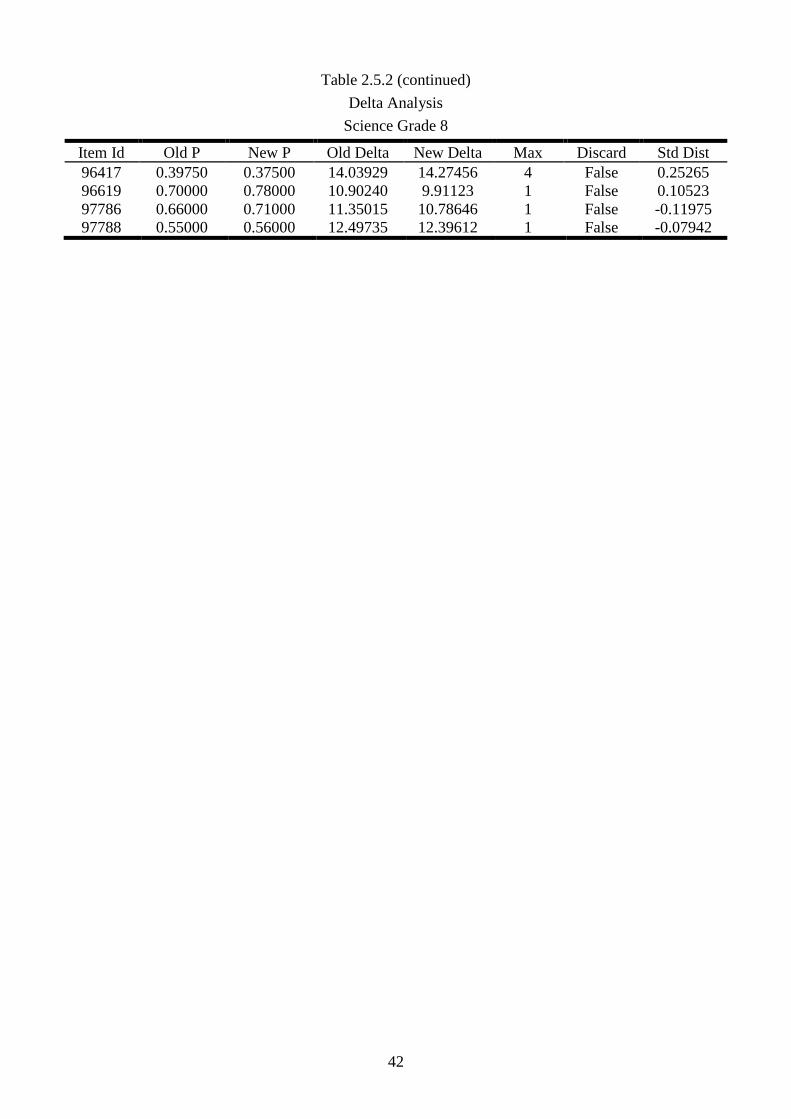
Table 2.5.2 (continued)
Delta Analysis
Science Grade 8
Item Id Old P New P Old Delta New Delta Max Discard Std Dist
96417 0.39750 0.37500 14.03929 14.27456 4 False 0.25265
96619 0.70000 0.78000 10.90240 9.91123 1 False 0.10523
97786 0.66000 0.71000 11.35015 10.78646 1 False -0.11975
97788 0.55000 0.56000 12.49735 12.39612 1 False -0.07942
43
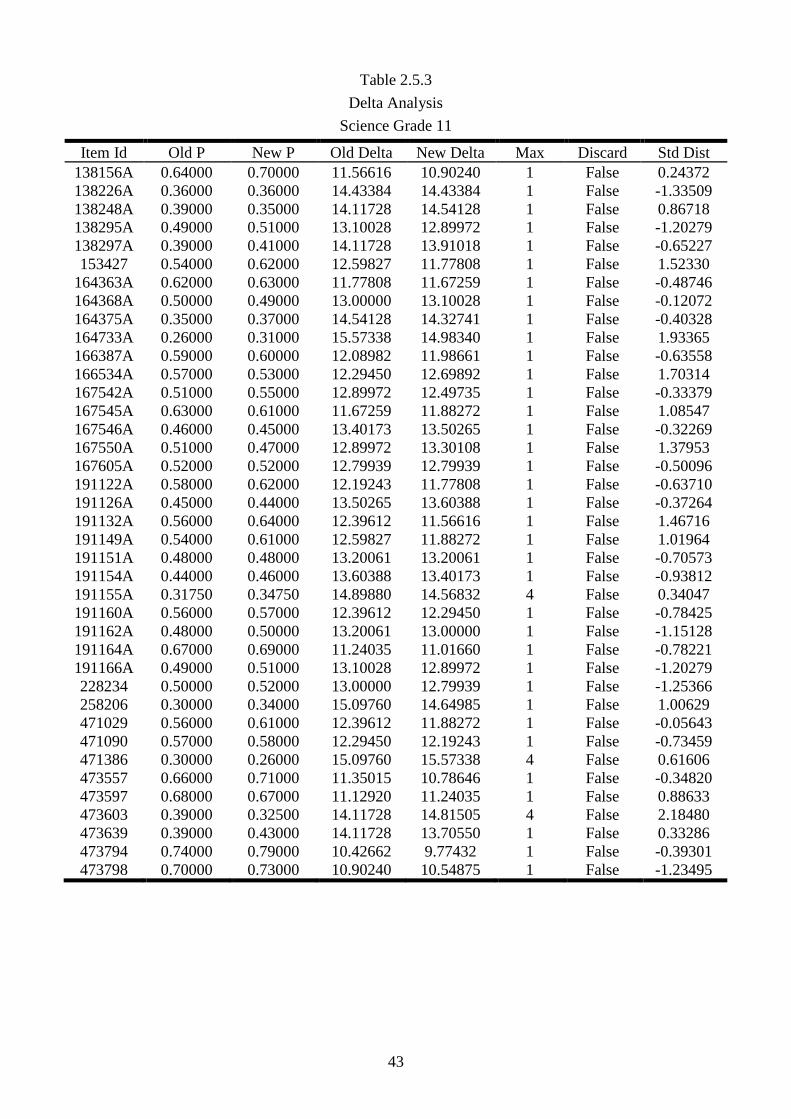
Table 2.5.3
Delta Analysis
Science Grade 11
Item Id Old P New P Old Delta New Delta Max Discard Std Dist
138156A 0.64000 0.70000 11.56616 10.90240 1 False 0.24372
138226A 0.36000 0.36000 14.43384 14.43384 1 False -1.33509
138248A 0.39000 0.35000 14.11728 14.54128 1 False 0.86718
138295A 0.49000 0.51000 13.10028 12.89972 1 False -1.20279
138297A 0.39000 0.41000 14.11728 13.91018 1 False -0.65227
153427 0.54000 0.62000 12.59827 11.77808 1 False 1.52330
164363A 0.62000 0.63000 11.77808 11.67259 1 False -0.48746
164368A 0.50000 0.49000 13.00000 13.10028 1 False -0.12072
164375A 0.35000 0.37000 14.54128 14.32741 1 False -0.40328
164733A 0.26000 0.31000 15.57338 14.98340 1 False 1.93365
166387A 0.59000 0.60000 12.08982 11.98661 1 False -0.63558
166534A 0.57000 0.53000 12.29450 12.69892 1 False 1.70314
167542A 0.51000 0.55000 12.89972 12.49735 1 False -0.33379
167545A 0.63000 0.61000 11.67259 11.88272 1 False 1.08547
167546A 0.46000 0.45000 13.40173 13.50265 1 False -0.32269
167550A 0.51000 0.47000 12.89972 13.30108 1 False 1.37953
167605A 0.52000 0.52000 12.79939 12.79939 1 False -0.50096
191122A 0.58000 0.62000 12.19243 11.77808 1 False -0.63710
191126A 0.45000 0.44000 13.50265 13.60388 1 False -0.37264
191132A 0.56000 0.64000 12.39612 11.56616 1 False 1.46716
191149A 0.54000 0.61000 12.59827 11.88272 1 False 1.01964
191151A 0.48000 0.48000 13.20061 13.20061 1 False -0.70573
191154A 0.44000 0.46000 13.60388 13.40173 1 False -0.93812
191155A 0.31750 0.34750 14.89880 14.56832 4 False 0.34047
191160A 0.56000 0.57000 12.39612 12.29450 1 False -0.78425
191162A 0.48000 0.50000 13.20061 13.00000 1 False -1.15128
191164A 0.67000 0.69000 11.24035 11.01660 1 False -0.78221
191166A 0.49000 0.51000 13.10028 12.89972 1 False -1.20279
228234 0.50000 0.52000 13.00000 12.79939 1 False -1.25366
258206 0.30000 0.34000 15.09760 14.64985 1 False 1.00629
471029 0.56000 0.61000 12.39612 11.88272 1 False -0.05643
471090 0.57000 0.58000 12.29450 12.19243 1 False -0.73459
471386 0.30000 0.26000 15.09760 15.57338 4 False 0.61606
473557 0.66000 0.71000 11.35015 10.78646 1 False -0.34820
473597 0.68000 0.67000 11.12920 11.24035 1 False 0.88633
473603 0.39000 0.32500 14.11728 14.81505 4 False 2.18480
473639 0.39000 0.43000 14.11728 13.70550 1 False 0.33286
473794 0.74000 0.79000 10.42662 9.77432 1 False -0.39301
473798 0.70000 0.73000 10.90240 10.54875 1 False -1.23495

44
Section 2.6
Tabled B/B Analysis Results
45
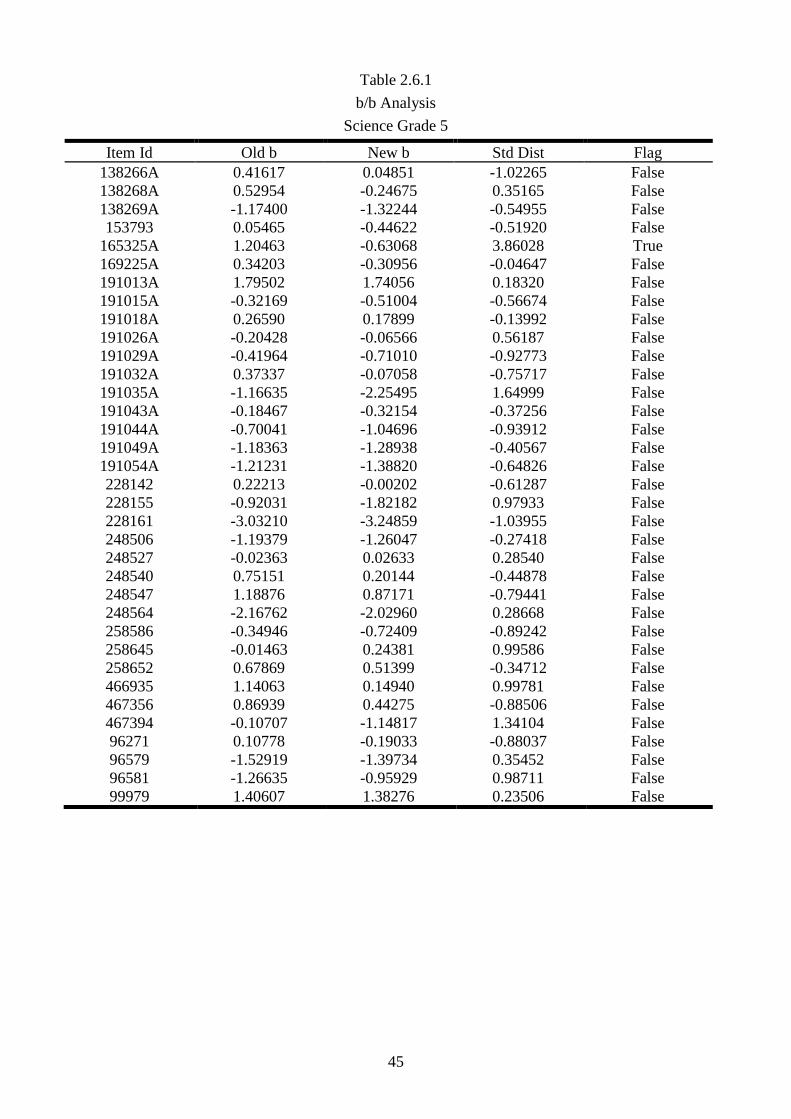
Table 2.6.1
b/b Analysis
Science Grade 5
Item Id Old b New b Std Dist Flag
138266A 0.41617 0.04851 -1.02265 False
138268A 0.52954 -0.24675 0.35165 False
138269A -1.17400 -1.32244 -0.54955 False
153793 0.05465 -0.44622 -0.51920 False
165325A 1.20463 -0.63068 3.86028 True
169225A 0.34203 -0.30956 -0.04647 False
191013A 1.79502 1.74056 0.18320 False
191015A -0.32169 -0.51004 -0.56674 False
191018A 0.26590 0.17899 -0.13992 False
191026A -0.20428 -0.06566 0.56187 False
191029A -0.41964 -0.71010 -0.92773 False
191032A 0.37337 -0.07058 -0.75717 False
191035A -1.16635 -2.25495 1.64999 False
191043A -0.18467 -0.32154 -0.37256 False
191044A -0.70041 -1.04696 -0.93912 False
191049A -1.18363 -1.28938 -0.40567 False
191054A -1.21231 -1.38820 -0.64826 False
228142 0.22213 -0.00202 -0.61287 False
228155 -0.92031 -1.82182 0.97933 False
228161 -3.03210 -3.24859 -1.03955 False
248506 -1.19379 -1.26047 -0.27418 False
248527 -0.02363 0.02633 0.28540 False
248540 0.75151 0.20144 -0.44878 False
248547 1.18876 0.87171 -0.79441 False
248564 -2.16762 -2.02960 0.28668 False
258586 -0.34946 -0.72409 -0.89242 False
258645 -0.01463 0.24381 0.99586 False
258652 0.67869 0.51399 -0.34712 False
466935 1.14063 0.14940 0.99781 False
467356 0.86939 0.44275 -0.88506 False
467394 -0.10707 -1.14817 1.34104 False
96271 0.10778 -0.19033 -0.88037 False
96579 -1.52919 -1.39734 0.35452 False
96581 -1.26635 -0.95929 0.98711 False
99979 1.40607 1.38276 0.23506 False
46
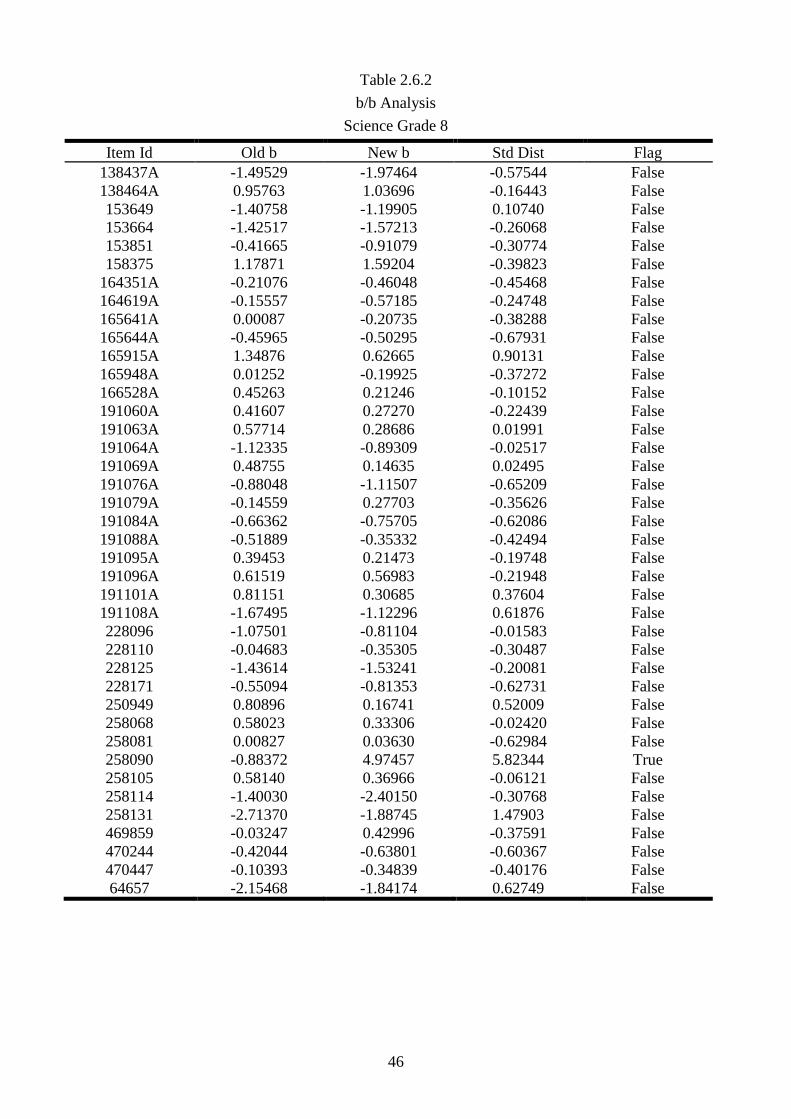
Table 2.6.2
b/b Analysis
Science Grade 8
Item Id Old b New b Std Dist Flag
138437A -1.49529 -1.97464 -0.57544 False
138464A 0.95763 1.03696 -0.16443 False
153649 -1.40758 -1.19905 0.10740 False
153664 -1.42517 -1.57213 -0.26068 False
153851 -0.41665 -0.91079 -0.30774 False
158375 1.17871 1.59204 -0.39823 False
164351A -0.21076 -0.46048 -0.45468 False
164619A -0.15557 -0.57185 -0.24748 False
165641A 0.00087 -0.20735 -0.38288 False
165644A -0.45965 -0.50295 -0.67931 False
165915A 1.34876 0.62665 0.90131 False
165948A 0.01252 -0.19925 -0.37272 False
166528A 0.45263 0.21246 -0.10152 False
191060A 0.41607 0.27270 -0.22439 False
191063A 0.57714 0.28686 0.01991 False
191064A -1.12335 -0.89309 -0.02517 False
191069A 0.48755 0.14635 0.02495 False
191076A -0.88048 -1.11507 -0.65209 False
191079A -0.14559 0.27703 -0.35626 False
191084A -0.66362 -0.75705 -0.62086 False
191088A -0.51889 -0.35332 -0.42494 False
191095A 0.39453 0.21473 -0.19748 False
191096A 0.61519 0.56983 -0.21948 False
191101A 0.81151 0.30685 0.37604 False
191108A -1.67495 -1.12296 0.61876 False
228096 -1.07501 -0.81104 -0.01583 False
228110 -0.04683 -0.35305 -0.30487 False
228125 -1.43614 -1.53241 -0.20081 False
228171 -0.55094 -0.81353 -0.62731 False
250949 0.80896 0.16741 0.52009 False
258068 0.58023 0.33306 -0.02420 False
258081 0.00827 0.03630 -0.62984 False
258090 -0.88372 4.97457 5.82344 True
258105 0.58140 0.36966 -0.06121 False
258114 -1.40030 -2.40150 -0.30768 False
258131 -2.71370 -1.88745 1.47903 False
469859 -0.03247 0.42996 -0.37591 False
470244 -0.42044 -0.63801 -0.60367 False
470447 -0.10393 -0.34839 -0.40176 False
64657 -2.15468 -1.84174 0.62749 False
47
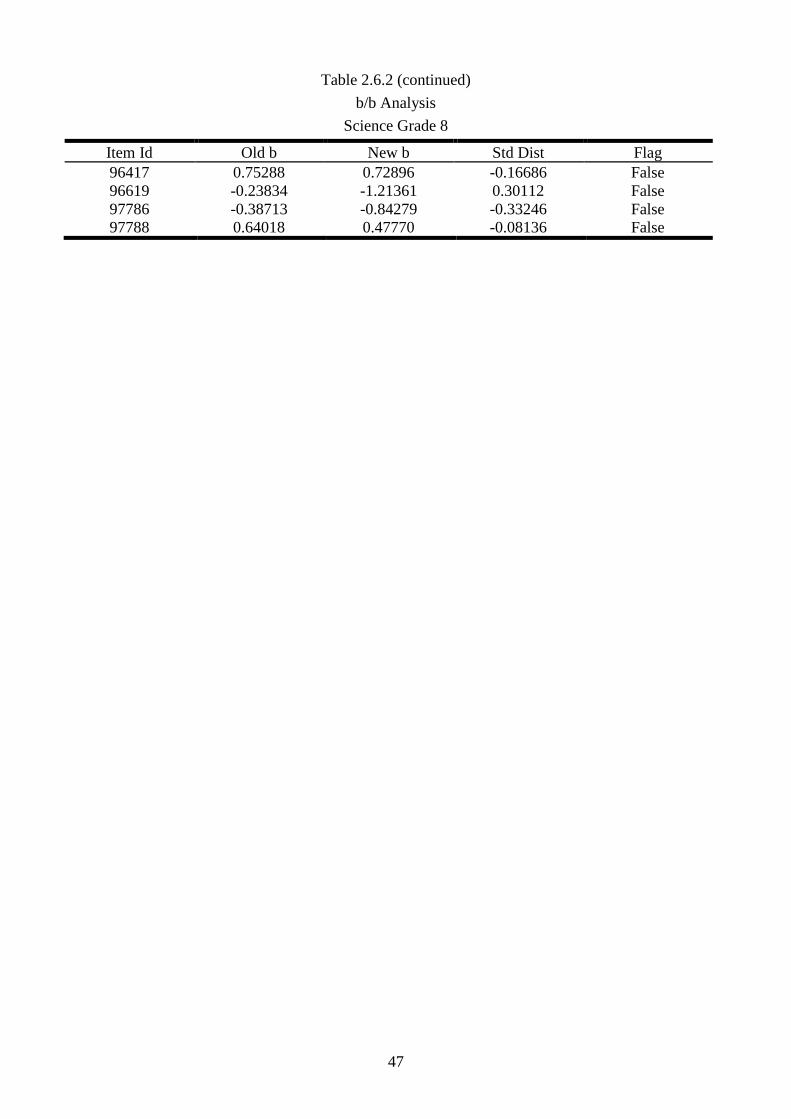
Table 2.6.2 (continued)
b/b Analysis
Science Grade 8
Item Id Old b New b Std Dist Flag
96417 0.75288 0.72896 -0.16686 False
96619 -0.23834 -1.21361 0.30112 False
97786 -0.38713 -0.84279 -0.33246 False
97788 0.64018 0.47770 -0.08136 False

48
Table 2.6.3
b/b Analysis
Science Grade 11
Item Id Old b New b Std Dist Flag
138156A -0.05019 -0.43474 -0.61281 False
138226A 1.72614 1.37668 0.31239 False
138248A 1.38753 1.21948 -0.67359 False
138295A 0.74162 0.53435 -0.89612 False
138297A 1.39884 1.15213 -0.32817 False
153427 0.23500 0.16777 -0.42332 False
164363A -0.04466 -0.32548 -1.05594 False
164368A 1.50802 0.63925 2.41546 False
164375A 1.28623 1.31871 -0.63106 False
164733A 1.78164 1.64467 -0.56859 False
166387A 0.11389 -0.79892 1.76034 False
166534A 0.21793 0.47765 0.99429 False
167542A 0.69688 0.56183 -0.99507 False
167545A -0.02006 -0.14251 -0.50646 False
167546A 0.76814 0.69909 -0.75417 False
167550A 0.73316 0.72489 -0.47137 False
167605A 0.57424 0.47023 -0.78717 False
191122A -0.29706 -0.30500 0.15424 False
191126A 1.52378 0.88671 1.42772 False
191132A -0.48914 -1.16440 0.37252 False
191149A 0.15523 -0.00502 -0.77537 False
191151A 0.85084 0.62499 -0.74998 False
191154A 0.61154 0.51492 -0.77796 False
191155A 0.94767 0.70623 -0.62421 False
191160A 0.43021 0.23375 -1.09783 False
191162A 0.85296 0.48644 -0.14322 False
191164A -0.16410 -0.63830 -0.29596 False
191166A 0.69529 0.39938 -0.54267 False
228234 0.62915 0.15026 0.20484 False
228332 0.13320 0.38378 1.00628 False
248420 0.15202 0.52817 1.53536 False
258181 0.09063 0.96974 3.73740 True
258187 -0.69150 -0.64590 0.62367 False
258206 1.42778 1.60937 -0.07502 False
471029 -0.35972 -0.39140 0.09002 False
471090 0.34074 -0.16754 0.15660 False
471386 1.13468 1.28548 -0.02997 False
473557 -0.17953 -0.65252 -0.31051 False
473597 -0.22410 -0.61299 -0.69950 False
473603 0.59930 0.88043 0.85538 False
49
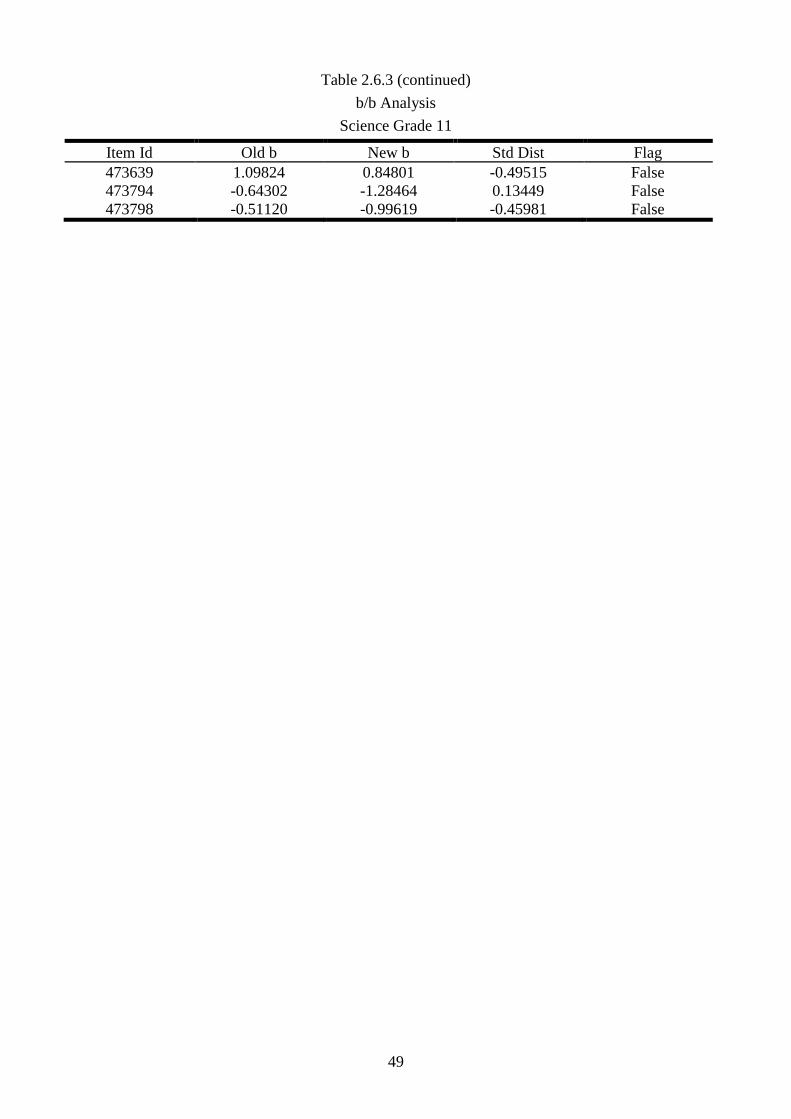
Table 2.6.3 (continued)
b/b Analysis
Science Grade 11
Item Id Old b New b Std Dist Flag
473639 1.09824 0.84801 -0.49515 False
473794 -0.64302 -1.28464 0.13449 False
473798 -0.51120 -0.99619 -0.45981 False
50
Section 2.7
Final Item Parameters
51
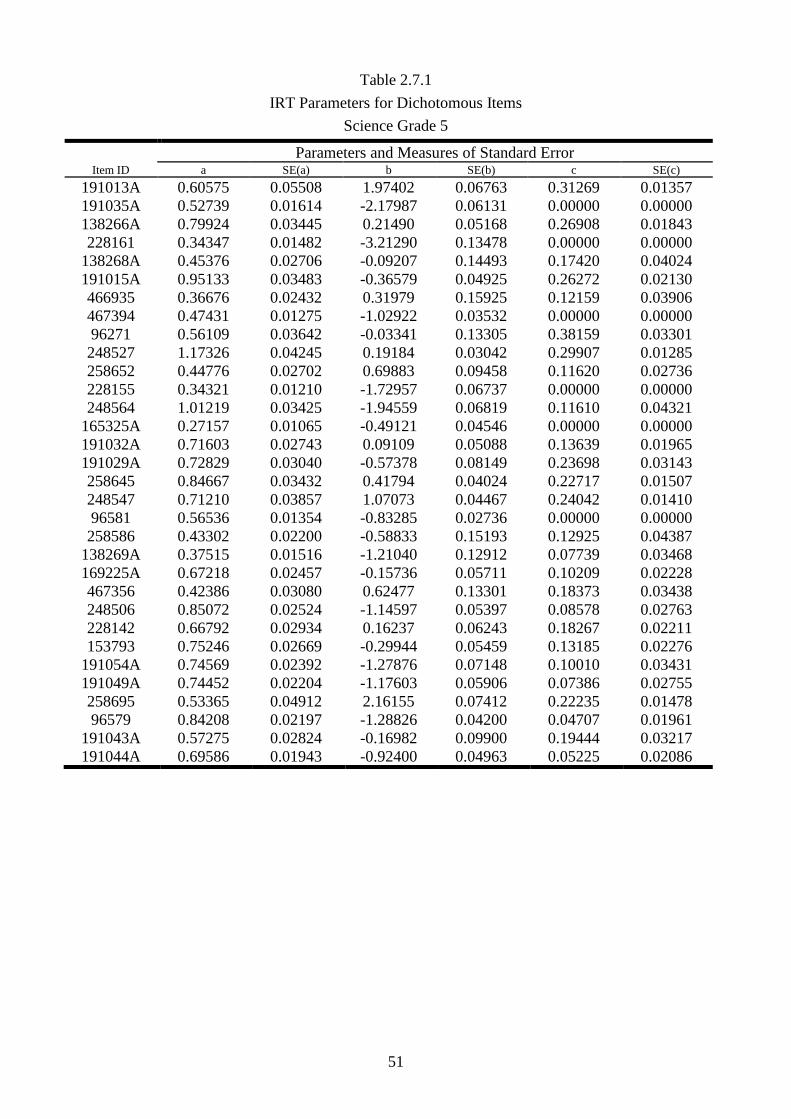
Table 2.7.1
IRT Parameters for Dichotomous Items
Science Grade 5
Item ID
Parameters and Measures of Standard Error a SE(a) b SE(b) c SE(c)
191013A 0.60575 0.05508 1.97402 0.06763 0.31269 0.01357
191035A 0.52739 0.01614 -2.17987 0.06131 0.00000 0.00000
138266A 0.79924 0.03445 0.21490 0.05168 0.26908 0.01843
228161 0.34347 0.01482 -3.21290 0.13478 0.00000 0.00000
138268A 0.45376 0.02706 -0.09207 0.14493 0.17420 0.04024
191015A 0.95133 0.03483 -0.36579 0.04925 0.26272 0.02130
466935 0.36676 0.02432 0.31979 0.15925 0.12159 0.03906
467394 0.47431 0.01275 -1.02922 0.03532 0.00000 0.00000
96271 0.56109 0.03642 -0.03341 0.13305 0.38159 0.03301
248527 1.17326 0.04245 0.19184 0.03042 0.29907 0.01285
258652 0.44776 0.02702 0.69883 0.09458 0.11620 0.02736
228155 0.34321 0.01210 -1.72957 0.06737 0.00000 0.00000
248564 1.01219 0.03425 -1.94559 0.06819 0.11610 0.04321
165325A 0.27157 0.01065 -0.49121 0.04546 0.00000 0.00000
191032A 0.71603 0.02743 0.09109 0.05088 0.13639 0.01965
191029A 0.72829 0.03040 -0.57378 0.08149 0.23698 0.03143
258645 0.84667 0.03432 0.41794 0.04024 0.22717 0.01507
248547 0.71210 0.03857 1.07073 0.04467 0.24042 0.01410
96581 0.56536 0.01354 -0.83285 0.02736 0.00000 0.00000
258586 0.43302 0.02200 -0.58833 0.15193 0.12925 0.04387
138269A 0.37515 0.01516 -1.21040 0.12912 0.07739 0.03468
169225A 0.67218 0.02457 -0.15736 0.05711 0.10209 0.02228
467356 0.42386 0.03080 0.62477 0.13301 0.18373 0.03438
248506 0.85072 0.02524 -1.14597 0.05397 0.08578 0.02763
228142 0.66792 0.02934 0.16237 0.06243 0.18267 0.02211
153793 0.75246 0.02669 -0.29944 0.05459 0.13185 0.02276
191054A 0.74569 0.02392 -1.27876 0.07148 0.10010 0.03431
191049A 0.74452 0.02204 -1.17603 0.05906 0.07386 0.02755
258695 0.53365 0.04912 2.16155 0.07412 0.22235 0.01478
96579 0.84208 0.02197 -1.28826 0.04200 0.04707 0.01961
191043A 0.57275 0.02824 -0.16982 0.09900 0.19444 0.03217
191044A 0.69586 0.01943 -0.92400 0.04963 0.05225 0.02086
52
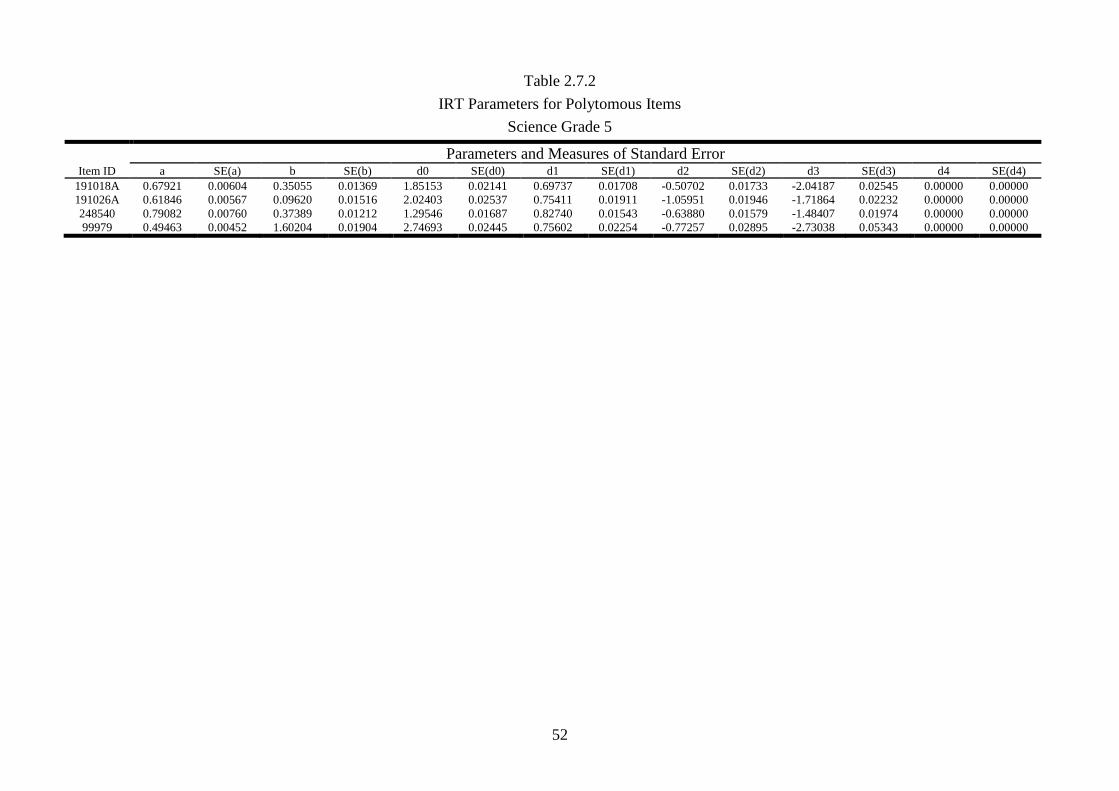
Table 2.7.2
IRT Parameters for Polytomous Items
Science Grade 5
Item ID
Parameters and Measures of Standard Error a SE(a) b SE(b) d0 SE(d0) d1 SE(d1) d2 SE(d2) d3 SE(d3) d4 SE(d4)
191018A 0.67921 0.00604 0.35055 0.01369 1.85153 0.02141 0.69737 0.01708 -0.50702 0.01733 -2.04187 0.02545 0.00000 0.00000
191026A 0.61846 0.00567 0.09620 0.01516 2.02403 0.02537 0.75411 0.01911 -1.05951 0.01946 -1.71864 0.02232 0.00000 0.00000
248540 0.79082 0.00760 0.37389 0.01212 1.29546 0.01687 0.82740 0.01543 -0.63880 0.01579 -1.48407 0.01974 0.00000 0.00000
99979 0.49463 0.00452 1.60204 0.01904 2.74693 0.02445 0.75602 0.02254 -0.77257 0.02895 -2.73038 0.05343 0.00000 0.00000

53
Table 2.7.3
IRT Parameters for Dichotomous Items
Science Grade 8
Item ID
Parameters and Measures of Standard Error a SE(a) b SE(b) c SE(c)
258114 0.20410 0.01389 -2.34017 0.41097 0.13713 0.06144
138437A 0.58261 0.02473 -1.88880 0.15801 0.18714 0.06313
191084A 0.71154 0.02705 -0.60130 0.07097 0.16492 0.02832
470447 0.69254 0.03420 -0.16917 0.08338 0.33207 0.02591
97786 0.53820 0.02460 -0.69196 0.11634 0.15469 0.03881
165644A 0.58699 0.02565 -0.33261 0.08648 0.14949 0.02986
97788 0.50501 0.03505 0.70435 0.09871 0.26234 0.02622
164619A 0.74738 0.03364 -0.40546 0.07866 0.31948 0.02690
153649 0.47616 0.01883 -1.06867 0.11484 0.09550 0.03732
165641A 1.07571 0.03623 -0.02003 0.03246 0.23106 0.01444
191063A 0.73227 0.02962 0.50255 0.04087 0.14487 0.01512
258090 0.10086 0.02315 5.45942 1.30022 0.28615 0.06920
158375 0.02948 0.00671 1.88267 9.69142 0.69270 0.07130
191069A 0.93115 0.03245 0.35398 0.03084 0.16656 0.01266
191088A 0.43394 0.02977 -0.17438 0.18070 0.24110 0.04465
165948A 0.62964 0.03204 -0.01147 0.08550 0.27549 0.02640
228171 0.88455 0.03039 -0.66102 0.05333 0.18720 0.02418
153664 0.88399 0.02329 -1.46318 0.04203 0.04666 0.01930
96619 0.68594 0.02277 -1.08407 0.07230 0.09725 0.03094
228125 0.61225 0.01899 -1.42117 0.07352 0.07018 0.02920
191076A 0.60883 0.01915 -0.97987 0.06641 0.06621 0.02555
153851 0.72776 0.02454 -0.76386 0.06258 0.10952 0.02674
164351A 1.15164 0.03403 -0.28770 0.02873 0.15941 0.01445
64657 0.74877 0.02133 -1.74827 0.05731 0.05701 0.02488
228110 0.70405 0.02998 -0.17410 0.06767 0.22302 0.02423
228096 0.58814 0.02281 -0.65839 0.08491 0.11060 0.03111
258081 0.93308 0.03575 0.23761 0.03774 0.25176 0.01472
470244 0.88335 0.03109 -0.47542 0.05079 0.20621 0.02208
258068 0.66997 0.03419 0.55141 0.05837 0.24939 0.01864
191060A 0.54083 0.03072 0.48758 0.08224 0.19734 0.02465
191101A 0.47988 0.02730 0.52369 0.08833 0.13123 0.02624
258131 0.73829 0.02325 -1.79660 0.07549 0.08954 0.03601
250949 0.73006 0.03363 0.37625 0.05339 0.24937 0.01808
469859 0.76756 0.03537 0.65387 0.04328 0.23463 0.01487
138464A 0.81408 0.03825 1.29572 0.03093 0.14948 0.00957
165915A 0.38744 0.02773 0.86185 0.11836 0.12200 0.03092
191064A 0.55467 0.01948 -0.74515 0.07709 0.07535 0.02750
191108A 0.59124 0.01785 -0.98822 0.06141 0.05511 0.02268
191095A 0.99686 0.03689 0.42628 0.03075 0.22598 0.01228
54
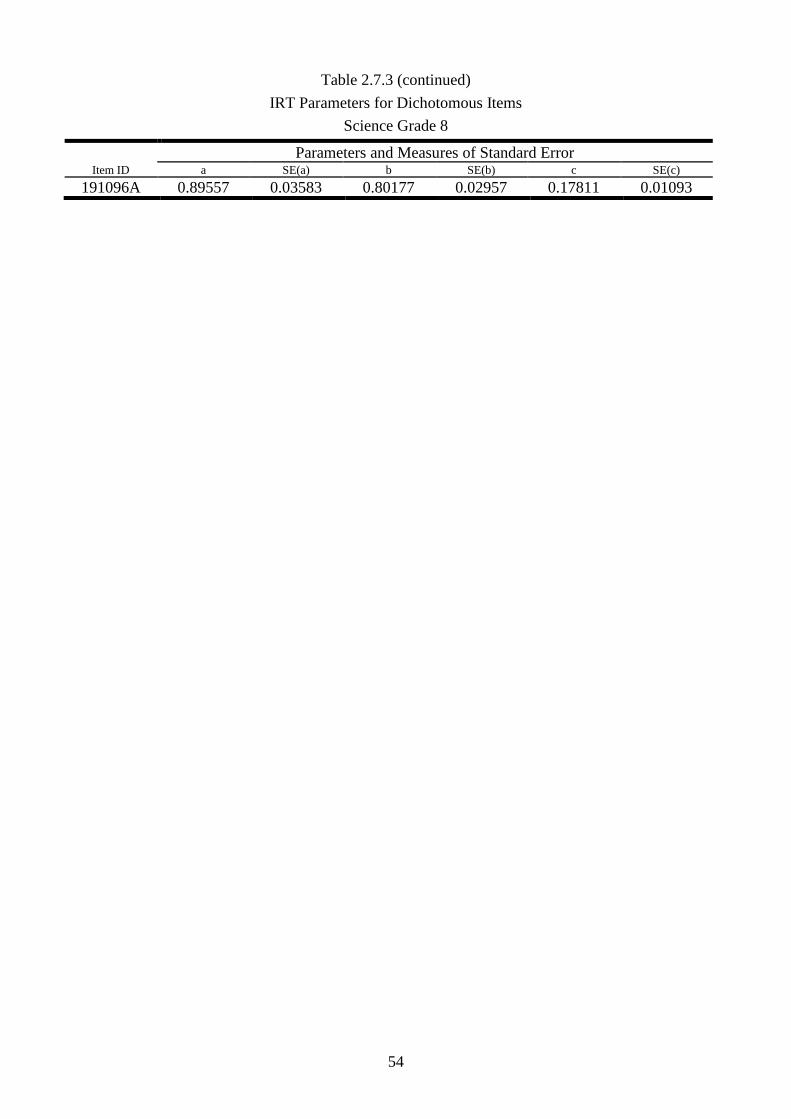
Table 2.7.3 (continued)
IRT Parameters for Dichotomous Items
Science Grade 8
Item ID
Parameters and Measures of Standard Error a SE(a) b SE(b) c SE(c)
191096A 0.89557 0.03583 0.80177 0.02957 0.17811 0.01093

55
Table 2.7.4
IRT Parameters for Polytomous Items
Science Grade 8
Item ID
Parameters and Measures of Standard Error a SE(a) b SE(b) d0 SE(d0) d1 SE(d1) d2 SE(d2) d3 SE(d3) d4 SE(d4)
166528A 0.95785 0.00875 0.42388 0.01006 1.50530 0.01584 0.50806 0.01292 -0.42126 0.01347 -1.59209 0.01962 0.00000 0.00000
191079A 0.61851 0.00545 0.49216 0.01520 2.19341 0.02395 0.84573 0.01865 -0.60581 0.01951 -2.43335 0.03237 0.00000 0.00000
258105 0.64975 0.00573 0.59011 0.01473 2.23143 0.02298 1.04424 0.01815 -0.97140 0.02057 -2.30427 0.03175 0.00000 0.00000
96417 0.80532 0.00731 0.97004 0.01200 2.00812 0.01735 0.77016 0.01467 -0.52195 0.01762 -2.25633 0.03753 0.00000 0.00000

56
Table 2.7.5
IRT Parameters for Dichotomous Items
Science Grade 11
Item ID
Parameters and Measures of Standard Error a SE(a) b SE(b) c SE(c)
473794 0.58501 0.02956 -1.04739 0.15523 0.20190 0.05873
191132A 0.32226 0.01276 -0.93577 0.05184 0.00000 0.00000
167550A 1.27797 0.05444 0.81819 0.02314 0.25636 0.00924
164375A 0.90789 0.05356 1.36948 0.03408 0.22165 0.01013
167546A 0.68955 0.03661 0.79424 0.04743 0.15182 0.01777
164368A 0.34064 0.02877 0.73869 0.17981 0.12101 0.04272
258206 0.85505 0.05830 1.63932 0.04148 0.21766 0.00983
166387A 0.35431 0.01281 -0.59647 0.03931 0.00000 0.00000
473557 0.89233 0.03229 -0.46055 0.05333 0.14688 0.02647
138156A 1.16980 0.03904 -0.25837 0.03384 0.18767 0.01829
191154A 0.85847 0.03606 0.62326 0.03333 0.13849 0.01387
153427 1.08624 0.04592 0.30098 0.03554 0.30085 0.01480
191122A 0.67454 0.02980 -0.13792 0.07202 0.13216 0.02882
191166A 0.56906 0.03386 0.51600 0.07961 0.15214 0.02703
473798 0.64723 0.02615 -0.77960 0.09243 0.12002 0.03922
167542A 1.11850 0.05195 0.66681 0.03093 0.31667 0.01181
138248A 1.26124 0.06190 1.27736 0.02375 0.21348 0.00729
164733A 0.99673 0.06383 1.67209 0.03717 0.20655 0.00793
228234 0.46763 0.02544 0.28472 0.09703 0.08774 0.03031
191162A 0.77616 0.03737 0.59682 0.04410 0.17999 0.01717
166534A 0.82408 0.04136 0.58866 0.04502 0.24396 0.01686
191160A 1.01923 0.04217 0.36223 0.03479 0.24514 0.01478
473597 0.75491 0.02727 -0.42385 0.05852 0.09683 0.02672
164363A 1.09850 0.03242 -0.15694 0.02772 0.08826 0.01481
191164A 0.96191 0.02870 -0.44735 0.03663 0.07417 0.01937
471090 0.72917 0.02845 -0.01031 0.05233 0.09654 0.02224
138297A 0.77474 0.04667 1.21483 0.03953 0.21190 0.01325
138295A 0.89585 0.04208 0.64130 0.03735 0.23035 0.01457
471029 0.77296 0.02444 -0.21814 0.04102 0.05655 0.01843
167545A 1.03147 0.03592 0.01293 0.03393 0.16018 0.01661
191126A 0.55090 0.03771 0.96842 0.07031 0.15863 0.02353
473639 1.15708 0.05126 0.93250 0.02448 0.22565 0.00934
167605A 1.00283 0.04325 0.58178 0.03205 0.23175 0.01314
138226A 0.57679 0.04178 1.42330 0.05393 0.14620 0.01781
191149A 0.83772 0.03652 0.14057 0.05035 0.21023 0.02075
191151A 0.99033 0.04344 0.72545 0.03003 0.21072 0.01210

57
Table 2.7.6
IRT Parameters for Polytomous Items
Science Grade 11
Item ID
Parameters and Measures of Standard Error a SE(a) b SE(b) d0 SE(d0) d1 SE(d1) d2 SE(d2) d3 SE(d3) d4 SE(d4)
191155A 1.10606 0.01091 0.80087 0.00925 1.24311 0.01232 0.43995 0.01154 -0.36011 0.01345 -1.32296 0.02123 0.00000 0.00000
471386 0.93825 0.00959 1.33863 0.01119 1.57519 0.01349 0.44403 0.01405 -0.51618 0.01929 -1.50304 0.03340 0.00000 0.00000
473603 0.99563 0.00986 0.96259 0.01027 1.38069 0.01320 0.58453 0.01253 -0.46056 0.01570 -1.50466 0.02651 0.00000 0.00000

58
Section 2.8
Fit Plots of Watchlist Items
59
60
61
62

63
64