main title option 1 second line title - tata communications awareness and loyalty. customer...
TRANSCRIPT

2ND QUARTER - FY2018
INVESTOR PRESENTATION

SOME OF THE STATEMENTS HEREIN CONSTITUTE “FORWARD-LOOKING STATEMENTS” THAT DO NOT
DIRECTLY OR EXCLUSIVELY RELATE TO HISTORICAL FACTS. THESE FORWARD-LOOKING STATEMENTS
REFLECT OUR INTENTIONS, PLANS, EXPECTATIONS, ASSUMPTIONS AND BELIEFS ABOUT FUTURE EVENTS
AND ARE SUBJECT TO RISKS, UNCERTAINTIES AND OTHER FACTORS, MANY OF WHICH ARE OUTSIDE OUR
CONTROL. IMPORTANT FACTORS THAT COULD CAUSE ACTUAL RESULTS TO DIFFER MATERIALLY FROM
THE EXPECTATIONS EXPRESSED OR IMPLIED IN THE FORWARD-LOOKING STATEMENTS INCLUDE KNOWN
AND UNKNOWN RISKS. BECAUSE ACTUAL RESULTS COULD DIFFER MATERIALLY FROM OUR INTENTIONS,
PLANS, EXPECTATIONS, ASSUMPTIONS AND BELIEFS ABOUT THE FUTURE, YOU ARE URGED TO VIEW ALL
FORWARD-LOOKING STATEMENTS CONTAINED HEREIN WITH CAUTION. TATA COMMUNICATIONS DOES
NOT UNDERTAKE ANY OBLIGATION TO UPDATE OR REVISE FORWARD LOOKING STATEMENTS, WHETHER
AS A RESULT OF NEW INFORMATION, FUTURE EVENTS OR OTHERWISE.
SAFE HARBOUR
2

• BUSINESS OVERVIEW
• FINANCIAL OVERVIEW
AGENDA
3
BUSINESS OVERVIEW
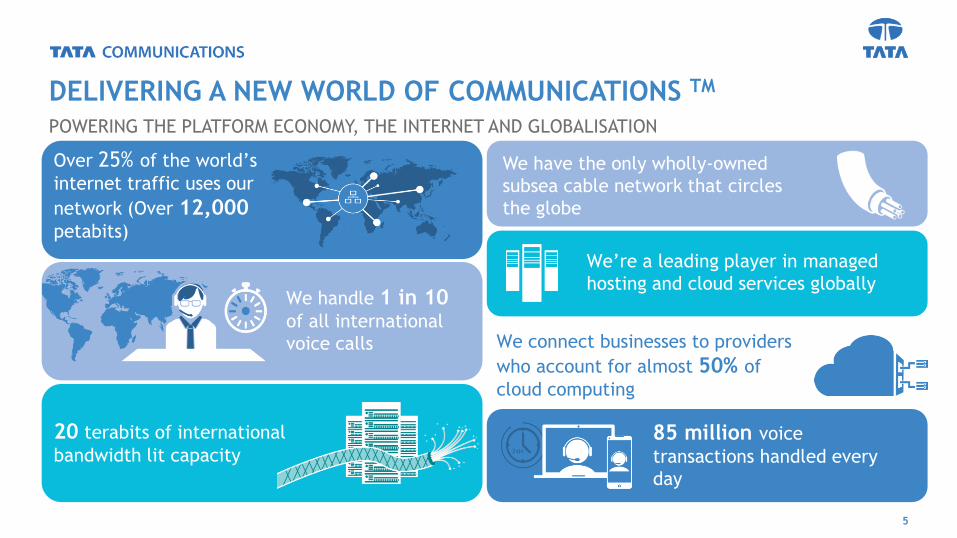
POWERING THE PLATFORM ECONOMY, THE INTERNET AND GLOBALISATION
DELIVERING A NEW WORLD OF COMMUNICATIONS TM
Over 25% of the world’s
internet traffic uses our
network (Over 12,000petabits)
We handle 1 in 10 of all international
voice calls
20 terabits of international
bandwidth lit capacity85 million voice
transactions handled every
day
We connect businesses to providers
who account for almost 50% of
cloud computing
We’re a leading player in managed
hosting and cloud services globally
We have the only wholly-owned
subsea cable network that circles
the globe
5

TRANSFORMING FROM AN INDIAN PSU TO A DIGITAL ENABLEMENT PLAYER
GROWTH STORY
InnovationGrowthTransformation
World’s 1st LTE roaming peering with Telecom Italia Sparkle
100G connectivity to carriers & enterprises across the US & Europe
Jamvee™ launchedLaunch of IZOTM
2002
Tata Group acquires stake in VSNL
2008
VSNL, VSNL International, CIPRIS, Tata Indicom Enterprise BU & Teleglobe unite
as TCL
2010
Launch of Cloud Services, and Next Generation Ethernet
Network
2011
New Verticals – Media, Banking, Healthcare
2012
Official connectivity partnership with F1®
2013
2014
Joined forces with Google, Microsoft Azure and AWS to deliver cloud
enablement platform
2015
Partnered with Salesforce to interconnect businesses to the cloud
Signed first UK advertising sponsorship deal with the Heathrow Express
2016-17
#1 International Wholesale Voice#1 India Large Enterprise
Leader in Global Network Services (Gartner) - 4th Year in a row
Exited Neotel & Data Center – 2017Launched MOVE, and NetFoundry
6

GLOBAL REACH – PROVIDING CONNECTIVITY ACROSS THE WORLD
7
Global
Backbone
Leadership
in Global
SIP
Trunking
“Ring
Around
the
World”
25% of
World’s
internet
routes
Over 40 Entities across the globe

PRODUCTS AND SERVICESPROVIDER OF ENTERPRISE & WHOLESALE DATA SERVICES & WHOLESALE LONG DISTANCE VOICE SOLUTIONS
Data Services
Traditional
Services
Virtual
Private
Network
Intl Private
Line
Internet
Leased Line
Ethernet
Inmarsat
National Private Line
Mobility
Internet Protocol - Transit
Growth
Services
IZO & IZO
SDWAN
Managed
Hosting/
Cloud/GHCC
Managed
Security
Services
Video
Streaming
Video
Connect
UCC/ SIP -
Trunking
Broadcast
MOVE & IOTHealthcareMedia
Management
Subsidiaries TC Transformation Services Ltd TC Payment Services Ltd
International Long Distance National Long DistanceVoice Solutions
8
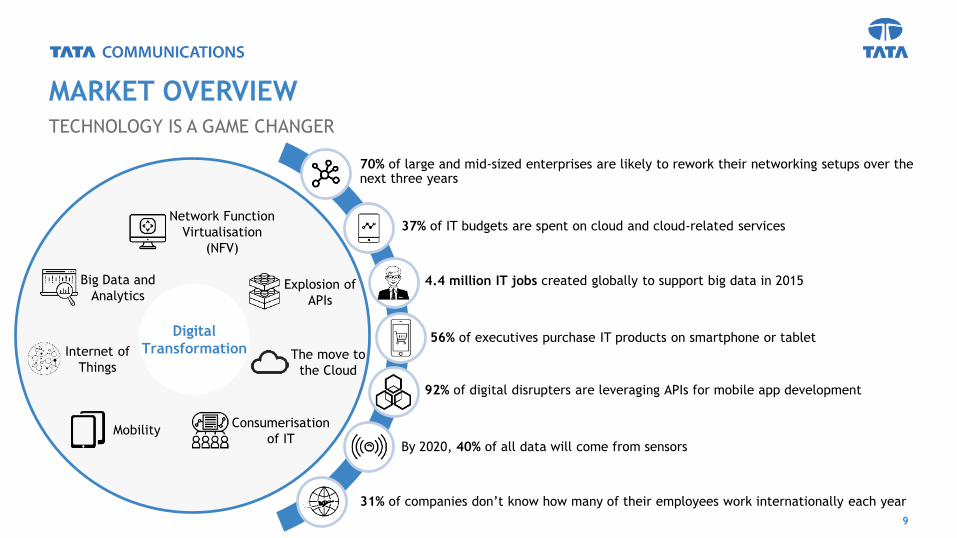
MARKET OVERVIEW
9
70% of large and mid-sized enterprises are likely to rework their networking setups over the next three years
4.4 million IT jobs created globally to support big data in 2015
37% of IT budgets are spent on cloud and cloud-related services
92% of digital disrupters are leveraging APIs for mobile app development
31% of companies don’t know how many of their employees work internationally each year
56% of executives purchase IT products on smartphone or tablet
By 2020, 40% of all data will come from sensors
The move to
the Cloud
Network Function
Virtualisation
(NFV)
Explosion of
APIs
Big Data and
Analytics
Mobility
Internet of
Things
Consumerisation
of IT
TECHNOLOGY IS A GAME CHANGER
Digital
Transformation

DIGITAL TYPICALLY DELIVERS VALUE ACROSS 4 IMPACT AREAS FOR BUSINESSES
BUSINESS THEMES SUPPORTING DIGITAL TRANSFORMATON
10
Driving their digital transformation on a global scale, organisations need best-in-class global
infrastructure and tools. They will power organisations’ expansion into new markets and
geographies, and allow them to innovate through new products, services and business models
to generate new revenue streams with agility.
Borderless
Growth
Managing business risk, organisations must secure their data and applications – which fuel their
growth in today’s digital economy – against external threats,
and ensure reliability and near-zero business disruption.
Managing
Business Risk
Boosting productivity and drive efficiencies via digital, organisations need to pave the way for
seamless multi-platform collaboration amongst their employees, partners and customers, and
empower them with ubiquitous access to data and applications.
Productivity
and Efficiency
Offering their digitally-savvy customers the seamless experiences they crave, organisations
need to embrace an omni-channel approach, which enables them to enhance customer
engagement, awareness and loyalty.
Customer
Experience and
Engagement
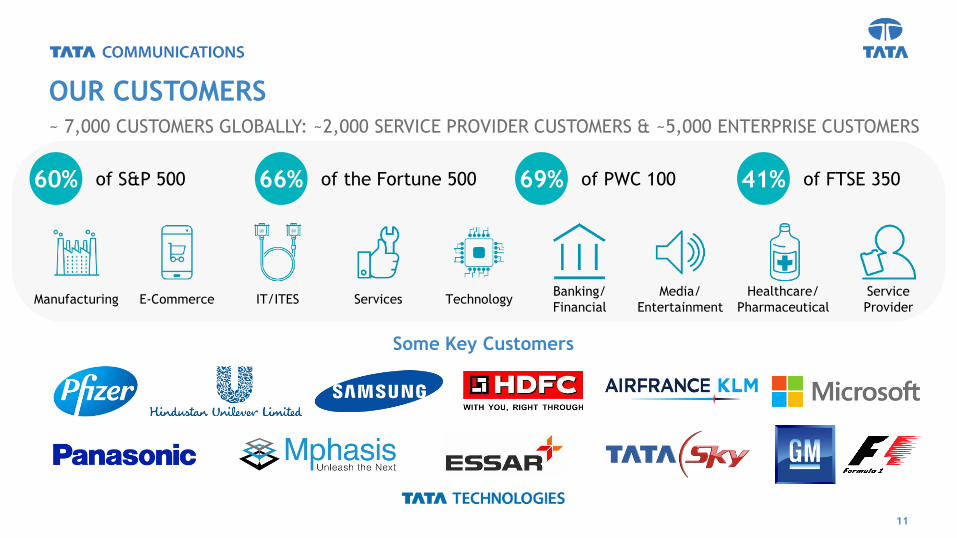
~ 7,000 CUSTOMERS GLOBALLY: ~2,000 SERVICE PROVIDER CUSTOMERS & ~5,000 ENTERPRISE CUSTOMERS
OUR CUSTOMERS
11
66% of the Fortune 500 41% of FTSE 35069% of PWC 100of S&P 50060%
Manufacturing E-Commerce IT/ITES Services TechnologyBanking/
Financial
Media/
Entertainment
Healthcare/
Pharmaceutical
Service
Provider
Some Key Customers
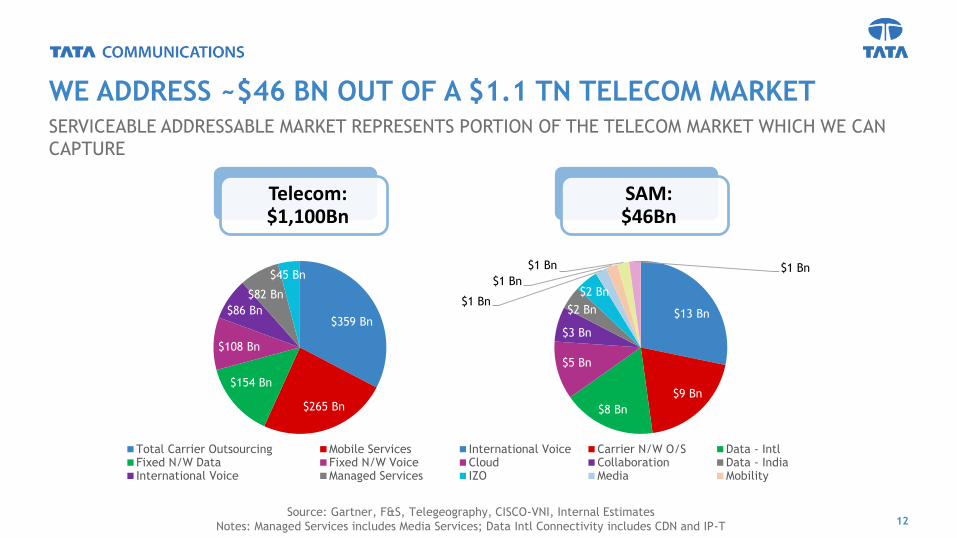
SERVICEABLE ADDRESSABLE MARKET REPRESENTS PORTION OF THE TELECOM MARKET WHICH WE CAN
CAPTURE
WE ADDRESS ~$46 BN OUT OF A $1.1 TN TELECOM MARKET
12
$359 Bn
$265 Bn
$154 Bn
$108 Bn
$86 Bn
$82 Bn
$45 Bn
Total Carrier Outsourcing Mobile ServicesFixed N/W Data Fixed N/W VoiceInternational Voice Managed Services
$13 Bn
$9 Bn
$8 Bn
$5 Bn
$3 Bn
$2 Bn
$2 Bn$1 Bn
$1 Bn
$1 Bn $1 Bn
International Voice Carrier N/W O/S Data - IntlCloud Collaboration Data - IndiaIZO Media Mobility
Telecom: $1,100Bn
SAM: $46Bn
Source: Gartner, F&S, Telegeography, CISCO-VNI, Internal Estimates
Notes: Managed Services includes Media Services; Data Intl Connectivity includes CDN and IP-T
13
(4)
9
9
1
10
8
2
10
2
1
3
5
2
7
0
1
1
2 3
4
7
2
4
2
3
4
5
9 9
13
Banking Solutions – 1
International Voice
Carrier Network
Data - International
Data - India
Cloud
Media – 1 UCC
IZO – 2
Healthcare – 1 Mobility - 1
MNaaS
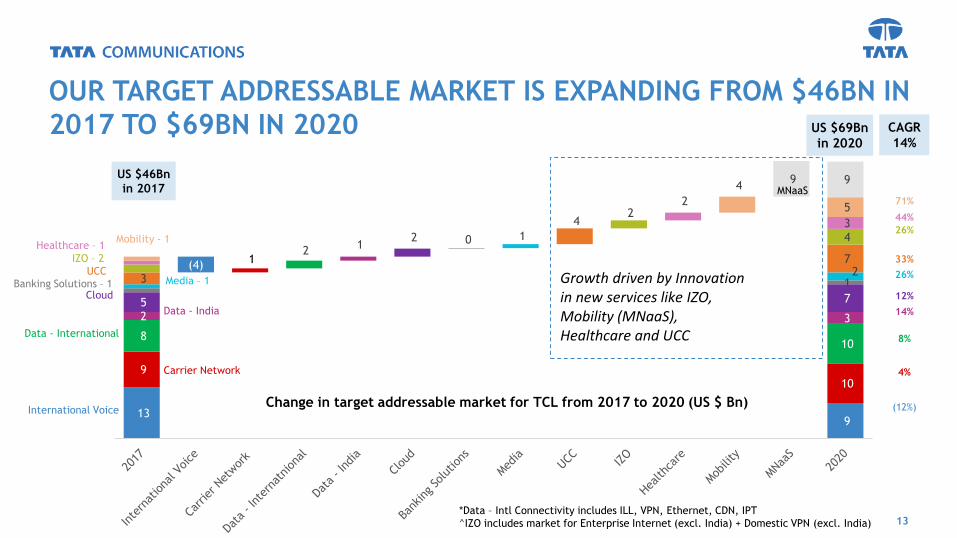
OUR TARGET ADDRESSABLE MARKET IS EXPANDING FROM $46BN IN
2017 TO $69BN IN 2020
*Data – Intl Connectivity includes ILL, VPN, Ethernet, CDN, IPT
^IZO includes market for Enterprise Internet (excl. India) + Domestic VPN (excl. India)
Growth driven by Innovation in new services like IZO, Mobility (MNaaS), Healthcare and UCC
US $69Bn
in 2020
US $46Bn
in 2017
CAGR
14%
26%
33%
26%
12%
14%
8%
4%
(12%)
71%
Change in target addressable market for TCL from 2017 to 2020 (US $ Bn)
44%
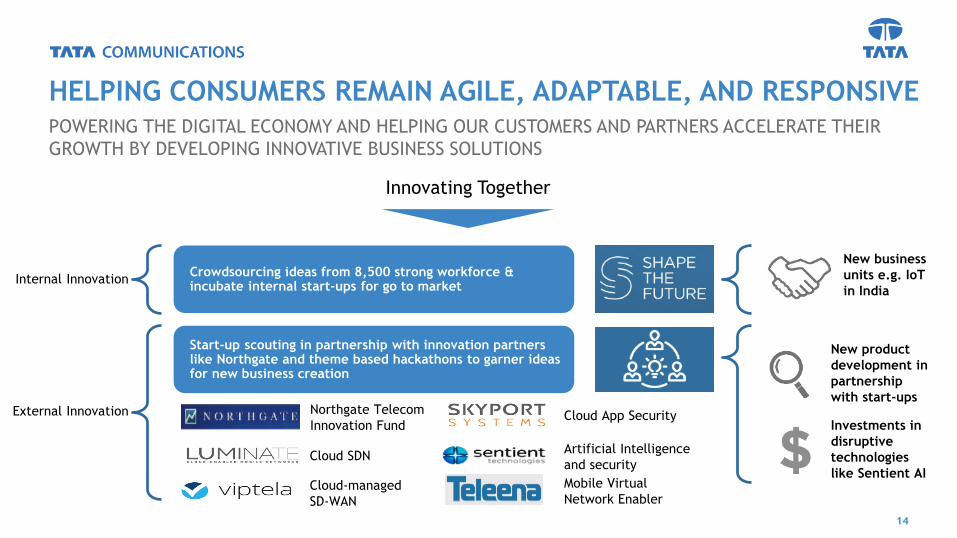
POWERING THE DIGITAL ECONOMY AND HELPING OUR CUSTOMERS AND PARTNERS ACCELERATE THEIR
GROWTH BY DEVELOPING INNOVATIVE BUSINESS SOLUTIONS
HELPING CONSUMERS REMAIN AGILE, ADAPTABLE, AND RESPONSIVE
14
Innovating Together
Internal InnovationCrowdsourcing ideas from 8,500 strong workforce & incubate internal start-ups for go to market
External Innovation
Start-up scouting in partnership with innovation partners like Northgate and theme based hackathons to garner ideas for new business creation
New business
units e.g. IoT
in India
New product
development in
partnership
with start-ups
Investments in
disruptive
technologies
like Sentient AI
Northgate Telecom
Innovation Fund
Cloud SDN
Cloud-managed
SD-WAN
Cloud App Security
Artificial Intelligence
and security
Mobile Virtual
Network Enabler
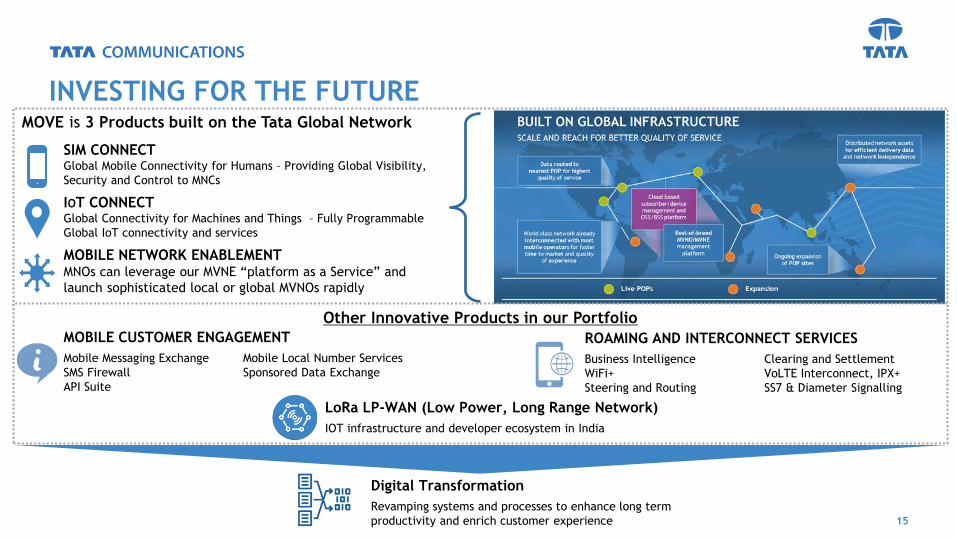
INVESTING FOR THE FUTURE
15
MOVE is 3 Products built on the Tata Global Network
SIM CONNECTGlobal Mobile Connectivity for Humans – Providing Global Visibility,
Security and Control to MNCs
IOT CONNECTGlobal Connectivity for Machines and Things – Fully Programmable
Global IoT connectivity and services
MOBILE NETWORK ENABLEMENTMNOs can leverage our MVNE “platform as a Service” and
launch sophisticated local or global MVNOs rapidly
Other Innovative Products in our Portfolio
Mobile Messaging Exchange
SMS Firewall
API Suite
Mobile Local Number Services
Sponsored Data Exchange
MOBILE CUSTOMER ENGAGEMENT
Business Intelligence
WiFi+
Steering and Routing
Clearing and Settlement
VoLTE Interconnect, IPX+
SS7 & Diameter Signalling
ROAMING AND INTERCONNECT SERVICES
IOT infrastructure and developer ecosystem in India
LoRa LP-WAN (Low Power, Long Range Network)
Revamping systems and processes to enhance long term
productivity and enrich customer experience
Digital Transformation
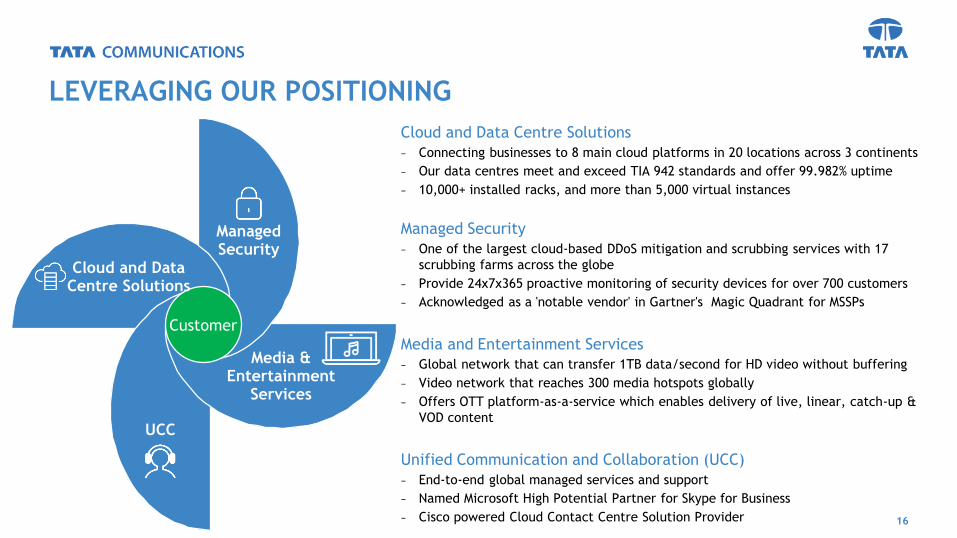
LEVERAGING OUR POSITIONING
16
Customer
Managed Security
Media & Entertainment
Services
UCC
Cloud and Data Centre Solutions
Cloud and Data Centre Solutions
− Connecting businesses to 8 main cloud platforms in 20 locations across 3 continents
− Our data centres meet and exceed TIA 942 standards and offer 99.982% uptime
− 10,000+ installed racks, and more than 5,000 virtual instances
Managed Security
− One of the largest cloud-based DDoS mitigation and scrubbing services with 17
scrubbing farms across the globe
− Provide 24x7x365 proactive monitoring of security devices for over 700 customers
− Acknowledged as a 'notable vendor' in Gartner's Magic Quadrant for MSSPs
Media and Entertainment Services
− Global network that can transfer 1TB data/second for HD video without buffering
− Video network that reaches 300 media hotspots globally
− Offers OTT platform-as-a-service which enables delivery of live, linear, catch-up &
VOD content
Unified Communication and Collaboration (UCC)
− End-to-end global managed services and support
− Named Microsoft High Potential Partner for Skype for Business
− Cisco powered Cloud Contact Centre Solution Provider
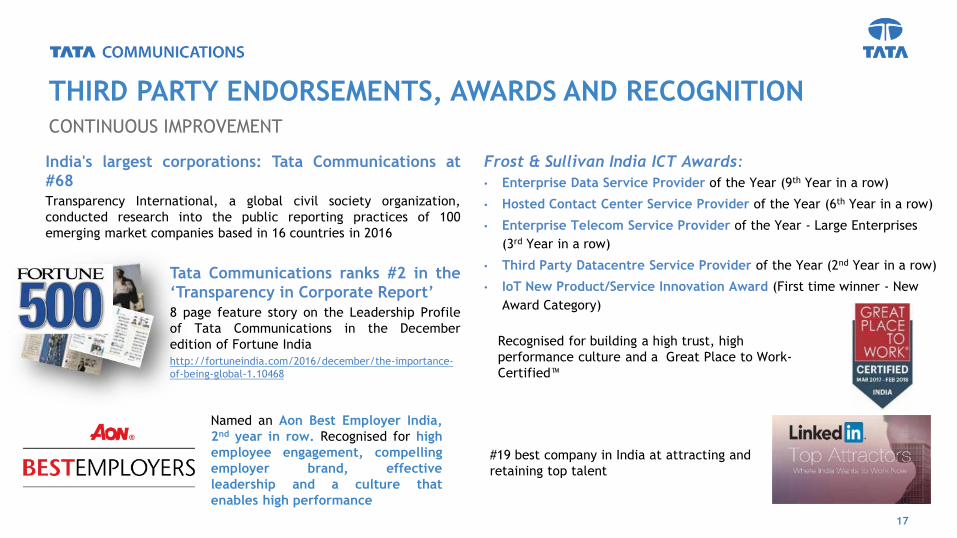
CONTINUOUS IMPROVEMENT
THIRD PARTY ENDORSEMENTS, AWARDS AND RECOGNITION
17
Tata Communications ranks #2 in the
‘Transparency in Corporate Report’
8 page feature story on the Leadership Profile
of Tata Communications in the December
edition of Fortune India
http://fortuneindia.com/2016/december/the-importance-
of-being-global-1.10468
Frost & Sullivan India ICT Awards:
• Enterprise Data Service Provider of the Year (9th Year in a row)
• Hosted Contact Center Service Provider of the Year (6th Year in a row)
• Enterprise Telecom Service Provider of the Year - Large Enterprises
(3rd Year in a row)
• Third Party Datacentre Service Provider of the Year (2nd Year in a row)
• IoT New Product/Service Innovation Award (First time winner - New
Award Category)
Named an Aon Best Employer India,
2nd year in row. Recognised for high
employee engagement, compelling
employer brand, effective
leadership and a culture that
enables high performance
Recognised for building a high trust, high
performance culture and a Great Place to Work-
Certified™
#19 best company in India at attracting and
retaining top talent
India's largest corporations: Tata Communications at
#68
Transparency International, a global civil society organization,
conducted research into the public reporting practices of 100
emerging market companies based in 16 countries in 2016
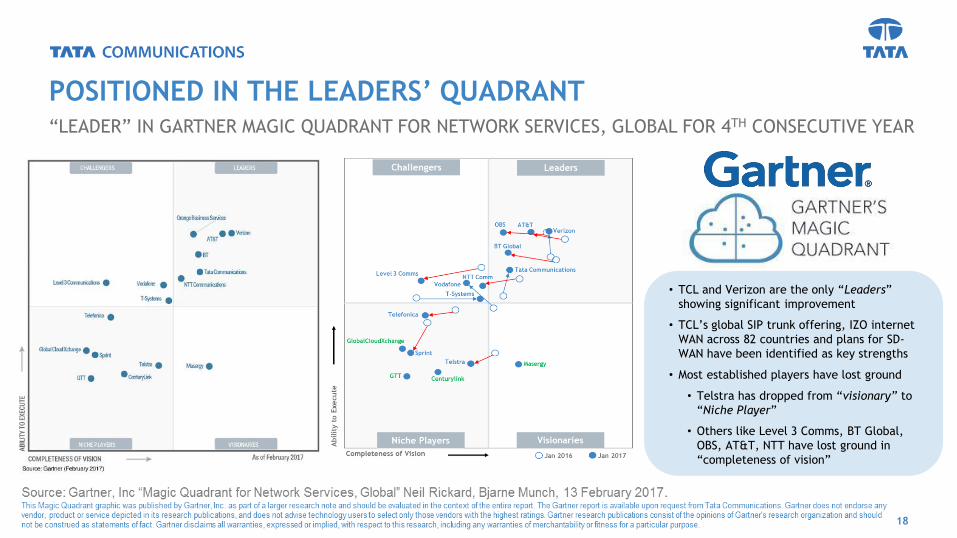
“LEADER” IN GARTNER MAGIC QUADRANT FOR NETWORK SERVICES, GLOBAL FOR 4TH CONSECUTIVE YEAR
18
POSITIONED IN THE LEADERS’ QUADRANT
• TCL and Verizon are the only “Leaders”
showing significant improvement
• TCL’s global SIP trunk offering, IZO internet
WAN across 82 countries and plans for SD-
WAN have been identified as key strengths
• Most established players have lost ground
• Telstra has dropped from “visionary” to
“Niche Player”
• Others like Level 3 Comms, BT Global,
OBS, AT&T, NTT have lost ground in
“completeness of vision”
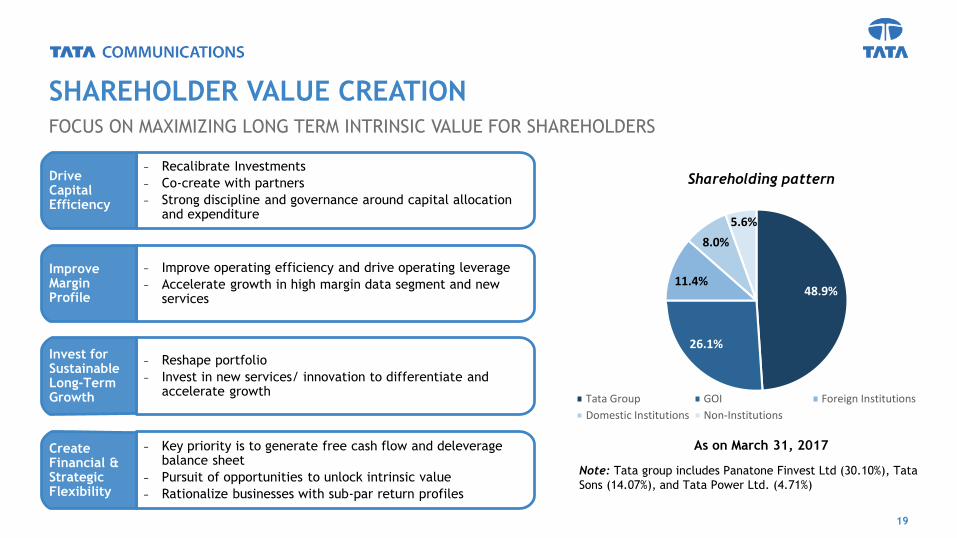
FOCUS ON MAXIMIZING LONG TERM INTRINSIC VALUE FOR SHAREHOLDERS
SHAREHOLDER VALUE CREATION
Shareholding pattern
As on March 31, 2017
Note: Tata group includes Panatone Finvest Ltd (30.10%), Tata
Sons (14.07%), and Tata Power Ltd. (4.71%)
48.9%
26.1%
11.4%
8.0%
5.6%
Tata Group GOI Foreign Institutions
Domestic Institutions Non-Institutions
− Recalibrate Investments
− Co-create with partners
− Strong discipline and governance around capital allocation and expenditure
Drive Capital Efficiency
− Improve operating efficiency and drive operating leverage
− Accelerate growth in high margin data segment and new services
Improve Margin Profile
− Reshape portfolio
− Invest in new services/ innovation to differentiate and accelerate growth
Invest for Sustainable Long-Term Growth
− Key priority is to generate free cash flow and deleverage balance sheet
− Pursuit of opportunities to unlock intrinsic value
− Rationalize businesses with sub-par return profiles
Create Financial & Strategic Flexibility
19
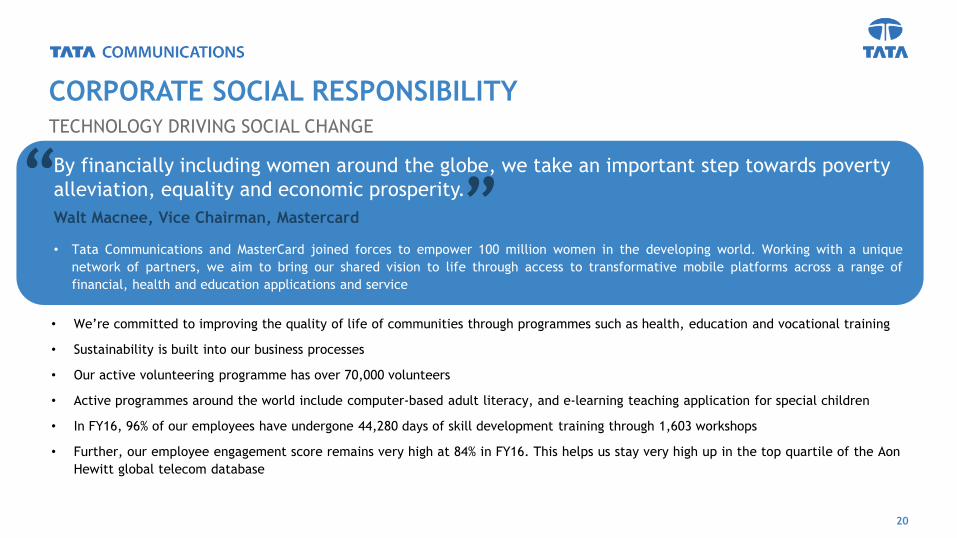
By financially including women around the globe, we take an important step towards poverty
alleviation, equality and economic prosperity.
Walt Macnee, Vice Chairman, Mastercard
“
“TECHNOLOGY DRIVING SOCIAL CHANGE
CORPORATE SOCIAL RESPONSIBILITY
20
• Tata Communications and MasterCard joined forces to empower 100 million women in the developing world. Working with a unique
network of partners, we aim to bring our shared vision to life through access to transformative mobile platforms across a range of
financial, health and education applications and service
• We’re committed to improving the quality of life of communities through programmes such as health, education and vocational training
• Sustainability is built into our business processes
• Our active volunteering programme has over 70,000 volunteers
• Active programmes around the world include computer-based adult literacy, and e-learning teaching application for special children
• In FY16, 96% of our employees have undergone 44,280 days of skill development training through 1,603 workshops
• Further, our employee engagement score remains very high at 84% in FY16. This helps us stay very high up in the top quartile of the Aon
Hewitt global telecom database
FINANCIAL PERFORMANCE
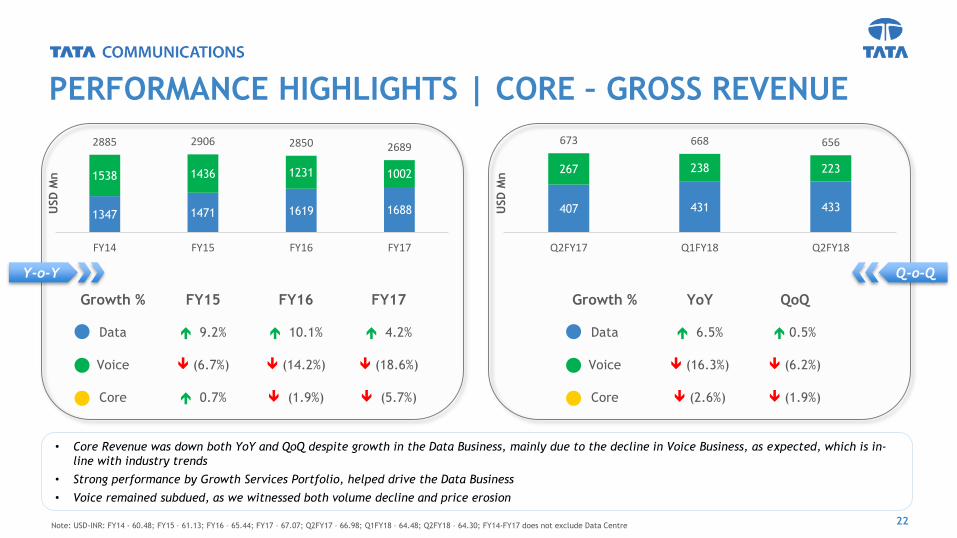
Growth % YoY QoQ
Data 6.5% 0.5%
Voice (16.3%) (6.2%)
Core (2.6%) (1.9%)
PERFORMANCE HIGHLIGHTS | CORE – GROSS REVENUE
22
• Core Revenue was down both YoY and QoQ despite growth in the Data Business, mainly due to the decline in Voice Business, as expected, which is in-
line with industry trends
• Strong performance by Growth Services Portfolio, helped drive the Data Business
• Voice remained subdued, as we witnessed both volume decline and price erosion
Y-o-Y Q-o-Q
Growth % FY15 FY16 FY17
Data 9.2% 10.1% 4.2%
Voice (6.7%) (14.2%) (18.6%)
Core 0.7% (1.9%) (5.7%)
USD
Mn
USD
Mn
Note: USD-INR: FY14 - 60.48; FY15 – 61.13; FY16 – 65.44; FY17 – 67.07; Q2FY17 – 66.98; Q1FY18 – 64.48; Q2FY18 – 64.30; FY14-FY17 does not exclude Data Centre
407 431 433
267 238 223
673 668 656
Q2FY17 Q1FY18 Q2FY18
1347 1471 1619 1688
1538 1436 1231 1002
2885 2906 2850 2689
FY14 FY15 FY16 FY17

PERFORMANCE HIGHLIGHTS | CORE – EBITDA
23
• Core EBITDA margin saw an improvement QoQ due to Voice business and one-off benefit in Payment Solutions business
• Data EBITDA margin this quarter was affected by higher investment in innovation; subdued performance of TCPSL due to demonetisation; higher
manpower and backbone costs; and access impact and transformation cost
• Improvement in Voice EBITDA margins by 150bps QoQ on account of recovery of outstanding from customers
Y-o-Y Q-o-Q
Margin % FY14 FY15 FY16 FY17
Data 18.9% 19.9% 21.2% 19.7%
Voice 8.9% 7.2% 6.3% 6.4%
Core 13.6% 13.6% 14.7% 14.7%
Margin % Q2FY17 Q1FY18 Q2FY18
Data 19.8% 17.0% 16.6%
Voice 6.4% 5.7% 7.2%
Core 14.5% 13.0% 13.4%
USD
Mn
USD
Mn
255 293 343 333
137 10477 64
392 397 420 397
FY14 FY15 FY16 FY17
81 73 72
1714 16
9887 88
Q2FY17 Q1FY18 Q2FY18
Note: USD-INR: FY14 - 60.48; FY15 – 61.13; FY16 – 65.44; FY17 – 67.07; Q2FY17 – 66.98; Q1FY18 – 64.48; Q2FY18 – 64.30; FY14-FY17 does not exclude Data Centre

PERFORMANCE HIGHLIGHTS | CORE – OPERATING FCF
24
Y-o-Y Q-o-Q
EBITDA to FCF Q2FY17 Q1FY18 Q2FY18
Data 27.4% 53.1% 10.4%
Voice 94.2% 99.3% 98.4%
Core 32.8% 41.1% 14.5%
USD
Mn
USD
Mn
EBITDA to FCF FY15 FY16 FY17
Data 8.8% 34.9% 43.8%
Voice 94.0% 93.9% 94.2%
Core 19.7% 37.4% 43.5%
• The business is generating healthy free cash flows - We generated USD 13Mn (INR 82 Crores) in Free Cash Flow after accounting for capex
• The underlying business levers are in place and the free cash flow growth momentum will continue as we grow scale
Note: USD-INR: FY14 - 60.48; FY15 – 61.13; FY16 – 65.44; FY17 – 67.07; Q2FY17 – 66.98; Q1FY18 – 64.48; Q2FY18 – 64.30; FCF = EBITDA less Capital Expenditure; Core FCF has been arrived at after subtracting total Capex; FY14-FY17 does
not exclude Data Centre
26
120 14698
7260
FY15 FY16 FY17
2239
7
16
13
16
Q2FY17 Q1FY18 Q2FY18

35.0%26.2%
18.3% 16.1%
64.1% 76.9%83.9% 88.5%
0.6% (3.7%) (7.1%)(9.0%)
0.3%0.6% 4.9% 4.3%
FY14 FY15 FY16 FY17
PERFORMANCE HIGHLIGHTS | PORTFOLIO MIX
25
• There has been a significant shift in the mix of our business, with Data dominating both in terms of Revenue, EBITDA and Free Cash Flow, and the
declining importance/ dependence on Voice can be clearly seen above
• Traditional Connectivity services is our mainstay as of now, and represents a majority portion of both our Revenue and EBITDA
• However, our investment in Growth Services will drive the business in the future
EBITDA Mix
Data
-65.0
% Data
-83.9
%
Operating Free Cash Flow Mix
Data Voice Traditional Services Growth Services Subsidiaries
Gross Revenue Mix
53.3% 49.4%43.2% 37.2%
37.5% 39.9%43.2%
46.1%
4.5% 5.3% 7.1% 8.9%
4.7% 5.4% 6.5% 7.7%
FY14 FY15 FY16 FY17
Data
-46.7
%
Data
-62.8
%
79.2%
37.7%29.3%
20.8%
62.3%70.7%
FY15 FY16 FY17
Note: USD-INR: FY14 - 60.48; FY15 – 61.13; FY16 – 65.44; FY17 – 67.07; Q2FY17 – 66.98; Q1FY18 – 64.48; Q2FY18 – 64.30; FY14-FY17 does not exclude Data Centre
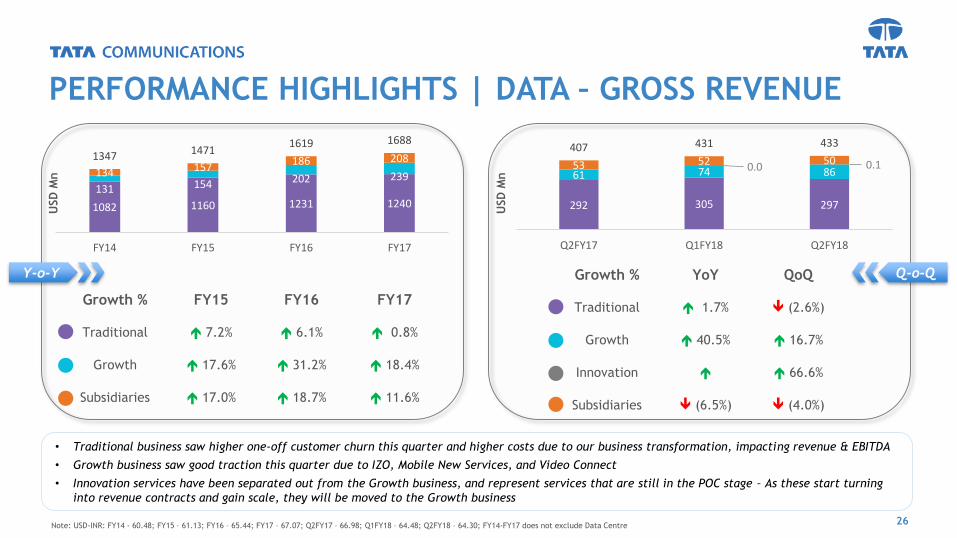
PERFORMANCE HIGHLIGHTS | DATA – GROSS REVENUE
26
• Traditional business saw higher one-off customer churn this quarter and higher costs due to our business transformation, impacting revenue & EBITDA
• Growth business saw good traction this quarter due to IZO, Mobile New Services, and Video Connect
• Innovation services have been separated out from the Growth business, and represent services that are still in the POC stage – As these start turning
into revenue contracts and gain scale, they will be moved to the Growth business
Y-o-Y Q-o-QGrowth % YoY QoQ
Traditional 1.7% (2.6%)
Growth 40.5% 16.7%
Innovation 66.6%
Subsidiaries (6.5%) (4.0%)
USD
Mn
USD
Mn
1082 1160 1231 1240131 154 202 239134 157
186 2081347 14711619 1688
FY14 FY15 FY16 FY17
292 305 297
61 74 860.0 0.153 52 50407 431 433
Q2FY17 Q1FY18 Q2FY18
Growth % FY15 FY16 FY17
Traditional 7.2% 6.1% 0.8%
Growth 17.6% 31.2% 18.4%
Subsidiaries 17.0% 18.7% 11.6%
Note: USD-INR: FY14 - 60.48; FY15 – 61.13; FY16 – 65.44; FY17 – 67.07; Q2FY17 – 66.98; Q1FY18 – 64.48; Q2FY18 – 64.30; FY14-FY17 does not exclude Data Centre

PERFORMANCE HIGHLIGHTS | DATA – EBITDA
27
• Traditional business EBITDA margin decline is temporary in nature and as benefits of cost productivity on account of business transformation starts to
flow through the EBITDA margins should be back in the 28-30% range
• Growth business is starting to see a reduction in EBITDA losses, and we should see a few products turning EBITDA positive over this year
• The Transformation business was impacted by closure of Tata Teleservices, while the Payments business is taking longer to normalize than expected
Y-o-Y Q-o-Q
USD
Mn
USD
Mn
Margin % Q2FY17 Q1FY18 Q2FY18
Traditional 30.8% 28.7% 27.6%
Growth (16.9)% (14.3%) (10.4%)
Innovation n/a
Subsidiaries 6.2% 7.1% 11.6%
251 305 352 3512
(15) (30) (36)
12
21 17255293
343 333
FY14 FY15 FY16 FY17
90 88 82
(10) (11) (9)(2) (8) (7)
3 4 6
81 73 72
Q2FY17 Q1FY18 Q2FY18
Margin % FY14 FY15 FY16 FY17
Traditional 23.2% 26.3% 28.6% 28.3%
Growth 1.8% (9.6%) (14.8%) (14.8%)
Subsidiaries 0.9% 1.5% 11.0% 8.3%
Note: USD-INR: FY14 - 60.48; FY15 – 61.13; FY16 – 65.44; FY17 – 67.07; Q2FY17 – 66.98; Q1FY18 – 64.48; Q2FY18 – 64.30; FY14-FY17 does not exclude Data Centre
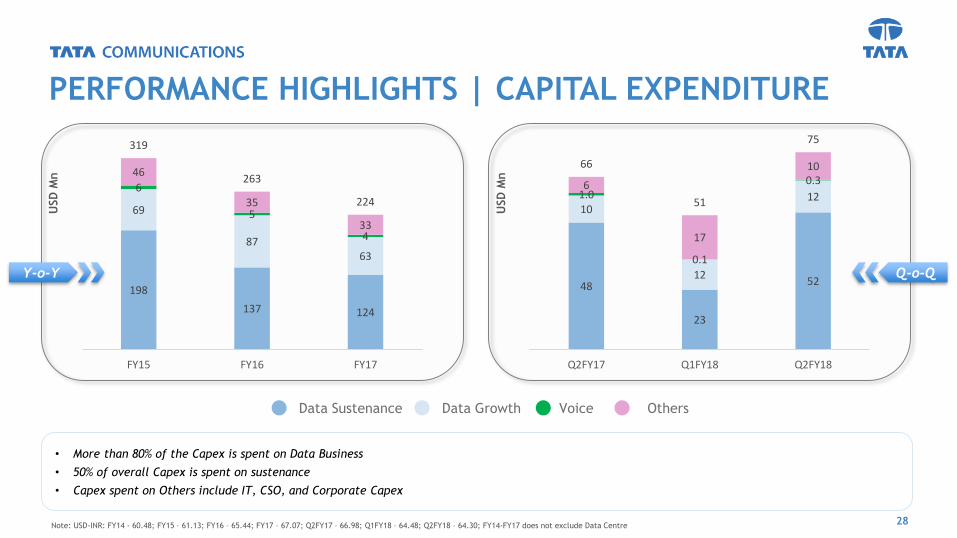
PERFORMANCE HIGHLIGHTS | CAPITAL EXPENDITURE
28
• More than 80% of the Capex is spent on Data Business
• 50% of overall Capex is spent on sustenance
• Capex spent on Others include IT, CSO, and Corporate Capex
Y-o-Y Q-o-Q
USD
Mn
USD
Mn
48
23
52
10
12
121.0
0.1
0.36
17
1066
51
75
Q2FY17 Q1FY18 Q2FY18
198
137 124
69
8763
6
5
4
46
35
33
319
263
224
FY15 FY16 FY17
Data Sustenance VoiceData Growth Others
Note: USD-INR: FY14 - 60.48; FY15 – 61.13; FY16 – 65.44; FY17 – 67.07; Q2FY17 – 66.98; Q1FY18 – 64.48; Q2FY18 – 64.30; FY14-FY17 does not exclude Data Centre

PERFORMANCE HIGHLIGHTS | NET DEBT
29
• Net debt at the end of quarter was at USD 1,209Mn, an increase of USD 5 Mn over last quarter on account of Sebras cable payment
• Finance cost was little high this quarter due to reversal of capitalised interest, as funding of projects happened through internal accruals. The cost of
debt was marginally up due to 3.3% LIBOR moving up on USD borrowings
USD
Mn
x %
Net Debt to EBITDA (x) Cost of Debt %
Note: USD-INR: FY14 - 60.48; FY15 – 61.13; FY16 – 65.44; FY17 – 67.07; Q2FY17 – 66.98; Q1FY18 – 64.48; Q2FY18 – 64.30
1380 1327 14381150 1204 1209
Mar'14 Mar'15 Mar'16 Mar'17 Jun'17 Sep'17
4.28% 3.80% 3.41% 3.12% 3.24% 3.30%
Mar'14 Mar'15 Mar'16 Mar'17 Jun'17 Sep'17
3.53.3
3.4
3.2
3.4
3.6
Mar'14 Mar'15 Mar'16 Mar'17 Jun'17 Sep'17
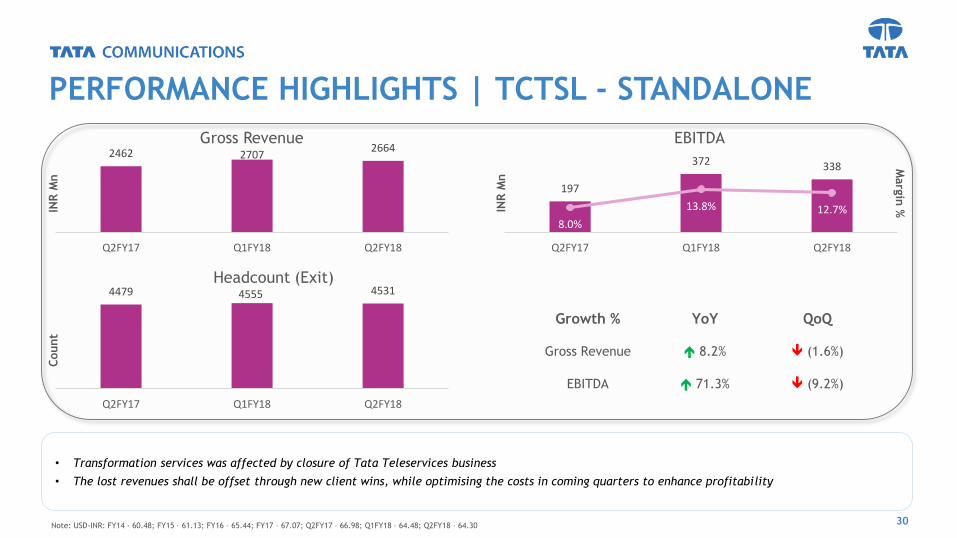
PERFORMANCE HIGHLIGHTS | TCTSL - STANDALONE
30
• Transformation services was affected by closure of Tata Teleservices business
• The lost revenues shall be offset through new client wins, while optimising the costs in coming quarters to enhance profitability
INR
Mn
Gross Revenue
INR
Mn
EBITDA
Headcount (Exit)
Count
Growth % YoY QoQ
Gross Revenue 8.2% (1.6%)
EBITDA 71.3% (9.2%)
Marg
in %
Note: USD-INR: FY14 - 60.48; FY15 – 61.13; FY16 – 65.44; FY17 – 67.07; Q2FY17 – 66.98; Q1FY18 – 64.48; Q2FY18 – 64.30
2462 27072664
Q2FY17 Q1FY18 Q2FY18
197
372 338
8.0%
13.8% 12.7%
Q2FY17 Q1FY18 Q2FY18
4479 4555 4531
Q2FY17 Q1FY18 Q2FY18
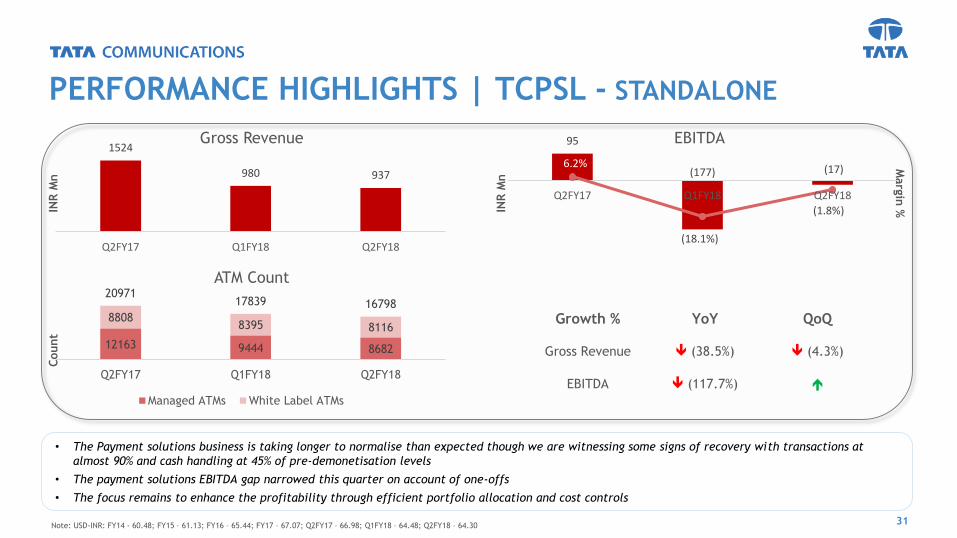
PERFORMANCE HIGHLIGHTS | TCPSL - STANDALONE
31
• The Payment solutions business is taking longer to normalise than expected though we are witnessing some signs of recovery with transactions at
almost 90% and cash handling at 45% of pre-demonetisation levels
• The payment solutions EBITDA gap narrowed this quarter on account of one-offs
• The focus remains to enhance the profitability through efficient portfolio allocation and cost controlsIN
R M
n
Gross Revenue
INR
Mn
EBITDA
ATM Count
Count
Growth % YoY QoQ
Gross Revenue (38.5%) (4.3%)
EBITDA (117.7%)
Marg
in %
Note: USD-INR: FY14 - 60.48; FY15 – 61.13; FY16 – 65.44; FY17 – 67.07; Q2FY17 – 66.98; Q1FY18 – 64.48; Q2FY18 – 64.30
1524
980 937
Q2FY17 Q1FY18 Q2FY18
95
(177) (17)6.2%
(18.1%)
(1.8%)
Q2FY17 Q1FY18 Q2FY18
12163 9444 8682
88088395 8116
2097117839 16798
Q2FY17 Q1FY18 Q2FY18
Managed ATMs White Label ATMs

INVESTMENT THESIS
32
Regular Dividend
Pay-out
Regulatory
Environment
Favourable
Lean Balance
Sheet
Valuation Arbitrage
as compared to
Global Peers
Internal Transformation
Value Creation
through huge Land
Assets
Data led Growth
Global
Management Team
33
Favourable sectoral trends – riding on global data growth
Connected the recently-launched Seabras-1 cable system to its Wall, NJ cable landing station and its global network, offering the most
direct link between the financial centres of New York City and São Paulo
Additionally, the company has built three new points of presence (PoP) in Jacksonville, FL, Minneapolis, MN, and St. Louis, MO,
growing the footprint to 48 PoPs across both major cities and emerging business hubs of the U.S.
At the TechXLR8 Asia, Tata Communications won the award for the Best IoT Connectivity Solution, being voted the best and most
innovative solution provider for the MOVE proposition
At the Ovum Industry Congress Tata Communications’ IoT solutions emerged as the winner of the Internet of Things award
Increased sales push through internal reorganisation and partnerships
Partnership with Skylab, HP Enterprise, Hitachi Sunway, Emirates Data Clearing
Growth Services continue to scale up well, and delivered an impressive 40.5% growth YoY
The business is generating healthy free cash flows - We generated USD 13Mn (INR 82 Crores) in Free Cash Flow after accounting for
capex, interest and tax expense
Core Net Debt at USD 1.21Bn, an increase of USD 5Mn over last quarter due to Sebras Cable payment- Net Debt to EBITDA at 3.6x
FY17 Dividend of INR 6/share which is 60% of face value of each share
KEY TAKE AWAY

34
THANK YOU
© 2016 Tata Communications. All Rights Reserved.
TATA COMMUNICATIONS and TATA are trademarks of Tata Sons Limited in certain countries.
tatacommunications.com
34