mahoning county regional shared service system · mahoning county regional shared service system...
TRANSCRIPT

Mahoning County Regional Shared Service System
A Local Government Innovation Fund
Project Proposal
Submitted By
ACCESS 100 DeBartolo Place, Suite 222
Youngstown, OH 44512
John LaPlante Executive Director

Mahoning County Local Government Innovation Fund Proposal
Tab 1 – Contact Information 1
Contact Information – Main Applicant
Area Cooperative Computerized Educational Support System (ACCESS) 100 DeBartolo Place, Suite 222 Youngstown, OH 44512 (o) (330) 965‐2829 (f) (330) 965‐7901
Applicant Contact
John LaPlante Executive Director laplante@access‐k12.org (o) (330) 965‐2830 (c) (330) 718‐4674 Type of Political Subdivision ACCESS is a Council of Governments Population Data
ACCESS, as an Information Technology Center, does not directly serve a population. However, many of the collaborative partners do, and their 2010 Census data is included in their data in Tab 2.

Mahoning County Local Government Innovation Fund Proposal
Tab 2 – Collaborative Partners 1
Collaborative Partners
1. Mahoning County Educational Service Center (MCESC) Ron Iarussi, Superintendent [email protected] 100 DeBartolo Place, Suite 220 Youngstown, OH 44512 (o) (330) 965‐7828 (f) (330) 965‐7901 Nature of Partnership – The MCESC will act as a co‐production partner in the project, providing educational, financial, technical, and consulting services to the partnership participants. The MCESC also acts as the fiscal agent to ACCESS, the Main Applicant.
2. Mahoning County Auditor’s Office Michael Sciortino, County Auditor [email protected] Jake Williams, Director, Information Technology [email protected] Mahoning County Court House 120 Market Street, First Floor Youngstown, OH 44503 (o) (330) 740‐2010 (f) (330) 480‐7571 Nature of Partnership – The Auditor’s office and the Data Processing department are charged with county‐wide IT services, including Internet, e‐mail, Intranet, and SQL database systems for the courts, real estate, GIS, financials, and HR/payroll. This service offering is part of the idea of co‐production by the project participants. Also, the County Mahoning Youngstown Regional Information System (MYRIS) was started 3 years ago as an initial shared county network system. This system, combined with ACCESS’ private fiber optic network, will form the basis for moving a shared network system forward.

Mahoning County Local Government Innovation Fund Proposal
Tab 2 – Collaborative Partners 2
3. Mahoning County Commissioners Total Population ‐ 238,823 John McNally, Commissioner [email protected] Mahoning County Administration Building 21 W. Boardman Street, Second Floor Youngstown, OH 44503 (o) (330) 740‐2130 (f) (330) 740‐2006 Nature of Partnership – The Board of Mahoning County Commissioners is the general administrative body for county government. In addition to serving as the fiscal representatives of Mahoning County, they serve as the legislative and governing body. The Commissioners are responsible for making policy, adopting ordinances, and levying taxes to finance county government programs. The Board is very interested in exploring any and all ways to reduce cost and enhance services through this project.
4. Austintown Township Total Population ‐ 36,722 Michael Dockry [email protected]
Austintown Township Administrator
82 Ohltown Rd.
Austintown, OH 44515 (o) (330) 792‐8584 (f) (330) 259‐7895 Nature of Partnership – Austintown Township is very interested in enhancing the services provided to its residents and offices, while reducing and controlling costs. Austintown is also a current MYRIS participant, looking to expand their partnership with other Mahoning County entities.
Mahoning County Local Government Innovation Fund Proposal
Tab 2 – Collaborative Partners 3
5. Boardman Township Total Population ‐ 40,889 Jason Loree [email protected] Boardman Township Administrator 8299 Market Street Boardman OH 44512 (o) (330) 726‐4177 (f) (330) 729‐2054 Nature of Partnership – Boardman Township is very interested in enhancing the services provided to its residents and offices, while reducing and controlling costs. Boardman is also a current MYRIS participant, looking to expand their partnership with other Mahoning County entities.
6. Goshen Township Total Population ‐ 3,243 Goshen Township Robert (Bob) McCracken ‐ Trustee's Chairperson [email protected] 14003 W. South Range Rd. Salem, OH 44460‐9127 (o) (330) 207‐8053 (f) (330) 332‐3411 Nature of Partnership – Goshen Township is very interested in enhanced connectivity services. They currently rely on a single T‐1 connection that is not very robust and very unreliable. They have limited budget to invest in technology, and are looking at this project as a way to tap into centralized information technology resources for their township.

Mahoning County Local Government Innovation Fund Proposal
Tab 2 – Collaborative Partners 4
7. Poland Village Tim Sicafuse, Mayor tsicafuse@valley‐group.com Poland Village 308 South Main Street Poland, Ohio 44514 (o) (330) 757‐2112 (f) (330) 757‐1680 Nature of Partnership – Poland Village is interested in expanding and enhancing the services provided to its citizens through the use technology, as well as making more efficient its day‐to‐day operations.
8. Springfield Township Total Population ‐ 6,703 Bob Orr [email protected] Springfield Township 3475 E. South Range Road New Springfield, Ohio 44443 (o) (330) 542‐2377 (f) (330) 542‐0357 Nature of Partnership – Springfield Township is interested in expanding and enhancing the services provided to its citizens through the use technology, as well as making more efficient its day‐to‐day operations. They are particularly interested in the sharing of law enforcement data.

Mahoning County Local Government Innovation Fund Proposal
Tab 2 – Collaborative Partners 5
9. Struthers City Total Population ‐ 10,713 Terry Stocker, Mayor [email protected] Struthers City 6 Elm Street Struthers, Ohio 44471 (o) (330) 755‐2181 (f) (330) 755‐1550 Nature of Partnership – Struthers City is interested in expanding and enhancing the services provided to its citizens through the use technology, as well as making more efficient its day‐to‐day operations. Struthers is also very interested in shared 911 services to greater enhance their police and fire information.
10. Data Recovery Services, LLC Mike Meloy, President [email protected] 1343 Belmont Avenue Youngstown, Ohio 44504 (o) (330) 259‐4900 (f) (330) 259‐4935 Nature of Partnership – ACCESS sold 2 strands of their private fiber network to the Columbiana County Port Authority (CCPA) in 2004, and the CCPA leased this network to DRS in early 2012. DRS is responsible for marketing this network to governmental agencies, while ACCESS focuses on educational and library customers. DRS is also providing a wide variety of technical services to Mahoning County governmental agencies currently, including desktop support, virtual server support, fiber‐optic connectivity, and voice‐over‐IP telephony.

Mahoning County Local Government Innovation Fund Proposal
Tab 2 – Collaborative Partners 6
11. Poland Township Total Population ‐ 14,960 Jim Scharville, Township Administrator [email protected] Poland Township 3339 Dobbins Road Poland, OH 44514 (o) (330) 757‐0733 (f) (330) 757‐1152 Nature of Partnership – Poland Township is interested in expanding and enhancing the services provided to its citizens through the use technology, as well as making more efficient its day‐to‐day operations.
12. Village of New Middletown Harry Kale, Mayor [email protected] Village of New Middletown 10711 Main Street New Middletown, OH 44442 (o) (330) 542‐2846 (f) (330) 542‐2866 Nature of Partnership – The Village of New Middletown is interested in expanding and enhancing the services provided to its citizens through the use technology, as well as making more efficient its day‐to‐day operations.

Mahoning County Local Government Innovation Fund Proposal
Tab 2 – Collaborative Partners 7
13. Mahoning County Sheriff Major Mike Fonda [email protected] Mahoning County Sheriff’s Office 110 Fifth Avenue Youngstown, OH 44503 (o) (330) 480‐5000 (f) (330) 480‐5089 Nature of Partnership – The Mahoning County Sheriff’s office is interested in expanding and enhancing the services provided to its citizens through the use of technology, as well as making more efficient its day‐to‐day operations. They are particularly interested in the sharing of law enforcement data with all of the county police departments and courts. This is something they have been interested in for years, and are looking forward to this possibility.
14. Youngstown City Total Population ‐ 66,971 Mike Kraynanski [email protected] Computer Center CIO City of Youngstown (o) (330) 742‐8986 (f) (330) 744‐7460 Nature of Partnership – The City of Youngstown is interested in expanding and enhancing the services provided to its citizens through the use technology, as well as making more efficient its day‐to‐day operations.

Mahoning County Local Government Innovation Fund Proposal
Tab 2 – Collaborative Partners 8
15. Mahoning County Treasurer Daniel Yemma [email protected] Mahoning County Treasurer Mahoning County Courthouse 120 Market Street, 1st Floor Youngstown, OH 44503 (o) (330) 740‐2460 (f) (330) 740‐2142 Nature of Partnership – The Mahoning County Treasurer is interested in expanding and enhancing the services it provides through the use technology, as well as making more efficient its day‐to‐day operations.
16. Mahoning County Recorder Noralynn Palermo, Mahoning County Recorder [email protected] Mahoning County Court House 120 Market St., First Floor Youngstown, OH 44503 (o) (330) 740‐2345 (f) (330) 740‐2347 Nature of Partnership – The Mahoning County Recorder is interested in expanding and enhancing the services it provides through the use technology, as well as making more efficient its day‐to‐day operations.

Mahoning County Local Government Innovation Fund Proposal
Tab 3 – Project Information 1
Project Information
1. Name of Project
Mahoning County Regional Shared Service System
2. Project Description
Recently, there have been two shared network projects underway in Mahoning County. One has been in the works for nearly 30 years, while the other is just barely off the ground. The Mahoning County Regional Shared Service System (MCRSSS) would bring these shared network environments together to significantly enhance the level and type of technology services available to Mahoning County local governments at a significantly reduced price.
The MCRSSS will be comprised of two distinct elements. First, a shared fiber optic network will connect all participants in the project. Then, a menu of services will be developed by the participants to be delivered over the shared network. Some participants may be providers of the services, some may be consumers of the services, and some may be both providers and consumers. Each of these elements is described in more detail below. Shared Network In Mahoning County, there are many different networks which connect governmental entities. Two of these are the ACCESS network and the MYRIS network. The MCRSSS project would look to combine these networks into a single shared information system. The ACCESS network is owned by the school districts in Mahoning and Columbiana counties. This network connects and serves these school districts, as well as public libraries and Youngstown State University. ACCESS, as both an Internet Service Provider (ISP) and an Application Service Provider (ASP), provides shared services such as Internet, E‐mail, Fiscal (budgetary and payroll), Library Automation, and Student (report cards, attendance, discipline, transcripts, scheduling, gradebook, etc.) services to its customers. Further, ACCESS has sold part of its network to the Columbiana County Port Authority for commercial development. The commercial development of the network is in full swing, with current customers including a national cell phone provider, three hospitals, and a major accounting firm. The ACCESS network has been, and continues to be, a great example of a public/private partnership.
Mahoning County Local Government Innovation Fund Proposal
Tab 3 – Project Information 2
The MYRIS network was originally funded by at $120,000 grant in 2010, and has the purpose of connecting local governments. The current project participants in this MYRIS network are the City of Struthers, Austintown Township, and Boardman Township. Menu Of Services Concurrent with the work to create a shared network infrastructure, a Menu of Services will be created for delivery to project participants. This menu of services will include traditional ISP services such as Internet, e‐mail, file server storage and backup, and identity management, and ASP services such as Geographic Information System (GIS) and pictometry services for zoning and emergency services, 911 dispatch, e‐justice (law enforcement, jail/booking), DR services, and digital permitting. Further, traditional educational services may also be available, such as distance education, multimedia development, blended learning, and professional development. Lastly, the MCRSSS will enable significantly enhanced consortium purchasing and collaboration, to include purchasing cooperatives, health care consortiums, and other collaborative efforts. For purposes of the grant proposal, it is anticipated that a shared service offering will be comprised of a direct fiber optic network connection, 1GB of Ethernet bandwidth, 5 shared servers per entity, centralized full service e‐mail functionality (to include Microsoft Exchange and e‐mail archiving), backup, restore, disaster recovery, and full technical support. A more detailed and comprehensive list of anticipated cost savings will be available after completion of the feasibility study.
3. Type of Award
Grant ‐ Feasibility and Planning Study
4. Problem Statement
In Mahoning County, there exists a digital divide between governmental agencies with respect to the technology services available to them. Some have the resources and ability to provide a solid and robust set of technology services to their customers, while others struggle to find the resources and ability to provide basic services. Further, there exists duplication of effort, duplication of infrastructure, and inefficient use of resources. By creating a shared service system in the County, we can

Mahoning County Local Government Innovation Fund Proposal
Tab 3 – Project Information 3
ensure that all governmental agencies have access to a robust and efficient set of services.
5. Targeted Approach
Coproduction
6. Anticipated Return on Investment (ROI)
The anticipated return on investment for this project is 143.75% in the first year, and 81% per year thereafter. In the first year, the majority of the ROI is in the form of significantly reduced fiber construction costs by taking advantage of ACCESS’ existing network. In subsequent years, the ROI is in the form of reduced operating costs as compared to contracting for and providing similar services either on their own or through a commercial provider. Please see the supporting documentation in Tab 4 for a detail of the estimated cost savings.
7. Probability of Success
This project has an extremely high probability of success, as it will be modeled on the shared information system that has been successful in the school system for the past 30 years. We similarly expect a high degree of success meeting the ROI estimates, particularly for the fiber construction portion of the feasibility study. The ROI estimates for the service delivery aspects of the project are a little less clear, given the assumptions made regarding the feasibility study.
8. Ability to Replicate or Scale the Proposal
This project is easily scaled and/or replicated to other counties, both rural and urban. While the technical aspects of this project are specific to Mahoning County, the overall concept, that of a shared regional service system, is universal in its appeal to counties across the state. As can be seen in the project budget, considerable effort will be made in the documentation phase to create a rubric and plan to scale this to other Councils of Government, Information Technology Centers, counties, municipalities, cities, and townships. ACCESS is very willing to assist with replicating this proposal to other interested entities.

Mahoning County Local Government Innovation Fund Proposal
Tab 3 – Project Information 4
9. Part of Larger Consolidation Effort?
This project is not part of a larger consolidation effort at the present time.
10. Past Success on Innovation
ACCESS began providing shared services to school districts in the late 1980s, and has never looked back. The school districts have come to rely on ACCESS as a trusted technology partner, and they rely on ACCESS for everything from the routine day‐to‐day technology support, as well as strategic initiatives that are core to their main business of student achievement.
11. How Responding to Current Changes in Economic Demand
By sharing services with all project entities, the project can make use of current infrastructure, current skill sets, and make the most efficient use of resources possible. This will have the added benefit of bringing a solid, robust set of technical services to all project participants, while keeping costs to an absolute minimum.
12. Intent to Implement Audit Findings
There are no known audit findings that are addressed by this project.
13. How Project Facilitates an Improved Business Environment and/or Community
Attraction One of the collaborative partners is DRS, a Mahoning County‐based organization. DRS is a trusted technology partner not only of ACCESS, but also of several of the project participants. As mentioned elsewhere in this proposal, DRS is critical to the success of the ACCESS network, as they manage and deliver all commercial aspects of this service. This project will serve to further the public‐private partnership that already exists between the project participants, ACCESS, and DRS. One of the most exciting aspects of this project, however, is the expanded set of services and information sharing that will be possible, demonstrating a commitment to service delivery and innovation to the taxpayers, at a bare minimum of expense. A true win‐win for everyone involved.

Mahoning County Local Government Innovation Fund Proposal
Tab 4 – Financial Documentation 1
Financial Documentation
1. Prior 3 Years of Financial Statements
ACCESS operates on a cash‐basis. These are our audited financial statements for the fiscal year periods ending in 2009, 2010, and 2011.
2009 2010 2011 Operating cash receipts: Membership contributions $1,198,202 $1,229,499 $1,209,700 Total operating cash receipts $1,198,202 $1,229,499 $1,209,700 Operating cash disbursements: Personal services $617,092 $623,522 $651,662 Employees' retirement and insurance $171,380 $178,220 $195,789 Purchased services $951,656 $971,954 $829,446 Materials and supplies $89,769 $33,947 $97,598 Capital outlay $108,455 $29,670 $43,450 Capital lease payments $871,144 $87,539 $904,748 Other $144,444 $781,910 $152,106 Total operating cash disbursements $2,953,940 $2,706,762 $2,874,799 Deficiency of operating cash receipts under operating cash disbursements ($1,755,738) ($1,477,263) ($1,665,099) Non‐operating cash receipts: Intergovernmental $1,622,360 $1,573,433 $1,528,792 Interest income $24,628 $17,234 $19,014 Sale of assets $25,000 $68,616 $51,266 Refund of Prior Year Expenditure $29,194 Other non‐operating receipts $50,000 $8,329 Total non‐operating cash receipts $1,751,182 $1,667,612 $1,599,072 Change in net cash assets ($4,556) $190,349 ($66,027) Net cash assets at beginning of year $937,570 $933,014 $1,123,363 Net cash assets at end of year $933,014 $1,123,363 $1,057,336

Mahoning County Local Government Innovation Fund Proposal
Tab 4 – Financial Documentation 2
2. Anticipated Project Costs a. Total Project Costs
a. Completion of MYRIS Network Implementation ‐ $120,000 i. Complete the implementation of the initial MYRIS network,
which connects three of the project entities with fiber optic cable.
b. Fiber Construction Evaluation and Planning ‐ $31,875 i. 15 hours of in‐depth technical analysis of each entity’s
current technical situation, to include Internet connectivity and Local‐, Metro‐, and Wide‐Area‐Network connectivity. Included in this item are reviews of current fiber infrastructure at ACCESS and MYRIS, as well as pole attachments and a full fiber construction plan.
c. Feasibility Study of Services To Be Offered ‐ $53,125 i. 25 hours of in‐depth analysis of each entity’s technology
platform, to include services offered, costs incurred, missed opportunities, and development of standard menu of services for each entity.
d. Project Management ‐ $25,000 i. 200 hours of project management, to include the
development of feasibility study rubric, coordination of all activities, and final technical documentation and report out to project participants. Particular attention will be made to creating a project definition document and evaluation rubric that can be replicated to other counties.
b. Total Project Budget ‐ $230,000 c. In‐Kind Match
a. MYRIS Grant Fund ‐ $120,000 i. The MYRIS network implementation started in early 2010
and is slated for completion in mid‐2013. b. Project Management ‐ $10,000
i. 80 hours will be performed by ACCESS at no charge to the project.
c. Total In‐Kind Match ‐ $130,000 (57%) d. Total Funds Requested – $100,000

Mahoning County Local Government Innovation Fund Proposal
Tab 4 – Financial Documentation 3
3. MCRSSS Return On Investment (ROI) Estimates
a. Fiber Construction. For analysis purposes, it is anticipated that the feasibility study will conclude that it is advantageous to the project participants to extend the ACCESS/MYRIS network to all project participants. The ROI calculated assumes a shared cost for extending this network as compared to constructing a completely new network for the participants. There is roughly 50 miles of fiber required to be constructed, at a rough cost of $15,000 per mile. However, by using the ACCESS/MYRIS network, it is estimated that 40 of the 50 miles already exist. For electronics, 17 switches at roughly 10,000 per switch would be needed to light the network in a shared environment, but in a stand‐alone environment this increases to $350,000 due to additional electronics needed to provide the core routing that would be provided by ACCESS in a shared environment. One‐Time Costs Shared Cost Individual Cost Fiber Construction $150,000 $750,000 Electronics $170,000 $350,000
Total Cost $320,000 $1,100,000 Initial Cost Savings $780,000 Initial ROI 143.75%

Mahoning County Local Government Innovation Fund Proposal
Tab 4 – Financial Documentation 4
b. Recurring Costs. For analysis purposes, it is anticipated that the feasibility
study will conclude that it is advantageous to the project participants to share in three technology services, namely high‐speed dedicated Internet connectivity, e‐mail services, and virtual servers and storage. The actual feasibility study may conclude otherwise, with more or less technology services to be shared. The Individual Cost below represents the cost if the entities were to purchase these services on their own, instead of receiving them through the MCRSSS. These may or may not represent savings from current expenditures. It is understood that most municipalities receive Internet access for free, however, this is not of a sufficient bandwidth to support advanced application sharing (for example, GIS mapping services which are bandwidth intensive) with internal Mahoning County departments, nor is it protected from other customers on the same network. Also, e‐mail services provided as part of this free offering are simple e‐mail services as opposed to the fully functional e‐mail services offered here, which include a centralized Global Address List, as well as full e‐mail archiving for e‐discovery and litigation purposes.
Recurring Costs Shared Cost Individual Cost 1GB of Ethernet $85,000 $204,000 2000 E‐mail Boxes $70,000 $120,000 5 Virtual Servers $51,000 $255,000
Total Recurring Costs $206,000 $579,000 Annual Cost Savings $373,000 Simple ROI 81.07%

Mahoning County Local Government Innovation Fund Proposal
Tab 4 – Financial Documentation 5
4. Current and Next Three Years of Projected Financial Statements
It is expected that 2012 will end in roughly the same financial condition as 2011, and that the first year of the project will be 2013. It is further anticipated that ACCESS will receive $100,000 in grant funding in early 2013, and $500K in loan funding in late 2013. The project will be up and running before the start of fiscal year 2014, with loan repayments starting in 2015. Finally, as ACCESS operates as a non‐profit, there is no anticipated change in net cash assets.
2012 2013 2014 2015 Operating cash receipts: Membership contributions $1,209,700 $1,249,100 $1,292,910 $1,341,792 Total operating cash receipts $1,209,700 $1,249,100 $1,292,910 $1,341,792 Operating cash disbursements: Personal services $650,000 $660,000 $670,000 $680,000 Employees' retirement and insurance $196,000 $225,400 $259,210 $298,092 Purchased services $830,000 $950,000 $850,000 $850,000 Materials and supplies $98,000 $98,000 $98,000 $98,000 Capital outlay $43,450 $550,000 $43,450 $43,450 Capital lease payments $905,000 $905,000 $905,000 $955,000 Other $150,000 $150,000 $150,000 $150,000 Total operating cash disbursements $2,872,450 $3,538,400 $2,975,660 $3,074,542 Deficiency of operating cash receipts under operating cash disbursements ($1,662,750) ($2,289,300) ($1,682,750) ($1,732,750) Non‐operating cash receipts: Intergovernmental $1,592,750 $1,619,300 $1,612,750 $1,662,750 Interest income $20,000 $20,000 $20,000 $20,000 Sale of assets $50,000 $50,000 $50,000 $50,000 Local Govt Innov Fund $600,000 Total non‐operating cash receipts $1,662,750 $2,289,300 $1,682,750 $1,732,750 Change in net cash assets $0 $0 $0 $0 Net cash assets at beginning of year $1,057,336 $1,057,336 $1,057,336 $1,057,336 Net cash assets at end of year $1,057,336 $1,057,336 $1,057,336 $1,057,336


Mahoning County Local Government Innovation Fund Proposal
Tab 5 – Supporting Documentation 1
Supporting Documentation 1. Executed Partnership Agreements
To Be Forwarded Under Separate Cover Prior to 4/30/2012
2. Resolution of Support From Applicant and Collaborative Partners
To Be Forwarded Under Separate Cover Prior to 4/30/2012
3. Self‐score assessment
Section 1
Financial Information 5 Repayment Structure NA Local Match 5 Total Section 10 out of 10 Section 2 Population 5 Participating Entities 5 Total Section 10 out of 10 Section 3 Expected Return 30 Past Success 5 Scalable/Replicable 10 Probablility of Success 5 Total Section 50 out of 50 Section 4
Performance Audit 0 Economic Impact 3 Response to Econ Demand 5 Total Section 8 out of 15 Total Self Score – 78 out of 85

Mahoning County Local Government Innovation Fund Proposal
Tab 5 – Supporting Documentation 2
4. 2010 Census Data Documentation a. Mahoning County
b. Austintown Township

Mahoning County Local Government Innovation Fund Proposal
Tab 5 – Supporting Documentation 3
c. Boardman Township
d. Goshen Township

Mahoning County Local Government Innovation Fund Proposal
Tab 5 – Supporting Documentation 4
e. Springfield Township
f. Struthers City

Mahoning County Local Government Innovation Fund Proposal
Tab 5 – Supporting Documentation 5
g. Poland Township
h. Youngstown City

Mahoning County Regional Shared Service System
A Local Government Innovation Fund
Project Proposal
Cure Letter Items
Submitted By
ACCESS 100 DeBartolo Place, Suite 222
Youngstown, OH 44512
John LaPlante Executive Director

Mahoning County Local Government Innovation Fund Proposal
CURE – Item 1 – In Kind Match 1
CURE Response – In-‐Kind Match 1. Future Match
It is understood from discussions with Nyla Potter that future in-‐kind contributions do not need to be certified until after they are made, and that we will need to re-‐certify in-‐kind contributions.

Mahoning County Local Government Innovation Fund Proposal
CURE – Item 2 -‐ Budget 1
CURE Response -‐ Financial Documentation 1. Line Item Budget
Mahoning County Regional Shared Service System Sources of Funds LGIF Request $100,000 Match In-‐Kind Contribution $130,000 Total $230,000
Uses of Funds MYRIS Project Completion $120,000 Fiber Construction Study $31,875 Services Feasibility Study $53,125 Project Management $25,000 Total $230,000 Total Project Cost: $230,000

Mahoning County Local Government Innovation Fund Proposal
CURE – Item 3 – Census Information 1
CURE Response – Census Information 1. Census Information from FactFinder
Please see individual PDF reports from the Total Population reports as found on the FactFinder portion of the US Census web site.
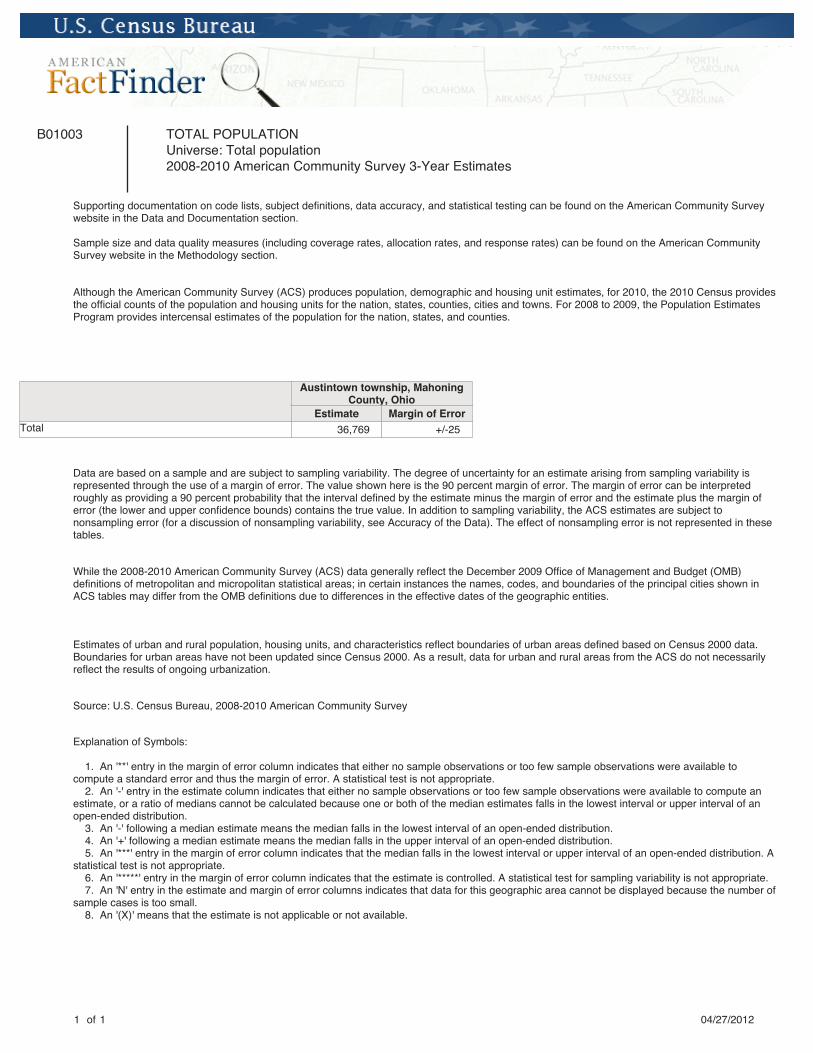
B01003 TOTAL POPULATIONUniverse: Total population2008-2010 American Community Survey 3-Year Estimates
Supporting documentation on code lists, subject definitions, data accuracy, and statistical testing can be found on the American Community Surveywebsite in the Data and Documentation section.
Sample size and data quality measures (including coverage rates, allocation rates, and response rates) can be found on the American CommunitySurvey website in the Methodology section.
Although the American Community Survey (ACS) produces population, demographic and housing unit estimates, for 2010, the 2010 Census providesthe official counts of the population and housing units for the nation, states, counties, cities and towns. For 2008 to 2009, the Population EstimatesProgram provides intercensal estimates of the population for the nation, states, and counties.
Austintown township, MahoningCounty, Ohio
Estimate Margin of ErrorTotal 36,769 +/-25
Data are based on a sample and are subject to sampling variability. The degree of uncertainty for an estimate arising from sampling variability isrepresented through the use of a margin of error. The value shown here is the 90 percent margin of error. The margin of error can be interpretedroughly as providing a 90 percent probability that the interval defined by the estimate minus the margin of error and the estimate plus the margin oferror (the lower and upper confidence bounds) contains the true value. In addition to sampling variability, the ACS estimates are subject tononsampling error (for a discussion of nonsampling variability, see Accuracy of the Data). The effect of nonsampling error is not represented in thesetables.
While the 2008-2010 American Community Survey (ACS) data generally reflect the December 2009 Office of Management and Budget (OMB)definitions of metropolitan and micropolitan statistical areas; in certain instances the names, codes, and boundaries of the principal cities shown inACS tables may differ from the OMB definitions due to differences in the effective dates of the geographic entities.
Estimates of urban and rural population, housing units, and characteristics reflect boundaries of urban areas defined based on Census 2000 data.Boundaries for urban areas have not been updated since Census 2000. As a result, data for urban and rural areas from the ACS do not necessarilyreflect the results of ongoing urbanization.
Source: U.S. Census Bureau, 2008-2010 American Community Survey
Explanation of Symbols:
1. An '**' entry in the margin of error column indicates that either no sample observations or too few sample observations were available tocompute a standard error and thus the margin of error. A statistical test is not appropriate. 2. An '-' entry in the estimate column indicates that either no sample observations or too few sample observations were available to compute anestimate, or a ratio of medians cannot be calculated because one or both of the median estimates falls in the lowest interval or upper interval of anopen-ended distribution. 3. An '-' following a median estimate means the median falls in the lowest interval of an open-ended distribution. 4. An '+' following a median estimate means the median falls in the upper interval of an open-ended distribution. 5. An '***' entry in the margin of error column indicates that the median falls in the lowest interval or upper interval of an open-ended distribution. Astatistical test is not appropriate. 6. An '*****' entry in the margin of error column indicates that the estimate is controlled. A statistical test for sampling variability is not appropriate. 7. An 'N' entry in the estimate and margin of error columns indicates that data for this geographic area cannot be displayed because the number ofsample cases is too small. 8. An '(X)' means that the estimate is not applicable or not available.
1 of 1 04/27/2012

B01003 TOTAL POPULATIONUniverse: Total population2008-2010 American Community Survey 3-Year Estimates
Supporting documentation on code lists, subject definitions, data accuracy, and statistical testing can be found on the American Community Surveywebsite in the Data and Documentation section.
Sample size and data quality measures (including coverage rates, allocation rates, and response rates) can be found on the American CommunitySurvey website in the Methodology section.
Although the American Community Survey (ACS) produces population, demographic and housing unit estimates, for 2010, the 2010 Census providesthe official counts of the population and housing units for the nation, states, counties, cities and towns. For 2008 to 2009, the Population EstimatesProgram provides intercensal estimates of the population for the nation, states, and counties.
Boardman township, MahoningCounty, Ohio
Estimate Margin of ErrorTotal 40,947 +/-44
Data are based on a sample and are subject to sampling variability. The degree of uncertainty for an estimate arising from sampling variability isrepresented through the use of a margin of error. The value shown here is the 90 percent margin of error. The margin of error can be interpretedroughly as providing a 90 percent probability that the interval defined by the estimate minus the margin of error and the estimate plus the margin oferror (the lower and upper confidence bounds) contains the true value. In addition to sampling variability, the ACS estimates are subject tononsampling error (for a discussion of nonsampling variability, see Accuracy of the Data). The effect of nonsampling error is not represented in thesetables.
While the 2008-2010 American Community Survey (ACS) data generally reflect the December 2009 Office of Management and Budget (OMB)definitions of metropolitan and micropolitan statistical areas; in certain instances the names, codes, and boundaries of the principal cities shown inACS tables may differ from the OMB definitions due to differences in the effective dates of the geographic entities.
Estimates of urban and rural population, housing units, and characteristics reflect boundaries of urban areas defined based on Census 2000 data.Boundaries for urban areas have not been updated since Census 2000. As a result, data for urban and rural areas from the ACS do not necessarilyreflect the results of ongoing urbanization.
Source: U.S. Census Bureau, 2008-2010 American Community Survey
Explanation of Symbols:
1. An '**' entry in the margin of error column indicates that either no sample observations or too few sample observations were available tocompute a standard error and thus the margin of error. A statistical test is not appropriate. 2. An '-' entry in the estimate column indicates that either no sample observations or too few sample observations were available to compute anestimate, or a ratio of medians cannot be calculated because one or both of the median estimates falls in the lowest interval or upper interval of anopen-ended distribution. 3. An '-' following a median estimate means the median falls in the lowest interval of an open-ended distribution. 4. An '+' following a median estimate means the median falls in the upper interval of an open-ended distribution. 5. An '***' entry in the margin of error column indicates that the median falls in the lowest interval or upper interval of an open-ended distribution. Astatistical test is not appropriate. 6. An '*****' entry in the margin of error column indicates that the estimate is controlled. A statistical test for sampling variability is not appropriate. 7. An 'N' entry in the estimate and margin of error columns indicates that data for this geographic area cannot be displayed because the number ofsample cases is too small. 8. An '(X)' means that the estimate is not applicable or not available.
1 of 1 04/27/2012

B01003 TOTAL POPULATIONUniverse: Total population2006-2010 American Community Survey 5-Year Estimates
Supporting documentation on code lists, subject definitions, data accuracy, and statistical testing can be found on the American Community Surveywebsite in the Data and Documentation section.
Sample size and data quality measures (including coverage rates, allocation rates, and response rates) can be found on the American CommunitySurvey website in the Methodology section.
Although the American Community Survey (ACS) produces population, demographic and housing unit estimates, for 2010, the 2010 Census providesthe official counts of the population and housing units for the nation, states, counties, cities and towns. For 2006 to 2009, the Population EstimatesProgram provides intercensal estimates of the population for the nation, states, and counties.
Goshen township, MahoningCounty, Ohio
Estimate Margin of ErrorTotal 3,240 +/-18
Data are based on a sample and are subject to sampling variability. The degree of uncertainty for an estimate arising from sampling variability isrepresented through the use of a margin of error. The value shown here is the 90 percent margin of error. The margin of error can be interpretedroughly as providing a 90 percent probability that the interval defined by the estimate minus the margin of error and the estimate plus the margin oferror (the lower and upper confidence bounds) contains the true value. In addition to sampling variability, the ACS estimates are subject tononsampling error (for a discussion of nonsampling variability, see Accuracy of the Data). The effect of nonsampling error is not represented in thesetables.
While the 2006-2010 American Community Survey (ACS) data generally reflect the December 2009 Office of Management and Budget (OMB)definitions of metropolitan and micropolitan statistical areas; in certain instances the names, codes, and boundaries of the principal cities shown inACS tables may differ from the OMB definitions due to differences in the effective dates of the geographic entities.
Estimates of urban and rural population, housing units, and characteristics reflect boundaries of urban areas defined based on Census 2000 data.Boundaries for urban areas have not been updated since Census 2000. As a result, data for urban and rural areas from the ACS do not necessarilyreflect the results of ongoing urbanization.
Source: U.S. Census Bureau, 2006-2010 American Community Survey
Explanation of Symbols:
1. An '**' entry in the margin of error column indicates that either no sample observations or too few sample observations were available tocompute a standard error and thus the margin of error. A statistical test is not appropriate. 2. An '-' entry in the estimate column indicates that either no sample observations or too few sample observations were available to compute anestimate, or a ratio of medians cannot be calculated because one or both of the median estimates falls in the lowest interval or upper interval of anopen-ended distribution. 3. An '-' following a median estimate means the median falls in the lowest interval of an open-ended distribution. 4. An '+' following a median estimate means the median falls in the upper interval of an open-ended distribution. 5. An '***' entry in the margin of error column indicates that the median falls in the lowest interval or upper interval of an open-ended distribution. Astatistical test is not appropriate. 6. An '*****' entry in the margin of error column indicates that the estimate is controlled. A statistical test for sampling variability is not appropriate. 7. An 'N' entry in the estimate and margin of error columns indicates that data for this geographic area cannot be displayed because the number ofsample cases is too small. 8. An '(X)' means that the estimate is not applicable or not available.
1 of 1 04/27/2012

B01003 TOTAL POPULATIONUniverse: Total population2010 American Community Survey 1-Year Estimates
Supporting documentation on code lists, subject definitions, data accuracy, and statistical testing can be found on the American Community Surveywebsite in the Data and Documentation section.
Sample size and data quality measures (including coverage rates, allocation rates, and response rates) can be found on the American CommunitySurvey website in the Methodology section.
Although the American Community Survey (ACS) produces population, demographic and housing unit estimates, for 2010, the 2010 Census providesthe official counts of the population and housing units for the nation, states, counties, cities and towns.
Mahoning County, OhioEstimate Margin of Error
Total 238,310 *****
Data are based on a sample and are subject to sampling variability. The degree of uncertainty for an estimate arising from sampling variability isrepresented through the use of a margin of error. The value shown here is the 90 percent margin of error. The margin of error can be interpretedroughly as providing a 90 percent probability that the interval defined by the estimate minus the margin of error and the estimate plus the margin oferror (the lower and upper confidence bounds) contains the true value. In addition to sampling variability, the ACS estimates are subject tononsampling error (for a discussion of nonsampling variability, see Accuracy of the Data). The effect of nonsampling error is not represented in thesetables.
While the 2010 American Community Survey (ACS) data generally reflect the December 2009 Office of Management and Budget (OMB) definitions ofmetropolitan and micropolitan statistical areas; in certain instances the names, codes, and boundaries of the principal cities shown in ACS tables maydiffer from the OMB definitions due to differences in the effective dates of the geographic entities.
Estimates of urban and rural population, housing units, and characteristics reflect boundaries of urban areas defined based on Census 2000 data.Boundaries for urban areas have not been updated since Census 2000. As a result, data for urban and rural areas from the ACS do not necessarilyreflect the results of ongoing urbanization.
Source: U.S. Census Bureau, 2010 American Community Survey
Explanation of Symbols:
1. An '**' entry in the margin of error column indicates that either no sample observations or too few sample observations were available tocompute a standard error and thus the margin of error. A statistical test is not appropriate. 2. An '-' entry in the estimate column indicates that either no sample observations or too few sample observations were available to compute anestimate, or a ratio of medians cannot be calculated because one or both of the median estimates falls in the lowest interval or upper interval of anopen-ended distribution. 3. An '-' following a median estimate means the median falls in the lowest interval of an open-ended distribution. 4. An '+' following a median estimate means the median falls in the upper interval of an open-ended distribution. 5. An '***' entry in the margin of error column indicates that the median falls in the lowest interval or upper interval of an open-ended distribution. Astatistical test is not appropriate. 6. An '*****' entry in the margin of error column indicates that the estimate is controlled. A statistical test for sampling variability is not appropriate. 7. An 'N' entry in the estimate and margin of error columns indicates that data for this geographic area cannot be displayed because the number ofsample cases is too small. 8. An '(X)' means that the estimate is not applicable or not available.
1 of 1 04/27/2012

B01003 TOTAL POPULATIONUniverse: Total population2006-2010 American Community Survey 5-Year Estimates
Supporting documentation on code lists, subject definitions, data accuracy, and statistical testing can be found on the American Community Surveywebsite in the Data and Documentation section.
Sample size and data quality measures (including coverage rates, allocation rates, and response rates) can be found on the American CommunitySurvey website in the Methodology section.
Although the American Community Survey (ACS) produces population, demographic and housing unit estimates, for 2010, the 2010 Census providesthe official counts of the population and housing units for the nation, states, counties, cities and towns. For 2006 to 2009, the Population EstimatesProgram provides intercensal estimates of the population for the nation, states, and counties.
Poland township, MahoningCounty, Ohio
Estimate Margin of ErrorTotal 14,912 +/-27
Data are based on a sample and are subject to sampling variability. The degree of uncertainty for an estimate arising from sampling variability isrepresented through the use of a margin of error. The value shown here is the 90 percent margin of error. The margin of error can be interpretedroughly as providing a 90 percent probability that the interval defined by the estimate minus the margin of error and the estimate plus the margin oferror (the lower and upper confidence bounds) contains the true value. In addition to sampling variability, the ACS estimates are subject tononsampling error (for a discussion of nonsampling variability, see Accuracy of the Data). The effect of nonsampling error is not represented in thesetables.
While the 2006-2010 American Community Survey (ACS) data generally reflect the December 2009 Office of Management and Budget (OMB)definitions of metropolitan and micropolitan statistical areas; in certain instances the names, codes, and boundaries of the principal cities shown inACS tables may differ from the OMB definitions due to differences in the effective dates of the geographic entities.
Estimates of urban and rural population, housing units, and characteristics reflect boundaries of urban areas defined based on Census 2000 data.Boundaries for urban areas have not been updated since Census 2000. As a result, data for urban and rural areas from the ACS do not necessarilyreflect the results of ongoing urbanization.
Source: U.S. Census Bureau, 2006-2010 American Community Survey
Explanation of Symbols:
1. An '**' entry in the margin of error column indicates that either no sample observations or too few sample observations were available tocompute a standard error and thus the margin of error. A statistical test is not appropriate. 2. An '-' entry in the estimate column indicates that either no sample observations or too few sample observations were available to compute anestimate, or a ratio of medians cannot be calculated because one or both of the median estimates falls in the lowest interval or upper interval of anopen-ended distribution. 3. An '-' following a median estimate means the median falls in the lowest interval of an open-ended distribution. 4. An '+' following a median estimate means the median falls in the upper interval of an open-ended distribution. 5. An '***' entry in the margin of error column indicates that the median falls in the lowest interval or upper interval of an open-ended distribution. Astatistical test is not appropriate. 6. An '*****' entry in the margin of error column indicates that the estimate is controlled. A statistical test for sampling variability is not appropriate. 7. An 'N' entry in the estimate and margin of error columns indicates that data for this geographic area cannot be displayed because the number ofsample cases is too small. 8. An '(X)' means that the estimate is not applicable or not available.
1 of 1 04/27/2012

B01003 TOTAL POPULATIONUniverse: Total population2006-2010 American Community Survey 5-Year Estimates
Supporting documentation on code lists, subject definitions, data accuracy, and statistical testing can be found on the American Community Surveywebsite in the Data and Documentation section.
Sample size and data quality measures (including coverage rates, allocation rates, and response rates) can be found on the American CommunitySurvey website in the Methodology section.
Although the American Community Survey (ACS) produces population, demographic and housing unit estimates, for 2010, the 2010 Census providesthe official counts of the population and housing units for the nation, states, counties, cities and towns. For 2006 to 2009, the Population EstimatesProgram provides intercensal estimates of the population for the nation, states, and counties.
Springfield township, MahoningCounty, Ohio
Estimate Margin of ErrorTotal 6,579 +/-19
Data are based on a sample and are subject to sampling variability. The degree of uncertainty for an estimate arising from sampling variability isrepresented through the use of a margin of error. The value shown here is the 90 percent margin of error. The margin of error can be interpretedroughly as providing a 90 percent probability that the interval defined by the estimate minus the margin of error and the estimate plus the margin oferror (the lower and upper confidence bounds) contains the true value. In addition to sampling variability, the ACS estimates are subject tononsampling error (for a discussion of nonsampling variability, see Accuracy of the Data). The effect of nonsampling error is not represented in thesetables.
While the 2006-2010 American Community Survey (ACS) data generally reflect the December 2009 Office of Management and Budget (OMB)definitions of metropolitan and micropolitan statistical areas; in certain instances the names, codes, and boundaries of the principal cities shown inACS tables may differ from the OMB definitions due to differences in the effective dates of the geographic entities.
Estimates of urban and rural population, housing units, and characteristics reflect boundaries of urban areas defined based on Census 2000 data.Boundaries for urban areas have not been updated since Census 2000. As a result, data for urban and rural areas from the ACS do not necessarilyreflect the results of ongoing urbanization.
Source: U.S. Census Bureau, 2006-2010 American Community Survey
Explanation of Symbols:
1. An '**' entry in the margin of error column indicates that either no sample observations or too few sample observations were available tocompute a standard error and thus the margin of error. A statistical test is not appropriate. 2. An '-' entry in the estimate column indicates that either no sample observations or too few sample observations were available to compute anestimate, or a ratio of medians cannot be calculated because one or both of the median estimates falls in the lowest interval or upper interval of anopen-ended distribution. 3. An '-' following a median estimate means the median falls in the lowest interval of an open-ended distribution. 4. An '+' following a median estimate means the median falls in the upper interval of an open-ended distribution. 5. An '***' entry in the margin of error column indicates that the median falls in the lowest interval or upper interval of an open-ended distribution. Astatistical test is not appropriate. 6. An '*****' entry in the margin of error column indicates that the estimate is controlled. A statistical test for sampling variability is not appropriate. 7. An 'N' entry in the estimate and margin of error columns indicates that data for this geographic area cannot be displayed because the number ofsample cases is too small. 8. An '(X)' means that the estimate is not applicable or not available.
1 of 1 04/27/2012

B01003 TOTAL POPULATIONUniverse: Total population2006-2010 American Community Survey 5-Year Estimates
Supporting documentation on code lists, subject definitions, data accuracy, and statistical testing can be found on the American Community Surveywebsite in the Data and Documentation section.
Sample size and data quality measures (including coverage rates, allocation rates, and response rates) can be found on the American CommunitySurvey website in the Methodology section.
Although the American Community Survey (ACS) produces population, demographic and housing unit estimates, for 2010, the 2010 Census providesthe official counts of the population and housing units for the nation, states, counties, cities and towns. For 2006 to 2009, the Population EstimatesProgram provides intercensal estimates of the population for the nation, states, and counties.
Struthers city, Mahoning County,Ohio
Estimate Margin of ErrorTotal 10,892 +/-44
Data are based on a sample and are subject to sampling variability. The degree of uncertainty for an estimate arising from sampling variability isrepresented through the use of a margin of error. The value shown here is the 90 percent margin of error. The margin of error can be interpretedroughly as providing a 90 percent probability that the interval defined by the estimate minus the margin of error and the estimate plus the margin oferror (the lower and upper confidence bounds) contains the true value. In addition to sampling variability, the ACS estimates are subject tononsampling error (for a discussion of nonsampling variability, see Accuracy of the Data). The effect of nonsampling error is not represented in thesetables.
While the 2006-2010 American Community Survey (ACS) data generally reflect the December 2009 Office of Management and Budget (OMB)definitions of metropolitan and micropolitan statistical areas; in certain instances the names, codes, and boundaries of the principal cities shown inACS tables may differ from the OMB definitions due to differences in the effective dates of the geographic entities.
Estimates of urban and rural population, housing units, and characteristics reflect boundaries of urban areas defined based on Census 2000 data.Boundaries for urban areas have not been updated since Census 2000. As a result, data for urban and rural areas from the ACS do not necessarilyreflect the results of ongoing urbanization.
Source: U.S. Census Bureau, 2006-2010 American Community Survey
Explanation of Symbols:
1. An '**' entry in the margin of error column indicates that either no sample observations or too few sample observations were available tocompute a standard error and thus the margin of error. A statistical test is not appropriate. 2. An '-' entry in the estimate column indicates that either no sample observations or too few sample observations were available to compute anestimate, or a ratio of medians cannot be calculated because one or both of the median estimates falls in the lowest interval or upper interval of anopen-ended distribution. 3. An '-' following a median estimate means the median falls in the lowest interval of an open-ended distribution. 4. An '+' following a median estimate means the median falls in the upper interval of an open-ended distribution. 5. An '***' entry in the margin of error column indicates that the median falls in the lowest interval or upper interval of an open-ended distribution. Astatistical test is not appropriate. 6. An '*****' entry in the margin of error column indicates that the estimate is controlled. A statistical test for sampling variability is not appropriate. 7. An 'N' entry in the estimate and margin of error columns indicates that data for this geographic area cannot be displayed because the number ofsample cases is too small. 8. An '(X)' means that the estimate is not applicable or not available.
1 of 1 04/27/2012

B01003 TOTAL POPULATIONUniverse: Total population2010 American Community Survey 1-Year Estimates
Supporting documentation on code lists, subject definitions, data accuracy, and statistical testing can be found on the American Community Surveywebsite in the Data and Documentation section.
Sample size and data quality measures (including coverage rates, allocation rates, and response rates) can be found on the American CommunitySurvey website in the Methodology section.
Although the American Community Survey (ACS) produces population, demographic and housing unit estimates, for 2010, the 2010 Census providesthe official counts of the population and housing units for the nation, states, counties, cities and towns.
Youngstown city, MahoningCounty, Ohio
Estimate Margin of ErrorTotal 66,835 +/-20
Data are based on a sample and are subject to sampling variability. The degree of uncertainty for an estimate arising from sampling variability isrepresented through the use of a margin of error. The value shown here is the 90 percent margin of error. The margin of error can be interpretedroughly as providing a 90 percent probability that the interval defined by the estimate minus the margin of error and the estimate plus the margin oferror (the lower and upper confidence bounds) contains the true value. In addition to sampling variability, the ACS estimates are subject tononsampling error (for a discussion of nonsampling variability, see Accuracy of the Data). The effect of nonsampling error is not represented in thesetables.
While the 2010 American Community Survey (ACS) data generally reflect the December 2009 Office of Management and Budget (OMB) definitions ofmetropolitan and micropolitan statistical areas; in certain instances the names, codes, and boundaries of the principal cities shown in ACS tables maydiffer from the OMB definitions due to differences in the effective dates of the geographic entities.
Estimates of urban and rural population, housing units, and characteristics reflect boundaries of urban areas defined based on Census 2000 data.Boundaries for urban areas have not been updated since Census 2000. As a result, data for urban and rural areas from the ACS do not necessarilyreflect the results of ongoing urbanization.
Source: U.S. Census Bureau, 2010 American Community Survey
Explanation of Symbols:
1. An '**' entry in the margin of error column indicates that either no sample observations or too few sample observations were available tocompute a standard error and thus the margin of error. A statistical test is not appropriate. 2. An '-' entry in the estimate column indicates that either no sample observations or too few sample observations were available to compute anestimate, or a ratio of medians cannot be calculated because one or both of the median estimates falls in the lowest interval or upper interval of anopen-ended distribution. 3. An '-' following a median estimate means the median falls in the lowest interval of an open-ended distribution. 4. An '+' following a median estimate means the median falls in the upper interval of an open-ended distribution. 5. An '***' entry in the margin of error column indicates that the median falls in the lowest interval or upper interval of an open-ended distribution. Astatistical test is not appropriate. 6. An '*****' entry in the margin of error column indicates that the estimate is controlled. A statistical test for sampling variability is not appropriate. 7. An 'N' entry in the estimate and margin of error columns indicates that data for this geographic area cannot be displayed because the number ofsample cases is too small. 8. An '(X)' means that the estimate is not applicable or not available.
1 of 1 04/27/2012

Mahoning County Local Government Innovation Fund Proposal
CURE – Item 4 – Resolutions of Support 1
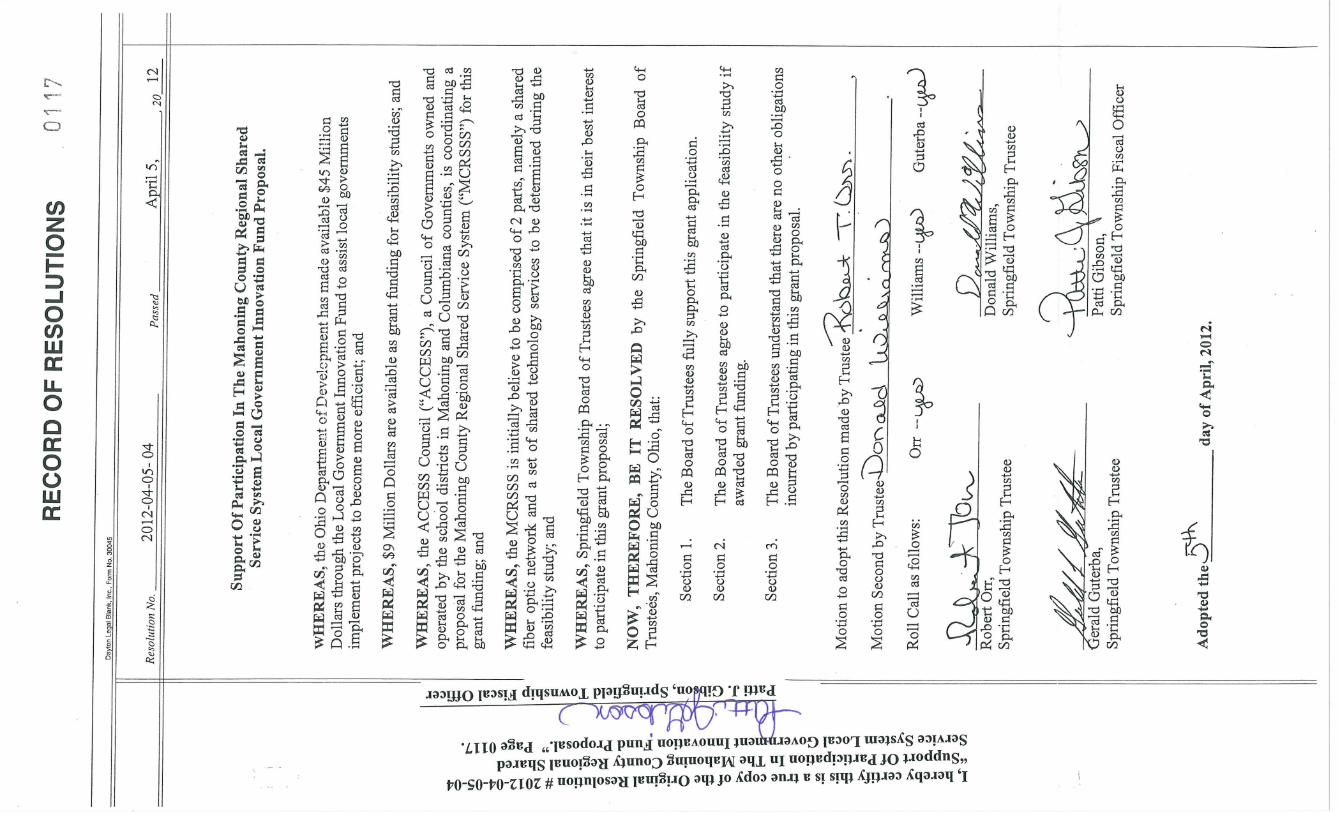
CURE Response – Resolutions of Support 1. Resolutions from Collaborative Partners
Please see the attached Resolutions of Support from the Collaborative Partners.


Mahoning County Local Government Innovation Fund Proposal
CURE – Item 5 – Partnership Agreements 1
CURE Response – Partnership Agreement 1. Partnership Agreement
Please find a copy of Tab 2 – Collaborative Partners from the original LGIF Grant Application. This tab covers the list of all collaborative partners and the nature of the partnership.
2. Signature Page Please find the approving signatures from the Collaborative Partners.

Mahoning County Local Government Innovation Fund Proposal
Tab 2 �– Collaborative Partners 1
Collaborative Partners
1. Mahoning County Educational Service Center (MCESC)
Ron Iarussi, [email protected] DeBartolo Place, Suite 220Youngstown, OH 44512(o) (330) 965 7828(f) (330) 965 7901
Nature of Partnership �– The MCESC will act as a co production partner in the project,providing educational, financial, technical, and consulting services to the partnershipparticipants. The MCESC also acts as the fiscal agent to ACCESS, the Main Applicant.
2. Mahoning County Auditor�’s Office
Michael Sciortino, County [email protected] Williams, Director, Information [email protected] County Court House120 Market Street, First FloorYoungstown, OH 44503(o) (330) 740 2010(f) (330) 480 7571
Nature of Partnership �– The Auditor�’s office and the Data Processing department arecharged with county wide IT services, including Internet, e mail, Intranet, and SQLdatabase systems for the courts, real estate, GIS, financials, and HR/payroll. Thisservice offering is part of the idea of co production by the project participants. Also,the County Mahoning Youngstown Regional Information System (MYRIS) was started3 years ago as an initial shared county network system. This system, combined withACCESS�’ private fiber optic network, will form the basis for moving a shared networksystem forward.

Mahoning County Local Government Innovation Fund Proposal
Tab 2 �– Collaborative Partners 2
3. Mahoning County CommissionersTotal Population 238,823
John McNally, [email protected] County Administration Building21 W. Boardman Street, Second FloorYoungstown, OH 44503(o) (330) 740 2130(f) (330) 740 2006
Nature of Partnership �– The Board of Mahoning County Commissioners is thegeneral administrative body for county government. In addition to serving as thefiscal representatives of Mahoning County, they serve as the legislative andgoverning body. The Commissioners are responsible for making policy, adoptingordinances, and levying taxes to finance county government programs. The Board isvery interested in exploring any and all ways to reduce cost and enhance servicesthrough this project.
4. Austintown TownshipTotal Population 36,722
Michael [email protected] Township Administrator̘82 Ohltown Rd.̘Austintown, OH 44515̘(o) (330) 792 8584(f) (330) 259 7895
Nature of Partnership �– Austintown Township is very interested in enhancing theservices provided to its residents and offices, while reducing and controlling costs.Austintown is also a current MYRIS participant, looking to expand their partnershipwith other Mahoning County entities.

Mahoning County Local Government Innovation Fund Proposal
Tab 2 �– Collaborative Partners 3
5. Boardman TownshipTotal Population 40,889
Jason [email protected] Township Administrator8299 Market StreetBoardman OH 44512(o) (330) 726 4177(f) (330) 729 2054
Nature of Partnership �– Boardman Township is very interested in enhancing theservices provided to its residents and offices, while reducing and controlling costs.Boardman is also a current MYRIS participant, looking to expand their partnershipwith other Mahoning County entities.
6. Goshen TownshipTotal Population 3,243
Goshen TownshipRobert (Bob) McCracken Trustee's [email protected] W. South Range Rd.Salem, OH 44460 9127(o) (330) 207 8053(f) (330) 332 3411
Nature of Partnership �– Goshen Township is very interested in enhancedconnectivity services. They currently rely on a single T 1 connection that is not veryrobust and very unreliable. They have limited budget to invest in technology, andare looking at this project as a way to tap into centralized information technologyresources for their township.

Mahoning County Local Government Innovation Fund Proposal
Tab 2 �– Collaborative Partners 4
7. Poland Village
Tim Sicafuse, Mayortsicafuse@valley group.comPoland Village308 South Main StreetPoland, Ohio 44514(o) (330) 757 2112(f) (330) 757 1680
Nature of Partnership �– Poland Village is interested in expanding and enhancing theservices provided to its citizens through the use technology, as well as making moreefficient its day to day operations.
8. Springfield TownshipTotal Population 6,703
Bob [email protected] Township3475 E. South Range RoadNew Springfield, Ohio 44443(o) (330) 542 2377(f) (330) 542 0357
Nature of Partnership �– Springfield Township is interested in expanding andenhancing the services provided to its citizens through the use technology, as well asmaking more efficient its day to day operations. They are particularly interested inthe sharing of law enforcement data.

Mahoning County Local Government Innovation Fund Proposal
Tab 2 �– Collaborative Partners 5
9. Struthers CityTotal Population 10,713
Terry Stocker, [email protected] City6 Elm StreetStruthers, Ohio 44471(o) (330) 755 2181(f) (330) 755 1550
Nature of Partnership �– Struthers City is interested in expanding and enhancing theservices provided to its citizens through the use technology, as well as making moreefficient its day to day operations. Struthers is also very interested in shared 911services to greater enhance their police and fire information.
10. Data Recovery Services, LLC
Mike Meloy, [email protected] Belmont AvenueYoungstown, Ohio 44504(o) (330) 259 4900(f) (330) 259 4935
Nature of Partnership �– ACCESS sold 2 strands of their private fiber network to theColumbiana County Port Authority (CCPA) in 2004, and the CCPA leased this networkto DRS in early 2012. DRS is responsible for marketing this network to governmentalagencies, while ACCESS focuses on educational and library customers. DRS is alsoproviding a wide variety of technical services to Mahoning County governmentalagencies currently, including desktop support, virtual server support, fiber opticconnectivity, and voice over IP telephony.

Mahoning County Local Government Innovation Fund Proposal
Tab 2 �– Collaborative Partners 6
11. Poland TownshipTotal Population 14,960
Jim Scharville, Township [email protected] Township3339 Dobbins RoadPoland, OH 44514(o) (330) 757 0733(f) (330) 757 1152
Nature of Partnership �– Poland Township is interested in expanding and enhancingthe services provided to its citizens through the use technology, as well as makingmore efficient its day to day operations.
12. Village of New Middletown
Harry Kale, [email protected] of New Middletown10711 Main StreetNew Middletown, OH 44442(o) (330) 542 2846(f) (330) 542 2866
Nature of Partnership �– The Village of New Middletown is interested in expandingand enhancing the services provided to its citizens through the use technology, aswell as making more efficient its day to day operations.

Mahoning County Local Government Innovation Fund Proposal
Tab 2 �– Collaborative Partners 7
13. Mahoning County Sheriff
Major Mike [email protected] County Sheriff�’s Office110 Fifth AvenueYoungstown, OH 44503(o) (330) 480 5000(f) (330) 480 5089
Nature of Partnership �– The Mahoning County Sheriff�’s office is interested inexpanding and enhancing the services provided to its citizens through the use oftechnology, as well as making more efficient its day to day operations. They areparticularly interested in the sharing of law enforcement data with all of the countypolice departments and courts. This is something they have been interested in foryears, and are looking forward to this possibility.
14. Youngstown CityTotal Population 66,971
Mike [email protected] Center CIOCity of Youngstown(o) (330) 742 8986(f) (330) 744 7460
Nature of Partnership �– The City of Youngstown is interested in expanding andenhancing the services provided to its citizens through the use technology, as well asmaking more efficient its day to day operations.

Mahoning County Local Government Innovation Fund Proposal
Tab 2 �– Collaborative Partners 8
15. Mahoning County Treasurer
Daniel [email protected] County TreasurerMahoning County Courthouse120 Market Street, 1st FloorYoungstown, OH 44503(o) (330) 740 2460(f) (330) 740 2142
Nature of Partnership �– The Mahoning County Treasurer is interested in expandingand enhancing the services it provides through the use technology, as well as makingmore efficient its day to day operations.
16. Mahoning County Recorder
Noralynn Palermo, Mahoning County [email protected] County Court House120 Market St., First FloorYoungstown, OH 44503
(o) (330) 740 2345(f) (330) 740 2347
Nature of Partnership �– The Mahoning County Recorder is interested in expandingand enhancing the services it provides through the use technology, as well as makingmore efficient its day to day operations.
