mahila arthik vikas mahamandal (mavim) annual …mahila arthik vikas mahamandal (mavim) annual...
TRANSCRIPT

1
MAHILA ARTHIK VIKAS MAHAMANDAL (MAVIM)
ANNUAL OUTCOME SURVEY REPORT
(APRIL 2009- MARCH 2010)
TEJASWINI MAHARASHTRA RURAL WOMEN EMPOWERMENT PROGRAMME
Loan No – 682 IN

2
A. Introduction –
Tejaswini Maharashtra Rural Women Empowerment Programme is implemented in the 33 rural
districts of Maharashtra covering over 12,000 villages supporting over 65,000 SHGs. The target
group for Tejaswini is poor rural women especially from the Scheduled Castes and Scheduled
Tribes, woman headed households, widows, deserted women, divorcees, landless laborers, and
AIDs affected women. Tejaswini Programme focuses on the following thrust areas:
• Grass Roots Institution building
• Micro Finance Services
• Livelihood & Micro Enterprise development
• Women Empowerment
The project began from July 2007 onwards, and the duration of the programme is up to the year
2015. Tejaswini programme envisages creation of strong sustainable SHGs, by promoting and
developing of Village Level Committees (VLC) and establishment of Community Managed
Resource Centers (CMRCs). The CMRCs’ are for social and economic development for promoting,
thrift, savings, and credit and insurance services in addition to strengthening their livelihoods. At
village level SHGs form Village Level Committees as a forum for convergence of services for
achieving social and economic empowerment, while the CMRCs would eventually become the
federations of SHGs in a given cluster of villages to provide a range of services to member
groups and build linkages with various development organisations. Programme proposes a clear
exit strategy where in these institutions promoted are owned and controlled by groups,
continues to sustain beyond the project where the groups would contribute service costs to meet
their costs.
The overall goal of the Programme is to enable poor women to make use of choices, spaces and
opportunities in the economic, social and political spheres for their improved well-being. The
goal is sought to be achieved by: (a) creating strong and sustainable SHGs and SHGs’ apex
organizations; (b) providing (them) access to micro-finance services; (c) creating new and
improved livelihood opportunities; and (d) providing access to functional education, labor-saving
infrastructure, and participation in local governance.
During the Current year implementation focuses on the following areas:-
o Strengthening the grass root institutions
o Making the CMRCs (Block level federations of SHGs) functional.
o Skill enhancement amongst women
o More credit flow for the eligible SHGs
o Strategic convergence with line departments
o Gender integration across all the work components
Tejaswini programme has conducted the Annual Outcome Survey for the period of 2010/11 in
the month of February 2011.
B. Methodology –
Sample size and sampling method:-
MAVIM has covered a women i.e., 4957 women i.e. 150 women for each of the 33 districts
covered under Tejaswini. Out of those 75 women i.e. 50% women are Tejaswini Programme
beneficiaries. However 50% women are non project beneficiaries.

3
The following steps have been followed for identification of samples:
I. Three CMRCs out of 7 / 8 CMRCs of each district are identified through random
sampling method.
II. A list of all SHGs functioning under these 3 CMRCs was prepared and 8 SHGs in each
CMRCs were identified through PPS method.
III. It was followed by preparing the list of all members of those 8 SHGs and three
members from each SHGs were selected through random table method.
IV. The similar method was applied for selecting the beneficiaries under control group.
V. Following table shows the district wise coverage of sample and coverage group
members :
Sr.
No.
Beneficiary Nos. Per
CMRC
No. of CMRCs
covered in
each of the
33 districts
No. of
beneficiaries
per district
Total Nos.of
beneficiaries
covered in all
33 districts
1 Sample group 25 3 75 2475
2 Control group 25 3 75 2475
Total 50 150 4950
• NOTE: = CMRC is a block level federation of SHGs comprising of 150 to 200 SHGs per
CMRC.
VI. Considering the corporate requirement of IFAD, 200 beneficiaries in each of the
sample and control group were selected through random sampling method and their
data analysis is mentioned in the enclosed reporting. As Tejaswini Maharashtra is
operating in all the districts of the state (33 districts), and supporting around 700,000
women households through the programme services, Management has taken a
decision to cover a bigger number of sample size under annual outcome survey which
will enable the programme to monitor the tract of the progress in effective manner.
VII. The survey report is consisting of the findings of 200 sample and 200 control group
beneficiaries.
C. Findings of the Survey
The detail analysis of the data is as follows:
Statistical Analysis
Objectives:-
1. To assess the effectiveness of programme activities in enhancing the income of the
respondents and change in the sources of income who has received the project services.
2. To assess the effectiveness of the programme activities for providing food security to the
beneficiaries.
3. To assess the level of increase in production, productivity and also the adoption of new agricultural technologies.
4. To assess the effectiveness of programme activities in providing access to credit, rural
finances and access to market to the beneficiaries and also to analyze the trend of utilization
of credit at the level of beneficiaries.

4
Compilation of Data:-
The information obtained through observation and interviews was processed and was used for
further analysis. All the schedules were entered into the computer for the purposes of analysis.
The software provided by IFAD based on MS Excel was used to analyse the data in order to derive simple frequencies and cross tabulation.
Statistical Analysis:-
Table A and B: Household Details and analysis of project services at the beneficiaries’ level: - In
all 400 respondents were included in this survey. The proportion of beneficiaries of the Tejaswini
programme was 50%, whereas the remaining 50% constitutes non-beneficiaries of the Tejaswini
programme.
• Among these households the female as head was reported by 18% and 59.5% respondents
in beneficiary and non-beneficiary group respectively. The percentage of male-headed
households is higher in sample group.
• There were 99% of programme beneficiaries have heard about Tejaswini programme,
however this percentage is nil in control group. The percentage of beneficiaries involved in
each of the programme activity is mentioned in the table below:-
Sr.
no
Name of the programme activities % of
beneficiaries
involved
1 Training on SHG concept and management 98.4
2 Training on concept Village Level Committee and management 89.9
3 Training on concept of CMRC (SHG federation) and management 83.6
4 Training on bank linkages 87.8
5 Training on skill development 76.2
6 Training on entrepreneurship awareness 78
(Note: Due to multiple responses the total percentage is above 100%)
18%
82%
Gender of the head of household
Female Male
59%
41%
Gender of the head of
household
Female
Male

• Out of 189 programme
programme activities and 58.2% rated it as
whereas 3.2% beneficiaries are not at all satisfied with
programme beneficiaries reported that they have frequent contacts with the
programme staff, while
beneficiaries reported rare contact with
Table C: No. of sources income and
The following table shows percentage of beneficiaries availing multiple number of sources of
income within both sample and control group.
Sr. No. Particulars At least
source
1 Sample group 96%
beneficiaries
2 Control group 97%
beneficiaries
197 189
2
0
100
200
300
Have heard about the
project?
Involved in at least one
project activity?
Knowledge about the project and
participation (Nb of households)
98
90
75
80
85
90
95
100
Involved in
activity a
Involved in
activity b
Participation in project activities(Nb of households)
5
programme beneficiaries, 43.4% reported that they are very satisfied
programme activities and 58.2% rated it as moderately satisfactory
3.2% beneficiaries are not at all satisfied with programme activities.
beneficiaries reported that they have frequent contacts with the
while 14.3% reported occasional contacts with programme
beneficiaries reported rare contact with programme staff.
No. of sources income and Change in Income: -
shows percentage of beneficiaries availing multiple number of sources of
income within both sample and control group.
At least one
source
Two sources Three sources
96%
beneficiaries
52%
beneficiaries
38% beneficiaries
97%
beneficiaries
61%
beneficiaries
24% beneficiaries
189
8
Involved in at least one
project activity?
Knowledge about the project and
participation (Nb of households)
Ye
s0
050
100150200250
Yes
Knowledge about the project?(Nb of households)
84
Involved in Involved in
activity c
Participation in project activities
88
14
0
20
40
60
80
100
Frequently Occasionally
Frequency of visits by project staff(Nb of households)
that they are very satisfied with
moderately satisfactory with the services,
activities. Similarly, 88%
beneficiaries reported that they have frequent contacts with the Tejaswini
programme staff and 3.2%
shows percentage of beneficiaries availing multiple number of sources of
Four sources
beneficiaries 11%
beneficiaries
24% beneficiaries 9% beneficiaries
200
No
Knowledge about the project?(Nb of households)
Yes
No
143
Occasionally Rarely
Frequency of visits by project staff(Nb of households)

Programme participants are
women to avail comparatively
for productive purposes through multiple capsules of trainings under
reason due to which we find the tendency of multiple number of income sources is a
(especially having 3 and 4 sources of income) in sample group as compared to control group.
This even shows that the sample group has more inclination to invest more in productive
sources to improve their livelihood which can be attributed to
programme.
The change in income over
2.It is evident that significantly higher percentage of respondents
increase in income (66.5%
last year were more prominent in
to non-beneficiary groups.
Programme is taking up multiple sets of activities to increase the income of the beneficiaries
especially through micro finance and livelihood activities. The thrust of the
encourage the beneficiaries to take up multiple sources of income through th
they are availing. Programme
enhancement for the women taking up IGA activities
activities are provided with the inputs on
equipments, etc. In the same
development training programme
contributed to increase in availing number of sources of income
enhancing income.
Table D: Food Security:-
Total 196 respondents have answered this section where
were able to provide 3 times meal to their family across the whole year whereas
respondent mentioned that
respondents have experienced improvement in food security whereas
for 6% beneficiaries the situation is even worse. The average duration
months during the year in the
0%
50%
100%
At least one sourceTwo sources Three sources
96%
52%%
ho
use
ho
lds
Nb of income sources per household
Number of income sources
6
participants are taking up micro finance activities to a larger extent.
comparatively larger size of credit, and also is being educated to use the
for productive purposes through multiple capsules of trainings under programme
reason due to which we find the tendency of multiple number of income sources is a
(especially having 3 and 4 sources of income) in sample group as compared to control group.
the sample group has more inclination to invest more in productive
sources to improve their livelihood which can be attributed to the interventions of the
over previous year as observed from the sample data is shown in Table
It is evident that significantly higher percentage of respondents in beneficiary group
% vs. 26.1%). It can be inferred that increase in income compared to
prominent in Tejaswini Programme among beneficiary group
is taking up multiple sets of activities to increase the income of the beneficiaries
especially through micro finance and livelihood activities. The thrust of the
encourage the beneficiaries to take up multiple sources of income through th
Programme is providing the training on skill development and skill
women taking up IGA activities whereas the women with agro based
activities are provided with the inputs on use of improved quality
, etc. In the same year 65% women are provided with e
programme through Tejaswini. As a result, increased awareness
contributed to increase in availing number of sources of income and increase in their capaci
ents have answered this section where 81% respondent mentioned
were able to provide 3 times meal to their family across the whole year whereas
that they were not able to provide 3 meals. On the other hand,
respondents have experienced improvement in food security whereas for 26% beneficiaries and
for 6% beneficiaries the situation is even worse. The average duration
the year in the sample group.
Two sources Three sourcesFour sources
52%38%
11%
Nb of income sources per household
Number of income sources
0%
100%
At least one sourceTwo sources
97%
% h
ou
seh
old
s
Nb of income sources per household
Number of income sources
finance activities to a larger extent. It is enabling
being educated to use the credit
programme. This is the
reason due to which we find the tendency of multiple number of income sources is at higher side
(especially having 3 and 4 sources of income) in sample group as compared to control group.
the sample group has more inclination to invest more in productive
the interventions of the
previous year as observed from the sample data is shown in Table D-
in beneficiary group report
It can be inferred that increase in income compared to
beneficiary groups as compared
is taking up multiple sets of activities to increase the income of the beneficiaries
especially through micro finance and livelihood activities. The thrust of the programme is to
encourage the beneficiaries to take up multiple sources of income through the amount of credit
is providing the training on skill development and skill
whereas the women with agro based
seeds, fertilizers, agro
ar 65% women are provided with entrepreneurship
increased awareness has
increase in their capacity for
respondent mentioned that they
were able to provide 3 times meal to their family across the whole year whereas 19%
ere not able to provide 3 meals. On the other hand, 68.55 %
for 26% beneficiaries and
for 6% beneficiaries the situation is even worse. The average duration of food shortage is 4
At least one sourceTwo sources Three sourcesFour sources
97%61%
24% 9%
Nb of income sources per household
Number of income sources

7
"Improving food security" is being a RIMS indicator; programme has taken up specific efforts to
address this issue. One of the prominent activities it motivated women to develop kitchen
gardens in the programme villages. For example, in the districts like Washim and Yeovathmal
(districts of Vidarbha region) a huge campaign was taken up in which all the SHG members in
the village are provided with seeds for kitchen garden in convergence with District Agriculture
Department and encouraged to develop the same. Women are educated to use the fresh green
vegetables for their own family along with the sale of the same in local markets. This was found
to be helping to reduce hunger season without much cost investment. Secondly, in the tribal belt
the "Grain BANKS” are promoted, and 51 grain banks are developed under the programme. This
is also enabling the poor programme participants to improve food security in the villages.
Another important intervention is the programme is facilitating to provide ration cards, and
awareness amongst beneficiaries to provide the services of the PDS system. More effective and
useful tool was a resolution issued by the Government of Maharastra in November 2009 by
which the SHGs are permitted to run PDS shops which is again a favorable policy decision to
improve the situation.
Table E: Land ownership, land size and property rights:
A total of 189 respondents have answered this session, out of that 53% respondents own some
land and the average size of land is 4.38 acres, whereas 43% respondents do not own land. In
the control group the average size of land is 3.34 acre.
68%
26%
6%
Change in food security situation
over past 12 months
Improvement
Same
Situation
worse
51%41%
8%
Change in food security
situation over past 12 months
Improvemen
t
Same
Situation
worse
4.38 1.00
105.00
0
20
40
60
80
100
120
Average land
size
Minimum land
size
Maximum land
size
Nb
of
acr
es
Land holding size
3.34
1.00
18.00
0
2
4
6
8
10
12
14
16
18
20
Average land
size
Minimum land
size
Maximum land
size
Nb
of
acr
es
Land holding size

8
Table F: Agriculture Production:-
The following table shows the details in this regard:
Sr.
no
Particulars Total no. of
beneficiaries
reported
% of
beneficiaries
reporting
large increase
% of
beneficiaries
reporting
medium
increase
% of
beneficiaries
reporting small
increase
% of
benefici
aries
reportin
g no
increase
1 Farming
households
reporting
increase in
crop
productivity
132 6 41 10 43
2 Farming
households
reporting
increase in size
of crop
production
area
147 5 35 12 49
3 Farming
households
reporting
increase in size
of irrigated
area
80 9 31 11 49
4 Farming
households
reporting
increase in fish
ponds
productivity
82 15 15 12 59
5 Households
reporting
increase in
hard size
117 6 27 15 52
About 57 percent revealed increase in agriculture production of which 10 per cent had small
increase in production, and 27 % reported increase in income to medium proportion, whereas
6% report increase to large scale. About 24.40% beneficiaries attribute the reason for increase
in production to progamme activities, which could be related to enhanced skill sets, use of
modern agro equipments, increased awareness to use improved quality of seeds, use of
fertilizers, introduction and use of rain water harvesting techniques, etc.
In the case of non programme beneficiaries, 3% respondents reported the increase in production
was to a large scale, and medium production increase was reported by 32% respondents.
Table G: Access to Market:
9
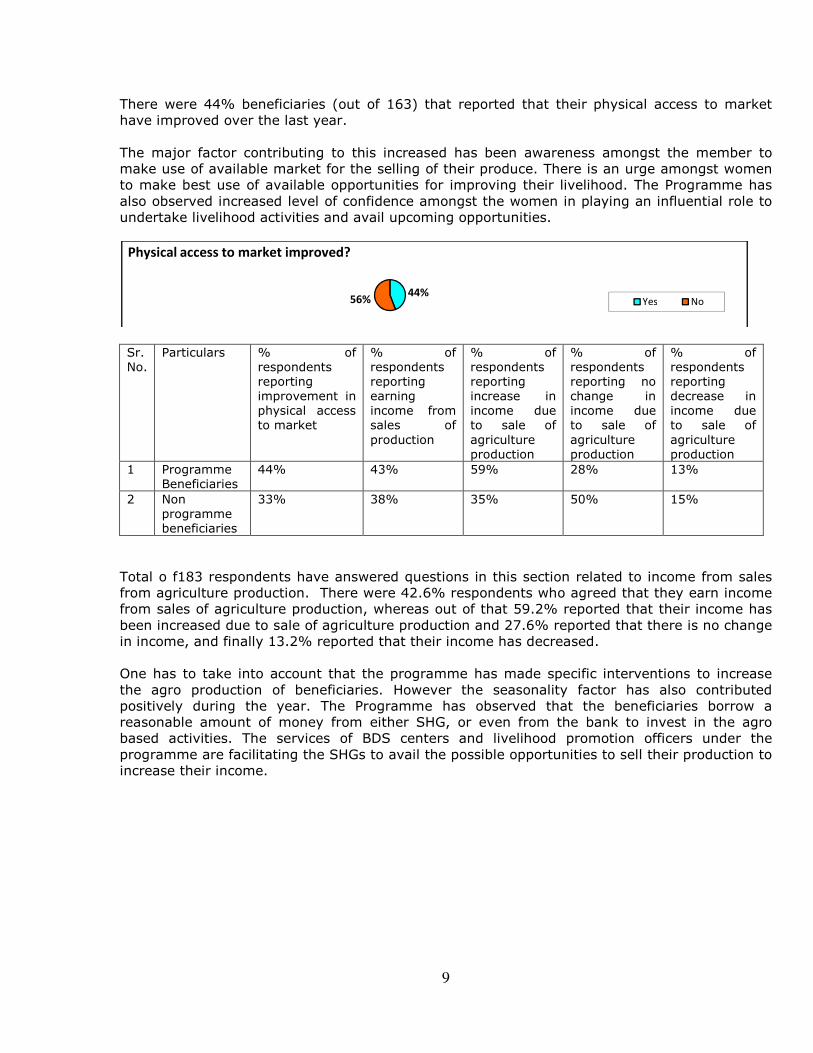
There were 44% beneficiaries (out of 163) that reported that their physical access to market
have improved over the last year.
The major factor contributing to this increased has been awareness amongst the member to
make use of available market for the selling of their produce. There is an urge amongst women
to make best use of available opportunities for improving their livelihood. The Programme has
also observed increased level of confidence amongst the women in playing an influential role to
undertake livelihood activities and avail upcoming opportunities.
Sr.
No.
Particulars % of
respondents
reporting
improvement in
physical access
to market
% of
respondents
reporting
earning
income from
sales of
production
% of
respondents
reporting
increase in
income due
to sale of
agriculture
production
% of
respondents
reporting no
change in
income due
to sale of
agriculture
production
% of
respondents
reporting
decrease in
income due
to sale of
agriculture
production
1 Programme
Beneficiaries
44% 43% 59% 28% 13%
2 Non
programme
beneficiaries
33% 38% 35% 50% 15%
Total o f183 respondents have answered questions in this section related to income from sales
from agriculture production. There were 42.6% respondents who agreed that they earn income
from sales of agriculture production, whereas out of that 59.2% reported that their income has
been increased due to sale of agriculture production and 27.6% reported that there is no change
in income, and finally 13.2% reported that their income has decreased.
One has to take into account that the programme has made specific interventions to increase
the agro production of beneficiaries. However the seasonality factor has also contributed
positively during the year. The Programme has observed that the beneficiaries borrow a
reasonable amount of money from either SHG, or even from the bank to invest in the agro
based activities. The services of BDS centers and livelihood promotion officers under the
programme are facilitating the SHGs to avail the possible opportunities to sell their production to
increase their income.
44%56%
Physical access to market improved?
Yes No

10
In the control group only 33% respondents (out of 161) reported that their access to market
have been improved in the last one year. Out of 188 respondents 37% reported that they have
earned income due to sale of agriculture production, and while 35% reported increased in
income, 50% reported no change in income, 15% reported decreased in income also.
Table H: Rural Financial Services
1. Under the programme, 78% of the beneficiaries have accessed credit over the last year
and 71% reported that their access to credit has been improved, whereas 83.7%
beneficiaries attributed this success to Tejaswini programme activities.
Whereas in non Tejaswini beneficiary group, 52% have access to credit over the last year
and 44% have reported an improvement in access to credit.
2. 46 % of respondent reported that they had taken loan for IG activities whereas for
consumption (28 %), education (9%), health (9 %) other investments (10%) under
beneficiary group.
59%28%
13%
Reported change in income from sales of agricultural production (% of hhs reporting)
Increased income No change Decreased income
Yes
71%
No
29%
Improved access to credit?
Yes
84%
No
16%
Access to credit improved thanks
to project activities?

11
Under non Tejaswini beneficiary group 37 % of respondent reported that they had taken
loan for IG activities whereas for consumption (35 %), education (11%), health (7 %)
other investments (14%).
Tejaswini programme is taking activities to motivate beneficiaries to utilize the loan more
for productive purposes , hence the % beneficiaries taking up loan for IG activities is at
greater extent.
Table I: Enterprise Development and Employment:
Sr.
No.
Particulars % respondents
who has
established
nonfarm
enterprise
% of enterprises
supported and
expanded by
programme / other
services
No. of respondents
reporting support from
Tejaswini programme in
finding a job or
improving employment
condition
1 Programme
Beneficiaries
33% 83% 71%
2 Non programme
beneficiaries
23% 26% 0
The 26% non Tejaswini beneficiaries reported the sources of support to their enterprises to Govt
extension services, interventions of NGO etc.
Consumption
28%
Income generating
activities
46%
Other investments
10%
Education
9%
Health
7%
Main use of credit

12
Table J: Women Empowerment:
Tejaswini Programme has also included the Women Empowerment Indicators in the survey, the
findings are given below:
• Assets creation and Ownership of assets :
Sr.
No.
Type of Assets Sample Group Control Group
% of beneficiaries reporting % of beneficiaries
reporting
1 Household material 51 39
2 Kitchen utensils 16 22
3 Agro instrument/ equipments 12 10
4 Live stock 8 12
5 Forest Land 1 1
6 House Repairing 8 10
7 Other 6 5
The creation of assets is at a higher side within sample group than the control group. The
ownership of assets is 16% exclusively for female, and 21% in the case of both in sample group,
whereas it is 15% and 17% respectively in the control group.
Tejaswini Programme is basically a Women Empowerment Programme for specific intervention
to motive women to create assets in their own name as they increase their own income.
• Involvement in decision making :-
Sample Group and Control Group
Decision
by
whom
Purchasing
Household
Material
Purchas
ing
Kitchen
Vessels
Purchasing
Agri.
Instrument
& Equipment
Livestock
Purchasi
ng
Decision of
Cultivation
Seed in
Field
Decision
Regarding
Land
Purchasing
Decision
Regarding
House
Constructi
on
Decision
Regardi
ng
Others
A Male
%
sample 17 15 33 19 23 20 13 16
52%31%
17%
SME establishement and type of project support
Project helped etablish Project helped expand No project support

13
%
Control 22 21 44 47 46 39 32 31
B
Female
%
sample 22 34 9 12 12 9 7 10
%
Control 22 36 3 4 1 5 4 7
C Both
%
Sample
61 51 58 69 66 71 80 74
%
Control 56 43 52 49 53 57 64 62
Total
no. of
respond
ent-
SAMPLE
GROUP
175 158 120 113 102 106 143 96
Total
no. of
respond
ent-
CONTR
OL
GROUP
176 165 124 114 116 122 144 89
The findings show that women do play a part in decision making while purchasing live stock,
seed, land purchasing, and house construction, however it is at a marginal level in both sample
and control group. Although the percentage of sample group is slightly in the higher side,
whereas the decision making of women in purchasing household material and kitchen utensil is
reasonably better.
Programme is making a constant effort to enhance the confidence level of women to take up an
aggressive role in decision making. However, the efforts are needed to be more strategic to
enhance their decision making on prominent issues such as purchasing of land, and seeds.
Tracking Outcome -Comparison of the findings of the year 2010/11 with 2009/10:-
1. During the last annual outcome survey 50% programme beneficiaries had reported increase
in income however during current annual outcome survey 66.5% beneficiaries are reporting
increase in their income which shows the hike of 11.5% over a year. Increased focus on
subsector development, enterprise development training based on subsector and thrust on
developing market linkages could support this increase.
2. As per the last annual survey 78% respondent were found to be able to provide 3 times a
meal to their family across the whole year, whereas the percentage has increased up to 81%
this year.
It can be attributed to the set of activities conducted during the current year for e.g.
establishing grain bank in progamme villages especially in tribal areas; taking up mass

14
campaign on kitchen garden activities in majority of the project villages; and thrust on
developing micro enterprises / IG activities by all the members of SHGs to improve their food
purchasing power.
3. As per the last annual survey only less than 1 percent beneficiaries had reported large increase in production which has grown up to 6% this year. Similarly, increase in production
in medium proportion has grown from 15% to 41%.
During the year 09/10, project has taken up focused interventions especially in convergence
with government departments in this regard. The beneficiaries are provided with trainings
and they are informed to use high quality seeds, fertilizers, etc. The farmers are oriented to
use the techniques to improve the quality of soil. The effectiveness of the intervention was
further improved by promoting various tillage equipment.
Key observations and lessons learnt from the Annual Outcome Survey:-
1. Programme is proposing to hire the services of Livelihood Resource Agencies to promote
effective technologies which can be adopted by the beneficiaries. The agencies are
proposed to be on board from the year 2011-12.Thus the factor of adoption of technology
will be addressed in the year 2011-12.
2. The Programme can undertake the similar type of survey exclusively for the women
headed households which can be a tool to assess the progress "targeted beneficiaries"
from a gender perspective.
3. Though there is an increase in multiple sources of income the number of women
reporting increase in income is yet to reach to satisfactory level. As the programme
targets women from the agricultural sector, the programme needs to take up special
interventions to increase the agricultural production to increase income by creating
surplus for marketing. A strategic Convergence especially with agriculture department,
forestry department, and animal husbandry department needs to be developed to benefit
the beneficiaries more significantly.
4. Under Food security -20% of beneficiaries are not able to meet 3 times a meal is a
matter of concern for the programme as well as for 6 % beneficiaries the situation has
grown worse. The Programme is covering the districts of Gadchiroli, Gondia, and
Amravati a larger part of these districts fall in the majorly tribal belt, where poverty is
comparatively higher. The Programme needs to expand the grain bank initiative. It also
needs to monitor this factor closely under every CMRC to improve the situation; and
focused BDS should be provided to the farmers.
5. Specific programme interventions are required to increase the herd size of the
beneficiaries, which has not increased and still at 52 %. Though 24 % are attributing the
success of their increase in production to the programme activities, the percentage has to
grow reasonably. It means the interventions have to reach effectively to masses. The
interventions are also required to reduce the average period of hunger which is 4 months
in a year.
6. The Programme needs to cater to specific attention to gender indicators i.e., motivating
women to use loan for their own health, education of child specially girl child, etc.
Presently programme focuses on motivating women to do special saving or additional
saving for such purposes. However it may not be possible in the case of ultra poor
section, in such cases they may be facilitated to use the loan more for such purposes.

15
7. Survey finding show that 33% beneficiaries could develop their non-farm enterprises. The
midterm survey of the programme conducted in the year 2010 shows that 45% women
are interested to take up nonfarm activities. It means programme has to gear up the
services to reach effectively around 12% beneficiaries.
Strategies to be incorporated to be adopted in the next AWPB based on the leanings:-
1. The Programme will organise a workshop with District officers, regional monitoring
officers, BDS managers to share these findings and to stress upon the focused activities.
2. The Programme will be undertaking a mass campaign to raise awareness amongst
women about "9 schemes for food security declared by State Government". CMRC and
BDS to facilitate between Government departments and beneficiaries so that women can
avail benefit of the existing schemes to improve the situation.
3. Programme will specifically work upon providing the Employment Cards to beneficiaries
under NAREGA at mass scale. Women will be encouraged to take up jobs as unskilled
labors.
4. The current AWPB has planned livelihood innovations such as: Formation & development
of Honey Production units in Tribal & other area, Rain water harvesting and ground water
recharge units - 1 activity per BDS potato / Onion /other valuable seed production (From
field preparation to Harvesting), Backyard Rearing of improved Nicobari Fowls/Local
breed, Protected Cultivation of Capsicum (Red & Yellow)/ Tomato or other marketable
exotic vegetables in Green-houses or in Shedding Nets, etc. These activities will enable
the programme to increase the production and income of the beneficiaries.
Similarly programme will be forming business groups depending upon the sub-sectors
identified which will also lead to increase in production and productivity.
5. The programme has a log frame indicator of developing market tie ups exclusively for
SHG products and in the current year BDS centers are supposed to move strategically to
achieve this. A focused attention on quality control, branding and packaging are proposed
to enhance the tie ups with malls, cooperatives, etc. The Programme will initiate plans to
develop strategic convergence with NABARD to support the shops or rural haats in these
areas to improve access to markets.
6. The Programme will incorporate the special topics on utilization of loan for productive
purposes during the training sessions.
**********************************