magnitude and extent of sediment toxicity in the hudson ... · magnitude and extent of sediment...
TRANSCRIPT

NOAA Technical Memorandum NOS ORCA 88_________________________________________________________________National Status and Trends Programfor Marine Environmental Quality
Magnitude and Extent of Sediment Toxicity inthe Hudson-Raritan Estuary
Silver Spring, MarylandAugust, 1995
noaa National Oceanic and Atmospheric Administration
_____________________________________________________________________National Ocean ServiceOffice of Ocean Resources Conservation and AssessmentCoastal Monitoring and Bioeffects Assessment Division
NOAA Coastal Ocean Office
1
2
3
4
56
7A7B
7C
8A
8B9
10
11
17
16
15
1413
12
18
19
2829
30
20
21 22
23 2425
2627
3132
37
33
343538
3639B
40B
4142C
57
5655
49 5450
5152
48
47
46
44
Staten Island
UpperNew YorkHarbor
Pas
saic
Riv
er
Percent Amphipod Survival
Significantly Toxic (p < .05)
Highly Toxic (< 80 % Survival)
Non-toxic (p>.05)
0.0 % Survival
NewarkBay
ArthurKill
Hac
kens
ack
Riv
er
∆
∆
∆
1
2
3
4
5
6
789
10
11
12
13
14
15
16
17
18
19
20
21
22
23
2425
26
27
28
29
30
3132
33
34
35
36
37
38
39
Stations significantly differentfrom controls
Non-toxic stations
Stations significantly differentfrom controls and <80% ofcontrol response
0
1
2
3
4
5
Hg, ug/g
Staten Island
UpperNew YorkHarbor
New
ark Bay
Passaic
Riv
er
Hacke
nsac
k Riv
er
57
56
36
3126
2120
17
14
121
3
5 7a7b
7c8a8b
10
11

Coastal Monitoring and Bioeffects Assessment DivisionOffice of Ocean Resources Conservation and AssessmentNational Ocean ServiceNational Oceanic and Atmospheric AdministrationU.S. Department of CommerceN/ORCA2, SSMC41305 East-West HighwaySilver Spring, MD 20910
Notice
This report has been reviewed by the National Ocean Service of the National Oceanic andAtmospheric Administration (NOAA) and approved for publication. Such approval does notsignify that the contents of this report necessarily represents the official position of NOAA orof the Government of the United States, nor does mention of trade names or commericalproducts constitute endorsement or recommendation for their use.

NOAA Technical Memorandum NOS ORCA 88
Magnitude and Extent of Sediment Toxicity inthe Hudson-Raritan Estuary
Edward R. LongNational Ocean Service, Office of Ocean Resources Conservationand Assessment, Seattle, WA
Douglas A. WolfeNational Ocean Service, Office of Ocean Resources Conservationand Assessment, Silver Spring, MD
K. John Scott and Glen B. ThursbyScience Applications International CorporationNarragansett, RI
Eric A. SternU.S. Environmental Protection AgencyNew York, New York
Carol PevenBattelle Ocean SciencesDuxbury, MA
Ted SchwartzNational Biological SurveyWashington, D.C.
Silver Spring, MarylandAugust, 1995

Table of Contents
List of Tables .................................................................................................................................................. i
List of Figures............................................................................................................................................... iii
Abstract ........................................................................................................................................................ 1
I. Introduction ............................................................................................................................................. 2Contaminant Concentrations .............................................................................................................. 4Potential for Toxicant Effects .............................................................................................................. 5Previously Measured Biological Effects ............................................................................................. 8
II. Methods and Materials .......................................................................................................................... 15Sampling Methods ............................................................................................................................ 19Sediment Testing Methods ............................................................................................................... 20Estimates of the Spatial Extent of Toxicity ........................................................................................ 22Chemical Analyses: Phase 1 ............................................................................................................ 23Chemical Analyses: Phase 2 ............................................................................................................ 25Data Analyses .................................................................................................................................. 27
III. Results .................................................................................................................................................. 28Solid-Phase Amphipod Tests ............................................................................................................ 28Elutriate/Liquid Phase Bivalve Larvae Tests .................................................................................... 38Microbial Bioluminescence Tests of Organic-Extracts ...................................................................... 50Polychaete and Sand Dollar Growth Tests ....................................................................................... 57Estimates of Spatial Extent of Toxicity .............................................................................................. 58Concentrations and Distribution of Contaminants in Sediments: Phase 1 ....................................... 60Concentrations and distribution of Contaminants in Sediments: Phase 2 ........................................ 62Relationships Between Toxicity and Physical-Chemical Parameters: Phase 1 ................................ 76Relationships Between Toxicity and Physical-Chemical Parameters: Phase 2 ................................ 96
IV. Discussion ............................................................................................................................................ 111Incidence and Severity of Toxicity ................................................................................................... 111Spatial Extent of Toxicity ................................................................................................................. 117Spatial Patterns in Toxicity .............................................................................................................. 117Correlations Among Toxicity Tests .................................................................................................. 121Summary of Chemistry/Toxicity Relationships ............................................................................... 122
V. Conclusions ........................................................................................................................................ 126Potential for Toxicity ....................................................................................................................... 126Incidence of Toxicity ....................................................................................................................... 126Spatial Patterns in Toxicity ............................................................................................................. 127Spatial Extent of Toxicity ................................................................................................................ 127Chemistry/Toxicity Relationships .................................................................................................... 127
Acknowledgments .................................................................................................................................... 128
References ............................................................................................................................................... 129
Appendices .............................................................................................................................................. 134

List of Tables
1. Regions of the Hudson-Raritan Estuary in which the concentrations of selectedtoxicants in sediments exceeded respective effects ranges of Long and Morgan(1990). Adapted from Squibb et al. (1991) ........................................................................................... 6
2. Spearman-rank correlations (Rho) between percent survival of A. abdita (n=9) and theconcentrations of trace metals normalized to dry wt., aluminum and total organic carbon(TOC). From U.S. EPA EMAP monitoring data, 1990 (Schimmel et al., 1994) .................................. 11
3. Mean percent mortality of Eohaustorius estuaries in sediments from Arthur Kill,Kill van Kull, and Newark Bay (from Aqua Survey, Inc., 1990a, 1990b) ............................................. 12
4. Locations of sites in the Hudson-Raritan Estuary sampled during Phase 1 ....................................... 15
5. Locations of stations in Newark Bay and vicinity sampled during Phase 2 ........................................ 18
6. Mean percent survival of A. abdita in 10-day solid-phase toxicity tests of sediments fromthe Central Long Island Sound (CLIS) control site (n = 5), 117 sampling stations (n = 5)and 39 sites (n = 3) and of Diporeia spp. in 9 samples from the Hudson-Raritan Estuary ................. 31
7. Mean percent amphipod (A. abdita) survival in the 1993 Newark Bay survey performedduring Phase 2 ................................................................................................................................... 36
8. Mean percent survival and normal morphological development (expressed as percent ofcontrols) in 48-hour tests of elutriates with the larvae of Mulinia lateralis .......................................... 41
9. Results of Microtox™ tests of microbial bioluminescence in organic extracts ofsediments; mean EC50's (n = 2) and 95% confidence intervals for stations, and meanEC50's (n = 3) for sites ....................................................................................................................... 50
10. Results of microbial bioluminescence (Microtox™) tests of sediments from theHudson-Raritan estuary performed with three kinds of sediment extracts (fromDeMuth et al., 1993) ........................................................................................................................... 57
11. Results of polychaete (Armandia brevis) impaired growth tests, and sand dollar(Dendraster excentricus) impaired growth tests of sediment from the Hudson-Raritanestuary (from Rice et al., in press) ...................................................................................................... 58
12. Estimates of the spatial extent of toxicity* (km2 and percent of total area) in theHudson-Raritan Estuary based upon the cumulative distribution functions ofdata from each of four test end-points ................................................................................................ 59
13. Estimates of concordance in the spatial extent of toxicity* (km2 and percent of total area)in the Hudson-Raritan estuary among the four toxicity test end-points .............................................. 59
14. Estimates of the spatial extent of toxicity* (km2 and percent of total area) in Newark Bayand vicinity, based upon the cumulative distribution function of data from amphipodsurvival tests ....................................................................................................................................... 60
15. Concentrations of TCDD-equivalents (pg/g) in whole extracts and extract fractionsdetermined in H4IIE rat hepatoma bioassays of sediments from Newark Bay ................................... 75
16. Spearman-rank (rho, corrected for ties) correlations between dioxin equivalentsdetermined in chemical analyses and dioxin equivalents (tcdd-eqs) determined inrat hepatoma bioassays of sediment extracts .................................................................................... 76
i

ii
17. Spearman-rank correlations (Rho, corrected for ties) between four toxicityend-points (as percent of controls) and the concentrations of trace elements inHudson-Raritan estuary sediments (n=38) ......................................................................................... 80
18. Spearman-rank correlations (Rho, corrected for ties) between four toxicity end-points(as percent of controls) and the concentrations of acid-volatile sulfides (AVS) andsimultaneously extracted trace metals (SEM) in Hudson-Raritan Estuary sediments (n=38) ............ 80
19. Spearman-rank correlations (Rho, corrected for ties) between four toxicity end-points(as percent of controls) and the concentrations of PCBs and pesticides in hudson-RaritanEstuary sediments (n=38)................................................................................................................... 81
20. Spearman-rank correlations (Rho, corrected for ties) between four toxicity end-points(as percent of controls) and the concentrations of PAHs in Hudson-Raritan Estuarysediments (n=38) ................................................................................................................................ 82
21. Samples from the Hudson-Raritan estuary (Phase 1) stations that equalled or exceededthe respective ERM or SQC guideline concentrations for teach major substance or classof compounds. Stations in which the concentration exceeded the guideline by >2x arelisted in bold (n=38)..... ....................................................................................................................... 83
22. Average trace metal concentrations (ppm, dry wt. or µmole/g ± s.d.) in samples thatwere not toxic, significantly toxic (p<0.05), and highly toxic (percent survival <80%of controls) in amphipod tests, ratios between the averages, and ratios of highly toxicaverages to SQGs .............................................................................................................................. 89
23. Average pesticide and PCB concentrations in samples that were not toxic, significantlytoxic, and highly toxic in the amphipod tests, ratios between the averages, and ratios ofhighly toxic averages to SQGs ........................................................................................................... 90
24. Average PAH concentrations in samples that were not toxic, significantly toxic, andhighly toxic in the amphipod tests, ratios between the averages, and ratios between highly toxic averages and respective SQGs.......................................................................................... 92
25. Average trace metal concentrations in samples that were not toxic, significantly toxic,and highly toxic in microtox tests, ratios between the averages, and ratios of highly toxicaverages to SQGs .............................................................................................................................. 93
26. Average pesticide and PCB concentrations in samples that were not toxic, significantlytoxic, and highly toxic in the Microtox tests, ratios between the averages, and ratios ofhighly toxic averages to SQGs ........................................................................................................... 94
27. Average PAH concentrations in samples that were not toxic, significantly toxic, and highlytoxic in the Microtox tests, ratios between the averages, and ratios between highly toxicaverages and respective SQGs .......................................................................................................... 95
28. Spearman-rank correlations between percent amphipod survival and the concentrationsof total trace metals and with the ratios of simultaneously extracted metals toacid-volatile sulfides in Phase 2 sediments ........................................................................................ 96
29. Spearman-rank correlations between percent amphipod survival and the concentrationsof chlorinated organic compounds in Newark Bay ............................................................................. 97
30. Spearman-rank correlations between percent amphipod survival and the concentrationsof chlorinated dibenzo dioxin and dibenzo furan compounds in Newark Bay sediments ................... 98
31. Spearman-rank correlations between percent amphipod survival and the concentrationsof polynuclear aromatic hydrocarbons in Newark Bay sediments ...................................................... 99

32. Samples from the Phase 2 stations that equalled or exceeded the respective ERM orSQC values for each major substance or class of compounds ........................................................ 100
33. Average concentrations of 2,3,7,8-tcdd and total cumulative dioxin TEQs in highly toxicand nontoxic samples from Newark Bay, ratios between the averages, and ratiosbetween the highly toxic averages and the respective SQG ............................................................ 108
34. Average concentrations of pesticides and PCBs in highly toxic and nontoxic samplesfrom Newark Bay, ratios between the averages, and ratios between the highly toxicaverages and the respective SQGs.................................................................................................. 108
35. Average concentrations of total extractable and AVS simultaneously extracted tracemetals in highly toxic and nontoxic samples from Phase 2, ratios between the averages,and ratios between the highly toxic averages and the respective SQGs ......................................... 110
36. Average concentrations of PAHs in highly toxic and nontoxic samples from Phase 2, ratiosbetween the averages, and ratios between the highly toxic averages and the respective SQGs .... 111
37. Summary of toxicity test results for each station and site sampled during Phase 1 ......................... 112
38. Summary of the numbers of Phase 1 stations and sites indicated as significantly toxicand numerically significant in each of four sediment toxicity test endpoints ..................................... 116
39. Spearman rank correlation coefficients for the four toxicity test end-points tested in Phase 1 as percent of controls .................................................................................................... 121
40. Summary of toxicity/chemistry relationships for those chemicals that were significantlycorrelated with toxicity in the Phase 1 samples ................................................................................ 123
41. Summary of toxicity/chemistry relationships for those chemicals that were significantlycorrelated with toxicity in the Phase 2 samples ................................................................................ 125

List of Figures
iii
1. The Hudson-Raritan Estuary study area .................................................................................................. 3
2. Sampling sites in which sediments were significantly toxic to: (1) nematode growth;(2) amphipod survival in static tests; (3) A. abdita in flow-through tests; and (4) A. abdita instatic tests ............................................................................................................................................... 10
3. Sampling stations in which survival was significantly different from referer materials intests of either grass shrimp, polychaetes, or clams during pre-dredging studies ................................... 14
4. Boundaries of sampling zones and locations of sampling sites within each zone .................................. 17
5. Stations sampled in the Passaic River, HackensackRiver, Newark Bay, upper Arthur Kill,Kill van Kull, and upper New York Harbor during Phase 2 ..................................................................... 24
6. Sampling stations in which the sediments were significantly toxic to Ampelisca abdita survival ............ 29
7. Sampling sites in which the sediments were significantly toxic to Ampelisca abdita survival ................. 30
8. Distribution of stations in Newark Bay and vicinity that were toxic, highly toxic, andnon-toxic in amphipod (A. abdita) survival tests ..................................................................................... 39
9. Sampling stations in which the sediment elutriates were significantly toxic toMulinia laterlis larvae survival ................................................................................................................. 46
10. Sampling sites in which the sediment elutriates were significantly toxic toMulinia lateralis larvae survival ............................................................................................................... 47
11. Sampling stations in which the sediment elutriates were significantly toxic toMulinia lateralis larvae normal development .......................................................................................... 48
12. Sampling sites in which the sediment elutriates were significantly toxic toMulinia lateralis larvae normal development .......................................................................................... 49
13. Sampling stations in which the sediment extracts were significantly toxic tomicrobial bioluminescence ..................................................................................................................... 55
14. Sampling sites in which the sediment extracts were significantly toxic to microbialbioluminescence ..................................................................................................................................... 56
15. Percent fine-grained sediments at selected stations in the Hudson-Raritan Estuary ............................. 61
16. Percent total organic carbon in selected stations in the Hudson-Raritan Estuary .................................. 63
17. Mercury concentrations in selected stations in the Hudson-Raritan Estuary ......................................... 64
18. Ratios of total simultaneously-extracted metals concentrations to acid-volatilesulfide concentrations in selected stations in the Hudson-Raritan Estuary ............................................ 65
19. Total PCB concentrations in selected stations in the Hudson-Raritan Estuary ...................................... 66
20. Concentrations of total PAHs at selected stations in the Hudson-Raritan Estuary ................................. 67
21. Concentrations of cadmium at selected stations in Newark Bay and vicinity ......................................... 69

iv
22. Concentrations of mercury at selected stations in Newark Bay and vicinity ........................................... 70
23. Ratios of total simultaneously-extracted metals to total acid-volatile sulfides atselected stations in Newark Bay and vicinity .......................................................................................... 71
24. Concentrations of total PCBs at selected stations in Newark Bay and vicinity ....................................... 72
25. Concentrations of total 2,3,7,8-tcdd toxicity equivalency quotients at selected stationsin Newark Bay and vicinity ...................................................................................................................... 73
26. Concentrations of 2,3,7,8-tcdd at 53 selected stations in Newark Bay and vicinity ................................ 77
27. TCDD equivalents from H4IIE bioassays of whole sediment extracts from selectedstations in Newark Bay and vicinity ........................................................................................................ 78
28. Relationship of total cumulative tcdd toxicity equivalents from chemical analyses andTCDD toxicity equivalent from H4IIE bioassays of the F12 fraction ....................................................... 79
29. Relationship of the concentrations of total PAHs to the concentrations of the TCDDtoxicity equivalents in the H4IIE bioassays of the F5 fraction ................................................................. 79
30. Relationship of amphipod survival to mercury concentrations in sediments .......................................... 85
31. Relationship of microbial bioluminescence EC50s to 4,4-DDE concentrations in sediments ................ 85
32. Relationship of amphipod survival to total low molecular weight PAH concentrationsin sediments ........................................................................................................................................... 86
33. Relationship of amphipod survival and total PAH concentrations in sediments ..................................... 86
34. Relationship of amphipod survival to flouranthene concentrations in sediments ................................... 87
35. Relationship of amphipod survival to phenanthrene concentrations in sediments ................................. 87
36. Relationship of amphipod survival to the concentrations of un-ionized ammonia in theoverlying water of the test chambers ...................................................................................................... 98
37. Relationship of amphipod survival to the concentrations of p, p'-DDE in Newark Baysediment samples ................................................................................................................................. 102
38. Relationship of amphipod survival to the concentrations of total PCB congenersin Newark Bay sediment samples ........................................................................................................ 102
39. Relationship between amphipod survival and the concentrations of 2,3,7,8-TCDDtoxicity equivalency quotients for the co-planar PCB congeners in Newark Bay sediments ................ 103
40. Relationship of amphipod survival to the concentrations of 2,3,7,8-TCDD in NewarkBay sediment samples ......................................................................................................................... 103
41. Relationship between amphipod survival and the concentration of total cumulative2,3,7,8-TCDD toxicity equivalency quotients in Newark Bay sediments .............................................. 104
42. Relationship of amphipod survival to the concentrations of total lead inNewark Bay sediment samples ............................................................................................................ 104
43. Relationship of amphipod survival to the concentrations of total zinc inNewark Bay sediment samples ............................................................................................................ 105

44. Relationship of amphipod survival to the concentrations of total high molecularweight PAHs in Newark Bay sediment samples ................................................................................... 105
45. Relationship of amphipod survival to the concentrations of fluoranthene inNewark Bay sediment samples ............................................................................................................ 106
46. Sampling stations in which the toxicity test results were significantly different fromcontrols in at least one of the four toxicity tests or not toxic in any test ................................................ 118
47. Sampling sites in which the mean toxicity test results were significantly differentfrom controls in at least one of the four tests or not toxic in any test .................................................... 119

1
Magnitude and Extent of Sediment Toxicity inthe Hudson-Raritan Estuary
Edward R. Long (NOAA), Douglas A. Wolfe (NOAA), K. John Scott (SAIC), Glen B. Thursby(SAIC), Eric A. Stern (U.S. EPA), Carol Peven (Battelle), and Ted Schwartz (NBS)
ABSTRACT
A survey of the toxicity of sediments was performed by NOAA’s National Status and Trends (NS&T)Program throughout the Hudson-Raritan Estuary. The objectives of the survey were to determine thespatial patterns of toxicity, the spatial scales (magnitude) of toxicity, the severity (frequency) of toxic-ity, and the relationships among measures of toxicity and chemical substances in the sediments. Thissurvey was conducted as a part of a nationwide program supported by NOAA’s Coastal Ocean Programand the NS&T Program, in which the biological effects of toxicants are determined in selected estuar-ies and bays.
The survey was conducted in two phases: 117 samples were collected throughout the entire estuaryduring 1991 (Phase 1) and an additional 57 samples were collected in Newark Bay and vicinity during1993 (Phase 2). Relatively sensitive toxicity tests were performed under controlled laboratory condi-tions with portions of each sample. During Phase 1, three independent tests were performed: (1) a 10-day, acute survival test of solid-phase sediments with the amphipod Ampelisca abdita; (2) a 48-hourliquid phase test of elutriates with the embryos of the bivalve Mulinia lateralis in which both percentsurvival and normal embryological development were recorded; and (3) a 15-minute microbial biolu-minescence test (Microtoxtm) of organic solvent extracts. Only the amphipod tests were performed onthe samples collected during Phase 2. Chemical analyses of selected samples were performed and theconcentrations of trace elements, polynuclear aromatic hydrocarbons (PAHs), chlorinated pesticidesand other hydrocarbons were reported. Also, during Phase 2 the concentrations of numerous chlori-nated dioxins and furans were determined.
Toxicity test results were compared with responses in controls to determine statistical significance.During Phase 1, 46.2% of the samples were significantly toxic (i. e., different from controls) in theamphipod tests, 26.6% were significantly toxic in either of the bivalve embryo tests, and 40.5% weresignificantly toxic in the microbial bioluminescence tests. Overall, 69.2% of the samples were toxic inat least one of the four test end-points.
Each toxicity test indicated somewhat different patterns in toxicity, possibly reflecting their differentsensitivities to the substances in the samples. Overall, toxicity was most severe in the East River anddiminished eastward into Long Island Sound and southward into upper New York Harbor. Also, toxic-ity was relatively high in Newark Bay, Arthur Kill, and western Raritan Bay and diminished southwardand eastward toward the mouth of the estuary. Toxicity was relatively low in the lower Hudson River,upper New York Harbor, and portions of lower New York Harbor and northern Raritan Bay, especiallyin samples that were relatively high in sand content.
During Phase 2, 48 of 57 samples (84.2%) from Newark Bay and vicinity were significantly toxic inthe amphipod survival tests. Amphipod survival was very low in most samples from the lower PassaicRiver, much of Newark Bay, and most samples from the northern reaches of Arthur Kill. A few samples
2
from the lower Hackensack River and one sample from upper New York Harbor were not significantlytoxic in this test.
During Phase 1 the entire survey area covered approximately 350 km2. By attributing the toxicity datato the spatial scales of each sampling stratum, the spatial extent of toxicity (kilometers2) was estimatedfor each test. The amphipod survival test indicated that approximately 133 km2 (38.1% of the totalarea) was toxic. The amphipod survival and microbial bioluminescence tests, together, indicated thatapproximately 34.2 km2 (9.8% of the total area) was toxic. All four test end-points, together, indicatedapproximately 19.9 km2 (5.7% of the total area) was toxic. During Phase 2, approximately 10.8 km2
(85.0% of the total survey area of 12.7 km2 in Newark Bay and vicinity) was toxic relative to thecontrols.
The causes of the toxicity were not determined. However, in the Phase 1 samples, amphipod survivaland microbial bioluminescence diminished and were significantly correlated with increasing concen-trations of numerous PAHs. Also, the average concentrations of the PAHs in the toxic samples greatlyexceeded the average concentrations in the nontoxic samples and applicable toxicity thresholds. Thesestrong relationships between the two measures of toxicity and the concentrations of the PAHs weredriven, in large part, by the samples from the upper East River that were highly toxic and highlycontaminated with the PAHs. To a lesser degree the concentrations of some trace elements and chlori-nated pesticides were correlated with the inhibition of microbial bioluminescence. The results of thebivalve embryo tests were rarely correlated with the concentrations of any of the potentially toxicsubstances that were measured.
In contrast to the results from Phase 1, amphipod survival in the Phase 2 samples diminished with andwas highly correlated with increasing concentrations of chlorinated hydrocarbons, especially the PCBs,pesticides, and dioxins. The concentrations of the sum of PCB congeners were very high in many ofthe samples in which amphipod survival was low or zero. Also, amphipod survival decreased withincreasing concentrations of lead, mercury, and zinc in the samples. In contrast to the observations inPhase 1, amphipod survival was not correlated with the concentrations of the PAHs in Phase 2.
INTRODUCTION
The Hudson-Raritan Estuary is a very large, highly urbanized estuarine system. It is bounded to theeast by the New York Bight and Long Island Sound, and bounded to the west, south and north by highlyurbanized and industrialized areas of New York and New Jersey. It is a mixing zone for four majorrivers and many wastewater treatment, point-source discharges. As defined in this report, it includesthe waters of the extreme western Long Island Sound, the East River, the lower Hudson River, upperand lower New York Harbors, Kill van Kull, Arthur Kill, the lower Passaic River, the lower HackensackRiver, Newark Bay, the lower Raritan River, Raritan Bay, Sandy Hook Bay and the waters of the outerharbor east to the Rockaway-Sandy Hook transect (Figure 1).
This estuary has been highly impacted by many human-induced factors (NOAA, 1988a). Many of thehistorical wetlands have been filled, many water bodies have been channelized for navigation, andhuge industrial and residential complexes have been built along the shores. Contaminants have beendischarged from wastewater treatment plants, combined sewer overflows, urban runoff, stormwater,petrochemical factories, illegal dumping, atmospheric deposition, and accidental spills.

3
Long Island SoundHudso
n Riv
er
Man
hatta
n
low
er E
ast R
iver
Brooklyn
Hackensack R.
Pass
aic
R.
New
ark
Bay
upperN.Y.Harbor
Staten Island
Art
hur K
ill
Kill van Kull
lowerN.Y.Harbor
Jamaica Bay
New York Bight
Raritan Bay
Raritan River
SandyHookBay
Figure 1. The Hudson-Raritan Estuary study area.
Rockaway
upper East River
Throg's Neck
GowanusCanal
Sandy Hook
Mueller et al. (1982) estimated that wastewater treatment discharges contributed 40-60 percent of thetotal input of several trace metals into the estuary. They estimated that 20-40 percent were contributedby the tributary rivers, and 10-30 percent by urban runoff. The data available for estimating sources oftoxic organic compounds were less complete than those for metals. Based on the data available, waste-water and the tributaries each contributed about 40 percent of the total PCB load, a substantial portionbeing transported by the Hudson River.

4
In 1988 it was estimated that 6.8 million gallons per day of untreated sewage was discharged into theestuary, primarily from Manhattan, Staten Island, and Brooklyn (Gottholm et al., 1993). With theimplementation of better source controls at key sewage treatment plants, the rate of discharge from thecity of New York decreased to less than 1.0 million gallons per day by 1992.
Over 1,453 accidental incidents, resulting in the release of more than 18 million U.S. gallons of hazard-ous materials and petroleum products, occurred throughout Newark Bay between 1982 and 1991 (Gunsteret al., 1993). The majority of these spills consisted of petroleum products, including fuel oils andgasoline. Many of them occurred in the lower Passaic River, Arthur Kill, Newark Bay, and Kill vanKull.
Data collected by numerous investigators, including the National Status and Trends Program, haveindicated that the concentrations of many potentially toxic chemicals are highly elevated in the Hudson-Raritan Estuary. The objectives of this report are to describe the magnitude (severity, multiplicity,incidence) of toxicity, the spatial patterns of toxicity, the spatial extent of toxicity of sediments, and therelationship(s) between sediment toxicity as a measure of toxicant-associated biological effects andpotentially toxic substances.
Contaminant Concentrations. Many different assessments have been conducted to determine thepresence, concentration, and distribution of toxic chemicals within the estuary. These assessmentshave been performed by many independent investigators and have shown that toxicants occur through-out the estuary in mixtures that differ from place to place. The toxicants that occur above backgroundlevels include PCBs, PAHs, DDT, other pesticides, many trace metals, radioisotopes, dioxins and furans.It is not the purpose of this report to review the results of all of these efforts. Several excellent reportssummarize the data on concentrations and distributions of toxicants in the Hudson-Raritan Estuary(e.g., Olsen et al., 1984; Breteler, 1984; NOAA, 1988a; Bopp and Simpson, 1989; Squibb et al., 1991;City of New York, 1987; Huntley et al., 1993; Bonnevie et al., 1993; New York-New Jersey HarborEstuary Program, 1995).
Based upon the available data from these many studies, several generalized patterns are apparent in thedistribution of elevated concentrations of toxicants. These generalities are tempered by many observa-tions of heterogeneity attributable to patchiness in sediment properties, sedimentation rates, scouring,dredging, and proximity to sources and other processes that influence the fate of toxicants. Neverthe-less, areas in which relatively high concentrations of different toxicants have been observed frequentlyinclude Newark Bay, Arthur Kill, lower Passaic River, lower Hackensack River, Gowanus Canal, west-ern Raritan Bay south of Staten Island, and the bays adjoining the upper East River/western LongIsland Sound. Intermediate levels of many toxicants often have been reported for parts of centralRaritan Bay, upper New York Harbor, lower Harlem River near Ward’s Island, and the lower PassaicRiver. Relative to these areas, toxicant concentrations often have been lowest in lower New YorkHarbor south of Coney Island and northwest of Sandy Hook, the East River, Harlem River, lowerHudson River, and eastern Raritan Bay.
Extremely high concentrations of dioxins and furans in sediments and marine biota have been reportedfor the lower Passaic River (Pruell et al., 1990; Bopp et al., 1991; Tong et al., 1990; Belton et al., 1985).The concentrations of these compounds gradually diminish downstream into Newark Bay and NewYork Harbor. In addition, the concentrations of PAHs and many trace elements were found in very highconcentrations in samples collected in the lower Passaic River, lower Hackensack River, and NewarkBay (Huntley et al., 1993; Bonnevie et al., 1993).

5
Sediments, mussels, and fish livers from the Hudson-Raritan Estuary analyzed by NOAA as a part ofthe NS&T Program consistently have contained relatively high concentrations of DDT, other pesti-cides, PCBs, PAHs, cadmium, chromium, lead, mercury, nickel, tin, and other substances. The concen-trations of these and other chemicals often were the highest or among the highest measured at about250 sites nationwide (NOAA, 1987; 1988b; 1989; 1991; Long and Morgan, 1990). Samples withparticularly high concentrations of toxicants were collected near the Throg’s Neck Bridge in westernLong Island Sound, in the upper New York Harbor near Ellis Island, and in central Raritan Bay. Foreach of the analytes quantified, NOAA ranked the sediment sites sampled nationwide according to thehighest concentrations (NOAA, 1988b: O’Connor and Ehler, 1991; Robertson et al., 1991). Collec-tively, the sediment and mussel samples from the Hudson/Raritan Estuary ranked the highest overall incontaminant concentrations among the many estuaries sampled by the NS&T Program. The averageconcentrations of several trace metals appeared to increase in mussel tissues during the period from1986 through 1988 at several sites in the estuary, whereas the concentrations of several organic com-pounds decreased during the same period (NOAA, 1989). Sediment samples collected at several sitesin 1986 and 1987 had relatively high concentrations of 13 toxicants, compared to concentrations na-tionwide (NOAA, 1991).
Potential for Toxicant Effects. Some of the sites sampled by the NS&T Program were determined tohave toxicant concentrations in sediments that equalled or exceeded known toxicity thresholds (O’Connorand Ehler, 1991). Some of the samples with high chemical concentrations were collected within theHudson-Raritan Estuary (Gottholm et al., 1993). The concentrations of PAHs, PCBs, mercury, silver,arsenic, and zinc mostly frequently equalled or exceeded the thresholds nationwide.
Long and Morgan (1990) ranked the NS&T Program sites according to their potential to cause toxicityin sediments attributable to elevated concentrations of analytes quantified by the Program. Based uponavailable data from laboratory-spiked bioassay studies, equilibrium-partitioning models, and matchingchemical and biological data from field surveys, they determined the ranges in chemical concentra-tions that were associated with adverse effects. The Effects Range-Low (ERL) value was identified asthe 10th percentile of the database associated with adverse biological effects. The Effects Range-Median (ERM) was identified as the 50th percentile (median) of these data. Long and Morgan (1990)then compared the ambient data from the NS&T Program sites with the ERL and ERM values. Thosesites that equalled or exceeded the effects ranges for the most analytes nationwide were ranked highest.
Among the 200+ sites that they evaluated, Long and Morgan (1990) ranked site HRUB in New YorkUpper Harbor as number 1, the highest. Site LITN near Throg’s Neck was ranked number 3, siteNYSH in Sandy Hook Bay was ranked number 5, and site HRLB in lower New York Harbor wasranked number 7. All six of the sediment sampling sites located within the estuary were ranked amongthe top sites nationwide in potential for toxicity. The concentrations of as many as 20 analytes inHudson-Raritan Estuary sites equalled or exceeded the respective effects ranges. The concentrationsof many PAHs were expecially highly elevated compared to the effects ranges.
Breteler (1984) estimated that numerous trace metals, petroleum hydrocarbons, pesticides, and haloge-nated hydrocarbons posed ecological and/or human health risks in the Hudson-Raritan Estuary. Squibbet al. (1991) compiled and evaluated existing contaminant data from analyses of water, tissues, andsediments from the Hudson-Raritan Estuary performed during the 1980s. They compared the ambientdata with several different water quality standards for the protection of marine life, wildlife, and humanhealth. Many trace metals, pesticides, industrial solvents, PCBs, and aromatic hydrocarbons equalledor exceeded these standards in water samples collected in the estuary. Similarly, they compared the
6
ambient concentrations of toxicants in finfish and shellfish tissues with existing standards. The con-centrations of PCBs, tcdd (dioxin), mercury, chlordane, and dieldrin in samples from the estuary oftenexceeded the standards and were noted as chemicals of high concern. Other contaminants listed aschemicals of moderate concern included arsenic, tDDT, heptachlor, heptachlor epoxide,hexachlorobenzene, lindane, numerous aromatic hydrocarbons, and tcdf (furans).
In the absence of any applicable sediment quality standards, Squibb et al. (1991) compared ambientconcentrations of contaminants in sediments with the ERL and ERM values identified by Long andMorgan (1990). In their investigation, Squibb et al. (1991) evaluated data from many different studies,merged the data for selected regions within the estuary, and compared the average, maximum, andminimum concentrations within each region with the effects ranges of Long and Morgan (1990). Wherethe abundance of data warranted, they treated four subregions of Raritan Bay separately: (I) WesternRaritan Bay at the confluence of the Raritan River and Arthur Kill; (II) central Raritan Bay stretchingfrom Staten Island to Sandy Hook Bay; (III) northern Raritan Bay bordering the lower New YorkHarbor; and (IV) southern Raritan Bay along the New Jersey shore.
Squibb et al. (1991) determined that the concentrations of eight trace metals, PCBs, tDDT, chlordane,dieldrin, tPAHs, and six aromatic hydrocarbons exceeded the ERM concentrations in samples from atleast one area within the estuary. In addition, the concentrations of six other aromatic hydrocarbonsexceeded the ERLs, but not the ERMs. Squibb et al. (1991) concluded that there was a substantialpotential for toxicant-associated biological effects in the sediments of the estuary.
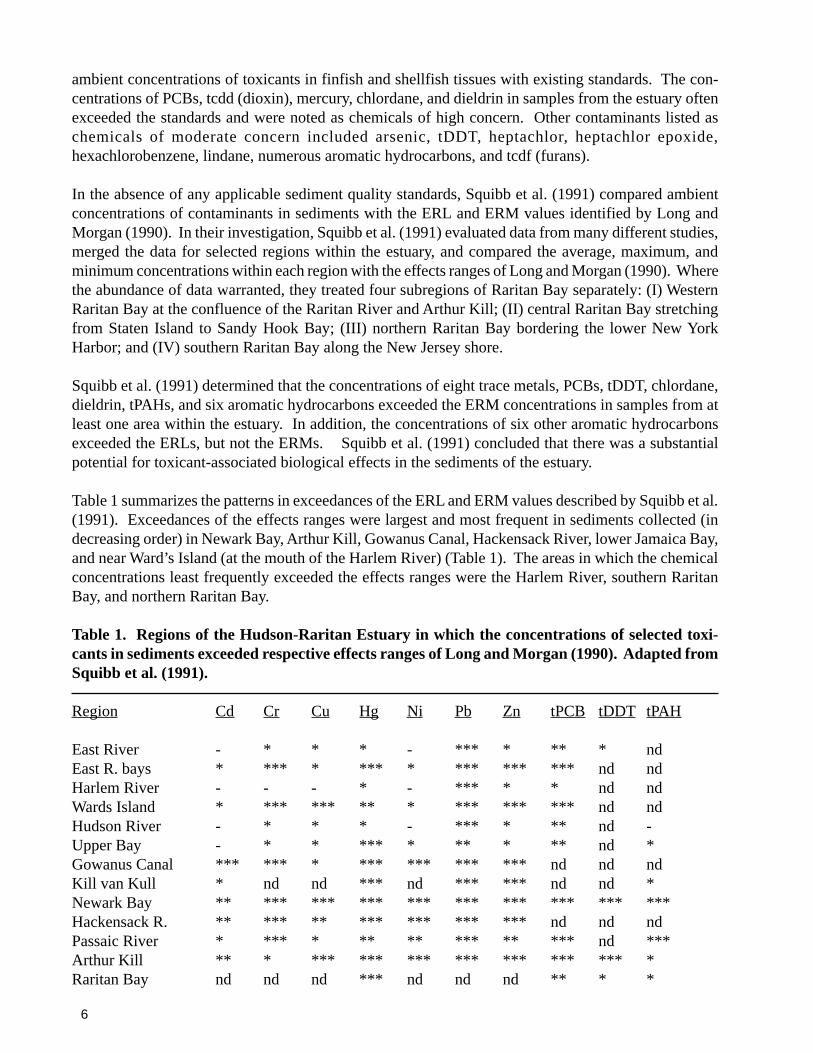
Table 1 summarizes the patterns in exceedances of the ERL and ERM values described by Squibb et al.(1991). Exceedances of the effects ranges were largest and most frequent in sediments collected (indecreasing order) in Newark Bay, Arthur Kill, Gowanus Canal, Hackensack River, lower Jamaica Bay,and near Ward’s Island (at the mouth of the Harlem River) (Table 1). The areas in which the chemicalconcentrations least frequently exceeded the effects ranges were the Harlem River, southern RaritanBay, and northern Raritan Bay.
Table 1. Regions of the Hudson-Raritan Estuary in which the concentrations of selected toxi-cants in sediments exceeded respective effects ranges of Long and Morgan (1990). Adapted fromSquibb et al. (1991).
Region Cd Cr Cu Hg Ni Pb Zn tPCB tDDT tPAH
East River - * * * - *** * ** * ndEast R. bays * *** * *** * *** *** *** nd ndHarlem River - - - * - *** * * nd ndWards Island * *** *** ** * *** *** *** nd ndHudson River - * * * - *** * ** nd -Upper Bay - * * *** * ** * ** nd *Gowanus Canal *** *** * *** *** *** *** nd nd ndKill van Kull * nd nd *** nd *** *** nd nd *Newark Bay ** *** *** *** *** *** *** *** *** ***Hackensack R. ** *** ** *** *** *** *** nd nd ndPassaic River * *** * ** ** *** ** *** nd ***Arthur Kill ** * *** *** *** *** *** *** *** *Raritan Bay nd nd nd *** nd nd nd ** * *

7
Table 1 continued.
Region Cd Cr Cu Hg Ni Pb Zn tPCB tDDT tPAH
W. Raritan Bay(I) ** *** *** nd * *** *** nd nd ndC. Raritan Bay(II) * ** ** nd * *** *** nd nd ndN. Raritan Bay(III) * ** * nd * ** ** nd nd ndS. Raritan Bay(IV) - ** * nd * ** ** nd nd ndLower Bay ** * * ** nd * nd ** * *Jamaica Bay(I) - ** * ** * *** ** ** * ndJamaica Bay(II) - ** * ** - ** * ** * *
*** Average concentration > ERM value;
** Only maximum concentration > ERM value;
* ERL value < maximum concentration < ERM value;
- maximum concentration <ERL value;nd - no data.
Based upon the multiplicity and degree of exceedances of the effects range values in Table 1, it appearsthat sediments in some regions of the estuary have a very high potential for causing toxicity. Also,based upon the number and degree of exceedances of the effects values, it appears that the potential fortoxicity differs among the regions. The regions evaluated by Squibb et al. (1991) are hypothesized tohave the following relative potentials for toxicant-associated effects:
•Extremely high potential for toxicity:• Newark Bay;• Arthur Kill.
•High potential for toxicity:• East River bays;• vicinity of Ward’s Island;• Upper Bay;• Gowanus Canal;• lower Hackensack River;• lower Jamaica Bay.
•Moderate potential for toxicity:• East River;• Hudson River;• Kill van Kull;• lower Passaic River;• western Raritan Bay;• central Raritan Bay;• Lower Bay;• upper Jamaica Bay.
•Lowest potential for toxicity:• Harlem River;• northern Raritan Bay;• southern Raritan Bay.

8
The minimum concentration of mercury in the lower Hackensack River (4 ppm) reported by Squibb etal. (1991) exceeded the ERM value (1 ppm) listed by Long and Morgan (1990); the maximum concen-tration (50 ppm) exceeded this value by a factor of 50-fold. Maximum concentrations of lead in New-ark Bay and Arthur Kill exceeded the ERM concentration (110 ppm) by factors of about 8- to 10-fold.The concentrations of DDT, PCBs, total PAHs, chlordane, and dieldrin in Newark Bay, Arthur Kill,and/or the Passaic River were very high relative to concentrations previously associated with toxiceffects.
Long and Morgan (1990) reported that in numerous studies the types of biological effects observed inassociation with exceedances of the effects ranges included high mortality in amphipods, other crusta-ceans, bivalve larvae, polychaetes, and fish in either spiked-sediment bioassays or toxicity tests ofambient sediments; or altered infaunal community structures and/or reduced abundance of infauna; oracute or chronic effects in aquatic species as predicted by equilibrium-partitioning models.
Both Long and Morgan (1990) and Squibb et al. (1991) recognized the uncertainty in applying theeffects ranges as predictors of toxic effects. Many factors control the bioavailability of sediment-associated toxicants and, as a consequence, bulk sediment concentrations often are poor predictors oftoxic effects. Both reports recommended that surveys to determine the presence of toxicant-associatedeffects should be conducted to verify the potential for these effects.
In more recent studies, the concentrations of a number of different substances, notably total PAHs,mercury, lead, and zinc were found in concentrations that exceeded the ERL and ERM concentrationsin samples collected in the lower Passaic River, lower Hackensack River, and Newark Bay (Huntley etal., 1993; Bonnevie et al., 1993). These are areas previously identified as highly contaminated.
Previously Measured Biological Effects. The adverse biological effects of toxicants in the Hudson-Raritan Estuary have been apparent for many years (Gottholm et al., 1993). Pearce (1988) reportedthat portions of the estuary were severely degraded as early as the U.S. Civil War. In the early 1900ssome fish were unfit to eat because of high contamination and in the 1920s the shellfish populationscrashed due to the effects of wastewaters. Based upon the summaries prepared by several contributorsto NOAA (1988a), the major categories of toxicant-associated biological effects reported for the estu-ary include:
•alterations to resident microbial communities, including increased resistance to toxicants through long-term continual exposure;•alterations and shifts in phytoplankton community structures and diminished species diversity;•reduced densities and species diversity of benthic communities;•severely reduced abundances of ampeliscid amphipods in benthic communities;•elevated prevalences of fin erosion and other diseases in bottom-dwelling fish;•elevated prevalences of tumors and other histopathological disorders of bottom-dwelling fish;•elevated prevalences of a variety of diseases in crabs, lobsters and shrimp;•tissue contamination leading to closures of fisheries and advisories against fish consumption;•increased resistance of resident killifish and soft-shelled clams to the effects of subsequent doses oftoxicants.
In Mayer (1982), several contributors reported that diminished commercial landings of some specieshave occurred in the estuary, and that increased prevalences of histopathological disorders and a num-ber of other diseases in fish in the adjacent New York Bight have been recorded. The causes of some ofthese conditions are unknown, while the cause of others are known or suspected.

9
During the 1980s and 1990s, numerous fish kills were reported within the estuary; marine mammalsthat were found stranded often had a variety of different lesions; and anglers were advised to avoidconsuming large amounts of fish from the estuary (Gottholm et al., 1993). In addition, in studiesperformed by the NS&T Program, the prevalence of liver lesions in demersal fish caught in the estuarywere significantly elevated relative to reference sites (Gottholm et al., 1993).
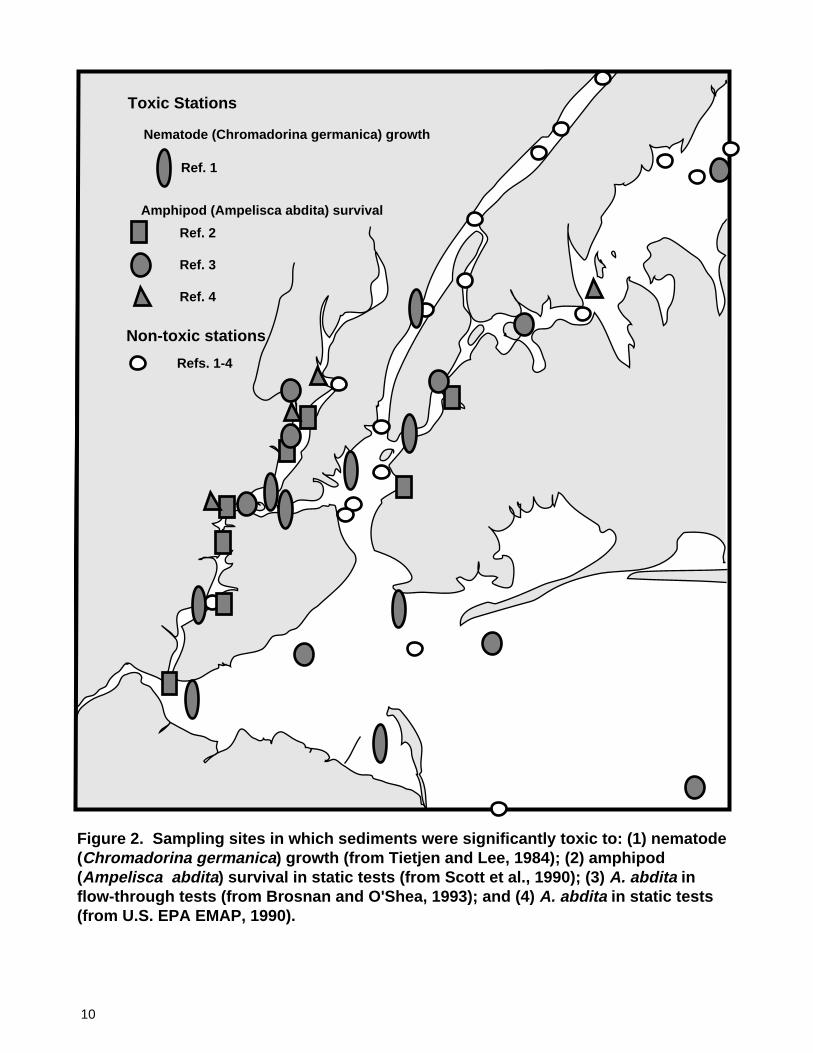
Tietjen and Lee (1984) reported that sediments from all of their 10 sampling sites in the Hudson-Raritan Estuary were significantly toxic to the growth of nematodes (Chromadorina germanica) inlaboratory toxicity tests (Figure 2). Sediments from the lower Hudson River, lower East River, upperNew York Harbor, Kill van Kull, Newark Bay, Arthur Kill, Raritan Bay, Sandy Hook Bay and the lowerNew York Harbor were toxic in these tests. In addition, most of the samples were toxic to anotherspecies of nematode, Diplolaimella punicea. Tietjen and Lee (1984) reported that toxicity to the growthof both nematodes was correlated with the concentrations of PCB, PAH, and mercury in the test sedi-ments (correlation coefficients of 0.68 to 0.90, p=0.05).
Scott et al. (1990) tested sediments from 10 locations in the estuary for toxicity to two species ofamphipods, Ampelisca abdita and Rhepoxynius hudsoni. A range of 12% to 100% mortality was re-ported for A. abdita, compared to 1% to 8% mortality in reference and control sediments. Eight of the10 samples were significantly different from controls (Figure 2) and five of the samples caused 100%mortality in A. abdita. Toxic samples were collected in Newtown Creek adjacent to the lower EastRiver, Gowanus Canal, Newark Bay, Arthur Kill, and western Raritan Bay. Similarly, a range of 9% to100% mortality was recorded for the tests with R. hudsoni, compared to 3% to 11% mortality in refer-ence and control sediments. Of the 10 samples, four collected in northern Arthur Kill, southern ArthurKill, Gowanus Canal, and Newtown Creek were toxic to R. hudsoni.
Scott et al. (1990) reported that mortality to A. abdita was significantly correlated with the concentra-tions of total PCBs, total PAHs, several pesticides, copper, zinc, chromium, lead, nickel, and cadmiumin the test sediments (correlation coefficients of 0.70 to 0.90, p<0.05). Also, they reported that mortal-ity to R. hudsoni was correlated with the concentrations of total PCBs, total PAHs, lead, and cadmiumin the sediments (correlation coefficients of 0.50 to 0.69, p<0.05). Mortality to A. abdita, but not to R.hudsoni, also was correlated with silt and Total Organic Carbon (TOC) content (correlation coeffi-cients of 0.69 to 0.70, p<0.05). In addition, Scott et al. (1990) reported that the concentrations oftoxicants in samples that were toxic to the amphipods often equalled or exceeded the ERL-ERM rangesof Long and Morgan (1990). The samples that were most toxic had chemical concentrations thatexceeded the ERM values for many analytes to the greatest degree.
The Environmental Monitoring and Assessment Program (EMAP) of the U.S. Environmental Protec-tion Agency (EPA) tested sediments from nine locations within the study area in 1990 for chemicalconcentrations and for survival of the amphipod, A. abdita (Schimmel et al., 1994). Five of the ninesamples (55%) were significantly different from controls. The toxic samples were collected in thelower Hackensack River, lower Passaic River, upper Newark Bay, upper Arthur Kill, and western LongIsland Sound near Hempstead Bay (Figure 2). Two of the nontoxic samples were collected in the basinof western Long Island Sound. The samples from the Hudson River and upper New York Harbor nearSt. George were nontoxic. Mean percent mortality ranged from 2.5±4.3% to 99.0±2.2%, whereas thatin the controls ranged from 6% to 9%. The samples from the Arthur Kill and the lower Passaic Rivercaused the highest mortalities (99.0% and 78.0%, respectively).
10
Nematode (Chromadorina germanica) growth
Amphipod (Ampelisca abdita) survival
Ref. 2
Ref. 3
Ref. 4
Toxic Stations
Non-toxic stations
Refs. 1-4
Ref. 1
Figure 2. Sampling sites in which sediments were significantly toxic to: (1) nematode(Chromadorina germanica) growth (from Tietjen and Lee, 1984); (2) amphipod (Ampelisca abdita) survival in static tests (from Scott et al., 1990); (3) A. abdita in flow-through tests (from Brosnan and O'Shea, 1993); and (4) A. abdita in static tests (from U.S. EPA EMAP, 1990).

11
Correlations between percent survival of A. abdita and the concentrations of trace metals and totalorganic carbon in the EMAP samples are summarized in Table 2. Survival would be expected todiminish among amphipods exposed to increasing concentrations of toxicants, resulting in negativecorrelation coefficients. The correlations were conducted with the trace metals data normalized to dryweight, aluminum concentrations, and TOC concentrations. A significant negative correlation be-tween survival and chemical concentrations normalized to dry weight was observed only for antimony(Rho = -0.480, p<0.05, n=9). The correlations between percent survival and trace metals concentra-tions improved when the chemical data were normalized to TOC content; the correlations with lead,cadmium, antimony, and tin were significant. When the trace metals data were normalized to thealuminum concentrations, many of the correlations became highly significant. For example, the corre-lations between percent survival and the concentrations of cadmium, copper, antimony, and tin werehighly significant, and those with nickel, zinc, and selenium were significant. The correlations be-tween percent survival and the concentrations of aluminum and TOC content, however, were not sig-nificant.
Table 2. Spearman-rank correlations (Rho) between percent survival of A. abdita (n=9) and theconcentrations of trace metals normalized to dry wt., aluminum, and total organic carbon (TOC).From U.S. EPA EMAP monitoring data, 1990 (Schimmel et al., 1994).
Concentration/ Concentration/ Concentration/Chemical dry weight aluminum TOC
Aluminum +0.385 nd ndTOC +0.133 nd ndChromium +0.093 -0.181 -0.016Copper -0.052 -0.705** -0.275Iron +0.283 nd ndManganese +0.292 nd ndNickel +0.088 -0.549* -0.017Lead -0.332 -0.433 -0.607*Zinc -0.002 -0.540* -0.127Arsenic +0.044 -0.198 -0.058Cadmium -0.343 -0.831*** -0.747**Antimony -0.480* -0.680** -0.495*Selenium +0.019 -0.538* -0.114Tin -0.190 -0.738** -0.552*Mercury -0.044 -0.438 -0.230
* p< 0.05 nd = no data** p < 0.01*** p < 0.001
These relatively high correlations between amphipod survival and chemical concentrations were unex-pected since the nine samples were collected in widely separated portions of the study area. They werenot collected near each other within the zone of influence or dilution gradient of one point source.
Battelle Pacific Northwest Laboratories tested sediment samples from 20 locations in the estuary forthe City of New York (Tom Brosnan, City of New York, personal communication; Brosnan and O’Shea,1993). The samples were collected throughout the estuary in February, 1992 and tested with a flow-

12
through, 10-day, amphipod survival test, using A. abdita. Portions of the same 20 samples were ana-lyzed for only trace metals concentrations. Nine of the 20 samples were significantly toxic (Figure 2).The toxic samples were collected in western Long Island Sound, upper East River, lower East River,lower Passaic River, Newark Bay near Shooters Island, lower New York Harbor and the New YorkBight. Sediments collected near Shooters Island indicated 0.0% survival, and those from the lowerPassaic River 11.0% survival, compared to 90% survival in the controls. The concentrations of totalsimultaneously extracted trace metals (SEM) (umoles/g) never equalled or exceeded the concentra-tions of acid volatile sulfide (umoles/g), suggesting that trace metals had a minor role in contributing totoxicity.
Aqua Survey, Inc. (1990a, 1990b) tested intertidal and subtidal sediments from numerous locations inthe Arthur Kill, Kill van Kull, and Newark Bay for the Exxon Company. The sediments were testedwith the estuarine amphipod Eohaustorius estuarius, collected from Yaquina Bay, Oregon. Sedimentswere held at 4°C for approximately one month before the tests were initiated. Nine to 27 samples weretested from each location. No site location map accompanied the toxicity data. Also, no statisticalanalyses of the data were performed to quantify significant differences between test sediments andcontrols. The qualitative results are summarized in Table 3.
Table 3. Mean percent mortality of Eohaustorius estuarius in sediments from Arthur Kill, Killvan Kull, and Newark Bay (from Aqua Survey, Inc., 1990a, 1990b).
Sampling Sample Mean Number ofLocation Description Mortality Samples
Yaquina Bay, Oregon Coarse control 7.5±6.5 18Yaquina Bay, Oregon Coarse control 6.9±6.1 8Yaquina Bay, Oregon Fine control 8.3±7.4 9Hackensack River - 57.0±29.3 27Arthur Kill
Mill Creek - 44.1±27.7 27Rahway River - 27.0±19.2 27Elizabeth River - 36.1±22.7 27Sawmill Creek - 52.6±33.2 27Sawmill Creek 50.4±24.9 27NW Pralls Island Sand 27.8±10.6 9NW Pralls Island Mud 38.3±14.9 9NW Pralls Island Subtidal 51.7±31.9 9E. Pralls Island Subtidal 61.1±14.9 9Old Place Creek Subtidal 31.7±17.3 9Isle of Meadows Sand 18.9±9.1 9Isle of Meadows Mud 43.9±34.5 9
Kill van KullConstable Hook - 18.8±10.4 26Shooters Island Subtidal 29.4±12.6 9
Newark BayElizabethport Subtidal 32.2±16.0 9West Bayonne Sand 34.4±9.6 9West Bayonne Mud 40.0±27.1 9

13
The mean mortality in all locations exceeded that of the Yaquina Bay controls. Sediments from easternPralls Island, the Hackensack River, northwest Pralls Island and Sawmill Creek caused the highestmortality. The results within each of the areas were highly variable, except in the sand sediments fromWest Bayonne. Lowest mortality was observed in the sandy sediments from Isle of Meadows andConstable Hook. In all three cases in which sand and mud from the same general location were tested,mean mortality was higher in the mud.
In summarizing the data from these small, disparate surveys, several patterns in toxicity seem to emerge.The data from the two Aqua Survey, Inc. surveys generally agree with those from Tietjen and Lee(1984), Scott et al. (1990), the City of New York (Brosnan and O’Shea, 1993), and EPA’s EMAPsurveys (Schimmel et al., 1994). That is, all five studies indicated that sediments from the Arthur Kill,Newark Bay, the lower Passaic River, and Kill van Kull were highly toxic. Moreover, all five studiesindicated that samples from the northern reach of Arthur Kill (from Isle of Meadows to Shooters Is-land) were particularly toxic. Several of the studies indicated that samples from the lower HudsonRiver and the upper New York Harbor were not toxic. Also, toxicity to amphipods generally dimin-ished eastward into the western Long Island Sound. Some samples from the lower reaches of theestuary and inner New York Bight were toxic in at least one test.
Numerous small studies of sediment toxicity have been conducted by or for the Army Corps of Engi-neers throughout the estuary as requirements for ocean disposal dredging permits. These toxicity testswere performed with consistent protocols, and, together, provide internally comparable data for muchof the study area. Usually, one to several samples were tested in each study, each consisting of sedi-ments collected in one or more long sediment cores. Data were available and compiled from 76 reports(Public Notices for Dredged Material Disposal, U. S. Army Corps of Engineers, 1985-1993). Testswere conducted with the shrimp Palaemonetes pugio, the polychaete Nereis virens, and the clamMercenaria mercenaria exposed to solid phase sediments for 10 days, using U.S. EPA/ACOE (1977)protocols. Test results were compared to those from an offshore reference site to determine significanttoxicity. Sediments were tested from shipyards, marine terminals, industrial waterways, harbors, sew-age outfalls, navigation channels, barge berthing sites, petroleum docks, military docks, tributary riv-ers, and creeks in all of the major regions of the estuary (Figure 3).
Ninety-two samples were tested with the three bioassays, for a total of 276 individual tests. The major-ity of the samples did not cause significantly elevated mortality in the test organisms. However, mor-tality significantly different from the reference materials was indicated in sediments from the lowerRaritan River, Arthur Kill, Kill van Kull, Keyport Harbor in Raritan Bay, Gowanus Bay/Canal, and theupper East River near Riker’s Island (Figure 3). The samples that were toxic in these tests were col-lected in many of the same areas in which sediments either were estimated to be highly contaminated(e.g., Squibb et al., 1991) or were toxic in tests performed with other taxa (Figure 2).
Tatem et al. (1991) tested sediments from three sites—Westchester Creek adjoining the upper EastRiver, central Arthur Kill, and Gowanus Creek —for toxicity to the mysid, Mysidopsis bahia. Thesediments were held for differing periods of time, from 8 days to 40 weeks, before testing was initiated.In the tests performed with sediments held for fewer than 8 days, the samples from Westchester Creekand Arthur Kill were significantly more toxic than offshore reference samples. The Gowanus Creeksamples were not toxic.

14
Toxic samples
Non-toxic samples
Figure 3. Sampling stations in which survival was significantly different from referencematerials in tests of either grass shrimp, polychaetes, or clams during pre-dredging studies (from Army Corps of Engineers Public Notices, 1985-1993).
Raritan R.
Raritan Bay
Gowanus Bay
Art
hur
Kill
Kill van Kull
New
ark
Bay
Hud
son
R.
East
Riv
er

15
METHODS AND MATERIALS
NOAA initiated an area-wide survey of sediment toxicity in 1991 to provide internally consistent dataon the spatial extent and severity of toxicity to relatively sensitive taxa. The intent of this survey wasto sample all of the major regions of the study area, collect surficial fine-grained sediments, and testthem to determine the degree of toxicity to laboratory organisms.
Based upon available sedimentological, chemical and biological data from numerous studies, a strati-fied sampling design was prepared that embraced areas previously identified as highly, moderately,and slightly contaminated. To ensure that samples were collected throughout the entire estuary, thestudy area was stratified into 13 contiguous regions designated as zones A through M (Figure 4). Thesezones were established following review of available bathymetric, physiographic and sedimentologi-cal information to represent conditions within major components of the study area. For example, zonesA and G were intended to represent conditions in the lower reaches of the Hudson and Raritan rivers,respectively. Zones C and D were intended to represent conditions in the upper and lower reaches ofthe East River, respectively. Zones H through K were selected to represent the different sedimentologi-cal and bathymetric regimes reported in Raritan Bay. Samples from zones B and M were intended toprovide information from suspected reference areas.
Three sites were sampled within each zone (Figure 4) to provide information on environmental vari-ability. Most sites were chosen based upon reviews of data from previous sedimentological and chemi-cal analyses (e.g., City of New York, 1987). Where no historical data were available, the sites wereselected based upon bathymetric and sedimentological information published on applicable navigationcharts. The coordinates for the center of each site are listed in Table 4. Similar to the method used inNOAA’s Mussel Watch Program (NOAA, 1987), three stations were sampled and tested independentlywithin each site. Sediments from a total of 39 sites and 117 stations were sampled and tested.
Table 4. Locations of sites in the Hudson-Raritan Estuary sampled during Phase 1.
Regional Site Depth Latitude LongitudeZone Number (m) (°N) (°W)
A. Lower Hudson River1 14-15 40°54’52"N 73°54’53"W2 12-16 40°52"42"N 73°55’53"W3 11-13 40°46’50"N 73°59’28"W
B. Western Long Island Sound4 14-15 40°53’40"N 73°42’15"W5 23-27 40°52’00"N 73°45’00"W6 17-19 40°49’59"n 73°46’42"W
C. Upper East River7 33-35 40°47’58"N 73°47’13"W8 6-14 40°48’16"N 73°58’01"W9 10-12 40°47’46"N 73°52’42"W
D. Lower East River10 6-11 40°47’58"N 73°54’04"W11 3-6 40°44’39"N 73°57’37"W12 3-16 40°42’31"N 73°58’14"W

16
Table 4 continued.
Regional Site Depth Latitude LongitudeZone Number (m) (°N) (°W)
E. Upper New York Harbor13 16-18 40°42’16"N 74°01’34"W14 15 40°38’38"N 74°03’17"W15 6-8 40°36’22"N 74°02’44"W
F. Newark Bay/Arthur Kill16 11-12 40°42’24"N 74°07’06"W17 10-14 40°38’43"N 74°10’20"W18 9-13 40°34’09"N 74°12’41"W
G. Lower Raritan River19 2 40°21’01"N 74°20’54"W20 3-4 40°30’34"N 74°18’13"W21 3-5 40°29’50"N 74°16’38"W
H. Western Raritan Bay22 3 40°30’37"N 74°15’25"W23 5-6 40°29’12"N 74°15’30"W24 5 40°29’20"N 74°13’30"W
I. Central Raritan Bay25 6 49°29’26"N 74°10’52"W26 8-9 40°30’06"N 74°09’07"W27 9-10 40°29’33"N 74°06’55"W
J. Sandy Hook Bay28 7 40°28’30"N 74°04’24"W29 6 40°27’23"N 74°02’00"W30 6 40°25’30"N 74°00’42"W
K. Southern Raritan Bay31 3 40°28’05"N 74°13’20"W32 4 40°28’02"N 74°09’30"W33 6-7 40°28’02"N 74°05’52"W
L. Lower New York Harbor34 6-7 40°30’35"N 74°06’05"W35 10-12 40°29’40"N 74°02’40"W36 4-7 40°33’42"N 74°03’08"W
M. Outer Bay/New York Bight37 4-7 40°30’00"N 73°58’37"W38 8-10 40°28’00"N 73°56’00"W39 20-22 40°25’57"N 73°53’43"W
Three toxicity tests were performed on the samples. These tests included a 10-day, solid phase test ofsurvival with the amphipod Ampelisca abdita, a 48-hour, elutriate/liquid phase test of normal develop-ment and survival with the larvae of the clam Mulinia lateralis, and a 15-minute, organic extract test ofbioluminescence with the bacterium Photobacterium phosphoreum (the Microtoxtm test). The batteryof four test end-points, together, were intended to provide information with which to evaluate therelative toxicity of the sediments.

17
1
2
3
4
5
6
78910
11
1213
14
15
16
17
18
19
2021
22
2324 25
26
27 28
29
30
31 3233
3435
36
37
38
39
Zone
A
Zone B
Zone C
Zone D
Zone E
Zone
F
Zone G
Zone HZone I
Zone J
Zone K
Zone L
Zone M
Figure 4. Boundaries of sampling zones (A-M) and locations of sampling sites (1-39) within each zone.

18
Following the initial survey in 1991, a follow-up Phase 2 was conducted that focused on the NewarkBay area. Sediment samples were collected at 57 randomly chosen stations. The study area was di-vided into strata that were approximately equal in size such that the data from each sample would haveapproximately equal spatial weight. Station location coordinates were chosen randomly within eachstratum with the aid of EPA’s EMAP software and hardware. Locations of the stations within thePassaic River, Hackensack River, Newark Bay, Kill van Kull, and Arthur Kill are listed in Table 5.Unlike Phase 1, the samples collected during Phase 2 were not replicated in the field; that is, only onesample was collected at each station. However, unlike Phase 1, the station locations were selected witha totally random approach.
Table 5. Locations of stations in Newark Bay and vicinity sampled during Phase 2.
Depth (m) (°N) (°W)Passaic River1. 5 40°47.36' 74°08.77'2. 5 40°46.28' 74°09.28'3. 7 40°45.28' 74°09.91'4. 7 40°44.07' 74°09.36'5. 4 40°44.18' 74°08.70'6. 4 40°44.36' 74°08.56'7a. 2 40°44.51' 74°07.99'7b. 4 40°44.49' 74°08.11'7c. 5 40°44.45' 74°08.30'8a. 5 40°44.52' 74°07.41'8b. 6 40°44.51' 74°07.59'9. 5 40°44.28' 74°07.05'10. 3 40°43.52' 74°07.16'11. 4 40°43.33' 74°07.23'Hackensack River12. 6.5 40°47.83' 74°04.30'13. 6 40°47.62' 74°04.62'14. 5 40°47.46' 74°04.74'15. 3 40°46.97' 74°05.13'16. 4 40°46.28' 74°05.30'17. 6 40°44.95' 74°05.15'18. 6 40°43.56' 74°05.95'Newark Bay19. 4 40°43.06' 74°06.32'20. 10 40°42.57' 74°06.50'21. 12 40°42.48' 74°07.08'22. 3 40°42.28' 74°07.08'23. 8 40°42.37' 74°07.17'24. 5 40°42.17' 74°07.08'25. 4 40°42.13' 74°07.11'26. 6 40°41.59' 74°07.29'27. 13 40°41.44' 74°07.37'28. 14 40°42.90' 74°09.14'29. 12 40°41.81' 74°08.80'

19
Table 5 continued.Depth (m) (°N) (°W)
30. 12 40°41.65' 74°08.33'31. 14 40°41.12' 74°07.90'32. 14 40°41.27' 74°09.53'33. 10 40°41.28' 74°08.30'34. 14 40°41.04' 74°07.99'35. 14 40°40.90' 74°08.08'36. 13 40°40.67' 74°08.14'37. 12 40°41.03' 74°09.16'38. 15 40°40.65' 74°08.36'39. 12 40°40.41' 74°08.25'40. 13 40°40.40' 74°08.32'41. 15 40°39.97' 74°08.57'42. 14 40°39.50' 74°08.76'43. no sample collected44. 14 40°39.55' 74°09.37'45. no sample collectedArthur Kill46. 2 40°37.02' 74°12.17'47. 6 40°37.07' 74°12.16'48. 10 40°38.44' 74°11.60'49. 2 40°38.69' 74°11.20'Kill van Kull50. 9 40°38.63' 74°10.09'51. 11 40°38.97' 74°09.79'52. 6 40°38.56' 74°09'.22'53. no sample collected54. 5 40°38.56' 74°08’89'55. 5 40°38.56' 74°09.07'56. 10 40°38.56' 74°08.89'Upper New York Harbor
57. 15 40°38.68' 74°09.26'
Sampling Methods. In Phase 1, samples were collected with a modified Van Veen grab sampler (alsoknown as a Young sampler) operated aboard the research vessel Mysidopsis. Samples were collectedin five periods: March 18-22; April 1-5; April 15-18; April 28-May 2; and May 13-16, 1991. Thecenter of each site was located with LORAN-C and Global Positioning System units. At each site, abuoy was dropped at the coordinates provided by NOAA. Then, the vessel was moved approximately100 m. away from the buoy for each of the three stations sampled at the site. The location of eachstation was determined with Loran and GPS, along with radar ranges and hand-held compass bearings.Generally the stations at each site were equidistant from the site center and about 250 m. apart fromeach other. In most cases the stations formed a triangle around the site center, but, where conditionsdictated otherwise, the stations were arranged in a straight line. Situations were avoided where consid-erably different environments were sampled at an individual site. For example, stations were located ata site such that all three were in similar depths and had sediments with similar-appearing grain sizes.Stations were not selected to represent conditions off known point or non-point discharges, wastedump sites, etc.
20
About 5 liters of sediment were collected at each station, requiring repeated deployments of the sam-pler. The upper 2 cm. of sediment were removed from each sample. The sediments from each stationwere homogenized thoroughly by stirring. Portions of each sample were placed in polyethylene con-tainers for the toxicity tests and in glass jars for the chemical analyses. The grab sampler and samplingutensils, pans, and other equipment were washed with seawater and acetone between sites, and withseawater between stations. Samples were rejected for any of the following reasons: presence of sedi-ments dropped from previous deployments of the sampler, excessive sediment escaping from grab lids,excessive sand or gravel content (>75%), excessive amount of shells or rocks, or over-penetration ofthe sampler. One sample from the East River was rejected because of the presence of a leg bone caughtin the jaws of the sampler. Only a few stations were relocated to avoid gravel, coarse sand, musselbeds, etc.
At all 117 stations, additional sediments were collected for possible future benthic community analy-ses. The benthic samples are currently in storage.
Sediments from a Central Long Island Sound (CLIS) site were used as negative (nontoxic) controls inthe toxicity tests. This site had been previously tested and found to be nontoxic (survival of A. abditaconsistently exceeded 90%) and the concentrations of toxicants were relatively low.
During Phase 2 of the survey, samples were collected by U.S. EPA Region 2 personnel during two legs.The first sampling leg (January 2-12, 1993) was conducted aboard the U.S. EPA Ocean Survey VesselPeter W. Anderson. Samples were collected in central Newark Bay, northern Arthur Kill, Kill van Kulland upper New York Harbor. Each sampling position was recorded by LORAN C, which had beencalibrated with the on-board Global Positioning System unit. The second sampling leg was conductedduring the period of March 16-29, 1993 aboard the U.S. Army Corps of Engineers (ACOE) SurveyVessel Hudson. During this leg, samples were collected in upper Newark Bay, the lower Passaic River,and the lower Hackensack River by personnel from EPA and the ACOE. Positions were recorded by aNorthstar LORAN C unit.
Phase 2 samples were collected with a stainless steel modified van Veen grab sampler. At each station,approximately 8 liters of sediment from the upper 2 cm were collected in multiple deployments of thesampler. A kynar-coated spatula was used to carefully remove the upper 2 cm of sediment. Thesediments were completely homogenized before aliquots were prepared for each laboratory. All equip-ment used in the collection of samples was rinsed with acetone and site water between sampling sta-tions. Samples were rejected if the jaws of the sampler were not completely shut or if the sampleconsisted of only gravel and sand.
Sediment Testing Methods. Testing methods followed previously published protocols to ensure com-parability of the results to previously collected data. The tests with the amphipods and bivalve larvaewere performed with fresh, unfrozen sediments, while the Microtox tests were performed with previ-ously frozen sediments. The holding times for the sediments tested with amphipods were 2 to 9 daysfor nine of the test series and 27-28 days for test series number 10. A number of unavoidable problemswere encountered at the initiation of the bivalve larvae tests, causing delays in the completion of thesetests. As a result, sediments tested with bivalve larvae were held for 93 to 163 days.
The amphipod test with Ampelisca abdita followed the protocols of ASTM (1990) and was conductedin both phases by Science Applications International Corporation. Test animals were collected fromtidal flats in the Pettaquamscutt (Narrow) River, a small estuary of the Narragansett Bay, RI. They

21
were held in the laboratory and acclimated for 2 to 10 days before testing. Test sediments were press-sieved through a 2.0 mm mesh sieve and homogenized. Test chambers were quart-size glass canningjars with inverted glass dishes as covers. Two hundred of sediments were added to each test chamberand covered with 600 mL of laboratory seawater. Aeration was continuous via a glass tube, lightingwas continuous during the 10-day static exposures, and temperatures were maintained at 20°C. Fivereplicate tests were performed with the sediments from each station and the control, using 20 animalsin each test chamber. Exposure chambers were checked daily and the number of individuals that weredead, or moribund, on the sediment surface, and/or on the water surface were recorded. Dead animalswere removed daily. Amphipods were considered to be dead when they did not respond to a gentleprod with a glass rod.
Six samples collected during Phase 2 were suspected to be highly contaminated with dioxins, and,therefore hazardous. The amphipod survival tests of these samples were performed by Aqua Survey,Inc., using the same ASTM (1990) protocols. The amphipods were obtained from East Coast Amphi-pod Co., Narragansett, RI (from the same site used by SAIC) and acclimated to test water for 96 hours.
The bivalve larvae test with Mulinia lateralis generally followed the protocols of the U.S. EPA/ACOE(1991) with some modifications. Adult male and female clams were induced to spawn by temperaturemanipulation. Egg stocks of about 1,200 eggs per mL and sperm stocks of about 4 million sperm permL were prepared. To prepare the embryo stock, 100 uL of sperm stock was added to every mL of eggstock and fertilization was allowed to proceed for about 35 min. The embryos were then retained on a10 um screen, and then resuspended. Next, 0.75 mL of embryo stock was added to vials containing 15mL of sample or control. Initial embryo counts were performed on the contents of six vials containing15 mL of seawater. Elutriates were prepared by adding 100 g (wet wt.) of homogenized sediment to500 mL of laboratory seawater in clean glass jars. The elutriates were mixed for 30 min. using heavyaeration with manual stirring every 10 min. After 30 min., the suspensions were allowed to settle for atleast one hour. At least 80 mL of supernatant was gently poured into a 0.4 um filter housing andvacuum filtered until there was enough filtered sample for 5 replicates of 15 mL each. Static testexposures of the liquid phase samples were conducted for 48 hours at 22°C. After 48 hours the testswere terminated by adding 0.75 mL of 50% buffered formalin to each vial. The total number of em-bryos and the number of normal-appearing embryos were counted.
The Microtoxtm tests followed an adaptation of the protocols prepared by U.S. EPA Region 10 (1990).The tests were performed with organic extracts of the sediments. Three grams (wet wt.) of each sedi-ment sample were weighed into a 100 mL Pyrex centrifuge tube with a Teflon lined top. Each samplewas centrifuged for 10 min. at 1,750 RPM and the water discarded. Fifteen grams of sodium sulfatewas mixed in, then 50 mL of dichloromethane (DCM) was added and mixed. The samples were shakenovernight; centrifugation was repeated; and the supernatant was collected in a 200 mL flask. Theextraction steps were repeated twice and the extract solutions collected in a flask. The solutions wereevaporated under nitrogen to a volume of about one mL. Undenatured ethanol was added and thevolumes reduced to just below one mL in a 100°C water bath. The final volumes were adjusted to 1 mLwith undenatured ethanol. An ethanol reagent blank was prepared as above but contained no sediment.Lyophilized bacteria (Photobacterium phosphoreum) were reconstituted with 1 mL of deionized waterand placed in a Microtoxtm cuvette at 4°C. Tests were performed with 10-fold serial dilutions (repre-senting 10, 1.0, 0.1, and 0.01 uL of sediment extract) prepared in seawater. Blanks were prepared at thesame concentrations by similar dilutions of the ethanol reagent blank. All dilutions were conducted intest cuvettes in temperature-controlled incubation wells. Reconstituted bacteria were added to each at30-sec. intervals and mixed well to initiate the tests. Exactly five minutes later, light emission was

22
measured at 30-sec. intervals in the same sequence as the tests were initiated. Between each extractdilution level, the blank of the corresponding concentration was used to adjust the photometer for thecontribution of the extraction solvent. To conclude the tests, light emission was measured again at 15min., and these data were used to calculate the 50% inhibition concentrations (i.e., the EC50s).
In addition to the tests described above that were performed with all of the samples, several others wereperformed on selected samples as a part of methods development. Tests of the growth of a polychaete(Armandia brevis) and an adult sand dollar (Dendraster excentricus) were performed with 17 of thesamples (Rice et al., in press). Also, nine of the samples were tested with the freshwater amphipodDiporeia spp. by the Great Lakes Environmental Research Laboratory (Dr. Peter Landrum). The testanimals were acclimated to 20 ppt salinity seawater by the addition of 5 ppt seawater/day and held for48 hours. Two cm of sieved sediments, in replicates of three per sample, were placed into one-literbeakers, containing 600 mL of seawater at 20 ppt salinity. Twenty animals were used in each replicate.Tests were performed at 4°C, maintained by a constant temperature water bath. The amphipods weremonitored daily for sediment avoidance, signs of stress, and mortality. Avoidance of the sediment wasobserved as the absence of burrowing and migration to the water surface, which resulted in adheranceto the surface film. Stress was observed as animals lay on the sediment surface. Dead animals wererecorded and removed from the exposure chambers. After 28 days, the beakers were removed from thewater bath and the sediment was wet sieved through a 1 mm screen. The numbers of live and deadanimals were recorded and the percent mortality and percent survival were calculated.
Estimates of the Spatial Extent of Toxicity. The spatial extent of toxicity within the survey area wasestimated using methods similar to those of the Environmental Monitoring and Assessment Program(EMAP) of the U.S. EPA (Schimmel et al., 1994). However, the design of the sampling plans differedbetween Phases 1 and 2. During Phase 1, the dimensions of each sampling zone (Figure 4) wereoutlined on navigation charts during the design phase. The locations of each sampling site were deter-mined a priori to represent conditions within each zone. These site locations were chosen following areview of existing information of sediment types, bathymetry, and proximity to previously sampledsites. The size of each zone was determined with a planimeter. The toxicity data were weighted to thesize of each zone (divided by three, the number of sites in each zone), and the cumulative distributionfunctions of these data were prepared. Using critical values of toxicity results less than 80% of thecontrol responses (as in the EMAP) and less than 20% of controls (reciprocal of 80%), the size(s) of thearea(s) that were significantly toxic and highly toxic, respectively, were estimated.
The principles of a probabalistic sampling design require that the sampling locations be chosen ran-domly and without knowledge of site-specific conditions (Schimmel et al., 1994). However, that typeof sampling design was not strictly adhered to in Phase 1 of this survey. The boundaries and dimen-sions of each zone were established a priori, but the locations of the sampling sites were not selectedwith a strictly random process. Some sites were chosen to coincide with the locations of sites previ-ously sampled by other investigators. However, none were chosen to represent conditions near anypoint sources or waste disposal sites. All sites were chosen to represent conditions in the nearbyvicinity of the sampling location and within the respective zone. The locations of the individual sam-pling stations at each site were chosen by the vessel operator in the field as three points on a compassradiating from the site center.
Highly disturbed areas that obviously had been recently dredged were avoided. Also, samples withexcessive amounts of coarse sandy materials were avoided, where possible. Within each site, attemptswere made in the field to avoid a mixture of stations from deep, dredged channels and shallow, undredged

23
flats. The boundaries of the sampling zones were chosen based upon major physiographic features,such as points of land and the dimensions of individual waterways. Because of these possible sourcesof bias in the data, the estimates of the spatial extent of toxicity prepared during Phase 1 must beinterpreted as rough estimates, and not as absolutes.
During Phase 2 of this survey, the probabalistic, random-stratified sampling design used by the EMAP(Schimmel et al., 1994) was used within the boundaries of the Phase 2 survey area (Figure 5). Duringthe design phase, the area was subdivided into strata roughly equal in size. The dimensions of thesestrata were outlined on a navigation chart, the chart was digitized, and the coordinates for the indi-vidual stations were selected randomly with the aid of a computer program. One station (one sample)was sampled within each stratum. The toxicity results were weighted to the size of each stratum, thecumulative distribution function prepared, and using <80% of controls as the critical value, the size(and percent) of the area that was toxic was determined.
Chemical Analyses: Phase 1. Sediment samples were chosen for chemical analyses based upon anexamination of the toxicity test results. Samples were chosen that represented gradients in the toxicityresults and that also represented contiguous geographic strings of stations. Sediments were extractedby Battelle Ocean Sciences in two batches containing approximately 19 field samples each. One pro-cedural blank, one standard reference material, a matrix spike sample, and a matrix spike duplicatesample were extracted with each batch. Each field sample contained 30 g to 50 g of sediment. Sedi-ment dry weight was determined using approximately 5 g of sample material. Analyses were per-formed for total trace metals, simultaneously extracted metals (SEM), acid-volatile sulfides (AVS),PCB congeners, pesticides, and polynuclear aromatic hydrocarbons (PAHs). Also, analyses were per-formed for total organic carbon (TOC) and sediment grain size.
Extraction and analytical methods followed those of Peven and Uhler (1993). Sediment was weighedinto pre-weighed Teflon jars; surrogate internal standards (to monitor extraction efficiency), sodiumsulfate, and 1:1 methylene chloride (DCM):acetone were added to each jar. Samples were extractedwith the solvent mixture three times using shaker table techniques. After each extraction, the jar wascentrifuged, and the overlying solvent decanted into a labelled Erlenmeyer flask. Solvent from each ofthe three extractions was combined in the flask. The combined extract was chromatographed througha 20 g alumina column eluted with dichloro-methane (DCM). After column cleanup, the sample ex-tract was concentrated to approximately 900 uL and further processed using a size-exclusion highperformance liquid chromatography (HPLC) procedure. Six hundred microliters of the extract werefractionated in this procedure, and the remaining 300 uL archived. After HPLC cleanup, the sampleextract was concentrated to approximately 1,000 uL and recovery internal standards were added toquantify surrogate recovery. The final sample was split in half by volume; one half was dedicated toGC/MS analysis of PAHs and the other half was solvent-exchanged with isooctane and analyzed byGC/ECD for PCBs and pesticides.
The analytical methods for the trace metals followed those of Crecelius et al. (1993). Samples werecompletely digested with 4:1 HNO3/HClO4 and heated. The digestates were analyzed either by graph-ite furnace atomic absorption (Ag, Cd, Se), or cold vapor atomic absorption (Hg), or x-ray fluorescence(Al, As, Cr, Cu, Fe, Mn, Ni, Zn), or inductively coupled plasma mass spectrometry (Sb, Sn). Tworeagent blanks and three standard reference materials were analyzed in each analytical string of 50samples.

24
1
2
3
45
67 8
9
10
11
1213
14
15
16
17
18
Stations for toxicity tests and chemical analyses
Stations for toxicity tests only
1920
21 2223 24
2526
27
2829
30
313233
343536
3738
3940
4142
4344
45
4647
4849 50
51
52
535455
56
57
Figure 5. Stations sampled in the Passaic River, Hackensack River, Newark Bay,upper Arthur Kill, Kill van Kull, and upper New York Harbor during Phase 2.
Staten IslandArt
hur
Kill
Newar
k Bay
Pass
aic
Riv
er
Hacke
nsac
k Rive
r
upperNew YorkHarbor
Kill van Kull

25
The concentrations of acid volatile sulfides (AVS) and simultaneouslyextracted metals (SEM) weredetermined in the samples. The analytical methods employed selective generation of hydrogen sulfideby acidifying the sample with 1N HCl, cryogenic trapping of the evolved H2S, and gas chromato-graphic separation with photoionization detection. This method gives high sensitivity, low detectionlimits and very limited chemical interference with minimal sample handling. The AVS analyticalsystem is made of glass and Teflon because of the reactivity of sulfide with metals. The filtered acidsolution resulting from the AVS analysis was subsequently analyzed for SEM using graphite furnaceatomic absorption, cold-vapor atomic absorption, and inductively coupled mass spectrometry.
Sediment samples were analyzed for total organic carbon (TOC) and total carbonate (TIC) by GlobalGeochemistry Corporation, Canoga Park, CA. Before the samples were analyzed, LECO filtrationcrucibles were precombusted for at least 2 hours at 450°C and allowed to cool. Between approxi-mately 175 mg and 250 mg of dried, finely ground and homogenized sample was placed in a pretreatedcrucible, and 6N HCl added to remove inorganic carbon. After approximately 1 hr, deionized waterwas flushed through the crucible removing the acid, and the sample was dried overnight. Immediatelyprior to sample analysis, iron and copper chips were added to accelerate the combustion. A LECOmodel 761-100 carbon analyzer was used to determine both the TOC and TIC content. The analyzerconverts all carbon in the sample to CO2 at high temperature in the presence of oxygen. The CO2 wasthen quantified by thermal conductivity detection. Before sample analysis for TIC, the filtration cru-cibles were precombusted for at least 2 hrs at 450°C and allowed to cool. Between approximately 175mg and 250 mg of dried, finely ground, homogenized sample was placed in a pretreated crucible, andthe sample placed in a 450°C oven for 2 hrs to remove organic carbon.
The methods used to determine sediment grain size are those according to Folk (1974). Briefly, coarseand fine fractions were seperated by wet-sieving. The fine fractions (silt and clay) were further sepa-rated by suspending the sediment in a deflocculant solution and taking aliquots of the settling sedimentat timed intervals after the solution was thoroughly mixed. The coarse fraction (sand and gravel) wasdried and then separated by sieving through a 2 mm screen.
Chemical Analyses: Phase 2. In Phase 2 of the study, chemical analyses were performed by theNational Biological Service, Midwest Science Center laboratory in Columbia, MO. Analyses wereperformed for total trace elements; SEM, AVS, PAHs; chlorinated pesticides; PCB congeners; and anumber of dioxins and furans.
Five-gram subsamples of wet sediment were analyzed for SEM/AVS by treatment with 100 ml 2N HClfor 1 hr in a nitrogen atmosphere. A sulfide-specific electrode was used to measure sulfide liberatedfrom the HCl treatment. The remaining sediment and acid was filtered through a 0.4 um polycarbonatemembrane for metals determination. A second 5 g subsample was taken for analysis of percent mois-ture by oven-drying at 95° C. The remainder of the sample was lyophilized to a constant weight andthe dry sediment was utilized for digestion and analysis for total metals and organic carbon. A portionof each filtered SEM extract (6 mL) was diluted with 5.7% nitric acid prior to Zeeman furnace atomicabsorption spectroscopy (AAS) to reduce the high chloride ion matrix. Another portion of the SEMextract was similarly diluted and stored in a glass container, which was later used for the determinationof mercury by flow injection AAS. A final portion of the SEM extract was subjected to a nitric acid wetdigestion/magnesium nitrate dry ash procedure to prepare a digestate suitable for the determination ofarsenic and selenium.
26
For total trace metals, a 0.5 g subsample of dried sediment was placed in a Teflon vessel and digestedwith nitric acid, hydrochloric acid, and hydrogen peroxide for analysis of total mercury. A second 0.5g portion of dried sediment was treated with nitric, perchloric, and hydrofluoric acids to prepare adigestate suitable for total metals determination. This latter digestate was diluted with 5.7% nitric acidprior to Zeeman furnace or flow injection AAS. A final portion of dried sediment was placed in aCoulometrics total carbon apparatus and combusted in pure oxygen for the determination of total or-ganic carbon.
Various instrumental approaches were used for the determination of elements in the total recoverableextractions, as well as the SEM fraction. Aluminum and iron in SEM extracts and aluminum, chro-mium, copper, iron, and zinc in the total sediment digestates were determined by inductively coupledplasma spectroscopy (ICP). Zinc in SEM extracts was determined by flame atomic absorption. Ar-senic and selenium in SEM extracts and total sediment digestates were determined by flow injectionhydride generation atomic spectroscopy. Mercury was determined on total recoverable digestates byflow injection cold vapor AAS. All remaining analytes (cadmium, chromium, copper, lead, nickel,silver, antimony, and tin in SEM extracts, and cadmium, lead, nickel, silver, antimony, and tin in totalsediment digestates) were determined by Zeeman furnace AAS.
For the analyses of organic compounds, the sediments were dried, homogenized, and extracted accord-ing to NBS Midwest Science Center procedures. Different sample aliquot sizes were extracted foreach class of compounds. In all cases the appropriate internal standards were spiked into the samplebefore extraction. Sediment samples were mixed with anhydrous sodium sulfate and column-extractedwith methylene chloride (MeCl).
For the organochlorine pesticides, sample extracts were injected onto an automated, high-performancegel permeation chromatography (HPGPC) system that was eluted with 80/20 hexane/MeCl. The col-lected portion then went through serial fractionation on Florisil and silica gel columns. One of theresultant three fractions (the first fraction of the silica gel) was treated for sulfur with acid-activatedcopper. The three fractions were then analyzed by GC/ECD on two different phase 30-m columns,DB-1 (methyl silicone) and OV-17 (50% phenyl-50% methylsilicone). All GC analyses were cool on-column injections.
For the polynuclear aromatic hydrocarbons (PAHs), the sample extracts were taken through a potas-sium silicate (KS) cleanup and the HPGPC system. Extracts were treated for sulfur with acid activatedcopper. The extracts went through a second KS cleanup and then were fractionated on a silver nitratetreated benzenesulfonic acid cartridge which separated chlorinated aromatics from the PAHs. ThePAH fractions were analyzed by GC/MS on a quadrapole system in full scan mode. The column was a60-m DB-5 (5% phenyl-95% methylsilicone). Compounds were determined by comparison of peakretention times to those of a standard and by checking the mass spectra. The concentrations of 12 lowmolecular weight (2- and 3-ring) PAHs and 12 high molecular weight (4- and 5-ring) PAHs werequantified. Recoveries were determined by deuterated internal standard spikes.
Samples extracted for polychlorinated biphenyls (PCB congeners, mono-ortho, and non-ortho) andpolychlorinated dibenzodioxins and dibenzofurans (PCDDs and PCDFs) were taken through two stagesof reactive column cleanup followed by HPGPC. After GPC cleanup the extracts were fractionated onan automated C-18/PX-21 carbon column system. Four fractions were collected from the carbon col-umn corresponding to congener PCBs (F1), mono-ortho PCBs (F2), non-ortho (F3) and PCDD/PCDFs(F4).
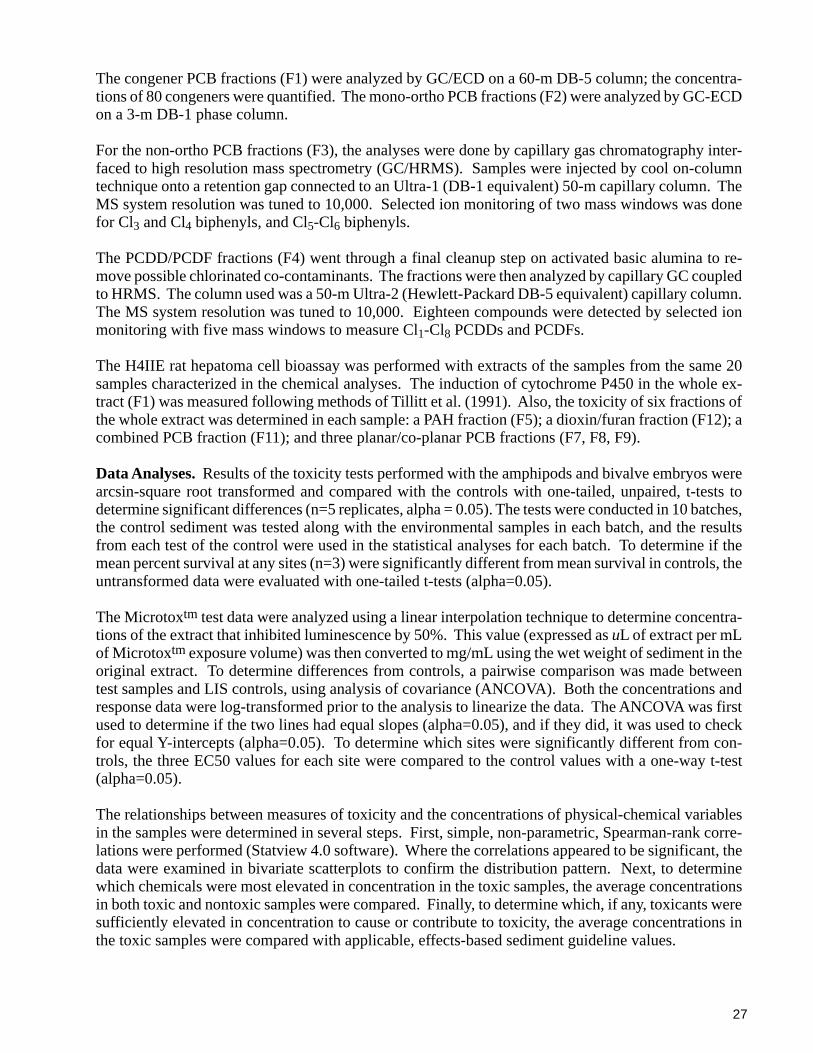
27
The congener PCB fractions (F1) were analyzed by GC/ECD on a 60-m DB-5 column; the concentra-tions of 80 congeners were quantified. The mono-ortho PCB fractions (F2) were analyzed by GC-ECDon a 3-m DB-1 phase column.
For the non-ortho PCB fractions (F3), the analyses were done by capillary gas chromatography inter-faced to high resolution mass spectrometry (GC/HRMS). Samples were injected by cool on-columntechnique onto a retention gap connected to an Ultra-1 (DB-1 equivalent) 50-m capillary column. TheMS system resolution was tuned to 10,000. Selected ion monitoring of two mass windows was donefor Cl3 and Cl4 biphenyls, and Cl5-Cl6 biphenyls.
The PCDD/PCDF fractions (F4) went through a final cleanup step on activated basic alumina to re-move possible chlorinated co-contaminants. The fractions were then analyzed by capillary GC coupledto HRMS. The column used was a 50-m Ultra-2 (Hewlett-Packard DB-5 equivalent) capillary column.The MS system resolution was tuned to 10,000. Eighteen compounds were detected by selected ionmonitoring with five mass windows to measure Cl1-Cl8 PCDDs and PCDFs.
The H4IIE rat hepatoma cell bioassay was performed with extracts of the samples from the same 20samples characterized in the chemical analyses. The induction of cytochrome P450 in the whole ex-tract (F1) was measured following methods of Tillitt et al. (1991). Also, the toxicity of six fractions ofthe whole extract was determined in each sample: a PAH fraction (F5); a dioxin/furan fraction (F12); acombined PCB fraction (F11); and three planar/co-planar PCB fractions (F7, F8, F9).
Data Analyses. Results of the toxicity tests performed with the amphipods and bivalve embryos werearcsin-square root transformed and compared with the controls with one-tailed, unpaired, t-tests todetermine significant differences (n=5 replicates, alpha = 0.05). The tests were conducted in 10 batches,the control sediment was tested along with the environmental samples in each batch, and the resultsfrom each test of the control were used in the statistical analyses for each batch. To determine if themean percent survival at any sites (n=3) were significantly different from mean survival in controls, theuntransformed data were evaluated with one-tailed t-tests (alpha=0.05).
The Microtoxtm test data were analyzed using a linear interpolation technique to determine concentra-tions of the extract that inhibited luminescence by 50%. This value (expressed as uL of extract per mLof Microtoxtm exposure volume) was then converted to mg/mL using the wet weight of sediment in theoriginal extract. To determine differences from controls, a pairwise comparison was made betweentest samples and LIS controls, using analysis of covariance (ANCOVA). Both the concentrations andresponse data were log-transformed prior to the analysis to linearize the data. The ANCOVA was firstused to determine if the two lines had equal slopes (alpha=0.05), and if they did, it was used to checkfor equal Y-intercepts (alpha=0.05). To determine which sites were significantly different from con-trols, the three EC50 values for each site were compared to the control values with a one-way t-test(alpha=0.05).
The relationships between measures of toxicity and the concentrations of physical-chemical variablesin the samples were determined in several steps. First, simple, non-parametric, Spearman-rank corre-lations were performed (Statview 4.0 software). Where the correlations appeared to be significant, thedata were examined in bivariate scatterplots to confirm the distribution pattern. Next, to determinewhich chemicals were most elevated in concentration in the toxic samples, the average concentrationsin both toxic and nontoxic samples were compared. Finally, to determine which, if any, toxicants weresufficiently elevated in concentration to cause or contribute to toxicity, the average concentrations inthe toxic samples were compared with applicable, effects-based sediment guideline values.

28
RESULTS
Solid-Phase Amphipod Tests. Results of the amphipod test performed with Ampelisca abdita aresummarized in Table 6. Tests were performed in a series of 10 batches. The results of the tests of theCentral Long Island Sound control sediments are listed first, followed by mean survival data for eachstation and site. Mean percent survival in the LIS sediments ranged from 83.2% to 99.0%. Normally,an acceptable survival rate in control sediments is 85% or greater. The mean percent survival in thecontrols in test series 3 and 6 were 83.2% and 85.0%, respectively. In both series, there was no patternof unusually low survival in tests of the Hudson-Raritan Estuary samples; therefore, the data wereaccepted and re-testing was not conducted. Furthermore, in series 3 amphipod survival in the testsamples was either very high or very low; therefore, the relatively low survival in the controls probablyhad no effect upon the tests of significance. However, in series 6 amphipod survival approximated80% in several samples and the tests of significance may have been affected by the results of the testsof the controls.
The sediments from 54 of the 117 stations (46%) were significantly toxic (i.e., different from controls)in the amphipod tests. A total of 16 of the 39 sites (41%) was significantly toxic in this test. Meanpercent survival ranged from 0.0 to 99.0% among the 117 stations. Mean percent survival in most ofthe 117 samples ranged from 80 to 99%, but a considerable number (48) of the test results were in therange of 0 to 79% survival. Among all 117 samples, 0.0% survival was observed in three samples (9-B, 10-A, and 18-C) and 0.1-10.0% survival was observed in five samples (9-A, 9-C, 12-A, 18-C, and34-B).
Based upon considerable previous experience with this test, differences in amphipod survival betweencontrols and test samples of 20% or more are significantly different in approximately 90% of the cases.Also, the 20% or greater difference from controls was used by EMAP (Schimmel et al., 1994) as acritical value in the interpretation of amphipod bioassay data. Therefore, stations and sites in whichmean amphipod survival was equal to or less than 80% of the controls are identified with two asterisksin Table 6.
Of the 43 samples in which amphipod survival was 80% or less of controls, 42 (98%) were signifi-cantly different from the controls. Mean amphipod survival in 10 sites was 80% or less of controls andsignificantly different from controls. There is a lower probability that test results in which mean sur-vival was greater than 80% of the controls were actually significantly different from controls. There-fore, in some samples with relatively high amphipod survival (>80%) the results of the t-tests, alone,may over estimate the incidence of toxicity in these tests.
Sediments from Zone F, Newark Bay/Arthur Kill/Kill van Kull, were most toxic (Table 6). All ninestations and all three sites were significantly toxic to amphipods in this zone. Also, zones C and D,upper East River and lower East River, respectively, were highly toxic. In the upper East River area, allnine stations and two of the three sites were toxic. In the lower East River, abd eight of nine stationswere toxic. Sediments from zones B (western Long Island Sound), I (Central Raritan Bay), and K(southern Raritan Bay) were least toxic; none of the stations was toxic in these zones. Sediments fromZone A, lower Hudson River, were relatively low in toxicity. Some of the sediments in Zone M in NewYork Bight were toxic, especially those from site 39 in the southern portion of this zone.
Several spatial patterns in toxicity were apparent, based upon the data from this test (Figures 6, 7).First, toxicity was very high in the upper East River and rapidly decreased eastward out into western

29
1
2
3
4
5
6
789
10
11
12
13
14
15
16
17
18
19
20
21
22
23
2425
26
27
28
29
30
3132
33
34
35
36
37
38
39
Non-toxic stations
Stations significantly differentfrom controls
Figure 6. Sampling stations in which the sediments were significantly toxic toAmpelisca abdita survival (n=5, alpha <0.05).
Stations significantly different from controls and <80% ofcontrol response

30
1
2
3
4
5
6
789
10
11
12
13
14
15
16
17
18
19
20
21
22
23
2425
26
27
28
29
30
3132
33
34
35
36
37
38
39
Figure 7. Sampling sites in which the sediments were significantly toxic toAmpelisca abdita survival (average of three stations, alpha <0.05).
Non-toxic Sites
Sites significantly different from controls
Sites significantly different from controls and <80% ofcontrol response

31
Long Island Sound. Second, toxicity was relatively high in samples from the lower East River, anddecreased southward through upper New York Harbor, lower New York Harbor, and eastward into theentrance of the estuary. Third, toxicity was extremely high in the Newark Bay/Kill van Kull/ArthurKill area and diminished southeastward through Raritan Bay. Sediments from the lower Raritan Riverand Sandy Hook Bay were moderately toxic, and this toxicity diminished into central Raritan Bay andeastward into the entrance to the estuary.
Table 6. Mean percent survival of A. abdita in 10-day solid-phase toxicity tests of sediments fromthe Central Long Island Sound (CLIS) control site (n=5), 117 sampling stations (n=5), and 39sites (n=3) and of Diporeia spp. in 9 samples from the Hudson-Raritan Estuary.
A. abdita Diporeia spp.Regional Sampling Test mean % % of Signif- mean % Signif-Zone Site/Station Series survival control icance survival icance
CLIS Control 1 92.0 -Control 2 89.5 -Control 3 83.2 -Control 4 91.0 -Control 5 99.0 -Control 6 85.0 -Control 7 92.0 -Control 8 98.0 -Control 9 98.0 -Control 10 92.0 -1-A 3 89.5 107.6 ns1-B 3 85.3 102.5 ns1-C 3 88.4 106.3 ns
Site 1 Mean 3 87.7 105.5 ns
2-A 3 90.8 109.2 ns2-B 3 91.6 110.1 ns2-C 3 84.2 101.3 ns
Site 2 Mean 3 88.9 106.9 ns
3-A 2 89.5 100.0 ns3-B 2 45.3 50.6 **3-C 2 42.1 47.1 **
Site 3 mean 2 59.0 65.9 ns
Zone B 4-A 3 98.9 119.0 ns4-B 3 95.8 115.2 ns4-C 3 93.7 112.7 ns
Site 4 mean 3 96.1 115.6 ns
5-A 3 96.9 116.6 ns5-B 3 92.9 111.8 ns5-C 3 94.7 113.9 ns
Site 5 mean 3 94.8 114.1 ns
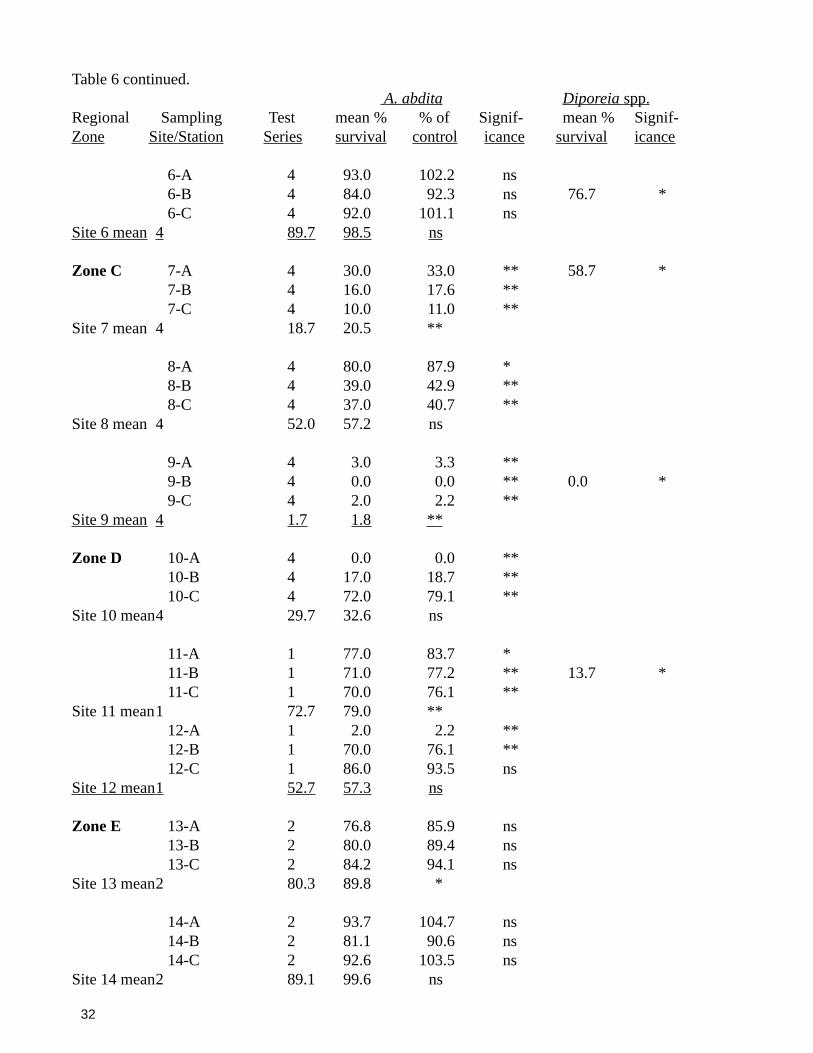
32
Table 6 continued. A. abdita Diporeia spp.
Regional Sampling Test mean % % of Signif- mean % Signif-Zone Site/Station Series survival control icance survival icance
6-A 4 93.0 102.2 ns6-B 4 84.0 92.3 ns 76.7 *6-C 4 92.0 101.1 ns
Site 6 mean4 89.7 98.5 ns
Zone C 7-A 4 30.0 33.0 ** 58.7 *7-B 4 16.0 17.6 **7-C 4 10.0 11.0 **
Site 7 mean 4 18.7 20.5 **
8-A 4 80.0 87.9 *8-B 4 39.0 42.9 **8-C 4 37.0 40.7 **
Site 8 mean 4 52.0 57.2 ns
9-A 4 3.0 3.3 **9-B 4 0.0 0.0 ** 0.0 *9-C 4 2.0 2.2 **
Site 9 mean4 1.7 1.8 **
Zone D 10-A 4 0.0 0.0 **10-B 4 17.0 18.7 **10-C 4 72.0 79.1 **
Site 10 mean4 29.7 32.6 ns
11-A 1 77.0 83.7 *11-B 1 71.0 77.2 ** 13.7 *11-C 1 70.0 76.1 **
Site 11 mean1 72.7 79.0 **12-A 1 2.0 2.2 **12-B 1 70.0 76.1 **12-C 1 86.0 93.5 ns
Site 12 mean1 52.7 57.3 ns
Zone E 13-A 2 76.8 85.9 ns13-B 2 80.0 89.4 ns13-C 2 84.2 94.1 ns
Site 13 mean2 80.3 89.8 *
14-A 2 93.7 104.7 ns14-B 2 81.1 90.6 ns14-C 2 92.6 103.5 ns
Site 14 mean2 89.1 99.6 ns

33
Table 6 continued. A. abdita Diporeia spp.
Regional Sampling Test mean % % of Signif- mean % Signif-Zone Site/Station Series survival control icance survival icance
15-A 5 77.9 78.7 **15-B 5 89.0 89.9 *15-C 5 70.0 70.7 **
Site 15 mean5 79.0 79.8 **
Zone F 16-A 2 61.1 68.2 **16-B 2 26.3 29.4 **16-C 2 30.5 34.1 **
Site 16 mean2 39.3 43.9 **
17-A 1 16.0 17.4 **17-B 1 13.0 14.1 **17-C 1 18.0 19.6 **
Site 17 mean1 15.7 17.0 **
18-A 2 32.6 36.5 **18-B 2 4.2 4.7 ** 55.0 *18-C 2 0.0 0.0 **
Site 18 mean2 12.3 13.7 *
Zone G 19-A 7 82.0 89.1 ns19-B 7 89.0 96.7 ns19-C 7 77.0 83.7 *
Site 19 mean7 82.7 89.8 ns
20-A 9 86.0 87.8 *20-B 9 89.0 90.8 *20-C 9 51.0 52.0 **
Site 20 mean9 75.3 76.9 ns
21-A 7 85.0 92.4 ns21-B 7 84.0 91.3 ns21-C 7 92.0 100.0 ns
Site 21 mean7 87.0 94.6 ns
Zone H 22-A 6 47.1 55.4 **22-B 6 64.3 75.7 ** 25.0 *22-C 6 32.0 37.7 **
Site 22 mean6 47.8 56.3 **
23-A 6 59.2 69.6 ns23-B 6 76.1 89.6 ns23-C 6 65.7 77.3 **
Site 23 mean6 67.0 78.8 **

34
Table 6 continued. A. abdita Diporeia spp.
Regional Sampling Test mean % % of Signif- mean % Signif-Zone Site/Station Series survival control icance survival icance
24-A 5 87.8 88.7 *24-B 7 89.0 96.7 ns24-C 7 89.0 96.7 ns
Site 24 mean5/7 88.6 94.0 ns
Zone I 25-A 9 99.0 101.0 ns 70.0 *25-B 9 93.0 94.9 ns25-C 9 95.0 96.9 ns
Site 25 mean9 95.7 97.6 ns
26-A 7 94.1 102.3 ns26-B 7 93.0 101.0 ns26-C 7 93.0 101.0 ns
Site 26 mean7 93.4 101.4 ns
27-A 9 96.0 98.0 ns27-B 9 95.0 96.9 ns27-C 9 93.0 94.9 ns
Site 27 mean9 94.7 96.6 ns
Zone J 28-A 6 70.3 82.7 ns28-B 6 68.0 80.0 ** 76.2 *28-C 6 66.0 77.6 **
Site 28 mean6 68.1 80.1 *
29-A 10 81.0 88.0 ns29-B 10 85.0 92.4 ns29-C 10 87.0 94.6 ns
Site 29 mean10 84.3 91.7 *
30-A 10 87.0 94.6 ns30-B 10 84.0 91.3 *30-C 10 47.0 51.1 **
Site 30 mean10 72.7 79.0 ns
Zone K 31-A 7 95.0 103.3 ns31-B 7 94.0 102.2 ns31-C 7 94.0 102.2 ns
Site 31 mean7 94.3 102.6 ns
32-A 10 93.0 101.1 ns32-B 10 92.0 100.0 ns32-C 10 86.0 93.5 ns
Site 32 mean10 90.3 98.2 ns

35
Table 6 continued. A. abdita Diporeia spp.
Regional Sampling Test mean % % of Signif- mean % Signif-Zone Site/Station Series survival control icance survival icance
33-A 10 84.0 91.3 ns33-B 10 88.0 95.7 ns33-C 10 88.0 95.7 ns
Site 33 mean10 86.7 94.2 *
Zone L 34-A 7 80.0 87.0 ns34-B 7 3.0 3.3 **34-C 7 27.0 29.3 **
Site 34 mean7 36.7 39.9 ns
35-A 6 58.3 68.6 **35-B 6 73.5 86.4 ns35-C 6 63.4 74.6 **
Site 35 mean6 65.1 76.5 **
36-A 5 92.3 93.2 ns36-B 5 93.0 93.9 *36-C 5 80.4 81.2 *
Site 36 mean5 88.6 89.4 ns
Zone M 37-A 8 95.0 96.9 ns37-B 8 91.0 92.9 ns37-C 8 91.0 92.9 ns
Site 37 mean8 92.3 94.3 *
38-A 8 95.0 96.9 ns 85.0 ns38-B 8 89.0 90.8 ns38-C 8 90.0 91.8 *
Site 38 mean8 91.3 93.2 *
39-A 8 68.0 69.4 **39-B 8 31.0 31.6 **39-C 8 80.0 81.6 *
Site 39 mean8 60.0 60.9 ns
ns - Not significantly different from controls (alpha >0.05).
* - Statistically significantly different from controls (alpha < 0.05).** - Mean response significantly different from controls and 80% or less than control response.
Usually, when all of the stations at a site were determined to be significantly toxic, the site mean alsowas different from the controls. When none of the stations was significantly different from controls, in

36
most cases the site mean also was not different. For example, the sediments from all nine stations inwestern Long Island Sound (sites 4, 5, and 6) were not different from controls. Correspondingly, noneof these three site means was different from controls. Similarly, all nine stations and all three sitemeans in Newark Bay/Arthur Kill were significantly different from controls. However, there weresome deviations from these patterns. For example, all three stations sampled at site 13 were not signifi-cantly different from the controls, but the site mean was significantly different. The same situationoccurred in sites 29, 33, 37. The variances among the five replicates tested for each station were high,but the variances among the three stations sampled at these sites were small, resulting in a significantdifference from the controls. Conversely, all of the stations at sites 10, 20 and 39 were significantlytoxic, but due to high variability among stations, the site means were not different from the controls.
Eight of the nine samples tested with the freshwater amphipod Diporeia spp. by the Great Lakes Envi-ronmental Research Laboratory (Dr. Peter Landrum) were significantly more toxic than controls (Table6). Mean percent survival in Florissant Soil controls ranged from 88.7 to 100 (n=4, 4 or 8 replicateseach). The sample from station 38-A was nontoxic in both amphipod tests. Among the eight samplestoxic to Diporeia spp., seven also were toxic to Ampelisca abdita. Sample 9-B caused zero survivors inboth tests. Avoidance of all but samples 38-A and 6-B was significant relative to controls. Avoidancewas greatest of samples 18-B and 9-B.
The results of the amphipod toxicity tests performed during Phase 2 with 57 samples are summarizedin Table 7. All except 6 samples were tested by SAIC in Narragansett, R. I. Because of the suspectedhazardous condition of samples 7-A, 7-B, 7-C, 8-A, 8-B, and 10, they were tested separately by AquaSurvey, Inc. in Flemington, N. J. Tests organisms used by both SAIC and Aqua Survey were obtainedfrom the same source. In the controls and 6 test samples, water pH ranged from 7.7 to 8.6, temperatureranged from 19.0 to 21.5°C, dissolved oxygen ranged from 5.1 to 7.5 ppm, and salinity ranged from24.0 to 28.5 ppt in the test samples and 29.5 to 32.5 ppt in the LIS controls. The 96-hr LC50 for thereference toxicant, cadmium chloride, was 0.33 mg/L as chloride. Mean survival (n=5) in the LIScontrol was 89±5.8% (range of 85-100%).
The amphipod survival in the control sediments ranged from 79% to 95% in the six test series. Usually,acceptable amphipod survival in controls is 85% or greater. However, the data from test series 5, inwhich survival was 79%, were accepted since survival in all the test samples was either very high orvery low. The results would not have changed significantly if the samples had been retested.
Amphipod survival ranged from 0.0% in two samples to 100% in one sample (Table 7). In 48 (84%) ofthe 57 samples that were tested, mean amphipod survival was 80% of controls or less. In 46 (96%) ofthe 48 samples in which amphipod survival was 80% of controls or less, the results were significantlydifferent from the controls.
Table 7. Mean percent amphipod (A. abdita) survival in the 1993 Newark Bay survey performedduring Phase 2.
Mean % SignificantlyStation Test survival Percent less than control <80% ofNumber Series ± std. dev. of Control (alpha=0.05) Control
LIS Control 1a 95.0±5.0 100 - -LIS Control 2a 95.0±5.0 100 - -
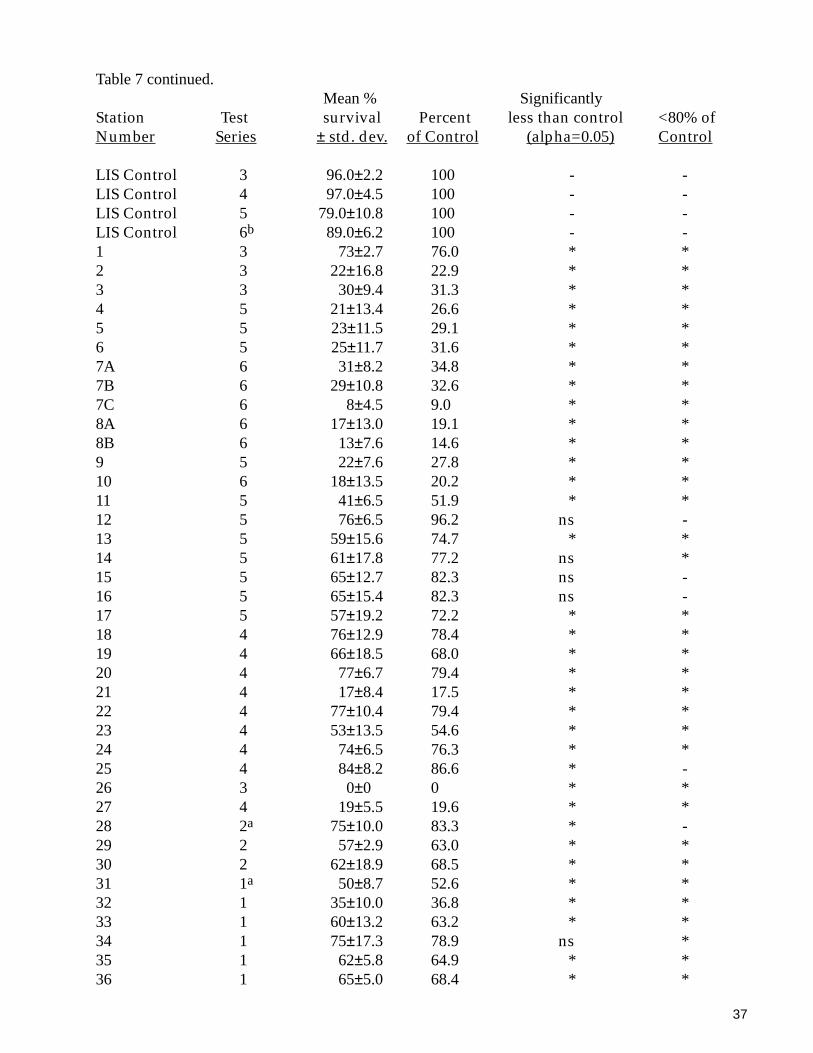
37
Table 7 continued.Mean % Significantly
Station Test survival Percent less than control <80% ofNumber Series ± std. dev. of Control (alpha=0.05) Control
LIS Control 3 96.0±2.2 100 - -LIS Control 4 97.0±4.5 100 - -LIS Control 5 79.0±10.8 100 - -LIS Control 6b 89.0±6.2 100 - -1 3 73±2.7 76.0 * *2 3 22±16.8 22.9 * *3 3 30±9.4 31.3 * *4 5 21±13.4 26.6 * *5 5 23±11.5 29.1 * *6 5 25±11.7 31.6 * *7A 6 31±8.2 34.8 * *7B 6 29±10.8 32.6 * *7C 6 8±4.5 9.0 * *8A 6 17±13.0 19.1 * *8B 6 13±7.6 14.6 * *9 5 22±7.6 27.8 * *10 6 18±13.5 20.2 * *11 5 41±6.5 51.9 * *12 5 76±6.5 96.2 ns -13 5 59±15.6 74.7 * *14 5 61±17.8 77.2 ns *15 5 65±12.7 82.3 ns -16 5 65±15.4 82.3 ns -17 5 57±19.2 72.2 * *18 4 76±12.9 78.4 * *19 4 66±18.5 68.0 * *20 4 77±6.7 79.4 * *21 4 17±8.4 17.5 * *22 4 77±10.4 79.4 * *23 4 53±13.5 54.6 * *24 4 74±6.5 76.3 * *25 4 84±8.2 86.6 * -26 3 0±0 0 * *27 4 19±5.5 19.6 * *28 2a 75±10.0 83.3 * -29 2 57±2.9 63.0 * *30 2 62±18.9 68.5 * *31 1a 50±8.7 52.6 * *32 1 35±10.0 36.8 * *33 1 60±13.2 63.2 * *34 1 75±17.3 78.9 ns *35 1 62±5.8 64.9 * *36 1 65±5.0 68.4 * *

38
Table 7 continued.Mean % Significantly
Station Test survival Percent less than control <80% ofNumber Series ± std. dev. of Control (alpha=0.05) Control
37 1 55±5.0 57.9 * *38 1 53±20.2 56.1 * *39B 1 68±7.6 71.9 * *40B 2 78±10.4 87.0 ns -41 2 87±7.6 96.3 ns -42C 2 70±5.0 77.8 * *43 No sample collected44 2 60±5.0 66.7 * *45 No sample collected46 3 8±17.9 8.3 * *47 3 0±0 0 * *48 1 57±12.6 59.6 * *49 1 18±10.4 19.3 * *50 3 35±6.1 36.5 * *51 2 70±5.0 77.8 * *52 3 22±14.0 22.9 * *53 No sample collected54 3 31±5.5 32.3 * *55 3 2±4.5 2.1 * *56 2 75±15.0 83.3 ns -57 2 100±0.0 111.1 ns -
a Tests of each sample in series 1 and 2 were tested with three replicates, instead of the usualfive replicates tested in all of the other samples.b Samples in series 6 were tested by Aqua Survey, Inc.
Amphipod survival was very low in the samples from much of the lower Passaic River and through-out Newark Bay (Figure 8). Samples that were toxic to amphipods were collected throughout thePhase 2 study area. The six samples from the lower Hackensack River were less toxic to the amphi-pods than those from the lower Passaic River. Two samples—one from central Newark Bay and onefrom the upper Arthur Kill—caused zero percent survival. In contrast, the sediment from station 57 inupper New York Harbor was not toxic in this test. Station 57 in Phase 2 and site 14 in Phase 1 werelocated at the same coordinates and were not toxic to amphipod survival in either phase.
Elutriate/Liquid Phase Bivalve Larvae Tests. The sediments from 109 of the 117 stations weretested with the larvae of Mulinia lateralis. Insufficient material from 8 stations remained following theperformance of the amphipod and Microtox tests to allow performance of the bivalve embryo tests.Percent survival and percent normal morphological development were measured. Percent survival andpercent normal development data (as decimal equivalents) for each station (n=5) were arcsin-squareroot transformed and evaluated with one-tailed, unpaired, t-tests to determine statistically significantdifferences from the respective controls (n=5, alpha=0.05). To determine if the mean percent survivalat any sites (n=3) were significantly different from mean survival in controls, the untransformed datawere evaluated with one-tailed t-tests (alpha=0.05).

39
1
2
3
4
56
7A7B
7C
8A
8B9
10
11
17
16
15
1413
12
18
19
2829
30
20
21 22
23 2425
2627
3132
37
33
343538
3639B
40B
4142C
57
5655
49 5450
5152
48
47
46
44
Staten Island
UpperNew YorkHarbor
Pas
saic
Riv
er
Percent Amphipod Survival
Significantly Toxic (p < .05)
Highly Toxic (< 80 % Survival)
Non-toxic (p>.05)
0.0 % Survival
NewarkBay
ArthurKill
Hacke
nsac
k Riv
er
∆
∆
∆
Figure 8. Distribution of stations in Newark Bay and vicinity that were toxic, highly toxic, and non-toxic in amphipod (A. abdita) survival tests.

40
Results of tests of seawater controls and Central Long Island Sound control sediments are followed bythe results of the tests from each study site (Table 8). Data from test samples are listed as percent ofcontrols for both end-points. Stations and sites that were significantly different from the respectiveCLIS controls (t-tests, alpha = 0.05) are indicated with asterisks and those that, additionally, were 80%or less than the control response are listed with two asterisks. Tests were performed in a series of sevenbatches of samples. Several unavoidable problems were encountered after the samples were collected,necessitating the storage of the samples for 93 to 175 days before the tests were initiated, well beyondthe normal allowable storage time of 14 days. The long holding times may have caused some changesin the toxicity of the samples, but do not, alone, invalidate the results.
As observed in the amphipod percent survival data, survival of bivalve larvae was >80% of controls inthe majority of the stations. Percent survival relative to controls ranged from 17.6% in sediments fromstation 39-B to >100% in many samples. Several samples caused 20-30% survival. In 29 of the sitesthe results from all samples that were tested indicated agreement as to toxic or nontoxic conditionswithin the site. In some samples (e.g., station 18-A) variability was very high among the laboratoryreplicates, and as a consequence, no statistically significant difference was observed from controls.Also, in a few cases variance among stations was relatively small, and despite relatively high meanpercent survival, there was a significant difference from the control. Station means that were 80% ofcontrols or less were frequently (21 of 29 samples, 72.4%) significantly different from controls.
Percent larvae survival was significantly lower than controls in sediments from 23 of 109 stations(21%) and 7 of 39 sites (18%) (Table 8). Percent survival was significantly lower than controls, and inaddition, less than 80% of controls in 21 stations and 4 sites. Based upon this test, toxicity was highestin sediments from site 6 (western Long Island Sound), site 7 (upper East River), site 11 (lower EastRiver), site 17 (mouth of Newark Bay), site 20 (lower Raritan River), site 30 (Sandy Hook Bay), andsite 37 (mouth of the estuary). At least one of the stations and the site mean were significantly differentfrom controls at these sites. Toxicity generally was lowest in sediments from the lower Hudson River,western Long Island Sound, lower New York Harbor, and much of Raritan Bay.
Percent normal embryo development ranged from 0.0% in samples from Site 30 to >100% in numer-ous samples (Table 8). Between 90% to 100% normal development occurred in 47 of the samples.Percent normal development was significantly lower than controls in sediments from 21 of 109 sta-tions (19%) and 6 of 39 sites (15%). Also, percent normal development was significantly lower thancontrols, and additionally, less than 80% of controls in 19 of the samples and 4 of the sites. Based uponthis test end-point, toxicity was highest in sediments from sites 5 and 6 (western Long Island Sound),site 7 (upper East River), and 30 (Sandy Hook Bay). At least one of the stations and the site mean weresignificantly different from controls at these sites. Toxicity generally was lowest in sediments from thelower Hudson River, upper and lower New York Harbor, and much of Raritan Bay.
Both end-points of this test indicated that sediments from sites 6, 7 and 30 were significantly toxic(Table 8). Based upon the t-tests, the data from the two tests indicated 95 of the same stations wereeither nontoxic or toxic. Also, based upon the results of the t-tests, the two end-points indicated agree-ment on the presence and absence of toxicity in 30 of 39 sites. At 32 of the 39 sites both survival andnormal development were either greater than 80% or both were less than 80% of controls. Sedimentsfrom some stations (e.g., 7-A, 7-B, 34-B, 39-B) were highly toxic to both end-points.

41
Table 8. Mean percent survival and normal morphological development (expressed as percent ofcontrols) in 48-hour tests of elutriates with the larvae of Mulinia lateralis.
Regional Sampling Test Percent PercentZone Site/station Series Survivala Normal
SEAWATER CONTROL 1 98.6 81.02 74.1 99.33 100.9 99.24 97.7 99.65 95.0 92.66 88.0 100.07 89.0 98.2
CLIS CONTROL 1 81.1 95.72 91.2 99.13 73.4 98.34 94.1 100.05 87.0 99.76 84.0 100.07 91.5 99.2
Zone A 1-A 3 105.7 101.71-B 3 121.1 101.71-C 3 117.3 101.7
Site 1 mean 114.1 101.7
2-A 3 100.0 101.72-B 3 135.6 101.72-C 3 nd nd
Site 2 mean 117.8 101.7
3-A 2 94.8 99.53-B 2 99.5 100.93-C 2 103.4 99.9
Site 3 mean 99.2 100.1Zone B 4-A 4 89.5 95.6
4-B 4 71.1 92.24-C 4 88.8 94.7
Site 4 mean 83.1 94.2*
5-A 4 82.3 23.2**5-B 4 93.7 37.3**5-C 4 55.9** 12.0**
Site 5 mean 77.3 24.2**
6-A 4 75.7** 85.0*6-B 4 56.6** 46.5**6-C 4 59.2** 37.6**
Site 6 mean4 63.8** 56.4**

42
Table 8 continued.Regional Sampling Test Percent PercentZone Site/station Series Survivala Normal
Zone C 7-A 4 40.2** 10.5**7-B 4 22.4** 2.8**7-C 4 51.8** 10.9**8-A 4 81.0* 92.48-B 4 99.4 44.5**8-C 4 60.6** 93.2
Site 8 mean 80.3 76.7
9-A 5 99.1 100.39-B 5 82.4 87.49-C 5 92.0 100.3
Site 9 mean 91.2 96.0Zone D 10-A 5 24.6** 13.3**
10-B 5 53.5** 12.7**10-C 5 83.4 93.0
Site 10 mean 53.8 39.7
11-A 2 88.0 100.311-B 2 76.1** 97.911-C 2 88.0 94.3*
Site 11 mean 84.0* 97.5
12-A 1 118.9101.812-B 1 97.8 97.812-C 1 73.5 34.8**
Site 12 mean 96.7 78.1
Zone E 13-A 3 110.5 100.713-B nd nd13-C 3 71.1 101.7
Site 13 mean 90.8 101.2
14-A 3 127.8 101.014-B 3 132.7 100.914-C 3 95.1 100.1
Site 14 mean 118.5 100.7
15-A 5 89.8 98.115-B 5 88.6 95.815-C 5 88.5 100.3
Site 15 mean 89.0* 98.1

43
Table 8 continued.Regional Sampling Test Percent PercentZone Site/station Series Survivala Normal
Zone F 16-A 3 139.4 101.716-B 3 122.1 101.016-C 3 143.2 100.3
Site 16 mean 134.9 101.0
17-A 2 75.5 99.117-B 2 74.5** 100.917-C 2 53.4** 95.6
Site 17 mean 67.8** 98.5
18-A 2 65.9 99.618-B 2 112.0 99.018-C 2 97.7 99.1
Site 18 mean 91.9 99.2*Zone G 19-A 6 96.0 98.5
19-B 6 109.7 99.819-C 6 96.0 99.3
Site 19 mean 100.6 99.2
20-A 7 96.9 100.120-B 7 94.5 100.820-C 7 91.5* 100.0
Site 20 mean 94.3* 100.3
21-A 6 102.1 100.021-B 6 119.8100.021-C 6 108.4 100.0
Site 21 mean 110.1100.0
Zone H 22-A 5 95.6 99.522-B 5 92.0 nd22-C 5 68.4 63.2
Site 22 mean 85.3 87.7
23-A 5 97.7 98.223-B 5 87.0 90.023-C 5 87.5 99.8
Site 23 mean 90.7 96.0
24-A 5 82.4 83.624-B nd nd24-C 5 111.1 99.1
Site 24 mean 96.7 91.3

44
Table 8 continued.Regional Sampling Test Percent PercentZone Site/station Series Survivala Normal
Zone I 25-A 7 112.9100.825-B 7 102.3 100.825-C 7 119.3100.8
Site 25 mean 111.5100.826-A 7 71.3** 17.6**26-B 7 113.1 100.826-C 7 104.6 100.8
Site 26 mean 96.3 73.1
27-A 7 77.5 100.827-B 7 95.3 99.927-C 7 90.7 99.0
Site 27 mean 87.8 99.9Zone J 28-A 6 97.9 100.0
28-B nd nd28-C nd nd
Site 28 mean 97.9 100.029-A 6 110.4 93.729-B 6 91.2 55.2**29-C 6 109.5 100.3
Site 29 mean 103.7 82.8
30-A 6 70.1** 0.0**30-B 6 73.5** 0.0**30-C nd nd
Site 30 mean 71.8** 0.0**Zone K 31-A 7 98.5 100.8
31-B 7 116.3 100.831-C 7 94.5 100.8
Site 31 mean 103.1 100.8
32-A 6 102.1 100.032-B 6 105.7 97.832-C 6 118.4 98.3
Site 32 mean 108.7 98.7
33-A 6 118.4 100.033-B 6 115.7 99.333-C 6 105.5 100.0
Site 33 mean 113.3 99.8Zone L 34-A nd nd
34-B 5 50.2* 20.934-C 89.5 98.2
Site 34 mean 69.9 59.5

45
Table 8 continued.Regional Sampling Test Percent PercentZone Site/station Series Survivala Normal
35-A 6 115.0 99.535-B nd35-C 6 119.9 100.0
Site 35 mean 117.4 99.8
36-A 5 78.4 72.436-B 5 97.7 99.636-C 5 79.4 85.6
Site 36 mean 85.2 85.9Zone M 37-A 7 73.4** 100.8
37-B 7 92.7 100.637-C 7 81.9 72.0
Site 37 mean 82.7* 91.1
38-A 7 96.9 100.538-B 7 97.7 100.038-C 7 80.7 99.7
Site 38 mean 91.8 100.1
39-A 7 60.7** 6.7**39-B 7 17.6** 11.5**39-C 7 95.3 100.5
Site 39 mean 57.9 39.6
a Percent survival relative to seawater controls.* Significantly different from controls (t-test, alpha = 0.05).** Significantly different from controls and 80% or less than the control response.
The spatial patterns in toxicity for the two end-points of this test are illustrated in Figures 9 through 12.As with the pattern seen in the Ampelisca abdita survival test, the bivalve larvae survival test indicatedrelatively high toxicity in the upper East River stations, diminishing eastward into western Long IslandSound (Figure 9). Also, samples from Kill van Kull (site 17), inner Sandy Hook Bay (site 30), and twooffshore sites (37 and 39) were toxic in this test. Based upon the site means, toxicity in this test washigh in sites 6, 7, 17, and 30 (Figure 10).
The percent normal development end-point also indicated high toxicity in sediments from sites 5-8 inthe upper East River and western Long Island Sound (Figure 11). However, toxicity to this test did notdiminish nearly as much into western Long Island Sound as in the amphipod and bivalve survival tests.Sediments from sites 4 and 5 were more toxic to bivalve normal development than to amphipod orbivalve embryo survival. The very high toxicity indicated by the amphipod survival test in the NewarkBay/Arthur Kill area (sites 16-18) was not as apparent in the bivalve larvae development tests. Sedi-ments from site 16 at the head of Newark Bay were very toxic to amphipods, but not to bivalve larvae.Site 17 sediments were toxic in the survival test, but not in the development test.

46
1
2
3
4
5
6
789
10
11
12
13
14
15
16
17
18
19
20
21
22
23
2425
26
27
28
29
30
3132
33
34
35
36
37
38
39
Figure 9. Sampling stations in which the sediment elutriates were significantly toxic to Mulinia lateralis larvae survival (n=5, alpha <0.05).
Non-toxic stations
Stations significantly differentfrom controlsStations significantly differentfrom controls and <80% ofcontrol response

47
1
2
3
4
5
6
789
10
11
12
13
14
15
16
17
18
19
20
21
22
23
2425
26
27
28
29
30
3132
33
34
35
36
37
38
39
Figure 10. Sampling sites in which the sediment elutriates were significantly toxic toMulinia lateralis larvae survival (average of three stations, alpha <0.05).
Non-toxic sites
Sites significantly differentfrom controls
Sites significantly differentfrom controls and <80% ofcontrol response

48
1
2
3
4
5
6
789
10
11
12
13
14
15
16
17
18
19
20
21
22
23
2425
26
27
28
29
30
3132
33
34
35
36
37
38
39
Figure 11. Sampling stations in which the sediment elutriates were significantly toxic to Mulinia lateralis larvae normal development (n=5, alpha <0.05).
Non-toxic stations
Stations significantly differentfrom controls
Stations significantly differentfrom controls and <80% ofcontrol response
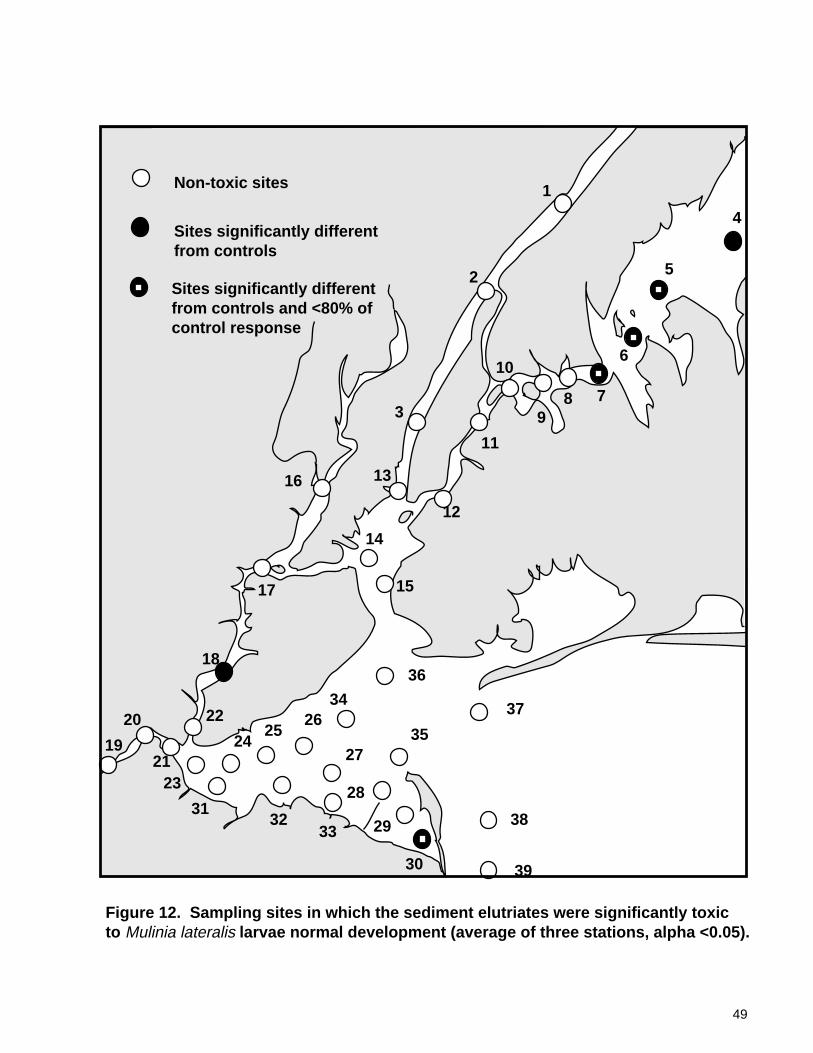
49
1
2
3
4
5
6
789
10
11
12
13
14
15
16
17
18
19
20
21
22
23
2425
26
27
28
29
30
3132
33
34
35
36
37
38
39
Figure 12. Sampling sites in which the sediment elutriates were significantly toxic to Mulinia lateralis larvae normal development (average of three stations, alpha <0.05).
Non-toxic sites
Sites significantly differentfrom controls
Sites significantly differentfrom controls and <80% ofcontrol response

50
Toxicity to bivalve development was not nearly as high in lower Raritan River sediments (site 20) as inthe amphipod test. All three of the stations at site 39 were significantly toxic to amphipods and two ofthe three were toxic to both end-points of the bivalve larvae test, but the site mean was not significantlydifferent from controls in any of the three test end-points. Two of the three samples from site 30 inSandy Hook Bay were toxic to all three test end-points and toxicity diminished northeastward out intolower New York Harbor.
Microbial Bioluminescence Tests of Organic-Extracts. An initial range-finding experiment wasconducted with sediments previously tested with the amphipods. Each of the sediments that indicatedhigh, intermediate, and low toxicity to the amphipods were tested with three sediment concentrations(3, 10, and 15 g wet weight of sediment) to provide a dilution series. This experiment showed thatextracts from 3 g of sediments were sufficient to cause a 50% reduction in light output by the Microtoxtm
bacteria. In addition, separation and precipitation of extract phases occurred in the vials during theextraction procedures with the 10 and 15 g extracts from both the intermediate and high toxicity samples.These results indicated that the 10 and 15 g concentrations were too high and would lead to spuriouslight attenuation. A total of 116 of the 117 sediment samples was tested with Microtoxtm. The sedi-ment concentrations (EC50s) that caused 50% light inhibition were determined, along with the 95%confidence limits, for the Central Long Island Control and each test sediment. Duplicate tests were runfor each sample. Mean EC50 values (mg sediment/mL) and the 95% confidence intervals are listed inTable 9. Samples that were significantly different from controls are listed with one asterisk. Thosesamples in which the mean EC50 was 80% or less of the control are listed with two asterisks.
The mean EC50s of the two tests of the controls were 2.02 and 2.1 mg/mL (Table 9). Of the 116samples that were tested, 47 (41%) were significantly toxic (i.e., different from controls) in this test.Many of the samples (32) caused EC50 values of 1.6 mg/mL or less (80% of controls). However, insome cases the test samples were less toxic than the CLIS controls (as indicated by EC50 values greaterthan 2.1). This test indicated that 19 of the 39 sites (49%) were significantly different from controls.The mean EC50s for 14 sites were significantly different from controls and 80% of the control re-sponse or less.
All three of the sites in zones C and D were significantly different from controls, whereas none of thesites in zones A, G, and M were toxic in this test. Stations 6-C, 9-B, 28-A, and 36-B were the mosttoxic, as indicated by the lowest mean EC50s. All but one of the nine stations in zone B (western LongIsland Sound), and zone D (lower East River) were different from controls in this test. None of thestations in zone A (lower Hudson River) and zone M (New York Bight) were toxic, and only one eachin zone E (Upper New York Harbor) and zone L (Lower New York Harbor) was different from con-trols.
Table 9. Results of Microtoxtm tests of microbial bioluminescence in organic extracts of sedi-ments; mean EC50’s (n=2) and 95% confidence intervals for stations, and mean EC50’s (n=3) forsites.
Regional Sampling Mean EC50 95% ConfidenceZone Site/station (mg/mL) Interval
CLIS Control 1 2.02 2.00-2.032 2.11 2.01-2.16Mean 2.06 n/a
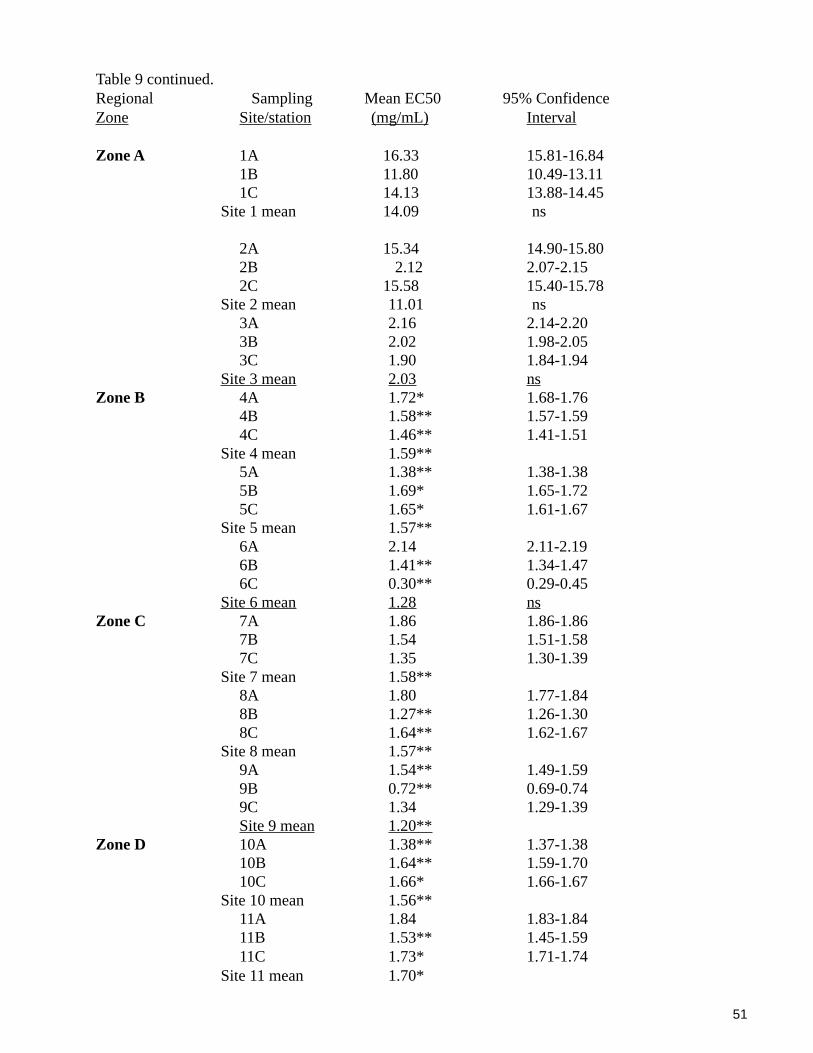
51
Table 9 continued.Regional Sampling Mean EC50 95% ConfidenceZone Site/station (mg/mL) Interval
Zone A 1A 16.33 15.81-16.841B 11.80 10.49-13.111C 14.13 13.88-14.45
Site 1 mean 14.09 ns
2A 15.34 14.90-15.802B 2.12 2.07-2.152C 15.58 15.40-15.78
Site 2 mean 11.01 ns3A 2.16 2.14-2.203B 2.02 1.98-2.053C 1.90 1.84-1.94
Site 3 mean 2.03 nsZone B 4A 1.72* 1.68-1.76
4B 1.58** 1.57-1.594C 1.46** 1.41-1.51
Site 4 mean 1.59**5A 1.38** 1.38-1.385B 1.69* 1.65-1.725C 1.65* 1.61-1.67
Site 5 mean 1.57**6A 2.14 2.11-2.196B 1.41** 1.34-1.476C 0.30** 0.29-0.45
Site 6 mean 1.28 nsZone C 7A 1.86 1.86-1.86
7B 1.54 1.51-1.587C 1.35 1.30-1.39
Site 7 mean 1.58**8A 1.80 1.77-1.848B 1.27** 1.26-1.308C 1.64** 1.62-1.67
Site 8 mean 1.57**9A 1.54** 1.49-1.599B 0.72** 0.69-0.749C 1.34 1.29-1.39Site 9 mean 1.20**
Zone D 10A 1.38** 1.37-1.3810B 1.64** 1.59-1.7010C 1.66* 1.66-1.67
Site 10 mean 1.56**11A 1.84 1.83-1.8411B 1.53** 1.45-1.5911C 1.73* 1.71-1.74
Site 11 mean 1.70*

52
Table 9 continued.Regional Sampling Mean EC50 95% ConfidenceZone Site/station (mg/mL) Interval
12A 1.51** 1.35-1.6212B 1.48** 1.45-1.5012C 1.48** 1.44-1.49
Site 12 mean 1.49**Zone E 13A 1.68 1.58-1.75
13B 2.28 2.25-2.3313C 1.86 1.60-2.07
Site 13 mean 1.94 ns14A 22.23 20.93-23.5914B 11.27 11.19-11.3614C 7.23 6.90-7.55
Site 14 mean 13.58 ns15A 1.57 1.48-1.6515B 1.87 1.86-1.8915C 1.69* 1.69-1.69
Site 15 mean 1.71*Zone F 16A 2.05 2.03-2.07
16B 1.75* 1.73-1.7616C 1.59** 1.58-1.61
Site 16 mean 1.80 ns17A 1.35 1.25-1.4517B 1.33 1.31-1.3417C 1.49 1.44-1.51
Site 17 mean 1.39**18A 1.76 1.69-1.8018B 1.46** 1.45-1.4818C 1.81 1.61-1.89Site 18 mean 1.68*
Zone G 19A 2.38 2.37-2.3819B 1.82* 1.80-1.8319C 1.79* 1.79-1.79
Site 19 mean 2.00 ns20A 2.39 2.31-2.4420B 1.85 1.78-1.8920C 1.73 1.71-1.75
Site 20 mean 1.99 ns21A 1.72* 1.70-1.7421B 1.65 1.64-1.6621C 2.32 2.23-2.42Site 21 mean 1.90 ns
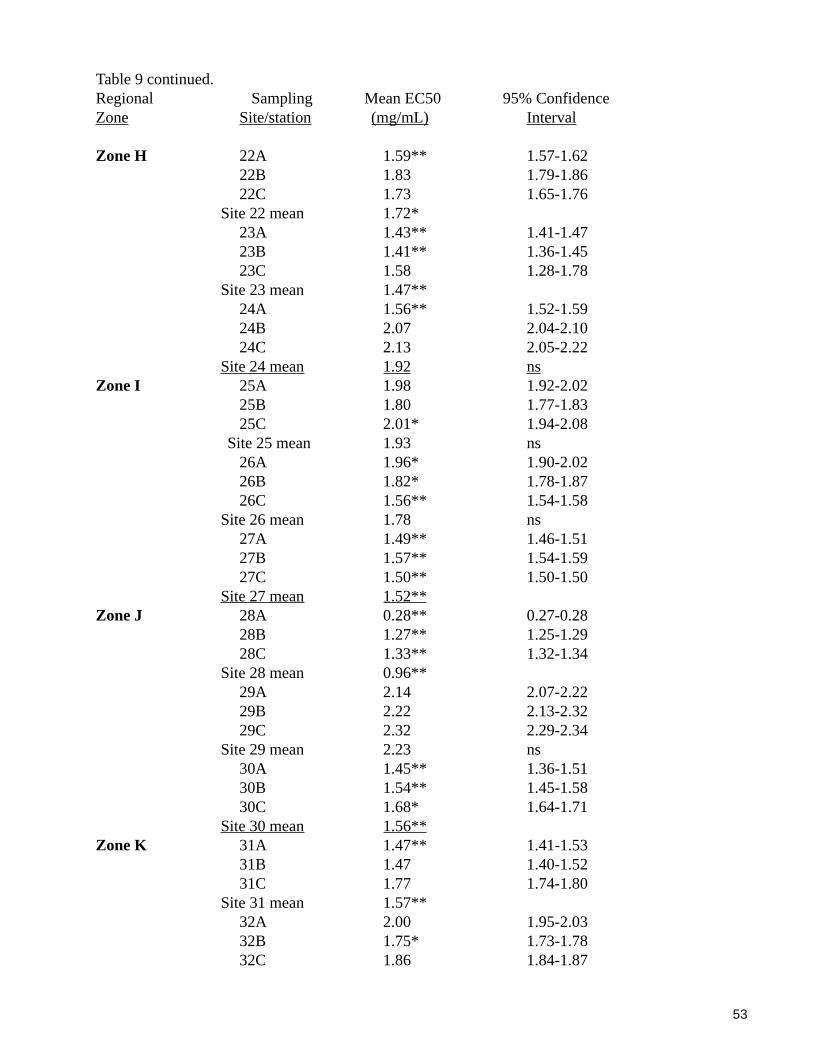
53
Table 9 continued.Regional Sampling Mean EC50 95% ConfidenceZone Site/station (mg/mL) Interval
Zone H 22A 1.59** 1.57-1.6222B 1.83 1.79-1.8622C 1.73 1.65-1.76
Site 22 mean 1.72*23A 1.43** 1.41-1.4723B 1.41** 1.36-1.4523C 1.58 1.28-1.78
Site 23 mean 1.47**24A 1.56** 1.52-1.5924B 2.07 2.04-2.1024C 2.13 2.05-2.22
Site 24 mean 1.92 nsZone I 25A 1.98 1.92-2.02
25B 1.80 1.77-1.8325C 2.01* 1.94-2.08
Site 25 mean 1.93 ns26A 1.96* 1.90-2.0226B 1.82* 1.78-1.8726C 1.56** 1.54-1.58
Site 26 mean 1.78 ns27A 1.49** 1.46-1.5127B 1.57** 1.54-1.5927C 1.50** 1.50-1.50
Site 27 mean 1.52**Zone J 28A 0.28** 0.27-0.28
28B 1.27** 1.25-1.2928C 1.33** 1.32-1.34
Site 28 mean 0.96**29A 2.14 2.07-2.2229B 2.22 2.13-2.3229C 2.32 2.29-2.34
Site 29 mean 2.23 ns30A 1.45** 1.36-1.5130B 1.54** 1.45-1.5830C 1.68* 1.64-1.71
Site 30 mean 1.56**Zone K 31A 1.47** 1.41-1.53
31B 1.47 1.40-1.5231C 1.77 1.74-1.80
Site 31 mean 1.57**32A 2.00 1.95-2.0332B 1.75* 1.73-1.7832C 1.86 1.84-1.87

54
Table 9 continued.Regional Sampling Mean EC50 95% ConfidenceZone Site/station (mg/mL) Interval
Site 32 mean 1.87 ns33A 2.00 1.95-2.0533B 1.45** 1.42-1.4833C 2.44 2.38-2.52
Site 33 mean 1.96 nsZone L 34A 1.56 1.29-1.77
34B 2.10 1.96-2.2234C 2.61 2.60-2.61
Site 34 mean 2.09 ns35A 1.79 1.76-1.8235B no data35C 1.78 1.76-1.80
Site 35 mean 1.79*36A 1.57 1.54-1.6036B 1.03** 0.95-1.1236C 1.50 1.44-1.58
Site 36 mean 1.37**Zone M 37A >29.80 n/a
37B >32.60 n/a37C >29.60 n/a
Site 37 mean >30.77 ns38A 20.12 19.99-20.1938B 21.55 21.10-22.1238C 22.00 21.85-22.17
Site 38 mean 21.22 ns39A 2.45 2.41-2.4839B 2.61 2.59-2.6439C 17.89 17.49-18.29
Site 39 mean 7.65 ns
* Station or site mean significantly different from controls (alpha=0.05).** Mean response significantly different from controls and 80% or less than control response.ns Mean response not significantly different from controls.
The data from this test indicated several spatial patterns in toxicity among the stations and sites (Fig-ures 13 and 14). Many of the stations and sites in the lower East River, upper East River, and westernLong Island Sound were toxic, whereas none were toxic in the adjacent lower Hudson River and onlyone was toxic in the upper New York Harbor. Second, many of the stations and sites in Arthur Kill,western Raritan Bay, central Raritan Bay, and Sandy Hook Bay were toxic, whereas only one of thestations in adjacent lower New York Harbor and outer bay/New York Bight was toxic. Also, none ofthe three sites in lower Raritan River was toxic. There was considerable heterogeneity in toxicitywithin Raritan Bay, but not in the outer bay/New York Bight, where all samples and sites were non-toxic.
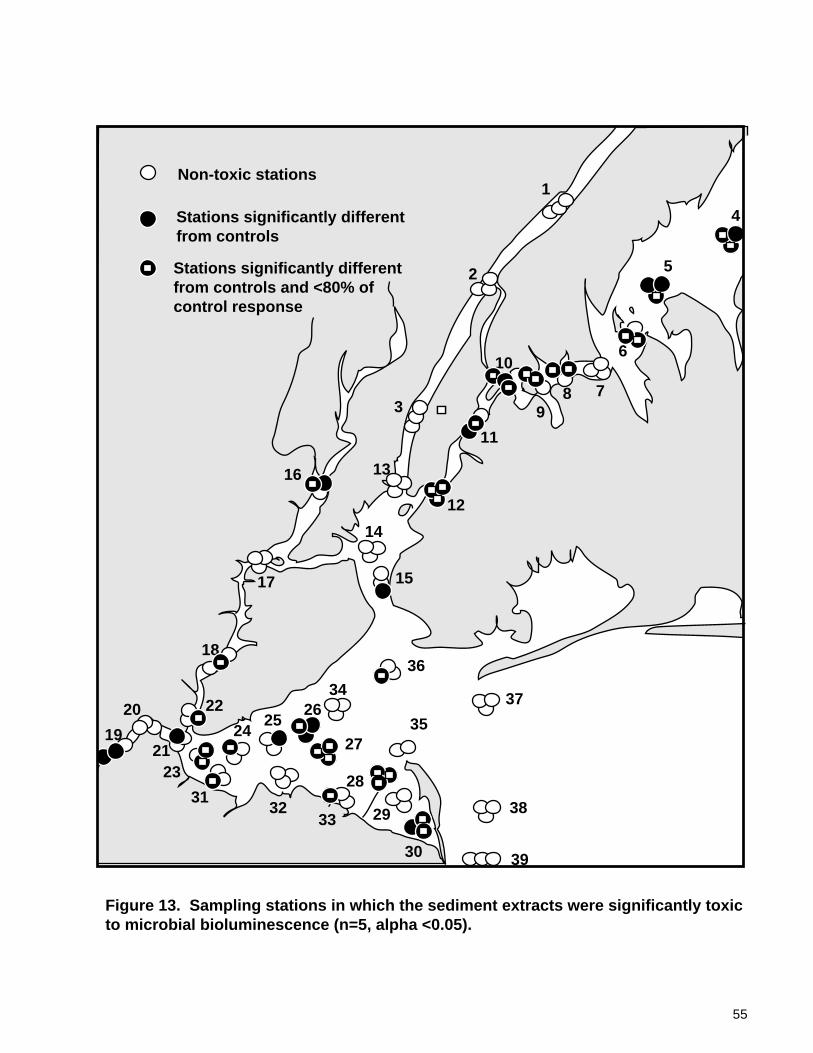
55
1
2
3
4
5
6
789
10
11
12
13
14
15
16
17
18
19
20
21
22
23
2425
26
27
28
29
30
3132
33
34
35
36
37
38
39
Figure 13. Sampling stations in which the sediment extracts were significantly toxic to microbial bioluminescence (n=5, alpha <0.05).
Stations significantly differentfrom controls
Non-toxic stations
Stations significantly differentfrom controls and <80% ofcontrol response

56
1
2
3
4
5
6
789
10
11
12
13
14
15
16
17
18
19
20
21
22
23
2425
26
27
28
29
30
3132
33
34
35
36
37
38
39
Figure 14. Sampling sites in which the sediment extracts were significantly toxic tomicrobial bioluminescence (average of three stations, alpha <0.05).
Sites significantly differentfrom controls
Non-toxic sites
Sites significantly differentfrom controls and <80% ofcontrol response
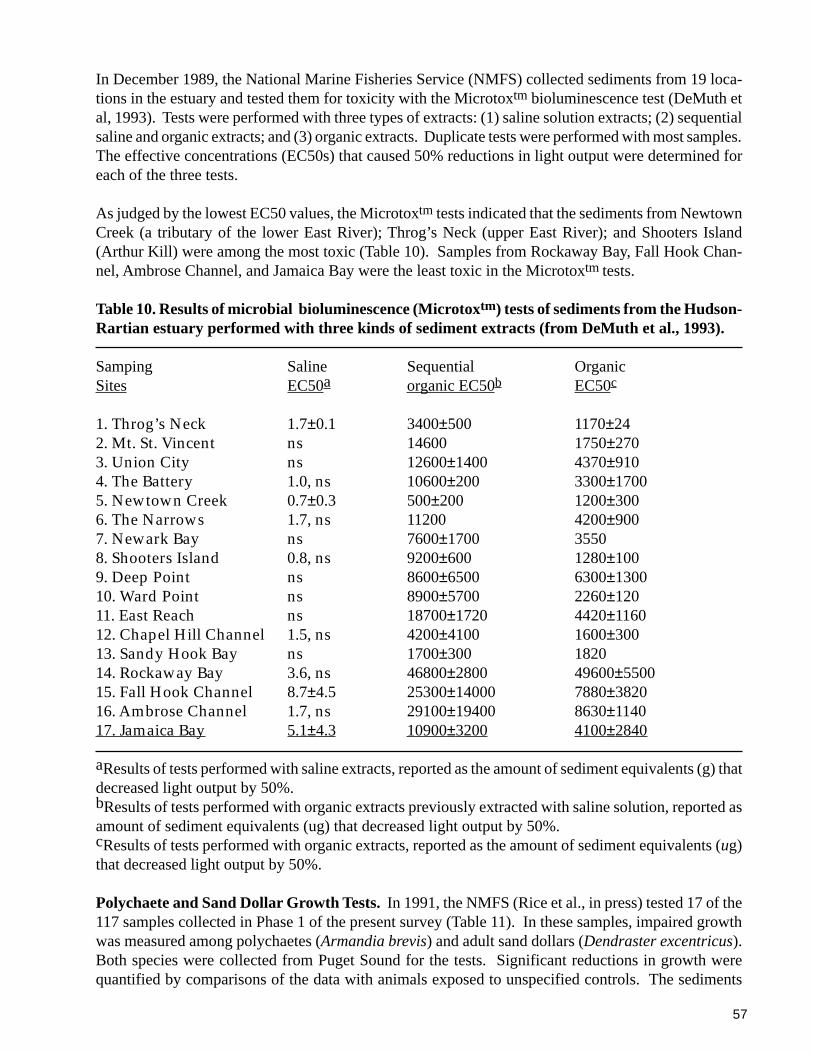
57
In December 1989, the National Marine Fisheries Service (NMFS) collected sediments from 19 loca-tions in the estuary and tested them for toxicity with the Microtoxtm bioluminescence test (DeMuth etal, 1993). Tests were performed with three types of extracts: (1) saline solution extracts; (2) sequentialsaline and organic extracts; and (3) organic extracts. Duplicate tests were performed with most samples.The effective concentrations (EC50s) that caused 50% reductions in light output were determined foreach of the three tests.
As judged by the lowest EC50 values, the Microtoxtm tests indicated that the sediments from NewtownCreek (a tributary of the lower East River); Throg’s Neck (upper East River); and Shooters Island(Arthur Kill) were among the most toxic (Table 10). Samples from Rockaway Bay, Fall Hook Chan-nel, Ambrose Channel, and Jamaica Bay were the least toxic in the Microtoxtm tests.
Table 10. Results of microbial bioluminescence (Microtoxtm) tests of sediments from the Hudson-Rartian estuary performed with three kinds of sediment extracts (from DeMuth et al., 1993).
Samping Saline Sequential OrganicSites EC50a organic EC50b EC50c
1. Throg’s Neck 1.7±0.1 3400±500 1170±242. Mt. St. Vincent ns 14600 1750±2703. Union City ns 12600±1400 4370±9104. The Battery 1.0, ns 10600±200 3300±17005. Newtown Creek 0.7±0.3 500±200 1200±3006. The Narrows 1.7, ns 11200 4200±9007. Newark Bay ns 7600±1700 35508. Shooters Island 0.8, ns 9200±600 1280±1009. Deep Point ns 8600±6500 6300±130010. Ward Point ns 8900±5700 2260±12011. East Reach ns 18700±1720 4420±116012. Chapel Hill Channel 1.5, ns 4200±4100 1600±30013. Sandy Hook Bay ns 1700±300 182014. Rockaway Bay 3.6, ns 46800±2800 49600±550015. Fall Hook Channel 8.7±4.5 25300±14000 7880±382016. Ambrose Channel 1.7, ns 29100±19400 8630±114017. Jamaica Bay 5.1±4.3 10900±3200 4100±2840
aResults of tests performed with saline extracts, reported as the amount of sediment equivalents (g) thatdecreased light output by 50%.bResults of tests performed with organic extracts previously extracted with saline solution, reported asamount of sediment equivalents (ug) that decreased light output by 50%.cResults of tests performed with organic extracts, reported as the amount of sediment equivalents (ug)that decreased light output by 50%.
Polychaete and Sand Dollar Growth Tests. In 1991, the NMFS (Rice et al., in press) tested 17 of the117 samples collected in Phase 1 of the present survey (Table 11). In these samples, impaired growthwas measured among polychaetes (Armandia brevis) and adult sand dollars (Dendraster excentricus).Both species were collected from Puget Sound for the tests. Significant reductions in growth werequantified by comparisons of the data with animals exposed to unspecified controls. The sediments
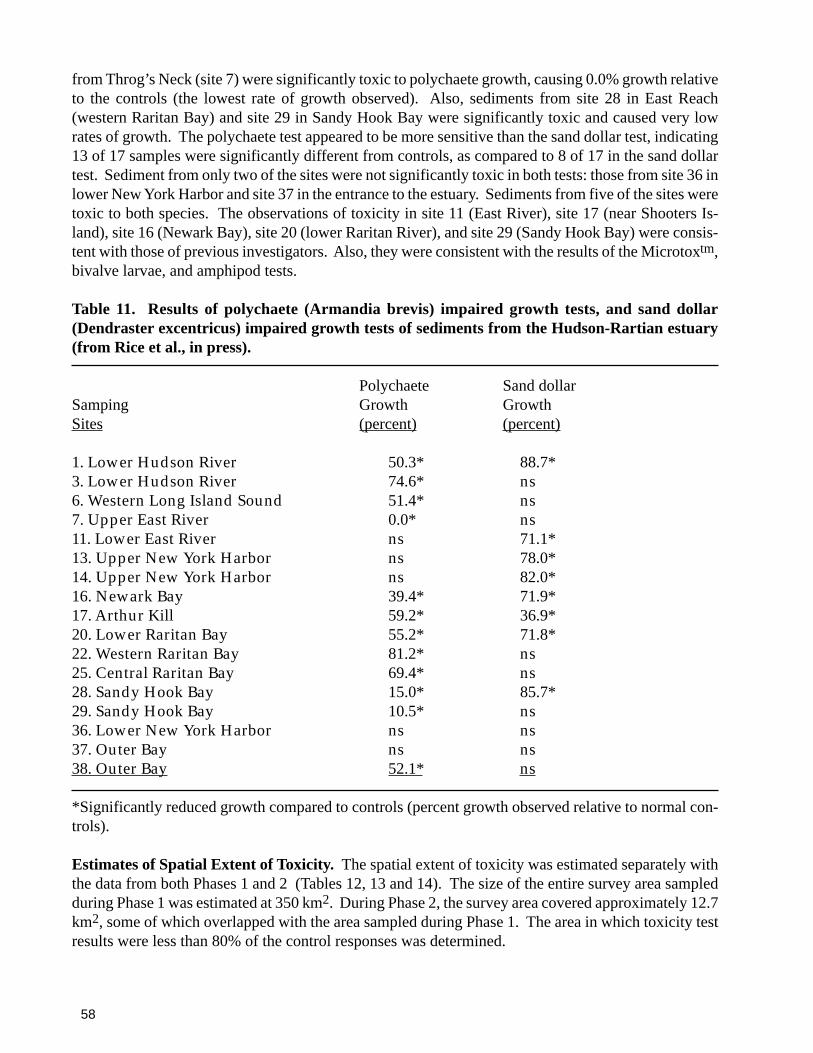
58
from Throg’s Neck (site 7) were significantly toxic to polychaete growth, causing 0.0% growth relativeto the controls (the lowest rate of growth observed). Also, sediments from site 28 in East Reach(western Raritan Bay) and site 29 in Sandy Hook Bay were significantly toxic and caused very lowrates of growth. The polychaete test appeared to be more sensitive than the sand dollar test, indicating13 of 17 samples were significantly different from controls, as compared to 8 of 17 in the sand dollartest. Sediment from only two of the sites were not significantly toxic in both tests: those from site 36 inlower New York Harbor and site 37 in the entrance to the estuary. Sediments from five of the sites weretoxic to both species. The observations of toxicity in site 11 (East River), site 17 (near Shooters Is-land), site 16 (Newark Bay), site 20 (lower Raritan River), and site 29 (Sandy Hook Bay) were consis-tent with those of previous investigators. Also, they were consistent with the results of the Microtoxtm,bivalve larvae, and amphipod tests.
Table 11. Results of polychaete (Armandia brevis) impaired growth tests, and sand dollar(Dendraster excentricus) impaired growth tests of sediments from the Hudson-Rartian estuary(from Rice et al., in press).
Polychaete Sand dollarSamping Growth GrowthSites (percent) (percent)
1. Lower Hudson River 50.3* 88.7*3. Lower Hudson River 74.6* ns6. Western Long Island Sound 51.4* ns7. Upper East River 0.0* ns11. Lower East River ns 71.1*13. Upper New York Harbor ns 78.0*14. Upper New York Harbor ns 82.0*16. Newark Bay 39.4* 71.9*17. Arthur Kill 59.2* 36.9*20. Lower Raritan Bay 55.2* 71.8*22. Western Raritan Bay 81.2* ns25. Central Raritan Bay 69.4* ns28. Sandy Hook Bay 15.0* 85.7*29. Sandy Hook Bay 10.5* ns36. Lower New York Harbor ns ns37. Outer Bay ns ns38. Outer Bay 52.1* ns
*Significantly reduced growth compared to controls (percent growth observed relative to normal con-trols).
Estimates of Spatial Extent of Toxicity. The spatial extent of toxicity was estimated separately withthe data from both Phases 1 and 2 (Tables 12, 13 and 14). The size of the entire survey area sampledduring Phase 1 was estimated at 350 km2. During Phase 2, the survey area covered approximately 12.7km2, some of which overlapped with the area sampled during Phase 1. The area in which toxicity testresults were less than 80% of the control responses was determined.

59
Based upon separate analyses of the data from the four test end-points in Phase 1, 89.4 to 136.1 km2
were estimated to be toxic (i.e., toxicity test results were less than 80% of the control responses). Theseareas represented approximately 25% to 39% of the total study area. Based upon a critical value of lessthan 20% of controls (the reciprocal of 80%), the area estimated to be highly toxic ranged from 0 to 16km2, representing from 0% to 4.6% of the survey area.
Table 12. Estimates of the spatial extent of toxicity* (km2 and percent of total area) in the Hudson-Raritan Estuary based upon the cumulative distribution functions of data from each of four testend-points.
Toxic Area Highly Toxic Area(<80% of controls) (<20% of controls)
Amphipod survival 133.3 km2 12.0 km2
(38.1%) (3.4%)
Bivalve larvae survival 87.4 km2 0(25.0%)
Bivalve larvae development 103.8 km2 16.1 km2
(30.0%) (4.6%)
Microtox bioluminescence 136.1 km2 0(38.9%)
* Based upon critical values of <80% and <20% of control responses.Total survey area: 350 km2
Based upon the amphipod survival test performed in Phase 1, approximately 133 km2 of the Hudson-Raritan Estuary were toxic (Table 12). Since toxicity was most widespread in the amphipod tests, theresults of the other three end-points were compared to it to determine concordance in the estimates ofthe spatial extent of toxicity. Toxicity was second most widespread in the microbial bioluminescencetest. Based upon both the amphipod and microbial bioluminescence tests (Table 13), approximately 34km2 were toxic (9.8% of the total). Based upon these data and, using the critical value of less than 80%of control responses, site 7 (located near Throg’s Neck), site 10 (located in the upper East River), andsite 30 (located in Sandy Hook Bay) were significantly toxic in all four test end-points, representingabout 20 km2 (5.7% of the total area).
Table 13. Estimates of concordance in the spatial extent of toxicity* (km2 and percent of totalarea) in the Hudson-Raritan estuary among the four toxicity test end-points.
Toxic AreaKilometer2 Percent
Amphipod survival 133.3 38.1%Amphipod survival and microbial
bioluminescence 34.2 9.8
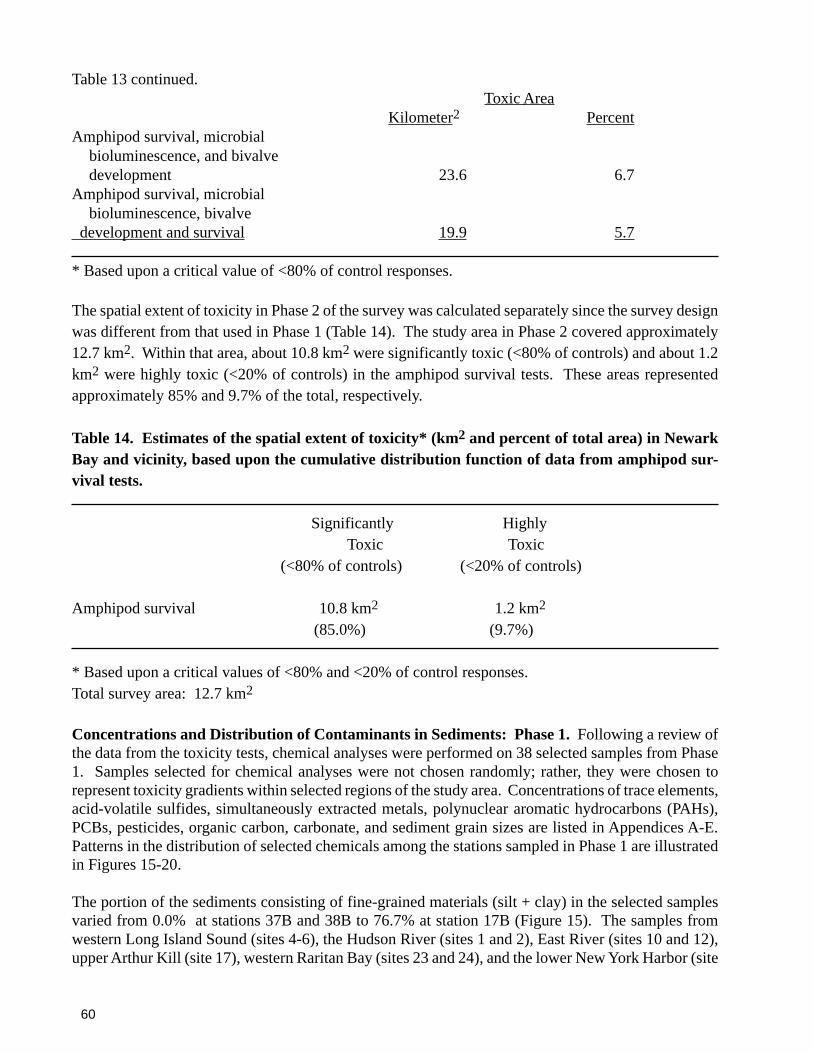
60
Table 13 continued.Toxic Area
Kilometer2 PercentAmphipod survival, microbial
bioluminescence, and bivalvedevelopment 23.6 6.7
Amphipod survival, microbialbioluminescence, bivalve
development and survival 19.9 5.7
* Based upon a critical value of <80% of control responses.
The spatial extent of toxicity in Phase 2 of the survey was calculated separately since the survey designwas different from that used in Phase 1 (Table 14). The study area in Phase 2 covered approximately12.7 km2. Within that area, about 10.8 km2 were significantly toxic (<80% of controls) and about 1.2km2 were highly toxic (<20% of controls) in the amphipod survival tests. These areas representedapproximately 85% and 9.7% of the total, respectively.
Table 14. Estimates of the spatial extent of toxicity* (km2 and percent of total area) in NewarkBay and vicinity, based upon the cumulative distribution function of data from amphipod sur-vival tests.
Significantly HighlyToxic Toxic
(<80% of controls) (<20% of controls)
Amphipod survival 10.8 km2 1.2 km2
(85.0%) (9.7%)
* Based upon a critical values of <80% and <20% of control responses.Total survey area: 12.7 km2
Concentrations and Distribution of Contaminants in Sediments: Phase 1. Following a review ofthe data from the toxicity tests, chemical analyses were performed on 38 selected samples from Phase1. Samples selected for chemical analyses were not chosen randomly; rather, they were chosen torepresent toxicity gradients within selected regions of the study area. Concentrations of trace elements,acid-volatile sulfides, simultaneously extracted metals, polynuclear aromatic hydrocarbons (PAHs),PCBs, pesticides, organic carbon, carbonate, and sediment grain sizes are listed in Appendices A-E.Patterns in the distribution of selected chemicals among the stations sampled in Phase 1 are illustratedin Figures 15-20.
The portion of the sediments consisting of fine-grained materials (silt + clay) in the selected samplesvaried from 0.0% at stations 37B and 38B to 76.7% at station 17B (Figure 15). The samples fromwestern Long Island Sound (sites 4-6), the Hudson River (sites 1 and 2), East River (sites 10 and 12),upper Arthur Kill (site 17), western Raritan Bay (sites 23 and 24), and the lower New York Harbor (site
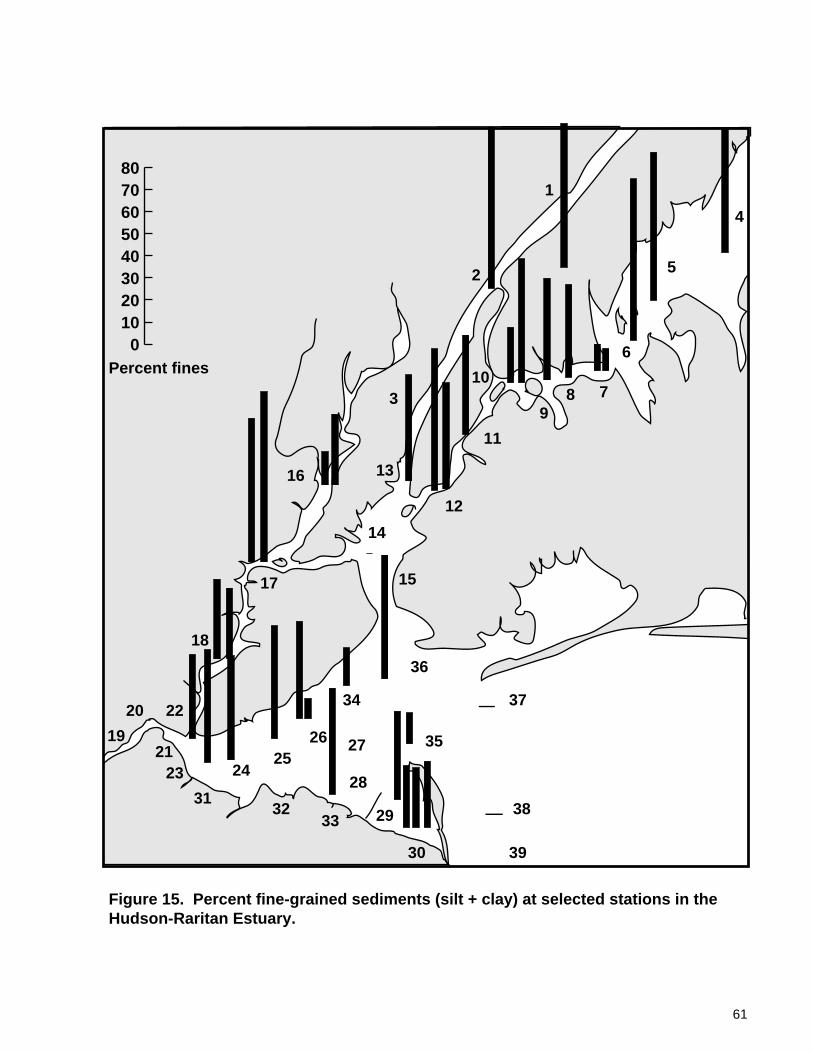
61
1
2
3
4
5
6
789
10
11
12
13
14
15
16
17
18
19
20
21
22
23 2425
26 27
28
29
30
3132
33
34
35
36
37
38
39
Figure 15. Percent fine-grained sediments (silt + clay) at selected stations in the Hudson-Raritan Estuary.
01020304050607080
Percent fines

62
36) had relatively high percent fine-grained materials (over 50%). Samples with relatively low percentfines were collected in the upper East River (site 7), lower Hudson River (site 13), upper New YorkHarbor (site 14), upper Newark Bay (site 16), and in the lower New York Harbor (sites 26, 34, 35, 37,and 38).
The concentrations of total organic carbon (TOC) ranged from 0.7% (at sites 37 and 38) to 3.6-4.8% (atsites 11 and 12) up to a maximum of 5.0% at site 9 (Figure 16). Curiously, sample 7B had low percentfines (10.4%), but very high TOC content (4.4%). In most samples the TOC content ranged from 2%to 3% with very few samples having less than 1% TOC. Multiple samples from most sites had similarconcentrations of TOC. However, the two samples from sites 7 and 10 had considerably differentconcentrations, reflecting within-site heterogeneity. The two samples collected in the mouth of theestuary (sites 37 and 38) had extremely low TOC content and consisted entirely of sand (100% sand).Also, the sample from site 14 in upper New York Harbor was 98.5% sand and had only 0.25% TOC.
The concentrations of mercury in most samples ranged from 1.0 to 2.5 ug/g (Figure 17). Samples fromsites 7, 9, and 10 had 4.7 to 5.0 ug/g Hg. Sample 18C from the Arthur Kill had 15 ug/g Hg, consider-ably higher than any of the other samples. Samples with relatively low mercury concentrations werethose from western Long Island Sound, the lower Hudson River, upper New York Harbor, lower NewYork Harbor, and near the Sandy Hook-Rockaway Point transec.
In most samples, the molar ratios of total simultaneously extracted metals (SEM) to total acid volatilesulfides (AVS) ranged from 0.04 to 0.22 (Figure 18). However, in sample 34B the ratio was 0.74, insample 14A it was 0.80, and in sample 2A it was 2.42. In sandy samples 37B and 38B, the concentra-tions of AVS were very low, and the SEM/AVS ratios were 9.32 and 5.47, respectively. There were noconsistent spatial patterns in the SEM/AVS ratios throughout the study area.
In most samples, the concentrations of total PCBs (sum of 20 congeners) ranged from 100 ng/g to 200ng/g (Figure 19). The PCB concentrations were relatively high in a few samples, notably the samplefrom station 12A in the East River which had 1972.8 ng/g. The concentrations of total PCBs exceeded450 ng/g in samples from stations 1A, 11B, 12B, 17B, 17C, and 18C. The relatively high PCB concen-trations in the samples from the East River gradually decreased into the western Long Island Sound.Also, the relatively high concentrations in the Arthur Kill gradually diminished towards the SandyHook-Rockaway Point transect at the estuary entrance.
In most samples, the concentrations of total PAHs (sum of 24 PAHs) ranged from 4,000 ng/g to 20,000ng/g (Figure 20). However, the samples from sites 7, 8, 9, 10, and 11 in the East River and site 17 inKull van Kull had concentrations that exceeded 20,000 ng/g total PAH. The concentration of total PAHin sample 9B from the upper East River was 1,123,355 ng/g. The high concentrations of PAHs in theEast River decreased considerably eastward into Long Island Sound. Also, the moderate concentra-tions of PAHs in the Arthur Kill diminished eastward toward the Sandy Hook-Rockaway Point transectat the estuary entrance. The lowest concentrations of these compounds were found in samples col-lected in the upper New York Harbor and beyond the estuary entrance.
Concentrations and Distribution of Contaminants in Sediments: Phase 2. In Phase 2 of the sur-vey, sediments from 20 of the 57 sampling stations in Newark Bay and vicinity were analyzed forchemical concentrations. These 20 stations included station 57 in upper New York Harbor, which wassampled during Phase 1 (listed as Site 14 in Phase 1). A full suite of trace elements, organo chlorine

63
1
2
3
4
5
6
789
10
11
12
13
14
15
16
17
18
19
20
21
22
23 2425 26 27
28
29
30
3132
33
34
35
36
37
38
39
Figure 16. Percent total organic carbon (TOC) in selected stations in the Hudson-Raritan Estuary.
0
1
2
3
4
5
Percent TOC

64
1
2
3
4
5
6
789
10
11
12
13
14
15
16
17
18
19
20
21
22
23 2425 26 27
28
29
30
3132
33
34
35
36
37
38
39
0
3
6
9
12
15
Mercury, ug/g
Figure 17. Mercury concentrations in selected stations in the Hudson-Raritan Estuary.

65
1
2
3
4
5
6
789
10
11
12
13
14
15
16
17
18
19
20
21
22
23 2425 26 27
28
29
30
3132
33
34
35
36
37
38
39
0
2
4
6
8
10
Total SEM/AVS ratio
Figure 18. Ratio of total simultaneously-extracted metals concentrations (umole/g) to acid-volatile sulfide concentrations (umole/g) in selected stations in the Hudson-Raritan Estuary.
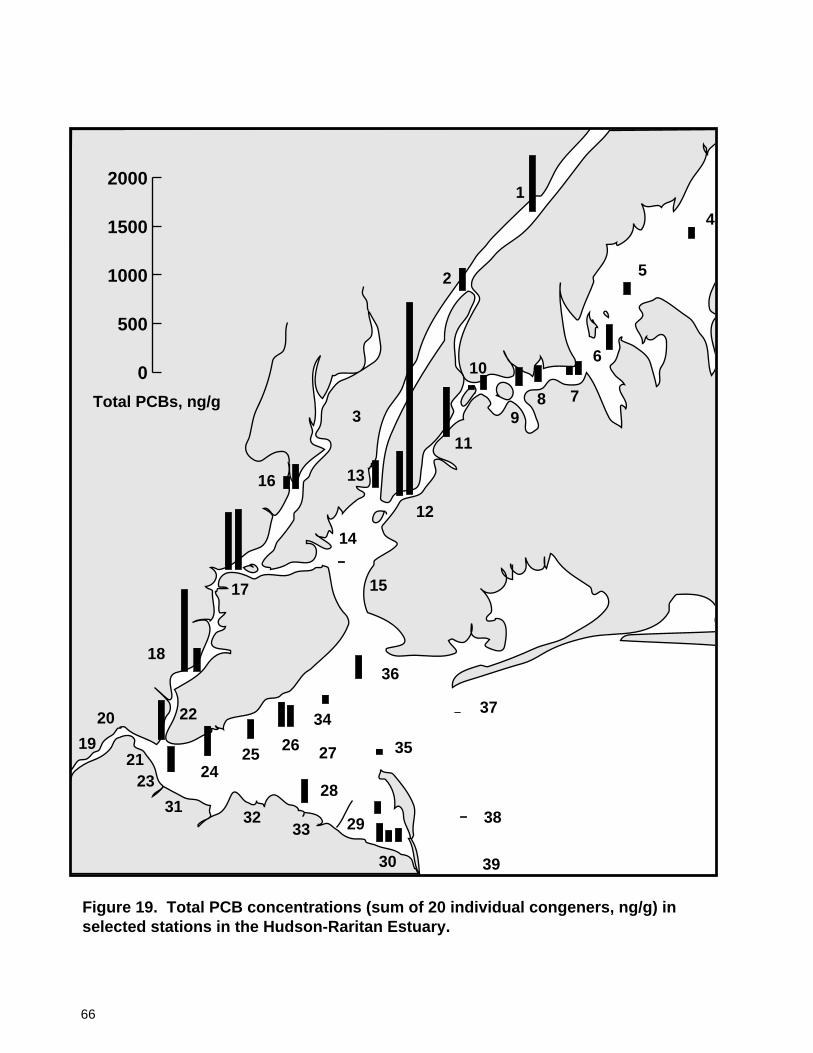
66
1
2
3
4
5
6
789
10
11
12
13
14
15
16
17
18
19
20
21
22
23 2425 26 27
28
29
30
3132
33
34
35
36
37
38
39
0
500
1000
1500
2000
Total PCBs, ng/g
Figure 19. Total PCB concentrations (sum of 20 individual congeners, ng/g) in selected stations in the Hudson-Raritan Estuary.
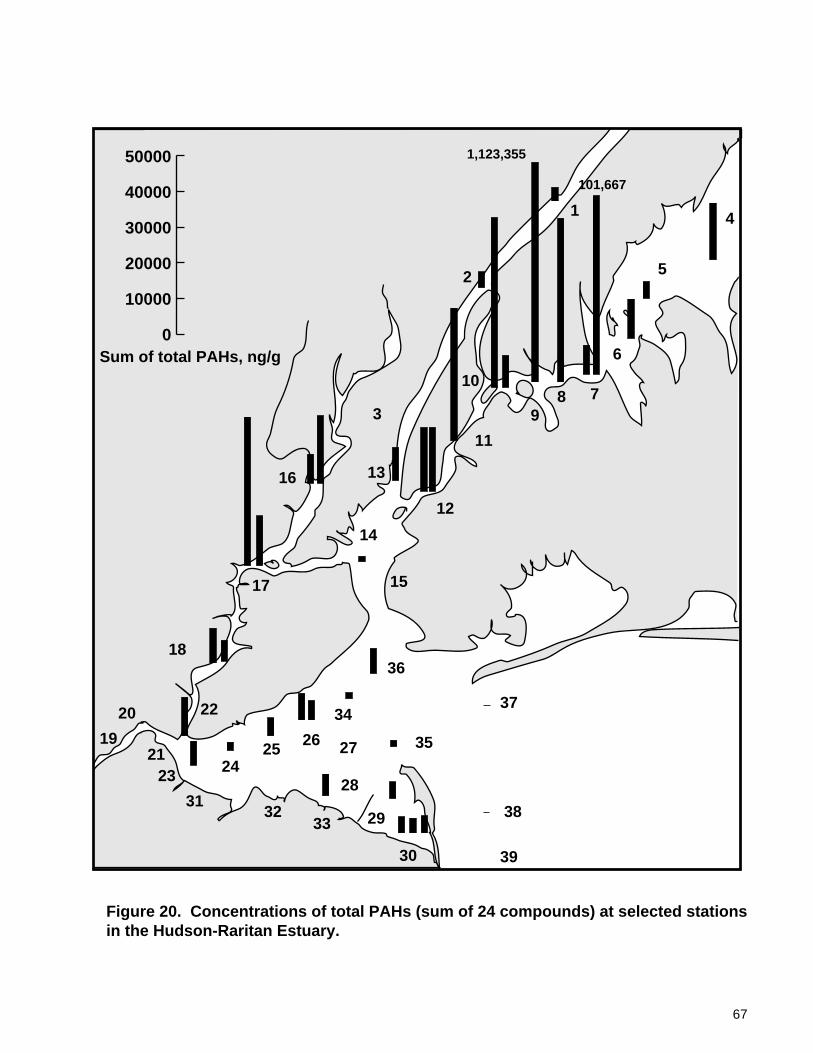
67
1
2
3
4
5
6
789
10
11
12
13
14
15
16
17
18
19
20
21
22
23 2425 26 27
28
29
30
3132
33
34
35
36
37
38
39
0
10000
20000
30000
40000
50000
101,667
1,123,355
Sum of total PAHs, ng/g
Figure 20. Concentrations of total PAHs (sum of 24 compounds) at selected stations in the Hudson-Raritan Estuary.

68
compounds, and PAHs were quantified along with dioxins and furans. The 20 samples selected forchemical analyses were chosen before the samples were collected. Samples were chosen to representsuspected pollution gradients based upon data (especially from analyses of dioxins) from previousstudies. As expected from the results of the Phase 1 analyses, the sample from station 57 was sandy andhad very low concentrations of all substances.
The concentration of cadmium was relatively low in the sample from station 57, a reference station inupper New York Harbor (Figure 21). Also, the cadmium concentration was relatively low in the samplesfrom the Hackensack River and much of Newark Bay. In contrast, the cadmium concentrations inmany of the samples from the lower Passaic River were 4 to 6 ppm. In addition, the sample fromstation 26 midway down Newark Bay had a cadmium concentration of 4.2 ppm.
The concentrations of mercury in the Newark Bay samples followed a distributional pattern similar tothat of cadmium (Figure 22). Mercury concentrations were relatively low in the reference sample fromupper New York Harbor, in most of the samples from Newark Bay, in two of the Hackensack Riversamples, and at the upstream station in the Passaic River. In contrast, mercury concentrations were 3-5 ppm in samples from the lower Passaic River, a station in the Hackensack River in the vicinity ofBerry’s Creek, and at station 26 midway down Newark Bay. At station 14 near Berry’s Creek, themercury concentration was 4.3 ppm.
The SEM/AVS ratios ranged from 0.07 to 2.85 and were less than 1.0 at all but three stations (Figure23). The sample from station 1 in the Passaic River had the highest ratio, 2.85, followed by station 8 inthe lower Passaic River and station 56 in lower Newark Bay, in which the ratios were 1.02 and 1.04,respectively. The total SEM concentrations were based upon sums of the Cd, Cu, Pb, Ni, and Znconcentrations.
The concentrations of total PCBs ranged from 105 ng/g at station 57 in upper New York Harbor to 2318ng/g at station 26 in Newark Bay and 2850 ng/g at station 3 in the lower Passaic River (Figure 24).Total PCB concentrations exceeded 1,000 ng/g in all of the Passaic River stations except station 1. Incontrast, the concentrations of total PCBs ranged from 110 to 671 ng/g at the three stations in theHackensack River.
The concentrations of 18 dioxins and furans were quantified by NBS. Also, the concentrations of fourco-planar PCBs were quantified. Based upon the toxicity equivalency factors (TEF) derived for mam-malian systems by Kutz et al. (1990) for the dioxins and furans and by Barnes et al. (1991) for the co-planar PCBs, the cumulative, total 2,3,7,8-tcdd toxicity equivalency quotients (TEQ) were calculatedand plotted (Figure 25). Total 2,3,7,8-tcdd TEQs ranged from 13 pg/g at station 57 in upper New YorkHarbor to 874 pg/g at station 7c in the lower Passaic River. All samples except five from stations in theHackensack River and Newark Bay had concentrations of 100 pg/g or greater. In addition, sample 26from Newark Bay had a concentration of 723 pg/g total TEQ.
With funding provided to U.S. EPA Region 2 from the U.S. EPA Office of Science and Technology, theconcentrations of 17 dioxin and furan congeners were determined in an additional 35 samples. Twelvesamples were analyzed by Pacific Analytical, Inc. and the remaining 23 samples were analyzed byMidwest Research Institute. Both laboratories prepared the samples and conducted the analyses inaccordance with EPA Method 1613. However, the comparability of the data from the NBS, PacificAnalytical, Inc., and Midwest Research Institute laboratories was not determined.

69
0
1
2
3
4
5
6
Cd, ug/g
Hacke
nsac
k Riv
er
Pass
aic
Riv
erN
ewar
k B
ay
Staten Island
UpperNew YorkHarbor
Figure 21. Concentrations of cadmium at selected stations in Newark Bay and vicinity.
1
3
5 7a7b
7c 8
10
11
12
14
17
20
21
26
3136
56 57
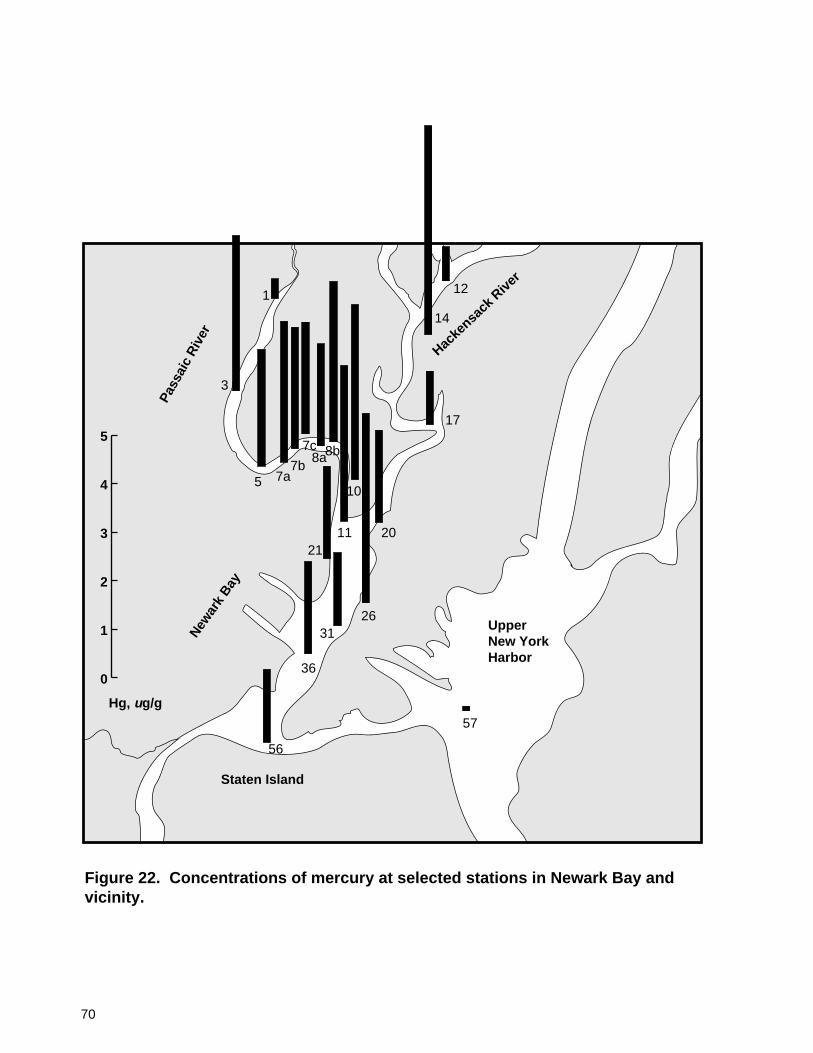
70
0
1
2
3
4
5
Hg, ug/g
Staten Island
UpperNew YorkHarbor
Newar
k Bay
Pass
aic
Riv
er
Hacke
nsack
Rive
r
Figure 22. Concentrations of mercury at selected stations in Newark Bay and vicinity.
57
56
36
3126
2120
17
14
121
3
5 7a7b
7c8a8b
10
11

71
0.0
0.5
1.0
1.5
2.0
2.5
3.0
SEM/AVS Ratios
Staten Island
Upper NewYorkHarbor
Newar
k Bay
Hac
kens
ack
Riv
er
Pass
aic
Riv
er
Figure 23. Ratios of total simultaneously-extracted metals(SEM) to total acid-volatile sulfides (AVS) at selected stations in Newark Bay and vicinity.
1
3
57a
7b7c
8a8b
10
11
12
14
17
2120
26
31
36
5657

72
0
500
1000
1500
2000
2500
3000
tPCB, ng/g
Staten Island
New
ark
Bay
UpperNew YorkHarbor
Passa
ic R
iver
Hacke
nsack
Rive
r
Figure 24. Concentrations of total PCBs at selected stations in Newark Bay andvicinity.
1
3
57a
7b7c
8a8b
1011
12
14
17
20
21
26
31
36
5657
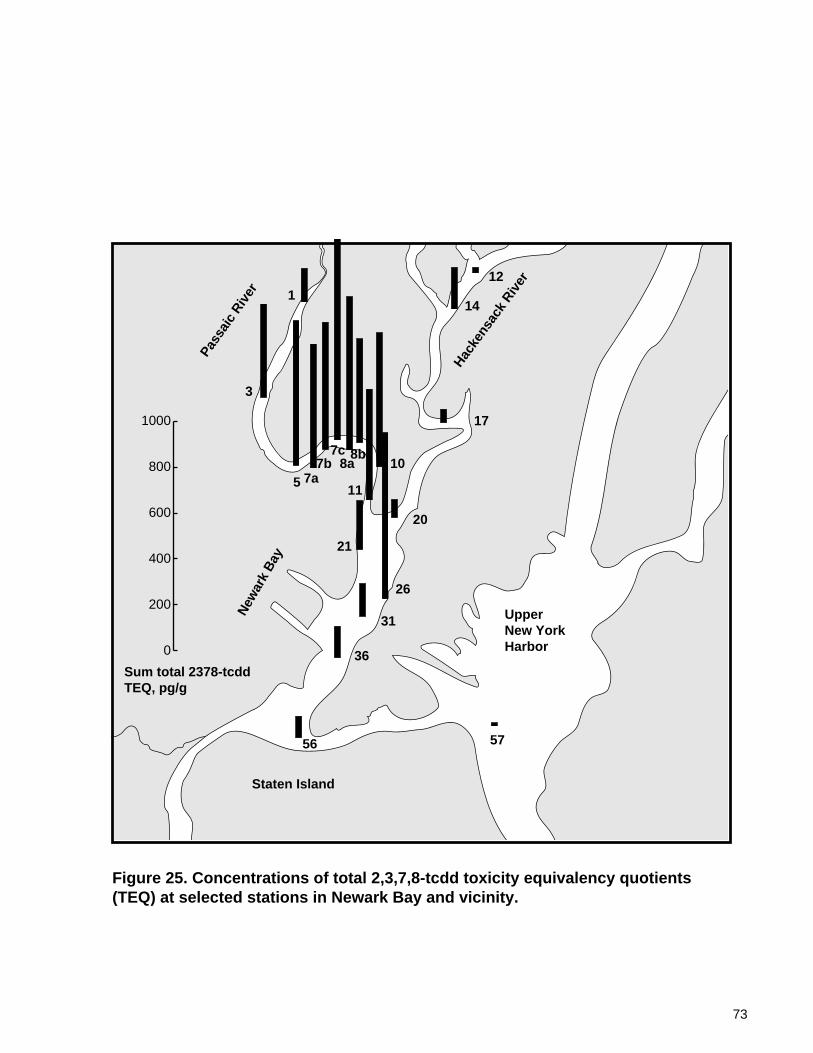
73
Staten Island
New
ark
Bay
UpperNew YorkHarbor
Pass
aic
River
Hacke
nsac
k Riv
er
Sum total 2378-tcddTEQ, pg/g
Figure 25. Concentrations of total 2,3,7,8-tcdd toxicity equivalency quotients (TEQ) at selected stations in Newark Bay and vicinity.
0
200
400
600
800
1000
1
3
5 7a7b
7c8a
8b10
11
12
14
17
20
21
26
31
36
56 57
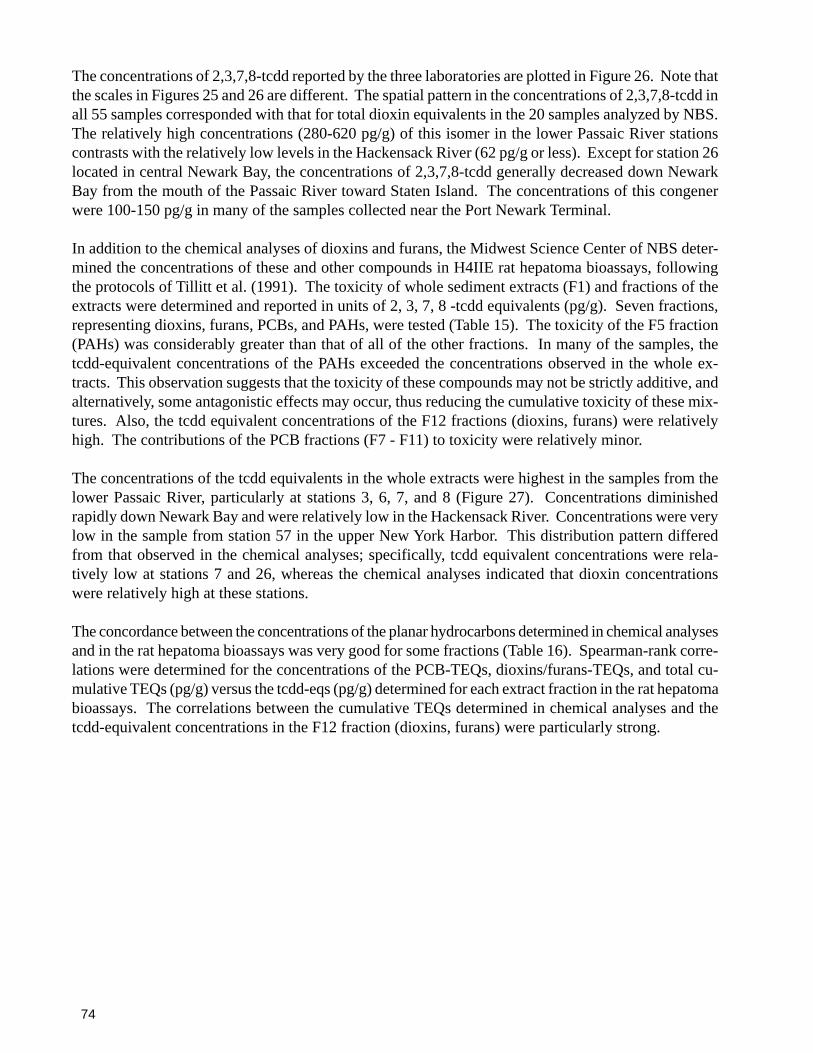
74
The concentrations of 2,3,7,8-tcdd reported by the three laboratories are plotted in Figure 26. Note thatthe scales in Figures 25 and 26 are different. The spatial pattern in the concentrations of 2,3,7,8-tcdd inall 55 samples corresponded with that for total dioxin equivalents in the 20 samples analyzed by NBS.The relatively high concentrations (280-620 pg/g) of this isomer in the lower Passaic River stationscontrasts with the relatively low levels in the Hackensack River (62 pg/g or less). Except for station 26located in central Newark Bay, the concentrations of 2,3,7,8-tcdd generally decreased down NewarkBay from the mouth of the Passaic River toward Staten Island. The concentrations of this congenerwere 100-150 pg/g in many of the samples collected near the Port Newark Terminal.
In addition to the chemical analyses of dioxins and furans, the Midwest Science Center of NBS deter-mined the concentrations of these and other compounds in H4IIE rat hepatoma bioassays, followingthe protocols of Tillitt et al. (1991). The toxicity of whole sediment extracts (F1) and fractions of theextracts were determined and reported in units of 2, 3, 7, 8 -tcdd equivalents (pg/g). Seven fractions,representing dioxins, furans, PCBs, and PAHs, were tested (Table 15). The toxicity of the F5 fraction(PAHs) was considerably greater than that of all of the other fractions. In many of the samples, thetcdd-equivalent concentrations of the PAHs exceeded the concentrations observed in the whole ex-tracts. This observation suggests that the toxicity of these compounds may not be strictly additive, andalternatively, some antagonistic effects may occur, thus reducing the cumulative toxicity of these mix-tures. Also, the tcdd equivalent concentrations of the F12 fractions (dioxins, furans) were relativelyhigh. The contributions of the PCB fractions (F7 - F11) to toxicity were relatively minor.
The concentrations of the tcdd equivalents in the whole extracts were highest in the samples from thelower Passaic River, particularly at stations 3, 6, 7, and 8 (Figure 27). Concentrations diminishedrapidly down Newark Bay and were relatively low in the Hackensack River. Concentrations were verylow in the sample from station 57 in the upper New York Harbor. This distribution pattern differedfrom that observed in the chemical analyses; specifically, tcdd equivalent concentrations were rela-tively low at stations 7 and 26, whereas the chemical analyses indicated that dioxin concentrationswere relatively high at these stations.
The concordance between the concentrations of the planar hydrocarbons determined in chemical analysesand in the rat hepatoma bioassays was very good for some fractions (Table 16). Spearman-rank corre-lations were determined for the concentrations of the PCB-TEQs, dioxins/furans-TEQs, and total cu-mulative TEQs (pg/g) versus the tcdd-eqs (pg/g) determined for each extract fraction in the rat hepatomabioassays. The correlations between the cumulative TEQs determined in chemical analyses and thetcdd-equivalent concentrations in the F12 fraction (dioxins, furans) were particularly strong.

75
Tabl
e 15
. C
once
ntra
tions
of
TC
DD
-equ
ival
ents
(pg
/g)
in w
hole
ext
ract
s an
d ex
trac
t fr
actio
ns d
eter
min
ed in
H4I
IE r
at h
epat
oma
bioa
ssay
s of
sed
imen
ts fr
om N
ewar
k B
ay.
F 1
frac
tion
= w
hole
ext
ract
. F
5 fr
actio
n =
PA
Hfr
actio
n. F
7 fr
actio
n =
bul
k (>
2 - o
rtho
- ch
loro
- su
bstit
uted
) PC
B fr
actio
n. F
8 =
mon
o - o
rtho
- ch
loro
- su
bstit
uted
PC
Bfr
actio
n. F
9 =
non
- or
tho
- chl
oro
- sub
stitu
ted
PC
B fr
actio
n. F
11
= c
ombi
ned
tota
l PC
B fr
actio
n. F
12
= P
CD
D/P
CD
Ffr
actio
n.
Sta
tion
No.
F1
frac
tion
F5
frac
tion
F7
frac
tion
F8
frac
tion
F9
frac
tion
F11
frac
tion
F12
frac
tion
1.38
058
000.
12.
27
8215
63.
4000
060
000.
11.
420
9652
05.
4200
022
000
0.0
7.4
4915
185
67a
.12
000
1900
00.
216
.811
396
762
7b.
8500
5400
0.2
11.3
155
6180
67c
.67
0055
001.
413
.317
6312
618a
.42
000
7200
0.1
5.0
8533
210
478b
.93
000
7000
3.3
18.4
192
391
648
10.
9300
4800
2.0
8.2
216
1017
11.
1000
021
000
0.3
4.7
6820
491
112
.50
065
00.
20.
71
1145
14.
650
1800
00.
14.
122
4242
417
.50
0049
000.
21.
95
5210
520
.71
011
000
0.1
5.6
1480
164
21.
4500
8500
0.1
4.0
1811
127
526
.30
0070
000.
118
.186
162
857
31.
1700
4500
0.4
3.6
1719
274
36.
3200
2000
0.2
4.0
1047
222
56.
7100
2400
0.3
4.7
1262
130
57.
170
870.
10.
32
215
Bas
ed u
pon
mea
ns w
here
rep
licat
es w
ere
test
ed.

76
Table 16. Spearman-rank (rho, corrected for ties) correlations between dioxin equivalents deter-mined in chemical analyses and dioxin equivalents (tcdd-eqs) determined in rat hepatoma bioas-says of sediment extracts. F 1 fraction = whole extract. F 5 fraction = PAH fraction. F 7fraction = bulk (>2 - ortho - chloro - substituted) PCB fraction. F 8 = mono - ortho - chloro -substituted PCB fraction. F 9 = non - ortho - chloro - substituted PCB fraction. F 11 = com-bined total PCB fraction. F 12 = PCDD/PCDF fraction.
Sediment extract Cumulative Cumulative Cumulativefraction PCB TEQs dioxin/furan TEQs total TEQs
F1 +0.633* +0.605* +0.616*F5 +0.428 ns +0.524* +0.506*F7 +0.116 ns +0.038 ns +0.053 nsF8 +0.738* +0.750* +0.746*F9 +0.634* +0.650* +0.649*F11 +0.530* +0.577* +0.574*F12 +0.962*** +0.962*** +0.959***
*p<0.05, **p<0.001, ***p<0.0001
This relationship between the total cumulative tcdd equivalents from the chemical analyses and thetcdd equivalents from the H4IIE rat hepatoma bioassays of the F12 fraction is illustrated in Figure 28.The relationship is very strong and nearly linear.
Also, there was a relatively strong correlation and relationship between the concentrations of totalPAHs in the sediments and the tcdd equivalents determined in the H4IIE bioassays of the F5 (PAHs)fraction (Figure 29). This relationship was not as strong as that observed with the dioxins and would beimproved by deletion of the data from two samples. Nevertheless, a strong pattern was obvious be-tween the chemical estimate and the bioassay estimate of PAH concentrations.
Relationships Between Toxicity and Physical-Chemical Parameters: Phase 1. The relationshipsbetween the four measures of toxicity and the concentrations of potential contaminants and other pa-rameters were compared using non-parametric, Spearman-rank correlations (Tables 15-18). Althoughthe correlation analyses cannot be interpreted as evidence of cause-effect relationships, they can iden-tify patterns in co-variance or concordance between dependent variables (i.e., toxicity) and indepen-dent variables (i.e., potential toxicants). The correlation coefficients are accompanied by the level ofsignificance of the correlations. To account for Type 1 errors in the correlations, the significance level(p=0.05) should be divided by the number of variables and the adjusted significance level used as thecritical p value.
The total concentrations of most trace metals were not significantly correlated with amphipod survival,bivalve survival, or bivalve normal development (Table 17). In contrast, most of the metals wereweakly (but significantly) correlated with the microbial bioluminescence EC50s. Only the concentra-tions of mercury and tin were significantly negatively correlated with amphipod survival. None of themetals or other parameters were correlated with bivalve survival and only the concentration of carbon-ate was correlated with bivalve normal development. In the microbial bioluminescence test, all of thepotentially toxic trace metals (i.e., Ag, Cr, Cd, Cu, Hg, Pb, Sn, and Zn) were significantly (p<0.05)correlated with toxicity. Also, the Microtox test results were correlated with the total organic carboncontent (% TOC). Only those correlations shown with “**” would remain significant if the number ofvariables (18) were taken into account.

77
UpperNew YorkHarbor
Staten Island
New
ark
Bay
Pass
aic
Riv
er
Hac
kens
ack
Riv
er
2378-tcddpg/g
Figure 26. Concentrations of 2,3,7,8-tcdd at 53 selected stations in Newark Bay and vicinity.
0100200300400500600700800
1
2
3
4
567a7b7c
8a8b
9 10
11
1213
14
15
16
17
18
19
20212223 24
2526
27
2829
3031
32 33 343536
393738
40 41
44
4648 49 51
54
55 5657

78
Staten Island
New
ark
Bay
UpperNew YorkHarbor
Pass
aic
River
Hacke
nsac
k Riv
er
Figure 27. TCDD equivalents (pg/g) from H4IIE bioassays of whole (F1) sediment extracts from selected stations in Newark Bay and vicinity.
1
3
5 7a7b
7c8a
8b10
11
12
14
17
20
21
26
31
36
56 57
0
10000
20000
30000
40000
50000
TCDD-EQ (pg/g)

79
0
200
400
600
800
1000
1200
1400
H4I
IE F
12 f
ract
ion
TC
DD
-EQ
, pg
/g
0 100 200 300 400 500 600 700 800 900
Total Cumulative TCDD-TEQ, pg/g
Newark Bay
Rho = -0.959***
Figure 28. Relationship of total cumulative tcdd toxicityequivalents from chemical analyses and TCDD toxicityequivalents from H4IIE bioassays of the F12 fraction.
1 0
100
1000
10000
100000
H4I
IE F
5 fr
acti
on
TC
DD
-EQ
, pg
/g
100 1000 10000 100000 1000000
Sum of total PAH, ng/g
Newark Bay
Rho = -0.730*
Figure 29. Relationship of the concentrations of total PAHs to the concentrations of the TCDD toxicity equivalentsin the H4IIE bioassays of the F5 (PAH) fraction.

80
Table 17. Spearman-rank correlations (Rho, corrected for ties) between four toxicity end-points(as percent of controls) and the concentrations of trace elements in Hudson-Raritan estuary sedi-ments (n=38).
Amphipod Bivalve Bivalve MicrobialSurvival Survival Development Bioluminescence
Silver +0.206 ns -0.029 ns -0.096 ns -0.363 *Aluminum +0.177 ns +0.245 ns -0.040 ns -0.201 nsArsenic -0.153 ns -0.050 ns -0.287 ns -0.305 nsChromium +0.025 ns +0.207 ns +0.001 ns -0.351 *Cadmium -0.264 ns -0.126 ns -0.205 ns -0.472 *Copper -0.255 ns -0.048 ns -0.091 ns -0.449 *Iron +0.233 ns +0.138 ns -0.181 ns -0.320 nsMercury -0.437 * -0.096 ns -0.119 ns -0.377 *Manganese +0.494 * -0.128 ns -0.142 ns -0.105 nsNickel -0.095 ns +0.017 ns -0.081 ns -0.451*Lead -0.295 ns -0.068 ns -0.150 ns -0.478 *Antimony -0.239 ns +0.013 ns -0.052 ns -0.355 *Selenium -0.067 ns +0.010 ns -0.047 ns -0.217 nsTin -0.342 * -0.061 ns -0.130 ns -0.427 *Zinc -0.134 ns +0.012 ns -0.208 ns -0.433 *Sum of Cd/CuHg/Pb/Zn -0.240 ns -0.040 ns -0.153 ns -0.465 *% TOC -0.151 ns -0.231 ns -0.318 ns -0.581 **% TIC -0.281 ns -0.233 ns -0.343 * -0.415 *% fines +0.196 ns +0.063 ns +0.120 ns -0.347 *
*p<0.05, **p<0.001, ***p<0.0001
The concentrations of individual and total simultaneously extracted metals (SEM) were not signifi-cantly correlated with the results of the tests of amphipod survival, bivalve survival, and bivalve devel-opment (Table 18). Similarly, the SEM/AVS ratios were not significantly correlated with any of thetests, and, improbably, a positive association was indicated with amphipod survival, bivalve survival,bivalve development, and microbial bioluminescence. However, the concentrations of many of theindividual simultaneously extracted metals, notably lead, were significantly correlated with the Microtoxresults. Although the correlations between microbial bioluminescence and both total AVS and totalSEM concentrations were significantly negative, the correlation with the SEM/AVS ratios was signifi-cantly positive. Only those correlations shown with “**” would remain significant if the number ofvariables (9) were taken into account.
Table 18. Spearman-rank correlations (Rho, corrected for ties) between four toxicity end-points(as percent of controls) and the concentrations of acid-volatile sulfides (AVS) and simultaneouslyextracted trace metals (SEM) in Hudson-Raritan Estuary sediments (n=38).
Amphipod Bivalve Bivalve MicrobialSurvival Survival Development Bioluminescence
Total AVS -0.150 ns -0.133 ns -0.323 ns -0.544 **SE Cd -0.149 ns -0.113 ns -0.229 ns -0.393 *SE Cu -0.105 ns -0.015 ns -0.096 ns -0.351 *

81
Table 18 continued.Amphipod Bivalve Bivalve MicrobialSurvival Survival Development Bioluminescence
SE Hg +0.292 ns +0.231 ns +0.189 ns +0.309 nsSE Ni +0.060 ns +0.125 ns +0.075 ns -0.234 nsSE Pb -0.234 ns +0.001 ns -0.086 ns -0.482 *SE Zn -0.050 ns +0.040 ns -0.216 ns -0.340 *Total SEM -0.130 ns +0.039 ns -0.192 ns -0.417 *SEM/AVS ratios +0.197 ns +0.118 ns +0.264 ns +0.454 *
*p<0.05, **p<0.001, ***p<0.0001
Most of the correlations between toxicity and the concentrations of chlorinated organic compoundswere not significant (Table 19). Only cis-chlordane, trans-nonachlor, 2,4’-DDD, 4,4'-DDE, 4,4’-DDT,and the sum of total indeno-pesticides were significantly negatively correlated with any of the toxicitytests. These compounds were significantly correlated with the microbial bioluminescence test results.In addition, 4,4’-DDT was significantly correlated with amphipod survival. However, none of thesecorrelations would remain significant if the number of variables (20) were taken into account.
Table 19. Spearman-rank correlations (Rho, corrected for ties) between four toxicity end-points(as percent of controls) and the concentrations of PCBs and pesticides in Hudson-Raritan Estu-ary sediments (n=38).
Amphipod Bivalve Bivalve MicrobialSurvival Survival Development Bioluminescence
HCB -0.013 ns +0.281 ns +0.144 ns -0.052 nsLindane -0.082 ns -0.172 ns -0.062 ns -0.030 nsHeptachlor < mdl < mdl < mdl < mdlAldrin -0.075 ns -0.004 ns +0.031 ns +0.087 nsHeptachlor epoxide -0.232 ns +0.234 ns +0.031 ns -0.120 ns2, 4-DDE -0.125 ns -0.157 ns +0.036 ns -0.295 nsCis-chlordane -0.204 ns -0.059 ns -0.007 ns -0.384 *Trans-nonachlor -0.150 ns -0.065 ns -0.018 ns -0.402 *Dieldrin -0.058 ns +0.285 ns +0.101 ns +0.014 ns4,4-DDE -0.287 ns +0.074 ns +0.105 ns -0.406 *2,4-DDD -0.197 ns +0.249 ns +0.286 ns -0.066 nsEndrin < mdl < mdl < mdl < mdl4,4-DDD -0.189 ns -0.019 ns +0.036 ns -0.314 ns2,4-DDT -0.118 ns +0.112 ns +0.189 ns -0.049 ns4,4-DDT -0.476 * -0.077 ns +0.069 ns -0.341 *Mirex +0.281 ns -0.024 ns -0.033 ns +0.039 nsIndeno pesticides -0.197 ns -0.054 ns -0.021 ns -0.395 *Total DDTs -0.311 ns +0.132 ns +0.163 ns -0.271 nsTotal PCBs -0.124 ns +0.134 ns +0.239 ns -0.306 nsTotal non-DDT pests. -0.146 ns +0.130 ns +0.079 ns -0.250 ns
*p<0.05, **p<0.001, ***p<0.0001< mdl = all samples below method detection limit
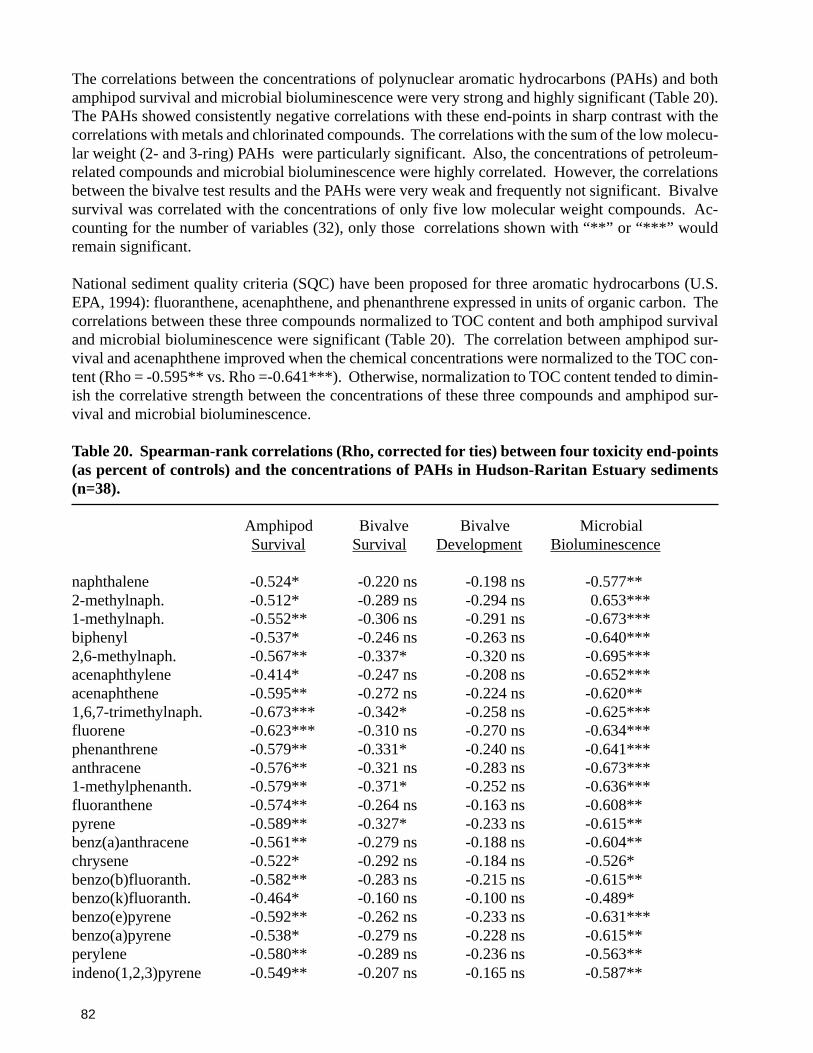
82
The correlations between the concentrations of polynuclear aromatic hydrocarbons (PAHs) and bothamphipod survival and microbial bioluminescence were very strong and highly significant (Table 20).The PAHs showed consistently negative correlations with these end-points in sharp contrast with thecorrelations with metals and chlorinated compounds. The correlations with the sum of the low molecu-lar weight (2- and 3-ring) PAHs were particularly significant. Also, the concentrations of petroleum-related compounds and microbial bioluminescence were highly correlated. However, the correlationsbetween the bivalve test results and the PAHs were very weak and frequently not significant. Bivalvesurvival was correlated with the concentrations of only five low molecular weight compounds. Ac-counting for the number of variables (32), only those correlations shown with “**” or “***” wouldremain significant.
National sediment quality criteria (SQC) have been proposed for three aromatic hydrocarbons (U.S.EPA, 1994): fluoranthene, acenaphthene, and phenanthrene expressed in units of organic carbon. Thecorrelations between these three compounds normalized to TOC content and both amphipod survivaland microbial bioluminescence were significant (Table 20). The correlation between amphipod sur-vival and acenaphthene improved when the chemical concentrations were normalized to the TOC con-tent (Rho = -0.595** vs. Rho =-0.641***). Otherwise, normalization to TOC content tended to dimin-ish the correlative strength between the concentrations of these three compounds and amphipod sur-vival and microbial bioluminescence.
Table 20. Spearman-rank correlations (Rho, corrected for ties) between four toxicity end-points(as percent of controls) and the concentrations of PAHs in Hudson-Raritan Estuary sediments(n=38).
Amphipod Bivalve Bivalve MicrobialSurvival Survival Development Bioluminescence
naphthalene -0.524* -0.220 ns -0.198 ns -0.577**2-methylnaph. -0.512* -0.289 ns -0.294 ns 0.653***1-methylnaph. -0.552** -0.306 ns -0.291 ns -0.673***biphenyl -0.537* -0.246 ns -0.263 ns -0.640***2,6-methylnaph. -0.567** -0.337* -0.320 ns -0.695***acenaphthylene -0.414* -0.247 ns -0.208 ns -0.652***acenaphthene -0.595** -0.272 ns -0.224 ns -0.620**1,6,7-trimethylnaph. -0.673*** -0.342* -0.258 ns -0.625***fluorene -0.623*** -0.310 ns -0.270 ns -0.634***phenanthrene -0.579** -0.331* -0.240 ns -0.641***anthracene -0.576** -0.321 ns -0.283 ns -0.673***1-methylphenanth. -0.579** -0.371* -0.252 ns -0.636***fluoranthene -0.574** -0.264 ns -0.163 ns -0.608**pyrene -0.589** -0.327* -0.233 ns -0.615**benz(a)anthracene -0.561** -0.279 ns -0.188 ns -0.604**chrysene -0.522* -0.292 ns -0.184 ns -0.526*benzo(b)fluoranth. -0.582** -0.283 ns -0.215 ns -0.615**benzo(k)fluoranth. -0.464* -0.160 ns -0.100 ns -0.489*benzo(e)pyrene -0.592** -0.262 ns -0.233 ns -0.631***benzo(a)pyrene -0.538* -0.279 ns -0.228 ns -0.615**perylene -0.580** -0.289 ns -0.236 ns -0.563**indeno(1,2,3)pyrene -0.549** -0.207 ns -0.165 ns -0.587**

83
Table 20 continued.Amphipod Bivalve Bivalve MicrobialSurvival Survival Development Bioluminescence
dibenzo(a,h)anth. -0.549** -0.291 ns -0.224 ns -0.628***benzo(g,h,i)perylene -0.480* -0.249 ns -0.196 ns -0.630***Group A(petroleum) -0.468* -0.293 ns -0.315 ns -0.625***Group B(combustion) -0.576** -0.294 ns -0.206 ns -0.602**sum low PAHs -0.592** -0.320 ns -0.266 ns -0.650***sum high PAHs -0.471* -0.128 ns -0.060 ns -0.512*sum total PAHs -0.495* -0.312 ns -0.241 ns -0.603**acenaphthene/toc -0.641*** -0.164 ns -0.083 ns -0.437*phenanthrene/toc -0.571** -0.178 ns -0.055 ns -0.398*fluoranthene/toc -0.559** -0.139 ns -0.022 ns -0.418*
*p<0.05, **p<0.001, ***p<0.0001
The concentrations of some substances equalled or exceeded the respective ERM guideline values ofLong et al. (1995) or Long and Morgan (1990), or the proposed National SQC of U.S. EPA (1994) insome of the samples. The ERM guidelines are the concentrations above which toxicity or other effectsfrequently occurred in previous studies (Long et al., 1995). The SQCs are the concentrations deter-mined by equilibrium-partitioning models to be protective of benthic organisms. In this study, it wasassumed that substances that were correlated with toxicity and equalled or exceeded either the respec-tive ERM or SQC values may have contributed to the observed toxicity. Table 19 summarizes thefrequency of guideline exceedances for those chemicals or classes of chemicals that indicated a signifi-cant negative correlation with toxicity in at least one of the tests.
None of the samples had concentrations of silver, arsenic, or cadmium that equalled or exceeded therespective ERM values (Table 21). The ERM value for chromium was exceeded only in one sample(12a from the East River). The guideline values for mercury, p,p’-DDT, p,p’-DDE, fluoranthene,phenanthrene, and total high molecular weight PAHs were equalled or exceeded most frequently. Al-though the ERM value for mercury was exceeded in 30 samples, Long et al. (1995) reported only amoderate degree of confidence in this guideline. The SQC values for fluoranthene and phenanthrenewere exceeded in many samples, often by a considerable amount. Many of the chemicals quantified insamples 7b, 9b, 11b, 12a, 17c, and 18c equalled or exceeded their respective guideline concentrations,often by a factor of 2x or greater.
Table 21. Samples from the Hudson-Raritan estuary (Phase 1) stations that equalled or exceededthe respective ERM or SQC guideline concentrations for each major substance or class of com-pounds. Stations in which the concentration exceeded the guideline by >2x are listed in bold(n=38).
Number of samples Samples in whichChemical in which ERM or SQC the ERM or SQCsubstance values were exceeded was exceeded
Silver (ERM=3.7a) 0Arsenic (ERM=70a) 0Cadmium (ERM=9.6a) 0Chromium (ERM-370a) 1 12a

84
Table 21 continued.Number of samples Samples in which
Chemical in which ERM or SQC the the ERM or SQCsubstance values were exceeded was exceeded
Copper (ERM = 270a) 2 12a, 18cMercury (ERM = 0.71a) 30 1a, 6c, 7b, 8c, 9b, 10a, 10b, 11b,
12a, 12b,13a, 16a, 16b, 17b, 17c,
18a, 18c, 22c, 23a, 24c, 25a, 26a,26c, 29a, 30a, 30b, 30c, 33b, 36c
Nickel (ERM = 51.6a) 3 11b, 12a, 17cLead (ERM = 218a) 8 8c, 9b, 12a, 10b, 11b, 12b, 17c, 18c
Zinc (ERM = 410a) 5 9b, 12a, 18c, 30a, 33bp,p’-DDE (ERM = 27a) 12 9b, 11b, 12a, 12b, 17b, 17c, 18a,
18c, 22c, 23a, 24c, 33bp,p’-DDT (ERM = 7b) 14 9b, 11b, 12a, 12b, 16a, 16b, 17b,
17c, 18a, 18c, 22c, 23a, 29a, 36ctotal PAHs (ERM = 44792a) 4 7b, 8c, 9b, 10btotal Low PAHs (ERM = 9 7b, 8c, 9b, 10b, 11b, 12a, 12b, 3160a) 16a, 17ctotal High PAHs (ERM = 14 7b, 8c, 9b, 10b, 11b, 12a, 12b, 9600a) 14a, 16a, 16b, 17b, 17c, 23a, 26cFluoranthene/toc 20 7b, 7c, 8c, 9b, 10b, 11b, 12a, (SQC = 300c) 12b, 13a, 14a, 16a, 16b, 17b,
17c, 18a, 18c, 22c, 23a, 35a, 36cAcenaphthene/toc 2 9b, 10b (SQC = 240c)Phenanthrene/toc 14 7b, 8c, 9b, 10b, 11b, 16a, 17c (SQC = 240c)
aEffects Range-Median values from Long et al. (1995)bEffects Range-Median values from Long and Morgan (1990)cSediment Quality Criteria from U.S. EPA (1994)
Mercury was among the few trace elements that were correlated with amphipod survival. Also, manyof the samples exceeded the ERM value for mercury. The relationship between amphipod survival andmercury concentrations in the sediments is illustrated in Figure 30. Amphipod survival decreasedrelatively steadily with increasing mercury concentrations, especially when the levels exceeded theERM value of 0.71 (Long et al., 1995).
Microbial bioluminescence EC50s were very low in all of the samples in which the concentrations of4,4’-DDE were above the ERM value of Long and Morgan, 1990 (Figure 31). Although the Microtoxtest results and the DDE concentrations were significantly correlated (Rho = -0.405, p<0.05), the pat-tern in response was not nearly as clear as with other toxicity tests and chemicals (i.e., amphipodsurvival correlated with the PAHs).
The correlations between amphipod survival and the concentrations of all the PAHs were consistentand clear. Also, the concentrations of these compounds often exceeded their respective guidelines.The relationships between amphipod survival and selected PAHs are illustrated in Figures 32-35. Atconcentrations of total low molecular weight PAHs below the ERM value of Long et al. (1995), amphi-

85
0
2 0
4 0
6 0
8 0
100
120
140
Am
phip
od s
urvi
val (
% o
f con
trol
s)
0 1 2 3 4 5 6
Hg, ug/g
Hudson-Raritan Estuary
15
Rho = -0.435,p<0.05
Figure 30. Relationship of amphipod survival to mercury concentrations in sediments.
ERM=0.71
0
200
400
600
800
1000
1200
1400
1600
1800
Mic
roto
x E
C50
as
perc
ent o
f con
trol
0 2 0 4 0 6 0 8 0 100 120 140 160 180 200
4,4-DDE, ng/g
Hudson-Raritan Estuary
Rho =-0.405,p<0.05ERM = 15
Figure 31. Relationship of microbial bioluminescenceEC50s to 4,4-DDE concentrations in sediments.
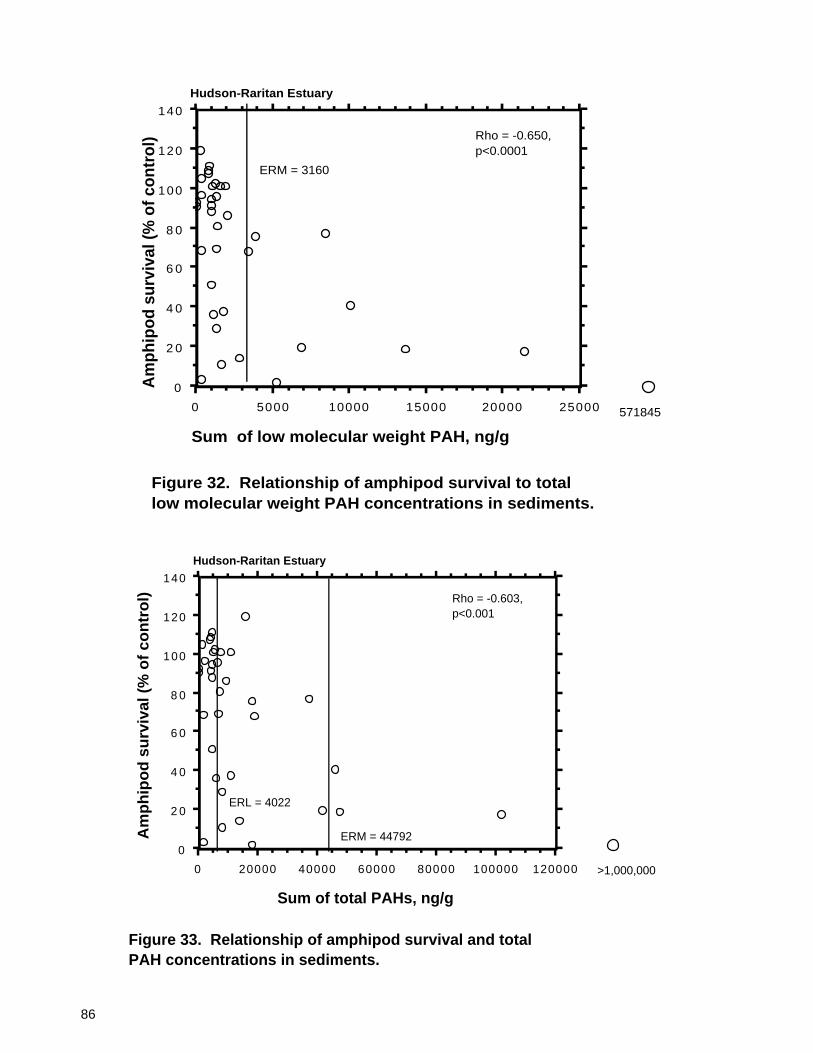
86
0
2 0
4 0
6 0
8 0
100
120
140
Am
ph
ipo
d s
urv
ival
(%
of
con
tro
l)
0 20000 40000 60000 80000 100000 120000
Sum of total PAHs, ng/g
Hudson-Raritan Estuary
Rho = -0.603,p<0.001
Figure 33. Relationship of amphipod survival and totalPAH concentrations in sediments.
>1,000,000
ERM = 44792
ERL = 4022
0
2 0
4 0
6 0
8 0
100
120
140
Am
phip
od s
urvi
val (
% o
f con
trol
)
0 5000 10000 15000 20000 25000
Sum of low molecular weight PAH, ng/g
Hudson-Raritan Estuary
Rho = -0.650,p<0.0001
Figure 32. Relationship of amphipod survival to totallow molecular weight PAH concentrations in sediments.
ERM = 3160
571845

87
0
2 0
4 0
6 0
8 0
100
120
140
Am
ph
ipo
d s
urv
ival
(%
of
con
tro
l)
0 1000 2000 3000 4000 5000
Fluoranthene, ug/goc
Hudson-Raritan Estuary
Rho = -0.418,p<0.05
Figure 34. Relationship of amphipod survival to fluoranthene concentrations (ug/goc) in sediments.
SQC = 300
21561
0
2 0
4 0
6 0
8 0
100
120
140
Am
ph
ipo
d s
urv
ival
(%
of
con
tro
ls)
0 250 500 750 1000 1250 1500 1750 2000
Phenanthrene, ug/goc
Hudson-Raritan Estuary
38713
Rho = -0.398,p<0.05
Figure 35. Relationship of amphipod survival tophenanthrene concentrations (ug/goc) in sediments.
SQC = 240

88
pod survival was highly variable (Figure 32). Relatively high survival occurred in many of the samples.In the samples in which these compounds equalled or exceeded the ERM value, however, amphipodsurvival was universally low and significantly different from controls. Amphipod survival was 0.0% inone sample from the East River that had extremely high concentrations of PAHs.
Amphipod survival was very high in all except two samples in which the total PAH concentrationswere below the ERL value of Long et al. (1995). Amphipod survival was relatively low in many of thesamples with total PAH concentrations above the ERL. Amphipod survival ranged from 0.0% to 40%in the four samples with total PAH concentrations above the ERM guideline. The data in Figure 30illustrate a relatively consistent decrease in amphipod survival with increasing concentrations of totalPAHs, in agreement with the significant correlation (Rho = -0.603, p<0.001).
The concentrations of both fluoranthene and phenanthrene normalized to TOC content were signifi-cantly correlated with amphipod survival and the concentrations in many samples equalled or ex-ceeded their respective proposed National SQC (U.S. EPA, 1994). The relationships between thesetwo compounds and amphipod survival are illustrated in Figures 34 and 35. In both cases amphipodsurvival was relatively high in most samples with chemical levels below the SQC, and decreased steadilyas the concentrations exceeded the respective SQCs.
In tables 22-24 the average concentrations of toxicants in the samples that were toxic to amphipodsurvival are compared to those in the samples that were not toxic. Also, the average concentrations inthe toxic samples were divided by the average concentrations in the nontoxic samples and these ratioswere compared among chemicals. Finally, the average concentrations in the toxic samples were com-pared with the sediment quality guidelines (SQG) of Long et al. (1995), or Long and Morgan (1990), orthe proposed National SQC (EPA, 1994). No SQG were available for substances such as aluminumand iron. We assumed that chemicals that contributed substantially to the observed toxicity would becorrelated with toxicity and highly elevated in concentration in the toxic samples, and the averageconcentrations in the highly toxic samples would exceed applicable ERM or SQC values. In the am-phipod tests 17 samples analyzed for chemical substances were not significantly toxic (i.e., differentfrom controls), 2 were significantly different from controls (but survival exceeded 80% of controls),and 19 samples caused amphipod survival in less than 80% of controls. Average amphipod survivalwas 98.4% in the nontoxic samples and 30.1% in the highly toxic samples.
The average concentrations of all the trace metals were very similar in the nontoxic, significantly toxic,and highly toxic samples, based upon the results of the amphipod tests (Table 22). The ratios in aver-age concentrations between the nontoxic samples and either the significantly toxic or highly toxicsamples ranged from 0.1 to 2.2. Most ratios were 1.0 or thereabouts. The concentrations of mercury inthe highly toxic samples were the most elevated of the metals, exceeding the concentrations in thenontoxic samples by a factor of 2.2, and exceeding the ERM value of 0.71 ppm (Long et al., 1995) bya factor of 4.5. The average concentrations of most metals exceeded the ERL values in both thenontoxic and the toxic samples, illustrating the relative similarity in concentrations among the samples.The mean total SEM concentrations exceeded the total AVS concentrations only in the nontoxic samples(a result of two nontoxic, sandy samples). Most of the variability in the SEM/AVS ratios was contrib-uted by the concentrations of zinc in the samples.
The average concentrations of chlorinated organic compounds (PCBs and pesticides) in the toxic samplesoften were very similar (i.e., ratios of about 1.0) to the concentrations in the significantly toxic samples(Table 23). However, the ratios in chemical concentrations between nontoxic and highly toxic samplesoften exceeded 2.0 and ranged upwards to 20.3 in the highly toxic samples. The average concentra-

89
Tabl
e 22
. A
vera
ge tr
ace
met
al c
once
ntra
tions
(pp
m, d
ry w
t. or
u
mol
e/g
± s.
d.)
in s
ampl
es th
at w
ere
not t
oxic
,si
gnifi
cant
ly to
xic
(p<0
.05)
, and
hig
hly
toxi
c (p
erce
nt s
urvi
val <
80%
of c
ontr
ols)
in a
mph
ipod
test
s, r
atio
s be
-tw
een
the
aver
ages
, and
rat
ios
of h
ighl
y to
xic
aver
ages
to S
QG
s.
Non
-tox
icS
igni
fican
tlyR
atio
of
Hig
hly
toxi
cR
atio
of
Rat
io o
f(9
8.4±
11.1
%to
xic
toxi
c to
(30.
1±26
.3%
toxi
c to
high
lysu
rviv
al,
(86.
2±5.
0%no
n-to
xic
surv
ival
,no
n-to
xic
toxi
c av
g.n=
17)
surv
ival
, n=
2)av
erag
esn=
19)
aver
ages
to S
QG
Silv
er2.
0±1.
0*2.
1±0.
05*
1.1
1.9±
0.7*
0.9
0.5
Alu
min
um (
%)
5.7±
2.2
5.4±
0.1
0.9
5.1±
1.1
0.9
Ars
enic
18.6
±10.
3*24
.5±3
.5*
1.3
20.7
±12.
0*1.
10.
3C
hrom
ium
116.
1±50
.2*
115.
0±5.
0*1.
012
8.7±
81.6
*1.
10.
3C
adm
ium
1.2±
0.6*
1.7±
0.4*
1.4
2.2±
1.7*
1.9
0.2
Cop
per
111.
3±62
.8*
88.5
±9.5
*0.
817
4.4±
139.
0*1.
60.
6Ir
on (
%)
3.7±
1.4
4.2±
0.7
1.1
3.3±
1.0
0.9
Mer
cury
1.4±
1.0*
*1.
3±0.
05**
0.9
3.2±
3.1*
*2.
24.
5M
anga
nese
849.
4±34
4.4
610.
0±50
.00.
755
6.5±
178.
80.
7N
icke
l34
.9±1
4.2*
32.0
±3.0
*0.
941
.0±2
4.7*
1.2
0.8
Lead
131.
4±67
.6*
110.
0±10
.0*
0.8
191.
4±12
3.8*
1.5
0.9
Ant
imon
y1.
5±1.
01.
4±0.
00.
92.
5±2.
11.
6S
elen
ium
1.0±
0.4
0.7±
0.2
0.8
1.1±
1.0
1.1
Tin
16.3
±9.3
15.0
±2.0
0.9
27.2
±21.
51.
7Z
inc
264.
6±12
3.1*
285.
0±65
.0*
1.1
330.
9±27
8.8*
1.2
0.8
SE
mol
ar C
d0.
007±
0.00
50.
009±
0.00
31.
20.
010±
0.00
81.
5S
E m
olar
Cu
0.59
3±0.
337
0.59
7±0.
009
1.0
0.63
3±-0
.528
1.1
SE
mol
ar H
g<
0.00
01±0
.0<
0.00
01±0
.01.
0<
0.00
01±0
.00.
5S
E m
olar
Ni
-0.0
5±0.
055
0.10
0±0.
004
1.0
0.09
4±0.
067
1.0
SE
mol
ar P
b0.
418±
0.22
80.
396±
0.03
71.
00.
542±
0.33
01.
3S
E m
olar
Zn
2.18
5±1.
181
2.64
1±0.
920
1.2
2.10
2±0.
936
1.0
Tota
l SE
M3.
299±
1.68
33.
74±0
.87
1.1
3.38
0±1.
643
1.0
SE
M/A
VS
rat
ios
1.21
±2.4
1***
0.16
±0.0
60.
10.
16±0
.15
0.1
Tota
l mol
ar A
VS
25.4
±22.
624
.3±5
.81.
031
.6±2
0.4
1.2
*Con
cent
ratio
n eq
uals
or
exce
eds
ER
L va
lue
(Lon
g et
al.,
199
5). *
*Con
cent
ratio
ns e
qual
s or
exc
eeds
ER
M v
alue
(Lo
ng e
tal
., 19
95).
***
Exc
eeds
rat
io o
f 1.0
.
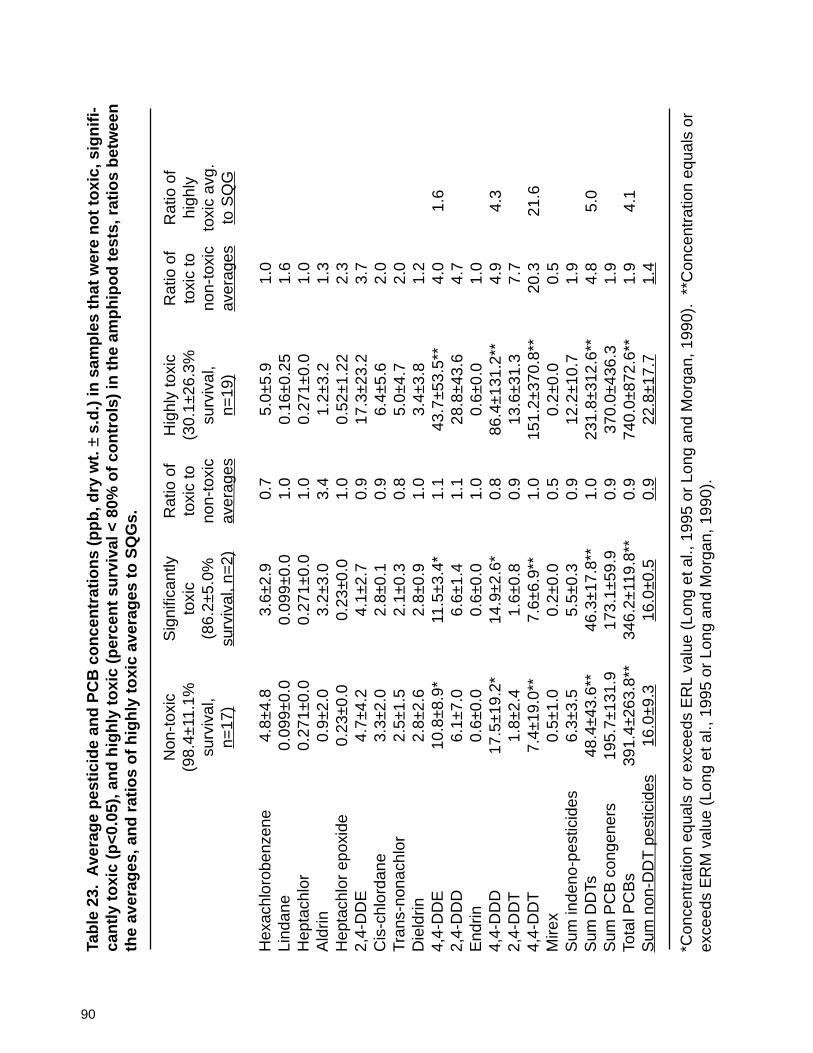
90
Tabl
e 23
. A
vera
ge p
estic
ide
and
PC
B c
once
ntra
tions
(pp
b, d
ry w
t. ±
s.d.
) in
sam
ples
that
wer
e no
t tox
ic, s
igni
fi-ca
ntly
toxi
c (p
<0.0
5), a
nd h
ighl
y to
xic
(per
cent
sur
viva
l < 8
0% o
f con
trol
s) in
the
amph
ipod
test
s, r
atio
s be
twee
nth
e av
erag
es, a
nd r
atio
s of
hig
hly
toxi
c av
erag
es to
SQ
Gs.
Non
-tox
icS
igni
fican
tlyR
atio
of
Hig
hly
toxi
cR
atio
of
Rat
io o
f(9
8.4±
11.1
%to
xic
toxi
c to
(30.
1±26
.3%
toxi
c to
high
lysu
rviv
al,
(86.
2±5.
0%no
n-to
xic
surv
ival
,no
n-to
xic
toxi
c av
g.n=
17)
surv
ival
, n=
2)av
erag
esn=
19)
aver
ages
to S
QG
Hex
achl
orob
enze
ne4.
8±4.
83.
6±2.
90.
75.
0±5.
91.
0Li
ndan
e0.
099±
0.0
0.09
9±0.
01.
00.
16±0
.25
1.6
Hep
tach
lor
0.27
1±0.
00.
271±
0.0
1.0
0.27
1±0.
01.
0A
ldrin
0.9±
2.0
3.2±
3.0
3.4
1.2±
3.2
1.3
Hep
tach
lor
epox
ide
0.23
±0.0
0.23
±0.0
1.0
0.52
±1.2
22.
32,
4-D
DE
4.7±
4.2
4.1±
2.7
0.9
17.3
±23.
23.
7C
is-c
hlor
dane
3.3±
2.0
2.8±
0.1
0.9
6.4±
5.6
2.0
Tran
s-no
nach
lor
2.5±
1.5
2.1±
0.3
0.8
5.0±
4.7
2.0
Die
ldrin
2.8±
2.6
2.8±
0.9
1.0
3.4±
3.8
1.2
4,4-
DD
E10
.8±8
.9*
11.5
±3.4
*1.
143
.7±5
3.5*
*4.
01.
62,
4-D
DD
6.1±
7.0
6.6±
1.4
1.1
28.8
±43.
64.
7E
ndrin
0.6±
0.0
0.6±
0.0
1.0
0.6±
0.0
1.0
4,4-
DD
D17
.5±1
9.2*
14.9
±2.6
*0.
886
.4±1
31.2
**4.
94.
32,
4-D
DT
1.8±
2.4
1.6±
0.8
0.9
13.6
±31.
37.
74,
4-D
DT
7.4±
19.0
**7.
6±6.
9**
1.0
151.
2±37
0.8*
*20
.321
.6M
irex
0.5±
1.0
0.2±
0.0
0.5
0.2±
0.0
0.5
Sum
inde
no-p
estic
ides
6.3±
3.5
5.5±
0.3
0.9
12.2
±10.
71.
9S
um D
DTs
48.4
±43.
6**
46.3
±17.
8**
1.0
231.
8±31
2.6*
*4.
85.
0S
um P
CB
con
gene
rs19
5.7±
131.
917
3.1±
59.9
0.9
370.
0±43
6.3
1.9
Tota
l PC
Bs
391.
4±26
3.8*
*34
6.2±
119.
8**
0.9
740.
0±87
2.6*
*1.
94.
1S
um n
on-D
DT
pes
ticid
es16
.0±9
.316
.0±0
.50.
922
.8±1
7.7
1.4
*Con
cent
ratio
n eq
uals
or
exce
eds
ER
L va
lue
(Lon
g et
al.,
199
5 or
Lon
g an
d M
orga
n, 1
990)
. **
Con
cent
ratio
n eq
uals
or
exce
eds
ER
M v
alue
(Lo
ng e
t al.,
199
5 or
Lon
g an
d M
orga
n, 1
990)
.

91
tions of parent 4,4'-DDT in the highly toxic samples exceeded the average concentration in the non-toxic samples by a factor of 20.3 and exceeded the ERM value of Long and Morgan (1990) by a factorof 21.6. The other isomers of DDT were highly elevated in the highly toxic samples and often ex-ceeded respective ERM guideline values. The sums of the quantified PCB congeners were multipliedby 2.0 to estimate the concentration of total PCB (NOAA, 1989). The average concentrations of totalPCBs in the highly toxic samples exceeded the average concentration in the nontoxic samples by afactor of 1.9 and exceeded the ERM value of Long et al. (1995) by a factor of 4.1.
The concentrations of all categories of PAHs were considerably elevated in the samples that werehighly toxic to the amphipods relative to the samples that were not toxic (Table 24). The concentra-tions of organic carbon, inorganic carbon, and fine-grained sediment particles were not elevated in thehighly toxic samples to the same degree as the PAHs. The average concentrations of total low molecuarweight PAHs in the toxic samples (34,672 ppb) exceeded the average concentrations in the nontoxicsamples (922 ppb) by a factor of 37.6 and exceeded the ERM value for LPAH of Long et al. (1995) bya factor of 11.0. Also, both the high molecular weight compounds and total PAHs were elevated inconcentration in the toxic samples relative to the nontoxic samples. The concentrations of bothfluoranthene and phenanthrene in the highly toxic samples exceeded both the average concentrationsin the nontoxic samples and the respective SQC concentrations by a considerable amount. Althoughthe average concentration of acenaphthene in the toxic samples exceeded the nontoxic average by afactor of 58.7, it exceeded the SQC by a factor of only 2.8.
In tables 25-27 the average concentrations of chemicals in samples that were toxic to microbial bi-oluminescence were compared with those that were not toxic. As observed in the amphipod tests, theaverage trace metals concentrations were relatively similar in the toxic and nontoxic samples, as indi-cated by ratios between the averages of 1.0 or therabouts (Table 25). Among the metals that werequantified, the concentrations of zinc were most elevated in the highly toxic samples; the averageconcentration of 442 ppm in the highly toxic samples exceeded the average in the nontoxic samples(240.7 ppm) by a factor of 1.8. Also, the concentration of lead in the highly toxic samples (average of224 ppm) exceeded the average concentration in the nontoxic samples (132.4 ppm) by a factor of 1.7.The average concentrations of both lead and zinc in the highly toxic samples were very similar to theERM values (218 and 410 ppm, respectively). The average concentrations of mercury in all threecategories were very similar (2.0-2.4 ppm) and exceeded the ERM value of 0.71 ppm. The concentra-tions of trace elements simultaneously extracted with the acid-volatile sulfides were very similar amongthe three toxicity categories. The SEM/AVS ratios averaged 1.0 in the nontoxic samples and 0.1 in thesignificantly toxic and highly toxic samples.
Again, as observed in the amphipod tests, most of the pesticides and other chlorinated organics oc-curred in similar concentrations in both the toxic and nontoxic samples (Table 26). The concentrationsof some compounds, such as heptachlor were below the detection limits in all samples, as indicated bystandard deviations of 0.0 in all categories. The average concentrations of many compounds (e.g., 4,4'-DDE, 4,4'-DDT) actually were considerably lower in the highly toxic samples than in the nontoxicsamples, despite the significant Spearman-rank correlations observed with these data. However, theconcentrations in the highly toxic samples often exceeded the respective ERM values. The averageconcentrations of total PCBs were relatively high, exceeding the ERM value of 180 ppb, in all catego-ries. One highly toxic sample from site 12 in the East River had a detectable concentration of hep-tachlor epoxide, thus driving up the average for that compound.

92
Tabl
e 24
. A
vera
ge P
AH
con
cent
ratio
ns (
ppb,
dry
wt.
± s.
d.)
in s
ampl
es th
at w
ere
not t
oxic
, sig
nific
antly
toxi
c(p
<0.0
5), a
nd h
ighl
y to
xic
(per
cent
sur
viva
l < 8
0% o
f con
trol
s) in
the
amph
ipod
test
s, r
atio
s be
twee
n th
e av
er-
ages
, and
rat
ios
betw
een
high
ly to
xic
aver
ages
and
res
pect
ive
SQ
Gs.
Non
-tox
icS
igni
fican
tlyR
atio
of
Hig
hly
toxi
cR
atio
of
Rat
io o
f(9
8.4±
11.1
%to
xic
toxi
c to
(30.
1±26
.3%
toxi
c to
high
lysu
rviv
al,
(86.
2±5.
0%no
n-to
xic
surv
ival
,no
n-to
xic
toxi
c av
g.n=
17)
surv
ival
, n=
2)av
erag
esn=
19)
aver
ages
to S
QG
Sum
pet
role
um-r
elat
ed20
57±6
659
448±
125
0.2
1285
8±46
456
6.3
Sum
com
bust
ion-
rela
ted
3526
±225
742
14±1
158
1.2
4471
5±11
8799
12.7
Sum
LP
AH
922±
583*
1167
±220
*1.
334
672±
1267
21**
37.6
11.0
Sum
HP
AH
6808
±827
8*43
79±1
202*
0.6
4814
2±12
0134
**7.
15.
0S
um to
tal P
AH
5427
±383
8*55
47±1
422*
1.0
8027
0±24
6981
**14
.81.
8P
erce
nt T
OC
2.4±
1.1
2.2±
0.3
0.9
2.8±
1.4
1.2
Per
cent
TIC
0.2±
0.3
0.05
±0.0
20.
20.
7±0.
82.
9P
erce
nt fi
nes
41.4
±24.
241
.3±1
4.6
1.0
37.2
±18.
80.
9F
luor
anth
ene/
toc
474.
0±95
6.3*
**29
9.9±
54.9
0.6
2161
.7±4
672.
8***
4.6
7.2
Ace
naph
then
e/to
c11
.4±7
.112
.9±4
.31.
166
7.5±
2489
.8**
*58
.72.
8P
hena
nthr
ene/
toc
123.
1 ±12
5.0
151.
1±16
.41.
224
91.1
±854
8.2*
**20
.210
.4
*Con
cent
ratio
n eq
uals
or
exce
ed E
RL
valu
e (L
ong
et a
l., 1
995)
. **
Con
cent
ratio
ns e
qual
s or
exc
eeds
ER
M v
alue
(Lo
nget
al.,
199
5).
***C
once
ntra
tion
equa
ls o
r ex
ceed
s pr
opos
ed S
QC
(E
PA
, 199
4).

93
Tabl
e 25
. A
vera
ge t
race
met
al c
once
ntra
tions
(pp
m,
dry
wt.
or
um
ole/
g ±
s.d.
) in
sam
ples
tha
t w
ere
not
toxi
c,si
gnifi
cant
ly to
xic
(p<0
.05)
, and
hig
hly
toxi
c (p
erce
nt s
urvi
val <
80%
of c
ontr
ols)
in M
icro
tox
test
s, r
atio
s be
twee
nth
e av
erag
es, a
nd r
atio
s of
hig
hly
toxi
c av
erag
es to
SQ
Gs.
Non
-tox
icS
igni
fican
tlyR
atio
of
Hig
hly
toxi
cR
atio
of
Rat
io o
f(E
C50
sto
xic
(EC
50s
toxi
c to
(EC
50s
toxi
c to
high
ly6.
3±8.
8,1.
7±0.
04,
non-
toxi
c1.
3±0.
4,no
n-to
xic
toxi
c av
g.n=
22)
n=6)
aver
ages
n=10
)av
erag
esto
SQ
G
Silv
er1.
8±0.
9*2.
0±0.
7*1.
12.
4±0.
1*1.
40.
6A
lum
inum
(%
)5.
1±2.
05.
4±0.
71.
16.
0±1.
11.
2A
rsen
ic18
.0±1
1.2*
23.1
±13.
5*1.
322
.5±7
.7*
1.2
0.3
Chr
omiu
m10
8.0±
54.1
*10
7.0±
16.9
*1.
016
3.1±
90.7
*1.
50.
4C
adm
ium
1.6±
1.5*
1.6±
0.8*
1.0
2.1±
1.3*
1.3
0.2
Cop
per
123.
7±11
2.7*
124.
5±42
.7*
1.0
191.
4±12
3.5*
1.5
0.7
Iron
(%
)3.
1±1.
33.
7±1.
01.
24.
3±0.
71.
3M
ercu
ry2.
4±3.
1**
2.0±
1.4*
*0.
82.
2±1.
2**
0.9
3.1
Man
gane
se62
6±27
573
0±29
81.
280
8±33
31.
3N
icke
l32
.3±1
5.4*
35.7
±6.2
*1.
151
.3±2
7.4*
1.6
1.0
Lead
132.
4±80
.5*
156.
5±84
.3*
1.2
224.
0±12
7.9*
*1.
71.
0A
ntim
ony
1.9±
1.7
1.3±
0.6
0.7
2.7±
2.0
1.4
Sel
eniu
m1.
1±0.
90.
8±0.
40.
71.
1±0.
51.
0Ti
n18
.6±1
3.1
19.3
±8.2
1.0
30.1
±25.
21.
6Z
inc
240.
7±13
1.5*
273.
3±89
.8*
1.1
442.
0±32
7.3*
*1.
81.
1S
E m
olar
Cd
0.01
00±0
.010
00.
0102
±0.0
062
1.0
0.01
03±0
.006
21.
0S
E m
olar
Cu
0.58
00±0
.500
00.
5539
±0.3
818
1.0
0.71
17±0
.278
31.
2S
E m
olar
Hg
<.0
001±
0.00
01<
.000
1±0.
0001
1.0
<.0
001±
0.00
011.
0S
E m
olar
Ni
0.10
00±0
.070
00.
0768
±0.0
351
0.8
0.09
72±0
.029
71.
0S
E m
olar
Pb
0.41
00±0
.250
00.
3494
±0.1
530
0.9
0.70
65±0
.298
51.
7S
E m
olar
Zn
1.99
00±1
.090
01.
7569
±0.7
411
0.9
2.79
30±0
.858
51.
4To
tal S
EM
3.1±
1.8
2.7±
1.2
0.9
4.3±
1.0
1.4
SE
M/A
VS
rat
ios
1.0±
2.2
0.1±
0.1
0.1
0.1±
0.1
0.1
Tota
l mol
ar A
VS
22.1
±18.
433
.1±2
7.4
1.5
39.7
±16.
61.
8
*Con
cent
ratio
n eq
uals
or
exce
eds
ER
L va
lue
(Lon
g et
al.,
199
5). *
*Con
cent
ratio
ns e
qual
s or
exc
eeds
ER
M v
alue
(Lo
nget
al.,
199
5).

94
Tabl
e 26
. A
vera
ge p
estic
ide
and
PC
B c
once
ntra
tions
(pp
b, d
ry w
t. ±
s.d.
) in
sam
ples
tha
t w
ere
not
toxi
c,si
gnifi
cant
ly to
xic
(p<0
.05)
, and
hig
hly
toxi
c (p
erce
nt s
urvi
val <
80%
of c
ontr
ols)
in th
e M
icro
tox
test
s, r
atio
sbe
twee
n th
e av
erag
es, a
nd r
atio
s of
hig
hly
toxi
c av
erag
es to
SQ
Gs.
Non
-tox
icS
igni
fican
tlyR
atio
of
Hig
hly
toxi
cR
atio
of
Rat
io o
f(E
C50
sto
xic
(EC
50s
toxi
c to
(EC
50s
toxi
c to
high
ly6.
3±8.
8,1.
6±0.
04,
non-
toxi
c1.
3±0.
4,no
n-to
xic
toxi
c av
g.n=
22)
n=6)
aver
ages
n=10
)av
erag
esto
SQ
G
hexa
chlo
robe
nzen
e4.
8±5.
11.
9±1.
80.
46.
6±6.
31.
4lin
dane
0.1±
0.0
0.3±
0.4
2.9
0.1±
0.0
1.0
hept
achl
or0.
3±0.
00.
3±0.
01.
00.
3±0.
01.
0al
drin
1.6±
3.3
0.2±
0.0
0.1
0.9±
2.0
0.5
hept
achl
or e
poxi
de0.
2±0.
00.
2±0.
01.
00.
8±1.
63.
42,
4'-D
DE
12.8
±19.
03.
1±1.
10.
211
.6±1
9.3
0.9
cis-
chlo
rdan
e4.
9±5.
2*2.
9±1.
5*0.
65.
7±3.
4*1.
1tr
ans-
nona
chlo
r3.
7±4.
12.
4±0.
60.
64.
6±3.
41.
2di
eldr
in2.
8±2.
2*1.
7±2.
2*0.
64.
6±4.
7*1.
74,
4'-D
DE
34.3
±50.
9**
6.4±
4.5*
0.2
24.2
±22.
6*0.
70.
92,
4'-D
DD
25.5
±41.
22.
6±2.
90.
18.
9±9.
70.
3en
drin
0.6±
0.0*
0.6±
0.0*
1.0
0.6±
0.0*
1.0
4,4'
-DD
D71
.8±1
24.7
**8.
4±5.
0*0.
133
.7±3
6.1*
*0.
51.
72,
4'-D
DT
12.5
±29.
20.
5±0.
4<
0.1
1.4±
1.5
0.1
4,4'
-DD
T12
9.5±
349.
0**
7.8±
14.2
**0.
111
.8±1
2.8*
*0.
11.
7m
irex
0.2±
0.0
0.9±
1.5
3.6
0.2±
0.0
1.0
tota
l ind
eno-
pes
ticid
es9.
2±9.
35.
8±2.
00.
611
.3±8
.31.
2to
tal D
DTs
192.
3±29
9.9*
*28
.8±2
3.4*
0.1
91.7
±84.
6**
0.5
2.0
tota
l PC
B c
onge
ners
258.
0±21
5.8
116.
8±37
.00.
543
2.4±
527.
51.
7to
tal P
CB
s51
6.0±
431.
6**2
33.6
±74.
0**
0.5
864.
8±10
55.0
**1.
74.
8to
tal n
on-D
DT
pes
ticid
es19
.4±1
4.8
11.3
±4.6
0.6
24.3
±15.
11.
3
*Con
cent
ratio
n eq
uals
or
exce
eds
ER
L va
lue
(Lon
g et
al.,
199
5 or
Lon
g an
d M
orga
n, 1
990)
. **
Con
cent
ratio
neq
uals
or
exce
eds
ER
M v
alue
(Lo
ng e
t al.,
199
5 or
Lon
g an
d M
orga
n, 1
990)
.

95
Tabl
e 27
. A
vera
ge P
AH
con
cent
ratio
ns (
ppb,
dry
wt.
± s.
d.)
in s
ampl
es th
at w
ere
not t
oxic
, sig
nific
antly
toxi
c (p
<0.0
5),
and
high
ly to
xic
(per
cent
sur
viva
l < 8
0% o
f con
trol
s) in
the
Mic
roto
x te
sts,
rat
ios
betw
een
the
aver
ages
, and
rat
ios
be-
twee
n hi
ghly
toxi
c av
erag
es a
nd r
espe
ctiv
e S
QG
s.
Non
-tox
icS
igni
fican
tlyR
atio
of
Hig
hly
toxi
cR
atio
of
Rat
io o
f(E
C50
sto
xic
(EC
50s
toxi
c to
(EC
50s
toxi
c to
high
ly6.
3±8.
8,1.
7±0.
04,
non-
toxi
c1.
3±0.
4,no
n-to
xic
toxi
c av
g.n=
22)
n=6)
aver
ages
n=10
)av
erag
esto
SQ
G
Sum
pet
role
um-r
elat
ed84
5±13
8067
01±1
0076
7.9
2213
5±62
558
26.2
Sum
com
bust
ion-
rela
ted
9332
±166
5013
910±
1437
31.
562
917±
1601
496.
7S
um L
PA
H23
37±4
389*
4518
±530
0**
1.9
5982
4±17
0688
**25
.618
.9S
um H
PA
H10
311±
1707
1**
1850
2±15
735*
*1.
870
134±
1608
61**
6.8
7.3
Sum
of t
otal
PA
H11
948±
2140
6*21
146±
1849
5*1.
812
3875
±333
291*
*10
.42.
8pe
rcen
t TO
C2.
2±1.
22.
7±0.
81.
23.
6±1.
01.
6pe
rcen
t TIC
0.4±
0.6
0.3±
0.3
0.8
0.7±
0.8
1.9
perc
ent f
ines
34.3
±24.
047
.4±1
3.5
1.4
45.2
±15.
01.
3flu
oran
then
e/to
c67
2.3±
927.
1***
951.
9±82
9.8*
**1.
429
22.7
±631
9.5*
**4.
39.
7ac
enap
hthe
ne/to
c33
.6±4
8.1
110.
6±15
1.8
3.3
1149
.9±3
357.
7***
34.2
4.8
phen
anth
rene
/toc
293.
6±38
5.9*
**42
2.6 ±
427.
9***
1.4
4073
.2± 1
1548
.0**
*13
.917
.0
*Con
cent
ratio
n eq
uals
or
exce
ed E
RL
valu
e (L
ong
et a
l., 1
995)
. **
Con
cent
ratio
ns e
qual
s or
exc
eeds
ER
M v
alue
(Lo
ng e
t al.,
1995
). *
**C
once
ntra
tion
equa
ls o
r ex
ceed
s pr
opos
ed N
atio
nal S
QC
(E
PA
, 199
4).

96
All of the classes of PAHs were considerably elevated in concentration in the samples that were highlytoxic to microbial bioluminescence (Table 27). The average concentration of LPAH in the highly toxicsamples exceeded the average concentration in the nontoxic samples by a factor of 25.6 and exceededthe ERM value by a factor of 18.9. Also, the concentrations of petroleum-related compounds,acenaphthene, and phenanthrene were very high in the highly toxic samples. All three of the individualPAHs exceeded the proposed National SQCs (U.S. EPA, 1994) in the highly toxic samples. The con-centrations of organic carbon, inorganic carbon, and fine-grained sediments were slightly higher in thehighly toxic samples relative to the nontoxic samples.
Relationships between Toxicity and Physical-Chemical Parameters: Phase 2. The Spearman-rankcorrelations between amphipod survival in the Phase 2 samples and the concentrations of trace metalsare compared in Table 28. The correlations were performed for the concentrations of total individualmetals, total acid-volatile sulfides (AVS), and the SEM/AVS ratios. The correlations between percentamphipod survival and total metals concentrations were significant for all elements except arsenic,aluminum, iron, nickel, and antimony. The concentrations of total cadmium were most strongly corre-lated with amphipod survival. Also, amphipod survival was significantly correlated with increasingconcentrations of AVS. However, the ratios of total SEM to total AVS were not correlated with amphi-pod survival. If the number of variables (16) were taken into account, only correlations listed as “**”would remain significant.
Table 28. Spearman-rank correlations (Rho, corrected for ties) between percent amphipod sur-vival and the concentrations of total trace metals and with the ratios of simultaneously extractedmetals (SEM) to acid-volatile sulfides (AVS) in Phase 2 sediments (n=20).
Total metals SEM/AVS(ug/g dry wt.) (u moles/g)
Silver -0.585*Arsenic -0.332 nsAluminum -0.095 nsCadmium -0.777**Chromium -0.673*Copper -0.723*Iron -0.209 nsMercury -0.612*Nickel -0.137 nsLead -0.681*Antimony -0.378 nsTin -0.734*Selenium -0.647*Zinc -0.534*Total AVS -0.565*SEM/AVS ratios +0.248 ns
ns = not significant (p>0.05). * p<0.05 ** p<0.001SEM = (sum of Cd, Cu, Pb, Ni, Zn)
The Spearman-rank correlation coefficient for amphipod survival and the concentration of un-ionizedammonia in the overlying water in the amphipod test chamber was not significant (Rho = -0.105,

97
p>0.05, n=50). The concentration of un-ionized ammonia exceeded the detection limit (0.35 ug/l) inseven of the samples and the maximum recorded concentration was 620 ug/l. Three of the samplesexceeded the no- observed-effects concentration and none equalled or exceeded the unionized ammo-nia LC50 for A. abdita (Figure 36) reported by Kohn et al. (1994).
The correlations between amphipod survival and the concentrations of chlorinated organic compoundsand total organic carbon are listed and compared in Table 29. Nearly all of the pesticides and PCBgroups were significantly correlated with toxicity to the amphipods. Compounds that were very highlycorrelated with amphipod survival included dieldrin (expressed both in dry weight and organic car-bon), p, p’-DDE, and total PCBs (estimated by GC, as the total of quantified congeners, and by GC/MS). Amphipod survival was more highly correlated with the DDE isomers than with the DDT iso-mers. The correlations with endrin were not significant. The correlations with total organic carbonalso were not significant. If the number of variables tested (18) were accounted for, only those corre-lations shown with “**” would be significant.
Table 29. Spearman-rank correlations (Rho, corrected for ties) between percent amphipod sur-vival and the concentrations of chlorinated organic compounds in Newark Bay sediments (n=20).
Chemical Correlation Chemical Correlationname coefficient name coefficient
hexachlorobenzene -0.633* pentachloro anisole -0.599*alpha-BHC -0.234 ns lindane -0.242 nsbeta-BHC +0.174 ns heptachlor -0.100 nsdelta-BHC -0.487* dacthal -0.289 nsoxychlordane -0.633* heptachlor epoxide -0.680*trans-chlordane -0.705* trans-nonachlor -0.699*cis-chlordane -0.677* o, p’-DDE -0.707*dieldrin -0.848** p, p’-DDE -0.800**o, p’-DDD -0.629* endrin -0.437 nscis-nonachlor -0.707* o, p’-DDT -0.576*p, p’-DDD -0.597* p, p’-DDT -0.253 nsmirex -0.569* total GC PCBs -0.802**total DDTs -0.576* sum of total PCBs -0.783**percent TOC -0.205 ns endrin/toc -0.253 nsdieldrin/toc -0.841**
ns = not significant (p>0.05). *p<0.05, **p<0.001
The correlations between amphipod survival and the concentrations of nearly all the dioxin and furancompounds were highly significant (Table 30). The concentrations were expressed as units of dryweight for individual compounds. Also, the concentrations of selected compounds were multiplied bythe respective 2,3,7,8-tcdd toxicity equivalency factors of Barnes et al. (1991) for co-planar PCBs andKutz et al. (1990) for dioxins and furans and summed to estimate the total toxicity equivalency quo-tients (TEQ). The correlations were particularly strong for 2,3,7,8-tcdd, 2,3,7,8-tcdf, the cumulative2,3,7,8-tcdd TEQ for total PCBs, and the total cumulative TEQ for dioxins, furans, and PCBs. Amphi-pod survival was significantly correlated with tcdd-equivalent concentrations determined in H4IIE rathepatoma bioassays of the whole F1 extract and several of the extract fractions, but not with the F5fraction (PAHs). If the number of variables tested (28) were accounted for, only those correlationsshown with “**” would be significant.

98
0
2 0
4 0
6 0
8 0
100
120
Per
cen
t am
ph
ipo
d s
urv
ival
- 1 0 0 0 100 200 300 400 500 600 700 800 900
Un-ionized ammonia in overlying water, ug/l
Newark Bay
LC50 =830 ug/l
Rho = -0.105 ns
NOEC
Figure 36. Relationship of amphipod survival to theconcentrations of un-ionized ammonia (ug/l) in theoverlying water of the test chambers.
Table 30. Spearman-rank correlations (Rho, corrected for ties) between percent amphipodsurvival and the concentrations of chlorinated dibenzo dioxin and dibenzo furan compounds inNewark Bay sediments (n=20).
Chemical Correlation Chemical Correlationname coefficient name coefficient
2378-tcdd -0.868** 12378-pcdd -0.683*12478-pcdd -0.539* 123478-hcdd -0.725*123678-hcdd -0.761** 123789-hcdd -0.684*1234678-hcdd -0.734* octodichloro-dd -0.675*2378-tcdf -0.863** 12378-pcdf -0.714*23478-pcdf -0.731* 123478-hcdf -0.639*123678-hcdf -0.677* 123789-hcdf -0.584234678-hcdf -0.558* 1234678-hcdf -0.618*1234789-hcdf -0.654* octochloro-df -0.613*total dioxins TEQ -0.866** total PCBs TEQ -0.850**total cumulative TEQ -0.865** total F1 extract -0.614**F5 fraction -0.393 ns F7 fraction -0.128 nsF8 fraction -0.659** F9 fraction -0.599**F11 fraction -0.630** F12 fraction -0.815***
ns = not significant (p>0.05), *p<0.05, **p<0.001

99
None of the correlations between amphipod survival and the concentrations of PAHs were statisticallysignificant (Table 31). These results are in sharp contrast with those from the Phase 1 samples, inwhich the PAHs were highly correlated with toxicity to amphipods.
Table 31. Spearman-rank correlations (Rho, corrected for ties) between percent amphipod sur-vival and the concentrations of polynuclear aromatic hydrocarbons (PAHs) in Newark Bay sedi-ments (n=20).
Chemical Correlation Chemical Correlationname coefficient name coefficient
naphthalene -0.149 ns benzo(b)thiophene -0.394 ns2-methyl naphthalene -0.313 ns 1-methyl naphthalene -0.262 nsbiphenyl -0.131 ns 2,6/2,7 dimethyl naphthalene +.023 nsacenaphylene -0.212 ns acenapthene -0.162 nsfluorene -0.131 ns dibenzothiophene -0.402 nsphenanthrene -0.212 ns anthracene +0.013 nsfluoranthene -0.244 ns pyrene -0.359 nsbenzo(a)anthracene -0.145 ns chrysene -0.209 nsbenzo(b)fluoranthene -0.138 ns benzo(k)fluoranthene -0.206 nsbenzo(e)pyrene -0.186 ns benzo(a)anthracene -0.147 nsperylene -0.122 ns indeno(1,2,3)pyrene -0.185 nsdibenzo(a,h)anthracene -0.188 ns benzo(g,h,i)perylene -0.203 nstotal LPAH -0.098 ns total HPAH -0.203 nssum total PAH -0.194 ns acenaphthene/toc -0.152 nsphenanthrene/toc -0.241 ns fluoranthene/toc -0.346 ns
ns = not significant (p>0.05)
The concentrations of many of the chemicals quantified in Phase 2 equalled or exceeded respectiveguideline values (Table 32). In particular, the concentrations of many chlorinated organic compounds,such as 2,3,7,8-tcdd, the isomers of DDT, and total PCBs, equalled or exceeded the respective guide-lines in many of the samples. The concentrations of 2,3,7,8-tcdd exceeded the proposed sedimentguideline (100 pg/g, parts per trillion) for the protection of benthic organisms (U.S. EPA, 1993) andhuman health receptors (New York Sate Department of Environmental Conservation, 1993) by morethan two fold in many samples. The cumulative 2378-tcdd toxicity equivalency quotients (TEQ) for allof the dioxins, furans, and PCBs also exceeded the guideline value by factors of up to four fold. Allthree p,p- isomers of DDE, DDD, and DDT equalled or exceeded the respective ERM values (Long etal., 1995; Long and Morgan, 1990) in many samples. However, the authors of these reports expressedonly a moderate degree of confidence in these guidelines. The concentrations of total PCB congenersexceeded the ERM value of 180 ppb in most of the samples.
The concentrations of many of the chlorinated organic compounds were elevated, frequently by >2X,in many of the Phase 2 samples. In comparison, the concentrations of most trace elements were notparticularly elevated in these samples (Table 32). None of the samples had concentrations of arsenic,cadmium, copper, or chromium that exceeded the respective ERM values. Although many of thesamples had mercury concentrations that exceeded the ERM value of 0.71 ppm, Long et al. (1995) hadonly a moderate degree of confidence in this ERM value. Lead and zinc concentrations equalled orexceeded the respective ERM values in 10 samples, but never by a factor of two fold or greater. The

100
concentrations of both low and high molecular weight PAHs were elevated in many samples; however,the concentrations of total PAHs exceeded the ERM value in only two samples. The PAH concentra-tions were particularly high in the sample from station 1 in the Passaic River. The samples collected inthe Passaic River (stations 1-11) and the sample from station 26 (central Newark Bay) had elevatedconcentrations of many chemicals.
Table 32. Samples from the Phase 2 stations that equalled or exceeded the respective ERM orSQC values for each major substance or class of compounds. Stations in which the concentra-tion exceeded the guideline by >2x are listed in bold (n=20).
Number of samples Samples in whichChemical in which guideline the ERM or SQCsubstance values were exceeded was exceeded
2378-tcdd (SQG = 100 ppta) 11 3, 5, 7a, 7b, 7c, 8a, 8b, 10,11, 21, 26
total cum. PCB TEQ 2 7c, 26 (SQG = 100 ppta)total dioxins TEQ 14 1, 3, 5, 7a, 7b, 7c, 8a, 8b, 10, 11, (SQG = 100ppta) 11, 14, 21, 26, 31total cumulative TEQ 15 1, 3, 5, 7a, 7b, 7c, 8a, 8b, 10, 11, (SQG = 100ppta) 11, 14, 21, 26, 31, 36p,p’ - DDE (ERM = 27 ppbb) 13 3, 5, 7a, 7b, 7c, 8a, 8b, 10, 11,
26, 31, 36, 56total PCBs (ERM = 180 ppbb) 16 1, 3, 5, 7a, 7b, 7c, 8a, 8b, 10,
11, 14, 21, 26, 31, 36, 56p, p’ - DDD (ERM = 20 ppbc) 15 1, 3, 5, 7a, 7b, 7c, 8a, 8b, 10,
11, 14, 26, 31, 36, 56p, p’ - DDT (ERM = 7 ppbc) 14 1, 3, 5, 7a, 7b, 7c, 8a, 8b, 10,
11, 14, 31, 36, 56total DDTs (ERM = 46.1 ppbb) 15 1, 3, 5, 7a, 7b, 7c, 8a, 8b, 10,
11, 14, 26, 31, 36, 56dieldrin/oc (SQC = 20 ug/gocd) 0 noneendrin/oc (SQC = 0.76 ug/gocd) 0 nonesilver (ERM = 3.7 ppmb) 7 5, 7a, 7b, 7c, 8a, 8b, 10arsenic (ERM = 70 ppmb) 0 nonecadmium (ERM = 9.6 ppmb) 0 nonechromium (ERM = 370 ppmb) 0 nonecopper (ERM = 270 ppmb) 0 nonemercury (ERM = 0.71 ppmb) 17 3, 5, 7a, 7b, 7c, 8a, 8b, 10,
11, 14, 17, 20, 21, 26, 31, 36, 56nickel (ERM = 51.6 ppmb) 3 10, 11, 56lead (ERM = 218 ppmb) 10 3, 5, 7a, 7b, 7c, 8a, 8b, 10,
11, 14zinc (ERM = 410 ppmb) 10 3, 5, 7a, 7b, 7c, 8a, 8b, 10,
11, 20total LPAH (ERM = 3160 ppbb) 9 1, 3, 5, 7a, 7b, 8b, 14, 20, 21total HPAH (ERM - 9600 ppbb) 13 1, 3, 5, 7a, 7b, 7c, 8a, 8b, 11, 14, 17, 20, 21

101
Table 32 continued.Number of samples Samples in which
Chemical in which guideline the ERM or SQCsubstance values were exceeded was exceeded
total PAH (ERM = 44792 ppbb) 2 1, 3acenaphthene (SQC = 0 none 230 ug/gocd)phenanthrene (SQC = 1 1 240 ug/gocd)fluoranthene (SQC = 3 1, 20, 21 300 ug/gocd)
aSediment Quality Guidelines from U.S. EPA (1993).bEffects Range Median values from Long et al. (1995)cEffects Range Median values from Long and Morgan (1990)dSediment Quality Criteria from U.S. EPA (1994)
The relationships between amphipod toxicity and the concentrations of a number of toxic chemicals inthe samples are plotted in the following graphs (Figures 37-45). In addition, each graph includes theSpearman-rank correlation coefficient for that particular chemical and the respective sediment qualityguideline value.
Amphipod survival decreased steadily with increasing concentrations of p,p’-DDE in the samples (Figure37). In the two samples with very high amphipod survival, the concentrations of p,p’-DDE were verylow (<10 ng/g). In the sample that caused zero amphipod survival, the concentration of p,p’-DDE wasthe highest among the 20 samples (>70 ng/g). In most of the samples in which p,p’-DDE concentra-tions were less than the ERM value (27 ng/g, Long et al., 1995), amphipod survival was relatively high(>70% in all but one sample). In contrast, amphipod survival was relatively low (<70%) in all but onesample in which the concentrations of p,p’-DDE exceeded the ERM value. However, MacDonald(1994) estimated a Sediment Effect Concentration (SEC) of 6.58 mg/kg dry wt. (6580 ng/g) for thesum of DDEs, two orders of magnitude greater than the highest concentrations observed in the Phase 2samples. Based upon a database compiled from studies focused upon the effects of the DDTs, the SECof MacDonald (1994) probably is more reliable than the ERM of Long et al. (1995). Therefore, al-though amphipod survival was strongly correlated with the concentrations of p,p’-DDE, this com-pound probably contributed minimally to the toxicity since the concentrations were far below a reliablethreshold concentration.
Although the correlation between amphipod survival and the concentrations of the sum of the six DDTisomers was significant (Rho = -0.576, p<0.05), the concentrations of these compounds were relativelylow. Total DDT concentrations ranged from 9.5 to 287.4 ng/g (median = 169.0 ng/g), considerablylower than the estimated SEC of 7120 ng/g (MacDonald, 1994). Expressed in units of organic carbon,total DDT concentrations ranged from 0.6 to 12.0 ug/goc (median = 4.4 ug/goc); again well below the10-day toxicity threshold in laboratory bioassays (300 ug/goc) and the 10-day LC50 (2500 ug/goc) infield-collected sediments for the amphipod Eohaustorius estuarius (Swartz et al., 1994).
There was a very strong relationship between amphipod survival and the concentrations of total PCBcongeners, as illustrated by a Spearman-rank correlation of 0.802. The concentrations of total PCBs

102
0
2 0
4 0
6 0
8 0
100
120
Perc
ent a
mph
ipod
sur
viva
l (%
of c
ontr
ol)
0 1 0 2 0 3 0 4 0 5 0 6 0 7 0 8 0
p,p'-DDE, ng/g
Newark Bay
Rho = -0.800**,p<0.001
ERM = 27
Figure 37. Relationship of amphipod survival to theconcentrations of p, p' - DDE in Newark Bay sediment samples.
0
1 0
2 0
3 0
4 0
5 0
6 0
7 0
8 0
Perc
ent a
mph
ipod
sur
viva
l (%
of c
ontr
ol)
0 250 500 750 1000 1250 1500 1750 2000 2250
Total PCBs, ng/g
Newark Bay
Rho = -0.802 **,p<0.001
ERM = 180
Figure 38. Relationship of amphipod survival to theconcentrations of total PCB congeners in Newark Baysediment samples.

103
0
2 0
4 0
6 0
8 0
100
120
Perc
ent a
mph
ipod
sur
viva
l (%
of c
ontr
ol)
0 2 0 4 0 6 0 8 0 100 120 140 160Cumulative PCB TEQs, pg/g
Newark Bay
Rho = 0.850**
SQC=100
Figure 39. Relationship between amphipod survival and theconcentrations of 2,3,7,8-TCDD toxicity equivalency quotientsfor the co-planar PCB congeners in Newark Bay sediments.
0
2 0
4 0
6 0
8 0
100
120
Per
cent
am
phip
od s
urvi
val (
% o
f con
trol
)
0 100 200 300 400 500 600 700
2,3,7,8-tcdd, pg/g
Newark Bay
Rho = -0.868**,p<0.001
SQG = 100
Figure 40. Relationship of amphipod survival to the concentrations of 2,3,7,8-TCDD in Newark Bay sedimentsamples.

104
0
2 0
4 0
6 0
8 0
100
120
Per
cent
am
phip
od s
urvi
val (
% o
f con
trol
s)
0 100 200 300 400 500 600 700 800Total cumulative 2378-tcdd TEQ, pg/g
Newark Bay
Rho = 0.865**,p<0.001
SQG=100
Figure 41. Relationship between amphipod survivaland the concentration of total cumulative 2,3,7,8-TCDDtoxicity equivalency quotients in Newark Bay sediments.
0
2 0
4 0
6 0
8 0
100
120
Per
cent
am
phip
od s
urvi
val (
% o
f con
trol
)
0 5 0 100 150 200 250 300 350 400
Total Pb, ug/g
Newark Bay
Rho = -0.681*,p<0.05
ERM = 218
Figure 42. Relationship of amphipod survival to theconcentrations of total lead in Newark Bay sediment samples.

105
0
2 0
4 0
6 0
8 0
100
120
Perc
ent a
mph
ipod
sur
viva
l (%
of c
ontr
ol)
0 100 200 300 400 500 600 700 800
total Zn, ug/g
Newark Bay
Rho = -0.534*,p<0.05
ERM = 410
Figure 43. Relationship of amphipod survival to theconcentrations of total zinc in Newark Bay sedimentsamples.
0
2 0
4 0
6 0
8 0
100
120
Perc
ent a
mph
ipod
sur
viva
l (%
of c
ontr
ol)
0 20000 40000 60000 80000 100000 120000 140000
Total HMPAH, ng/g
Newark Bay
Rho = -0.203 ns
ERM = 9600
Figure 44. Relationship of amphipod survival to theconcentrations of total high molecular weight PAHsin Newark Bay sediment samples.

106
exceeded the ERM value of 180 ng/g (Long et al., 1995) in all except three samples, and most of thesesamples were highly toxic to the amphipods (Figure 38). Total PCB concentrations ranged from 105.5to 2,850.2 ng/g (median = 879.2 ng/g). Amphipod survival was zero in a sample with approximately1,400 ng tPCB/g. MacDonald (1994) estimated the SEC for total PCBs as 0.592 mg/kg dry wt (592 ng/g). All of the samples that equalled or exceeded a total PCB concentration of 592 ng/g caused 50% orless amphipod survival. One sample had over 2,800 ng tPCB/g and caused less than 40% amphipodsurvival. It appears that the PCBs may have made a major contribution to the toxicity to the amphi-pods.
The concentrations of four co-planar PCBs were normalized to (multiplied by) the toxicity equivalencyfactors (TEFs) (Barnes et al., 1991) for each congener and the sums of those quotients were calculated.The cumulative toxicity equivalency quotients (TEQ) for the co-planar PCBs were highly correlatedwith amphipod survival (Figure 39). There is no consensus toxicity threshold value for these quotients.Many different estimates have been made of critical or threshold values and they differ from each otherby many orders of magnitude (Iannuzzi et al., 1995). In two samples the cumulative TEQs for the PCBcongeners were higher than one estimate of a threshold, 100 pg/g for fish and human receptors (U.S.EPA, 1993; New York State DEC, 1993, respectively), but the reliability of this threshold value isunknown. The sample from station 26 caused 100% amphipod mortality and had about 140 pg/gcumulative TEQs for the co-planar PCBs. Among all the chemicals quantified, only the concentrationsof these compounds and p,p’-DDE were highest in the sample from station 26 where amphipod sur-vival was zero.
0
2 0
4 0
6 0
8 0
100
120
Per
cen
t am
ph
ipo
d s
urv
ival
(%
of
con
tro
l)
0 200 400 600 800 1000 1200
fluoranthene, ug/goc
Newark Bay
Rho = -0.346 ns
SQC = 300
Figure 45. Relationship of amphipod survival to theconcentrations of fluoranthene in Newark Bay sedimentsamples.

107
Among all of the substances quantified in Phase 2, the concentrations of the dioxins were most highlycorrelated with amphipod survival. The scatterplot of the data showed a consistent pattern of decreas-ing survival with increasing 2,3,7,8-tcdd concentrations (Figure 40). All of the samples that werehighly toxic to the amphipods had 2,3,7,8-tcdd concentrations that exceeded the 100 pg/g guidelineproposed by the U.S. EPA (1993).
The concentrations of all the dioxin, furan, and PCB congeners for which toxicity equivalency factorswere available (Barnes et al., 1991; Kutz et al., 1990) were normalized to (multiplied by) the appropri-ate TEFs and the total cumulative TEQs were determined. Amphipod survival was highly correlatedwith the total cumulative TEQs (Figure 41). Also, all of the samples that exceeded the U.S. EPA(1993) guideline of 100 pg/g were highly toxic to the amphipods. Amphipod survival dropped to 50%or less in samples with total dioxins TEQs of 150 pg/g or more. However, the sample with the highestTEQ concentration was not sample 26, in which amphipod survival was zero.
The relationships between amphipod survival and the concentrations of both lead and zinc were rela-tively strong and consistent (Figures 42-43). All of the samples with lead concentrations that exceededthe ERM value (Long et al., 1995) were highly toxic (survival <80%). Also, all except one sample withzinc concentrations above the ERM value were highly toxic. Long et al. (1995) reported relativelyhigh confidence in the ERM values for both of the elements. However, two samples in which survivalwas 0.0% and 20% had relatively low concentrations of both lead and zinc. The very high concentra-tions of PCBs, dioxins, and other chlorinated hydrocarbons probably were more important in thesesamples than the trace elements. Also, one sample with a very high concentration of zinc (>700 ug/g)had relatively high amphipod survival (80%). Based upon these data, lead and zinc may have contrib-uted to the observed toxicity in some of the samples.
The correlations between the concentrations of PAHs and amphipod survival were relatively poor,especially when compared to the strong correlations observed in the data from Phase 1. The concentra-tions of high molecular weight PAHs were relatively high in the samples that caused low amphipodsurvival; however, this pattern was not consistent (Figure 44). For example, the HPAH concentrationin sample 26 was relatively low (less than the ERM value of 9600 ng/g) and one sample in whichamphipod survival was relatively high had the highest concentration of these compounds. Among thethree compounds for which EPA has developed SQCs, fluoranthene was most strongly correlated withamphipod survival. However, the correlation between amphipod survival and fluoranthene concentra-tions was not significant and the pattern was inconsistent (Figure 45). Three samples had fluorantheneconcentrations that either equalled or exceeded the SQC; amphipod survival was relatively high in oneand very low in the other. Based upon these data, it does not appear that the PAHs contributed substan-tially to the observed toxicity in many of the Newark Bay samples.
Of the 20 samples that were subjected to chemical analyses, 4 were not significantly different fromcontrols in the tests of amphipod survival, whereas 16 were significantly different from controls andamphipod survival was less than 80% of the control survival. The average concentrations of the 2,3,7,8-tcdd and dioxin TEQs that co-occurred with the nontoxic and the toxic samples are compared in Table33. In addition, the average concentrations of these compounds in the toxic samples were comparedwith the sediment guideline proposed by the U.S. EPA (1993). The average concentration of 2,3,7,8-tcdd in the toxic samples exceeded the average concentration in the nontoxic samples by a factor of10.6 and exceeded the guideline by a factor of 2.7. The concentrations of the dioxin TEQs, co-planarPCB TEQs, and total cumulative TEQs in the toxic samples exceeded the concentrations in the non-

108
toxic samples by factors of 6.5, 2.8, and 5.4, respectively. In addition, the average concentrations of thedioxin TEQs and the total cumulative TEQs in the toxic samples exceeded the guideline value of 100pg/g by factors of 3.5 and 4.2, respectively.
Table 33. Average concentrations (pg/g, dry wt.) of 2,3,7,8-tcdd and total cumulative dioxin TEQsin highly toxic (<80% survival) and nontoxic samples from Newark Bay, ratios between the aver-ages, and ratios between the highly toxic averages and the respective SQG*.
Nontoxic Highly toxic Ratio of Ratio of highly(91.9 ± 13.0% (38.0 ± 24.7% highly toxic toxic avg.
survival, survival, to nontoxic to then = 4) n = 16) averages SQG
2378-tcdd 25.8±23.2 273.9±177.9 10.6 2.7cum. dioxins TEQ 55.0±50.8 355.1±217.1 6.5 3.5cum. PCB TEQ 22.1±16.6 62.0±34.5 2.8 <1.0total cum. TEQ 77.2±66.9 417.1±249.0 5.4 4.2
*SQG = 100 pg/g (U.S. EPA, 1993)
The average concentrations of pesticides and total PCBs in the toxic and nontoxic samples are com-pared in Table 34. The average concentrations of nearly all of these compounds were higher in thetoxic samples than in the nontoxic samples. The ratios of the averages ranged from 0.9 to 6.2. Theconcentrations of some chlordane isomers, hexachlorobenzene, and the sum of the PCB congenerswere elevated to the greatest degree (>5.0X) in the toxic samples. Sediment guidelines were not avail-able for most compounds. Among those substances for which guidelines exist, the average concentra-tions in the toxic samples often were lower than the guidelines. However, the concentrations of p,p’-DDE and total PCB congeners were highly elevated relative to the ERM values (Long et al., 1995).Also, the average concentration of total PCBs (758 ng/g) in the toxic samples exceeded the SEC (562ng/g) calculated by MacDonald (1994). However, the average concentration of total DDTs in the toxicsamples (5.8 ug/goc) was far lower than the toxicity threshold (300 ug/goc) identified by Swartz et al.(1994) for the amphipod R. abronius.
Table 34. Average concentrations (ng/g, dry wt.) of pesticides and PCBs in highly toxic (<80%survival) and nontoxic samples from Newark Bay, ratios between the averages, and ratios be-tween the highly toxic averages and the respective SQGs.
Nontoxic Highly toxic Ratio of Ratio of highly(91.9 ± 13.0% (38.0 ± 24.7% highly toxic toxic avg.
survival, survival, to nontoxic to then = 4) n = 16) averages SQG
hexachlorobenzene 1.0±1.0 4.8±2.4 5.0 napentachloro-anisole 0.3±0.2 0.6±0.2 2.2 naalpha-BHC 1.1±0.5 0.7±0.5 1.6 nalindane 0.2±0.2 0.3±0.3 1.3 nabeta-BHC 0.4±0.3 0.3±0.3 0.9 naheptachlor 0.1±0.0 0.2±0.3 2.0 nadelta-BHC 1.3±0.7 2.4±1.1 1.9 nadacthal 1.7±0.5 2.3±0.7 1.4 na

109
Table 34 contd.Nontoxic Highly toxic Ratio of Ratio of highly
(91.9 ± 13.0% (38.0 ± 24.7% highly toxic toxic avg.survival, survival, to nontoxic to the
n = 4) n = 16) averages SQG
oxychlordane 0.2±0.1 0.5±0.3 2.6 naheptachlor epoxide 1.4±1.0 6.6±4.4 4.9 natrans-chlordane 3.8±3.0 23.4±16.0 6.2 natrans-nonachlor 2.8±2.1 13.5±8.8 4.9 nacis-chlordane 4.7±3.7 28.2±20.6 6.0 nao, p’ - DDE 3.4±3.3 8.3±4.3 2.5 nadieldrin 2.7±1.9 10.6±5.9 3.9 1.3a
p, p’ - DDE 16.8±14.1 44.4±19.0 2.7 1.6b
o, p’ - DDD 6.8±6.5 21.5±12.5 3.2 naendrin 0.4±0.2 0.9±0.7 2.2 0.02a
cis-nonachlor 1.3±0.9 6.2±4.2 4.8 nao, p’ - DDT 1.2±0.8 5.3±3.4 4.6 nap, p’ - DDD 15.8±14.1 45.9±22.2 2.9 2.3a
p, p’ - DDT 31.5±40.6 40.7±35.0 1.3 5.8a
mirex 2.4±1.3 10.8±7.2 4.6 nasum of DDTs 75.2±65.7 166.2±73.7 2.2 3.6b
sum of PCB congeners 148.1±123.0 757.8±527.4 5.1 4.2b
percent TOC 2.2±1.4 3.1±1.5 1.4 nadieldrin (ug/goc) 0.1±0.1 0.4±0.2 2.7 0.02c
endrin (ug/goc) 0.3±0.3 0.3±0.4 1.1 0.4c
p, p’ - DDE (ug/goc) 0.7±0.5 1.6±0.8 2.1 nasum of DDTs (ug/goc) 2.9±1.6 5.8±2.8 2.0 0.03d
sum of PCBs (ug/goc) 5.6±2.2 25.1±16.2 4.5 na
a Long and Morgan (1990) na = no applicable guidelinesb Long et al. (1995)c U.S. EPA (1994)d Swartz et al. (1994)
The average concentrations of the trace metals in the toxic samples rarely exceeded the averages in thenontoxic samples by a great degree, and, except for mercury, were lower than the respective ERMvalue (Table 35). The toxic/nontoxic ratios ranged from 0.8 to 2.9 for the metals. The toxic/nontoxicratios for each element were similar whether quantified as total extractable metal or as AVS simulta-neously extracted metal. Although the average concentration of mercury in the toxic samples waselevated relative to the ERM value, Long et al. (1995) reported only a moderate degree of confidencein this guideline, suggesting that it should be higher. The concentrations of un-ionized ammonia werelower in the toxic samples than in the nontoxic samples.

110
Table 35. Average concentrations of total extractable and AVS simultaneously extracted tracemetals (ppm, dry wt.) in highly toxic (<80% survival) and nontoxic samples from Phase 2, ratiosbetween the averages, and ratios between the highly toxic averages and the respective SQGs.
Nontoxic Highly toxic Ratio of Ratio of highly(91.9 ± 13.0% (38.0 ± 24.7% highly toxic toxic avg.
survival, survival, to nontoxic to then = 4) n = 16) averages SQG
total silver 2.4±1.1 3.6±1.6 1.5 1.0a
total arsenic 10.7±3.3 10.4±3.9 1.0 0.15a
total cadmium 1.1±0.9 3.3±1.8 2.9 0.3a
total chromium 102.9±68.1 141.1±56.3 1.4 0.4a
total copper 68.9±46.5 142.6±67.0 2.1 0.5a
total mercury 1.6±1.6 2.4±0.9 1.4 3.4a
total nickel 45.1±17.9 39.7±11.8 0.9 0.8a
total lead 88.8±42.9 208.0±102.9 2.3 0.9a
total tin 16.5±9.6 46.4±24.2 2.8 natotal selenium 0.5±0.4 0.9±0.3 1.7 natotal zinc 166.2±93.1 403.9±191.9 2.4 1.0a
total AVS (umol/g) 2.2±1.4 3.1±1.5 1.4 naSE silver 0.4±0.3 0.4±0.2 1.0 naSE arsenic 2.0±1.2 1.6±0.6 0.8 naSE cadmium 0.9±0.7 2.7±1.4 2.9 naSE chromium 33.4±28.0 67.4±35.8 2.0 naSE copper 26.5±24.2 36.9±20.2 1.4 naSE mercury 0.06±0.0 0.06±0.0 1.0 naSE nickel 6.3±3.1 8.6±3.6 1.4 naSE lead 69.0±41.1 164.7±81.5 2.4 naSE zinc 147.3±55.8 293.6±161.2 2.0 naSEM/AVS ratios (umol/g) 0.5±0.4 0.5±0.7 1.0 naUn-ionized ammonia (ug/l) 155.3±268.3 102.7±164.4 0.7 na
a Long et al. (1995)na = no applicable guidelines
The concentrations of the classes of PAHs and three individual hydrocarbons were higher in the toxicsamples than in the nontoxic samples, but not to a great degree (Table 36). Also, the average concen-trations of the sums of both the low and high molecular weight compounds exceeded the respectiveERM values, but again, not by a large amount. Among the three compounds for which there areproposed criteria, phenanthrene was most elevated in concentration in the toxic samples, but the aver-age concentrations of all three compounds were considerably lower than the respective SQGs.

111
Table 36. Average concentrations of PAHs (ng/g, dry wt.) in highly toxic (<80% survival) andnontoxic samples from Phase 2, ratios between the averages, and ratios between the highly toxicaverages and the respective SQGs.
Nontoxic Highly toxic Ratio of Ratio of highly(91.9 ± 13.0% (38.0 ± 24.7% highly toxic toxic avg.
survival, survival, nontoxic to then = 4) n = 16) averages SQG
sum of LPAH 1736±1730 5822±9350 3.4 1.8a
sum of HPAH 12100±15868 31709±30761 2.6 3.3a
sum of PAH 13836±17576 37532±39671 2.7 0.8a
acenaphthene (ug/goc) 2.4±1.7 12.5±20.7 5.3 0.05b
phenanthrene (ug/goc) 17.0±12.8 123.0±294.6 7.2 0.5b
fluoranthene (ug/goc) 51.0±49.8 208.9±260.2 4.1 0.7b
a Long et al. (1995)b U.S. EPA (1994)
DISCUSSION
Incidence and Severity of Toxicity. In previous studies and surveys of the Hudson-Raritan Estuary,many investigators have reported that portions of this area were highly contaminated with a variety ofpotentially toxic chemicals (O’Connor and Ehler, 1991; Breteler, 1984; Squibb et al., 1991; Long andMorgan, 1990; Schimmel et al., 1994). The concentrations of many substances equalled or exceededknown toxicity thresholds and exceeded concentrations observed in many other estuaries in the USA.Therefore, based upon these historical chemical data, there was a potential for contaminant-inducedtoxicity in water, sediments, and resident biota.
The spatial patterns in chemical concentrations compiled by Squibb et al. (1991) suggested that New-ark Bay and Arthur Kill would be highly toxic. Based upon the data from the present survey, many ofthe samples from these two areas, indeed, appeared to be toxic. The data assembled by Squibb et al.(1991) also suggested that the following areas would be moderately toxic: East River bays, East Riverin the vicinity of Ward’s Island, upper New York Harbor, Gowanus Canal, lower Hackensack River,and lower Jamaica Bay. Among these areas, samples were collected in the present survey in the upperEast River near Ward’s Island, upper New York Harbor, and the lower Hackensack River. The samplescollected in the East River were highly toxic, those from the lower Hackensack River were moderatelytoxic, and those from the upper New York Harbor were not toxic at one site and moderately toxic atanother site. The northern and southern portions of Raritan Bay, which were highly sandy, were ex-pected to be among the least toxic areas according to the data compiled by Squibb et al. (1991), and thatwas confirmed in the present survey. Although conditions in all of these areas were heterogeneous, theoverall patterns in toxicity suggested by the chemical data from previous surveys generally were con-firmed by the toxicity tests in the present survey.
Previous investigators have documented toxicity in sediment samples collected throughout the estuary.The toxicity of sediments to nematode growth (Tietjen and Lee, 1984) was reported in all ten samplesthat were tested. Toxicity to amphipods was reported in 8% of 10% samples tested in 1990 (Scott et al.,1990). Nine of 20 samples collected in 1992 and tested in flow-through tests with amphipods were

112
toxic (Brosnan and O’Shea, 1993). In 18 samples tested in 1990 from the Arthur Kill and vicinity,amphipod mortality ranged from 18 to 61% (Aqua Survey, 1990a, 1990b). Five of nine samples col-lected in 1990 were toxic to amphipods during the first phase of the EMAP survey conducted by U.S.EPA (Schimmel et al., 1994).
During Phase 1 of this survey, toxicity in 117 sediment samples was determined with three complimen-tary tests performed in the laboratory. Four toxicity end-points were determined among the three tests.Toxicity end-points included survival of amphipods, survival of bivalve larvae, morphological devel-opment of bivalve larvae, and metabolic activity of a bioluminescent bacterium. During Phase 2, 57additional samples from Newark Bay and vicinity were tested with the amphipod survival test.
All four test end-points provided a wide range in response from the least toxic to the most toxic station.In Phase 1, amphipod survival ranged from 0.0% in three samples to 99.0%. In Phase 2, amphipodsurvival ranged from 0.0% in two samples to 100%. Bivalve embryo survival ranged from 16.1% toover 100% relative to controls. Bivalve normal development ranged from 0.0% in two samples to100% in many samples. The Microtox EC50s ranged from 0.30 mg/ml to over 32.6 mg/ml. All fourend-points indicated that some of the stations and some of the sites were significantly more toxic thanthe control sediments.
The toxicity data developed for each station and site during Phase 1 are summarized in Table 37. Asingle asterisk was assigned to those stations and sites that were significantly different from controls ineach test. Two asterisks were assigned where the numerical results were significantly different fromcontrols and were less than or equal to 80% of the control response.
Based upon the results of all four test end-points combined, the samples from zones A (lower HudsonRiver), G (lower Raritan River), I (central Raritan Bay), K (southern Raritan Bay), and M (outer bay,New York Bight) were among the least toxic. Samples from these areas often were not toxic in any ofthe tests, or in only one or two of them. Furthermore, toxicity test results rarely were less than 80% ofthe control responses. Among the most toxic samples were those from zones B (western Long IslandSound), C (upper East River), D (lower East River), and F (Newark Bay/Arthur Kill). Samples fromthese areas often were highly toxic as indicated by toxicity in multiple tests and responses less than80% of the control response.
Table 37. Summary of toxicity test results for each station and site sampled during Phase 1.
BivalveRegional Sampling Amphipod Bivalve develop- Microbialzone site/station survival survival ment bioluminescence
Zone A 1-A - - - -1-B - - - -1-C - - - -
Site 1 mean - - - -2-A - - - -2-B - - - -2-C - nd nd -
Site 2 mean - - - -

113
Table 37 continued.Bivalve
Regional Sampling Amphipod Bivalve develop- Microbialzone site/station survival survival ment bioluminescence
3-A - - - -3-B ** - - -3-C ** - - -
Site 3 mean - - - -Zone B 4-A - - - *
4-B - - - *4-C - - *
Site 4 mean - - * *5-A - - ** **5-B - - ** *5-C - ** ** *
Site 5 mean - - ** **6-A - ** * -6-B - ** ** **6-C - ** ** **
Site 6 mean - ** ** -Zone C 7-A ** ** ** -
7-B ** ** ** -7-C ** ** ** -
Site 7 mean ** ** ** **8-A * * - -8-B ** - ** **8-C ** ** - *
Site 8 mean - - - **9-A ** - - *9-B ** - - **9-C ** - - -
Site 9 mean ** - - **
Zone D 10-A ** ** ** **10-B ** ** ** *10-C ** - - *
Site 10 mean - - - **11-A * - - -11-B ** ** - *11-C ** - * *
Site 11 mean ** ** - *12-A ** - - *12-B ** - - *12-C - - ** *
Site 12 mean - - - **Zone E 13-A - - - -
13-B - nd nd -13-C - - - -
Site 13 mean * - - -

114
Table 37 continued.Bivalve
Regional Sampling Amphipod Bivalve develop- Microbialzone site/station survival survival ment bioluminescence
14-A - - - -14-B - - - -14-C - - - -Site 14 mean - - - -15-A ** - - -15-B * - - -15-C ** - - *Site 15 mean ** * - *
Zone F 16-A ** - - -16-B ** - - *16-C ** - - *Site 16 mean ** - - -17-A ** - - -17-B ** ** - -17-C ** ** - -Site 17 mean ** ** - **18-A ** - - -18-B ** - - *18-C ** - - -Site 18 mean ** - * *
Zone G 19-A - - - -19-B - - - *19-C * - - *Site 19 mean - - - -20-A * - - -20-B * - - -20-C ** * - -Site 20 mean - * - -21-A - - - *21-B - - - -21-C - - - -Site 21 mean - - - -
Zone H 22-A ** - - *22-B ** - - -22-C ** ** - -Site 22 mean ** - - *23-A - - - **23-B - - - **23-C ** - - -Site 23 mean ** - - **24-A * - - *24-B - nd nd -24-C - - - -Site 24 mean - - - -

115
Table 37 continued.Bivalve
Regional Sampling Amphipod Bivalve develop- Microbialzone site/station survival survival ment bioluminescence
Zone I 25-A - - - -25-B - - - -25-C - - - *Site 25 mean - - - -26-A - ** ** *26-B - - - *26-C - - - *Site 26 mean - - - -27-A - - - *27-B - - - *27-C - - - *Site 27 mean - - - **
Zone J 28-A - - - **28-B ** nd nd **28-C ** nd nd **Site 28 mean * - - **29-A - - - -29-B - - ** -29-C - - - -Site 29 mean * - - -30-A - ** ** **30-B * ** ** *30-C ** nd nd *Site 30 mean - ** ** **
Zone K 31-A - - - *31-B - - - -31-C - - - -Site 31 mean - - - **32-A - - - -32-B - - - *32-C - - - -Site 32 mean - - - -33-A - - - -33-B - - - -33-C - - - _Site 33 mean * - - -
Zone L 34-A - nd nd -34-B ** ** ** -34-C ** - - -Site 34 mean - - - -35-A ** - - -35-B - nd nd nd35-C ** - - -Site 35 mean ** - - *

116
Table 37 continued.Bivalve
Regional Sampling Amphipod Bivalve develop- Microbialzone site/station survival survival ment bioluminescence
36-A - - - -36-B * - - **36-C * - - -Site 36 mean - - - **
Zone M 37-A - ** - -37-B - - - -37-C - - - -Site 37 mean * * - -38-A - - - -38-B - - - -38-C * - - -Site 38 mean * - - -39-A ** ** ** -39-B ** ** ** -39-C * - - -Site 39 mean - - - -
* Significantly different from controls (alpha=0.05).** Significantly different from controls and 80% or less of controls.- Not significantly different from controls.nd - No data.
Significantly elevated toxicity was observed in samples from 54 stations and 16 sites in the amphipodsurvival test; 23 stations and 6 sites in the bivalve larvae survival test; 21 stations and 6 sites in thebivalve larvae development test; and 47 stations and 19 sites in the Microtox test (Table 38). Testresults were significantly different from controls and 80% or less of the control in samples from 42stations and 10 sites in the amphipod tests; in 21 stations and 4 sites in the bivalve survival tests; in 19stations and 4 sites in the bivalve development tests; and in 32 stations and 14 sites in the Microtoxtests. A total of 81 stations out of 117 (69%) and 27 sites out of 39 (69%) were indicated as signifi-cantly toxic in at least one of the test end-points during Phase 1. A total of 54 stations (46%) and 19sites (49%) were significantly toxic and indicated responses of 80% or less than the controls in at leastone of the tests. During the Phase 2 tests, amphipod survival was significantly lower than controls in48 of 57 samples (84.2%).
Table 38. Summary of the numbers of Phase 1 stations and sites indicated as significantly toxic(different from controls) and numerically significant (80% controls or less) in each of four sedi-ment toxicity test endpoints.
Number of Stations Number of SitesToxicity Statisticallya Numericallyb Statisticallya Numericallyb
Test/Endpoint Significant Significant Significant Significant
Ampelisca abdita• survival (n=117) 54 42 16 10

117
Table 38 continued.Number of Stations Number of Sites
Toxicity Statisticallya Numericallyb Statisticallya Numericallyb
Test/Endpoint Significant Significant Significant SignificantMulinia lateralis
• survival (n=109) 23 21 6 4• normal (n=109) development 21 19 6 4
Microtoxtm
• Inhibition of bioluminescence 47 32 19 14 (n=116)
All tests combined 81 54 27 19
a Statistically significantly different from controls (alpha=0.05).b Significantly different from controls (alpha=0.05) and mean value 80% or less of the control re-sponse.
Spatial Extent of Toxicity. Using test results of <80% of control responses as a critical value, thespatial extent of toxicity was estimated. Approximately 25% of the study area exhibited toxic samplesin the bivalve survival tests, 30% was toxic in the bivalve embryo development tests, 38% was toxic inthe amphipod tests, and approximately 39% of the area was toxic to microbial bioluminescence. Ap-proximately 5.7% of the area was toxic in all four of these tests. These estimates are similar to theestimate of the spatial extent of sediment toxicity to amphipod survival (21%) for the entire Virginianprovince of EMAP, which includes the present study area (Schimmel et al., 1994). However, theestimated spatial extent of toxicity to amphipods within the Newark Bay region of the study area (85%)was much higher than that for the remainder of the study area or the Virginian province.
These calculations of the spatial extent of toxicity must be viewed as rough estimates, since a numberof factors could have contributed to bias in the analyses. Although the Phase 1 survey area was strati-fied a priori, the selection of the boundaries for each stratum could have affected the results. Sincemany of the sampling sites were selected with some knowledge of the site from previous studies, theremay have been some bias in the site selection. Each station within a site was chosen by the vesseloperator with no attempt to sample near known sources; nevertheless, there could have been bias in thestation selections. The coordinates for each sampling station were not selected with a probabalistic,random method (Schimmel et al., 1994). On the other hand, there was no attempt to bias the site andstation selections to over- or under estimate the toxicity of the area.
During Phase 2 of the survey, the samples were chosen randomly with a probabalistic, random-strati-fied sampling design similar to that used by the EMAP. As a consequence, the estimate of the spatialextent of toxicity (85%) within the Newark Bay area should be more accurate than that calculated forthe entire survey area.
Spatial Patterns in Toxicity. The area-wide patterns in toxicity, as determined by the four test end-points measured in Phase 1, collectively, are illustrated for the station means in Figure 46 and for thesite means in Figure 47. Stations and sites were depicted as toxic when at least one of the four test end-points indicated a statistically significant elevation in toxicity relative to the controls. These two fig-
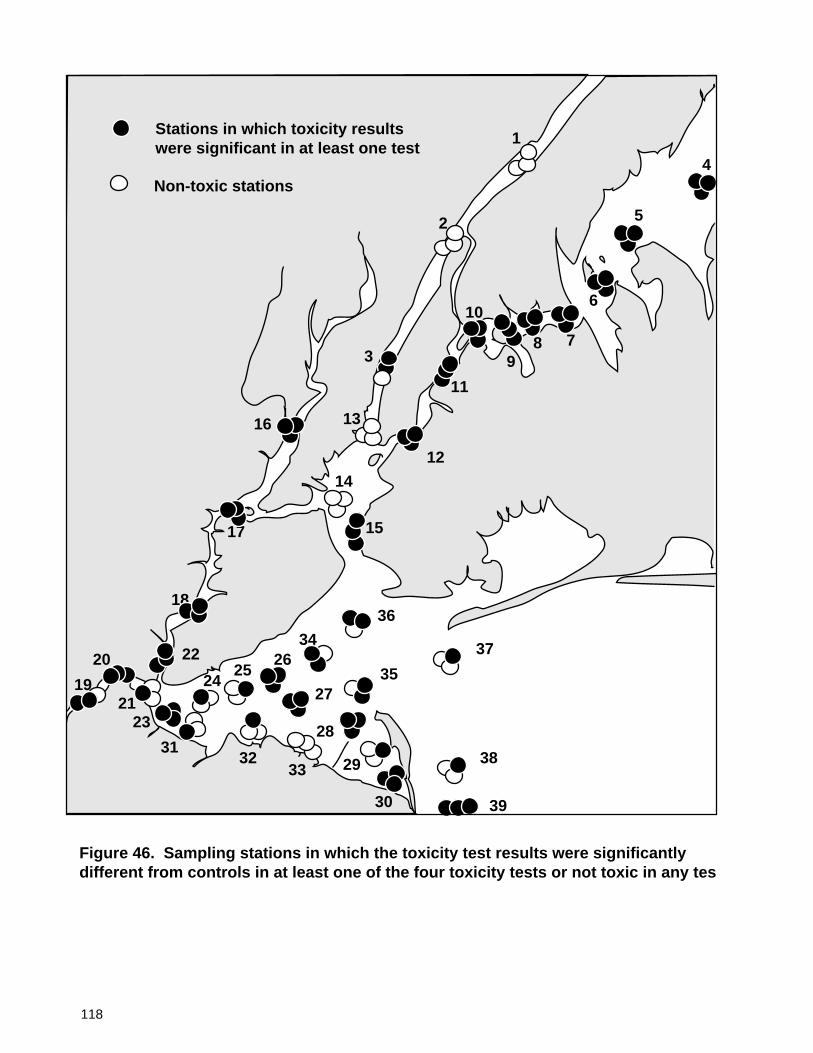
118
1
2
3
4
5
6
789
10
11
12
13
14
15
16
17
18
19
20
21
22
23
2425
26
27
28
29
30
3132
33
34
35
36
37
38
39
Figure 46. Sampling stations in which the toxicity test results were significantly different from controls in at least one of the four toxicity tests or not toxic in any tes
Stations in which toxicity resultswere significant in at least one test
Non-toxic stations

119
1
2
3
4
5
6
789
10
11
12
13
14
15
16
17
18
19
20
21
22
23
2425
26
27
28
29
30
3132
33
34
35
36
37
38
39
Figure 47. Sampling sites in which the mean toxicity test results were significantly different from controls in at least one of the four tests or not toxic in any test (average of three stations).
Sites in which toxicity resultswere significant in at least one test
Non-toxic sites

120
ures depict the presence/absence of toxicity, not the relative degree of toxicity, based upon statisticaldifferences from the controls.
Based upon the data depicted in Table 37 and Figures 46 and 47, it appears that the spatial limits oftoxicity were not determined. Toxicity to at least one of the tests was evident throughout most of thestudy area and extended to its outer limits. There were no clear limits or boundaries beyond which onlynontoxic sediments were consistently encountered. All of the samples from western Long Island Sound,the upper East River, the lower East River, Newark Bay, Arthur Kill, and inner-most Sandy Hook Baywere toxic in at least one of the tests. Also, many of the samples from the lower Raritan River andwestern Raritan Bay were toxic in at least one test. In contrast, only two of the 15 samples in the lowerHudson River/upper New York Harbor area were toxic in any of the tests. In addition, only two of thestations in sites 31, 32, and 33 in southern Raritan Bay were toxic in all tests. All three samples fromsite 39 in New York Bight were significantly different from controls in at least one test, but the sitemean was not significantly different from controls in any of the tests.
The spatial pattern in toxicity illustrated by the site means (Figure 47) is similar to that identified by thestation means (Figure 46). Figure 47 illlustrates the sites in which the mean toxicity results for any ofthe tests were significantly different from the respective controls. As observed with the station means,these data indicate that the sites in western Long Island Sound, upper East River, lower East River,Newark Bay, Arthur Kill, much of western Raritan Bay, and Sandy Hook Bay were different fromcontrols. However, these data also suggest that site 13 in the lower Hudson River; sites 31 and 33 insouthern Raritan Bay; and sites 36, 37, and 38 in the mouth of the estuary were significantly differentfrom controls in at least one test. As observed with the station means, the site means indicated that sites1-3 in the lower Hudson River, site 14 in upper New York Harbor, and several sites in north-centralRaritan Bay were not toxic in any of the tests.
Figure 48 depicts the relative toxicity of the sites, based upon the number of significant toxic responsesdetermined at each site, using the tests of statistical differences from controls. Sites are identified inwhich there was no toxic response relative to controls among the four test end-points, and sites inwhich there was one response, two, three, or four. It was assumed that sediments that caused foursignificantly elevated toxic responses were more degraded than those that elicited, say, one or twosignificant responses.
The site means for all four tests were significantly different from the controls only at site 7 (Figure 48).Note: based upon a critical value of <80% of controls, three sites were indicated as toxic in all tests inthe calculations of the spatial extent of toxicity (Table 13). However, based upon the statistical tests ofsignificance, only one site (site 7) was different from controls in all four tests. That is, in all four testend-points, the measures of toxicity were sufficiently high and consistent to provide mean results thatwere significantly different from the controls. In addition, the numerical results of the three inverte-brate tests were 80% or less than the controls. Among the 17 samples tested with the polychaetegrowth test, sediments from site 7 were the most toxic. This site was clearly the most toxic among all39 sites sampled during Phase 1.
Sites 11, 15, 17, 18, and 30 located in lower East River, upper New York Harbor, Newark Bay, ArthurKill, and Sandy Hook Bay, respectively, were highly toxic in three of the four test end-points (Figure48). Sites 1-3, 14, 19, 21, 24-26, 32, 34, and 39 were not toxic to any of the tests.
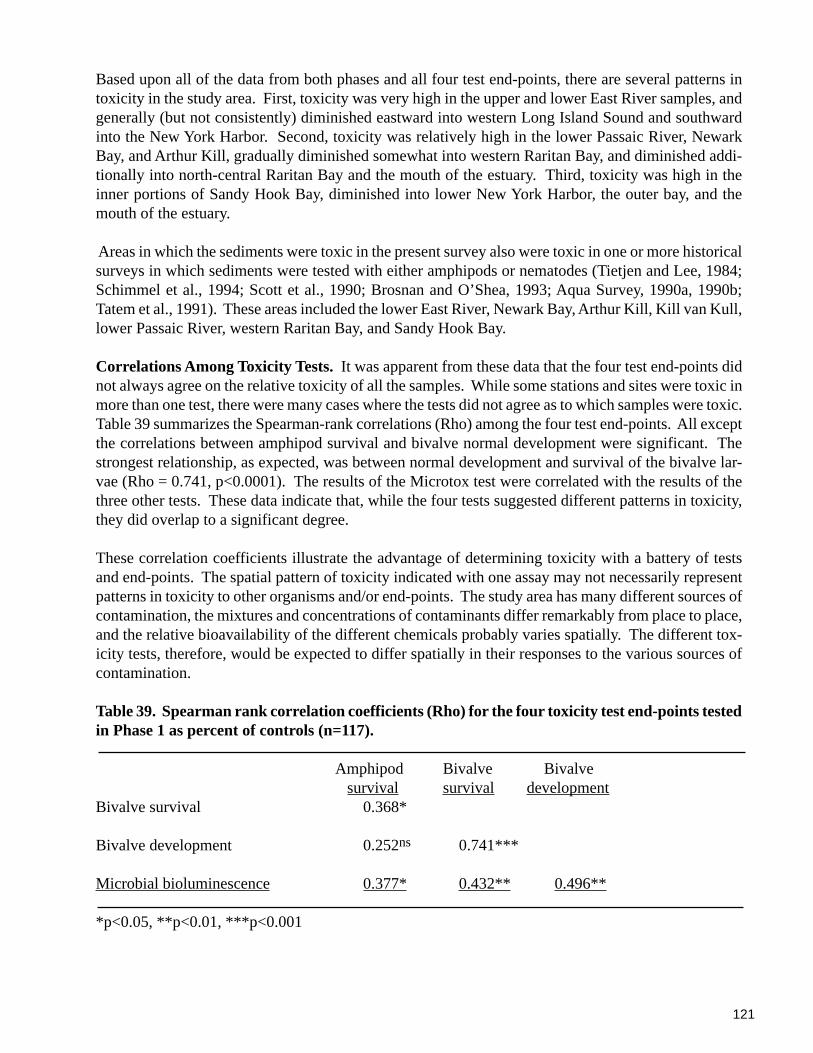
121
Based upon all of the data from both phases and all four test end-points, there are several patterns intoxicity in the study area. First, toxicity was very high in the upper and lower East River samples, andgenerally (but not consistently) diminished eastward into western Long Island Sound and southwardinto the New York Harbor. Second, toxicity was relatively high in the lower Passaic River, NewarkBay, and Arthur Kill, gradually diminished somewhat into western Raritan Bay, and diminished addi-tionally into north-central Raritan Bay and the mouth of the estuary. Third, toxicity was high in theinner portions of Sandy Hook Bay, diminished into lower New York Harbor, the outer bay, and themouth of the estuary.
Areas in which the sediments were toxic in the present survey also were toxic in one or more historicalsurveys in which sediments were tested with either amphipods or nematodes (Tietjen and Lee, 1984;Schimmel et al., 1994; Scott et al., 1990; Brosnan and O’Shea, 1993; Aqua Survey, 1990a, 1990b;Tatem et al., 1991). These areas included the lower East River, Newark Bay, Arthur Kill, Kill van Kull,lower Passaic River, western Raritan Bay, and Sandy Hook Bay.
Correlations Among Toxicity Tests. It was apparent from these data that the four test end-points didnot always agree on the relative toxicity of all the samples. While some stations and sites were toxic inmore than one test, there were many cases where the tests did not agree as to which samples were toxic.Table 39 summarizes the Spearman-rank correlations (Rho) among the four test end-points. All exceptthe correlations between amphipod survival and bivalve normal development were significant. Thestrongest relationship, as expected, was between normal development and survival of the bivalve lar-vae (Rho = 0.741, p<0.0001). The results of the Microtox test were correlated with the results of thethree other tests. These data indicate that, while the four tests suggested different patterns in toxicity,they did overlap to a significant degree.
These correlation coefficients illustrate the advantage of determining toxicity with a battery of testsand end-points. The spatial pattern of toxicity indicated with one assay may not necessarily representpatterns in toxicity to other organisms and/or end-points. The study area has many different sources ofcontamination, the mixtures and concentrations of contaminants differ remarkably from place to place,and the relative bioavailability of the different chemicals probably varies spatially. The different tox-icity tests, therefore, would be expected to differ spatially in their responses to the various sources ofcontamination.
Table 39. Spearman rank correlation coefficients (Rho) for the four toxicity test end-points testedin Phase 1 as percent of controls (n=117).
Amphipod Bivalve Bivalvesurvival survival development
Bivalve survival 0.368*
Bivalve development 0.252ns 0.741***
Microbial bioluminescence 0.377* 0.432** 0.496**
*p<0.05, **p<0.01, ***p<0.001

122
Another source of variability in results among the tests is the exposure medium that was tested. Theamphipods are tube-dwelling, epifaunal organisms and were exposed to solid phase sediments for 10days. The clam larvae were planktonic and exposed to liquid phase samples for 48 hours. The bacteriawere cultured in laboratory equipment and exposed for 5 minutes to an organic extract of the sedi-ments. The solvent extraction elutes potentially toxic contaminants from the sediments, and, therefore,enhances their apparent availability. The Microtox tests probably provide an estimate of the toxicitypotential of the total bulk contaminant content of the sediments, instead of the biologically availablefraction.
Summary of Chemistry/Toxicity Relationships. The data from Phase 1 of the Hudson-Raritan Estu-ary survey were examined to determine (1) which chemicals were correlated significantly with themeasures of toxicity; (2) which chemicals also were elevated in concentration in the highly toxic samplesversus the nontoxic samples; and (3) which chemicals in the highly toxic samples also were elevated inconcentration above applicable, effects-based, sediment quality guidelines. A summary of the datafrom these three tiers of analyses are listed in Table 40. The substances included in Table 40 are thosethat were significantly correlated with two measures of toxicity: amphipod survival and microbialbioluminescence. There were no strong, significant correlations between toxicity to the bivalve em-bryos and any of the chemicals or chemical classes, so the data from those tests were not included inTable 40.
Amphipod survival was significantly correlated with two metals, mercury and tin, in the sediments.Microtox test results were significantly correlated with 10 metals. Generally, the average concentra-tions of all 10 trace metals in the highly toxic samples were slightly higher than in the nontoxic samplesin both of the toxicity tests. For most of the metals, the average concentrations in the highly toxicsamples were lower than the respective ERM values of Long et al. (1995). The concentrations ofmercury, lead, and zinc in the highly toxic samples either equalled or slightly exceeded the applicableERM values. Thirty of the 38 samples equalled or exceeded the mercury ERM concentration. How-ever, Long et al. (1995) reported that they had only a moderate degree of confidence in the ERM valuefor mercury, whereas they reported a relatively high degree of confidence in the values for lead andzinc. Therefore, the exceedances of the mercury ERM concentration in most samples probably werenot very meaningful.
Four chlorinated organic compounds were significantly correlated with microbial bioluminescenceand one was correlated with amphipod survival (Table 40). No applicable guidelines were availablefor cis-chlordane and trans-nonachlor. Both of these isomers of chlordane were slightly elevated in thehighly toxic samples relative to the nontoxic samples. The concentrations of p,p’-DDT were signifi-cantly correlated with both measures of toxicity. However, the average concentrations of this isomer ofDDT were much more elevated in the samples that were toxic to the amphipods (exceeded the ERM bya factor of 21.6) than in those that were toxic to microbial bioluminescence (exceeed the ERM by afactor of 1.7). Long et al. (1995) reported a moderate degree of confidence in the ERM values for totalDDT and p,p’-DDE and Long and Morgan (1990) reported a low degree of confidence in the ERM forp,p’-DDT. Therefore, the slight exceedance of the ERM value for p,p’-DDT in the samples that werehighly toxic to microbial bioluminescence probably is meaningless. The concentrations of the DDTisomers in these samples were one to two orders of magnitude lower than the respective SedimentEffect Concentrations (SECs) of MacDonald (1994).
All of the compounds and classes of PAHs were significantly correlated with the results of the amphi-pod and Microtox tests the concentrations in the highly toxic samples exceeded the concentrations in

123
Tabl
e 40
. S
umm
ary
of to
xici
ty/c
hem
istr
y re
latio
nshi
ps fo
r th
ose
chem
ical
s th
at w
ere
sign
ifica
ntly
cor
rela
ted
with
toxi
c-ity
in th
e P
hase
1 s
ampl
es.
Spe
arm
anR
atio
of h
ighl
yR
atio
of h
ighl
yN
o. o
f sam
ples
rank
cor
rela
tion
toxi
c av
erag
es to
toxi
c av
erag
es to
that
equ
alle
d or
coef
ficie
nts
non-
toxi
c av
erag
esre
spec
tive
SQ
Gs
exce
eded
Am
phip
odM
icro
tox
Am
phip
odM
icro
tox
Am
phip
odM
icro
tox
SQ
Gs
silv
erns
-0.3
63*
0.9
1.4
<1.
0<
1.0
0ch
rom
ium
ns-0
.351
*1.
11.
5<
1.0
<1.
01
cadm
ium
ns-0
.472
*1.
91.
3<
1.0
<1.
00
copp
erns
-0.4
49*
1.6
1.5
<1.
0<
1.0
2m
ercu
ry-0
.437
*-0
.377
*2.
20.
94.
53.
130
nick
elns
-0.4
51*
1.2
1.6
<1.
0<
1.0
3le
adns
-0.4
78*
1.5
1.7
<1.
01.
08
antim
ony
ns-0
.355
*1.
61.
4na
nana
tin-0
.342
*-0
.427
*1.
71.
6na
nana
zinc
ns-0
.433
*1.
21.
8<
1.0
1.1
5ci
s-ch
lord
ane
ns-0
.384
*2.
01.
1na
nana
tran
s-no
nach
lor
ns-0
.402
*2.
01.
2na
nana
4,4'
-DD
Ens
-0.4
06*
4.0
0.7
1.6
<1.
012
4,4'
-DD
T-0
.476
*-0
.341
*20
.30.
121
.61.
714
tota
l ind
eno-
pes
ticid
esns
-0.3
95*
1.9
1.2
nana
nape
trol
eum
PA
Hs
-0.4
68*
-0.6
25**
*6.
326
.2na
nana
com
bust
ion
PA
Hs
-0.5
76**
-0.6
02**
12.7
6.7
nana
nasu
m o
f LP
AH
s-0
.592
**-0
.650
***
37.6
25.6
11.0
18.9
9su
m o
f HP
AH
s-0
.471
*-0
.512
*7.
16.
85.
07.
314
sum
of t
otal
PA
Hs
-0.4
95*
-0.6
03**
14.8
10.4
1.8
2.8
4flu
oran
then
e/to
c-0
.559
**-0
.418
*4.
64.
37.
29.
720
acen
apht
hene
/toc
-0.6
41**
*-0
.437
*58
.734
.22.
84.
82
phen
anth
rene
/toc
-0.5
71**
-0.3
98*
20.2
13.9
10.4
17.0
14
*p<
0.05
, **p
<0.
001,
***
p<0.
0001

124
the nontoxic samples (often by a considerable amount), and they exceeded the applicable guidelines(Table 40). The concentrations of the low molecular weight PAHs, in particular, corresponded verywell with the toxicity results. The concentrations of the petroleum-related compounds were very highin the samples that were toxic in the Microtox tests, whereas the combustion-related compounds wererelatively high in the samples that were toxic in the amphipod tests. The concentrations of acenaphthenewere correlated with toxicity, and were highly elevated in the toxic samples, but they exceeded theapplicable SQC by only a factor of 2.8 and 4.8, respectively, in the two tests. Also, phenanthrene wascorrelated with toxicity and elevated in concentration in the toxic samples; in addition, it was elevatedrelative to the applicable SQC by factors of 10.4 and 17.0, respectively, in the two tests.
In summary, these data from the Phase 1 portion of the survey suggest that the toxicity observed in thesamples was in strong correspondence with the concentrations of the PAHs in the samples. To a con-siderably lesser degree, toxicity corresponded with the concentrations of some trace metals and chlori-nated organic compounds.
In the samples analyzed during Phase 2 of the survey, a considerable number of chemicals co-variedwith amphipod survival (Table 41). Nine trace elements were correlated with toxicity to the amphi-pods; however, the concentrations of most of these metals were not highly elevated relative to appli-cable guidelines. For example, cadmium, chromium, and copper were correlated with amphipod sur-vival, but the concentrations of these substances were below the ERM values. The concentrations ofmercury were elevated relative to the ERM values, but Long et al. (1995) reported only a moderatedegree of confidence in the guidelines for mercury.
Whereas the concentrations of PAHs were highly correlated with amphipod survival in Phase 1, theconcentrations of PCBs, 2,3,7,8-tcdd, and many other chlorinated hydrocarbons were highly correlatedwith amphipod survival in Phase 2 (Table 41). The strong correlations with are particularly interestingsince dioxins generally are not especially toxic to invertebrates in short-term acute exposures. Noapplicable guidelines are available for many of these compounds. The concentrations of dieldrin werefar below the applicable sediment guideline values, whereas the concentrations of the p,p’-DDE andtotal DDT isomers were high relative to the ERM values of Long et al (1995), but were far below therespective SECs of MacDonald (1994).
The PAH concentrations in some samples exceeded the sediment guidelines of Long et al. (1995) or theU.S. EPA (1994) and the average concentrations in the toxic samples exceeded the average in thenontoxic samples. However, amphipod survival was not correlated with those compounds, and, there-fore, they were not included in Table 41. Nevertheless, they may have been important in contributingto toxicity in some specific samples in which the PAH concentrations were particularly high.
In previous studies conducted within this study area, measures of sediment toxicity were highly corre-lated with a number of different chemicals. Scott et al. (1990) reported that amphipod mortality insamples from the Hudson-Raritan Estuary was correlated with the concentrations of total PCBs, totalPAHs, several pesticides, copper, zinc, chromium, lead, nickel, and cadmium. Also, the concentrationsof many of these chemicals in the highly toxic samples equalled or exceeded the respective ERMvalues. The correlations between amphipod mortality and the concentrations of trace metals normal-ized to the aluminum content were highly significant in the EMAP samples (Schimmel et al., 1994). Insamples collected by the City of New York (Brosnan and O’Shea, 1994), amphipod mortality wascorrelated with total SEM/AVS ratios.

125
Table 41. Summary of toxicity/chemistry relationships for those chemicals that were sig-nificantly correlated with toxicity in the Phase 2 samples.
Spearman Ratio of highly Ratio of highly Number of samplesrank correlation toxic averages to toxic averages to that equalled or
coefficients non-toxic averages SQGs exceeded SQGs
Trace elements
silver -0.585* 1.5 1.0 7cadmium -0.777** 2.9 0.3 0chromium -0.673* 1.4 0.4 0copper -0.723* 2.1 0.5 0mercury -0.612* 1.4 3.4 17lead -0.681* 2.3 0.9 10tin -0.734* 2.8 na naselenium -0.647* 1.7 na nazinc -0.534* 2.4 1.0 10
Chlorinated hydrocarbons
sum of PCB congeners -0.783* 5.1 4.2 16cumulative PCB TEQ -0.850** 2.8 <1.0 22378-tcdd -0.868** 10.6 2.7 11cumulative dioxin TEQ -0.866** 6.5 3.5 14total cumulative TEQ -0.865** 5.4 4.2 15
Pesticides
hexachlorobenzene -0.633* 5.0 na nadelta-BHC -0.487* 1.9 na naoxychlordane -0.633* 2.6 na natrans-chlordane -0.705* 6.2 na nacis-chlordane -0.677* 6.0 na nadieldrin (dry wt.) -0.848** 3.9 na nadieldrin (oc) -0.841** 2.7 0.02 0o, p’ - DDD -0.629* 3.2 na napentachloro anisole -0.599* 2.2 na naheptachlor epoxide -0.680* 4.9 na natrans-nonachlor -0.699* 4.9 na nao, p’ - DDE -0.707* 2.5 na nap, p’ - DDE -0.800** 2.7 1.6 13cis-nonachlor -0.707* 4.8 na nao, p’ - DDT -0.576* 4.6 na nap, p’ - DDD -0.597* 2.9 na namirex -0.569* 4.6 na nasum of total DDTs -0.576* 2.2 3.6 15
*p<0.05, **p<0.001. na = no applicable SQGs available.

126
As observed in this survey, many contaminants co-vary with each other in the sediments. Therefore,correlation analyses alone do not provide great insight into the potential causes of toxicity. A muchstronger weight of evidence is provided by the complementary measures of correlative strength, con-centrations gradients between toxic and nontoxic samples, and comparisons with applicable effects-based, numerical guidelines.
CONCLUSIONS
This survey was intended to provide information on the possible biological effects of toxic chemicalsin the sediments of the Hudson-Raritan estuary. Standardized laboratory toxicity tests were performedon 174 samples collected throughout the study area. Some of the important conclusions derived fromthis survey follow:
Potential for Toxicity
• The concentrations and mixtures of toxicants quantified in previous studies differed among themany different waterways, tributaries, harbors, and basins of this study area.
• The concentrations of many substances quantified during previous studies exceeded the concentra-tions previously associated with toxicity, occasionally by a great amount, and therefore, suggested thatsediments in this area may be toxic.
• The concentrations of polynuclear aromatic hydrocarbons (PAHs) were extremely high in somesamples from the East River collected during the present survey. The concentrations of chlorinatedhydrocarbons, such as PCBs, pesticides, and dioxins, were very high in some samples from the lowerPassaic River and Newark Bay. The concentrations of total simultaneously extracted metals exceededthe acid-volatile sulfide concentrations in a few of the samples.
• Based upon historical data, those areas included in the present survey in which the highest toxicitywas predicted included Newark Bay and Arthur Kill. As expected, many samples from these twoadjacent areas were highly toxic. Portions of the East River and lower Passaic River, which wereexpected to be moderately toxic, often were moderately to highly toxic in the laboratory tests.
Incidence of Toxicity
The significance of the toxicity data was determined in statistical comparisons of the test results withthe respective controls.
• Out of 58 sediment samples tested in previous studies, 45 (77.6%) were highly toxic to eithernematode growth or amphipod survival.
• All four test end-points measured in the present survey indicated results significantly differentfrom controls in samples collected throughout the estuary.
• Of the 117 stations that were sampled in Phase 1 of the present survey, test results for 81 stations(69% of the total tested) were significantly different from controls in at least one of the test end-points.
• Of the 117 samples, 46% were significantly different from controls in the amphipod survival tests.• Of 109 samples tested, 27% were significantly different from controls in the tests of bivalve em-
bryo survival or normal development.• Of 116 samples tested, 41% were significantly different from controls in the bacterial biolumines-
cence tests.• Of 57 samples from Newark Bay and vicinity tested during Phase 2, 48 (84%) were significantly
toxic to amphipod survival.

127
• In tests of growth, 13 of 17 samples were toxic to the polychaete Armandia brevis and 8 of 17samples were toxic to the sand dollar Dendraster excentricus. Also, 8 of 9 samples were toxic in testsof survival with the freshwater amphipod Diporeia spp.
Spatial Patterns in Toxicity
• Toxicity extended throughout much of the study area and no clear boundary or limit to toxicity wasapparent.
• The data from each of the individual tests were correlated with each other to different degrees andindicated overlap in the patterns of toxicity.
• 100% mortality of amphipods was observed in samples from Newark Bay, Arthur Kill, and theEast River.
• Regions of the study area in which highly toxic sediments were collected included the East River,the vicinity of the Verrazano Narrows Bridge, Kill van Kull near Shooter’s Island, Arthur Kill, centralNewark Bay, lower Passaic River, and Sandy Hook Bay.
• Sediments that were consistently not toxic or the least toxic in all tests were collected in the lowerHudson River off Manhattan Island, in the center of upper New York Harbor, in southern Raritan Bay,and in some regions of north-central Raritan Bay.
• Based upon the distance from the metropolitan New York City area, the sediments collected in themouth of the estuary and New York Bight were expected not to be toxic or among the least toxic.However, some of the samples from these areas were toxic in some of the tests.
• The relatively high toxicity observed in the East River generally diminished eastward into LongIsland Sound and southward into upper New York Harbor.
• The relatively high toxicity in the lower Passaic River, Newark Bay, and Arthur Kill generallydiminished into central Raritan Bay.
• The relatively high toxicity in innermost Sandy Hook Bay generally diminished into central RaritanBay and the mouth of the estuary.
Spatial Extent of Toxicity.
• Approximately 25% of the study area exhibited toxicity in the bivalve embryo survival tests; 30%was toxic in the bivalve embryo development tests; 38% was toxic in the amphipod survival tests; andapproximately 39% of the area was toxic to microbial bioluminescence. Approximately 5.7% of thearea was toxic in all four of these tests. Since a probabalistic, random-stratified sampling design wasnot used in Phase 1, the estimates of the spatial extent of toxicity may not be accurate.
•Within the Newark Bay/lower Passaic River/lower Hackensack River/northern Arthur Kill region,however, 85% of the area was toxic to amphipod survival. Since a probabalistic, random-stratifiedsampling was used in Phase 2, the estimate of the spatial extent of toxicity in the Newark Bay area maybe much more accurate that the estimate for the entire survey area.
Chemistry/Toxicity Relationships.
• The chemistry/toxicity relationships differed among regions of the study area.• Toxicity to amphipod survival and microbial bioluminescence in samples from the East River and
vicinity was highly correlated with the concentrations of polynuclear aromatic hydrocarbons (PAHs).The concentrations of these compounds in highly toxic samples often exceeded effects-based guide-lines or toxicity thresholds.

128
• Toxicity to amphipod survival in samples from the lower Passaic River, Newark Bay and vicinitywas highly correlated with the concentrations of PCBs, dioxins, and pesticides, the concentrations ofwhich often exceeded effects-based guidelines or toxicity thresholds. In this area, toxicity was notcorrelated with the concentrations of PAHs.
• Toxicity to amphipod survival was not highly correlated with the concentrations of ammonia in thesamples.
• Toxicity to amphipod survival was not significantly correlated with total SEM:AVS ratios.• Toxicity to amphipod survival and microbial bioluminescence were moderately correlated with
some trace metals, such as lead and zinc.• Generally, the correlations between the results of the bivalve embryo tests and the concentrations
of all chemicals were poor.
ACKNOWLEDGMENTS
During Phase 1, the following personnel performed the chemical analyses of the sediment samples:Daniel Bardon, George Desreuisseau, Bernadette Koczwara, Robert Lizotte, Richard Restucci, andJulie Seavey (Battelle Ocean Sciences). During Phase 2, the following personnel participated in thesample collections: Douglas Pabst (Chief Survey Scientist), Matthew Masters, Helen Grebe, and Rob-ert Rosenner (U.S. EPA); and Captain Harry Rydquist and Thomas Wyche (U. S. Army Corps of Engi-neers, New York District). During Phase 2, the following personnel participated in the chemical analy-ses of the samples: Donald Tillitt, Bill Brumbaugh, Kathy Echols, Robert Gale, John Meadows, DianeNicks, and Paul Peterman (National Biological Service, Midwest Science Center). Donald Tillitt per-formed the H4IIE rat hepatoma bioassays. Peter Landrum (NOAA Great Lakes Environmental Re-search Laboratory) conducted toxicity tests with Diporeia spp. Edmundo Casillas (NMFS) provideddata from tests of growth impairment and microbial bioluminescence. Kevin McMahon and PamRubin (NOAA) edited and Sophie Bowen provided correction assistance. Andrew Robertson and JayField (U.S. NOAA/NOS) and Joel O’Connor and Darvene Adams (U.S. EPA, Region 2) providedtechnical reviews and helpful comments on an initial draft of this report. Jo Linse and Heather Boswellprepared some of the data figures for the report.
129
REFERENCES
Aqua Survey, Inc. 1990a. Solid phase 10-day static sediment tests for control, reference and testsediments. Job #9094. August 17, 1990. Prepared for Exxon Company, U.S.A., Linden, NJ. 112 pp.
Aqua Survey, Inc. 1990b. Solid phase 10-day static sediment tests for control, reference and testsediments. Job #9205. November 30, 1990. Prepared for Exxon Company, USA, Linden, NJ. 84 pp.
ASTM. 1990. Standard guide for conducting 10-day static sediment toxicity tests with marine andestuarine amphipods. Guide E, pp. 1367-90. American Society for Testing Materials, Philadelphia,PA. 9 pp.
Barnes, D., A. Alford-Stevens, L. Birnbaum, F.W. Kutz, W. Wood and D. Patton. 1991. Toxicityequivalency factors for PCBs? Quality Assurance: Good Practice, Regulation and Law 1(1):70-81.
Belin, J. S. and D. G. Barnes. 1989. Interim procedures for estimating risks associated with expo-sures to mixtures of chlorinated dibenzo-p-dioxins and -dibenzofurans (CDDs and CDFs) and 1989update. U.S. EPA/625/3-89/016. U.S. Environmental Protection Agency, Washington, DC. 29 pp.
Belton, T.J., R. Hazen, B.E. Ruppel, K. Lockwood, R. Mueller, E. Stevenson, and J.J. Post. 1985. Astudy of dioxin (2,3,7,8-tetrachlorodibenzo-p-dioxin) contamination in select finfish, crustaceans andsediments of New Jersey Waterways. New Jersey Dept. of Environmental Protection, Trenton, NJ.102 pp.
Bonnevie, N.L., R.J. Wenning, S.L. Huntley and H. Bedbury. 1993. Distribution of inorganic com-pounds in sediments from three waterways in northern New Jersey. Bulletin of Environmental Con-tamination and Toxicology 51:672-680.
Bopp, R.F. and H.J. Simpson. 1989. Contamination of the Hudson River - The sediment record. In:Contaminated marine sediments - assessment and remediation: 401-416. National Academy of Sci-ences, Washington, DC. 493 pp.
Bopp, R.F., M.L. Gross, H. Tong, H.J. Simpson, S.J. Monson, B.L. Deck and F.C. Moser. 1991. Amajor incident of dioxin contamination: Sediments of New Jersey estuaries. Environmental ScienceTechnology 25:951-956.
Breteler, R.J. (ed.) 1984. Chemical pollution of the Hudson-Raritan Estuary. NOAA Tech. Memo.NOS OMA 7. National Oceanic and Atmospheric Administration, Rockville, MD. 72 pp.
Brosnan, T.M. and M.L. O’Shea. 1993. New York Harbor Water Quality Survey: 1991-1992.Executive summary. New York City Dept. of Environmental Protection, Wards Island. New York, NY.29 pp.
City of New York. 1987. New York Harbor Water Quality Survey, 1987. New York City, , Dept. ofEnvironmental Protection, New York, NY. 19 pp.
Crecelius, E., C. Apts, L. Bingler, O. Cotter, S. Kiesser and R. Sanders. 1993. Analysis of marinesediment and bivalve tissue by x-ray fluorescence, atomic absorption, and inductively coupled plasma
130
mass spectrometry. In: Sampling and analytical methods of the National Status and Trends ProgramNational Benthic Surveillance and Mussel Watch Projects 1984-1992. Vol 3: III.187-III.212. Compre-hensive descriptions of elemental analytical methods. National Oceanic and Atmospheric Administra-tion, Silver Spring, MD.
DeMuth, S., E. Casillas, D.A. Wolfe and B. B. McCain. 1993. Toxicity of saline and organic solventextracts of sediments from Boston Harbor, Massachusetts and the Hudson-Raritan Estuary, New Yorkusing the Microtox bioassay. Archives of Environmental Contamination Toxicology 25:377-386.
Folk, 1974. Petrology of Sedimentary Rocks. Hemphill Publishing Company, Austin, TX. 184 pp.
Gottholm, B.W., M.R. Harmon and D.D. Turgeon. 1993. Assessment of chemical contaminants inthe Hudson-Raritan Estuary and coastal New Jersey area. National Oceanic and Atmospheric Admin-istration, Silver Spring, MD. 19 pp.
Gunster, D.G., C.A. Gillis, N.L. Bonnevie, T.B. Abel and R. J. Wenning. 1993. Petroleum andhazardous chemical spills in Newark Bay, New Jersey, USA from 1982-1991. Environmental Pollu-tion 82:245-253.
Huntley, S. L., N. L. Bonnevie, R. J. Wenning. 1993. Distribution of polycyclic aromatic hydrocar-bons (PAHs) in three northern New Jersey waterways. Bulletin of Environmental Contamination andToxicology 51: 865-872.
Jannuzzi, T.J., N.L. Bonnevie, and R.J. Wenning. 1995. An evaluation of current methods for devel-oping sediment quality guidelines for 2,3,7,8 tetrachlorodibenzo-p-dioxin. Archives of EnvironmentalContamination and Toxicology 28: 366-377.
Kohn, N.P., J.Q. Word, D.K. Niyogi, L.T. Ross, T. Dillon and D.W. Moore. 1994. Acute toxicity ofammonia to four species of marine amphipod. Marine Environmental Research 38:1-15.
Kutz, F.W., D.G. Barnes, D.P. Bottimore, H. Greim and E. W. Bretthauer. 1990. The Internationaltoxicity equivalency factor (I-REF) method of risk assessment for complex mixtures of dioxins andrelated compounds. Chemosphere 20(7-9):751-757.
Long, E.R. and L.G. Morgan. 1990. The potential for biological effects of sediment-sorbed con-taminants tested in the National Status and Trends Program. NOAA Tech. Memo. NOS OMA 52.National Oceanic and Atmospheric Administration, Seattle, WA. 175 pp.
Long, E.R., D.D. MacDonald, S.L. Smith, and F.D. Calder. 1995. Incidence of adverse biologicaleffects within ranges of chemical concentrations in marine and estuarine sediments. EnvironmentalManagement 19(1):81-97.
MacDonald, D.D. 1994. Sediment injury in the Southern California Bight: Review of the toxiceffects of DDTs and PCBs in sediments. Report prepared by MacDonald Environmental Sciences, Ltd.for NOAA Damage Assessment Program - Southwest Region, Long Beach, CA. 96 pp.
Mayer, Gary E. (ed.) 1982. Ecological stress and the New York Bight: Science and management.Estuarine Research Federation, Columbia, SC. 715 pp.

131
Mueller, J.A., T.A. Gerrish and M.C. Casey. 1982. Contaminant inputs to the Hudson-RaritanEstuary. NOAA Tech. Memo. OMPA-21. 192 pp.
National Marine Fisheries Service. 1994. Bioassays to assess sublethal toxicity of sediments fromthe Hudson-Raritan Estuary, New York. Quarterly Report (April-May-June, 1994). Northwest Fisher-ies Science Center, National Marine Fisheries Service, Seattle, WA. 22 pp.
New York-New Jersey Harbor Estuary Program. 1995. Proposed comprehensive conservation andmanagement plan. U.S. EPA, Region 2, New York, NY.
New York State Department of Environmental Conservation. 1993. Technical guidance for screen-ing contaminated sediments. NYSDEC Division of Fish and Wildlife, Albany, NY.
NOAA. 1987. National Status and Trends Program for Marine Environmental Quality ProgressReport. A summary of selected data on chemical contaminants in tissues collected during 1984, 1985,and 1986. NOAA Tech. Memo. NOS OMA 38. National Oceanic and Atmospheric Administration,Rockville, MD. 23 pp.
NOAA. 1988a. Hudson/Raritan Estuary: Issues, Resources, Status, and Management. NOAAEstuary-of-the-Month Seminar Series No. 9. National Oceanic and Atmospheric Administration, Wash-ington, DC. 170 pp.
NOAA. 1988b. National Status and Trends Program for Marine Environmental Quality ProgressReport. A summary of selected data on chemical contaminants in sediments collected during 1984,1985, 1986, and 1987. NOAA Tech Memo. NOS OMA 44. Rockville, MD. 15 pp.
NOAA. 1989. National Status and Trends Program for Marine Environmental Quality ProgressReport. A summary of data on tissue contamination from the first three years (1986-1988) of themussel watch project. NOAA Tech. Memo. NOS OMA 49. Rockville, MD. 22 pp.
NOAA. 1991. National Status and Trends Program for Marine Environmental Quality ProgressReport. Second summary of data on chemical contaminants in sediments from the National Status andTrends Program. NOAA Tech. Memo. NOS OMA 59. Rockville, MD. 29 pp.
O’Connor, T.P. and C.N. Ehler. 1991. Results from the NOAA National Status and Trends Programon distribution and effects of chemical contamination in the coastal and estuarine United States. Envi-ronmental Monitoring and Assessment 17:33-49.
Olsen, C.R., I.L. Larsen, R.H. Brewster, N.H. Cutshall, R.F. Bopp and H.J. Simpson. 1984. Ageochemical assessment of sedimentation and contaminant distributions in the Hudson-Raritan Estu-ary. NOAA Tech. Report NOS OMS 2. Rockville, MD. 101 pp.
Pearce, J.B. 1988. Changing patterns of biological responses to pollution in the New York Bight.In: Hudson/Raritan Estuary: Issues, Resources, Status, and Management: 1-26. NOAA Estuary-of-the-Month Seminar Series No. 9. National Oceanic and Atmospheric Administration, Washington,D.C. 170 pp.
Peven, C.S. and A.D. Uhler. 1993. Analytical procedures followed by Battelle Ocean Sciences andScience Applications International Corporation to quantify organic contaminants. In: Sampling and
132
Analytical Methods of the National Status and Trends Program Benthic Surveillance and Mussel WatchProjects 1984-1992. Volume IV. Comprehensive descriptions of trace organic analytical methods.NOAA Tech. Memo. NOS ORCA 71. National Oceanic and Atmospheric Administration, Rockville,MD.
Pruell, R.J., N.I. Rubinstein, B.K. Taplin, J.A. LiVolsi, and C.B. Norwood. 1990. 2,3,7,8-TCDD,2,3,7,8-TCDF and PCBs in marine sediments and biota: Laboratory and field studies. U.S. Environ-mental Protection Agency, Narragansett, R.I. Report No. EPA/600/8-90/068 prepared for U.S. ArmyCorps of Engineers, New York District. 75 pp.
Rice, C.A., P.D. Plesha, E. Casillas, D.A. Misitano, and J.P. Meador. In press. Growth and survivalof three marine invertebrate species in sediments from the Hudson-Raritan Estuary, New York.
Robertson, A., B.W. Gottholm, D.D. Turgeon and D.A. Wolfe. 1991. A comparative study ofcontaminant levels in Long Island Sound. Estuaries 14(3):290-298.
Schimmel, S.C., B.D. Melzian, D.E. Campbell, C.J. Strobel, S.J. Benyi, J.S. Rosen, and H.W. Buffum.1994. Statistical summary EMAP-Estuaries Virginian Province - 1991. Report No. EPA/620/R/94/005. U.S. Environmental Protection Agency, Narragansett, RI. 77 pp.
Scott, J., W. Berry, D. Cobb, D. Keith, G. Tracey, and N. Rubinstein. 1990. The application of theamphipod ten-day sediment toxicity test for dredged material evaluations. Submitted to U.S. EPARegion 2 by U.S. EPA Environmental Research Laboratory-Narragansett, RI.. ERL-Narragansett Con-tribution #1181. 25 pp.
Squibb, K.S., J.M. O’Connor and T.J. Kneip. 1991. New York/New Jersey Harbor Estuary Pro-gram. Module 3.1: Toxics Characterization Report. Prepared by Institute of Environmental Medicine,New York University Medical Center for U.S. EPA Region 2, New York City, N.Y. 188 pp.
Swartz, R.D., F.A. Cole, J.O. Lamberson, S.P. Ferraro, D.W. Schults, W.A. DeBen, H.Lee II andR.J.Ozretich. 1994. Sediment toxicity, contamination and amphipod abundance at a DDT- and dield-rin-contaminated site in San Francisco Bay. Environmental Toxicology & Chemistry 13(6):949-962.
Tatem, H.E., D.L. Brandon, C.R. Lee, A. S. Jarvis and R.G. Rhett. 1991. Effects of storage onsediment toxicity, bioaccumulation potential, and chemistry. Miscellaneous Paper EL-91-2. U.S. ArmyWaterways Experiment Station, Vicksburg, MS. 35 pp.
Tietjen, J.H. and J.J. Lee. 1984. The use of free-living nematodes as a bioassay for estuarinesediments. Marine Environmental Research 11:233-251.
Tillitt, D.E., J.P. Giesy and G.T. Ankley. 1991. Characterization of the H4IIE rat hepatoma cellbioassay as a tool for assessing toxic potency of planar halogenated hydrocarbons (PHHs) in environ-mental samples. Environmental Science Technology 25:87-92.
Tong, H.Y., S.J. Monson, M.L. Gross, R.F. Bopp, H.J. Simpson, B.L. Deck and F.C. Moser. 1990.Analysis of dated sediment samples from the Newark Bay area for selected PCDD/Fs. Chemosphere20:1497-1502.

133
U.S. EPA. 1990. Recommended protocols for conducting laboratory bioassays on Puget Soundsediments. Revised April, 1990. Puget Sound Estuary Program, U.S. EPA Region 10, Seattle, WA. 79pp.
U.S. EPA. 1993. Interim report on data and methods for assessment of 2,3,7,8-tetrachlorodibenzo-p-dioxin risks to aquatic life and associated wildlife. EPA/600/R-93/055. U.S. Environmental Protec-tion Agency, Office of Research and Development, Washington, DC.
U.S. EPA. 1994. Notice of sediment quality criteria. Federal Register 59 (11):2652-2656. U.S.Environmental Protection Agency, Washington, DC.
U.S. EPA/ACOE. 1977. Ecological evaluation of proposed discharge of dredged material intoocean waters. Implementation Manual for Section 103 of Public Law 92-532. U.S. EnvironmentalProtection Agency/U.S. Army Corps of Engineers, Washington, DC.
U.S. EPA/ACOE. 1991. Evaluation of dredged material proposed for ocean disposal. TestingManual. U.S. Environmental Protection Agency/U.S. Army Corps of Engineers, Washington, DC.EPA-503/8-91/001.

134
Appendix A. Phase 1 field notes.
Appendix B. Trace metals concentrations: Phase 1.
Appendix C. Acid-volatile sulfides and simultaneously extracted metals: Phase 1.
Appendix D. Polynuclear aromatic hydrocarbon concentrations : Phase 1.
Appendix E. PCB and pesticides concentrations: Phase 1.
Appendix F. Percent organic carbon, percent carbonate, and grain size: Phase 1.
Appendix G. Concentrations of all chemicals in Newark Bay samples: Phase 2.
Appendix H. Concentrations of dioxins and furans in Newark Bay samples: Phase 2.
Appendix I. Concentrations of tcdd-equivalents (pg/g) in H4IIE rat hepatoma bioassays of NewarkBay sediment extracts.
Appendix

AP
PE
ND
IX A
. Field
No
tes
Sta
tion
Latitude Longitude
De
pth
Num
.(°N
)(°W
)(m
)S
ediment description
1a
40°5
4'5
2"
73°5
4'5
3"
14
.3V
ery fine watery brow
n mud; R
PD
5 cm. deep; deep sedim
ent with H
2S odor.
1b
40°5
4'4
6"
73°5
4'5
8"
15
.5B
rown w
atery mud w
ith some sm
all shell fragments; R
PD
4 cm. deep.
1c
40°5
4'5
8"
73°5
4'5
2"
14
.9S
oft brownish green m
ud with sm
all shell fragments.
2a
40°5
2'4
2"
73°5
5'5
3"
14
.3W
atery brown m
ud in top 1 cm.; R
PD
3 cm. deep; few
oil droplets.2
b4
0°52
'40
"7
3°55
'52
"1
5.8
Soft brow
n silt in upper 3-4 cm.
2c
40°5
2'4
4"
73°5
5'5
5"
12
.5F
ine watery brow
n silt in upper 4 cm.
3a
40°4
6'5
5"
73°5
9'2
5"
13
.1W
atery mud; R
PD
<1 cm
. deep; clay beneath; oil droplets. 3
b4
0°46
'50
"7
3°59
'28
"1
1.6
Soft brow
n silt; RP
D <
0.5 cm. deep; black clay beneath; oil droplets.
3c
40°4
6'4
4"
73°5
9'3
1"
11
Soft brow
n silt; RP
D <
0.5 cm. deep; black clay beneath; oil droplets.
4a
40°5
3'4
6"
73°4
2'2
1"
14
.3B
rown flocculent surface layer; puddy-like green silt; R
PD
1 cm. deep.
4b
40°5
3'4
5"
73°4
2'0
8"
14
.6B
rown flocculent surface layer; puddy-like green silt; R
PD
1 cm. deep.
4c
40°5
3'3
5"
73°4
2'1
9"
15
.2P
uddy-like olive green silt; RP
D 1 cm
. deep. 5
a4
0°52
'04
"7
3°44
'54
"2
7.4
Brow
n-green silt w/shell fragm
ents and amphipod tubes; R
PD
1 cm. deep.
5b
40°5
1'5
3"
73°4
4'5
5"
25
.9B
rown-green silt; flocculent on surface; R
PD
0.5 cm. deep; few
oil droplets.5
c4
0°52
'00
"7
3°45
'04
"2
3.2
Brow
n-green silt; flocculent on surface; RP
D 1 cm
. deep; several oil droplets.6
a4
0°50
'04
"7
3°46
'41
"1
8.6
Gooey brow
n-green surface mud; R
PD
0.3 cm. deep; bottom
mud oily black w
ith anaerobic odor.6
b4
0°49
'56
"7
3°46
'42
"1
8.6
Brow
n mud on top w
ith flocculent and lots of shell fragments; R
PD
0.5-1.0 cm.
6c
40°4
9'5
9"
73°4
6'3
4"
17
.4Light brow
n flocculent layer on top; RP
D 0.25 to 0.50 cm
. deep; dark anaerobic mud below
.7
a4
0°48
'02
"7
3°47
'14
"3
5.4
Loose fine sand and mud w
ith floc. on surface; tube worm
s and shell fragments.
7b
40°4
8'0
1"
73°4
7'1
0"
35
.4C
lean brown m
ud; light floc. on surface; RP
D 1.0-2.5 cm
. deep; high water content.
7c
40°4
7'5
6"
73°4
7'0
8"
32
.9B
rown m
ud w/fine sand, shells, w
orm tubes, sea anem
ones crabs & clam
s; RP
D 2-3 cm
. deep.8
a4
0°48
'15
"7
3°50
'17
"1
3.7
Brow
n muddy, silty sand w
ith detritus & floc. on top; D
PR
2-3 cm. deep.
8b
40°4
8'2
0"
73°5
0'2
5"
5.5
Gooey brw
n mud w
/ black depositional layer, oily smell, shell fragm
ents; RP
D 1 cm
. deep.8
c4
0°48
'21
"7
3°50
'19
"6
.1B
rownish dense m
ud w/ scallop shells on surface; oily sm
ell; RP
D 0.5-1.0 cm
. deep.9
a4
0°47
'46
.2"
73°5
2'4
2"
9.7
Muddy, silty sand-dark green top w
/black layer underneath; oily smell; R
PD
1 cm.
9b
40°4
7'4
8"
73°5
2'5
1"
11
.6B
rown sandy top w
/thick mud; rust colored patches; light floc.; oily sm
ell; RP
D 1 cm
. deep.9
c4
0°47
'44
"7
3°52
'38
"1
1.6
Dark brow
n sandy top w/black oily m
ud below; R
PD
1 cm. deep.
10
a4
0°47
'58
"7
3°54
'04
"1
0.7
Brow
n mud w
/worm
tubes and oily smell; R
PD
2 cm. deep; dark black gooey m
ud below.
10
b4
0°47
'56
"7
3°54
'06
"7
Very thick, sticky m
ud with rust colored spots and shell fragm
ents; RP
D 2 cm
. deep.

AP
PE
ND
IX A
(con
td.)
Sta
tion
Latitude Longitude
De
pth
Num
.(°N
)(°W
)(m
)S
ediment description
10
c4
0°47
'54
"7
3°54
'02
"5
.5B
rown coarse top m
ud w/w
orm tubes; R
PD
2 cm. deep w
/darker, oily smelling m
ud below.
11
a4
0°44
'38
"7
3°57
'38
"4
.1S
ilty clay, amphipod tubes, m
ussels and sea grass; visible oil sheen on last grab of composite.
11
b4
0°44
'39
"7
3°57
'37
"6
.2S
oft silty clay; amphipod tubes, polychaetes and gold flecks present; R
PD
<1 cm
. deep.1
1c
40°4
4'4
3"
73°5
7'3
5"
3.1
Silty sand w
ith polychaetes and gold flecks; RP
D 2 cm
.1
2a
40°4
2'3
3"
73°5
8'1
9"
16
.5S
oft clay, amphipod tubes, snails, polychaetes, and oxidized m
aterial; RP
D <
1 cm.
12
b4
0°42
'35
"7
3°58
'13
"6
.2S
oupy silt; RP
D 2 cm
. deep; worm
tubes & hydroids in com
posite grab; benthic grab azoic.1
2c
40°4
2'3
1"
73°5
8'1
4"
3.3
Soupy silt, alm
ost clay; RP
D 1 cm
. deep; all grabs appeared azoic.1
3a
40°4
2'1
1"
74°0
1'2
5"
15
.5S
ilty mud w
ith black clay-like sediment below
the RP
D at <
0.5 cm. depth.
13
b4
0°42
'21
"7
4°01
'34
"1
8S
oft silt with black clay-like sedim
ent below the R
PD
at <0.5 cm
. depth.1
3c
40°4
2'1
1"
74°0
1'4
1"
19
Soft silt w
ith black silt beneath the RP
D at <
1 cm. depth; shells, m
ussels and crabs.1
4a
40°3
8'3
2"
74°0
3'1
2"
14
.9F
ine sand w/slight R
PD
of 1 cm. deep; w
hite specks, shells, polychaete worm
s; 1 razor clam shell.
14
b4
0°38
'42
"7
4°03
'14
"1
4.9
Fine sand, w
hite specks, shells; RP
D 1.5cm
. deep; benthic grab- RP
D 2.3 cm
. deep.1
4c
40°3
8'3
5"
74°0
3'2
4"
15
.2F
ine sand, shells, white specks, w
orms; R
PD
1.5 cm. deep; benthic grab- no visible R
PD
.1
5a
40°3
6'4
2"
74°0
2'0
3"
6.4
Silty, sandy m
ud; shells, one crab, small tubes; rust colored spots; oil sheen; R
PD
0.5 cm. deep.
15
b4
0°36
'47
"7
4°02
'30
"7
.9D
ark brwn m
ud, light floc.. on top, small tubes; R
PD
0.5 cm. deep; black m
ud below w
ith oily sheen.1
5c
40°3
6'5
9"
74°0
2'4
0"
6.1
Brow
n silty, sandy mud w
ith mussel shells; R
PD
0.5cm. deep.
16
a4
0°42
'29
"7
4°07
'02
"1
1S
andy mud, shells, pebbles, w
orm tubes; R
PD
1 cm. deep (R
PD
3 cm. on one grab); oily sheen.
16
b4
0°42
'27
"7
4°07
'12
"1
1S
andy mud, siltier below
surface; RP
D 0.5 to 1 cm
. deep; oily sheen; benthic grab RP
D 3 cm
. deep.1
6c
40°4
2'2
4"
74°0
7'0
6"
11
.6S
ilty sediment; R
PD
<0.5 cm
. deep; oily sheen in composite.
17
a4
0°38
'43
"7
4°10
'20
"1
4.2
Fine silt w
ith oil sheen on surface; small bivalves and polychaetes.
17
b4
0°38
'43
"7
4°10
'31
"1
1V
ery fine silt with oil sheen on surface; sm
all bivalves and polychaetes.1
7c
40°3
8'4
1"
74°1
0'1
1"
9.5
Very fine silt w
ith oil sheen on surface; small bivalves and polychaetes.
18
a4
0°34
'11
"7
4°12
'38
"1
2.8
Silty, petroleum
odor; RP
D 0.5 cm
. deep; benthic grab- RP
D 1.5 cm
deep w/dark black silt beneath.
18
b4
0°34
'09
"7
4°12
'41
"1
1.6
Silty w
/blk silt under RP
D of 0.5 cm
deep; oil sheen,organic matter, benthic grab- R
PD
1cm deep.
18
c4
0°34
'06
"7
4°12
'42
"9
.1S
oft black silt; RP
D very close to surface; oil sheen; very sm
all clams.
19
a4
0°29
'01
"7
4°21
'00
"1
.9F
ine to coarse sand and fine silt on surface; bivalve shells, sticks, rocks; no distinct RP
D.
19
b4
0°21
'01
"7
4°20
'54
"1
.8M
edium brow
n soft silt and fine sand; RP
D 0.5 cm
. deep.1
9c
40°2
9'0
2"
74°2
0'4
9"
1.8
Medium
and dark brown silt w
ith some fine sand; uneven surface; R
PD
1 cm. deep.
20
a4
0°30
'34
"7
4°18
'13
"2
.9M
edium brw
n, fine, soupy silt with a few
tar balls; worm
s, oysters, clam shells; R
PD
2.5 cm deep.
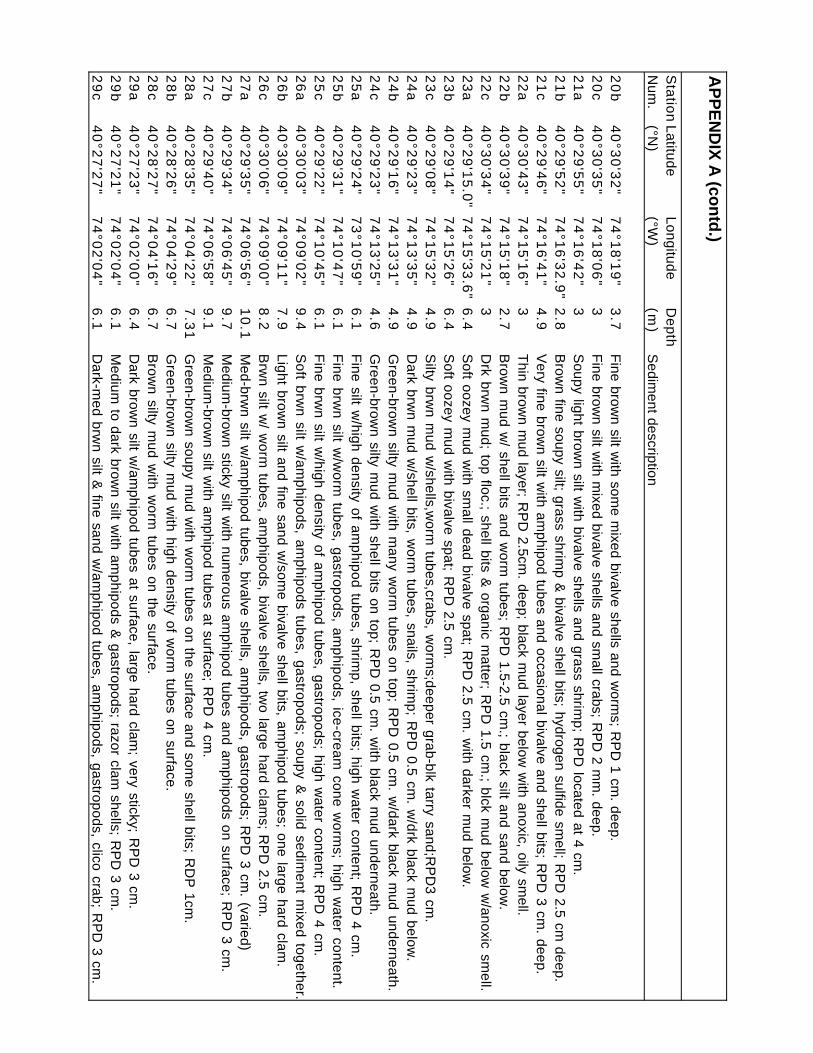
AP
PE
ND
IX A
(con
td.)
Sta
tion
Latitude Longitude
De
pth
Num
.(°N
)(°W
)(m
)S
ediment description
20
b4
0°30
'32
"7
4°18
'19
"3
.7F
ine brown silt w
ith some m
ixed bivalve shells and worm
s; RP
D 1 cm
. deep.2
0c
40°3
0'3
5"
74°1
8'0
6"
3F
ine brown silt w
ith mixed bivalve shells and sm
all crabs; RP
D 2 m
m. deep.
21
a4
0°29
'55
"7
4°16
'42
"3
Soupy light brow
n silt with bivalve shells and grass shrim
p; RP
D located at 4 cm
. 2
1b
40°2
9'5
2"
74°1
6'3
2.9
"2
.8B
rown fine soupy silt; grass shrim
p & bivalve shell bits; hydrogen sulfide sm
ell; RP
D 2.5 cm
deep.2
1c
40°2
9'4
6"
74°1
6'4
1"
4.9
Very fine brow
n silt with am
phipod tubes and occasional bivalve and shell bits; RP
D 3 cm
. deep. 2
2a
40°3
0'4
3"
74°1
5'1
6"
3T
hin brown m
ud layer; RP
D 2.5cm
. deep; black mud layer below
with anoxic, oily sm
ell.2
2b
40°3
0'3
9"
74°1
5'1
8"
2.7
Brow
n mud w
/ shell bits and worm
tubes; RP
D 1.5-2.5 cm
.; black silt and sand below.
22
c4
0°30
'34
"7
4°15
'21
"3
Drk brw
n mud; top floc.; shell bits &
organic matter; R
PD
1.5 cm.; blck m
ud below w
/anoxic smell.
23
a4
0°29
'15
.0"
74°1
5'3
3.6
"6
.4S
oft oozey mud w
ith small dead bivalve spat; R
PD
2.5 cm. w
ith darker mud below
.2
3b
40°2
9'1
4"
74°1
5'2
6"
6.4
Soft oozey m
ud with bivalve spat; R
PD
2.5 cm.
23
c4
0°29
'08
"7
4°15
'32
"4
.9S
ilty brwn m
ud w/shells,w
orm tubes,crabs, w
orms;deeper grab-blk tarry sand;R
PD
3 cm.
24
a4
0°29
'23
"7
4°13
'35
"4
.9D
ark brwn m
ud w/shell bits, w
orm tubes, snails, shrim
p; RP
D 0.5 cm
. w/drk black m
ud below.
24
b4
0°29
'16
"7
4°13
'31
"4
.9G
reen-brown silty m
ud with m
any worm
tubes on top; RP
D 0.5 cm
. w/dark black m
ud underneath.2
4c
40°2
9'2
3"
74°1
3'2
5"
4.6
Green-brow
n silty mud w
ith shell bits on top; RP
D 0.5 cm
. with black m
ud underneath.2
5a
40°2
9'2
4"
73°1
0'5
9"
6.1
Fine silt w
/high density of amphipod tubes, shrim
p, shell bits; high water content; R
PD
4 cm.
25
b4
0°29
'31
"7
4°10
'47
"6
.1F
ine brwn silt w
/worm
tubes, gastropods, amphipods, ice-cream
cone worm
s; high water content.
25
c4
0°29
'22
"7
4°10
'45
"6
.1F
ine brwn silt w
/high density of amphipod tubes, gastropods; high w
ater content; RP
D 4 cm
.2
6a
40°3
0'0
3"
74°0
9'0
2"
9.4
Soft brw
n silt w/am
phipods, amphipods tubes, gastropods; soupy &
solid sediment m
ixed together.2
6b
40°3
0'0
9"
74°0
9'1
1"
7.9
Light brown silt and fine sand w
/some bivalve shell bits, am
phipod tubes; one large hard clam.
26
c4
0°30
'06
"7
4°09
'00
"8
.2B
rwn silt w
/ worm
tubes, amphipods, bivalve shells, tw
o large hard clams; R
PD
2.5 cm.
27
a4
0°29
'35
"7
4°06
'56
"1
0.1
Med-brw
n silt w/am
phipod tubes, bivalve shells, amphipods, gastropods; R
PD
3 cm. (varied)
27
b4
0°29
'34
"7
4°06
'45
"9
.7M
edium-brow
n sticky silt with num
erous amphipod tubes and am
phipods on surface; RP
D 3 cm
.2
7c
40°2
9'4
0"
74°0
6'5
8"
9.1
Medium
-brown silt w
ith amphipod tubes at surface; R
PD
4 cm.
28
a4
0°28
'35
"7
4°04
'22
"7
.31
Green-brow
n soupy mud w
ith worm
tubes on the surface and some shell bits; R
DP
1cm.
28
b4
0°28
'26
"7
4°04
'29
"6
.7G
reen-brown silty m
ud with high density of w
orm tubes on surface.
28
c4
0°28
'27
"7
4°04
'16
"6
.7B
rown silty m
ud with w
orm tubes on the surface.
29
a4
0°27
'23
"7
4°02
'00
"6
.4D
ark brown silt w
/amphipod tubes at surface, large hard clam
; very sticky; RP
D 3 cm
.2
9b
40°2
7'2
1"
74°0
2'0
4"
6.1
Medium
to dark brown silt w
ith amphipods &
gastropods; razor clam shells; R
PD
3 cm.
29
c4
0°27
'27
"7
4°02
'04
"6
.1D
ark-med brw
n silt & fine sand w
/amphipod tubes, am
phipods, gastropods, clico crab; RP
D 3 cm
.
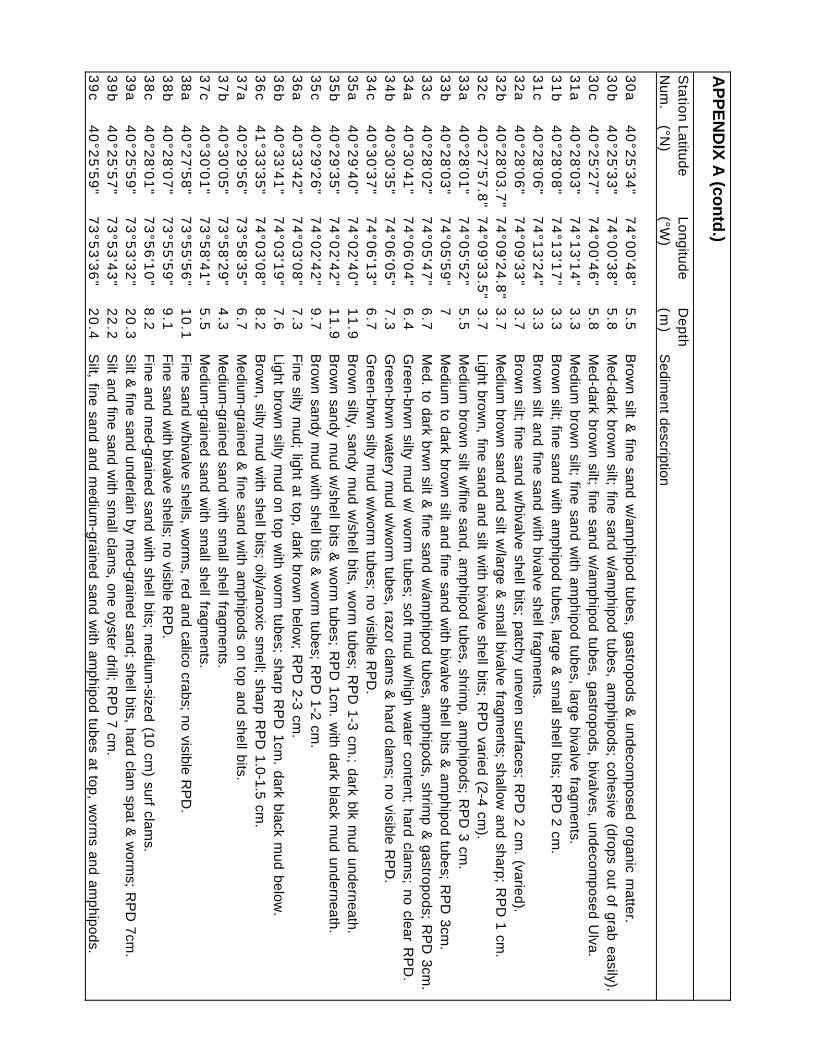
AP
PE
ND
IX A
(con
td.)
Sta
tion
Latitude Longitude
De
pth
Num
.(°N
)(°W
)(m
)S
ediment description
30
a4
0°25
'34
"7
4°00
'48
"5
.5B
rown silt &
fine sand w/am
phipod tubes, gastropods & undecom
posed organic matter.
30
b4
0°25
'33
"7
4°00
'38
"5
.8M
ed-dark brown silt; fine sand w
/amphipod tubes, am
phipods; cohesive (drops out of grab easily).3
0c
40°2
5'2
7"
74°0
0'4
6"
5.8
Med-dark brow
n silt; fine sand w/am
phipod tubes, gastropods, bivalves, undecomposed U
lva.3
1a
40°2
8'0
3"
74°1
3'1
4"
3.3
Medium
brown silt; fine sand w
ith amphipod tubes, large bivalve fragm
ents.3
1b
40°2
8'0
8"
74°1
3'1
7"
3.3
Brow
n silt; fine sand with am
phipod tubes, large & sm
all shell bits; RP
D 2 cm
.3
1c
40°2
8'0
6"
74°1
3'2
4"
3.3
Brow
n silt and fine sand with bivalve shell fragm
ents.3
2a
40°2
8'0
6"
74°0
9'3
3"
3.7
Brow
n silt; fine sand w/bivalve shell bits; patchy uneven surfaces; R
PD
2 cm. (varied).
32
b4
0°28
'03
.7"
74°0
9'2
4.8
"3
.7M
edium brow
n sand and silt w/large &
small bivalve fragm
ents; shallow and sharp; R
PD
1 cm.
32
c4
0°27
'57
.8"
74°0
9'3
3.5
"3
.7Light brow
n, fine sand and silt with bivalve shell bits; R
PD
varied (2-4 cm).
33
a4
0°28
'01
"7
4°05
'52
"5
.5M
edium brow
n silt w/fine sand, am
phipod tubes, shrimp, am
phipods; RP
D 3 cm
.3
3b
40°2
8'0
3"
74°0
5'5
9"
7M
edium to dark brow
n silt and fine sand with bivalve shell bits &
amphipod tubes; R
PD
3cm.
33
c4
0°28
'02
"7
4°05
'47
"6
.7M
ed. to dark brwn silt &
fine sand w/am
phipod tubes, amphipods, shrim
p & gastropods; R
PD
3cm.
34
a4
0°30
'41
"7
4°06
'04
"6
.4G
reen-brwn silty m
ud w/ w
orm tubes; soft m
ud w/high w
ater content; hard clams; no clear R
PD
.3
4b
40°3
0'3
5"
74°0
6'0
5"
7.3
Green-brw
n watery m
ud w/w
orm tubes, razor clam
s & hard clam
s; no visible RP
D.
34
c4
0°30
'37
"7
4°06
'13
"6
.7G
reen-brwn silty m
ud w/w
orm tubes; no visible R
PD
.3
5a
40°2
9'4
0"
74°0
2'4
0"
11
.9B
rown silty, sandy m
ud w/shell bits, w
orm tubes; R
PD
1-3 cm.; dark blk m
ud underneath.3
5b
40°2
9'3
5"
74°0
2'4
2"
11
.9B
rown sandy m
ud w/shell bits &
worm
tubes; RP
D 1cm
. with dark black m
ud underneath.3
5c
40°2
9'2
6"
74°0
2'4
2"
9.7
Brow
n sandy mud w
ith shell bits & w
orm tubes; R
PD
1-2 cm.
36
a4
0°33
'42
"7
4°03
'08
"7
.3F
ine silty mud; light at top, dark brow
n below; R
PD
2-3 cm.
36
b4
0°33
'41
"7
4°03
'19
"7
.6Light brow
n silty mud on top w
ith worm
tubes; sharp RP
D 1cm
. dark black mud below
.3
6c
41°3
3'3
5"
74°0
3'0
8"
8.2
Brow
n, silty mud w
ith shell bits; oily/anoxic smell; sharp R
PD
1.0-1.5 cm.
37
a4
0°29
'56
"7
3°58
'35
"6
.7M
edium-grained &
fine sand with am
phipods on top and shell bits.3
7b
40°3
0'0
5"
73°5
8'2
9"
4.3
Medium
-grained sand with sm
all shell fragments.
37
c4
0°30
'01
"7
3°58
'41
"5
.5M
edium-grained sand w
ith small shell fragm
ents.3
8a
40°2
7'5
8"
73°5
5'5
6"
10
.1F
ine sand w/bivalve shells, w
orms, red and calico crabs; no visible R
PD
.3
8b
40°2
8'0
7"
73°5
5'5
9"
9.1
Fine sand w
ith bivalve shells; no visible RP
D.
38
c4
0°28
'01
"7
3°56
'10
"8
.2F
ine and med-grained sand w
ith shell bits; medium
-sized (10 cm) surf clam
s.3
9a
40°2
5'5
9"
73°5
3'3
2"
20
.3S
ilt & fine sand underlain by m
ed-grained sand; shell bits, hard clam spat &
worm
s; RP
D 7cm
.3
9b
40°2
5'5
7"
73°5
3'4
3"
22
.2S
ilt and fine sand with sm
all clams, one oyster drill; R
PD
7 cm.
39
c4
0°25
'59
"7
3°53
'36
"2
0.4
Silt, fine sand and m
edium-grained sand w
ith amphipod tubes at top, w
orms and am
phipods.
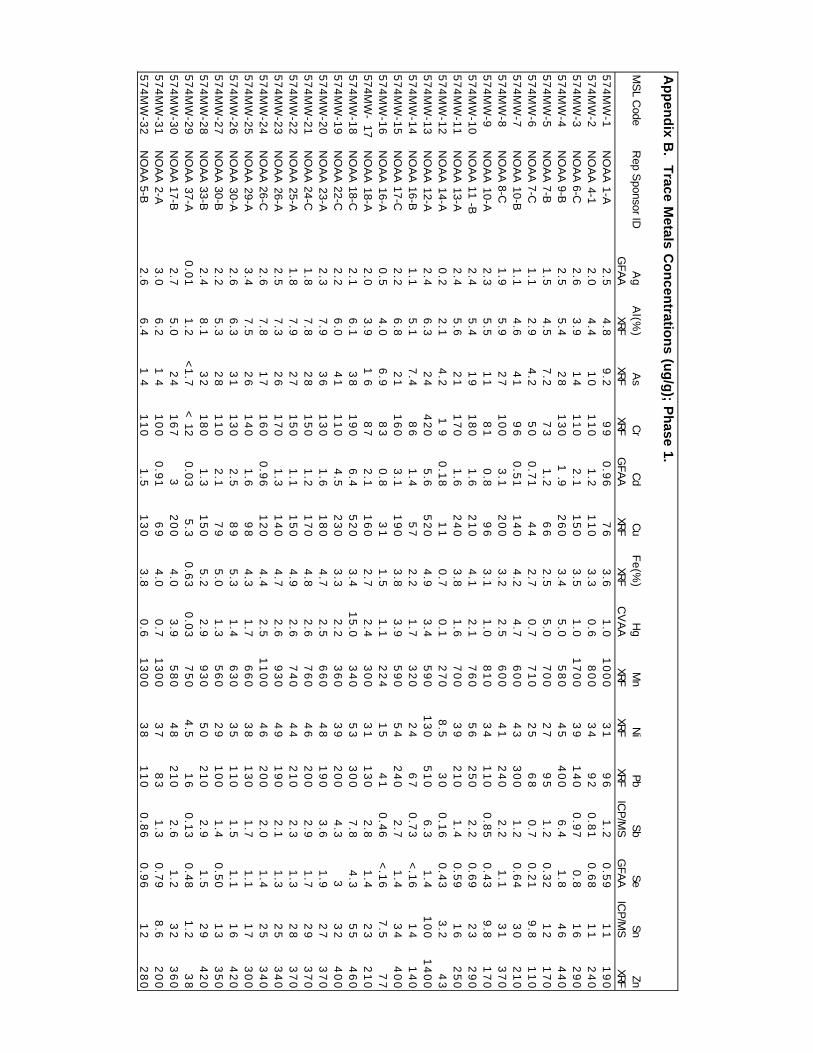
Ap
pen
dix B
. Trace M
etals Co
ncen
tration
s (ug
/g); P
hase 1.
MS
L Code
Rep S
ponsor IDA
gA
l(%)
As
Cr
Cd
Cu
Fe
(%)
Hg
Mn
Ni
PbS
bSe
SnZn
GFA
AXRF
XRFXRF
GFA
AXRF
XRFC
VA
AXRF
XRFXRF
ICP
/MS
GFA
AIC
P/M
SXRF
57
4M
W-1
NO
AA
1-A2
.54
.89
.29
90
.96
76
3.6
1.0
10
00
31
96
1.2
0.5
91
11
90
57
4M
W-2
NO
AA
4-12
.04
.41
01
10
1.2
11
03
.30
.68
00
34
92
0.8
10
.68
11
24
05
74
MW
-3N
OA
A 6-C
2.6
3.9
14
11
02
.11
50
3.5
1.0
17
00
39
14
00
.97
0.8
16
29
05
74
MW
-4N
OA
A 9-B
2.5
5.4
28
13
01 .9
26
03
.45
.05
80
45
40
06
.41
.84
64
40
57
4M
W-5
NO
AA
7-B1
.54
.57
.27
31
.26
62
.55
.07
00
27
95
1.2
0.3
21
21
70
57
4M
W-6
NO
AA
7-C1
.12
.94
.25
00
.71
44
2.7
0.7
71
02
56
80
.70
.21
9.8
11
05
74
MW
-7N
OA
A 10-B
1.1
4.6
41
96
0.5
11
40
4.2
4.7
60
04
33
00
1.2
0.6
43
02
10
57
4M
W-8
NO
AA
8-C1
.95
.92
71
00
3.1
20
03
.22
.56
00
41
24
02
.21
.13
13
70
57
4M
W-9
NO
AA
10-A2
.35
.51
18
10
.89
63
.11
.08
10
34
11
00
.85
0.4
39
.81
70
57
4M
W-1
0N
OA
A 11 -B
2.4
5.4
19
18
01
.62
10
4.1
2.1
76
05
62
50
2.2
0.6
92
32
90
57
4M
W-1
1N
OA
A 13-A
2.4
5.6
21
17
01
.62
40
3.8
1.6
70
03
92
10
1.4
0.5
91
62
50
57
4M
W-1
2N
OA
A 14-A
0.2
2.1
4.2
1 90
.18
11
0.7
0.1
27
08
.53
00
.16
0.4
33
.24
35
74
MW
-13
NO
AA
12-A2
.46
.32
44
20
5.6
52
04
.93
.45
90
13
05
10
6.3
1.4
10
01
40
05
74
MW
-14
NO
AA
16-B1
.15
.17
.48
61
.45
72
.21
.73
20
24
67
0.7
3<
.16
14
14
05
74
MW
-15
NO
AA
17-C2
.26
.82
11
60
3.1
19
03
.83
.95
90
54
24
02
.71
.43
44
00
57
4M
W-1
6N
OA
A 16-A
0.5
4.0
6.9
83
0.8
31
1.5
1.1
22
41
54
10
.46
<.1
67
.57
75
74
MW
- 17
NO
AA
18-A2
.03
.91 6
87
2.1
16
02
.72
.43
00
31
13
02
.81
.42
32
10
57
4M
W-1
8N
OA
A 18-C
2.1
6.1
38
19
06
.45
20
3.4
15
.03
40
53
30
07
.84
.35
54
60
57
4M
W-1
9N
OA
A 22-C
2.2
6.0
41
11
04
.52
30
3.3
2.2
36
03
92
00
4.3
33
24
00
57
4M
W-2
0N
OA
A 23-A
2.3
7.9
36
13
01
.61
80
4.7
2.5
66
04
81
90
3.6
1.9
27
37
05
74
MW
-21
NO
AA
24-C1
.87
.82
81
50
1.2
17
04
.82
.67
60
46
20
02
.91
.72
93
70
57
4M
W-2
2N
OA
A 25-A
1.8
7.9
27
15
01
.11
50
4.9
2.6
74
04
42
10
2.3
1.3
28
37
05
74
MW
-23
NO
AA
26-A2
.57
.32
61
70
1.3
14
04
.72
.69
30
49
19
02
.11
.32
53
40
57
4M
W-2
4N
OA
A 26-C
2.6
7.8
17
16
00
.96
12
04
.42
.51
10
04
62
00
2.0
1.4
25
34
05
74
MW
-25
NO
AA
29-A3
.47
.52
61
40
1.6
98
4.3
1.7
66
03
81
30
1.7
1.1
17
30
05
74
MW
-26
NO
AA
30-A2
.66
.33
11
30
2.5
89
5.3
1.4
63
03
51
10
1.5
1.1
16
42
05
74
MW
-27
NO
AA
30-B2
.25
.32
81
10
2.1
79
5.0
1.3
56
02
91
00
1.4
0.5
01
33
50
57
4M
W-2
8N
OA
A 33-B
2.4
8.1
32
18
01
.31
50
5.2
2.9
93
05
02
10
2.9
1.5
29
42
05
74
MW
-29
NO
AA
37-A0
.01
1.2
<1
.7<
120
.03
5.3
0.6
30
.03
75
04
.51
60
.13
0.4
81
.23
85
74
MW
-30
NO
AA
17-B2
.75
.02
41
67
32
00
4.0
3.9
58
04
82
10
2.6
1.2
32
36
05
74
MW
-31
NO
AA
2-A3
.06
.21 4
10
00
.91
69
4.0
0.7
13
00
37
83
1.3
0.7
98
.62
00
57
4M
W-3
2N
OA
A 5-B
2.6
6.4
1 41
10
1.5
13
03
.80
.61
30
03
81
10
0.8
60
.96
12
28
0
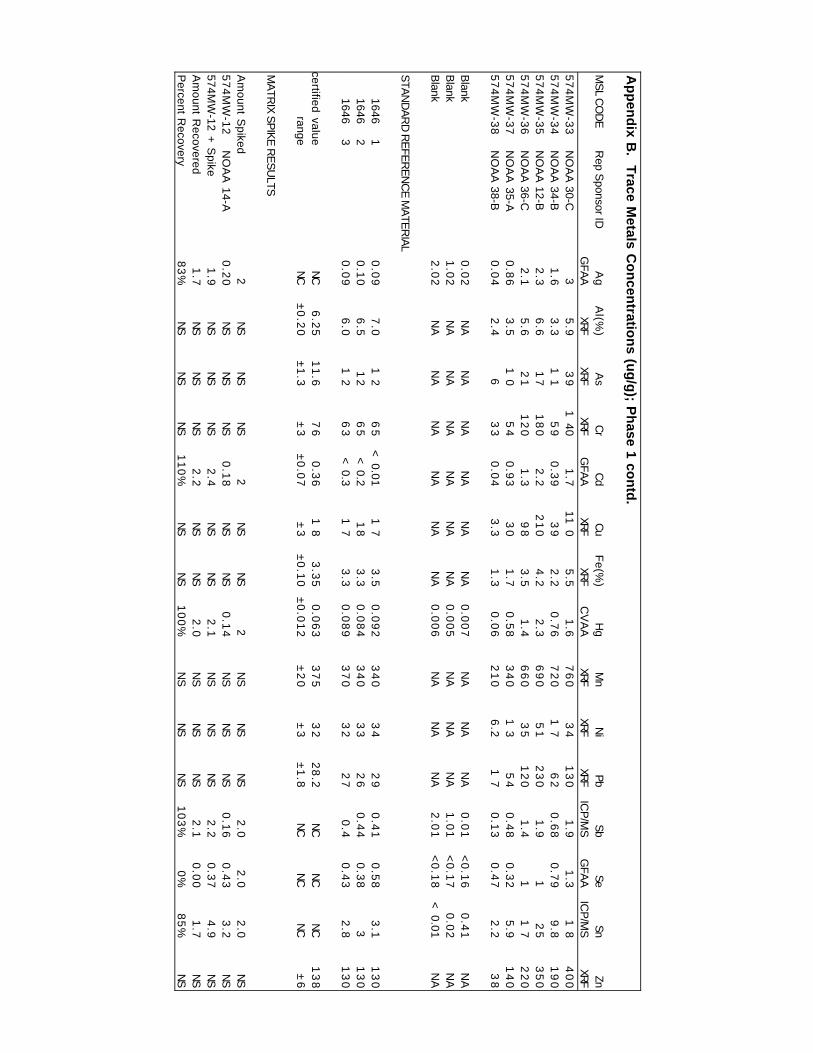
Ap
pen
dix B
. Trace M
etals Co
ncen
tration
s (ug
/g); P
hase 1 co
ntd
.
MS
L CO
DE
Rep S
ponsor IDA
gA
l(%)
As
Cr
Cd
Cu
Fe
(%)
Hg
Mn
Ni
PbS
bSe
SnZn
GFA
AXRF
XRFXRF
GFA
AXRF
XRFC
VA
AXRF
XRFXRF
ICP
/MS
GFA
AIC
P/M
SXRF
57
4M
W-3
3N
OA
A 30-C
35
.93
91
40
1.7
11
05
.51
.67
60
34
13
01
.91
.31 8
40
05
74
MW
-34
NO
AA
34-B1
.63
.31 1
59
0.3
93
92
.20
.76
72
01 7
62
0.6
80
.79
9.8
19
05
74
MW
-35
NO
AA
12-B2
.36
.61
71
80
2.2
21
04
.22
.36
90
51
23
01
.91
25
35
05
74
MW
-36
NO
AA
36-C2
.15
.62
11
20
1.3
98
3.5
1.4
66
03
51
20
1.4
11 7
22
05
74
MW
-37
NO
AA
35-A0
.86
3.5
1 05
40
.93
30
1.7
0.5
83
40
1 35
40
.48
0.3
25
.91
40
57
4M
W-3
8N
OA
A 38-B
0.0
42
.46
33
0.0
43
.31
.30
.06
21
06
.21 7
0.1
30
.47
2.2
38
Blank
0.0
2N
AN
AN
AN
AN
AN
A0
.00
7N
AN
AN
A0
.01
<0
.16
0.4
1N
AB
lank1
.02
NA
NA
NA
NA
NA
NA
0.0
05
NA
NA
NA
1.0
1<
0.1
70
.02
NA
Blank
2.0
2N
AN
AN
AN
AN
AN
A0
.00
6N
AN
AN
A2
.01
<0
.18
< 0
.01
NA
STA
ND
AR
D R
EFE
RE
NC
E M
ATE
RIA
L
1646 10
.09
7.0
1 26
5<
0.0
11 7
3.5
0.0
92
34
03
42
90
.41
0.5
83
.11
30
1646 20
.10
6.5
12
65
< 0.2
18
3.3
0.0
84
34
03
32
60
.44
0.3
83
13
01646 3
0.0
96
.01 2
63
< 0.3
1 73
.30
.08
93
70
32
27
0.4
0.4
32
.81
30
certified valueNC
6.2
51
1.6
76
0.3
61 8
3.3
50
.06
33
75
32
28
.2NC
NCNC
13
8range
NC±
0.2
0±
1.3
±3
±0
.07
±3
±0
.10
±0
.01
2±
20
±3
±1
.8NC
NCNC
±6
MA
TRIX
SP
IKE
RE
SU
LTS
Am
ount Spiked
2N
SN
SN
S2
NS
NS
2 N
SN
SN
S2
.02
.02
.0N
S5
74
MW
-12
NO
AA
14-A0
.20
NS
NS
NS
0.1
8N
SN
S0
.14
NS
NS
NS
0.1
60
.43
3.2
NS
574MW
-12 + S
pike1
.9N
SN
SN
S2
.4N
SN
S2
.1 N
SN
SN
S2
.20
.37
4.9
NS
Am
ount Recovered
1.7
NS
NS
NS
2.2
NS
NS
2.0
NS
NS
NS
2.1
0.0
01
.7N
SP
ercent Recovery
83
%N
SN
SN
S1
10
%N
SN
S1
00
% N
SN
SN
S1
03
%0
%8
5%
NS

Ap
pen
dix B
. Trace M
etals Co
ncen
tration
s (ug
/g); P
hase 1 co
ntd
.
MS
L CO
DE
RE
P S
PO
NS
OR
IDA
gA
l(%)
As
Cr
Cd
Cu
Fe
(%)
Hg
Mn
Ni
PbS
bSe
SnZn
GFA
AXRF
XRFXRF
GFA
AXRF
XRFC
VA
AXRF
XRFXRF
ICP
/MS
GFA
AIC
P/M
SXRF
MA
TRIX
SP
IKE
RE
SU
LTS
Am
ount Spiked
2N
SN
SN
S2
NS
NS
2N
SN
SN
S2
22
NS
57
4M
W-2
4N
OA
A 26-C
2.6
NS
NS
NS
0.9
6N
SN
S2
.5N
SN
SN
S2
1.4
25
NS
574MW
-24 + S
pike2
.6N
SN
SN
S3
.1N
SN
S4
.6N
SN
SN
S3
.81
.62
7N
SA
mount R
ecovered0
.01
NS
NS
NS
2.1
NS
NS
2.1
NS
NS
NS
1.8
0.1
72
NS
Percent R
ecovery1
%N
SN
SN
S1
05
%N
SN
S1
05
%N
SN
SN
S9
2%
9%
10
0%
NS
Am
ount Spiked
2N
SN
SN
S2
NS
NS
2N
SN
SN
S2
22
NS
57
4M
W-3
6N
OA
A 36-C
2.1
NS
NS
NS
1.3
NS
NS
1.4
NS
NS
NS
1.4
11 6
NS
574MW
-36 + S
pike2
.4N
SN
SN
S3
.3N
SN
S3
.9N
SN
SN
S3
.41
.11 8
NS
Am
ount Recovered
0.2
9N
SN
SN
S2
.1N
SN
S2
.5N
SN
SN
S2
0.0
61
.7N
SP
ercent Recovery
15
%N
SN
SN
S1
04
%N
SN
S1
25
%N
SN
SN
S1
00
%3
%8
5%
NS
Am
ount Spiked
2N
SN
SN
S2
NS
NS
2N
SN
SN
S2
22
NS
57
4M
W-3
8N
OA
A 38-B
0.0
4N
SN
SN
S0
.04
NS
NS
0.0
6N
SN
SN
S0
.13
0.4
72
.2N
S574M
W-38 +
Spike
1.6
NS
NS
NS
2.4
NS
NS
2.2
NS
NS
NS
2.2
0.5
94
.4N
SA
mount R
ecovered1
.6N
SN
SN
S2
.3N
SN
S2
.1N
SN
SN
S2
.10
.12
2.2
NS
Percent R
ecovery8
0%
NS
NS
NS
11
6%
NS
NS
10
6%
NS
NS
NS
10
4%
6%
11
1%
NS
NA
= N
ot applicableN
C =
Not certified
NS
= N
ot spiked

Appendix C. Acid-Volatile Sulfides and Simultaneously-Extracted Metals: Phase 1.MSLCode Sponsor ID AVS SEM
µmole/g Ratio*
574MW-1 NOAA 1-A 4.39 0.0067574MW-1 DUP NOAA 1-A 4.96 0.0074574MW-2 NOAA 4-A 61.05 0.0028574MW-3 * * NOAA 6-C 51.77 0.0029574MW-4 NOAA 9-B 69.32 0.0042574MW-5 * * NOAA 7-B 14.17 0.0212574MW-5 * * DUP NOAA 7-B 12.66 0.0092574MW-6 NOAA 7-C 27.54 0.0087574MW-7 * * NOAA 10-B 25.84 0.0068574MW-8 * * NOAA 8-C 21.98 0.0099574MW-9 NOAA 10-A 7.23 0.0128574MW-10 NOAA 11-B 59.78 0.0041574MW-11 NOAA 13-A 43.92 0.0051574MW-12 NOAA 14-A 0.63 0.0291574MW-13 NOAA 12-A 51.58 0.0049574MW-14 NOAA 16-B 15.13 0.0125574MW-15 NOAA 17-C 23.72 0.007574MW-15 DUP NOAA 17-C 18.58 0.0065574MW-16 NOAA 16-A 10.16 0.0196574MW-17 NOAA 18-A 56.73 0.0063574MW-18 * * NOAA 18-C 63.45 0.0056574MW-19 NOAA 22-C 54.71 0.0058574MW-20 NOAA 23-A 35.37 0.004574MW-21 * * NOAA 24-C 12.24 0.0073574MW-22 NOAA 25-A 14.57 0.0066574MW-23 NOAA 26-A 22.57 0.0068574MW-23 DUP NOAA 26-A 20.14 0.0045574MW-24 NOAA 26-C 19.32 0.0067574MW-25 NOAA 29-A 30.12 0.0058574MW-26 NOAA 30-A 25.9 0.0035574MW-27 NOAA 30-B 20.53 0.0072574MW-28 NOAA 33-B 29.21 0.0051574MW-29 NOAA 37-B <0.036 0.0365574MW-30 * * NOAA 17-B 20.78 0.005574MW-31 * * NOAA 2-A 1.08 0.0055574MW-32 NOAA 5-B 79.71 0.0012574MW-33 NOAA 30-C 18.44 0.0087574MW-34 NOAA 34-B 3.63 0.0148574MW-35 NOAA 12-B 37.86 0.007574MW-36 * * NOAA 36-C 28.08 0.0062574MW-37 NOAA 35-A 18.76 0.0108574MW-37 DUP NOAA 35-A 20.42 0.009574MW-38 NOAA 38-B 0.05 0.0495
574MW Blank-1 0 NA574MW Blank-2 0 NA*Sediment/acid volume** = Sample jar received broken.

Appendix C. Acid-Volatile Sulfides and Simultaneously-Extracted Metals: Phase 1 contd.MSLCode CADMIUM CADMIUM COPPER COPPER MERCURY
µg/g µmole/g µg/g µmole/g µmole/g
574MW-1 0.602 0.0054 32.67 0.5141 0.0048574MW-1 0.467 0.0042 28.53 0.4491 0.0066574MW-2 1.07 0.0095 17.66 0.278 0.00048574MW-3 1.09 0.0097 50.2 0.79 0.00052574MW-4 0.939 0.0084 44.52 0.7006 <0.00024574MW-5 0.781 0.0069 20.62 0.3245 0.00091574MW-5 0.712 0.0063 23.4 0.3683 0.0024574MW-6 0.404 0.0036 9.089 0.143 0.00005574MW-7 0.218 0.0019 62.89 0.9897 0.003574MW-8 1.67 0.015 82.13 1.293 0.00074574MW-9 0.321 0.0029 31.59 0.4972 0.0021574MW-10 0.771 0.0069 15.79 0.2485 0.0014574MW-11 0.922 0.0082 47.89 0.7537 0.0034574MW-12 0.171 0.0015 3.279 0.0516 0.0014574MW-13 2.84 0.025 79.75 1.255 0.00084574MW-14 0.817 0.0073 11.74 0.1847 0.0015574MW-15 1.59 0.014 50.44 0.7938 0.004574MW-15 1.78 0.016 54.02 0.8502 0.0036574MW-16 0.515 0.0046 6.388 0.1005 0.00098574MW-17 1.41 0.013 12.38 0.1948 0.0023574MW-18 3.71 0.033 141.3 2.224 0.0172574MW-19 1.89 0.017 28.13 0.4428 0.0022574MW-20 0.933 0.0083 56.34 0.8866 0.0065574MW-21 0.685 0.0061 70.68 1.112 0.014574MW-22 0.571 0.0051 66.14 1.041 0.017574MW-23 0.643 0.0057 56.9 0.8954 0.0093574MW-23 0.646 0.0057 56.77 0.8934 0.015574MW-24 0.507 0.0045 46.74 0.7356 0.0053574MW-25 0.918 0.0082 32.92 0.5181 0.0088574MW-26 1.89 0.017 33.84 0.5325 0.0048574MW-27 1.39 0.012 37.33 0.5875 0.0099574MW-28 0.757 0.0067 5 7 0.8971 0.012574MW-29 <0.007 <0.00007 0.9984 0.0157 0.0049574MW-30 1.67 0.015 66.34 1.044 0.0077574MW-31 0.579 0.0052 38.82 0.6109 0.013574MW-32 2.36 0.021 27.43 0.4317 0.0032574MW-33 0.944 0.0084 45.95 0.7231 0.0065574MW-34 0.207 0.0018 20.07 0.3158 0.0046574MW-35 1.02 0.0091 24.85 0.3911 0.002574MW-36 0.621 0.0055 38.53 0.6064 0.0029574MW-37 0.635 0.0056 9.608 0.1512 0.0021574MW-37 0.637 0.0057 9.514 0.1497 0.0021574MW-38 0.023 0.0002 0.9516 0.015 0.0025
574MW Blank-1 0.042 0.0004 0.0631 0.001 1.36574MW Blank-2 0.038 0.0003 0.2358 0.0037 2.27*Sediment/acid volume** = Sample jar received broken.

Appendix C. Acid-Volatile Sulfides and Simultaneously-Extracted Metals: Phase 1 contd.
Mercury Nickel Nickel Lead LeadMSLCode µg/g µg/g µmole/g µg/g µmole/g
574MW-1 0.000024 4.875 0.08304 63.89 0.3084574MW-1 0.000033 3.953 0.06734 57.45 0.2773574MW-2 2.40E-06 7.822 0.13323 58.76 0.2836574MW-3 2.60E-06 3.886 0.06619 77.96 0.3763574MW-4 <0.0000001 5.752 0.09797 272.1 1.313574MW-5 4.50E-06 2.29 0.039 51.62 0.2492574MW-5 0.000012 4.142 0.07054 51.28 0.2475574MW-6 2.00E-07 2.188 0.03726 38.09 0.1839574MW-7 0.000015 2.929 0.04988 201.3 0.9717574MW-8 3.70E-06 3.185 0.05426 132.8 0.641574MW-9 0.00001 2.499 0.04257 54.03 0.2608574MW-10 7.10E-06 6.753 0.115 149.6 0.7219574MW-11 0.000017 5.456 0.09293 111.O 0.5356574MW-12 6.80E-06 0.5996 0.01021 16.31 0.07874574MW-13 4.20E-06 9.769 0.1664 207.9 1.003574MW-14 7.50E-06 1.928 0.03284 46.15 0.2228574MW-15 0.00002 6.714 0.1144 147.1 0.7102574MW-15 1.77E-05 6.911 0.1177 158.1 0.7629574MW-16 4.90E-06 2.461 0.04192 30.36 0.1465574MW-17 0.000012 3.996 0.06806 79.09 0.3817574MW-18 0.000086 14.96 0.25478 189.7 0.9155574MW-19 0.000011 6.472 0.1102 93.18 0.4497574MW-20 0.000033 6.593 0.1123 130.7 0.6307574MW-21 0.00007 6.178 0.1052 131.4 0.6344574MW-22 0.000086 8.145 0.1387 162.3 0.7833574MW-23 0.000047 5.592 0.09526 132.3 0.6388574MW-23 0.000075 8.853 0.1508 133.4 0.6436574MW-24 0.000027 5.742 0.0978 132.8 0.6411574MW-25 0.000044 4.97 0.08464 81.8 0.3948574MW-26 0.000024 5.117 0.08715 73.19 0.3533574MW-27 0.000049 5.623 0.09578 74.38 0.359574MW-28 0.000059 7.816 0.1331 145.9 0.7042574MW-29 0.000025 2.158 0.03676 4.919 0.0237574MW-30 0.000038 15.64 0.2664 132.6 0.6399574MW-31 0.000064 15.15 0.2581 62.21 0.3003574MW-32 0.000016 4.444 0.0757 79.54 0.3839574MW-33 0.000033 6.65 0.1133 78.91 0.3808574MW-34 0.000023 3.246 0.05528 50.92 0.2458574MW-35 0.00001 4.929 0.08395 144 0.6952574MW-36 0.000014 6.132 0.1044 89.66 0.4328574MW-37 0.000011 2.446 0.04166 35.15 0.1696574MW-37 0.00001 3.032 0.05164 39.03 0.1884574MW-38 0.000013 0.712 0.01213 8.71 0.04204
574MW Blank-1 0.0068 0.1405 0.00239 0.0700 0.0003 0.00034574MW Blank-2 0.0013 0.3324 0.00566 0.0724 0.0003 0.00035
*Sediment/acid volume** = Sample jar received broken.

Appendix C. Acid-Volatile Sulfides and Simultaneously-Extracted Metals: Phase 1 contd.
Zinc Zinc Total SEM SEM/AVSMSLCode µg/g µmole/g umole/g ratio
574MW-1 95.74 1.465 2.38 0.54574MW-1 87.67 1.341 2.14 0.43574MW-2 122.7 1.877 2.58 0.04574MW-3 120.9 1.85 3.09 0.06574MW-4 190.7 2.917 5.04 0.07574MW-5 80.72 1.235 1.85 0.13574MW-5 83.41 1.276 1.97 0.16574MW-6 52.71 0.8063 1.17 0.04574MW-7 9 8 1.499 3.51 0.14574MW-8 143.8 2.199 4.2 0.19574MW-9 56.11 0.8583 1.66 0.23574MW-10 131.5 2.011 3.1 0.05574MW-11 127.6 1.951 3.34 0.08574MW-12 23.74 0.3632 0.51 0.8574MW-13 225.3 3.447 5.9 0.11574MW-14 70.56 1.079 1.53 0.1574MW-15 198.1 3.03 4.66 0.2574MW-15 209.2 3.2 4.95 0.27574MW-16 47.02 0.7194 1.01 0.1574MW-17 126.9 1.942 2.6 0.05574MW-18 233.4 3.571 7 0.11574MW-19 240.4 3.677 4.7 0.09574MW-20 206.8 3.163 4.8 0.14574MW-21 209.4 3.203 5.06 0.41574MW-22 211.9 3.241 5.21 0.36574MW-23 174.4 2.668 4.3 0.19574MW-23 180.3 2.759 4.45 0.22574MW-24 180.5 2.761 4.24 0.22574MW-25 155.1 2.373 3.38 0.11574MW-26 291 4.452 5.44 0.21574MW-27 232.7 3.56 4.61 0.22574MW-28 247.8 3.791 5.53 0.19574MW-29 16.93 0.2591 0.34 9.32574MW-30 164.4 2.515 4.48 0.22574MW-31 94.31 1.443 2.62 2.42574MW-32 136.3 2.085 3 0.04574MW-33 183.2 2.803 4.03 0.22574MW-34 134.4 2.055 2.67 0.74574MW-35 148.4 2.27 3.45 0.09574MW-36 112.4 1.72 2.87 0.1574MW-37 84.72 1.296 1.66 0.09574MW-37 89.6 1.371 1.77 0.09574MW-38 13.34 0.2041 0.27 5.47
574MW Blank-1 1.225 0.0187574MW Blank-2 1.417 0.0217

Appendix C. Acid-Volatile Sulfides and Simultaneously-Extracted Metals: Phase 1 contd.MSL Code Sponsor ID AVS CadmiumSTANDARD REFERENCE MATERIAL (µg/L) µmole/g µg/L
1643c-1 NA 9.721643c-2 NA 9.93
certified value NA 12.2range NA 1
1641 b- 1 NA NA1641 b- 2 NA NA1641 b- 3 NA NA
certified value NA NArange NA NA
SPIKE RESULTS (µg/L)
Amount Spiked NA 250574MW- 1 NOAA 1-A NA 4.4574MW-1 + Spike NA 251.31Amount Recovered NA 246.91Percent Recovery x100 NA 99.00%
Amount Spiked NA 250574MW-7 NOAA 10-B NA 1.85574MW-7 + Spike NA 234.74Amount Recovered NA 232.89Percent Recovery x100 NA 93%
Amount Spiked NA 250574MW-16 NOAA 16-A NA 10.49574MW-16 + Spike NA 251.18Amount Recovered NA 240.69Percent Recovery NA 96%
Amount Spiked NA 250574MW-24 NOAA 26-C NA 3.76574MW-24 + Spike 1 NA 237.46Amount Recovered NA 233.7Percent Recovery NA 93%
Amount Spiked NA 500574MW-24 NOAA 26-C NA 3.76574MW-24 + Spike 2 NA 521.31Amount Recovered NA 517.55Percent Recovery NA 104%

Appendix C. Acid-Volatile Sulfides and Simultaneously-Extracted Metals: Phase 1 contd.MSL Code Copper Mercury NickelSTANDARD REFERENCE MATERIAL (µg/L) µg/L µg/L µg/L
1643c-1 18.92 NA 57.231643c-2 19.33 NA 57.21
22.3 NA 60.62.8 NA 7.3
1641 b- 1 NA 1550 NA1641 b- 2 NA 1600 NA1641 b- 3 NA 1580 NA
NA 1520 NANA 4 0 NA
SPIKE RESULTS (µg/L)
Amount Spiked 250 0.136 250 250574MW- 1 219.2 0.049 34.76 426.63574MW-1 + Spike 489.37 0.1798 284.57 699.25Amount Recovered 270.17 0.1308 249.81 272.62Percent Recovery x100 108.00% 96.00% 100.00% 109.00%
Amount Spiked 250 0.136 250 250574MW-7 425.91 0.0375 22.03 1359.65574MW-7 + Spike 620.79 0.1742 255.7 1464.32Amount Recovered 194.88 0.1367 233.67 104.67Percent Recovery x100 78% 101% 93% .42#
Amount Spiked 250 0.136 250 250574MW-16 126.79 0.0366 50.55 596.44574MW-16 + Spike 362.81 0.1745 287.21 825.7Amount Recovered 236.02 0.1379 236.66 229.26Percent Recovery 94% 1.01 95% 92%
Amount Spiked 250 0.136 250 250574MW-24 313.02 0.053 40.54 886.16574MW-24 + Spike 1 538.44 0.2214 275.95 1110.32Amount Recovered 225.42 0.1684 235.41 224.16Percent Recovery 90% 124% 94% 90%
Amount Spiked 500 NS 500 500574MW-24 313.02 NS 40.53 886.16574MW-24 + Spike 2 858.68 NS 563.42 1505.04Amount Recovered 545.66 NS 522.89 618.88Percent Recovery 1.09 NS 105% 124%
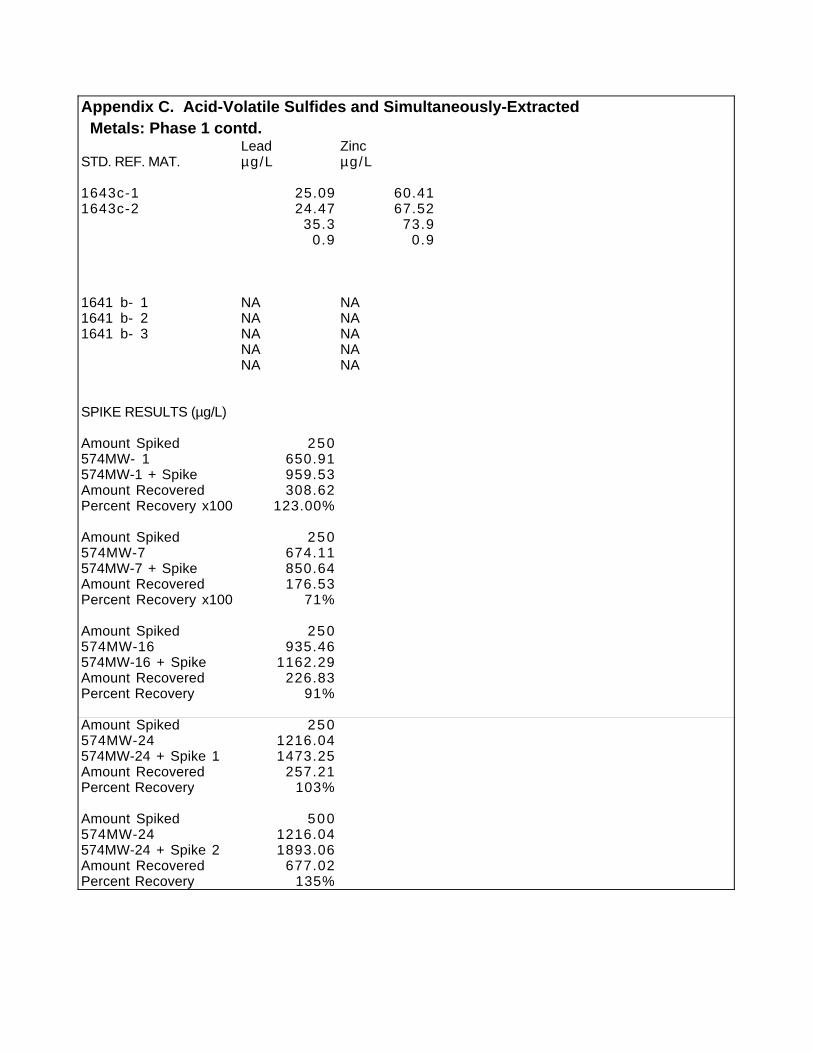
Appendix C. Acid-Volatile Sulfides and Simultaneously-Extracted Metals: Phase 1 contd.
Lead ZincSTD. REF. MAT. µg/L µg/L
1643c-1 25.09 60.411643c-2 24.47 67.52
35.3 73.90.9 0.9
1641 b- 1 NA NA1641 b- 2 NA NA1641 b- 3 NA NA
NA NANA NA
SPIKE RESULTS (µg/L)
Amount Spiked 250574MW- 1 650.91574MW-1 + Spike 959.53Amount Recovered 308.62Percent Recovery x100 123.00%
Amount Spiked 250574MW-7 674.11574MW-7 + Spike 850.64Amount Recovered 176.53Percent Recovery x100 71%
Amount Spiked 250574MW-16 935.46574MW-16 + Spike 1162.29Amount Recovered 226.83Percent Recovery 91%
Amount Spiked 250574MW-24 1216.04574MW-24 + Spike 1 1473.25Amount Recovered 257.21Percent Recovery 103%
Amount Spiked 500574MW-24 1216.04574MW-24 + Spike 2 1893.06Amount Recovered 677.02Percent Recovery 135%


Appendix C. Acid-Volatile Sulfides and Simultaneously-Extracted Metals: Phase 1 contd.REPLICATE ANALYSES (mg/g)MSLCode574MW-1 NOAA 1-A 4.39 0.602574MW-1 DUP NOAA 1-A 4.96 0.467
RPD % 12% 25%
574MW-5 NOAA 7-B 14.17 0.781574MW-5 DUP NOAA 7-B 12.66 0.712
RPD % 11% 9%
574MW-15 NOAA 17-C 23.72 1.59574MW-15 DUP NOM 17-C 18.58 1.78
24% 11%
574MW-23 NOAA 26-A 22.57 0.643574MW-23 DUP NOAA 26-A 20.14 0.646
RPD % 11% 0%
574MW-37 NOAA 35-A 18.76 0.635574MW-37 DUP NOAA 35-A 20.42 0.637
RPD % 8% 0%

Appendix C. Acid-Volatile Sulfides and Simultaneously-Extracted Metals: Phase 1 contd.REPLICATE ANALYSES (mg/g)MSLCode
32.67 0.00476 4.88 63.89 95.728.53 0.00664 3.95 57.45 87.7
14% 33% 21% 11% 9%
20.62 0.00091 2.29 51.62 80.723.4 0.00236 4.14 51.28 83.413% 89% 58% 1% 3%
50.44 0.00398 6.71 147.14 198.0654.02 0.00356 6.91 158.07 209.19
7% 0.11 3% 7% 5%
56.9 0.00934 5.59 132.34 174.3956.77 0.01509 8.85 133.36 180.34
0% 47% 45% 1% 3%
9.61 0.00214 2.45 35.15 84.729.51 0.00208 3.03 39.03 89.6
1% 0.03 21% 10% 6%
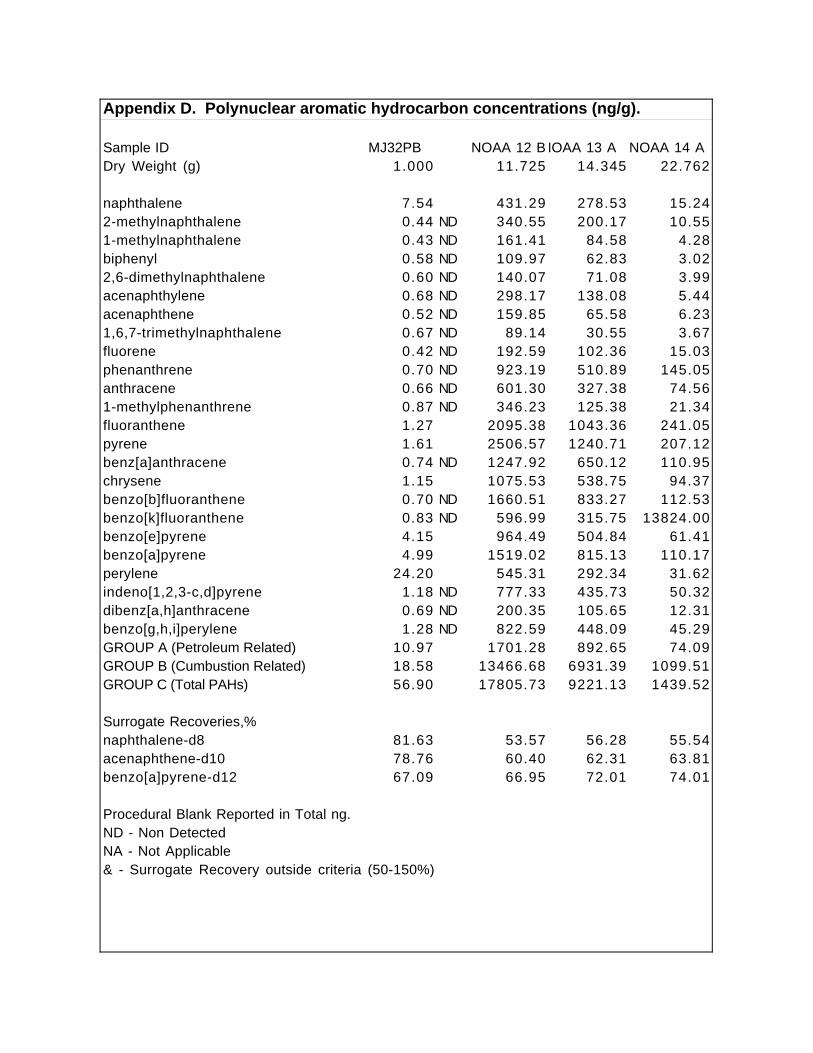
Appendix D. Polynuclear aromatic hydrocarbon concentrations (ng/g).
Sample ID MJ32PB NOAA 12 BNOAA 13 A NOAA 14 A Dry Weight (g) 1.000 11.725 14.345 22.762
naphthalene 7.54 431.29 278.53 15.242-methylnaphthalene 0.44 ND 340.55 200.17 10.551-methylnaphthalene 0.43 ND 161.41 84.58 4.28biphenyl 0.58 ND 109.97 62.83 3.022,6-dimethylnaphthalene 0.60 ND 140.07 71.08 3.99acenaphthylene 0.68 ND 298.17 138.08 5.44acenaphthene 0.52 ND 159.85 65.58 6.231,6,7-trimethylnaphthalene 0.67 ND 89.14 30.55 3.67fluorene 0.42 ND 192.59 102.36 15.03phenanthrene 0.70 ND 923.19 510.89 145.05anthracene 0.66 ND 601.30 327.38 74.561-methylphenanthrene 0.87 ND 346.23 125.38 21.34fluoranthene 1.27 2095.38 1043.36 241.05pyrene 1.61 2506.57 1240.71 207.12benz[a]anthracene 0.74 ND 1247.92 650.12 110.95chrysene 1.15 1075.53 538.75 94.37benzo[b]fluoranthene 0.70 ND 1660.51 833.27 112.53benzo[k]fluoranthene 0.83 ND 596.99 315.75 13824.00benzo[e]pyrene 4.15 964.49 504.84 61.41benzo[a]pyrene 4.99 1519.02 815.13 110.17perylene 24.20 545.31 292.34 31.62indeno[1,2,3-c,d]pyrene 1.18 ND 777.33 435.73 50.32dibenz[a,h]anthracene 0.69 ND 200.35 105.65 12.31benzo[g,h,i]perylene 1.28 ND 822.59 448.09 45.29GROUP A (Petroleum Related) 10.97 1701.28 892.65 74.09GROUP B (Cumbustion Related) 18.58 13466.68 6931.39 1099.51GROUP C (Total PAHs) 56.90 17805.73 9221.13 1439.52
Surrogate Recoveries,%naphthalene-d8 81.63 53.57 56.28 55.54acenaphthene-d10 78.76 60.40 62.31 63.81benzo[a]pyrene-d12 67.09 66.95 72.01 74.01
Procedural Blank Reported in Total ng.ND - Non DetectedNA - Not Applicable& - Surrogate Recovery outside criteria (50-150%)

Appendix D. Polynuclear aromatic hydrocarbon conc. (ng/g) contd.
Sample ID NOAA 16 ANOAA 16 BNOAA 18 A NOAA 22 C NOAA 23 ADry Weight (g) 22.651 21.094 17.219 15.591 11.373
naphthalene 379.98 163.29 109.57 168.12 185.22-methylnaphthalene 100.9 76.05 77.88 106.44 125.281-methylnaphthalene 58.49 36.68 35.4 48.21 51.08biphenyl 39.29 31.11 24.8 34.31 45.282,6-dimethylnaphthalene 33.14 30.09 38.83 43.37 50.76acenaphthylene 236.52 107.24 49.57 87.12 89.44acenaphthene 159.74 79.52 31.5 50.8 41.371,6,7-trimethylnaphthalene 21.47 21.45 23.83 27.19 19.7fluorene 215.09 78.73 65.52 85.05 75.07phenanthrene 1056 373.9 405.87 668.27 367.32anthracene 952.5 217.34 151.75 300.28 186.441-methylphenanthrene 134.64 93.42 86.13 96.8 82.16fluoranthene 2938.9 1384 998.9 1378.29 12547pyrene 2620.7 1230.5 913.2 1668.63 850.3benz[a]anthracene 1439.8 562.5 343.26 779.99 401.26chrysene 1281.9 438.02 312.08 634.44 -32767benzo[b]fluoranthene 1804.9 797 529.7 1056.52 691.8benzo[k]fluoranthene 737.8 272.65 214.54 352.22 274.37benzo[e]pyrene 927.1 430.98 312.41 761.98 410.94benzo[a]pyrene 1613.4 670.5 356.04 957.04 503.26perylene 419.15 199.25 137.41 273.49 242.61indeno[1,2,3-c,d]pyrene 783.4 22785 241.31 493.87 367.8dibenz[a,h]anthracene 192.86 85.96 61.51 141.85 81.41benzo[g,h,i]perylene 731.7 343.26 257.19 607.54 388.45GROUP A (Petroleum Related) 943.7 499.7 437.16 575.19 589.2GROUP B (Combustion Related) 15072 6560.4 4540.2 8832.4 5170.6GROUP C (Total PAHs) 18879 8068.4 5778.2 10821.8 6732.2
Surrogate Recoveries,%naphthalene-d8 62.15 59.02 54.65 56.06 63.55acenaphthene-d10 70.82 70.36 65.08 64.8 73.53benzo[a]pyrene-d12 85.95 79.48 72.6 73.23 83.25
Procedural Blank Reported in Total ng.ND - Non DetectedNA - Not Applicable& - Surrogate Recovery outside criteria (50-150%)

Appendix D. Polynuclear aromatic hydrocarbon conc. (ng/g) contd.
Sample ID NOAA 25 ANOAA 26 ANOAA 26 C NOAA 29 A NOAA 30 BNOAA 30 CDry Weight (g) 10.816 11.761 12.237 13.598 12.769 10.622
naphthalene 176.9 190.67 210.35 129.62 80.98 115.372-methylnaphthalene 122.57 135.98 140.32 84.88 59.3 86.061-methylnaphthalene 47.61 51.52 58.47 34.59 23.54 40.62biphenyl 42.16 47.05 50.2 27.72 21.54 28.352,6-dimethylnaphthalene 46.1 46.71 58.11 30.87 25.31 31.91acenaphthylene 77.96 76.46 109.96 67.94 54.62 52.41acenaphthene 27.39 32.62 51.25 32.51 16.61 24.641,6,7-trimethylnaphthalene 14.85 15.54 17.65 12.26 7.85 13.6fluorene 53.86 61.62 89.21 52.98 83.72 52.43phenanthrene 240.44 289.25 500.26 286.43 261.44 311.87anthracene 131.51 153.95 224.1 146.86 270.09 112.91-methylphenanthrene 50.59 74.84 79.83 60.35 41.94 63.34fluoranthene 503.65 591 816.9 569.6 475.22 620.7pyrene 563.3 673.2 874.56 572.6 497.2 665.8benz[a]anthracene 289.43 305.24 494.17 311.52 248.44 249.85chrysene 288.37 305.06 462.31 268.52 254.72 293.7benzo[b]fluoranthene 525.8 509.65 741.54 433.88 427.52 488.63benzo[k]fluoranthene 196.84 202.13 262.66 177.1 139.56 185.23benzo[e]pyrene 314.29 311.59 426.25 251.23 231.97 273.66benzo[a]pyrene 453.74 455.33 641.96 395.33 324.8 365.19perylene 176.95 203.9 -2048 133.01 122.78 135.83indeno[1,2,3-c,d]pyrene 285.27 284.99 389.94 220.79 211.23 248.81dibenz[a,h]anthracene 65.03 65.81 92.87 52.26 45.19 55.34benzo[g,h,i]perylene 301.62 299.11 31745 224.84 199.59 245.53GROUP A (Petroleum Related) 512.5 576.9 653.94 405.54 322.65 403.33GROUP B (Cumbustion Related) 3787.3 4003.2 5583.17 3477.6 3055.4 3692.5GROUP C (Total PAHs) 4996.2 5383.3 7420.87 4577.6 4125.1 4761.8
Surrogate Recoveries,%naphthalene-d8 60.24 54.52 61.37 64.65 60.95 67.25acenaphthene-d10 70.13 62.39 66.43 69.7 68.09 70.87benzo[a]pyrene-d12 76.22 74.57 72.39 82.52 75.8 82.69
Procedural Blank Reported in Total ng.ND - Non DetectedNA - Not Applicable& - Surrogate Recovery outside criteria (50-150%)

Appendix D. Polynuclear aromatic hydrocarbon conc. (ng/g) contd.
Sample ID NOAA 33 B NOAA 34 B NOAA 35 A NOAA 37 B NOAA 38 B Dry Weight (g) 12.687 17.520 20.614 23.377 22.906
naphthalene 217.03 60.53 45.63 0.68 1.352-methylnaphthalene 158.1 44.77 32.23 0.35 0.681-methylnaphthalene 60.43 17.99 13.41 0.23 0.34biphenyl 52.50 14.97 10.23 0.17 0.282,6-dimethylnaphthalene 57.62 17.46 12.36 0.60 ND 0.15acenaphthylene 87.69 22.44 21.48 0.68 ND 0.39acenaphthene 35.84 11.41 13.56 0.10 0.161,6,7-trimethylnaphthalene 16.93 5.22 4.41 0.67 ND 0.67 NDfluorene 70.81 21.02 19.9 0.11 0.21phenanthrene 321.21 91.44 109.12 0.39 1.18anthracene 174.52 48.64 50.91 0.15 0.71-methylphenanthrene 65.83 21.89 28.36 0.08 0.43fluoranthene 638.56 166.74 208.74 0.31 4.36pyrene 789.83 203.95 228.65 0.37 4.61benz[a]anthracene 319.59 86.14 114.29 0.29 3.18chrysene 312.51 82.31 100.22 0.22 2.43benzo[b]fluoranthene 605.17 160.36 169.54 0.23 3.69benzo[k]fluoranthene 220.27 59.8 64.83 0.11 1.5benzo[e]pyrene 356.71 98.35 114.1 0.3 1.97benzo[a]pyrene 492.8 126.25 163.55 0.2 3.48perylene 225.48 72.86 60.4 0.34 1.15indeno[1,2,3-c,d]pyrene 356.63 86.98 87.02 0.15 1.57dibenz[a,h]anthracene 78.75 19.48 21.75 0.69 ND 0.37benzo[g,h,i]perylene 354.65 88.31 95.43 0.45 2.23GROUP A (Petroleum Related) 646.74 188.89 156.3 2.73 3.83GROUP B (Cumbustion Related) 4525.45 1178.67 1274 3.32 29.39GROUP C (Total PAHs) 6069.42 1629.31 1696 7.89 37.08
Surrogate Recoveries,%naphthalene-d8 59.53 68.12 54.42 74.75 72.82acenaphthene-d10 64.37 110.01 63.67 74.11 71.91benzo[a]pyrene-d12 75.06 126.19 68.75 69.94 74.82
Procedural Blank Reported in Total ng.ND - Non DetectedNA - Not Applicable& - Surrogate Recovery outside criteria (50-150%)

Appendix D. Polynuclear aromatic hydrocarbon conc. (ng/g) contd.
Sample ID MJ38PB NOAA10A NOAA10BDry Weight (g) 1.000 19.252 17.473
naphthalene NA 5.32 423.11 2905.292-methylnaphthalene 2MN 2.63 290.93 915.931-methylnaphthalene 1MN 1.96 133.67 626.88biphenyl B 0.58 ND 84.53 624.162,6-dimethylnaphthalene DMN 0.60 ND 92.65 155.71acenaphthylene AC 2.96 151.72 636.88acenaphthene ACN 0.52 ND 71.45 1133.371,6,7-trimethylnaphthalene TMN 0.67 ND 33.79 65.39fluorene F 0.42 ND 101.29 652.70phenanthrene PH 5.02 510.36 3217.40anthracene AN 1.53 300.87 2212.951-methylphenanthrene 1MP 0.87 ND 128.61 474.94fluoranthene FL 17.40 961.03 5769.79pyrene PY 29.04 1259.06 6921.67benz[a]anthracene BAN 20.11 634.32 2707.69chrysene CY 19.04 526.07 2396.60benzo[b]fluoranthene BBF 33.21 754.40 3092.41benzo[k]fluoranthene BKF 14.37 270.43 1038.76benzo[e]pyrene BEP 16.86 451.74 2371.45benzo[a]pyrene BAP 8.85 723.53 -7153.00perylene PER 6.94 221.23 774.12indeno[1,2,3-c,d]pyrene IN 15.44 359.30 1946.91dibenz[a,h]anthracene DBA 3.12 92.50 340.75benzo[g,h,i]perylene BP 20.18 358.88 2537.97GROUP A (Petroleum Related) 12.47 1204.05 5796.82GROUP B (Cumbustion Related) 197.62 6391.25 33191.99GROUP C (Total PAHs) 227.64 8935.44 47587.69
Surrogate Recoveries,%naphthalene-d8 73.45 42.73 & 59.75acenaphthene-d10 70.49 47.12 & 66.30benzo[a]pyrene-d12 79.47 56.40 73.24

Appendix D. Polynuclear aromatic hydrocarbon conc. (ng/g) contd.
Sample ID NOAA11B NOAA12A NOAA17B NOAA17CDry Weight (g) 12.663 15.081 15.232 13.334
naphthalene 656.84 663.30 307.71 490.922-methylnaphthalene 639.73 600.15 192.68 383.341-methylnaphthalene 377.41 280.49 84.08 215.80biphenyl 112.25 166.59 66.13 90.282,6-dimethylnaphthalene 211.17 271.45 98.50 134.22acenaphthylene 548.87 249.30 154.63 792.14acenaphthene 347.93 266.19 114.73 221.221,6,7-trimethylnaphthalene 113.54 172.92 64.33 96.35fluorene 394.93 299.36 178.10 296.95phenanthrene 2745.66 1248.98 835.23 1933.53anthracene 1183.29 619.61 485.21 1370.221-methylphenanthrene 1045.45 354.83 187.26 837.29fluoranthene 4591.76 2013.27 2076.62 4356.75pyrene 5527.88 2274.18 1972.39 6415.16benz[a]anthracene 2876.35 1196.34 907.27 3748.46chrysene 2781.68 1017.97 840.20 3418.87benzo[b]fluoranthene 2989.70 1437.13 1298.59 3590.44benzo[k]fluoranthene 1079.38 529.40 486.02 1359.53benzo[e]pyrene 1803.85 22019.00 744.39 2283.47benzo[a]pyrene 3265.49 1303.08 1067.83 4770.75perylene 627.59 387.68 370.55 798.20indeno[1,2,3-c,d]pyrene 1433.34 711.49 616.57 1814.68dibenz[a,h]anthracene 360.74 191.58 146.72 468.83benzo[g,h,i]perylene 1416.88 717.40 605.13 -3322.00GROUP A (Petroleum Related) 3439.07 2642.49 1112.67 2454.87GROUP B (Cumbustion Related) 28127.04 12245.83 10761.72 34005.93GROUP C (Total PAHs) 37131.69 17826.66 13900.86 41666.38
Surrogate Recoveries,%naphthalene-d8 58.64 45.56 & 56.92 58.42acenaphthene-d10 65.72 45.56 & 61.27 62.59benzo[a]pyrene-d12 81.90 47.51 & 74.42 81.02

Appendix D. Polynuclear aromatic hydrocarbon conc. (ng/g) contd.
Sample ID NOAA18C NOAA1A NOAA24C NOAA2A NOAA30ADry Weight (g) 17.395 15.406 14.519 9.722 14.631
naphthalene 185.67 173.36 53.03 76.14 79.862-methylnaphthalene 133.01 49.54 31.11 46.52 57.561-methylnaphthalene 70.89 21.84 13.12 21.38 35.86biphenyl 48.18 17.61 11.04 18.53 25.762,6-dimethylnaphthalene 84.38 15.77 11.14 18.49 30.15acenaphthylene 77.92 57.67 40.64 69.15 65.83acenaphthene 104.03 26.34 10.54 19.29 32.591,6,7-trimethylnaphthalene 114.40 9.12 4.58 9.41 10.86fluorene 125.53 39.82 18.33 37.31 58.37phenanthrene 349.75 271.11 105.98 252.69 334.09anthracene 340.12 86.07 54.30 93.93 134.471-methylphenanthrene 126.10 53.54 30.53 85.01 82.79fluoranthene 1379.56 511.38 273.09 663.85 612.20pyrene 1443.84 519.95 300.08 631.73 658.95benz[a]anthracene 596.52 220.65 139.91 275.63 256.65chrysene 621.07 230.49 141.11 350.23 246.33benzo[b]fluoranthene 957.55 330.56 230.41 397.17 414.46benzo[k]fluoranthene 288.03 117.76 86.89 159.79 163.12benzo[e]pyrene 542.66 187.49 141.99 215.64 234.43benzo[a]pyrene 704.14 301.73 219.82 343.22 336.17perylene 220.61 137.12 67.35 163.01 113.77indeno[1,2,3-c,d]pyrene 452.89 176.67 131.75 196.66 206.96dibenz[a,h]anthracene 116.66 40.85 30.41 47.83 47.93benzo[g,h,i]perylene 545.74 168.82 136.33 181.34 250.90GROUP A (Petroleum Related) 839.97 362.99 161.85 294.26 355.44GROUP B (Cumbustion Related) 7648.65 2806.33 1831.79 3463.09 3428.10GROUP C (Total PAHs) 9629.22 3765.23 2283.48 4373.94 4490.04
Surrogate Recoveries,%naphthalene-d8 63.56 43.53 & 57.62 56.86 51.01acenaphthene-d10 64.60 47.39 & 64.02 63.60 57.72benzo[a]pyrene-d12 87.14 67.14 86.99 88.65 81.27
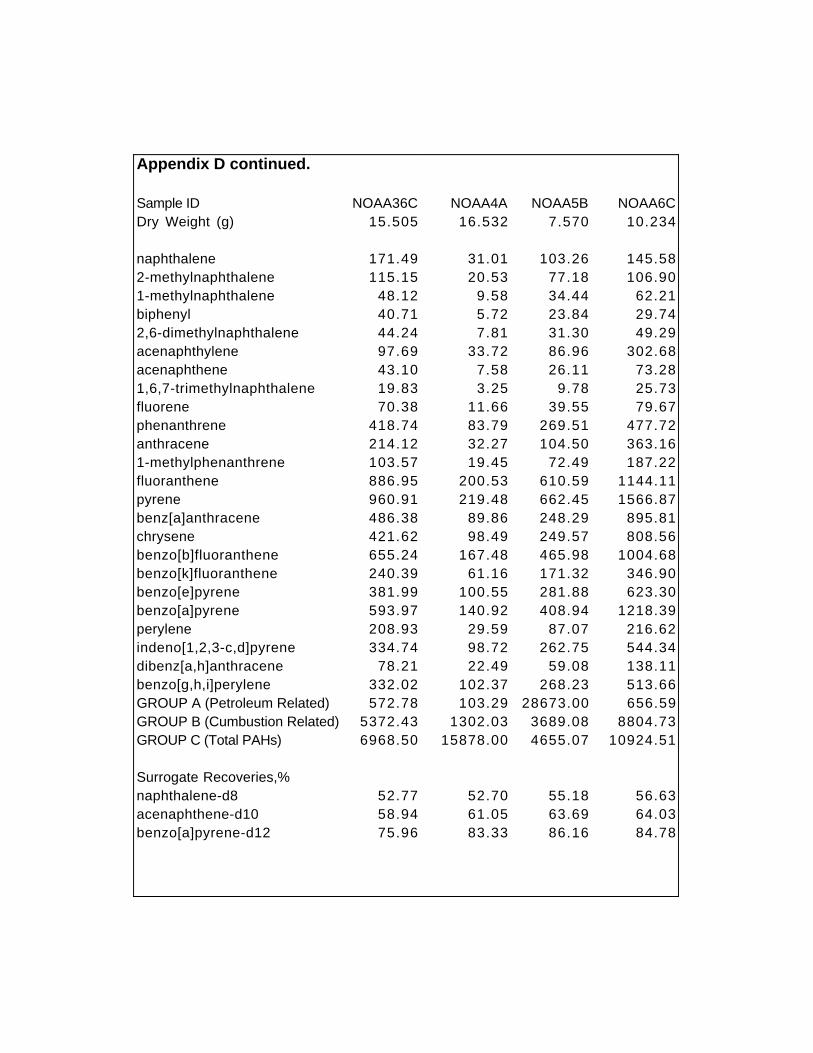
Appendix D continued.
Sample ID NOAA36C NOAA4A NOAA5B NOAA6CDry Weight (g) 15.505 16.532 7.570 10.234
naphthalene 171.49 31.01 103.26 145.582-methylnaphthalene 115.15 20.53 77.18 106.901-methylnaphthalene 48.12 9.58 34.44 62.21biphenyl 40.71 5.72 23.84 29.742,6-dimethylnaphthalene 44.24 7.81 31.30 49.29acenaphthylene 97.69 33.72 86.96 302.68acenaphthene 43.10 7.58 26.11 73.281,6,7-trimethylnaphthalene 19.83 3.25 9.78 25.73fluorene 70.38 11.66 39.55 79.67phenanthrene 418.74 83.79 269.51 477.72anthracene 214.12 32.27 104.50 363.161-methylphenanthrene 103.57 19.45 72.49 187.22fluoranthene 886.95 200.53 610.59 1144.11pyrene 960.91 219.48 662.45 1566.87benz[a]anthracene 486.38 89.86 248.29 895.81chrysene 421.62 98.49 249.57 808.56benzo[b]fluoranthene 655.24 167.48 465.98 1004.68benzo[k]fluoranthene 240.39 61.16 171.32 346.90benzo[e]pyrene 381.99 100.55 281.88 623.30benzo[a]pyrene 593.97 140.92 408.94 1218.39perylene 208.93 29.59 87.07 216.62indeno[1,2,3-c,d]pyrene 334.74 98.72 262.75 544.34dibenz[a,h]anthracene 78.21 22.49 59.08 138.11benzo[g,h,i]perylene 332.02 102.37 268.23 513.66GROUP A (Petroleum Related) 572.78 103.29 28673.00 656.59GROUP B (Cumbustion Related) 5372.43 1302.03 3689.08 8804.73GROUP C (Total PAHs) 6968.50 15878.00 4655.07 10924.51
Surrogate Recoveries,%naphthalene-d8 52.77 52.70 55.18 56.63acenaphthene-d10 58.94 61.05 63.69 64.03benzo[a]pyrene-d12 75.96 83.33 86.16 84.78

Appendix D continued.
Sample ID NOAA7B NOAA7C NOAA8C NOAA9BDry Weight (g) 20.641 21.164 17.383 14.912
naphthalene 1350.21 186.74 1047.53 17414.182-methylnaphthalene 995.26 117.62 1003.15 15556.601-methylnaphthalene 613.09 49.85 468.48 48783.50biphenyl 250.57 38.07 207.46 9095.852,6-dimethylnaphthalene 370.06 60.18 319.73 27888.59acenaphthylene 2984.66 70.11 777.71 12915.13acenaphthene 609.08 56.51 439.36 56337.881,6,7-trimethylnaphthalene 260.17 41.64 188.90 6806.37fluorene 1043.15 96.74 499.93 54208.65phenanthrene 6430.44 478.57 2395.37 194342.88anthracene 4338.97 298.71 1551.70 89365.951-methylphenanthrene 2088.39 111.47 1201.39 39129.60fluoranthene 13079.92 1097.29 5457.95 108236.19pyrene 16052.43 1105.77 6452.17 143131.57benz[a]anthracene 8452.82 472.66 3647.63 59298.22chrysene 6577.55 535.97 3519.73 60330.78benzo[b]fluoranthene 7997.26 767.93 3758.01 39168.09benzo[k]fluoranthene 3087.22 297.47 1481.92 15749.82benzo[e]pyrene 4898.81 449.45 2282.92 22676.21benzo[a]pyrene 9368.31 623.09 4336.47 54861.52perylene 1894.46 233.39 799.80 8606.85indeno[1,2,3-c,d]pyrene 4064.36 391.29 1838.73 18024.98dibenz[a,h]anthracene 955.37 94.64 466.93 4533.87benzo[g,h,i]perylene 3904.74 396.18 1783.38 16891.42GROUP A (Petroleum Related) 6720.32 664.23 4729.12 209787.50GROUP B (Cumbustion Related) 78438.78 6231.73 35025.84 542902.67GROUP C (Total PAHs) 101667.28 8071.32 45926.35 1123354.70
Surrogate Recoveries,%naphthalene-d8 40.26 & 53.49 46.89 & 32.69acenaphthene-d10 48.29 & 57.25 52.49 33.31benzo[a]pyrene-d12 78.86 72.57 64.35 30.57
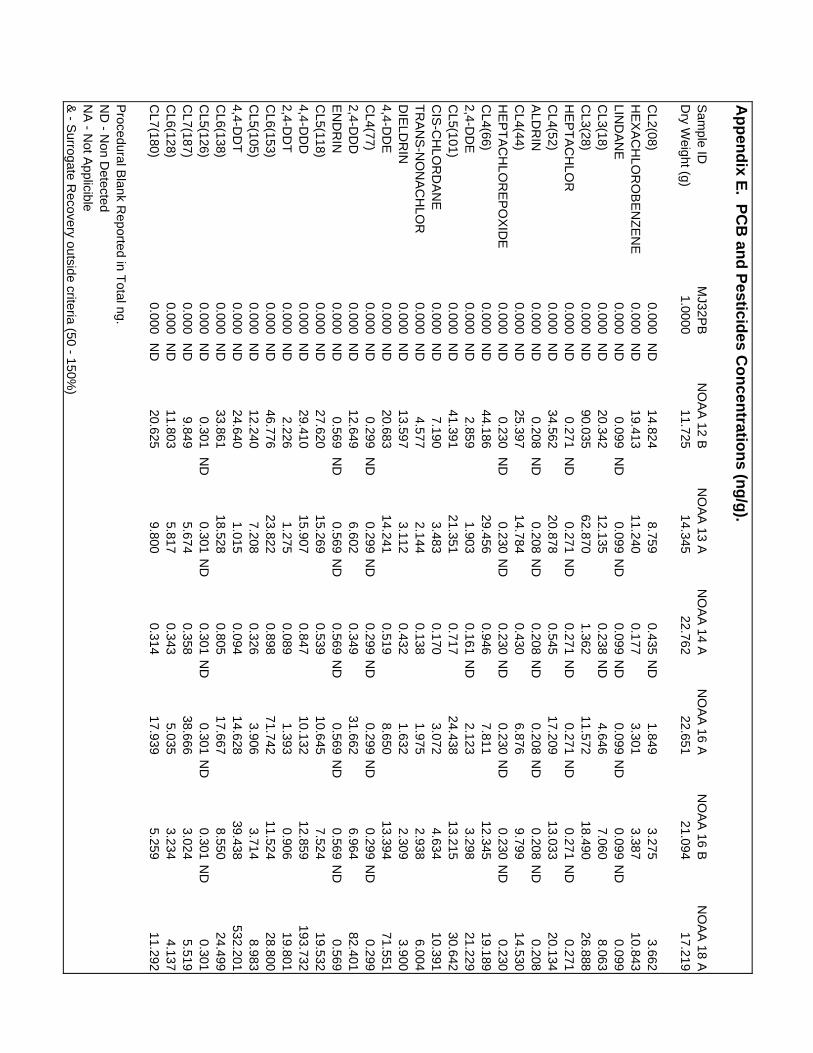
Ap
pen
dix E
. PC
B an
d P
esticides C
on
centratio
ns (n
g/g
).
Sam
ple ID M
J32PB
NO
AA
12 BN
OA
A 13 A
NO
AA
14 AN
OA
A 16 A
NO
AA
16 BN
OA
A 18 A
Dry W
eight (g)1.0000
11.72514.345
22.76222.651
21.09417.219
CL2(08)
0.000 N
D14.824
8.7590.435
ND
1.8493.275
3.662H
EX
AC
HLO
RO
BE
NZ
EN
E0.000
ND
19.41311.240
0.1773.301
3.38710.843
LIND
AN
E0.000
ND
0.099 N
D0.099
ND
0.099N
D0.099
ND
0.099N
D0.099
CL3(18)
0.000 N
D20.342
12.1350.238
ND
4.6467.060
8.063C
L3(28)0.000
ND
90.03562.870
1.36211.572
18.49026.888
HE
PT
AC
HLO
R0.000
ND
0.271 N
D0.271
ND
0.271N
D0.271
ND
0.271N
D0.271
CL4(52)
0.000 N
D34.562
20.8780.545
17.20913.033
20.134A
LDR
IN0.000
ND
0.208 N
D0.208
ND
0.208N
D0.208
ND
0.208N
D0.208
CL4(44)
0.000 N
D25.397
14.7840.430
6.8769.799
14.530H
EP
TA
CH
LOR
EP
OX
IDE
0.000 N
D0.230
ND
0.230N
D0.230
ND
0.230N
D0.230
ND
0.230C
L4(66)0.000
ND
44.18629.456
0.9467.811
12.34519.189
2,4-DD
E0.000
ND
2.8591.903
0.161N
D2.123
3.29821.229
CL5(101)
0.000 N
D41.391
21.3510.717
24.43813.215
30.642C
IS-C
HLO
RD
AN
E0.000
ND
7.1903.483
0.1703.072
4.63410.391
TR
AN
S-N
ON
AC
HLO
R0.000
ND
4.5772.144
0.1381.975
2.9386.004
DIE
LDR
IN0.000
ND
13.5973.112
0.4321.632
2.3093.900
4,4-DD
E0.000
ND
20.68314.241
0.5198.650
13.39471.551
CL4(77)
0.000 N
D0.299
ND
0.299N
D0.299
ND
0.299N
D0.299
ND
0.2992,4-D
DD
0.000 N
D12.649
6.6020.349
31.6626.964
82.401E
ND
RIN
0.000 N
D0.569
ND
0.569N
D0.569
ND
0.569N
D0.569
ND
0.569C
L5(118)0.000
ND
27.62015.269
0.53910.645
7.52419.532
4,4-DD
D0.000
ND
29.41015.907
0.84710.132
12.859193.732
2,4-DD
T0.000
ND
2.2261.275
0.0891.393
0.90619.801
CL6(153)
0.000 N
D46.776
23.8220.898
71.74211.524
28.800C
L5(105)0.000
ND
12.2407.208
0.3263.906
3.7148.983
4,4-DD
T0.000
ND
24.6401.015
0.09414.628
39.438532.201
CL6(138)
0.000 N
D33.861
18.5280.805
17.6678.550
24.499C
L5(126)0.000
ND
0.301 N
D0.301
ND
0.301N
D0.301
ND
0.301N
D0.301
CL7(187)
0.000 N
D9.849
5.6740.358
38.6663.024
5.519C
L6(128)0.000
ND
11.8035.817
0.3435.035
3.2344.137
CL7(180)
0.000 N
D20.625
9.8000.314
17.9395.259
11.292
Procedural B
lank Reported in T
otal ng.N
D - N
on Detected
NA
- Not A
pplicible&
- Surrogate R
ecovery outside criteria (50 - 150%)

Ap
pen
dix E
. PC
B an
d P
esticides C
on
centratio
ns (n
g/g
) con
td.
Sam
ple IDN
OA
A 22 C
NO
AA
23 AN
OA
A 25 A
NO
AA
26 AN
OA
A 26 C
NO
AA
29 AN
OA
A 30 B
Dry W
eight (g)15.591
11.37310.816
11.76112.237
13.59812.769
CL2(08)
5.7777.616
9.3779.924
9.5906.469
4.969H
EX
AC
HLO
RO
BE
NZ
EN
E20.221
16.3347.020
9.2887.672
8.7176.414
LIND
AN
E N
D0.099
ND
0.099 N
D0.099
ND
0.099N
D0.099
ND
0.099N
D0.099
CL3(18)
14.1309.286
8.18610.151
8.4455.464
4.936C
L3(28)41.283
42.47438.133
47.53961.186
22.66417.662
HE
PT
AC
HLO
R N
D0.271
ND
0.271 N
D0.271
ND
0.271N
D0.271
ND
0.271N
D0.271
CL4(52)
41.07620.780
13.58715.432
17.3467.849
7.049A
LDR
IN N
D0.208
ND
0.208 N
D0.208
ND
0.208N
D0.208
ND
0.208N
D0.208
CL4(44)
27.61314.471
10.20611.689
11.1315.712
6.845H
EP
TA
CH
LOR
EP
OX
IDE
ND
0.230 N
D0.230
ND
0.230N
D0.230
ND
0.230N
D0.230
ND
0.230C
L4(66)35.618
29.31823.450
25.82632.266
13.96714.088
2,4-DD
E26.064
7.6923.014
2.0662.345
1.3351.409
CL5(101)
56.94425.097
17.39518.464
19.81010.931
10.395C
IS-C
HLO
RD
AN
E5.236
7.0304.421
3.5324.280
2.1022.813
TR
AN
S-N
ON
AC
HLO
R2.698
5.3953.266
2.6333.058
1.6541.865
DIE
LDR
IN4.687
8.7716.658
4.4586.400
3.2153.719
4,4-DD
E94.695
33.99512.889
12.02514.441
7.3938.077
CL4(77)
ND
0.299 N
D0.299
ND
0.299N
D0.299
ND
0.299N
D0.299
ND
0.2992,4-D
DD
31.79827.178
7.8136.869
8.1805.172
5.201E
ND
RIN
ND
0.569 N
D0.569
ND
0.569N
D0.569
ND
0.569N
D0.569
ND
0.569C
L5(118)36.829
18.02012.720
13.35515.677
8.5509.159
4,4-DD
D127.740
83.66318.953
14.93519.751
14.50912.304
2,4-DD
T2.275
2.8461.270
1.1871.806
1.9190.822
CL6(153)
45.15327.465
15.79617.142
19.68510.492
10.057C
L5(105)13.315
6.8426.278
6.8918.114
4.1794.314
4,4-DD
T75.579
14.5551.499
1.3851.054
82.2310.706
CL6(138)
39.70618.603
11.86013.795
16.0757.811
7.845C
L5(126) N
D0.301
ND
0.301 N
D0.301
ND
0.301N
D0.301
ND
0.301N
D0.301
CL7(187)
6.3705.978
4.3264.694
5.0193.011
3.513C
L6(128)7.443
4.4363.756
4.0774.447
3.2163.270
CL7(180)
12.57810.857
5.1466.241
7.3103.506
3.452
Procedural B
lank Reported in T
otal ng.N
D - N
on Detected
NA
- Not A
pplicible&
- Surrogate R
ecovery outside criteria (50 - 150%)

Ap
pen
dix E
. PC
B an
d P
esticides C
on
centratio
ns (n
g/g
) con
td.
Sam
ple IDN
OA
A 30 C
NO
AA
33 BN
OA
A 34 B
NO
AA
35 AN
OA
A 37 B
NO
AA
38 B M
J36SS
RM
Dry W
eight (g)10.622
12.68717.520
20.61423.377
22.9067.026
CL2(08)
6.4937.346
4.6002.178
0.435N
D0.435
ND
0.435 N
DH
EX
AC
HLO
RO
BE
NZ
EN
E4.531
8.3840.748
3.1630.140
ND
0.140N
D29.878
LIND
AN
E N
D0.099
ND
0.099 N
D0.099
ND
0.099N
D0.099
ND
0.099N
D0.648
CL3(18)
4.4857.959
3.2811.988
0.238N
D0.238
ND
7.626C
L3(28)18.331
43.17418.487
8.1270.117
ND
0.117N
D15.539
HE
PT
AC
HLO
R N
D0.271
ND
0.271 N
D0.271
ND
0.271N
D0.271
ND
0.271N
D0.271
ND
CL4(52)
8.20613.776
5.2533.736
0.129N
D0.129
ND
17.032A
LDR
IN N
D0.208
ND
0.208 N
D0.208
ND
0.208N
D0.208
ND
0.208N
D0.208
ND
CL4(44)
7.0699.864
3.5332.715
0.336N
D0.336
ND
12.496H
EP
TA
CH
LOR
EP
OX
IDE
ND
0.230 N
D0.230
ND
0.230N
D0.230
ND
0.230N
D0.230
ND
3.370C
L4(66)15.683
28.1709.974
6.7840.217
ND
0.217N
D15.782
2,4-DD
E1.041
3.7000.398
0.7420.161
ND
0.161N
D2.167
CL5(101)
13.01919.452
5.9384.771
0.244N
D0.244
ND
32.844C
IS-C
HLO
RD
AN
E3.140
4.0741.205
0.9130.195
ND
0.195N
D2.612
TR
AN
S-N
ON
AC
HLO
R2.152
2.7540.918
0.6430.209
ND
0.209N
D1.108
DIE
LDR
IN6.335
5.6284.264
0.4680.200
ND
0.200N
D3.432
4,4-DD
E10.068
17.1515.278
3.4730.127
ND
0.127N
D9.779
CL4(77)
ND
0.299 N
D0.299
ND
0.299N
D0.299
ND
0.299N
D0.299
ND
0.299 N
D2,4-D
DD
6.31210.770
3.2302.161
0.247N
D0.247
ND
5.474E
ND
RIN
ND
0.569 N
D0.569
ND
0.569N
D0.569
ND
0.569N
D0.569
ND
0.569 N
DC
L5(118)12.216
20.3105.988
4.0440.223
ND
0.223N
D15.131
4,4-DD
D15.959
25.7197.778
4.0250.292
ND
0.292N
D7.481
2,4-DD
T1.216
1.5570.692
5.7370.183
ND
0.183N
D1.833
CL6(153)
13.34824.559
7.1754.841
0.409N
D0.409
ND
31.798C
L5(105)5.632
10.0183.177
2.0650.298
ND
0.298N
D10.075
4,4-DD
T1.543
4.6591.436
0.3210.312
ND
0.312N
D3.200
CL6(138)
10.73118.825
6.3184.024
0.227N
D0.227
ND
23.227C
L5(126) N
D0.301
ND
0.301 N
D0.301
ND
0.301N
D0.301
ND
0.301N
D0.301
ND
CL7(187)
3.4736.261
1.9241.382
0.292N
D0.292
ND
14.187C
L6(128)3.506
5.3231.800
1.4900.172
ND
0.172N
D6.628
CL7(180)
4.5086.311
2.3871.289
0.243N
D0.243
ND
18.072
Procedural B
lank Reported in T
otal ng.N
D - N
on Detected
NA
- Not A
pplicible&
- Surrogate R
ecovery outside criteria (50 - 150%)

Ap
pen
dix E
. PC
B an
d P
esticides C
on
centratio
ns (n
g/g
) con
td.
Sam
ple ID M
J32PB
NO
AA
12 BN
OA
A 13 A
NO
AA
14 AN
OA
A 16 A
NO
AA
16 BN
OA
A 18 A
Dry W
eight (g)1.0000
11.72514.345
22.76222.651
21.09417.219
MIR
EX
0.000 N
D0.247
ND
0.247N
D0.247
ND
0.247N
D0.247
ND
0.247C
L7(170)0.000
ND
9.9665.463
0.334N
D7.434
3.2146.976
CL8(195)
0.000 N
D2.974
1.8190.303
ND
2.9940.645
1.528C
L9(206)0.000
ND
5.0832.855
0.480N
D2.422
1.0011.465
CL10(209)
0.000 N
D4.703
3.2810.314
ND
0.7271.685
1.363G
RO
UP
D (IN
DE
NO
PE
ST
)0.000
12.2686.128
0.8095.548
8.07316.896
SU
M O
F D
DT
0.00092.467
40.9432.059
68.58876.859
920.915T
OT
AL P
CB
0.000456.237
269.7699.687
253.578126.591
237.202G
RO
UP
D (N
O M
DL)
0.00011.767
5.6270.308
5.0477.572
16.395S
UM
OF
DD
T (N
O M
DL)
0.00092.467
40.9431.898
68.58876.859
920.915
TO
TA
L PC
B (N
O M
DL)
0.000456.237
269.7697.583
253.578126.591
237.202T
otal non-DD
T pest.
46.401021.6030
2.541011.6040
14.892032.7620
Surrogate R
ecoveries,%D
BO
FB
84.36354.120
43.148&
67.42862.471
56.11046.974
CL5(112)
76.52063.244
64.62069.398
79.27777.846
75.258
Procedural B
lank Reported in T
otal ng.N
D - N
on Detected
NA
- Not A
pplicible&
- Surrogate R
ecovery outside criteria (50 - 150%)
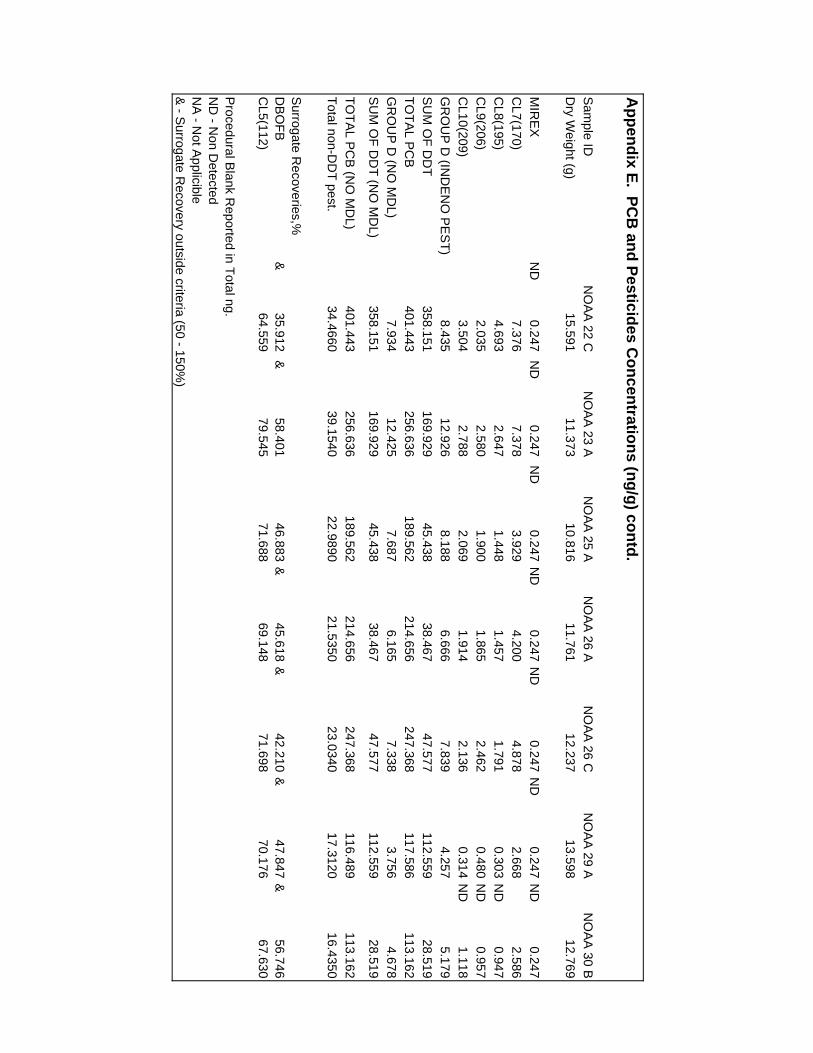
Ap
pen
dix E
. PC
B an
d P
esticides C
on
centratio
ns (n
g/g
) con
td.
Sam
ple IDN
OA
A 22 C
NO
AA
23 AN
OA
A 25 A
NO
AA
26 AN
OA
A 26 C
NO
AA
29 AN
OA
A 30 B
Dry W
eight (g)15.591
11.37310.816
11.76112.237
13.59812.769
MIR
EX
ND
0.247 N
D0.247
ND
0.247N
D0.247
ND
0.247N
D0.247
ND
0.247C
L7(170)7.376
7.3783.929
4.2004.878
2.6682.586
CL8(195)
4.6932.647
1.4481.457
1.7910.303
ND
0.947C
L9(206)2.035
2.5801.900
1.8652.462
0.480N
D0.957
CL10(209)
3.5042.788
2.0691.914
2.1360.314
ND
1.118G
RO
UP
D (IN
DE
NO
PE
ST
)8.435
12.9268.188
6.6667.839
4.2575.179
SU
M O
F D
DT
358.151169.929
45.43838.467
47.577112.559
28.519T
OT
AL P
CB
401.443256.636
189.562214.656
247.368117.586
113.162G
RO
UP
D (N
O M
DL)
7.93412.425
7.6876.165
7.3383.756
4.678S
UM
OF
DD
T (N
O M
DL)
358.151169.929
45.43838.467
47.577112.559
28.519
TO
TA
L PC
B (N
O M
DL)
401.443256.636
189.562214.656
247.368116.489
113.162T
otal non-DD
T pest.
34.466039.1540
22.989021.5350
23.034017.3120
16.4350
Surrogate R
ecoveries,%D
BO
FB
&35.912
&58.401
46.883&
45.618&
42.210&
47.847&
56.746C
L5(112)64.559
79.54571.688
69.14871.698
70.17667.630
Procedural B
lank Reported in T
otal ng.N
D - N
on Detected
NA
- Not A
pplicible&
- Surrogate R
ecovery outside criteria (50 - 150%)

Ap
pen
dix E
. PC
B an
d P
esticides C
on
centratio
ns (n
g/g
) con
td.
Sam
ple IDN
OA
A 30 C
NO
AA
33 BN
OA
A 34 B
NO
AA
35 AN
OA
A 37 B
NO
AA
38 B M
J36SS
RM
Dry W
eight (g)10.622
12.68717.520
20.61423.377
22.9067.026
MIR
EX
ND
0.247 N
D0.247
ND
0.247N
D0.247
ND
0.247N
D0.247
ND
0.247 N
DC
L7(170)3.798
5.9601.831
1.4630.334
ND
0.334N
D8.681
CL8(195)
1.2562.793
0.4550.457
0.303N
D0.303
ND
3.229C
L9(206)1.296
3.2200.837
0.5430.480
ND
0.480N
D9.315
CL10(209)
1.5715.223
1.0181.528
0.314N
D0.314
ND
9.770G
RO
UP
D (IN
DE
NO
PE
ST
)5.793
7.3292.624
2.0570.905
0.9057.361
SU
M O
F D
DT
36.13963.556
18.81216.459
1.3221.322
29.934T
OT
AL P
CB
134.621238.544
83.97653.425
5.0115.011
251.867G
RO
UP
D (N
O M
DL)
5.2926.828
2.1231.556
0.0000.000
7.090S
UM
OF
DD
T (N
O M
DL)
36.13963.556
18.81216.459
0.0000.000
29.934
TO
TA
L PC
B (N
O M
DL)
134.621238.544
83.97653.425
0.0000.000
251.432T
otal non-DD
T pest.
17.782022.4640
8.75906.8110
2.36802.3680
42.3430
Surrogate R
ecoveries,%D
BO
FB
68.18548.625
&34.919
&58.866
79.92985.344
56.893C
L5(112)76.368
73.47871.631
61.16672.013
73.25060.520
Procedural B
lank Reported in T
otal ng.N
D - N
on Detected
NA
- Not A
pplicible&
- Surrogate R
ecovery outside criteria (50 - 150%)

Ap
pen
dix E
. PC
B an
d P
esticides C
on
centratio
ns (n
g/g
) con
td.
Sam
ple ID M
P31P
B N
OA
A1A
-R N
OA
A2A
NO
AA
4A-R
NO
AA
5B-R
NO
AA
6C-R
NO
AA
7B-R
Dry W
eight (g)1.0000
5.2279.722
5.1832.450
3.9517.932
CL2(08)
0.000N
D32.188
14.63538.479
0.435N
D28.348
0.435H
EX
AC
HLO
RO
BE
NZ
EN
E0.000
ND
1.4500.457
3.0790.140
ND
0.140N
D0.140
LIND
AN
E0.000
ND
0.099N
D0.099
ND
0.099N
D0.099
ND
0.099N
D0.099
CL3(18)
0.000N
D41.633
17.8958.220
12.7436.849
7.537C
L3(28)0.000
ND
179.93854.088
7.64911.632
17.79116.642
HE
PT
AC
HLO
R0.000
ND
0.271N
D0.271
ND
0.271N
D0.271
ND
0.271N
D0.271
CL4(52)
0.000N
D55.416
25.6154.872
5.36311.394
11.129A
LDR
IN0.000
ND
0.208N
D5.886
0.208N
D0.208
ND
0.208N
D0.208
CL4(44)
0.000N
D34.104
16.1521.726
0.336N
D7.008
4.620H
EP
TA
CH
LOR
EP
OX
IDE
0.000N
D0.230
ND
0.230N
D0.230
ND
0.230N
D0.230
ND
0.230C
L4(66)0.000
ND
65.69625.602
7.5819.950
24.60513.047
2,4-DD
E0.000
ND
14.2196.961
4.6423.378
6.8145.065
CL5(101)
0.000N
D33.072
16.5798.292
10.42321.771
14.001C
IS-C
HLO
RD
AN
E0.000
ND
2.3181.619
1.9974.879
5.3075.126
TR
AN
S-N
ON
AC
HLO
R0.000
ND
2.6420.945
2.4243.520
3.8934.369
DIE
LDR
IN0.000
ND
1.9220.966
0.8370.200
ND
0.200N
D0.200
4,4-DD
E0.000
ND
8.8734.358
3.4768.069
10.1486.811
CL4(77)
0.000N
D8.873
0.299N
D0.299
ND
0.299N
D0.299
ND
0.2992,4-D
DD
0.000N
D3.126
2.1011.631
0.247N
D0.247
ND
0.247E
ND
RIN
0.000N
D0.569
ND
0.569N
D0.569
ND
0.569N
D0.569
ND
0.569C
L5(118)0.000
ND
22.2399.902
5.16010.443
16.68413.032
4,4-DD
D0.000
ND
12.9335.516
4.71310.510
15.42020.754
2,4-DD
T0.000
ND
1.8580.614
0.183N
D0.183
ND
0.183N
D0.183
CL6(153)
0.000N
D17.186
8.6865.563
11.23219.080
9.737C
L5(105)0.000
ND
19.9089.432
4.9039.974
18.1688.294
4,4-DD
T0.000
ND
3.4684.275
1.3200.312
ND
3.7935.304
CL6(138)
0.000N
D20.087
10.6286.672
15.12923.566
10.289C
L5(126)0.000
ND
0.301N
D0.301
ND
0.301N
D0.301
ND
0.301N
D0.301
CL7(187)
0.000N
D7.673
3.5492.669
5.8429.757
7.145C
L6(128)0.000
ND
3.9601.868
1.2250.172
ND
3.5110.172
Procedural B
lank Reported in T
otal ng.N
D - N
on Detected
NA
- Not A
pplicible&
- Surrogate R
ecovery outside criteria (50 - 150%)
S
urrogate Recoveries,%

Ap
pen
dix E
. PC
B an
d P
esticides C
on
centratio
ns (n
g/g
) con
td.
Sam
ple ID N
OA
A7C
-R N
OA
A8C
-R N
OA
A9B
-R N
OA
A10A
NO
AA
10B-R
NO
AA
11B-R
NO
AA
12A-R
Dry W
eight (g)7.321
6.3585.021
19.2526.048
4.3026.078
CL2(08)
ND
5.50311.152
0.435N
D7.371
0.435N
D34.521
63.050H
EX
AC
HLO
RO
BE
NZ
EN
E N
D0.140
ND
0.140N
D0.140
ND
0.9310.140
ND
1.4646.668
LIND
AN
E N
D0.099
ND
1.2340.099
ND
0.099N
D0.099
ND
0.099N
D0.099
CL3(18)
2.9935.039
20.2078.182
0.238N
D30.345
161.625C
L3(28)6.704
10.00756.246
25.4597.543
84.207424.806
HE
PT
AC
HLO
R N
D0.271
ND
0.271N
D0.271
ND
0.271N
D0.271
ND
0.271N
D0.271
CL4(52)
4.0638.472
0.129N
D12.878
1.71538.060
248.261A
LDR
IN N
D0.208
ND
0.208N
D0.208
ND
6.8630.208
ND
0.208N
D0.208
CL4(44)
2.6783.485
0.336N
D8.530
1.44725.317
184.699H
EP
TA
CH
LOR
EP
OX
IDE
ND
0.230N
D0.230
ND
0.230N
D0.230
ND
0.230N
D0.230
ND
5.676C
L4(66)5.016
6.9268.712
14.5012.466
48.70347.040
2,4-DD
E1.975
3.7910.161
ND
4.1732.433
13.28068.428
CL5(101)
5.20012.723
0.244N
D12.553
1.65437.020
207.478C
IS-C
HLO
RD
AN
E1.398
1.0480.195
ND
3.8381.654
9.12213.501
TR
AN
S-N
ON
AC
HLO
R1.362
1.8000.209
ND
2.7131.731
7.97613.022
DIE
LDR
IN N
D0.784
0.200N
D0.200
ND
0.9120.200
ND
0.200N
D10.628
4,4-DD
E4.942
2.24430.730
6.6131.088
23.21186.299
CL4(77)
ND
0.299N
D0.299
ND
0.299N
D0.299
ND
0.299N
D0.299
ND
0.2992,4-D
DD
ND
0.247N
D0.247
ND
0.247N
D3.447
0.247N
D0.247
ND
26.527E
ND
RIN
ND
0.569N
D0.569
ND
0.569N
D0.569
ND
0.569N
D0.569
ND
0.569C
L5(118)12.875
8.7620.223
ND
9.1552.913
42.830123.937
4,4-DD
D7.318
4.6970.292
ND
10.3421.787
32.990120.159
2,4-DD
T N
D0.183
ND
0.183N
D0.183
ND
0.8510.183
ND
0.183N
D0.183
CL6(153)
7.86112.400
13.4179.438
2.12730.157
94.135C
L5(105)6.411
11.1410.298
ND
8.9701.532
28.910114.207
4,4-DD
T3.037
3.80843.322
1.9700.312
ND
11.01713.111
CL6(138)
8.66612.628
16.18910.921
1.02237.341
125.443C
L5(126) N
D0.301
ND
0.301N
D0.301
ND
0.301N
D0.301
ND
0.301N
D0.301
CL7(187)
4.25810.305
15.2363.947
3.58617.028
28.585C
L6(128) N
D1.229
3.0370.172
ND
1.9540.172
ND
5.80815.921
Procedural B
lank Reported in T
otal ng.N
D - N
on Detected
NA
- Not A
pplicible&
- Surrogate R
ecovery outside criteria (50 - 150%)
Surrogate R
ecoveries,%

Ap
pen
dix E
. PC
B an
d P
esticides C
on
centratio
ns (n
g/g
) con
td.
Sam
ple IDN
OA
A17B
-RN
OA
A17C
-RN
OA
A18C
-R N
OA
A24C
-R N
OA
A30A
-R N
OA
A36C
-R M
P35S
SR
MD
ry Weight (g)
4.9874.915
6.0055.988
5.3636.911
7.050
CL2(08)
24.67425.476
26.63315.867
0.435N
D16.653
0.435 N
DH
EX
AC
HLO
RO
BE
NZ
EN
E5.863
5.5538.430
0.6366.723
0.71138.621
LIND
AN
E N
D0.099
ND
0.099N
D0.099
ND
0.099N
D0.099
ND
0.099N
D10.346
CL3(18)
32.24030.629
61.41111.360
21.92410.127
6.465C
L3(28)87.922
90.871136.844
42.44533.266
43.26115.789
HE
PT
AC
HLO
R N
D0.271
ND
0.271N
D0.271
ND
0.271N
D0.271
ND
0.271N
D0.271
ND
CL4(52)
52.38052.877
132.40321.760
14.15515.600
14.882A
LDR
IN N
D0.208
ND
0.208N
D13.164
7.0300.208
ND
6.1940.208
ND
CL4(44)
38.47738.420
84.73314.322
7.22510.601
7.897H
EP
TA
CH
LOR
EP
OX
IDE
0.230N
D0.230
ND
0.230N
D0.230
ND
0.230N
D0.230
ND
0.230 N
DC
L4(66)58.795
54.37496.418
29.02626.281
21.36614.082
2,4-DD
E58.819
51.28861.652
12.9198.959
6.7556.535
CL5(101)
49.96850.428
92.09722.862
14.97515.527
19.092C
IS-C
HLO
RD
AN
E15.186
15.82918.965
6.2353.598
2.8280.195
ND
TR
AN
S-N
ON
AC
HLO
R12.356
12.88614.792
5.0783.171
2.4410.209
ND
DIE
LDR
IN0.200
ND
6.8846.480
3.0991.617
1.8792.260
4,4-DD
E181.917
142.493115.370
27.3378.327
14.8578.730
CL4(77)
ND
0.299N
D0.299
ND
0.299N
D0.299
ND
0.299N
D0.299
ND
0.299 N
D2,4-D
DD
128.953145.881
64.65117.814
4.8078.015
0.247 N
DE
ND
RIN
ND
0.569N
D0.569
ND
0.569N
D0.569
ND
0.569N
D0.569
ND
0.569 N
DC
L5(118)40.129
26.10235.831
21.86410.777
18.34321.036
4,4-DD
D380.209
461.650199.220
40.66713.197
17.43210.274
2,4-DD
T N
D131.344
33.31457.902
10.1414.779
2.4460.183
ND
CL6(153)
40.44039.406
39.29323.568
10.69219.588
23.962C
L5(105)37.800
37.88735.145
22.69110.855
14.83621.470
4,4-DD
T1614.974
357.773128.417
2.4103.892
14.5400.312
ND
CL6(138)
47.96847.942
38.11223.872
10.82918.131
24.049C
L5(126) N
D0.301
ND
0.301N
D0.301
ND
0.301N
D0.301
ND
0.301N
D0.301
ND
CL7(187)
19.13619.033
13.02414.303
5.3497.240
14.117C
L6(128)6.727
6.7355.146
3.3621.795
2.5473.814
Procedural B
lank Reported in T
otal ng.N
D - N
on Detected
NA
- Not A
pplicible&
- Surrogate R
ecovery outside criteria (50 - 150%)
Surrogate R
ecoveries,%

Ap
pen
dix E
. PC
B an
d P
esticides C
on
centratio
ns (n
g/g
) con
td.
Sam
ple ID M
P31P
B N
OA
A1A
-R N
OA
A2A
NO
AA
4A-R
NO
AA
5B-R
NO
AA
6C-R
NO
AA
7B-R
Dry W
eight (g)1.0000
5.2279.722
5.1832.450
3.9517.932
CL7(180)
0.000N
D10.018
4.9832.845
5.9548.580
4.340M
IRE
X0.000
ND
0.247N
D0.247
ND
4.2400.247
ND
0.247N
D0.247
CL7(170)
0.000N
D10.489
6.5904.672
11.56518.792
15.836C
L8(195)0.000
ND
3.7290.754
0.4080.303
ND
3.4170.303
CL9(206)
0.000N
D7.430
0.480N
D0.653
0.480N
D7.682
0.480C
L10(209)0.000
ND
5.1240.314
ND
1.1200.314
ND
4.5770.314
GR
OU
P D
(IND
EN
O P
ES
T)
0.0005.461
3.0654.922
8.9009.701
9.996S
UM
OF
DD
T0.000
44.47723.825
15.96522.699
36.60538.364
TO
TA
L PC
B0.000
569.890227.752
112.709122.290
251.580137.353
GR
OU
P D
(NO
MD
L)0.000
4.9602.564
4.4218.399
9.2009.495
SU
M O
F D
DT
(NO
MD
L)0.000
44.47723.825
15.78221.957
36.17537.934
TO
TA
L PC
B (N
O M
DL)
0.000569.890
226.958112.709
120.250251.580
135.649T
otal non-DD
T pest.
9.956011.2890
13.954010.3630
11.164011.4590
Procedural B
lank Reported in T
otal ng.N
D - N
on Detected
NA
- Not A
pplicible&
- Surrogate R
ecovery outside criteria (50 - 150%)
Surrogate R
ecoveries,%
DB
OF
B69.977
54.50661.470
53.08659.247
71.49664.485
CL5(112)
69.44874.121
75.99071.328
77.47868.352
68.532
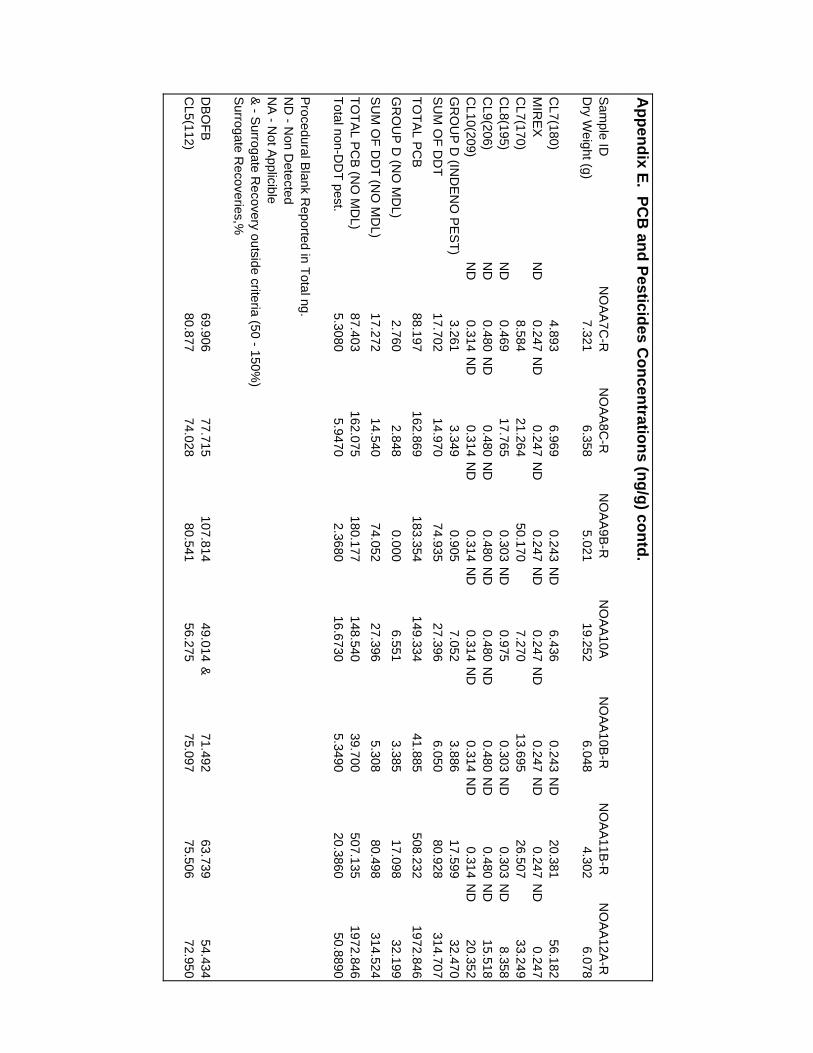
Ap
pen
dix E
. PC
B an
d P
esticides C
on
centratio
ns (n
g/g
) con
td.
Sam
ple ID N
OA
A7C
-R N
OA
A8C
-R N
OA
A9B
-R N
OA
A10A
NO
AA
10B-R
NO
AA
11B-R
NO
AA
12A-R
Dry W
eight (g)7.321
6.3585.021
19.2526.048
4.3026.078
CL7(180)
4.8936.969
0.243N
D6.436
0.243N
D20.381
56.182M
IRE
X N
D0.247
ND
0.247N
D0.247
ND
0.247N
D0.247
ND
0.247N
D0.247
CL7(170)
8.58421.264
50.1707.270
13.69526.507
33.249C
L8(195) N
D0.469
17.7650.303
ND
0.9750.303
ND
0.303N
D8.358
CL9(206)
ND
0.480N
D0.480
ND
0.480N
D0.480
ND
0.480N
D0.480
ND
15.518C
L10(209) N
D0.314
ND
0.314N
D0.314
ND
0.314N
D0.314
ND
0.314N
D20.352
GR
OU
P D
(IND
EN
O P
ES
T)
3.2613.349
0.9057.052
3.88617.599
32.470S
UM
OF
DD
T17.702
14.97074.935
27.3966.050
80.928314.707
TO
TA
L PC
B88.197
162.869183.354
149.33441.885
508.2321972.846
GR
OU
P D
(NO
MD
L)2.760
2.8480.000
6.5513.385
17.09832.199
SU
M O
F D
DT
(NO
MD
L)17.272
14.54074.052
27.3965.308
80.498314.524
TO
TA
L PC
B (N
O M
DL)
87.403162.075
180.177148.540
39.700507.135
1972.846T
otal non-DD
T pest.
5.30805.9470
2.368016.6730
5.349020.3860
50.8890
Procedural B
lank Reported in T
otal ng.N
D - N
on Detected
NA
- Not A
pplicible&
- Surrogate R
ecovery outside criteria (50 - 150%)
Surrogate R
ecoveries,%
DB
OF
B69.906
77.715107.814
49.014&
71.49263.739
54.434C
L5(112)80.877
74.02880.541
56.27575.097
75.50672.950
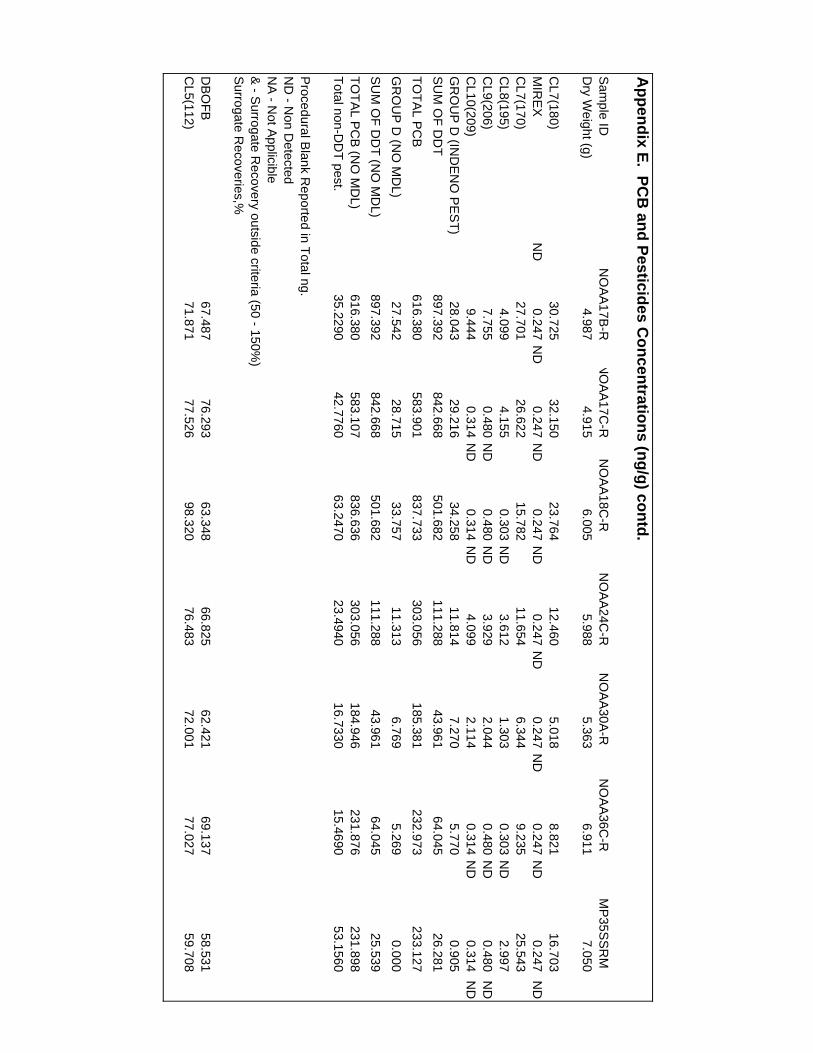
Ap
pen
dix E
. PC
B an
d P
esticides C
on
centratio
ns (n
g/g
) con
td.
Sam
ple IDN
OA
A17B
-RN
OA
A17C
-RN
OA
A18C
-R N
OA
A24C
-R N
OA
A30A
-R N
OA
A36C
-R M
P35S
SR
MD
ry Weight (g)
4.9874.915
6.0055.988
5.3636.911
7.050
CL7(180)
30.72532.150
23.76412.460
5.0188.821
16.703M
IRE
X N
D0.247
ND
0.247N
D0.247
ND
0.247N
D0.247
ND
0.247N
D0.247
ND
CL7(170)
27.70126.622
15.78211.654
6.3449.235
25.543C
L8(195)4.099
4.1550.303
ND
3.6121.303
0.303N
D2.997
CL9(206)
7.7550.480
ND
0.480N
D3.929
2.0440.480
ND
0.480 N
DC
L10(209)9.444
0.314N
D0.314
ND
4.0992.114
0.314N
D0.314
ND
GR
OU
P D
(IND
EN
O P
ES
T)
28.04329.216
34.25811.814
7.2705.770
0.905S
UM
OF
DD
T897.392
842.668501.682
111.28843.961
64.04526.281
TO
TA
L PC
B616.380
583.901837.733
303.056185.381
232.973233.127
GR
OU
P D
(NO
MD
L)27.542
28.71533.757
11.3136.769
5.2690.000
SU
M O
F D
DT
(NO
MD
L)897.392
842.668501.682
111.28843.961
64.04525.539
TO
TA
L PC
B (N
O M
DL)
616.380583.107
836.636303.056
184.946231.876
231.898T
otal non-DD
T pest.
35.229042.7760
63.247023.4940
16.733015.4690
53.1560
Procedural B
lank Reported in T
otal ng.N
D - N
on Detected
NA
- Not A
pplicible&
- Surrogate R
ecovery outside criteria (50 - 150%)
Surrogate R
ecoveries,%
DB
OF
B67.487
76.29363.348
66.82562.421
69.13758.531
CL5(112)
71.87177.526
98.32076.483
72.00177.027
59.708

Appendix F. Percent organic carbon, percent carbonate, and grain size.
SAMPLE % TOC TOC Dup % TIC TIC Dup % Fines % GRAVEL % SAND % SILT % CLAY
NOAA 1-A 2.49 2.48 0.07 0.07 65.1 1.0 34.0 46.4 18.7
NOAA 2-A 2.67 0.22 72.7 0.0 27.4 53.2 19.5
NOAA 4-A 2.86 0.50 56.0 0.2 43.8 30.8 25.2
NOAA 5-B 3.09 0.03 67.5 0.0 32.4 38.3 29.2
NOAA 6-C 3.86 0.19 73.5 0.6 25.9 40.6 32.9
NOAA 7-B 4.44 2.38 10.4 2.6 87.1 5.6 4.8
NOAA 7-C 1.88 1.00 12.5 8.5 79.1 7.5 5.0
NOAA 8-C 3.47 1.02 42.5 3.0 54.5 23.8 18.7
NOAA 9-B 5.02 1.35 46.1 0.4 53.5 27.7 18.4
NOAA 10-A 4.44 2.55 24.7 9.1 66.1 14.2 10.5
NOAA 10-B 2.61 0.22 55.8 2.1 42.0 31.4 24.4
NOAA 11-B 3.99 4.23 0.62 0.65 45.1 0.0 54.8 29.8 15.3
NOAA 12-A 4.78 1.52 48.3 1.3 50.3 32.9 15.4
NOAA 12-B 3.63 0.10 64.1 0.0 35.8 40.9 23.2
NOAA 13-A 2.55 0.26 48.1 15.0 36.9 29.5 18.6
NOAA 14-A 0.25 0.00 1.5 0.0 98.5 1.2 0.3
NOAA 16-A 0.77 0.39 15.2 3.2 81.6 10.6 4.6
NOAA 16-B 0.95 0.07 32.3 6.7 61.1 22.6 9.7
NOAA 17-B 3.19 3.17 0.07 0.07 76.7 0.2 23.2 53.5 23.2
NOAA 17-C 2.98 0.15 65.4 0.3 34.4 47.1 18.3
NOAA 18-A 1.47 0.09 32.1 1.2 66.7 17.5 14.6
NOAA 18-C 1.98 0.07 35.8 12.8 51.3 22.7 13.1
NOAA 22-C 3.47 0.66 37.9 3.1 59.0 22.1 15.8
NOAA 23-A 2.98 2.93 0.51 0.50 51.3 32.5 16.2 31.8 19.5
NOAA 24-C 2.98 0.18 46.8 0.9 52.3 29.9 16.9
NOAA 25-A 3.21 0.09 51.0 0.1 48.9 33.8 17.2
NOAA 26-A 3.15 1.42 9.4 0.0 90.5 5.9 3.5
NOAA 26-C 3.02 0.09 43.7 0.7 55.6 29.4 14.3
NOAA 29-A 2.80 0.13 40.3 0.1 59.5 25.5 14.8
NOAA 30-A 2.20 0.25 28.5 0.5 70.9 16.8 11.7
NOAA 30-B 1.94 0.07 26.7 0.7 72.5 16.2 10.5
NOAA 30-C 3.05 0.06 30.4 2.0 67.6 18.6 11.8
NOAA 33-B 3.18 0.14 47.9 3.7 48.4 31.4 16.5
NOAA 34-B 1.00 0.00 17.2 0.0 82.8 7.4 9.8
NOAA 35-A 0.69 1.07 13.6 11.2 75.3 7.9 5.7
NOAA 36-C 2.50 0.03 55.8 0.0 44.2 37.5 18.3
NOAA 37-B 0.07 0.00 0.0 0.0 100.0 0.0 0.0
NOAA 38-B 0.07 0.00 0.0 0.0 100.0 0.0 0.0
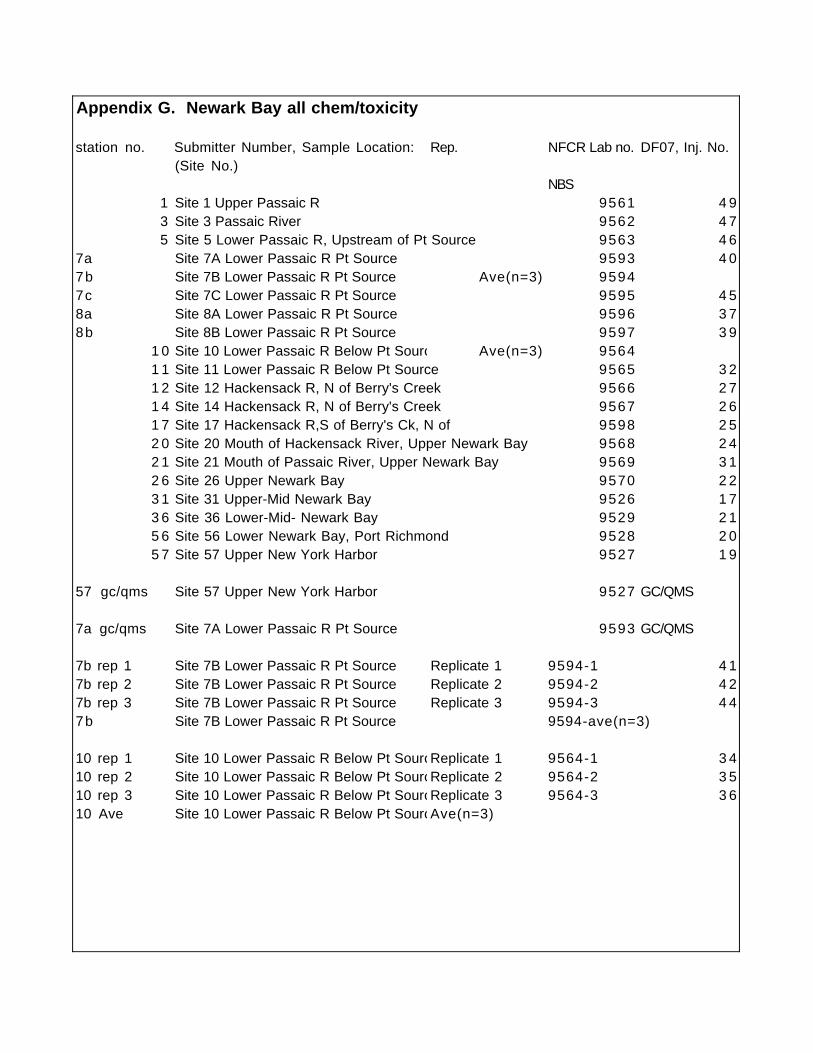
Appendix G. Newark Bay all chem/toxicity
station no. Submitter Number, Sample Location: Rep. NFCR Lab no. DF07, Inj. No.(Site No.)
NBS1 Site 1 Upper Passaic R 9561 4 93 Site 3 Passaic River 9562 4 75 Site 5 Lower Passaic R, Upstream of Pt Source 9563 4 6
7a Site 7A Lower Passaic R Pt Source 9593 4 07b Site 7B Lower Passaic R Pt Source Ave(n=3) 95947c Site 7C Lower Passaic R Pt Source 9595 4 58a Site 8A Lower Passaic R Pt Source 9596 3 78b Site 8B Lower Passaic R Pt Source 9597 3 9
1 0 Site 10 Lower Passaic R Below Pt Sourc Ave(n=3) 95641 1 Site 11 Lower Passaic R Below Pt Source 9565 3 21 2 Site 12 Hackensack R, N of Berry's Creek 9566 2 71 4 Site 14 Hackensack R, N of Berry's Creek 9567 2 61 7 Site 17 Hackensack R,S of Berry's Ck, N of 9598 2 52 0 Site 20 Mouth of Hackensack River, Upper Newark Bay 9568 2 42 1 Site 21 Mouth of Passaic River, Upper Newark Bay 9569 3 12 6 Site 26 Upper Newark Bay 9570 2 23 1 Site 31 Upper-Mid Newark Bay 9526 1 73 6 Site 36 Lower-Mid- Newark Bay 9529 2 15 6 Site 56 Lower Newark Bay, Port Richmond 9528 2 05 7 Site 57 Upper New York Harbor 9527 1 9
57 gc/qms Site 57 Upper New York Harbor 9527 GC/QMS
7a gc/qms Site 7A Lower Passaic R Pt Source 9593 GC/QMS
7b rep 1 Site 7B Lower Passaic R Pt Source Replicate 1 9594-1 4 17b rep 2 Site 7B Lower Passaic R Pt Source Replicate 2 9594-2 4 27b rep 3 Site 7B Lower Passaic R Pt Source Replicate 3 9594-3 4 47b Site 7B Lower Passaic R Pt Source 9594-ave(n=3)
10 rep 1 Site 10 Lower Passaic R Below Pt SourcReplicate 1 9564-1 3 410 rep 2 Site 10 Lower Passaic R Below Pt SourcReplicate 2 9564-2 3 510 rep 3 Site 10 Lower Passaic R Below Pt SourcReplicate 3 9564-3 3 610 Ave Site 10 Lower Passaic R Below Pt SourcAve(n=3)

Appendix G. Newark Bay all chem/toxicity contd.
station no. % AmphSurv Stat. signif. UAN, ug/l 2,3,7,8-tcdd, kutz 90 TEF TEQ 1(Site No.) Rel. to Ctls. Hit/Nohit pg/g
1 Site 1 7 6 H 330 9 9 1 9 93 Site 3 31.3 H 235 270 1 2705 Site 5 29.1 H 460 450 1 450
7a Site 7A 34.8 H nd 390 1 3907b Site 7B 32.6 H nd 376.67 1 376.677c Site 7C 9 H nd 620 1 6208a Site 8A 19.1 H nd 440 1 4408b Site 8B 14.6 H nd 300 1 300
1 0 Site 10 20.2 H nd 363.33 1 363.331 1 Site 11 51.9 H 0.35 280 1 2801 2 Site 12 96.2 N 0.35 7.4 1 7.41 4 Site 14 77.2 N 0.35 6 2 1 6 21 7 Site 17 72.2 H 0.35 2 9 1 2 92 0 Site 20 79.4 H 0.35 3 8 1 3 82 1 Site 21 17.5 H 0.35 140 1 1402 6 Site 26 0 H 0.35 470 1 4703 1 Site 31 52.6 H 0.35 6 2 1 6 23 6 Site 36 68.4 H 0.35 5 5 1 5 55 6 Site 56 83.3 N 0.35 3 0 1 3 05 7 Site 57 111.1 N 620 3.6 1 3.6
57 gc/qms Site 57 2 1 2
7a gc/qms Site 7A 480 1 480
7b rep 1 Site 7B 430 1 4307b rep 2 Site 7B 340 1 3407b rep 3 Site 7B 360 1 3607b Site 7B 376.667 1 376.67
10 rep 1 Site 10 310 1 31010 rep 2 Site 10 350 1 35010 rep 3 Site 10 430 1 43010 Ave Site 10 363.33 1 363.33
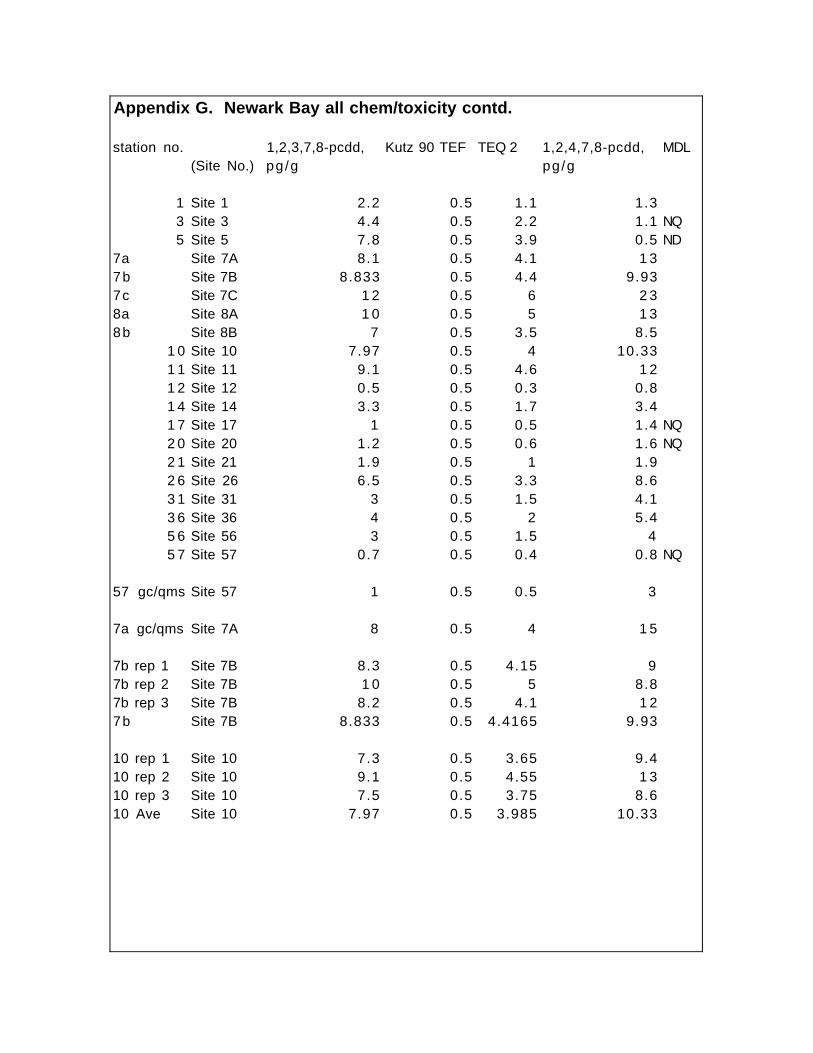
Appendix G. Newark Bay all chem/toxicity contd.
station no. 1,2,3,7,8-pcdd, Kutz 90 TEF TEQ 2 1,2,4,7,8-pcdd, MDL(Site No.) pg/g pg/g
1 Site 1 2.2 0.5 1.1 1.33 Site 3 4.4 0.5 2.2 1.1 NQ5 Site 5 7.8 0.5 3.9 0.5 ND
7a Site 7A 8.1 0.5 4.1 1 37b Site 7B 8.833 0.5 4.4 9.937c Site 7C 1 2 0.5 6 2 38a Site 8A 1 0 0.5 5 1 38b Site 8B 7 0.5 3.5 8.5
1 0 Site 10 7.97 0.5 4 10.331 1 Site 11 9.1 0.5 4.6 1 21 2 Site 12 0.5 0.5 0.3 0.81 4 Site 14 3.3 0.5 1.7 3.41 7 Site 17 1 0.5 0.5 1.4 NQ2 0 Site 20 1.2 0.5 0.6 1.6 NQ2 1 Site 21 1.9 0.5 1 1.92 6 Site 26 6.5 0.5 3.3 8.63 1 Site 31 3 0.5 1.5 4.13 6 Site 36 4 0.5 2 5.45 6 Site 56 3 0.5 1.5 45 7 Site 57 0.7 0.5 0.4 0.8 NQ
57 gc/qms Site 57 1 0.5 0.5 3
7a gc/qms Site 7A 8 0.5 4 1 5
7b rep 1 Site 7B 8.3 0.5 4.15 97b rep 2 Site 7B 1 0 0.5 5 8.87b rep 3 Site 7B 8.2 0.5 4.1 1 27b Site 7B 8.833 0.5 4.4165 9.93
10 rep 1 Site 10 7.3 0.5 3.65 9.410 rep 2 Site 10 9.1 0.5 4.55 1 310 rep 3 Site 10 7.5 0.5 3.75 8.610 Ave Site 10 7.97 0.5 3.985 10.33

Appendix G. Newark Bay all chem/toxicity contd.
station no. TEQ 3 1,2,3,6,7, Kutz 90 TEF TEQ 4 1,2,3,7,8,(Site No.) 8-hcdd, pg/g 9-hcdd, ng/g
1 Site 1 0.16 7.5 0.1 0.75 4.33 Site 3 0.41 3 3 0.1 3.3 4.55 Site 5 0.8 4 4 0.1 4.4 2 6
7a Site 7A 0.77 2 9 0.1 2.9 2 07b Site 7B 0.97 32.33 0.1 3.23 29.677c Site 7C 0.97 3 9 0.1 3.9 2 98a Site 8A 0.97 3 8 0.1 3.8 2 98b Site 8B 0.82 3 2 0.1 3.2 2 2
1 0 Site 10 0.74 33.67 0.1 3.37 23.331 1 Site 11 0.83 3 1 0.1 3.1 2 41 2 Site 12 0.07 2.9 0.1 0.29 21 4 Site 14 0.35 1 7 0.1 1.7 1 21 7 Site 17 0.12 4.1 0.1 0.41 2.82 0 Site 20 0.12 6.2 0.1 0.62 42 1 Site 21 0.23 8 0.1 0.8 5.92 6 Site 26 0.55 3 2 0.1 3.2 2 13 1 Site 31 0.32 1 5 0.1 1.5 1 13 6 Site 36 0.41 1 7 0.1 1.7 1 35 6 Site 56 0.32 1 6 0.1 1.6 1 25 7 Site 57 0.07 2.4 0.1 0.24 1.4
57 gc/qms Site 57 0.1 3 0.1 0.3 0.9
7a gc/qms Site 7A 0.8 5 7 0.1 5.7 2 8
7b rep 1 Site 7B 0.96 2 9 0.1 2.9 2 57b rep 2 Site 7B 1.1 3 7 0.1 3.7 3 97b rep 3 Site 7B 0.84 3 1 0.1 3.1 2 57b Site 7B 0.97 32.333 0.1 3.23 29.667
10 rep 1 Site 10 0.71 3 4 0.1 3.4 2 210 rep 2 Site 10 0.78 3 4 0.1 3.4 2 410 rep 3 Site 10 0.73 3 3 0.1 3.3 2 410 Ave Site 10 0.74 33.67 0.1 3.37 23.33
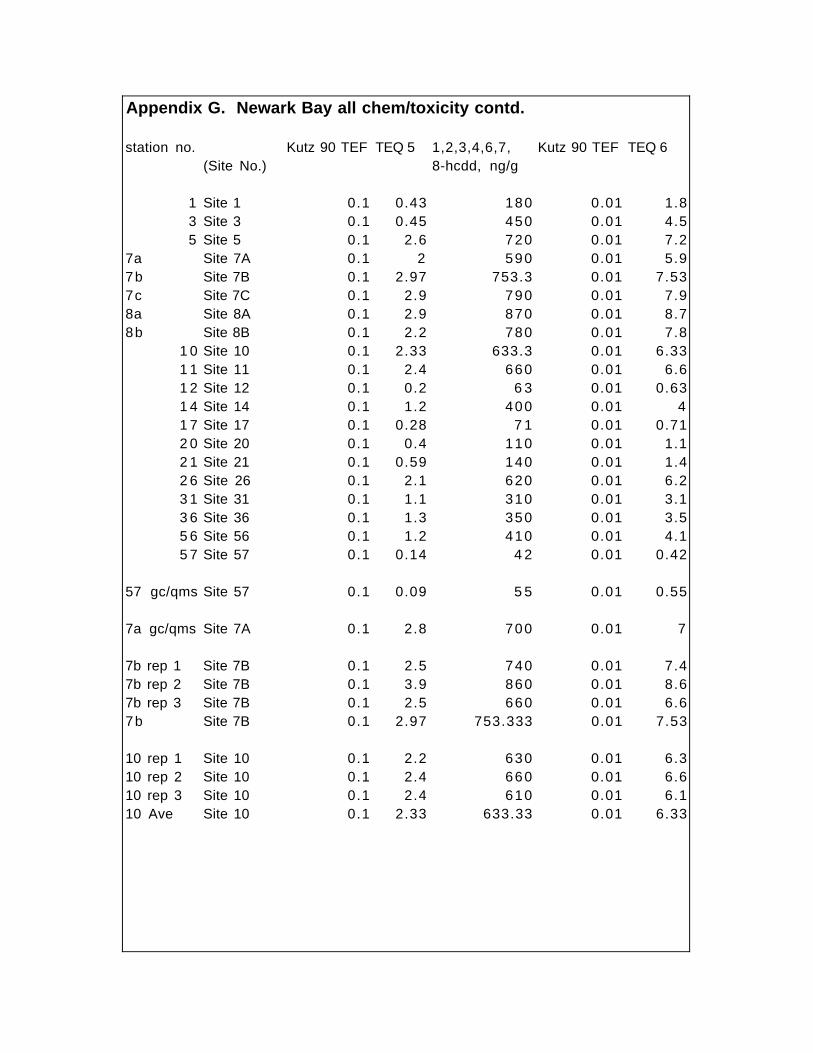
Appendix G. Newark Bay all chem/toxicity contd.
station no. Kutz 90 TEF TEQ 5 1,2,3,4,6,7, Kutz 90 TEF TEQ 6(Site No.) 8-hcdd, ng/g
1 Site 1 0.1 0.43 180 0.01 1.83 Site 3 0.1 0.45 450 0.01 4.55 Site 5 0.1 2.6 720 0.01 7.2
7a Site 7A 0.1 2 590 0.01 5.97b Site 7B 0.1 2.97 753.3 0.01 7.537c Site 7C 0.1 2.9 790 0.01 7.98a Site 8A 0.1 2.9 870 0.01 8.78b Site 8B 0.1 2.2 780 0.01 7.8
1 0 Site 10 0.1 2.33 633.3 0.01 6.331 1 Site 11 0.1 2.4 660 0.01 6.61 2 Site 12 0.1 0.2 6 3 0.01 0.631 4 Site 14 0.1 1.2 400 0.01 41 7 Site 17 0.1 0.28 7 1 0.01 0.712 0 Site 20 0.1 0.4 110 0.01 1.12 1 Site 21 0.1 0.59 140 0.01 1.42 6 Site 26 0.1 2.1 620 0.01 6.23 1 Site 31 0.1 1.1 310 0.01 3.13 6 Site 36 0.1 1.3 350 0.01 3.55 6 Site 56 0.1 1.2 410 0.01 4.15 7 Site 57 0.1 0.14 4 2 0.01 0.42
57 gc/qms Site 57 0.1 0.09 5 5 0.01 0.55
7a gc/qms Site 7A 0.1 2.8 700 0.01 7
7b rep 1 Site 7B 0.1 2.5 740 0.01 7.47b rep 2 Site 7B 0.1 3.9 860 0.01 8.67b rep 3 Site 7B 0.1 2.5 660 0.01 6.67b Site 7B 0.1 2.97 753.333 0.01 7.53
10 rep 1 Site 10 0.1 2.2 630 0.01 6.310 rep 2 Site 10 0.1 2.4 660 0.01 6.610 rep 3 Site 10 0.1 2.4 610 0.01 6.110 Ave Site 10 0.1 2.33 633.33 0.01 6.33

Appendix G. Newark Bay all chem/toxicity contd.
station no. Octa chloro-dd, Kutz 90 TEF TEQ 7 2,3,7,8-tcdf, (Site No.) pg/g pg/g
1 Site 1 1,900 0.001 1.9 7 13 Site 3 4,800 0.001 4.8 1605 Site 5 7,100 0.001 7.1 190
7a Site 7A 6,400 0.001 6.4 1707b Site 7B 7800 0.001 7.8 2207c Site 7C 8,100 0.001 8.1 2308a Site 8A 8,700 0.001 8.7 2308b Site 8B 7,700 0.001 7.7 170
1 0 Site 10 6300 0.001 6.3 233.331 1 Site 11 7,400 0.001 7.4 2201 2 Site 12 1,200 0.001 1.2 1 01 4 Site 14 5,000 0.001 5 8 91 7 Site 17 1,100 0.001 1.1 2 92 0 Site 20 1,400 0.001 1.4 4 12 1 Site 21 1,800 0.001 1.8 1402 6 Site 26 5,900 0.001 5.9 3703 1 Site 31 3,100 0.001 3.1 9 23 6 Site 36 3,600 0.001 3.6 6 65 6 Site 56 4,800 0.001 4.8 5 65 7 Site 57 510 0.001 0.51 9.5
57 gc/qms Site 57 580 0.001 0.58 7
7a gc/qms Site 7A 5,960 0.001 5.96 190
7b rep 1 Site 7B 7,000 0.001 7 2207b rep 2 Site 7B 9,700 0.001 9.7 2707b rep 3 Site 7B 6,700 0.001 6.7 1707b Site 7B 7800 0.001 7.8 220
10 rep 1 Site 10 6,700 0.001 6.7 25010 rep 2 Site 10 6,300 0.001 6.3 23010 rep 3 Site 10 5,900 0.001 5.9 22010 Ave Site 10 6300 0.001 6.3 233.33

Appendix G. Newark Bay all chem/toxicity contd.
station no. Kutz 90 TEF TEQ 8 1,2,3,7,8-pcdf, Kutz 90 TEF TEQ 9(Site No.) pg/g
1 Site 1 0.1 7.1 2.8 0.05 0.143 Site 3 0.1 1 6 8.7 0.05 0.4355 Site 5 0.1 1 9 1 4 0.05 0.7
7a Site 7A 0.1 1 7 1 2 0.05 0.67b Site 7B 0.1 2 2 13.333 0.05 0.666657c Site 7C 0.1 2 3 1 9 0.05 0.958a Site 8A 0.1 2 3 1 6 0.05 0.88b Site 8B 0.1 1 7 1 1 0.05 0.55
1 0 Site 10 0.1 23.33 22.33 0.05 1.11651 1 Site 11 0.1 2 2 1 8 0.05 0.91 2 Site 12 0.1 1 1.3 0.05 0.0651 4 Site 14 0.1 8.9 9 0.05 0.451 7 Site 17 0.1 2.9 2.7 0.05 0.1352 0 Site 20 0.1 4.1 5.4 0.05 0.272 1 Site 21 0.1 1 4 5.2 0.05 0.262 6 Site 26 0.1 3 7 1 5 0.05 0.753 1 Site 31 0.1 9.2 1 0 0.05 0.53 6 Site 36 0.1 6.6 7.5 0.05 0.3755 6 Site 56 0.1 5.6 6.4 0.05 0.325 7 Site 57 0.1 0.95 1.1 0.05 0.055
57 gc/qms Site 57 0.1 0.7 0.8 0.05 0.04
7a gc/qms Site 7A 0.1 1 9 1 3 0.05 0.65
7b rep 1 Site 7B 0.1 2 2 1 3 0.05 0.657b rep 2 Site 7B 0.1 2 7 1 4 0.05 0.77b rep 3 Site 7B 0.1 1 7 1 3 0.05 0.657b Site 7B 0.1 2 2 13.333 0.05 0.66665
10 rep 1 Site 10 0.1 2 5 2 3 0.05 1.1510 rep 2 Site 10 0.1 2 3 2 2 0.05 1.110 rep 3 Site 10 0.1 2 2 2 2 0.05 1.110 Ave Site 10 0.1 23.33 22.33 0.05 1.1165

Appendix G. Newark Bay all chem/toxicity contd.
station no. 2,3,4,7,8-pcdf, Kutz 90 TEF TEQ 10 1,2,3,4,7, Kutz 90 TEF(Site No.) pg/g 8-hcdf, pg/g
1 Site 1 6.2 0.5 3.1 1 9 0.13 Site 3 3 6 0.5 1 8 120 0.15 Site 5 3 3 0.5 16.5 220 0.1
7a Site 7A 2 7 0.5 13.5 170 0.17b Site 7B 29.333 0.5 14.67 220 0.17c Site 7C 4 1 0.5 20.5 370 0.18a Site 8A 4 3 0.5 21.5 350 0.18b Site 8B 2 5 0.5 12.5 170 0.1
1 0 Site 10 47.33 0.5 23.67 386.67 0.11 1 Site 11 4 0 0.5 2 0 380 0.11 2 Site 12 2 0.5 1 1 6 0.11 4 Site 14 2 2 0.5 1 1 230 0.11 7 Site 17 5.5 0.5 2.75 4 5 0.12 0 Site 20 8.4 0.5 4.2 7 5 0.12 1 Site 21 8.4 0.5 4.2 6 9 0.12 6 Site 26 3 6 0.5 1 8 200 0.13 1 Site 31 1 5 0.5 7.5 9 5 0.13 6 Site 36 1 4 0.5 7 9 0 0.15 6 Site 56 9.4 0.5 4.7 3 2 0.15 7 Site 57 1.4 0.5 0.7 4.3 0.1
57 gc/qms Site 57 0.3 0.5 0.15 3 0.1
7a gc/qms Site 7A 2 9 0.5 14.5 200 0.1
7b rep 1 Site 7B 2 9 0.5 14.5 230 0.17b rep 2 Site 7B 2 8 0.5 1 4 220 0.17b rep 3 Site 7B 3 1 0.5 15.5 210 0.17b Site 7B 29.333 0.5 14.67 220 0.1
10 rep 1 Site 10 4 7 0.5 23.5 340 0.110 rep 2 Site 10 5 2 0.5 2 6 460 0.110 rep 3 Site 10 4 3 0.5 21.5 360 0.110 Ave Site 10 47.33 0.5 23.67 386.67 0.1

Appendix G. Newark Bay all chem/toxicity contd.
station no. TEQ 11 1,2,3,6,7, 88-TEF TEQ 12 1,2,3,7,8,(Site No.) 8-hcdf, pg/g 9-hcdf, ng/g
1 Site 1 1.9 5.5 0.1 0.55 0.43 Site 3 1 2 2 9 0.1 2.9 0.45 Site 5 2 2 4 7 0.1 4.7 0.9
7a Site 7A 1 7 4 0 0.1 4 1.57b Site 7B 2 2 4 7 0.1 4.7 1.1677c Site 7C 3 7 7 4 0.1 7.4 1.28a Site 8A 3 5 6 8 0.1 6.8 1.48b Site 8B 1 7 3 8 0.1 3.8 1.2
1 0 Site 10 38.67 7 5 0.1 7.5 1.471 1 Site 11 3 8 7 2 0.1 7.2 1.51 2 Site 12 1.6 3.1 0.1 0.31 0.41 4 Site 14 2 3 3 6 0.1 3.6 0.81 7 Site 17 4.5 7.6 0.1 0.76 0.42 0 Site 20 7.5 1 4 0.1 1.4 0.42 1 Site 21 6.9 1 2 0.1 1.2 0.72 6 Site 26 2 0 3 5 0.1 3.5 1.23 1 Site 31 9.5 2 1 0.1 2.1 1.53 6 Site 36 9 1 7 0.1 1.7 0.75 6 Site 56 3.2 8.9 0.1 0.89 0.45 7 Site 57 0.43 1.2 0.1 0.12 0.4
57 gc/qms Site 57 0.3 0.9 0.1 0.09 5
7a gc/qms Site 7A 2 0 2 8 0.1 2.8 8
7b rep 1 Site 7B 2 3 4 9 0.1 4.9 1.27b rep 2 Site 7B 2 2 4 7 0.1 4.7 1.27b rep 3 Site 7B 2 1 4 5 0.1 4.5 1.17b Site 7B 2 2 4 7 0.1 4.7 1.167
10 rep 1 Site 10 3 4 7 0 0.1 7 1.510 rep 2 Site 10 4 6 8 4 0.1 8.4 1.510 rep 3 Site 10 3 6 7 1 0.1 7.1 1.410 Ave Site 10 38.67 7 5 0.1 7.5 1.47

Appendix G. Newark Bay all chem/toxicity contd.
station no. Kutz 90 TEF TEQ 13 2,3,4,6,7, Kutz 90 TEFTEQ 14 1,2,3,4,6,7,(Site No.) 8-hcdf, pg/g 8-hcdf, pg/g
1 Site 1 0.1 0.04 4.2 0.1 0.42 8 23 Site 3 0.1 0.04 2.2 0.1 0.22 4805 Site 5 0.1 0.09 9.4 0.1 0.94 940
7a Site 7A 0.1 0.15 1 9 0.1 1.9 8307b Site 7B 0.1 0.12 14.1 0.1 1.41 1003.337c Site 7C 0.1 0.12 3 4 0.1 3.4 1,6008a Site 8A 0.1 0.14 1 2 0.1 1.2 1,5008b Site 8B 0.1 0.12 9.2 0.1 0.92 800
1 0 Site 10 0.1 0.15 30.33 0.1 3.03 1633.331 1 Site 11 0.1 0.15 3 0 0.1 3 1,6001 2 Site 12 0.1 0.04 1.8 0.1 0.18 9 51 4 Site 14 0.1 0.08 1 4 0.1 1.4 9501 7 Site 17 0.1 0.04 3.1 0.1 0.31 1902 0 Site 20 0.1 0.04 5.6 0.1 0.56 3202 1 Site 21 0.1 0.07 5.8 0.1 0.58 2802 6 Site 26 0.1 0.12 1 8 0.1 1.8 7503 1 Site 31 0.1 0.15 9.5 0.1 0.95 5103 6 Site 36 0.1 0.07 9.7 0.1 0.97 3805 6 Site 56 0.1 0.04 6.4 0.1 0.64 1905 7 Site 57 0.1 0.04 1.2 0.1 0.12 2 3
57 gc/qms Site 57 0.1 0.5 0.5 0.1 0.05 1 4
7a gc/qms Site 7A 0.1 0.8 5 0.1 0.5 600
7b rep 1 Site 7B 0.1 0.12 9.8 0.1 0.98 1,1007b rep 2 Site 7B 0.1 0.12 2 3 0.1 2.3 1,0007b rep 3 Site 7B 0.1 0.11 9.5 0.1 0.95 9107b Site 7B 0.1 0.12 14.1 0.1 1.41 1003.333
10 rep 1 Site 10 0.1 0.15 2 8 0.1 2.8 1,50010 rep 2 Site 10 0.1 0.15 3 4 0.1 3.4 1,80010 rep 3 Site 10 0.1 0.14 2 9 0.1 2.9 1,60010 Ave Site 10 0.1 0.15 30.33 0.1 3.03 1633.33
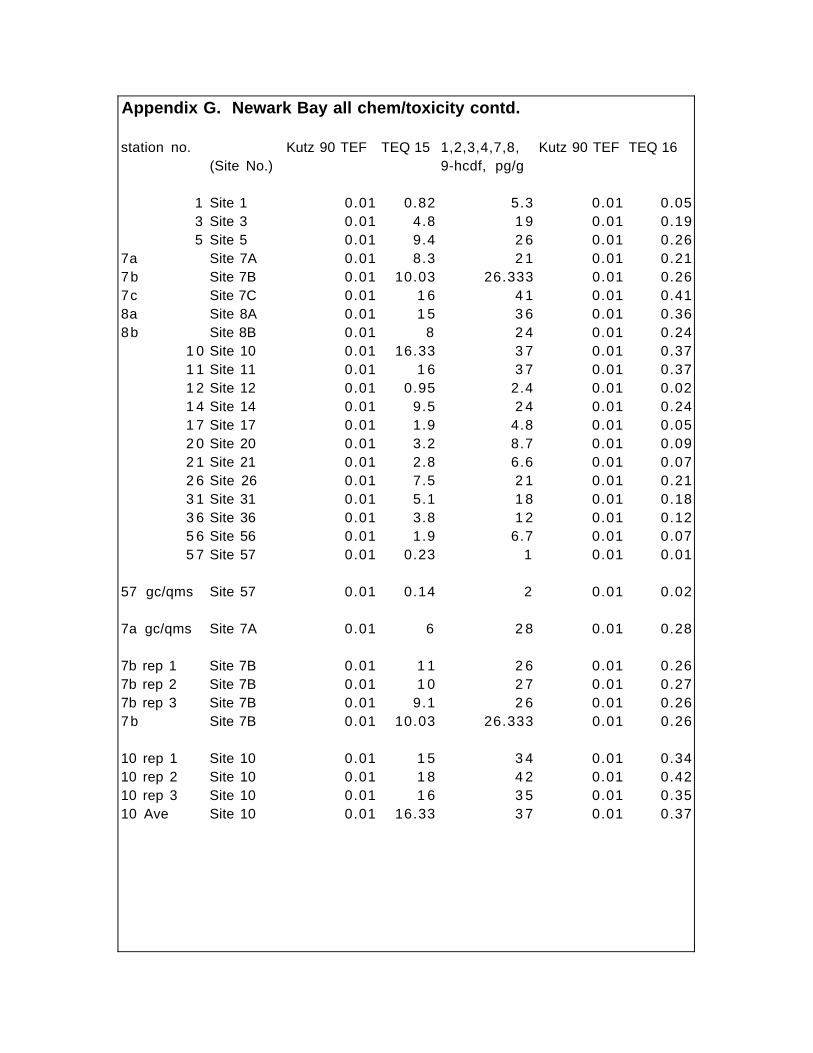
Appendix G. Newark Bay all chem/toxicity contd.
station no. Kutz 90 TEF TEQ 15 1,2,3,4,7,8, Kutz 90 TEF TEQ 16(Site No.) 9-hcdf, pg/g
1 Site 1 0.01 0.82 5.3 0.01 0.053 Site 3 0.01 4.8 1 9 0.01 0.195 Site 5 0.01 9.4 2 6 0.01 0.26
7a Site 7A 0.01 8.3 2 1 0.01 0.217b Site 7B 0.01 10.03 26.333 0.01 0.267c Site 7C 0.01 1 6 4 1 0.01 0.418a Site 8A 0.01 1 5 3 6 0.01 0.368b Site 8B 0.01 8 2 4 0.01 0.24
1 0 Site 10 0.01 16.33 3 7 0.01 0.371 1 Site 11 0.01 1 6 3 7 0.01 0.371 2 Site 12 0.01 0.95 2.4 0.01 0.021 4 Site 14 0.01 9.5 2 4 0.01 0.241 7 Site 17 0.01 1.9 4.8 0.01 0.052 0 Site 20 0.01 3.2 8.7 0.01 0.092 1 Site 21 0.01 2.8 6.6 0.01 0.072 6 Site 26 0.01 7.5 2 1 0.01 0.213 1 Site 31 0.01 5.1 1 8 0.01 0.183 6 Site 36 0.01 3.8 1 2 0.01 0.125 6 Site 56 0.01 1.9 6.7 0.01 0.075 7 Site 57 0.01 0.23 1 0.01 0.01
57 gc/qms Site 57 0.01 0.14 2 0.01 0.02
7a gc/qms Site 7A 0.01 6 2 8 0.01 0.28
7b rep 1 Site 7B 0.01 1 1 2 6 0.01 0.267b rep 2 Site 7B 0.01 1 0 2 7 0.01 0.277b rep 3 Site 7B 0.01 9.1 2 6 0.01 0.267b Site 7B 0.01 10.03 26.333 0.01 0.26
10 rep 1 Site 10 0.01 1 5 3 4 0.01 0.3410 rep 2 Site 10 0.01 1 8 4 2 0.01 0.4210 rep 3 Site 10 0.01 1 6 3 5 0.01 0.3510 Ave Site 10 0.01 16.33 3 7 0.01 0.37

Appendix G. Newark Bay all chem/toxicity contd.
station no. Octa chloro df, Kutz 90 TETEQ 17 Cum dioxin TEQPCB 81 PCB 77(Site No.) pg/g pg/g pg/g pg/g
1 Site 1 210 0.001 0.21 119.47 5 9 22003 Site 3 770 0.001 0.77 341.02 9 4 52005 Site 5 1,300 0.001 1.3 550.89 130 6100
7a Site 7A 1,200 0.001 1.2 475.88 110 49007b Site 7B 1333 0.001 1.33 480.77 120 53007c Site 7C 2,000 0.001 2 760.55 140 95008a Site 8A 1,800 0.001 1.8 575.67 150 70008b Site 8B 1,200 0.001 1.2 386.55 120 4900
1 0 Site 10 2000 0.001 2 502.55 173.33 6233.31 1 Site 11 2,100 0.001 2.1 414.6 160 54001 2 Site 12 180 0.001 0.18 15.389 2 8 4801 4 Site 14 1,500 0.001 1.5 135.57 9 0 35001 7 Site 17 310 0.001 0.31 45.773 2 7 9102 0 Site 20 490 0.001 0.49 64.087 2 3 11002 1 Site 21 430 0.001 0.43 176.28 7 8 27002 6 Site 26 1,200 0.001 1.2 581.28 320 120003 1 Site 31 970 0.001 0.97 108.77 7 6 25003 6 Site 36 640 0.001 0.64 97.785 7 6 30005 6 Site 56 330 0.001 0.33 61.207 6 7 26005 7 Site 57 4 4 0.001 0.04 8.029 1 3 370
57 gc/qms Site 57 3 3 0.001 0.03 6.143 2 0 260
7a gc/qms Site 7A 1,580 0.001 1.58 572.37 8 7 5400
7b rep 1 Site 7B 1,400 0.001 1.4 533.72 130 55007b rep 2 Site 7B 1,300 0.001 1.3 454.39 120 53007b rep 3 Site 7B 1,300 0.001 1.3 454.21 110 51007b Site 7B 1333.333 0.001 1.33 480.773 120 5300
10 rep 1 Site 10 2,000 0.001 2 443.9 170 620010 rep 2 Site 10 2,100 0.001 2.1 502.6 180 630010 rep 3 Site 10 1,900 0.001 1.9 561.17 170 620010 Ave Site 10 2000 0.001 2 502.553 173.33 6233.3

Appendix G. Newark Bay all chem/toxicity contd.
station no. Barnes 91 TEF TEQ 19 PCB 126 Barnes 91 TEF TEQ 20(Site No.) pg/g
1 Site 1 0.01 2 2 3 5 0.1 3.53 Site 3 0.01 5 2 110 0.1 1 15 Site 5 0.01 6 1 170 0.1 1 7
7a Site 7A 0.01 4 9 130 0.1 1 37b Site 7B 0.01 5 3 176.67 0.1 17.677c Site 7C 0.01 9 5 170 0.1 1 78a Site 8A 0.01 7 0 190 0.1 1 98b Site 8B 0.01 4 9 150 0.1 1 5
1 0 Site 10 0.01 62.33 170 0.1 1 71 1 Site 11 0.01 5 4 140 0.1 1 41 2 Site 12 0.01 4.8 2 3 0.1 2.31 4 Site 14 0.01 3 5 9 0 0.1 91 7 Site 17 0.01 9.1 2 3 0.1 2.32 0 Site 20 0.01 1 1 1 9 0.1 1.92 1 Site 21 0.01 2 7 5 6 0.1 5.62 6 Site 26 0.01 120 210 0.1 2 13 1 Site 31 0.01 2 5 7 4 0.1 7.43 6 Site 36 0.01 3 0 7 4 0.1 7.45 6 Site 56 0.01 2 6 5 7 0.1 5.75 7 Site 57 0.01 3.7 9 0.1 0.9
57 gc/qms Site 57 0.01 2.6 1 9 0.1 1.9
7a gc/qms Site 7A 0.01 5 4 120 0.1 1 2
7b rep 1 Site 7B 0.01 5 5 240 0.1 2 47b rep 2 Site 7B 0.01 5 3 150 0.1 1 57b rep 3 Site 7B 0.01 5 1 140 0.1 1 47b Site 7B 0.01 5 3 176.667 0.1 17.67
10 rep 1 Site 10 0.01 6 2 180 0.1 1 810 rep 2 Site 10 0.01 6 3 180 0.1 1 810 rep 3 Site 10 0.01 6 2 150 0.1 1 510 Ave Site 10 0.01 62.33 170 0.1 1 7
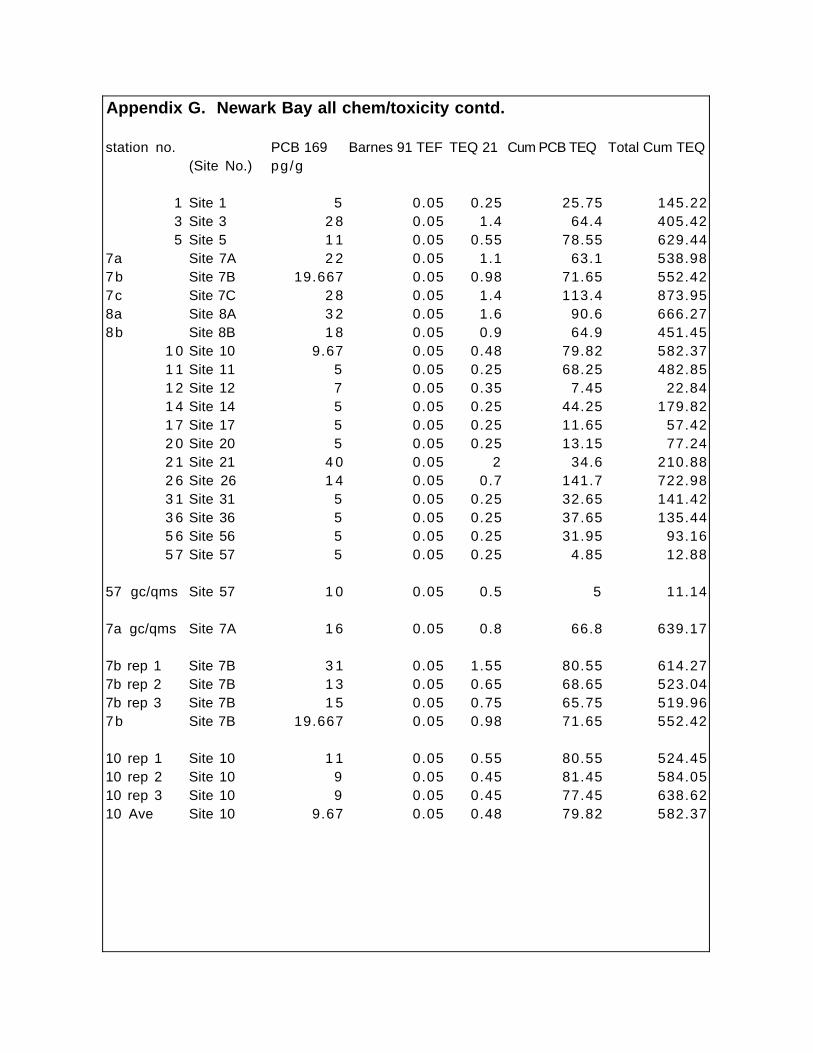
Appendix G. Newark Bay all chem/toxicity contd.
station no. PCB 169 Barnes 91 TEF TEQ 21 Cum PCB TEQ Total Cum TEQ(Site No.) pg/g
1 Site 1 5 0.05 0.25 25.75 145.223 Site 3 2 8 0.05 1.4 64.4 405.425 Site 5 1 1 0.05 0.55 78.55 629.44
7a Site 7A 2 2 0.05 1.1 63.1 538.987b Site 7B 19.667 0.05 0.98 71.65 552.427c Site 7C 2 8 0.05 1.4 113.4 873.958a Site 8A 3 2 0.05 1.6 90.6 666.278b Site 8B 1 8 0.05 0.9 64.9 451.45
1 0 Site 10 9.67 0.05 0.48 79.82 582.371 1 Site 11 5 0.05 0.25 68.25 482.851 2 Site 12 7 0.05 0.35 7.45 22.841 4 Site 14 5 0.05 0.25 44.25 179.821 7 Site 17 5 0.05 0.25 11.65 57.422 0 Site 20 5 0.05 0.25 13.15 77.242 1 Site 21 4 0 0.05 2 34.6 210.882 6 Site 26 1 4 0.05 0.7 141.7 722.983 1 Site 31 5 0.05 0.25 32.65 141.423 6 Site 36 5 0.05 0.25 37.65 135.445 6 Site 56 5 0.05 0.25 31.95 93.165 7 Site 57 5 0.05 0.25 4.85 12.88
57 gc/qms Site 57 1 0 0.05 0.5 5 11.14
7a gc/qms Site 7A 1 6 0.05 0.8 66.8 639.17
7b rep 1 Site 7B 3 1 0.05 1.55 80.55 614.277b rep 2 Site 7B 1 3 0.05 0.65 68.65 523.047b rep 3 Site 7B 1 5 0.05 0.75 65.75 519.967b Site 7B 19.667 0.05 0.98 71.65 552.42
10 rep 1 Site 10 1 1 0.05 0.55 80.55 524.4510 rep 2 Site 10 9 0.05 0.45 81.45 584.0510 rep 3 Site 10 9 0.05 0.45 77.45 638.6210 Ave Site 10 9.67 0.05 0.48 79.82 582.37

Appendix G. Newark Bay all chem/toxicity contd.
NFCRC No. Field station ID Hexachloro- Pentachloro- Alpha-BHC, Lindane,benzene, ng/g anisole, ng/g ng/g ng/g
9561 STATION #1 0.9 0.4 1.3 0.19562 STATION #3 3 0.7 1 0.79563 STATION #5 5.6 0.8 2.4 0.19593 STATION #7A 6.6 0.7 0.8 0.19594 STATION #7B 5.3 0.8 1.2 0.19595 STATION #7C 6.3 0.6 0.7 0.19596 STATION #8A 7.6 0.7 0.9 0.19597 STATION #8B 3.9 0.8 0.9 0.1
9564* STATION #10 7 0.7 1.7 0.19565 STATION #11 10.1 0.6 2 0.19566 STATION #12 0.1 0.1 0.1 0.19567 STATION #14 2.6 0.4 1.5 0.19598 STATION #17 1.6 0.3 0.6 0.19568 STATION #20 2 0.1 0.5 0.19569 STATION #21 2 0.4 0.4 0.99570 STATION #26 5.2 0.3 0.7 0.99526 STATION #31 5.6 0.5 1.5 0.99529 STATION #36 4 0.4 0.9 0.19528 STATION #56 1 0.4 0.6 0.69527 STATION #57 0.1 0.1 0.5 0.1
*Values are average of GC Replicate injections.
MDL = 0.11 ng/g; MQL = 0.26 ng/g.DUP = Duplicate sample

Appendix G. Newark Bay all chem/toxicity contd.
NFCRC No. Field station ID Beta-BHC, Heptachlor, Delta-BHC, Dacthal, Oxychlordane,ng/g ng/g ng/g ng/g ng/g
9561 STATION #1 0.1 0.1 1.2 2.3 0.39562 STATION #3 0.4 0.1 1 2 0.49563 STATION #5 0.5 0.1 3 2.3 0.89593 STATION #7A 0.1 0.1 3.8 2.4 0.69594 STATION #7B 0.1 0.1 3.5 1.6 0.59595 STATION #7C 0.1 0.1 3.1 2 0.59596 STATION #8A 0.7 0.1 3.2 1.5 0.59597 STATION #8B 0.3 0.5 3.5 2.1 1.3
9564* STATION #10 0.1 0.1 3.2 2.1 0.39565 STATION #11 0.1 0.1 3.8 3.3 0.59566 STATION #12 0.1 0.1 0.1 1.2 0.19567 STATION #14 0.1 0.1 1.5 2.5 0.49598 STATION #17 0.8 1.3 0.6 2.7 0.19568 STATION #20 0.9 0.1 0.9 2.7 0.49569 STATION #21 0.3 0.1 1.6 2.8 0.69570 STATION #26 0.1 0.1 1.6 4.4 0.39526 STATION #31 0.1 0.1 2.7 1.4 0.19529 STATION #36 0.1 0.1 1.7 1.6 0.19528 STATION #56 0.7 0.1 1.9 1.8 0.19527 STATION #57 0.5 0.1 1.6 1.4 0.1
*Values are average of GC Replicate injections.
MDL = 0.11 ng/g; MQL = 0.26 ng/g.DUP = Duplicate sample

Appendix G. Newark Bay all chem/toxicity contd.
NFCRC No. Field station ID Heptachlor epoxide, trans-chlordane, trans-nonachlor,ng/g ng/g ng/g
9561 STATION #1 2.8 11.5 7.29562 STATION #3 8.5 31.7 15.89563 STATION #5 1 3 42.5 30.59593 STATION #7A 9.9 36.3 19.29594 STATION #7B 10.9 40.4 17.79595 STATION #7C 10.6 42.1 18.29596 STATION #8A 10.6 42.7 17.19597 STATION #8B 12.9 41.8 28.3
9564* STATION #10 7 25.1 17.99565 STATION #11 8 26.5 16.99566 STATION #12 0.4 1.1 0.69567 STATION #14 2.9 7.7 5.69598 STATION #17 1.1 2.2 1.29568 STATION #20 0.9 2.4 1.79569 STATION #21 1 3.6 2.99570 STATION #26 4.7 13.8 12.49526 STATION #31 1.7 5.7 4.89529 STATION #36 1.7 6.3 4.19528 STATION #56 1.7 5.8 49527 STATION #57 0.4 0.6 0.9
*Values are average of GC Replicate injections.
MDL = 0.11 ng/g; MQL = 0.26 ng/g.DUP = Duplicate sample

Appendix G. Newark Bay all chem/toxicity contd.
NFCRC No. Field station ID cis-chlordane, o,p'-DDE, Dieldrin, p,p'-DDE, o,p'-DDD,ng/g ng/g ng/g ng/g ng/g
9561 STATION #1 12.3 1.9 4.9 13.8 8.89562 STATION #3 34.3 4 12.9 51.6 37.49563 STATION #5 59.7 16.7 21.2 60.7 40.49593 STATION #7A 42.3 5.9 12.7 4 9 31.29594 STATION #7B 48.7 6.4 13.3 5 3 27.29595 STATION #7C 53.2 1 6 15.6 57.7 35.59596 STATION #8A 49.2 7.1 13.9 55.6 31.39597 STATION #8B 56.6 8.7 19.1 5 0 31.1
9564* STATION #10 28.8 11.2 1 0 71.8 2 69565 STATION #11 2 9 9.2 12.4 53.3 25.29566 STATION #12 1.4 0.8 0.9 3.9 0.89567 STATION #14 1 0 3.8 5.4 22.7 8.59598 STATION #17 2.6 1.5 1.7 9.5 2.29568 STATION #20 3.1 6.7 1.8 19.4 4.29569 STATION #21 3 8.4 5.5 24.4 4.49570 STATION #26 12.2 14.3 15.2 72.1 11.99526 STATION #31 7.2 8.3 3 37.1 1 49529 STATION #36 8.9 7 6.2 31.5 13.69528 STATION #56 6.3 8.6 3.6 37.1 16.79527 STATION #57 1 0.3 1 3.3 1.1
*Values are average of GC Replicate injections.
MDL = 0.11 ng/g; MQL = 0.26 ng/g.DUP = Duplicate sample
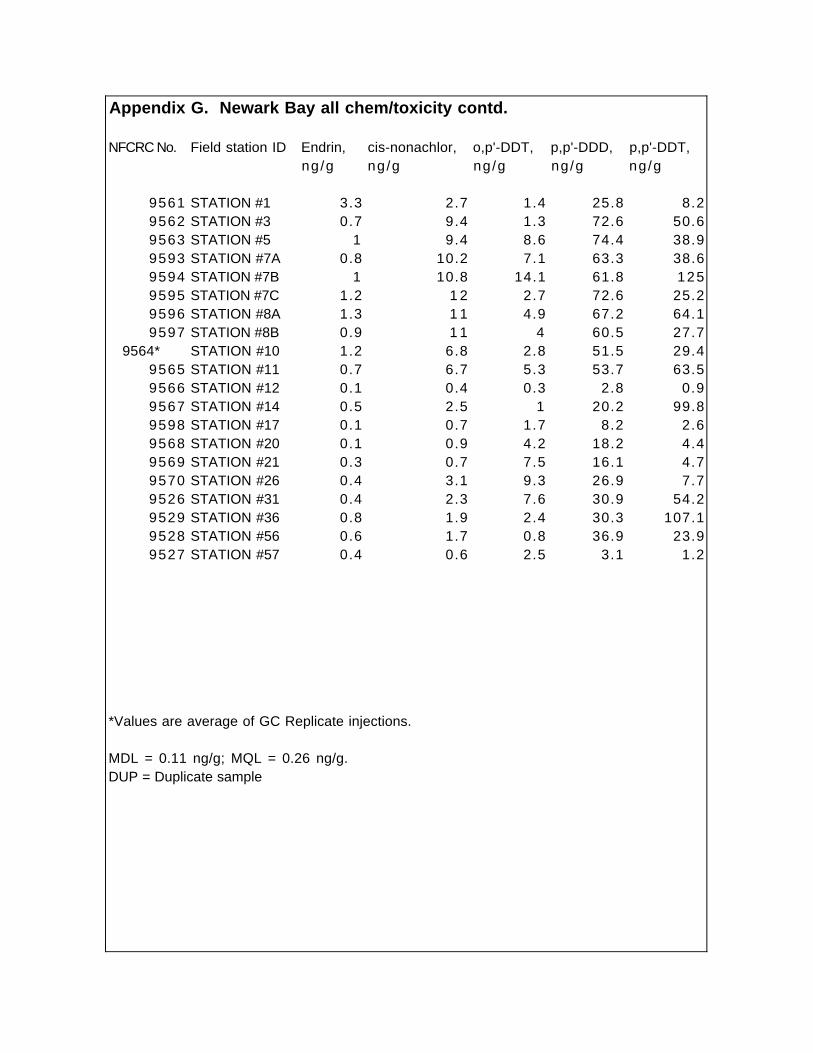
Appendix G. Newark Bay all chem/toxicity contd.
NFCRC No. Field station ID Endrin, cis-nonachlor, o,p'-DDT, p,p'-DDD, p,p'-DDT,ng/g ng/g ng/g ng/g ng/g
9561 STATION #1 3.3 2.7 1.4 25.8 8.29562 STATION #3 0.7 9.4 1.3 72.6 50.69563 STATION #5 1 9.4 8.6 74.4 38.99593 STATION #7A 0.8 10.2 7.1 63.3 38.69594 STATION #7B 1 10.8 14.1 61.8 1259595 STATION #7C 1.2 1 2 2.7 72.6 25.29596 STATION #8A 1.3 1 1 4.9 67.2 64.19597 STATION #8B 0.9 1 1 4 60.5 27.7
9564* STATION #10 1.2 6.8 2.8 51.5 29.49565 STATION #11 0.7 6.7 5.3 53.7 63.59566 STATION #12 0.1 0.4 0.3 2.8 0.99567 STATION #14 0.5 2.5 1 20.2 99.89598 STATION #17 0.1 0.7 1.7 8.2 2.69568 STATION #20 0.1 0.9 4.2 18.2 4.49569 STATION #21 0.3 0.7 7.5 16.1 4.79570 STATION #26 0.4 3.1 9.3 26.9 7.79526 STATION #31 0.4 2.3 7.6 30.9 54.29529 STATION #36 0.8 1.9 2.4 30.3 107.19528 STATION #56 0.6 1.7 0.8 36.9 23.99527 STATION #57 0.4 0.6 2.5 3.1 1.2
*Values are average of GC Replicate injections.
MDL = 0.11 ng/g; MQL = 0.26 ng/g.DUP = Duplicate sample

Appendix G. Newark Bay all chem/toxicity contd.
NFCRC No. Field station ID mirex, total PCBs, total DDTs, Total cPCB, Total mPCB, ng/g ng/g ng/g ng/g ng/g
9561 STATION #1 8.4 320 59.8 208.91 23.399562 STATION #3 25.2 2850.2 217.5 2046.09 69.849563 STATION #5 23.1 1799.6 239.8 967.94 67.939593 STATION #7A 14.3 1206.3 195.1 622.49 52.149594 STATION #7B 12.8 1362.7 287.4 1038.48 85.319595 STATION #7C 1 4 1454.3 209.6 863.19 60.019596 STATION #8A 13.5 1609 230.2 891.56 68.169597 STATION #8B 19.6 1340.7 182 808.12 61.38
9564* STATION #10 11.5 1324.3 192.6 1129.52 72.59565 STATION #11 11.4 1087.4 210.2 567.34 46.559566 STATION #12 0.7 109.7 9.5 43.68 5.779567 STATION #14 3.9 671 155.9 286.53 38.989598 STATION #17 2.4 206.7 25.8 76.46 10.129568 STATION #20 3.4 400 57.2 152.1 2.539569 STATION #21 3 539.4 65.3 238.24 19.299570 STATION #26 3.3 2318 142.2 1289.81 15.789526 STATION #31 3.2 564.9 152.2 243.53 23.359529 STATION #36 3.6 576.5 191.9 278.7 23.279528 STATION #56 3.2 484.9 124 181.79 16.979527 STATION #57 1.6 105.5 11.4 15.76 3
7b 942.78 77.227b 963.64 76.777b 1209.01 101.937b ave. 1038.48 85.31
1 0 1100.97 70.981 0 1219.92 75.961 0 1067.67 70.57
10 ave. 1129.52 72.5
*Values are average of GC Replicate injections.
MDL = 0.11 ng/g; MQL = 0.26 ng/g.DUP = Duplicate sample
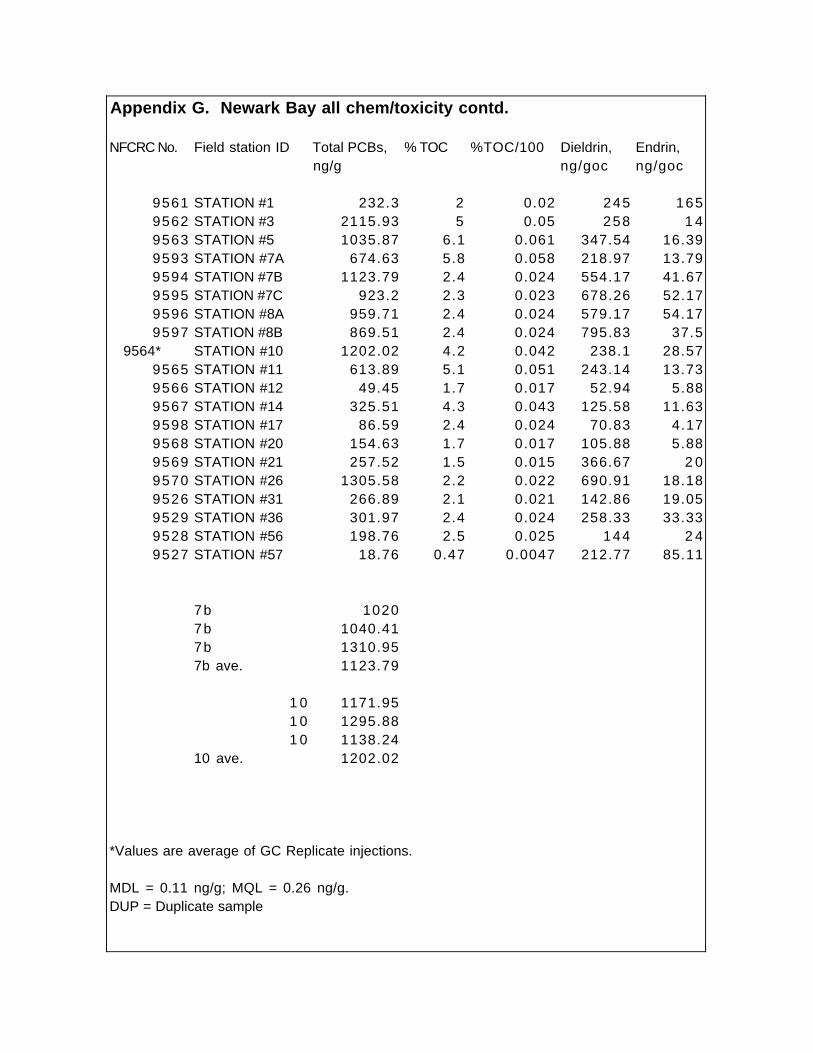
Appendix G. Newark Bay all chem/toxicity contd.
NFCRC No. Field station ID Total PCBs, % TOC %TOC/100 Dieldrin, Endrin, ng/g ng/goc ng/goc
9561 STATION #1 232.3 2 0.02 245 1659562 STATION #3 2115.93 5 0.05 258 1 49563 STATION #5 1035.87 6.1 0.061 347.54 16.399593 STATION #7A 674.63 5.8 0.058 218.97 13.799594 STATION #7B 1123.79 2.4 0.024 554.17 41.679595 STATION #7C 923.2 2.3 0.023 678.26 52.179596 STATION #8A 959.71 2.4 0.024 579.17 54.179597 STATION #8B 869.51 2.4 0.024 795.83 37.5
9564* STATION #10 1202.02 4.2 0.042 238.1 28.579565 STATION #11 613.89 5.1 0.051 243.14 13.739566 STATION #12 49.45 1.7 0.017 52.94 5.889567 STATION #14 325.51 4.3 0.043 125.58 11.639598 STATION #17 86.59 2.4 0.024 70.83 4.179568 STATION #20 154.63 1.7 0.017 105.88 5.889569 STATION #21 257.52 1.5 0.015 366.67 2 09570 STATION #26 1305.58 2.2 0.022 690.91 18.189526 STATION #31 266.89 2.1 0.021 142.86 19.059529 STATION #36 301.97 2.4 0.024 258.33 33.339528 STATION #56 198.76 2.5 0.025 144 2 49527 STATION #57 18.76 0.47 0.0047 212.77 85.11
7b 10207b 1040.417b 1310.957b ave. 1123.79
1 0 1171.951 0 1295.881 0 1138.24
10 ave. 1202.02
*Values are average of GC Replicate injections.
MDL = 0.11 ng/g; MQL = 0.26 ng/g.DUP = Duplicate sample

Appendix G. Newark Bay all chem/toxicity contd.
NFCRC No. Field station ID Dieldrin, Endrin, p,p-DDE, p,p-DDE, tDDTs, ng/gocug/goc ug/goc ng/goc ug/goc
9561 Station 1, 3/93 0.245 0.165 690 0.69 29909562 Station 3, 3/93 0.258 0.014 1032 1.03 43509563 Station 5, 3/93 0.348 0.016 995.08 1 3931.159593 Sta. 7A, 3/93, h 0.219 0.014 844.83 0.84 3363.799594 Station 7B, 3/93 0.554 0.042 2208.33 2.21 119759595 Station 7C, 3/93 0.678 0.052 2508.7 2.51 9113.049596 Station 8A, 3/93 0.579 0.054 2316.67 2.32 9591.679597 Station 8B, 3/93 0.796 0.038 2083.33 2.08 7583.33
9564* Station 10, 3/93 0.238 0.029 1709.52 1.71 4585.719565 Station 11, 3/93 0.243 0.014 1045.1 1.05 4121.579566 Station 12, 3/93 0.053 0.006 229.41 0.23 558.829567 Station 14, 3/93 0.126 0.012 527.91 0.53 3625.589598 Station 17, 3/93 0.071 0.004 395.83 0.4 10759568 Station 20, 3/93 0.106 0.006 1141.18 1.14 3364.719569 Station 21, 3/93 0.367 0.02 1626.67 1.63 4353.339570 Station 26, 3/93 0.691 0.018 3277.27 3.28 6463.649526 Sta. 31, 1/93, H 0.143 0.019 1766.67 1.77 7247.629529 Sta. 36, 1/93 0.258 0.033 1312.5 1.31 7995.839528 Sta. 56, 1/93, H 0.144 0.024 1484 1.48 49609527 Sta. 57, 1/93 0.213 0.085 702.13 0.7 2425.53

Appendix G. Newark Bay all chem/toxicity contd.
Lab no. Station No. tDDTs, tPCB, ng/goc tPCB, ug/goc TOC(%) total AVS,ug/goc umol/g
9581 STATION #1 2.99 11615 11.62 2 0.989582 STATION #3 4.35 42319 42.32 5 13.99583 STATION #5 3.93 16981 16.98 6.1 29.69605 STATION #7A 3.36 11632 11.63 5.8 20.89607 STATION #7B 11.98 46825 46.82 2.4 3 39608 STATION #7C 9.11 40139 40.14 2.3 54.99609 STATION #8A 9.59 39988 39.99 2.4 62.99610 STATION #8B 7.58 36230 36.23 2.4 9.69584 STATION #10 4.59 28620 28.62 4.2 20.49585 STATION #11 4.12 12037 12.04 5.1 20.19586 STATION #12 0.56 2908.8 2.91 1.7 7.79587 STATION #14 3.63 7570 7.57 4.3 3 59611 STATION #17 1.08 3607.9 3.61 2.4 6.69588 STATION #20 3.36 9095.9 9.1 1.7 11.19589 STATION #21 4.35 17168 17.17 1.5 99590 STATION #26 6.46 59345 59.34 2.2 32.29535 STATION #31 7.25 12709 12.71 2.1 4.19539 STATION #36 8 12582 12.58 2.4 14.69538 STATION #56 4.96 7950.4 7.95 2.5 49536 STATION #57 2.43 3991.5 3.99 0.47 5.2
9606 STATION #7A 2.5 13.6
9534 STATION #31 2.8 6.7
9537 STATION #56 3.2 6.5
9163 STATION #57 2.2 32.6

Appendix G. Newark Bay all chem/toxicity contd.
Lab no. Station No. SE Ag, ug/g dw SE As, ug/g dw SE Al, ug/g dw
9581 Station 1, 3/93 0.113 0.61 5779582 Station 3, 3/93 0.153 0.79 15099583 Station 5, 3/93 0.384 1.14 25289605 Sta. 7A, 3/93, homogenized 0.335 2.01 26139607 Station 7B, 3/93 0.42 1.56 25719608 Station 7C, 3/93 0.643 1.35 32269609 Station 8A, 3/93 0.678 1.16 32189610 Station 8B, 3/93 0.437 1.75 23999584 Station 10, 3/93 0.752 2.13 29339585 Station 11, 3/93 0.686 2.44 28699586 Station 12, 3/93 0.097 0.99 11689587 Station 14, 3/93 0.501 1.16 20289611 Station 17, 3/93 0.099 1.36 7579588 Station 20, 3/93 0.218 1 10529589 Station 21, 3/93 0.113 1.44 8829590 Station 26, 3/93 0.378 1.89 17879535 Sta. 31, 1/93, Homogenized 0.368 2.34 12959539 Sta. 36, 1/93 0.356 2.38 17439538 Sta. 56, 1/93, Homogenized 0.761 4.05 19219536 Sta. 57, 1/93 0.204 1.59 465
9606 STATION #7A 0.284 1.64 2009
9534 STATION #31 0.372 3.09 1757
9537 STATION #56 0.736 4.51 1976
9163 STATION #57 0.431 1.45 1573

Appendix G. Newark Bay all chem/toxicity contd.
Lab no. Station No. SE Cd, ug/g dw SE Cr, ug/g dw SE Cu, ug/g dw SE Fe, ug/g dw
9581 Station 1, 3/93 1.02 1 1 17.3 27209582 Station 3, 3/93 2.54 44.6 28.1 58709583 Station 5, 3/93 3.76 64.6 38.5 98109605 Sta. 7A, 3/93, homogenized 3.97 63.5 54.8 103009607 Station 7B, 3/93 3.62 61.4 42.2 95309608 Station 7C, 3/93 4.49 77.3 27.1 109009609 Station 8A, 3/93 4.86 81.7 2 3 115009610 Station 8B, 3/93 3.75 53.3 75.8 95509584 Station 10, 3/93 3.6 115 53.3 85109585 Station 11, 3/93 3.16 87.9 77.4 111009586 Station 12, 3/93 0.383 13.6 10.8 59709587 Station 14, 3/93 2.02 7 9 15.1 82809611 Station 17, 3/93 0.55 52.4 1 4 29509588 Station 20, 3/93 0.839 41.2 16.8 36609589 Station 21, 3/93 0.98 70.2 17.4 25909590 Station 26, 3/93 3.19 173 13.9 52209535 Sta. 31, 1/93, Homogenized 0.965 39.9 42.3 42309539 Sta. 36, 1/93 1.06 40.7 47.8 66109538 Sta. 56, 1/93, Homogenized 0.978 33.3 68.4 72609536 Sta. 57, 1/93 0.245 7.62 11.7 3060
9606 STATION #7A 2.92 45.7 53.8 9100
9534 STATION #31 1.24 53.1 61.2 6280
9537 STATION #56 1.25 40.3 80.8 7920
9163 STATION #57 0.934 29.1 35.5 6840

Appendix G. Newark Bay all chem/toxicity contd.
lab. no. station no. SE Hg, ug/g dw SE Hg (1/2 mdl) SE Ni, SE Pb, ug/g dw ug/g dw
9581 Station 1, 3/93 <0.125 0.0625 3.87 81.89582 Station 3, 3/93 <0.125 0.0625 7.88 1969583 Station 5, 3/93 <0.125 0.0625 11.2 2509605 Sta. 7A, 3/93, homogenized<0.125 0.0625 12.1 2459607 Station 7B, 3/93 <0.125 0.0625 11.7 2319608 Station 7C, 3/93 <0.125 0.0625 12.2 2489609 Station 8A, 3/93 <0.125 0.0625 12.9 2619610 Station 8B, 3/93 <0.125 0.0625 11.8 2589584 Station 10, 3/93 <0.125 0.0625 11.4 2019585 Station 11, 3/93 <0.125 0.0625 12.3 2009586 Station 12, 3/93 <0.125 0.0625 3.62 34.39587 Station 14, 3/93 <0.125 0.0625 8.55 81.29611 Station 17, 3/93 <0.125 0.0625 3.06 33.49588 Station 20, 3/93 <0.125 0.0625 4.26 59.59589 Station 21, 3/93 <0.125 0.0625 2.99 57.89590 Station 26, 3/93 <0.125 0.0625 6.49 1409535 Sta. 31, 1/93, Homogenized<0.125 0.0625 6.15 78.29539 Sta. 36, 1/93 <0.125 0.0625 7.06 94.19538 Sta. 56, 1/93, Homogenized<0.125 0.0625 10.1 1319536 Sta. 57, 1/93 <0.125 0.0625 2.8 29.4
9606 Sta. 7A, 3/93, direct <0.125 0.0625 10.2 244
9534 Sta. 31, 1/93, Direct <0.125 0.0625 7.71 108
9537 Sta. 56, 1/93, Direct <0.125 0.0625 9.41 136
9163 Sta. 57, 10/27/92 <0.125 0.0625 18.6 91.7

Appendix G. Newark Bay all chem/toxicity contd.
lab. no. station no. SE Sb, SE Sb SE Sn, SE Se, SE Se ug/g dw (1/2mdl) ug/g dw ug/g dw (1/2 mdl)
9581 Station 1, 3/93 <2.0 1 9.55 <0.381 0.199582 Station 3, 3/93 <2.0 1 19.4 <0.381 0.199583 Station 5, 3/93 2.88 2.88 25.7 <0.381 0.199605 Sta. 7A, 3/93, homogenized 2.1 2.1 26.1 <0.381 0.199607 Station 7B, 3/93 2.01 2.01 25.6 <0.381 0.199608 Station 7C, 3/93 2.06 2.06 27.8 <0.381 0.199609 Station 8A, 3/93 2.16 2.16 33.4 <0.381 0.199610 Station 8B, 3/93 2.23 2.23 28.9 <0.381 0.199584 Station 10, 3/93 <2.0 1 24.8 <0.381 0.199585 Station 11, 3/93 3.28 3.28 23.7 <0.381 0.199586 Station 12, 3/93 <2.0 1 2.46 <0.381 0.199587 Station 14, 3/93 <2.0 1 8.93 <0.381 0.199611 Station 17, 3/93 <2.0 1 3.68 <0.381 0.199588 Station 20, 3/93 <2.0 1 8.34 <0.381 0.199589 Station 21, 3/93 <2.0 1 9.41 <0.381 0.199590 Station 26, 3/93 <2.0 1 9.81 <0.381 0.199535 Sta. 31, 1/93, Homogenized <2.0 1 19.6 <0.381 0.199539 Sta. 36, 1/93 <2.0 1 1 1 <0.381 0.199538 Sta. 56, 1/93, Homogenized <2.0 1 10.8 <0.381 0.199536 Sta. 57, 1/93 <2.0 1 2.48 <0.381 0.19
9606 Sta. 7A, 3/93, direct <2.0 1 23.5 <0.381 0.19
9534 Sta. 31, 1/93, Direct 2.26 2.26 11.9 <0.381 0.19
9537 Sta. 56, 1/93, Direct 2.05 2.05 13.5 <0.381 0.19
9163 Sta. 57, 10/27/92 2.41 2.41 7.76 <0.381 0.19

Appendix G. Newark Bay all chem/toxicity contd.
lab. no. station no. SE Zn, SEM/AVS ratio Cd as % SEM Cu as % SEMug/g dw
9581 Station 1, 3/93 134 2.85 108 5 79582 Station 3, 3/93 341 0.49 7 6 2 29583 Station 5, 3/93 444 0.3 7 8 1 79605 Sta. 7A, 3/93, homogenized 446 0.44 8 6 3 19607 Station 7B, 3/93 435 0.26 7 6 2 39608 Station 7C, 3/93 495 0.17 8 4 1 29609 Station 8A, 3/93 526 0.16 8 5 1 09610 Station 8B, 3/93 465 1.02 8 2 4 19584 Station 10, 3/93 353 0.36 7 8 2 69585 Station 11, 3/93 339 0.38 8 0 4 19586 Station 12, 3/93 5 6 0.16 8 0 3 59587 Station 14, 3/93 185 0.1 7 7 1 39611 Station 17, 3/93 74.3 0.24 8 7 4 59588 Station 20, 3/93 91.4 0.18 9 2 2 89589 Station 21, 3/93 99.8 0.069 7 0 2 19590 Station 26, 3/93 212 0.133 7 5 1 09535 Sta. 31, 1/93, Homogenized 115 0.71 8 0 5 19539 Sta. 36, 1/93 127 0.22 7 3 4 29538 Sta. 56, 1/93, Homogenized 149 1.04 1 9 5 99536 Sta. 57, 1/93 199 0.66 132 8 0
9606 Sta. 7A, 3/93, direct 401 0.61 8 9 3 8
9534 Sta. 31, 1/93, Direct 144 0.57 ---b ---
9537 Sta. 56, 1/93, Direct 163 0.71 --- ---
9163 Sta. 57, 10/27/92 122 0.098 7 6 3 9

Appendix G. Newark Bay all chem/toxicity contd.
lab. no. station no. Pb as % SEM Ni as % SEM Zn as % SEM total Ag, ug/g
9581 Station 1, 3/93 8 2 2 2 100 1.549582 Station 3, 3/93 8 0 2 2 8 3 1.999583 Station 5, 3/93 7 3 2 4 7 9 4.169605 Sta. 7A, 3/93, homogenized 8 5 2 5 9 9 4.989607 Station 7B, 3/93 8 1 2 4 8 1 4.399608 Station 7C, 3/93 8 0 2 6 8 3 5.59609 Station 8A, 3/93 8 4 2 6 8 2 5.749610 Station 8B, 3/93 7 3 2 7 8 3 5.649584 Station 10, 3/93 7 8 2 1 7 5 5.029585 Station 11, 3/93 8 3 2 4 7 9 3.119586 Station 12, 3/93 5 4 1 3 5 8 <0.739587 Station 14, 3/93 6 5 2 3 6 5 3.199611 Station 17, 3/93 8 1 1 1 7 4 <0.739588 Station 20, 3/93 6 8 1 9 1 3 1.399589 Station 21, 3/93 6 9 1 4 6 2 1.199590 Station 26, 3/93 8 8 2 4 6 9 3.439535 Sta. 31, 1/93, Homogenized 8 2 1 4 6 6 2.229539 Sta. 36, 1/93 7 6 1 4 5 9 2.899538 Sta. 56, 1/93, Homogenized 9 7 1 4 6 5 3.249536 Sta. 57, 1/93 9 3 7 356 0.843
9606 Sta. 7A, 3/93, direct 9 1 2 7 8 5 4.32
9534 Sta. 31, 1/93, Direct --- --- --- ---b
9537 Sta. 56, 1/93, Direct --- --- --- ---
9163 Sta. 57, 10/27/92 8 8 1 0 6 5 3.26

Appendix G. Newark Bay all chem/toxicity contd.
lab. no. station no. total As, ug/g total Al, ug/g total Cd, ug/g total Cr, ug/g
9581 Station 1, 3/93 1.94 32400 0.941 29.89582 Station 3, 3/93 4.68 39800 3.35 75.59583 Station 5, 3/93 9.17 54800 4.81 1379605 Sta. 7A, 3/93, homogenized 10.2 54300 4.6 1349607 Station 7B, 3/93 9.97 61900 4.73 1379608 Station 7C, 3/93 11.4 61400 5.31 1889609 Station 8A, 3/93 11.8 56000 5.69 1749610 Station 8B, 3/93 8.03 50000 4.56 1349584 Station 10, 3/93 15.1 64100 4.64 2179585 Station 11, 3/93 15.8 62700 3.96 1849586 Station 12, 3/93 8.19 45800 0.476 5 99587 Station 14, 3/93 14.2 62600 2.61 2139611 Station 17, 3/93 7.06 38800 0.633 1119588 Station 20, 3/93 8.02 51500 0.91 96.39589 Station 21, 3/93 12.8 39300 1.39 1359590 Station 26, 3/93 16.7 47700 4.23 2779535 Sta. 31, 1/93, Homogenized 9.83 55600 1.2 1069539 Sta. 36, 1/93 13.4 65200 1.46 1229538 Sta. 56, 1/93, Homogenized 13.6 64100 1.29 1049536 Sta. 57, 1/93 6.64 32100 0.186 35.7
9606 Sta. 7A, 3/93, direct 7.71 46100 3.29 102
9534 Sta. 31, 1/93, Direct 14.1 --- --- ---
9537 Sta. 56, 1/93, Direct 15.4 --- --- ---
9163 Sta. 57, 10/27/92 12.4 53500 1.23 110

Appendix G. Newark Bay all chem/toxicity contd.
lab. no. station no. total Cu, ug/g total Fe, ug/g total Hg, ug/g total Pb, ug/g
9581 Station 1, 3/93 14700 0.359 1009582 Station 3, 3/93 125 25100 3.16 2469583 Station 5, 3/93 224 35000 2.4 3449605 Sta. 7A, 3/93, homogenized 178 38800 2.28 2899607 Station 7B, 3/93 184 38100 2.46 2849608 Station 7C, 3/93 217 39500 2.91 3109609 Station 8A, 3/93 232 41300 3.26 3109610 Station 8B, 3/93 185 35600 2.09 3539584 Station 10, 3/93 206 40900 3.58 2599585 Station 11, 3/93 191 44400 3.18 2419586 Station 12, 3/93 30.8 30400 0.665 63.59587 Station 14, 3/93 114 42700 4.29 1259611 Station 17, 3/93 3 1 27300 1.07 4 19588 Station 20, 3/93 58.8 27500 1.92 87.29589 Station 21, 3/93 82.5 21900 1.9 84.29590 Station 26, 3/93 141 28500 3.89 1599535 Sta. 31, 1/93, Homogenized 82.4 29300 1.51 95.99539 Sta. 36, 1/93 113 37200 1.89 1249538 Sta. 56, 1/93, Homogenized 116 38600 1.46 1359536 Sta. 57, 1/93 14.7 13800 0.14 31.7
9606 Sta. 7A, 3/93, direct 143 34700 2.23 268
9534 Sta. 31, 1/93, Direct --- --- 2.34 ---
9537 Sta. 56, 1/93, Direct --- --- 1.79 ---
9163 Sta. 57, 10/27/92 91.8 27600 1.18 104
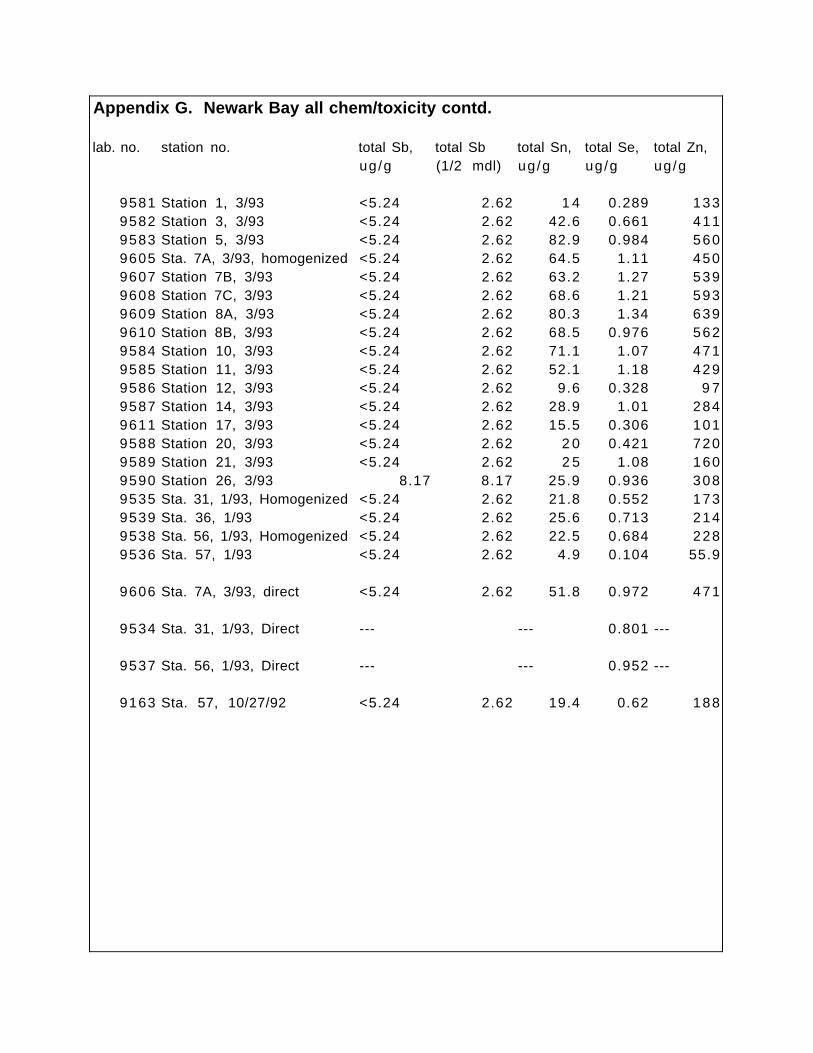
Appendix G. Newark Bay all chem/toxicity contd.
lab. no. station no. total Sb, total Sb total Sn, total Se, total Zn, ug/g (1/2 mdl) ug/g ug/g ug/g
9581 Station 1, 3/93 <5.24 2.62 1 4 0.289 1339582 Station 3, 3/93 <5.24 2.62 42.6 0.661 4119583 Station 5, 3/93 <5.24 2.62 82.9 0.984 5609605 Sta. 7A, 3/93, homogenized <5.24 2.62 64.5 1.11 4509607 Station 7B, 3/93 <5.24 2.62 63.2 1.27 5399608 Station 7C, 3/93 <5.24 2.62 68.6 1.21 5939609 Station 8A, 3/93 <5.24 2.62 80.3 1.34 6399610 Station 8B, 3/93 <5.24 2.62 68.5 0.976 5629584 Station 10, 3/93 <5.24 2.62 71.1 1.07 4719585 Station 11, 3/93 <5.24 2.62 52.1 1.18 4299586 Station 12, 3/93 <5.24 2.62 9.6 0.328 9 79587 Station 14, 3/93 <5.24 2.62 28.9 1.01 2849611 Station 17, 3/93 <5.24 2.62 15.5 0.306 1019588 Station 20, 3/93 <5.24 2.62 2 0 0.421 7209589 Station 21, 3/93 <5.24 2.62 2 5 1.08 1609590 Station 26, 3/93 8.17 8.17 25.9 0.936 3089535 Sta. 31, 1/93, Homogenized <5.24 2.62 21.8 0.552 1739539 Sta. 36, 1/93 <5.24 2.62 25.6 0.713 2149538 Sta. 56, 1/93, Homogenized <5.24 2.62 22.5 0.684 2289536 Sta. 57, 1/93 <5.24 2.62 4.9 0.104 55.9
9606 Sta. 7A, 3/93, direct <5.24 2.62 51.8 0.972 471
9534 Sta. 31, 1/93, Direct --- --- 0.801 ---
9537 Sta. 56, 1/93, Direct --- --- 0.952 ---
9163 Sta. 57, 10/27/92 <5.24 2.62 19.4 0.62 188

Appendix G. Newark Bay all chem/toxicity contd.
lab no. station no. Cd SEM/AVS Cu SEM/AVS Pb SEM/AVS Ni SEM/AVS Zn SEM/AVS
9581 Station 1, 3/93 0.00925993 0.27782596 0.40286398 0.0672625 2.09170419582 Station 3, 3/93 0.00162575 0.03181591 0.06805695 0.0096561 0.37528499583 Station 5, 3/93 0.00113013 0.02047019 0.04076425 0.0064449 0.22946319605 Sta. 7A, 3/93, ho 0.00169809 0.04146389 0.05685046 0.0099086 0.32801459607 Station 7B, 3/93 0.00097595 0.02012571 0.03378541 0.0060389 0.20164949608 Station 7C, 3/93 0.00072763 0.00776872 0.02180271 0.0037851 0.13792869609 Station 8A, 3/93 0.00068742 0.0057548 0.02002724 0.0034932 0.12792549610 Station 8B, 3/93 0.00347531 0.12426555 0.12971186 0.0209362 0.74097459584 Station 10, 3/93 0.00157002 0.04111969 0.0475551 0.0095184 0.26470749585 Station 11, 3/93 0.0013987 0.0606035 0.04802475 0.0104231 0.25800329586 Station 12, 3/93 0.00044253 0.02207424 0.02149981 0.0080077 0.11125489587 Station 14, 3/93 0.00051347 0.00678987 0.01119745 0.0041609 0.08085849611 Station 17, 3/93 0.0007414 0.03338389 0.02442495 0.0078971 0.17221329588 Station 20, 3/93 0.00067247 0.02381985 0.02587171 0.0065369 0.12596359589 Station 21, 3/93 0.00096876 0.03042703 0.03099678 0.0056587 0.00064769590 Station 26, 3/93 0.00088139 0.00679378 0.02098473 0.003433 0.10071679535 Sta. 31, 1/93, Ho 0.002094 0.16237131 0.09205643 0.0255493 0.42907739539 Sta. 36, 1/93 0.00064593 0.05152617 0.03110771 0.0082364 0.13306769538 Sta. 56, 1/93, Ho 0.00217527 0.26912181 0.15806747 0.043008 0.56983339536 Sta. 57, 1/93 0.00041918 0.03541076 0.02728822 0.0091716 0.585425
0883PH9606 Sta. 7A, 3/93, dir 0.00191019 0.06225814 0.08659287 0.0127747 0.4510524
9534 Sta. 31, 1/93, Dir 0.00164657 0.14375714 0.0778001 0.0196005 0.3287829
9537 Sta. 56, 1/93, Dir 0.00171092 0.19563691 0.10098497 0.0246584 0.3836152
9163 Sta. 57, 10/27/9 0.0002549 0.01713813 0.01357635 0.0097181 0.0572485

station no.(Site No.)
1 Site 1 3 Site 3 5 Site 5
7a Site 7A 7b Site 7B 7c Site 7C 8a Site 8A 8b Site 8B
1 0 Site 10 1 1 Site 11 1 2 Site 12 1 4 Site 14 1 7 Site 17 2 0 Site 20 2 1 Site 21 2 6 Site 263 1 Site 31 3 6 Site 36 5 6 Site 56 5 7 Site 57
57 gc/qms Site 57
7a gc/qms Site 7A
7b rep 1 Site 7B 7b rep 2 Site 7B 7b rep 3 Site 7B 7b Site 7B
10 rep 1 Site 10 10 rep 2 Site 10 10 rep 3 Site 10 10 Ave Site 10

Appendix G. Newark Bay all chem/toxicity contd.
Lab Number: GC/MS Number: Analysis date Submitter no. % toc %toc/100 Naphthaleneng/g
9561 0902PH 1 / 2 6 / 9 4 Site 1 2 0.02 4209562 0976PH 6 / 2 / 9 4 Site 3 5 0.05 4309563 0977PH 6 / 2 / 9 4 Site 5 6.1 0.061 3209593 0990PH 6 / 8 / 9 4 Site 7A 5.8 0.058 3709594 0887PH 1 / 2 0 / 9 4 Site 7B 2.4 0.024 2509595 0898PH 1 / 2 6 / 9 4 Site 7C 2.3 0.023 2509596 0899PH 1 / 2 6 / 9 4 Site 8A 2.4 0.024 3109597 0900PH 1 / 2 6 / 9 4 Site 8B 2.4 0.024 250
Ave. 10 4.2 0.04 266.67Site 11 5.1 0.051 370Site 12 1.7 0.017 120
9565 0980PH 6 / 2 / 9 4 Site 14 4.3 0.043 6309566 0989PH 6 / 8 / 9 4 Site 17 2.4 0.024 3509567 0979PH 6 / 2 / 9 4 Site 20 1.7 0.017 5709598 0901PH 2 / 2 / 9 4 Site 21 1.5 0.015 6009568 0988PH 6 / 8 / 9 4 Site 26 2.2 0.022 2009569 0978PH 6 / 2 / 9 4 Site 31 2.1 0.021 1909570 0991PH 6 / 8 / 9 4 Site 36 2.4 0.024 1609526 0881PH 1 / 1 0 / 9 4 Site 56 2.5 0.025 120
9529b 0884PH 1 / 1 0 / 9 4 Site 57 0.47 0.0047 3 99528 0883PH 1 / 1 0 / 9 49527 0882PH 1 / 1 0 / 9 4
1941A 4001941A 380
SRM Rep 1 0992PH 6 / 8 / 9 4 1941A 400SRM Rep 2 0993PH 6 / 8 / 9 4 PC1 47.4646SRM Rep 3 0994PH 6 / 8 / 9 4 PC2 61.3302PC1 0975PH 6 / 2 / 9 4 MS1 390PC2 0987PH 6 / 8 / 9 4 MS2 270MS1 0974PH 6 / 2 / 9 4 MB1 11.7572MS2 0986PH 6 / 8 / 9 4 MB2 8.3604MB1 0973PH 6 / 2 / 9 4 PB1 0MB2 0985PH 6 / 8 / 9 4 PB2 29.303PB1 0972PH 6 / 2 / 9 4 PC1 1 5PB2 0984PH 6 / 8 / 9 4

Appendix G. Newark Bay all chem/toxicity contd.
Lab Number: Submitter no. Benzo(b)thiophene 2-Methyl naphthalene(1/2mdl), 1/2mdl, ng/g 1/2mdl, ng/g
9561 Site 1 8 14009562 Site 3 5 0 3609563 Site 5 5 0 2209593 Site 7A 5 0 2909594 Site 7B 1 0 3009595 Site 7C 1 0 1809596 Site 8A 1 1 2009597 Site 8B 1 2 230
Ave. 10 65.44 213.9Site 11 5 0 200Site 12 2 0 62.1
9565 Site 14 5 0 2609566 Site 17 7 3 29567 Site 20 2 0 1509598 Site 21 5 0 2009568 Site 26 2 0 78.4169569 Site 31 7 1109570 Site 36 7 1409526 Site 56 6 100
9529b Site 57 0.5 1 495289527
1941A 29.2756 2201941A 23.8318 210
SRM Rep 1 1941A 20.6338 200SRM Rep 2 PC1 2 59.321SRM Rep 3 PC2 2 70.2892PC1 MS1 380 540PC2 MS2 260 300MS1 MB1 2 5.425MS2 MB2 2 5.4882MB1 PB1 0 0MB2 PB2 1 0 1 0PB1 PC1 1 4 4PB2

Appendix G. Newark Bay all chem/toxicity contd.
Lab Number: Submitter no. 1-Methyl-naphthalene Biphenyl 2,6-/ 2,7-Dimethyl-1/2mdl, ng/g 1/2mdl, ng/g naphthalene, 1/2mdk, ng/g
9561 Site 1 2200 130 8509562 Site 3 260 120 2309563 Site 5 150 5 0 2209593 Site 7A 110 5 0 5 09594 Site 7B 180 6 6 1409595 Site 7C 7 7 4 6 1 59596 Site 8A 7 8 5 0 3 99597 Site 8B 130 5 1 5 2
Ave. 10 111.53 2 0 6 2Site 11 130 5 0 170Site 12 2 0 2 0 180
9565 Site 14 140 110 1709566 Site 17 4 9 4 8 2 69567 Site 20 94.578 57.11 6 69598 Site 21 130 5 0 1509568 Site 26 2 0 2 0 2 09569 Site 31 4 4 2 3 3 79570 Site 36 7 2 3 0 3 29526 Site 56 3 2 1 9 1 3
9529b Site 57 6 9 595289527
1941A 90.3906 67.5532 1401941A 97.7296 61.3412 140
SRM Rep 1 1941A 83.1484 65.3144 150SRM Rep 2 PC1 37.2004 25.8582 3 4SRM Rep 3 PC2 38.1146 43.9196 6 1PC1 MS1 550 380.398 790PC2 MS2 300 360 740MS1 MB1 2 2 2MS2 MB2 2 2 2MB1 PB1 0 28.179 1 0MB2 PB2 1 0 1 0 71.888PB1 PC1 2 2 1 1 0.5PB2

Appendix G. Newark Bay all chem/toxicity contd.
Lab Number: Submitter no. Acenaphthylene Acenaphthene Fluorene Dibenzothiophene1/2mdl, ng/g 1/2mdl, ng/g 1/2mdl, ng/g 1/2mdl, ng/g
9561 Site 1 280 1800 4000 19009562 Site 3 5 0 900 880 4309563 Site 5 5 0 240 240 179.99593 Site 7A 5 0 200 260 1709594 Site 7B 2 8 210 260 1609595 Site 7C 5 1 160 230 1109596 Site 8A 4 5 170 200 1109597 Site 8B 5 6 250 320 210
Ave. 10 2 0 43.99 61.34 27.63Site 11 5 0 120 190 5 0Site 12 2 0 11.004 49.864 2 0
9565 Site 14 5 0 220 260 1609566 Site 17 1 4 180 140 2 59567 Site 20 64.046 330 320.222 1709598 Site 21 5 0 200 130 2209568 Site 26 2 0 2 0 50.544 55.1269569 Site 31 2 2 110 130 5 09570 Site 36 2 3 5 6 9 3 4 39526 Site 56 3 6 4 1 110 3 6
9529b Site 57 3.5 1 0 1 1 1 095289527
1941A 20.819 27.2312 73.01 41.12881941A 20.771 28.0662 67.7868 41.991
SRM Rep 1 1941A 22.6054 29.0584 73.4116 33.7054SRM Rep 2 PC1 2 11.7422 21.671 17.1184SRM Rep 3 PC2 4.6582 15.8232 28.2296 20.4504PC1 MS1 400 410 440 400PC2 MS2 370 410 410 290MS1 MB1 2 2 2 2MS2 MB2 2 2 2 10.819MB1 PB1 1 0 1 0 26.626 1 0MB2 PB2 1 0 1 0 1 0 1 0PB1 PC1 1 0 1.5 1 4 3 6PB2

Appendix G. Newark Bay all chem/toxicity contd.
Lab Number: Submitter no. Phenanthrene Anthracene Fluoranthene Pyrene 1/2mdl, ng/g 1/2mdl, ng/g 1/2mdl, ng/g 1/2mdl, ng/g
9561 Site 1 25100 2300 22800 293009562 Site 3 7400 2200 13900 120009563 Site 5 2400 420 6200 56009593 Site 7A 2200 430 4800 44009594 Site 7B 2000 390 5100 48009595 Site 7C 740 390 3300 30009596 Site 8A 800 460 3300 31009597 Site 8B 1800 580 4800 5400
Ave. 10 416.67 126.67 1400 1233.27Site 11 1400 370 4100 3500Site 12 110 43.11 340 310
9565 Site 14 1600 970 5900 42009566 Site 17 240 470 2500 20009567 Site 20 1800 960 5600 46009598 Site 21 770 630 5400 57009568 Site 26 260 150 1200 11009569 Site 31 550 400 900 6809570 Site 36 520 310 1000 10009526 Site 56 480 490 640 700
9529b Site 57 2 6 3 1 100 15095289527
1941A 250 95.2534 460 3801941A 260 98.571 460 360
SRM Rep 1 1941A 250 82.0958 459.706 390SRM Rep 2 PC1 190 23.7292 410 330SRM Rep 3 PC2 200 30.393 330 330PC1 MS1 420 380 460 420PC2 MS2 340 290 360 350MS1 MB1 6.4092 2 11.8636 8.0404MS2 MB2 2 5.7188 9.7008 7.2562MB1 PB1 1 0 1 0 1 0 1 0MB2 PB2 1 0 1 0 1 0 1 0PB1 PC1 290 1 0 440 460PB2

Appendix G. Newark Bay all chem/toxicity contd.
Lab Number: Submitter no. Benzo(a)-anthracene Chrysene Benzo(b)-fluoranthene1/2mdl, ng/g 1/2mdl, ng/g 1/2mdl, ng/g
9561 Site 1 11300 14200 80009562 Site 3 7500 7400 75009563 Site 5 3000 3600 34009593 Site 7A 2600 3000 29009594 Site 7B 2000 2500 26009595 Site 7C 790 1300 12009596 Site 8A 1000 1500 13009597 Site 8B 1800 2800 1900
Ave. 10 613.31 733.33 819.99Site 11 1800 2200 2400Site 12 220 250 190
9565 Site 14 3400 3600 38009566 Site 17 770 670 7209567 Site 20 3400 3100 29009598 Site 21 2900 3100 25009568 Site 26 600 650 600.3729569 Site 31 640 760 1609570 Site 36 660 810 8509526 Site 56 410 540 650
9529b Site 57 5 8 7 9 8 895289527
1941A 280 350 6101941A 270 350 670.244
SRM Rep 1 1941A 290 380 700SRM Rep 2 PC1 190 260 270SRM Rep 3 PC2 169.5394 230.446 250PC1 MS1 400 420.156 460PC2 MS2 350 360 440MS1 MB1 2 5.7898 6.6024MS2 MB2 2 5.3004 7.0114MB1 PB1 1 0 1 0 1 0MB2 PB2 1 0 1 0 1 0PB1 PC1 230 380 350PB2

Appendix G. Newark Bay all chem/toxicity contd.
Lab Number: Submitter no. Benzo(k)-fluoranthene Benzo(e)pyrene Benzo(a)pyrene1/2mdl, ng/g 1/2mdl, ng/g 1/2mdl, ng/g
9561 Site 1 7700 8000 98009562 Site 3 6800 6800 79009563 Site 5 3300 3600 36009593 Site 7A 2900 2900 29009594 Site 7B 2300 2700 21009595 Site 7C 1300 1400 10009596 Site 8A 1400 1600 13009597 Site 8B 2000 2100 1700
Ave. 10 786.66 816.67 750Site 11 2100 2200 2000Site 12 220 269.578 250
9565 Site 14 3800 3800 40009566 Site 17 670 770 7809567 Site 20 3000 2600 32009598 Site 21 2800 2600 28009568 Site 26 680 560 5409569 Site 31 270 480 4509570 Site 36 760 790 7409526 Site 56 390 600 550
9529b Site 57 9 2 8 8 7 795289527
1941A 490 550.328 4001941A 420 530 370
SRM Rep 1 1941A 580 630 400SRM Rep 2 PC1 260 270 210SRM Rep 3 PC2 220 230 190PC1 MS1 480 460 460PC2 MS2 420 420 409.874MS1 MB1 7.8326 6.764 5.9786MS2 MB2 8.15 2 8.3128MB1 PB1 1 0 1 0 1 0MB2 PB2 1 0 32.444 1 0PB1 PC1 380 320 250PB2

Appendix G. Newark Bay all chem/toxicity contd.
Lab Number: Submitter no. Perylene Indeno-123cd pyrene Dibenz(a,h)-anthracene1/2mdl, ng/g 1/2mdl, ng/g 1/2mdl, ng/g
9561 Site 1 2200 7000 8109562 Site 3 2000 6100 13009563 Site 5 740 2700 5709593 Site 7A 640 2200 5009594 Site 7B 660 2600 4109595 Site 7C 750 1700 4609596 Site 8A 820 1700 5009597 Site 8B 920 2000 540
Ave. 10 196.67 563.33 166.7Site 11 580 1700 520Site 12 210 180 64.666
9565 Site 14 1300 2700 5309566 Site 17 760 1300 2509567 Site 20 859.616 2100 7009598 Site 21 680 1800 3709568 Site 26 140 360 1009569 Site 31 440 630 2109570 Site 36 300 590 1209526 Site 56 290 360 120
9529b Site 57 1 3 4 7 295289527
1941A 269.56 510 1401941A 250 480 150
SRM Rep 1 1941A 280 580 180SRM Rep 2 PC1 110 210 41.7132SRM Rep 3 PC2 100 180 48.7332PC1 MS1 420 460 460PC2 MS2 400 430 440MS1 MB1 2 5.9982 2MS2 MB2 7.476 5.7294 5.4408MB1 PB1 1 0 1 0 1 0MB2 PB2 1 0 1 0 1 0PB1 PC1 160 190 2 8PB2

Appendix G. Newark Bay all chem/toxicity contd.
Lab Number: Submit. no. Benzo(g,h,i)-perylene Total G-eq total LMPAH, total HMPAH, 1/2mdl, ng/g analyzed ng/g ng/g
9561 Site 1 6000 5 40388 1271109562 Site 3 5200 0.2 13310 844009563 Site 5 2400 0.2 4539.9 387109593 Site 7A 2100 0.2 4230 318409594 Site 7B 2100 5 3994 298709595 Site 7C 1100 5 2259 173009596 Site 8A 1100 5 2473 186209597 Site 8B 1400 5 3941 27360
Ave. 10 470 0.5 1435.83 8549.93Site 11 1400 0.2 3150 24500Site 12 140 0.5 676.078 2644.244
9565 Site 14 2400 0.2 4620 394309566 Site 17 890 5 1581 120809567 Site 20 1900 0.5 4601.956 33959.6169598 Site 21 1400 0.2 3180 320509568 Site 26 380 0.5 914.086 6910.3729569 Site 31 480 5 1673 61009570 Site 36 370 5 1486 79909526 Site 56 270 5 1483 5520
9529b Site 57 1 3 5 165 80795289527
1941A 440 5 1454.6618 4879.8881941A 430 5 1430.0886 4740.244
SRM Rep 1 1941A 510 5 1409.9732 5379.706SRM Rep 2 PC1 190 5 472.105 2751.7132SRM Rep 3 PC2 170.4846 5 576.208 2449.2032PC1 MS1 450 5 5480.398 5350.156PC2 MS2 409.69 5 4340 4789.564MS1 MB1 5.6154 5 41.5914 70.485MS2 MB2 5.3214 5 46.3864 73.6992MB1 PB1 1 0 1 114.805 120MB2 PB2 1 0 1 201.191 142.444PB1 PC1 9 7 5 455 3285PB2

Appendix G. Newark Bay all chem/toxicity contd.
Lab Number: Submitter no. sum total PAH, acenaphthene, acenaphthene, phenanthrene,ng/g ng/goc ug/goc ng/goc
9561 Site 1 167498 90000 9 0 12550009562 Site 3 97710 18000 1 8 1480009563 Site 5 43249.9 3934.43 3.93 39344.269593 Site 7A 36070 3448.28 3.45 37931.039594 Site 7B 33864 8750 8.75 83333.339595 Site 7C 19559 6956.52 6.96 32173.919596 Site 8A 21093 7083.33 7.08 33333.339597 Site 8B 31301 10416.67 10.42 75000
Ave. 10 9985.76 1047.4 1.05 9920.83Site 11 27650 2352.94 2.35 27450.98Site 12 3320.322 647.29 0.65 6470.59
9565 Site 14 44050 5116.28 5.12 37209.39566 Site 17 13661 7500 7.5 100009567 Site 20 38561.572 19411.76 19.41 105882.359598 Site 21 35230 13333.33 13.33 51333.339568 Site 26 7824.458 909.09 0.91 11818.189569 Site 31 7773 5238.1 5.24 26190.489570 Site 36 9476 2333.33 2.33 21666.679526 Site 56 7003 1640 1.64 19200
9529b Site 57 972 2127.66 2.13 5531.9195289527
1941A 6334.54981941A 6170.3326
SRM Rep 1 1941A 6789.6792SRM Rep 2 PC1 3223.8182SRM Rep 3 PC2 3025.4112PC1 MS1 10830.554PC2 MS2 9129.564MS1 MB1 112.0764MS2 MB2 120.0856MB1 PB1 234.805MB2 PB2 343.635PB1 PC1 3740PB2
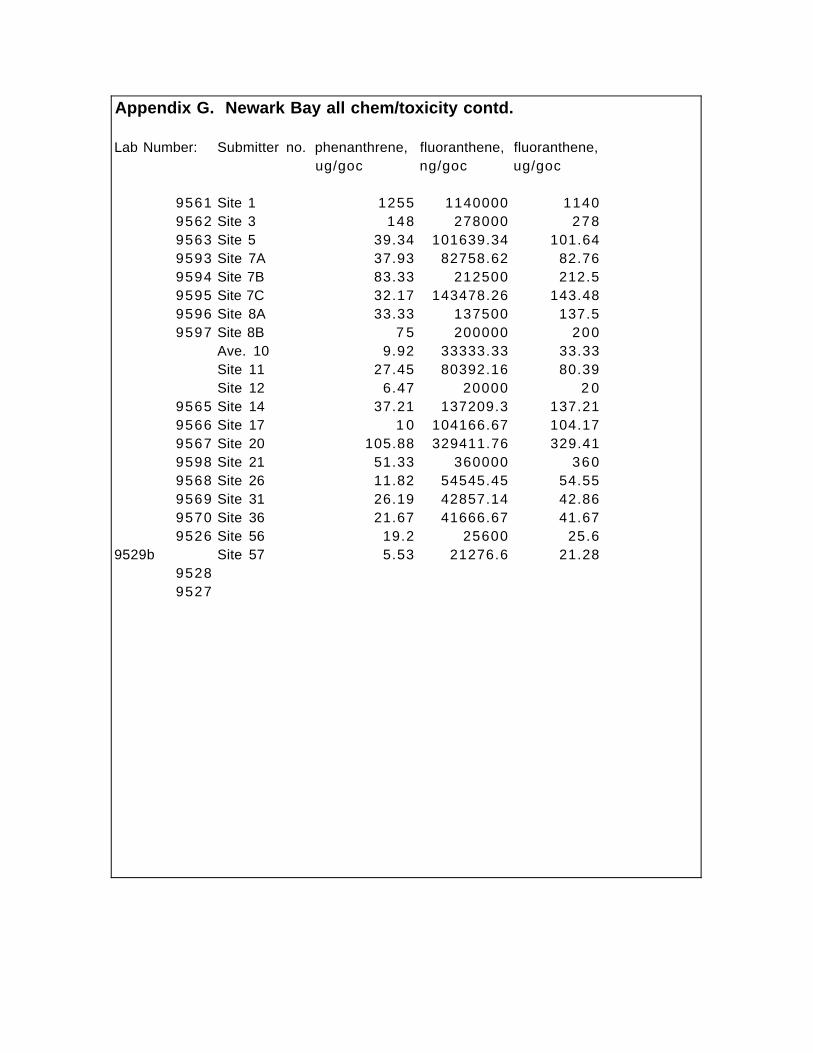
Appendix G. Newark Bay all chem/toxicity contd.
Lab Number: Submitter no. phenanthrene, fluoranthene, fluoranthene, ug/goc ng/goc ug/goc
9561 Site 1 1255 1140000 11409562 Site 3 148 278000 2789563 Site 5 39.34 101639.34 101.649593 Site 7A 37.93 82758.62 82.769594 Site 7B 83.33 212500 212.59595 Site 7C 32.17 143478.26 143.489596 Site 8A 33.33 137500 137.59597 Site 8B 7 5 200000 200
Ave. 10 9.92 33333.33 33.33Site 11 27.45 80392.16 80.39Site 12 6.47 20000 2 0
9565 Site 14 37.21 137209.3 137.219566 Site 17 1 0 104166.67 104.179567 Site 20 105.88 329411.76 329.419598 Site 21 51.33 360000 3609568 Site 26 11.82 54545.45 54.559569 Site 31 26.19 42857.14 42.869570 Site 36 21.67 41666.67 41.679526 Site 56 19.2 25600 25.6
9529b Site 57 5.53 21276.6 21.2895289527
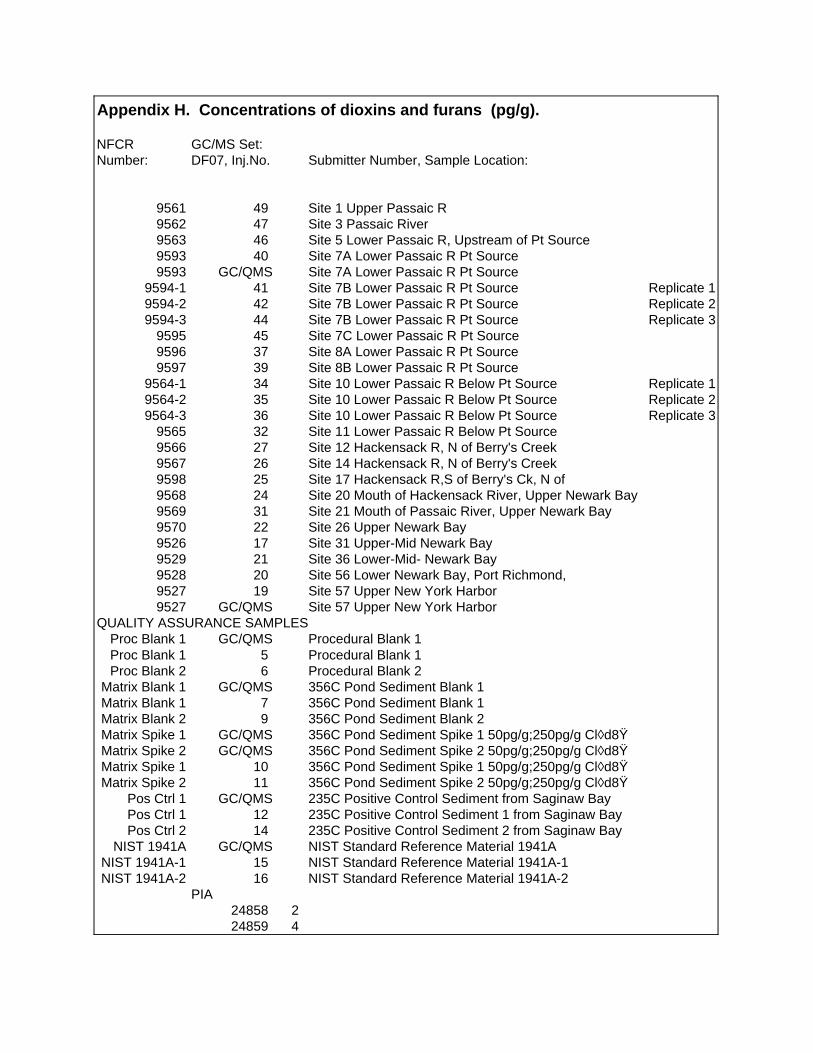
Appendix H. Concentrations of dioxins and furans (pg/g).
NFCR GC/MS Set:Number: DF07, Inj.No. Submitter Number, Sample Location:
9561 49 Site 1 Upper Passaic R 9562 47 Site 3 Passaic River 9563 46 Site 5 Lower Passaic R, Upstream of Pt Source9593 40 Site 7A Lower Passaic R Pt Source9593 GC/QMS Site 7A Lower Passaic R Pt Source
9594-1 41 Site 7B Lower Passaic R Pt Source Replicate 19594-2 42 Site 7B Lower Passaic R Pt Source Replicate 29594-3 44 Site 7B Lower Passaic R Pt Source Replicate 3
9595 45 Site 7C Lower Passaic R Pt Source9596 37 Site 8A Lower Passaic R Pt Source9597 39 Site 8B Lower Passaic R Pt Source
9564-1 34 Site 10 Lower Passaic R Below Pt Source Replicate 19564-2 35 Site 10 Lower Passaic R Below Pt Source Replicate 29564-3 36 Site 10 Lower Passaic R Below Pt Source Replicate 3
9565 32 Site 11 Lower Passaic R Below Pt Source9566 27 Site 12 Hackensack R, N of Berry's Creek9567 26 Site 14 Hackensack R, N of Berry's Creek9598 25 Site 17 Hackensack R,S of Berry's Ck, N of9568 24 Site 20 Mouth of Hackensack River, Upper Newark Bay9569 31 Site 21 Mouth of Passaic River, Upper Newark Bay9570 22 Site 26 Upper Newark Bay9526 17 Site 31 Upper-Mid Newark Bay9529 21 Site 36 Lower-Mid- Newark Bay9528 20 Site 56 Lower Newark Bay, Port Richmond,9527 19 Site 57 Upper New York Harbor9527 GC/QMS Site 57 Upper New York Harbor
QUALITY ASSURANCE SAMPLESProc Blank 1 GC/QMS Procedural Blank 1 Proc Blank 1 5 Procedural Blank 1 Proc Blank 2 6 Procedural Blank 2
Matrix Blank 1 GC/QMS 356C Pond Sediment Blank 1 Matrix Blank 1 7 356C Pond Sediment Blank 1 Matrix Blank 2 9 356C Pond Sediment Blank 2 Matrix Spike 1 GC/QMS 356C Pond Sediment Spike 1 50pg/g;250pg/g Cl◊d8ŸMatrix Spike 2 GC/QMS 356C Pond Sediment Spike 2 50pg/g;250pg/g Cl◊d8ŸMatrix Spike 1 10 356C Pond Sediment Spike 1 50pg/g;250pg/g Cl◊d8ŸMatrix Spike 2 11 356C Pond Sediment Spike 2 50pg/g;250pg/g Cl◊d8Ÿ
Pos Ctrl 1 GC/QMS 235C Positive Control Sediment from Saginaw BayPos Ctrl 1 12 235C Positive Control Sediment 1 from Saginaw BayPos Ctrl 2 14 235C Positive Control Sediment 2 from Saginaw Bay
NIST 1941A GC/QMS NIST Standard Reference Material 1941ANIST 1941A-1 15 NIST Standard Reference Material 1941A-1NIST 1941A-2 16 NIST Standard Reference Material 1941A-2
PIA24858 224859 4

Appendix H. Concentrations of dioxins and furans (pg/g) contd.
NFCR GC/MS Set: DIOXINSNumber: DF07, Inj.No. 2,3,7,8- 1,2,3,7,8- 1,2,4,7,8-
Tetrachloro-DD Pentachloro-DD Pentachloro-DD
9561 49 99 2.2 NQ 1.39562 47 270 4.4 NQ 1.1 NQ9563 46 450 7.8 0.5 ND9593 40 390 8.1 139593 GC/QMS 480 8 15
9594-1 41 430 8.3 9.09594-2 42 340 10 8.89594-3 44 360 8.2 12
9595 45 620 12 239596 37 440 10 139597 39 300 7.0 8.5
9564-1 34 310 7.3 9.49564-2 35 350 9.1 139564-3 36 430 7.5 8.6
9565 32 280 9.1 NQ 129566 27 7.4 0.5 NQ 0.89567 26 62 3.3 3.49598 25 29 1.0 NQ 1.4 NQ9568 24 38 1.2 NQ 1.6 NQ9569 31 140 1.9 NQ 1.99570 22 470 6.5 8.69526 17 62 3 NQ 4.19529 21 55 4.0 5.49528 20 30 3.0 4.09527 19 3.6 0.7 0.8 NQ9527 GC/QMS 2 1 ND 3
QUALITY ASSURANCE SAMPLESProc Blank 1 GC/QMS 2 ND 1 ND 9 NDProc Blank 1 5 0.4 NQ 0.3 ND 0.3 NDProc Blank 2 6 0.3 NQ 0.3 ND 0.3 ND
Matrix Blank 1 GC/QMS 2 ND 4 ND 3 NQMatrix Blank 1 7 0.3 ND 0.5 NQ 0.5 NQMatrix Blank 2 9 0.4 0.5 ND 0.5 NQMatrix Spike 1 GC/QMS 64 46 66Matrix Spike 2 GC/QMS 64 48 66Matrix Spike 1 10 47 46 38Matrix Spike 2 11 45 45 37
Pos Ctrl 1 GC/QMS 19 12 17Pos Ctrl 1 12 25 14 13Pos Ctrl 2 14 21 14 14
NIST 1941A GC/QMS 2 NQ 3 NQ 10NIST 1941A-1 15 1.9 5.6 5.3NIST 1941A-2 16 1.9 5.1 5.0
PIA24858 3224859 24

Appendix H. Concentrations of dioxins and furans (pg/g) contd.
NFCR GC/MS Set:Number: DF07, Inj.No. 1,2,3,4,7,8- 1,2,3,6,7,8- 1,2,3,7,8,9-
Hexachloro-DD Hexachloro-DD Hexachloro-DD
9561 49 1.6 7.5 4.3 NQ9562 47 4.1 NQ 33 4.5 NQ9563 46 8.0 44 269593 40 7.7 29 209593 GC/QMS 8 57 28
9594-1 41 9.6 29 259594-2 42 11 37 399594-3 44 8.4 31 25
9595 45 9.7 39 299596 37 9.7 38 299597 39 8.2 32 22
9564-1 34 7.1 34 229564-2 35 7.8 34 249564-3 36 7.3 33 24
9565 32 8.3 31 249566 27 0.7 NQ 2.9 2.09567 26 3.5 17 129598 25 1.2 4.1 2.89568 24 1.2 6.2 4.09569 31 2.3 NQ 8.0 5.9 NQ9570 22 5.5 32 219526 17 3.2 15 119529 21 4.1 17 139528 20 3.2 16 129527 19 0.7 NQ 2.4 NQ 1.4 NQ9527 GC/QMS 1 NQ 3 0.9 NQ
QUALITY ASSURANCE SAMPLESProc Blank 1 GC/QMS 1 ND 0.9 ND 1 NDProc Blank 1 5 0.4 ND 0.3 ND 0.4 NDProc Blank 2 6 0.4 ND 0.8 NQ 0.4 ND
Matrix Blank 1 GC/QMS 2 ND 4 ND 4 NDMatrix Blank 1 7 0.9 NQ 1.8 1.9Matrix Blank 2 9 1.0 NQ 1.6 NQ 1.7Matrix Spike 1 GC/QMS 80 69 76Matrix Spike 2 GC/QMS 81 69 76Matrix Spike 1 10 47 44 48Matrix Spike 2 11 44 46 46
Pos Ctrl 1 GC/QMS 0.5 NQ 100 40Pos Ctrl 1 12 7.5 43 24Pos Ctrl 2 14 8.3 46 25
NIST 1941A GC/QMS 14 37 32NIST 1941A-1 15 9.1 21 23NIST 1941A-2 16 9.6 21 23

Appendix H. Concentrations of dioxins and furans (pg/g) contd.
NFCR GC/MS Set: FURANSNumber: DF07, Inj.No1,2,3,4,6,7,8- Octa 2,3,7,8-
Heptachloro-DD chloro-DD Tetrachloro-DF
9561 49 180 1,900 719562 47 450 4,800 1609563 46 720 7,100 1909593 40 590 6,400 1709593 GC/QMS 700 5,960 190
9594-1 41 740 7,000 2209594-2 42 860 9,700 2709594-3 44 660 6,700 170
9595 45 790 8,100 2309596 37 870 8,700 2309597 39 780 7,700 170
9564-1 34 630 6,700 2509564-2 35 660 6,300 2309564-3 36 610 5,900 220
9565 32 660 7,400 2209566 27 63 1,200 109567 26 400 5,000 899598 25 71 1,100 299568 24 110 1,400 419569 31 140 1,800 1409570 22 620 5,900 3709526 17 310 3,100 929529 21 350 3,600 669528 20 410 4,800 569527 19 42 510 9.59527 GC/QMS 55 580 7
QUALITY ASSURANCE SAMPLESProc Blank 1 GC/QMS 0.7 ND 3 0.7 NDProc Blank 1 5 1.0 NQ 17 1.3Proc Blank 2 6 1.3 16 0.6 NQ
Matrix Blank 1 GC/QMS 79 2,610 0.5 NDMatrix Blank 1 7 44 1,400 1 NQMatrix Blank 2 9 46 1,500 1 NQMatrix Spike 1 GC/QMS 150 2,390 75Matrix Spike 2 GC/QMS 150 2,390 74Matrix Spike 1 10 93 1,800 46Matrix Spike 2 11 94 1,900 44
Pos Ctrl 1 GC/QMS 980 8,940 720Pos Ctrl 1 12 840 7,400 1,400Pos Ctrl 2 14 840 7,100 410
NIST 1941A GC/QMS 710 7,670 130NIST 1941A-1 15 520 6,400 120NIST 1941A-2 16 560 7,100 130

Appendix H. Concentrations of dioxins and furans (pg/g) contd.
NFCR GC/MS Set:Number: DF07, Inj.No. 1,2,3,7,8- 2,3,4,7,8- 1,2,3,4,7,8-
Pentachloro-DF Pentachloro-DF Hexachloro-DF
9561 49 2.8 6.2 199562 47 8.7 NQ 36 1209563 46 14 33 2209593 40 12 27 1709593 GC/QMS 13 29 200
9594-1 41 13 29 2309594-2 42 14 28 2209594-3 44 13 31 210
9595 45 19 41 3709596 37 16 43 3509597 39 11 25 170
9564-1 34 23 47 3409564-2 35 22 52 4609564-3 36 22 43 360
9565 32 18 40 3809566 27 1.3 2.0 169567 26 9.0 22 2309598 25 2.7 5.5 459568 24 5.4 8.4 759569 31 5.2 8.4 699570 22 15 36 2009526 17 10 15 959529 21 7.5 14 909528 20 6.4 9.4 329527 19 1.1 1.4 4.39527 GC/QMS 0.8 NQ 0.3 NQ 3
QUALITY ASSURANCE SAMPLESProc Blank 1 GC/QMS 2 ND 2 ND 0.8 NQProc Blank 1 5 0.4 0.4 1.5Proc Blank 2 6 0.3 ND 0.3 ND 0.9
Matrix Blank 1 GC/QMS 1 ND 0.9 ND 2 NDMatrix Blank 1 7 0.3 ND 0.5 NQ 0.7 NQMatrix Blank 2 9 0.4 NQ 0.5 NQ 1.1Matrix Spike 1 GC/QMS 61 63 70Matrix Spike 2 GC/QMS 62 65 69Matrix Spike 1 10 45 46 46Matrix Spike 2 11 43 43 45
Pos Ctrl 1 GC/QMS 480 320 360Pos Ctrl 1 12 730 580 660Pos Ctrl 2 14 190 150 220
NIST 1941A GC/QMS 210 57 440NIST 1941A-1 15 140 48 320NIST 1941A-2 16 150 51 350

Appendix H. Concentrations of dioxins and furans (pg/g) contd.
NFCR GC/MS Set:Number: DF07, Inj.No. 1,2,3,6,7,8- 1,2,3,7,8,9- 2,3,4,6,7,8-
Hexachloro-DF Hexachloro-DF Hexachloro-DF
9561 49 5.5 0.4 ND 4.29562 47 29 0.4 ND 2.29563 46 47 0.9 NQ 9.49593 40 40 1.5 199593 GC/QMS 28 8 NQ 5 NQ
9594-1 41 49 1.2 NQ 9.89594-2 42 47 1.2 NQ 239594-3 44 45 1.1 9.5
9595 45 74 1.2 349596 37 68 1.4 129597 39 38 1.2 9.2
9564-1 34 70 1.5 289564-2 35 84 1.5 349564-3 36 71 1.4 29
9565 32 72 1.5 309566 27 3.1 0.4 ND 1.89567 26 36 0.8 149598 25 7.6 0.4 ND 3.19568 24 14 0.4 ND 5.69569 31 12 0.7 NQ 5.89570 22 35 1.2 NQ 189526 17 21 1.5 9.59529 21 17 0.7 9.79528 20 8.9 0.4 ND 6.49527 19 1.2 NQ 0.4 ND 1.29527 GC/QMS 0.9 NQ 5 NQ 0.5 NQ
QUALITY ASSURANCE SAMPLESProc Blank 1 GC/QMS 0.4 ND 2 NQ 1 NQProc Blank 1 5 0.6 0.4 ND 0.5 NQProc Blank 2 6 0.5 NQ 0.4 ND 0.4 ND
Matrix Blank 1 GC/QMS 2 ND 2 ND 1 NDMatrix Blank 1 7 0.4 NQ 0.4 ND 0.4 NQMatrix Blank 2 9 0.8 0.4 ND 0.5 NQMatrix Spike 1 GC/QMS 63 64 69Matrix Spike 2 GC/QMS 62 64 69Matrix Spike 1 10 46 45 56Matrix Spike 2 11 48 44 46
Pos Ctrl 1 GC/QMS 69 0.4 NQ 9Pos Ctrl 1 12 120 9.8 60Pos Ctrl 2 14 51 4.2 26
NIST 1941A GC/QMS 100 54 66NIST 1941A-1 15 81 31 16NIST 1941A-2 16 90 34 18

Appendix H. Concentrations of dioxins and furans (pg/g) contd.
NFCR GC/MS Set:Number: DF07, Inj.No. 1,2,3,4,6,7,8- 1,2,3,4,7,8,9- Octa
Heptachloro-DF Heptachloro-DF chloro-DF
9561 49 82 5.3 2109562 47 480 19 7709563 46 940 26 1,3009593 40 830 21 1,2009593 GC/QMS 600 28 1,580
9594-1 41 1,100 26 1,4009594-2 42 1,000 27 1,3009594-3 44 910 26 1,300
9595 45 1,600 41 2,0009596 37 1,500 36 1,8009597 39 800 24 1,200
9564-1 34 1,500 34 2,0009564-2 35 1,800 42 2,1009564-3 36 1,600 35 1,900
9565 32 1,600 37 2,1009566 27 95 2.4 1809567 26 950 24 1,5009598 25 190 4.8 3109568 24 320 8.7 4909569 31 280 6.6 4309570 22 750 21 1,2009526 17 510 18 9709529 21 380 12 6409528 20 190 6.7 3309527 19 23 1.0 449527 GC/QMS 14 2 NQ 33
QUALITY ASSURANCE SAMPLESProc Blank 1 GC/QMS 0.7 ND 0.6 ND 1 NDProc Blank 1 5 1.7 0.7 NQ 3.7Proc Blank 2 6 1.2 0.4 NQ 2.9
Matrix Blank 1 GC/QMS 3 2 ND 10Matrix Blank 1 7 3.8 0.5 NQ 8.1Matrix Blank 2 9 3.8 0.6 8.2Matrix Spike 1 GC/QMS 60 60 360Matrix Spike 2 GC/QMS 60 61 350Matrix Spike 1 10 55 48 240Matrix Spike 2 11 52 46 240
Pos Ctrl 1 GC/QMS 940 79 3,200Pos Ctrl 1 12 1,400 70 2,100Pos Ctrl 2 14 1,300 54 2,200
NIST 1941A GC/QMS 440 370 7,080NIST 1941A-1 15 450 260 5,300NIST 1941A-2 16 500 290 5,800
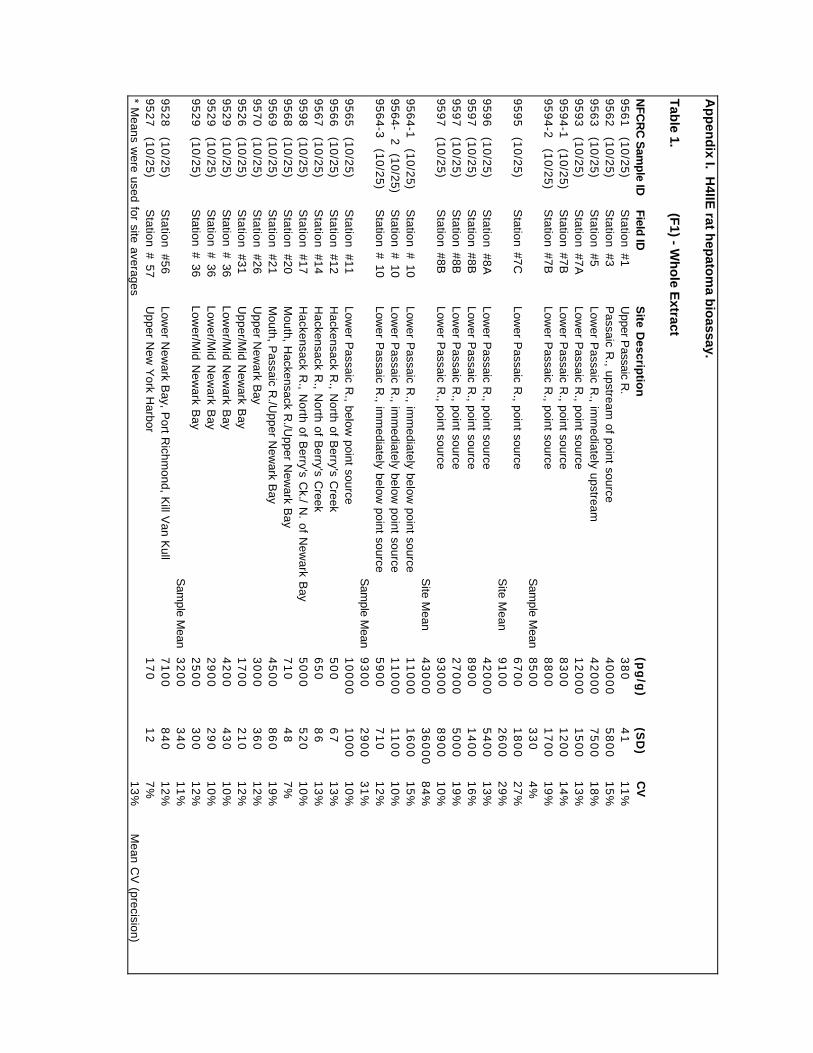
Ap
pen
dix I. H
4IIE rat h
epato
ma b
ioassay.
Tab
le 1. (F
1) - Wh
ole E
xtract
NFC
RC
Sam
ple IDField ID
Site D
escriptio
n(p
g/g
)(S
D)
CV
95
61
(1
0/2
5)
Station
#1U
pper Passaic R
.3
80
41
11
%9
56
2
(10
/25
)S
tation
#3P
assaic R., upstream
of point source4
00
00
58
00
15
%9
56
3
(10
/25
)S
tation
#5Low
er Passaic R
., imm
ediately upstream4
20
00
75
00
18
%9
59
3
(10
/25
)S
tation
#7
ALow
er Passaic R
., point source1
20
00
15
00
13
%9
59
4-1
(1
0/2
5)
Station #7B
Lower P
assaic R., point source
83
00
12
00
14
%9
59
4-2
(1
0/2
5)
Station #7B
Lower P
assaic R., point source
88
00
17
00
19
%S
ample M
ean8
50
03
30
4%
95
95
(1
0/2
5)
Station #7C
Lower P
assaic R., point source
67
00
18
00
27
%S
ite Mean
91
00
26
00
29
%9
59
6
(10
/25
)S
tation
#8
ALow
er Passaic R
., point source4
20
00
54
00
13
%9
59
7
(10
/25
)S
tation #8BLow
er Passaic R
., point source8
90
01
40
01
6%
95
97
(1
0/2
5)
Station #8B
Lower P
assaic R., point source
27
00
05
00
01
9%
95
97
(1
0/2
5)
Station #8B
Lower P
assaic R., point source
93
00
08
90
01
0%
Site M
ean4
30
00
36
00
08
4%
95
64
-1
(10
/25
)S
tation # 10Low
er Passaic R
., imm
ediately below point source
11
00
01
60
01
5%
95
64
- 2
(1
0/2
5)
Station # 10
Lower P
assaic R., im
mediately below
point source1
10
00
11
00
10
%9
56
4-3
(1
0/2
5)
Station # 10
Lower P
assaic R., im
mediately below
point source5
90
07
10
12
%S
ample M
ean9
30
02
90
03
1%
95
65
(1
0/2
5)
Sta
tion
#1
1Low
er Passaic R
., below point source
10
00
01
00
01
0%
95
66
(1
0/2
5)
Sta
tion
#1
2H
ackensack R., N
orth of Berry's C
reek5
00
67
13
%9
56
7
(10
/25
)S
tatio
n #
14
Hackensack R
., North of B
erry's Creek
65
08
61
3%
95
98
(1
0/2
5)
Sta
tion
#1
7H
ackensack R., N
orth of Berry's C
k./ N. of N
ewark B
ay5
00
05
20
10
%9
56
8
(10
/25
)S
tatio
n #
20
Mouth, H
ackensack R./U
pper New
ark Bay
71
04
87
%9
56
9
(10
/25
)S
tatio
n #
21
Mouth, P
assaic R./U
pper New
ark Bay
45
00
86
01
9%
95
70
(1
0/2
5)
Sta
tion
#2
6U
pper New
ark Bay
30
00
36
01
2%
95
26
(1
0/2
5)
Sta
tion
#3
1U
pper/Mid N
ewark B
ay1
70
02
10
12
%9
52
9
(10
/25
)S
tation # 36Low
er/Mid N
ewark B
ay4
20
04
30
10
%9
52
9
(10
/25
)S
tation # 36Low
er/Mid N
ewark B
ay2
90
02
90
10
%9
52
9
(10
/25
)S
tation # 36Low
er/Mid N
ewark B
ay2
50
03
00
12
%S
ample M
ean3
20
03
40
11
%9
52
8
(10
/25
)S
tatio
n #
56
Lower N
ewark B
ay, Port R
ichmond, K
ill Van K
ull7
10
08
40
12
%9
52
7
(10
/25
)S
tation # 57U
pper New
York H
arbor1
70
12
7%
* Means w
ere used for site averages1
3%
Mean C
V (precision)

Ap
pen
dix I. H
4IIE rat h
epato
ma b
ioassay co
ntd
.
Tab
le 2. (F5) - P
AH
fraction
.
NFC
RC
Sam
ple IDF
ield ID
Site D
escriptio
nT
CD
D-E
Q
(pg
/g)
(SD
)C
V9
56
1
(12
/6)
Station # 1
Upper P
assaic R.
58
00
16
00
28
%9
56
2
(12
/6)
Station # 3
Passaic R
., upstream of point source
60
00
16
00
27
%9
56
3
(12
/6)
Station # 5
Lower P
assaic R., im
mediately upstream
22
00
07
60
03
5%
95
93
(1
2/6
)S
tation # 7ALow
er Passaic R
., point source1
90
00
33
00
17
%9
59
4-1
(1
2/6
)S
tation # 7BLow
er Passaic R
., point source5
40
09
70
18
%9
59
5
(12
/6)
Station # 7C
Low
er Passaic R
., point source5
50
03
50
06
4%
Site M
ean1
00
00
79
00
79
%9
59
6
(12
/6)
Station # 8A
Lower P
assaic R., point source
72
00
28
00
39
%9
59
7
(12
/6)
Station # 8B
Low
er Passaic R
., point source7
00
01
20
01
7%
Site M
ean7
10
01
60
2%
95
64
-1
(12
/6)
Station # 10
Lower P
assaic R., im
mediately below
point source5
00
01
30
02
6%
95
64
-2(1
2/6
)S
tation # 10Low
er Passaic R
., imm
ediately below point source
50
00
90
01
8%
95
64
-3
(12
/6)
Station # 10
Lower P
assaic R., im
mediately below
point source4
50
01
00
02
2%
Sam
ple Mean
48
00
28
06
%9
56
5
(12
/6)
Station # 11
Lower P
assaic R., below
point source2
10
00
38
00
18
%9
56
6a
(1
2/6
)S
tation # 12H
ackensack R., N
orth of Berry's C
reek6
70
11
01
6%
95
66
b
(12
/6)
Station # 12
Hackensack R
., North of B
erry's Creek
12
00
20
01
7%
95
66
c (1
2/6
)S
tation # 12H
ackensack R., N
orth of Berry's C
reek6
41
82
8%
Bioassay M
ean6
50
57
08
8%
95
67
(1
2/6
)S
tation # 14H
ackensack R., N
orth of Berry's C
reek1
80
00
33
00
18
%9
59
8
(12
/6)
Station # 17
Hackensack R
., North of B
erry's Ck./ N
. of New
ark Bay
49
00
12
00
24
%9
56
8
(12
/6)
Station # 20
Mouth, H
ackensack R./U
pper New
ark Bay
11
00
02
20
02
0%
95
69
a
(12
/6)
Station # 21
Mouth, P
assaic R./U
pper New
ark Bay
13
00
02
10
01
6%
95
69
b
(12
/6)
Station # 21
Mouth, P
assaic R./U
pper New
ark Bay
81
00
17
00
21
%9
56
9c
(12
/6)
Station # 21
Mouth, P
assaic R./U
pper New
ark Bay
48
00
86
01
8%
Bioassay M
ean8
50
03
80
04
5%
95
70
(1
2/6
)S
tation # 26U
pper New
ark Bay
70
00
12
00
17
%9
52
6
(12
/6)
Station # 31
Upper/M
id New
ark Bay
45
00
30
00
67
%9
52
9
(12
/6)
Station # 36
Lower/M
id New
ark Bay
20
00
44
02
2%
95
28
(1
2/6
)S
tation # 56 Low
er New
ark Bay, P
ort Richm
ond, Kill V
an Kull
24
00
13
00
54
%9
52
7
(12
/6)
Station # 57
Upper N
ew Y
ork Harbor
87
23
26
%* M
eans were used for site averages
27
%M
ean CV
(precision)

Ap
pen
dix I. H
4IIE rat h
epato
ma b
ioassay co
ntd
.
Tab
le 3. (F7) - B
ulk (>2-o
rtho
-chlo
ro-su
bstitu
ted) P
CB
fraction
.
NFC
RC
Sam
ple IDF
ield ID
Site D
escriptio
nT
CD
D-E
Q
(pg
/g)
(SD
)C
V9
56
1
(3/7
)S
tation # 1U
pper Passaic R
.0
.10
.01
5%
95
62
(3
/7)
Station # 3
Passaic R
., upstream of point source
0.1
0.1
11
6%
95
63
(3
/7)
Station # 5
Lower P
assaic R., im
mediately uptream
0.0
0.0
67
1%
95
93
(3
/7)
Station # 7A
Lower P
assaic R., point source
0.2
0.1
48
%9
59
4
(3/7
)S
tation # 7BLow
er Passaic R
., point source0
.20
.01
9%
95
95
(3
/7)
Station # 7C
Low
er Passaic R
., point source1
.40
.21
4%
Site M
ean0
.60
.11
9%
95
96
a
(3/7
)S
tation # 8ALow
er Passaic R
., point source0
.00
.01
23
%9
59
6b
(3
/7)
Station # 8A
Lower P
assaic R., point source
0.3
0.1
23
%9
59
6c
(3/7
)S
tation # 8ALow
er Passaic R
., point source0
.10
.02
2%
Bioassay M
ean0
.10
.11
19
%9
59
7
(3/7
)S
tation # 8B
Lower P
assaic R., point source
3.3
0.4
13
%S
ite Mean
1.7
2.2
13
1%
95
64
(3
/7)
Station # 10
Lower P
assaic R., im
mediately below
point source2
.00
.31
5%
95
65
a
(3/7
)S
tation # 11Low
er Passaic R
., below point source
0.3
0.1
28
%9
56
5b
(3
/7)
Station # 11
Lower P
assaic R., below
point source0
.10
.03
1%
95
65
c (3
/7)
Station # 11
Lower P
assaic R., below
point source0
.40
.11
6%
Bioassay M
ean0
.30
.15
0%
95
66
-1
(3/7
)S
tation # 12H
ackensack R., N
orth of Berry's C
reek0
.40
.12
6%
95
66
-2
(3/7
)S
tation # 12H
ackensack R., N
orth of Berry's C
reek0
.00
.02
3%
Sam
ple Mean
0.2
0.2
11
8%
95
67
(3
/7)
Station # 14
Hackensack R
., North of B
erry's Creek
0.1
0.0
14
%9
59
8
(3/7
)S
tation # 17H
ackensack R., S
. of Berry's C
k./N. of N
ewark B
ay0
.20
.12
4%
95
68
(3
/7)
Station # 20
Mouth, H
ackensack R./U
pper New
ark Bay
0.1
0.0
22
%9
56
9
(3/7
)S
tation # 21M
outh, Passaic R
./Upper N
ewark B
ay0
.10
.01
7%
95
70
(3
/7)
Station # 26
Upper N
ewark B
ay0
.10
.17
1%
95
26
(3
/7)
Station # 31
Upper/M
id New
ark Bay
0.4
0.1
32
%9
52
9
(3/7
)S
tation # 36Low
er/Mid N
ewark B
ay0
.20
.02
1%
95
28
-1
(3/7
)S
tation # 56 Low
er New
ark Bay, P
ort Richm
ond, Kill V
an Kull
0.5
0.1
14
%9
52
8-2
(3
/7)
Station # 56
Lower N
ewark B
ay, Port R
ichmond, K
ill Van K
ull0
.10
.11
01
%S
ample M
ean0
.30
.12
2%
95
27
(3
/7)
Station # 57
Upper N
ew Y
ork Harbor
0.1
0.0
32
%* M
eans were used for site averages
60
%M
ean CV
(precision)

Ap
pen
dix I. H
4IIE rat h
epato
ma b
ioassay co
ntd
.
Tab
le 4. (F8) - M
on
o-o
rtho
-chlo
ro-su
bstitu
ted P
CB
fraction
.
NFC
RC
Sam
ple ID
Field
IDS
ite Descrip
tion
TC
DD
-EQ
(p
g/g
)(S
D)
CV
95
61
a
(2/1
8)
Station # 1
Upper P
assaic R.
1.6
0.2
11
%9
56
1b
(2
/18
)S
tation # 1U
pper Passaic R
.2
.60
.31
0%
95
61
c (2
/18
)S
tation # 1U
pper Passaic R
.2
.50
.31
1%
Bioassay M
ean 2
.20
.62
6%
95
62
(2
/18
)S
tation # 3P
assaic R., upstream
of point source1
.40
.21
2%
95
63
(2
/18
)S
tation # 5Low
er Passaic R
., imm
ediately upstream7
.40
.81
1%
95
93
(2
/18
)S
tation # 7ALow
er Passaic R
., point source1
6.8
1.9
11
%9
59
4
(2/1
8)
Station # 7B
Lower P
assaic R., point source
11
.31
.31
2%
95
95
(2
/18
)S
tation # 7C
Lower P
assaic R., point source
13
.31
.41
0%
Site M
ean1
3.8
2.8
20
%9
59
6
(2/1
8)
Station # 8A
Lower P
assaic R., point source
5.0
0.5
10
%9
59
7
(2/1
8)
Station # 8B
Low
er Passaic R
., point source1
8.4
3.9
21
%S
ite Mean
11
.79
.58
1%
95
64
(2
/18
)S
tation # 10Low
er Passaic R
., imm
ediately below point source
8.2
0.9
10
%9
56
5
(2/1
8)
Station # 11
Lower P
assaic R., below
point source4
.70
.51
1%
95
66
-1
(2/1
8)
Station # 12
Hackensack R
., North of B
erry's Creek
0.9
0.2
23
%9
56
6-2
(2
/18
)S
tation # 12H
ackensack R., N
orth of Berry's C
reek0
.50
.11
2%
Sam
ple Mean
0.7
0.2
34
%9
56
7
(2/1
8)
Station # 14
Hackensack R
., North of B
erry's Creek
4.1
0.4
10
%9
59
8
(2/1
8)
Station # 17
Hackensack R
., North of B
erry's Ck./ N
. of New
ark Bay
1.9
0.2
10
%9
56
8a
(2
/18
)S
tation # 20M
outh, Hackensack R
./Upper N
ewark B
ay2
.80
.31
1%
95
68
b
(2/1
8)
Station # 20
Mouth, H
ackensack R./U
pper New
ark Bay
5.7
0.6
10
%9
56
8c
(2/1
8)
Station # 20
Mouth, H
ackensack R./U
pper New
ark Bay
8.2
1.0
12
%B
ioassay Mean
5.6
2.7
49
%9
56
9
(2/1
8)
Station # 21
Mouth, P
assaic R./U
pper New
ark Bay
4.0
0.4
10
%9
57
0
(2/1
8)
Station # 26
Upper N
ewark B
ay1
8.1
2.6
15
%9
52
6
(2/1
8)
Station # 31
Upper/M
id New
ark Bay
3.6
0.4
10
%9
52
9
(2/1
8)
Station # 36
Lower/M
id New
ark Bay
4.0
0.4
11
%9
52
8-1
(2
/18
)S
tation # 56 Low
er New
ark Bay, P
ort Richm
ond, Kill V
an Kull
6.6
0.7
10
%9
52
8-2
(2
/18
)S
tation # 56 Low
er New
ark Bay, P
ort Richm
ond, Kill V
an Kull
2.7
0.3
10
%S
ample M
ean 4
.72
.85
9%
95
27
(2
/18
)S
tation # 57U
pper New
York H
arbor0
.30
.01
1%
* Means w
ere used for site averages1
2%
Mean C
V (precision)

Ap
pen
dix I. H
4IIE rat h
epato
ma b
ioassay co
ntd
.
Tab
le 5. (F9) - N
on
-orth
o-ch
loro
-sub
stituted
PC
B fractio
n.
NFC
RC
Sam
ple IDField ID
Site D
escriptio
nT
CD
DE
Q
(pg
/g)
(SD
)C
V9
56
1
(3/1
1)
Station # 1
Upper P
assaic R.
73
39
%9
56
2
(3/1
1)
Station # 3
Passaic R
., upstream of point source
20
31
4%
95
63
a
(3/1
1)
Station # 5
Lower P
assaic R., im
mediately uptream
69
91
3%
95
63
b
(3/1
1)
Station # 5
Lower P
assaic R., im
mediately uptream
68
91
3%
95
63
c (3
/11
)S
tation # 5Low
er Passaic R
., imm
ediately uptream1
22
13
%B
ioassay Mean
49
32
65
%9
59
3
(3/1
1)
Station # 7A
Lower P
assaic R., point source
11
32
42
1%
95
94
(3
/11
)S
tation # 7BLow
er Passaic R
., point source1
55
26
17
%9
59
5
(3/1
1)
Station # 7C
Low
er Passaic R
., point source1
73
16
%S
ite Mean
95
70
74
%9
59
6a
(3
/11
)S
tation # 8ALow
er Passaic R
., point source7
81
21
5%
95
96
b
(3/1
1)
Station # 8A
Lower P
assaic R., point source
97
16
16
%9
59
6c
(3/1
1)
Station # 8A
Lower P
assaic R., point source
81
11
14
%B
ioassay Mean
85
10
12
%9
59
7
(3/1
1)
Station # 8B
Low
er Passaic R
., point source1
92
41
21
%
95
64
(3
/11
)S
tation # 10Low
er Passaic R
., imm
ediately below point source
21
41
%9
56
5
(3/1
1)
Station # 11
Lower P
assaic R., below
point source6
81
21
7%
95
66
-1
(3/1
1)
Station # 12
Hackensack R
., North of B
erry's Creek
00
22
%9
56
6-2
(3
/11
)S
tation # 12H
ackensack R., N
orth of Berry's C
reek2
01
4%
Sam
ple Mean
11
11
8%
95
67
(3
/11
)S
tation # 14H
ackensack R., N
orth of Berry's C
reek2
23
16
%9
59
8
(3/1
1)
Station # 17
Hackensack R
., S. of B
erry's Ck./N
. of New
ark Bay
51
20
%9
56
8
(3/1
1)
Station # 20
Mouth, H
ackensack R./U
pper New
ark Bay
14
32
0%
95
69
(3
/11
)S
tation # 21M
outh, Passaic R
./Upper N
ewark B
ay1
83
16
%9
57
0
(3/1
1)
Station # 26
Upper N
ewark B
ay8
61
21
4%
95
26
(3
/11
)S
tation # 31U
pper/Mid N
ewark B
ay1
72
14
%9
52
9
(3/1
1)
Station # 36
Lower/M
id New
ark Bay
10
11
5%
95
28
-1
(3/1
1)
Station # 56
Lower N
ewark B
ay, Port R
ichmond, K
ill Van K
ull1
42
15
%9
52
8-2
(3
/11
)S
tation # 56 Low
er New
ark Bay, P
ort Richm
ond, Kill V
an Kull
10
21
6%
Sam
ple Mean
12
32
5%
95
27
(3
/11
)S
tation # 57U
pper New
York H
arbor2
01
5%
18
%M
ean CV
(precision)*M
eans were used for site averages

Ap
pen
dix I. H
4IIE rat h
epato
ma b
ioassay co
ntd
.
Tab
le 6. (F11) - C
om
bin
ed to
tal PC
B fractio
n.
NFC
RC
Sam
ple ID
Field
IDS
ite Descrip
tion
TC
DD
-EQ
(p
g/g
)(S
D)
CV
95
61
a
(3/1
8)
Station # 1
Upper P
assaic R.
10
38
8%
95
61
b
(3/1
8)
Station # 1
Upper P
assaic R.
57
59
%9
56
1c
(3/1
8)
Station # 1
Upper P
assaic R.
87
67
%B
ioassay Mean
82
23
28
%9
56
2
(3/1
8)
Station # 3
Passaic R
., upstream of point source
96
89
%9
56
3
(3/1
8)
Station # 5
Lower P
assaic R., im
mediately uptream
15
11
06
%9
59
3
(3/1
8)
Station # 7A
Lower P
assaic R., point source
96
78
%9
59
4
(3/1
8)
Station # 7B
Lower P
assaic R., point source
61
46
%9
59
5
(3/1
8)
Station # 7C
Low
er Passaic R
., point source6
35
8%
Site M
ean7
32
02
7%
95
96
(3
/18
)S
tation # 8ALow
er Passaic R
., point source3
32
34
10
%9
59
7
(3/1
8)
Station # 8B
Low
er Passaic R
., point source3
91
34
9%
Site M
ean3
62
42
12
%9
56
4
(3/1
8)
Station # 10
Lower P
assaic R., im
mediately below
point source1
61
7%
95
65
(3
/18
)S
tation # 11Low
er Passaic R
., below point source
20
41
68
%9
56
6-1
(3
/18
)S
tation # 12H
ackensack R., N
orth of Berry's C
reek8
18
%9
56
6-2
(3
/18
)S
tation # 12H
ackensack R., N
orth of Berry's C
reek1
41
7%
Sam
ple Mean
11
44
1%
95
67
(3
/18
)S
tation # 14H
ackensack R., N
orth of Berry's C
reek4
22
6%
95
98
a
(3/1
8)
Station # 17
Hackensack R
., S. of B
erry's Ck./N
. of New
ark Bay
11
73
%9
59
8b
(3
/18
)S
tation # 17H
ackensack R., S
. of Berry's C
k./N. of N
ewark B
ay8
15
7%
95
98
c (3
/18
)S
tation # 17H
ackensack R., S
. of Berry's C
k./N. of N
ewark B
ay7
45
6%
Bioassay M
ean5
24
48
5%
95
68
(3
/18
)S
tation # 20M
outh, Hackensack R
./Upper N
ewark B
ay8
08
10
%9
56
9
(3/1
8)
Station # 21
Mouth, P
assaic R./U
pper New
ark Bay
11
11
09
%9
57
0
(3/1
8)
Station # 26
Upper N
ewark B
ay1
62
14
8%
95
26
(3
/18
)S
tation # 31U
pper/Mid N
ewark B
ay1
91
8%
95
29
(3
/18
)S
tation # 36Low
er/Mid N
ewark B
ay4
73
7%
95
28
-1
(3/1
8)
Station # 56
Lower N
ewark B
ay, Port R
ichmond, K
ill Van K
ull4
64
8%
95
28
-2
(3/1
8)
Station # 56
Lower N
ewark B
ay, Port R
ichmond, K
ill Van K
ull7
85
6%
Sam
ple Mean
62
23
37
%9
52
7
(3/1
8)
Station # 57
Upper N
ew Y
ork Harbor
20
9%
* Means w
ere used for site averages1
0%
mean C
V (precision)

Ap
pen
dix I. H
4IIE rat h
epato
ma b
ioassay co
ntd
.
Tab
le 7. (F12) - P
CD
D/P
CD
F fractio
n.
NFC
RC
S
amp
le IDF
ield ID
Site D
escriptio
nT
EQ
(pg
/g)
TCD
D-E
Q
(pg
/g)
95
61
Site 1
Upper P
assaic R1
56
70
95
62
Site 3
Passaic R
iver5
20
20
49
56
3S
ite 5Low
er Passaic R
, Upstream
of Pt. S
ource, 5g8
56
38
39
59
3S
ite 7ALow
er Passaic R
, Pt. S
ource, 5g7
48
44
09
59
3S
ite 7ALow
er Passaic R
, Pt. S
ource, 5g7
77
95
94
Site 7B
Lower P
assaic R, P
t. Source, 5g, R
ep 18
85
54
39
59
4S
ite 7BLow
er Passaic R
, Pt. S
ource, 5g, Rep 2
78
49
59
4S
ite 7BLow
er Passaic R
, Pt. S
ource, 5g, Rep 3
74
89
59
5S
ite 7CLow
er Passaic R
, Pt. S
ource, 5g1
26
12
92
95
96
Site 8A
Lower P
assaic R, P
t. Source, 5g
10
47
50
39
59
7S
ite 8BLow
er Passaic R
, Pt. S
ource, 5g6
48
54
19
56
4S
ite 10Low
er Passaic R
, Below
Pt S
ource, 5g, Rep 1
92
43
26
95
64
Site 10
Lower P
assaic R, B
elow P
t Source, 5g, R
ep 21
06
49
56
4S
ite 10Low
er Passaic R
, Below
Pt S
ource, 5g, Rep 3
10
63
95
65
Site 11
Lower P
assaic R, B
elow P
t Source, 5g
91
13
05
95
66
Site 12
Hackensack R
, N of B
erry's Creek, 5g
45
28
95
67
Site 14
Hackensack R
, N of B
erry's Creek, 5g
42
46
3
95
98
Site 17
Hackensack R
, S of B
erry's Creek, N
of New
ark Bay, 5g
10
52
0
95
68
Site 20
Mouth of H
ackensack R, U
pper New
ark Bay, 5g
16
43
29
56
9S
ite 21M
outh of Passaic R
, Upper N
ewark B
ay, 5g2
75
21
79
57
0S
ite 26U
pper New
ark Bay, 5g
85
78
43
95
26
Site 31
Upper-M
id-New
ark Bay, 5g
27
43
69
52
9S
ite 36Low
er-Mid-N
ewark B
ay, 5g2
22
12
3
95
28
Site 56
Lower N
ewark B
ay, Port R
ichmond, K
ill Van K
ull, 5g1
30
13
49
52
7S
ite 57U
pper New
York H
arbor, 5g1
77
95
27
Site 57
Upper N
ew Y
ork Harbor, 5g
12