magnetic reconnection processes induced by a cme expansion - … · 10831), located close to the...
TRANSCRIPT

Ann. Geophys., 26, 3017–3024, 2008www.ann-geophys.net/26/3017/2008/© European Geosciences Union 2008
AnnalesGeophysicae
Magnetic reconnection processes induced by a CME expansion
A. Bemporad1* , G. Poletto2, F. Landini3, and M. Romoli3
1INAF – Torino Astrophysical Observatory, via Osservatorio 20, 10025 Pino Torinese (TO), Italy2INAF – Arcetri Astrophysical Observatory, L.go E. Fermi 5, 50125 Firenze, Italy3Dept. of Astronomy and Space Science, University of Firenze, L.go E. Fermi 2, 50125 Firenze, Italy* Work partially made while at the Arcetri Astrophysical Observatory, L.go E. Fermi 5, 50125 Firenze, Italy
Received: 1 October 2007 – Revised: 22 January 2008 – Accepted: 12 March 2008 – Published: 15 October 2008
Abstract. On 10–11 December 2005 a slow CME occurredin the Western Hemisphere in between two coronal stream-ers. SOHO/MDI magnetograms show a multipolar magneticconfiguration at the photosphere: a complex of active regionslocated at the CME source and two bipoles at the base ofthe lateral coronal streamers. White light observations revealthat the CME expansion affects both of them and inducesthe release of plasma within or close to the nearby stream-ers. These transient phenomena are possibly due to magneticreconnections induced by the CME expansion and occurringinside the streamer current sheet or between the CME flanksand the streamer.
These events have been observed by the SOHO/UVCSwith the spectrometer slit centered at 1.8R� over about afull day. In this work we focus on the interaction betweenthe CME and the streamer: the UVCS spectral interval in-cluded UV lines from ions at different temperatures of max-imum formation such as OVI , Si XII and Al XI . These datagave us the opportunity to infer the evolution of plasma tem-perature and density at the reconnection site and adjacent re-gions. These are relevant to characterize secondary recon-nection processes occurring during a CME development.
Keywords. Solar physics, astrophysics,and astronomy(Flares and mass ejections; Ultraviolet emissions) – Spaceplasma physics (Magnetic reconnection)
1 Introduction
White light images acquired in the last ten years by the LargeAngle and Spectrometric COronagraphs (LASCO;Brueck-ner et al., 1995) on SOHO demonstrated that the occurrenceof a Coronal Mass Ejection (hereafter CME) quite often is
Correspondence to:A. Bemporad([email protected])
followed by the formation of one or more radial features con-necting the CME to the solar surface, some of them beingidentified as the CME flanks. Moreover, single radial whitelight features centered approximately at the CME latitude,connected with the expanding CME bubble and associatedwith EUV emission from unusually high temperature ions,have been ascribed to the post-CME current sheet (see e.g.Ciaravella et al., 2002; Ko et al., 2003; Raymond et al., 2003;Bemporad et al., 2006).
LASCO data suggest that the catastrophe loss of equilib-rium can be the primary driver of CMEs (see e.g.Liu etal., 2003) and the catastrophe CME models (e.g.Lin andForbes, 2000) predicted the formation of a current sheet con-necting the top of the reconnecting post-eruption loops withthe bottom of the expanding plasma bubble. However, thesemodels start from a simple bipolar magnetic configuration,while observations indicate that the CME occurrence is asso-ciated with much more complex magnetic topologies. Start-ing fromAntiochos et al.(1999), many quadrupolar configu-ration models have been developed and some recent versionsof these models (see e.g.Zhang and Wang, 2007) involvethe formation of two reconnecting current sheets, a trans-verse one above the rising flux rope and a vertical one be-low it (the same as in the catastrophe model). Despite thecomplexity reached by the actual CME models, so far littleis known about the role played by nearby coronal structures(e.g. two lateral streamers in the case of a quadrupolar con-figuration) and in general by the overall coronal magneticconfiguration in the CME occurrence, although recent UVand radio observations of flare associated CMEs suggest thatthe magnetic reconnection occurring between an expandingmagnetic structure and nearby open fields can play a role inthe eruption development (Goff et al., 2007; Demoulin et al.,2007)
In this work we focus on this subject by analyzing whitelight and UV observations of a CME that occurred on 10December 2005. In particular, after a description of the
Published by Copernicus Publications on behalf of the European Geosciences Union.
3018 A. Bemporad et al.: Reconnection processes induced by a CME
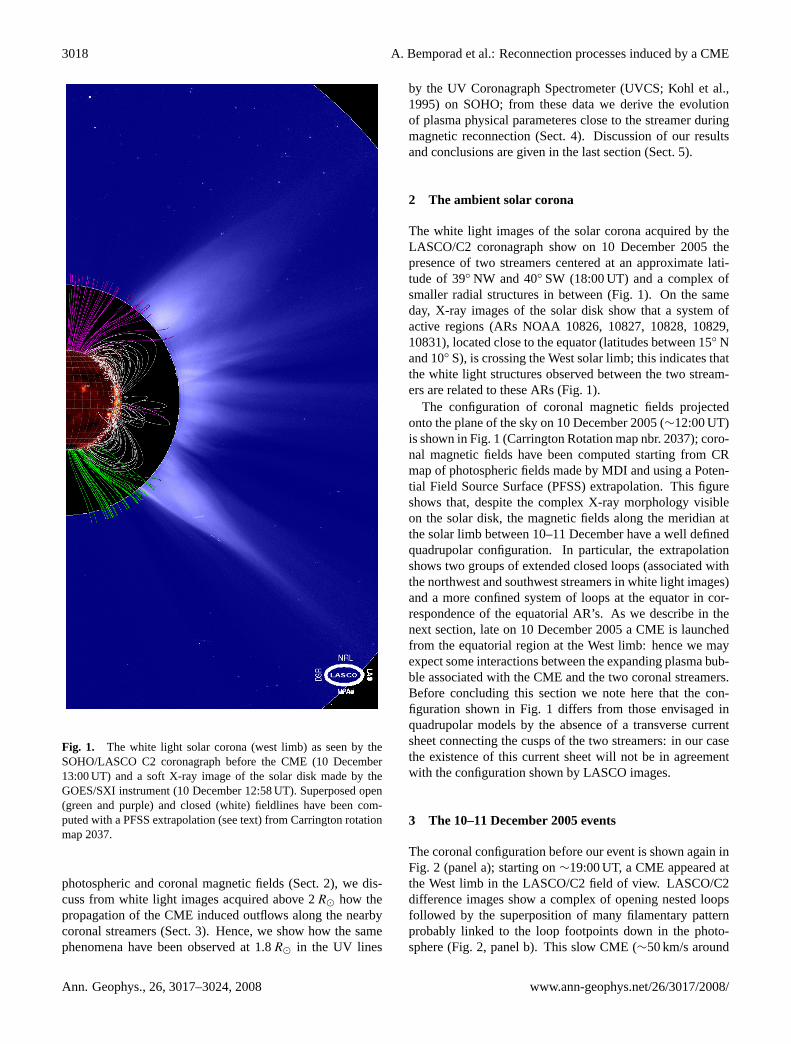
Fig. 1. The white light solar corona (west limb) as seen by theSOHO/LASCO C2 coronagraph before the CME (10 December13:00 UT) and a soft X-ray image of the solar disk made by theGOES/SXI instrument (10 December 12:58 UT). Superposed open(green and purple) and closed (white) fieldlines have been com-puted with a PFSS extrapolation (see text) from Carrington rotationmap 2037.
photospheric and coronal magnetic fields (Sect. 2), we dis-cuss from white light images acquired above 2R� how thepropagation of the CME induced outflows along the nearbycoronal streamers (Sect. 3). Hence, we show how the samephenomena have been observed at 1.8R� in the UV lines
by the UV Coronagraph Spectrometer (UVCS;Kohl et al.,1995) on SOHO; from these data we derive the evolutionof plasma physical parameteres close to the streamer duringmagnetic reconnection (Sect. 4). Discussion of our resultsand conclusions are given in the last section (Sect. 5).
2 The ambient solar corona
The white light images of the solar corona acquired by theLASCO/C2 coronagraph show on 10 December 2005 thepresence of two streamers centered at an approximate lati-tude of 39◦ NW and 40◦ SW (18:00 UT) and a complex ofsmaller radial structures in between (Fig. 1). On the sameday, X-ray images of the solar disk show that a system ofactive regions (ARs NOAA 10826, 10827, 10828, 10829,10831), located close to the equator (latitudes between 15◦ Nand 10◦ S), is crossing the West solar limb; this indicates thatthe white light structures observed between the two stream-ers are related to these ARs (Fig. 1).
The configuration of coronal magnetic fields projectedonto the plane of the sky on 10 December 2005 (∼12:00 UT)is shown in Fig. 1 (Carrington Rotation map nbr. 2037); coro-nal magnetic fields have been computed starting from CRmap of photospheric fields made by MDI and using a Poten-tial Field Source Surface (PFSS) extrapolation. This figureshows that, despite the complex X-ray morphology visibleon the solar disk, the magnetic fields along the meridian atthe solar limb between 10–11 December have a well definedquadrupolar configuration. In particular, the extrapolationshows two groups of extended closed loops (associated withthe northwest and southwest streamers in white light images)and a more confined system of loops at the equator in cor-respondence of the equatorial AR’s. As we describe in thenext section, late on 10 December 2005 a CME is launchedfrom the equatorial region at the West limb: hence we mayexpect some interactions between the expanding plasma bub-ble associated with the CME and the two coronal streamers.Before concluding this section we note here that the con-figuration shown in Fig. 1 differs from those envisaged inquadrupolar models by the absence of a transverse currentsheet connecting the cusps of the two streamers: in our casethe existence of this current sheet will not be in agreementwith the configuration shown by LASCO images.
3 The 10–11 December 2005 events
The coronal configuration before our event is shown again inFig. 2 (panel a); starting on∼19:00 UT, a CME appeared atthe West limb in the LASCO/C2 field of view. LASCO/C2difference images show a complex of opening nested loopsfollowed by the superposition of many filamentary patternprobably linked to the loop footpoints down in the photo-sphere (Fig. 2, panel b). This slow CME (∼50 km/s around
Ann. Geophys., 26, 3017–3024, 2008 www.ann-geophys.net/26/3017/2008/

A. Bemporad et al.: Reconnection processes induced by a CME 3019
3R�) expanded at a latitude of about 10◦ SW with an angu-lar width of ∼70◦: hence the CME propagated in betweenthe two streamers, with its flanks close to the streamer axes.
During the CME development LASCO images show theoccurrence of other interesting phenomena: starting fromabout 03:00 UT on 11 December the northwest streamer ap-pears to pinch off and the propagation of a concave Y-shapedfeature along the streamer axis is observed (Fig. 2, panels b–c). In the following hours a similar process occurs also in thesouthwest streamer that clearly shows the formation of a X-point in between two radial features approaching each other,the northward one being aligned with the CME southwardflank. The X-point stretches in two Y-shaped features, onepropagating outward along the streamer and the other rootedon the Sun, while a current sheet develops in between (Fig. 2,panel e). About 12 h later the pre-CME coronal configurationis mainly recovered (two streamers at intermediate latitude),but the equatorial region is less bright in white light likelybecause of the density decrease in the region where the CMEoccurred (Fig. 2, panel f).
Interestingly, the formation of the outward propagating Y-shaped feature in the south streamer is preceeded by a sec-ondary small ejection occurring northward of the streamerboundaries around∼12:00 UT (Fig. 2, panel d). A deeperstudy of this small event shows that it consist of an unstruc-tured eruption including many different blobs propagating atdifferent speeds (Fig. 3). From LASCO/C2 difference im-ages we concluded that in this small eruption the outflowspeeds span from∼40 km/s (feature indicated by a red arrowin Fig. 3) up to∼250 km/s (feature indicated by a blue ar-row in Fig. 3). LASCO difference images show clearly thissecondary eruption to arise from a region comprised in be-tween the southward expanding CME flank and the streamerboundary and to propagate mainly parallel to the CME flank.The correspondence between the orientation of the south-ward CME flank and the latitude of the secondary eruptionand of the northward approaching feature forming later theX-point suggests that these events are probably related to theCME expansion.
The northwest streamer event has been already studied byWang and Sheeley(2006): the authors found from LASCOimages that this streamer is slowly expanding in the days be-fore 11 December and that this expansion leads to the ob-served detachment. As pointed out by these authors, EIT andMDI data show the presence of a bipolar magnetic regionlocated below the northwest streamer and the emergenceof several smaller ARs located mainly around the equator.Wang and Sheeley(2006) concluded that this flux emergencedrives the streamer expansion until, via magnetic reconnec-tion in the expanding loop arcade, a non-equilibrium con-figuration is reached leading to the observed detachment.However, looking at LASCO movies it is evident that theCME and the streamer detachment occur together: hence itis likely that, at the end of the expansion described byWangand Sheeley(2006), the occurrence of the CME at the side of
Fig. 2. The white light solar corona (west limb) as seen by theLASCO/C2 coronagraph in standard (panels a and f) and runningdifference (panels b–e) images; panel(a): coronal configuration be-fore the event; panel(b): CME propagation; panel(c): northweststreamer detachment; panel(d): secondary ejection after the CME;panel(e): southwest streamer detachment; panel(f): coronal con-figuration after the events; observation times are indicated in eachpanel. The solid white line corresponds to the position of the UVCSslit field of view, while the dashed line shows the radial towards theslit center at a latitude of 35◦ S; UVCS observations respectivelystarted and ended rougthly at times corresponding to panels (a) and(c).
the streamer accelerates this process helping the reconnec-tion inside the streamer and destabilizing the overall mag-netic configuration. Although similar to this, the interpreta-tion we propose for the events occurring southward of theCME is not identical because we have to explain not only thestreamer detachment, but also the secondary eruption.
From the above considerations, taking also into accountthe coronal magnetic configuration described above, we ten-tatively explain the overall evolution as follows: the emer-gence of magnetic flux in the equatorial region leads to anunstable configuration that erupts as a CME and induces atthe same time the progressive expansion of the northweststreamer observed byWang and Sheeley(2006). Hence,
www.ann-geophys.net/26/3017/2008/ Ann. Geophys., 26, 3017–3024, 2008

3020 A. Bemporad et al.: Reconnection processes induced by a CME
Fig. 3. LASCO/C2 difference images showing the white light evo-lution during the secondary eruption. From these images we es-timated the outflow speeds of different features (tentatively iden-tified with arrows of different colors) that turn out to be between∼40 km/s (red arrowed feature) and∼250 km/s (blue arrowed fea-ture).
the northward and southward expanding CME flanks interactwith lateral streamers pushing the oppositely directed field-lines against each other and inducing magnetic reconnection.In the northwest streamer the reconnection is induced alongthe streamer current sheet leading to the observed detach-ment along the streamer axis. In the coronal region locatedsouthward of the CME the situation is more complicated, assuggested by LASCO difference images. As the CME propa-gates outward magnetic reconnection occurred first betweenthe expanding CME flank and the streamer boundaries, pro-ducing the observed secondary eruption (Fig. 1, panel d andFig. 4, panels 1–4). Different blobs propagating at differentspeed are probably produced by magnetic reconnection pro-cesses occurring at various altitudes and latitudes during theexpansion of the CME flanks towards the streamer bound-aries. Later on, the propagation of the secondary eruptionclose to the southwest streamer axis induces the magnetic re-connection along the streamer current sheet, leading to theformation of the two Y-shaped features described above that,accelerated by magnetic tension, propagate outward generat-ing the streamer detachment (Fig. 1, panel e and Fig. 4, pan-els 5–8). As explained in the next section, this interpretationis also supported by the evolution of the UV line intensitiesobserved during this event by UVCS below the LASCO/C2occulter.
4 UVCS observations
The position of the UVCS slit field of view is shown in Fig. 2(panels a–c): in particular the slit was centered at a latitudeof 35◦ S in the West limb and covered approximately a lat-itude interval between 3◦ N and 64◦ S, hence the slit wasfavourably located to observe both the CME and the evolu-tion of the southwest streamer. UVCS observed the coronawith a spatial resolution of 42 arcsecs (∼3×10⁴ km) and atime resolution of 2 min (exposure time) over a∼23 h timeinterval between 10 December, 08:29 UT (Fig. 2, panel a)and 11 December, 07:33 UT (Fig. 2, panel c). The selectedspectral intervals included the OVI λλ1032–1037A dou-blet lines, the H Lyman-β λ1025A and Lyman-γ λ973Alines and the SiXII λ520A, [Al XI ] λ550A second orderlines. During the observations the grating position has beenchanged, so that in the last dataset (∼7 h from 11 December,00:23 to 07:33 UT) we observed the [AlXI ] λ550A (non in-cluded in the previous datasets), but we did not observe theO VI λ1037 and SiXII λ520A lines. The [FeXIII ] λ510A(second order) and [FeX] λ1028A lines were also includedin the selected spectral intervals, but no significant emissionwas detected in these lines.
In order to increase the signal to noise ratio we averagedthese data over 2 spatial bins (reducing the spatial resolutionto∼6×10⁴ km) and 10 exposures (reducing the temporal res-olution to ∼20 min). By integrating each spectral line overthe observed profile and subtracting the average backgroundwe computed the evolution of line intensities at different spa-tial bins along the slit. The resulting intensity evolution ofO VI λ1032A is shown in Fig. 5 (panel a). At the begin-ning of the UVCS observations the southwest streamer wascentered approximately at a latitude of∼40◦ S, hence 5◦ or∼105 km from the slit center. Hence Fig. 5 (panel a) showsthat during our observations the main UV emission is asso-ciated with the southwest streamer and that apparently thereis no significant variation of the line intensity. In order tohighlight minor intensity variations (larger than the statisti-cal uncertainties) we show in Fig. 5 the OVI λ1032A lineintensity evolution after subtracting from each bin along theslit its intensity averaged over 1) the first 20 exposures ofobservation (i.e. 40 min; Fig. 5, panel b) and 2) the wholeobservation interval (∼23 h; Fig. 5, panel c). Both panels (b)and (c) show a more complex pattern: in particular, it is pos-sible to recognize the CME front and void, while the iden-tification of the CME core is more uncertain. Interestingly,these panels show that, during the CME propagation, two ap-proaching features are visible close to the streamer core: twobranches, initially at a relative distance of'3.6×10⁵ km inpanel (c), start approaching each other∼5 h after the UVCSobservations start. The two branches, both moving towardsthe center of the streamer, coalesce∼11 h after the UVCSobservation start (hence on 11 December, 00:30 UT), as weinferred by defining the “coalescence time” as the time theO VI emission peaks (see later).
Ann. Geophys., 26, 3017–3024, 2008 www.ann-geophys.net/26/3017/2008/

A. Bemporad et al.: Reconnection processes induced by a CME 3021
Fig. 4. A cartoon showing the interaction between the expanding CME and the southwest streamer: positive and negative polarities areshown as light and dark gray areas respectively; shaded regions represent coronal altitudes located below the LASCO/C2 occulter (gray) andin the UVCS field of view (red); dimensions are not to scale. As the CME expands (panela) magnetic reconnection is induced between theCME flank and the streamer (panelb); this reconnection proceeds towards higher levels leading finally to the secondary eruption (panelscandd). The propagation of the eruption close to the streamer axis leads to the streamer pinching by magnetic reconnection along the streamercurrent sheet (panele) and to the subsequent formation of the two Y-shaped features (panelf) and the final release of a streamer detachment(panelsg andh).
Fig. 5. The evolution of OVI λ1032A total intensity(a) and of the line intensity after the subtraction of the average pre-CME values(b) andof the average over the whole observation interval(c). Time in they axes is given starting on 10 December, 08:29 UT, while the “0” in thex-axes marks the position of the slit center. Colors range from 0 (black) to 3×10¹⁰phot cm−2 s−1 sr−1 (white) in panel a and from−6×10⁹
(black) to+6×10⁹ phot cm−2 s−1 sr−1 (white) in panels (b) and (c).
www.ann-geophys.net/26/3017/2008/ Ann. Geophys., 26, 3017–3024, 2008
3022 A. Bemporad et al.: Reconnection processes induced by a CME
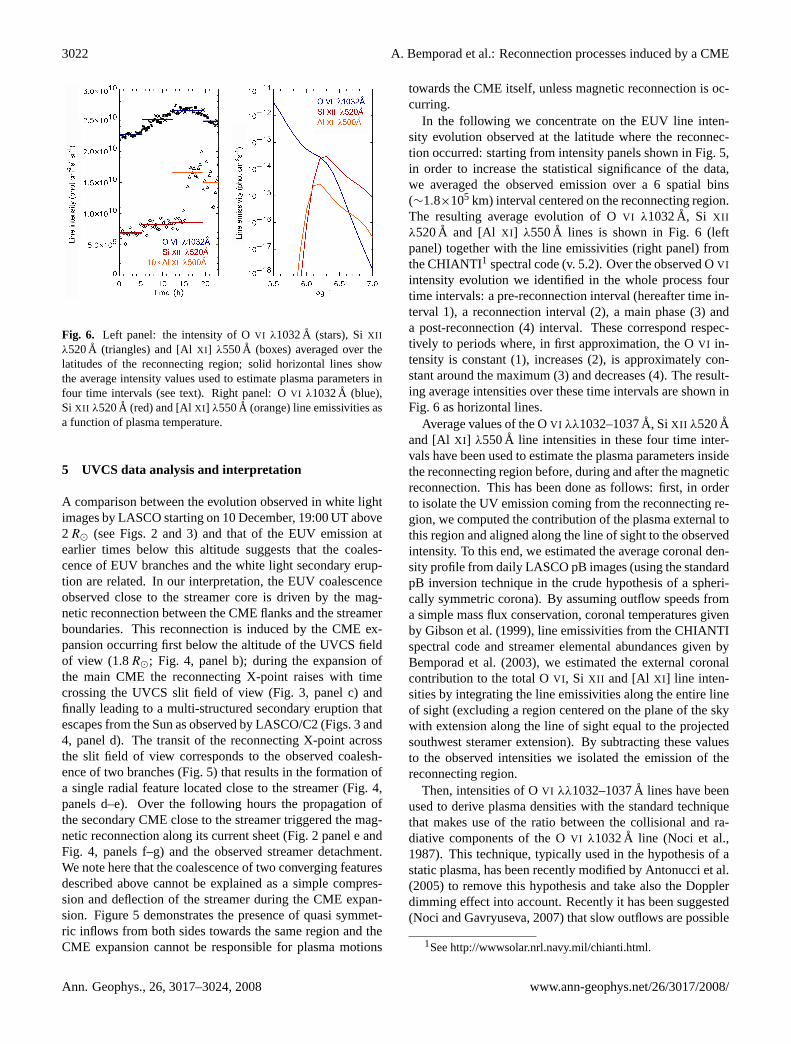
Fig. 6. Left panel: the intensity of OVI λ1032A (stars), SiXII
λ520A (triangles) and [AlXI ] λ550A (boxes) averaged over thelatitudes of the reconnecting region; solid horizontal lines showthe average intensity values used to estimate plasma parameters infour time intervals (see text). Right panel: OVI λ1032A (blue),Si XII λ520A (red) and [AlXI ] λ550A (orange) line emissivities asa function of plasma temperature.
5 UVCS data analysis and interpretation
A comparison between the evolution observed in white lightimages by LASCO starting on 10 December, 19:00 UT above2R� (see Figs. 2 and 3) and that of the EUV emission atearlier times below this altitude suggests that the coales-cence of EUV branches and the white light secondary erup-tion are related. In our interpretation, the EUV coalescenceobserved close to the streamer core is driven by the mag-netic reconnection between the CME flanks and the streamerboundaries. This reconnection is induced by the CME ex-pansion occurring first below the altitude of the UVCS fieldof view (1.8R�; Fig. 4, panel b); during the expansion ofthe main CME the reconnecting X-point raises with timecrossing the UVCS slit field of view (Fig. 3, panel c) andfinally leading to a multi-structured secondary eruption thatescapes from the Sun as observed by LASCO/C2 (Figs. 3 and4, panel d). The transit of the reconnecting X-point acrossthe slit field of view corresponds to the observed coalesh-ence of two branches (Fig. 5) that results in the formation ofa single radial feature located close to the streamer (Fig. 4,panels d–e). Over the following hours the propagation ofthe secondary CME close to the streamer triggered the mag-netic reconnection along its current sheet (Fig. 2 panel e andFig. 4, panels f–g) and the observed streamer detachment.We note here that the coalescence of two converging featuresdescribed above cannot be explained as a simple compres-sion and deflection of the streamer during the CME expan-sion. Figure 5 demonstrates the presence of quasi symmet-ric inflows from both sides towards the same region and theCME expansion cannot be responsible for plasma motions
towards the CME itself, unless magnetic reconnection is oc-curring.
In the following we concentrate on the EUV line inten-sity evolution observed at the latitude where the reconnec-tion occurred: starting from intensity panels shown in Fig. 5,in order to increase the statistical significance of the data,we averaged the observed emission over a 6 spatial bins(∼1.8×10⁵ km) interval centered on the reconnecting region.The resulting average evolution of OVI λ1032A, Si XII
λ520A and [Al XI ] λ550A lines is shown in Fig. 6 (leftpanel) together with the line emissivities (right panel) fromthe CHIANTI1 spectral code (v. 5.2). Over the observed OVI
intensity evolution we identified in the whole process fourtime intervals: a pre-reconnection interval (hereafter time in-terval 1), a reconnection interval (2), a main phase (3) anda post-reconnection (4) interval. These correspond respec-tively to periods where, in first approximation, the OVI in-tensity is constant (1), increases (2), is approximately con-stant around the maximum (3) and decreases (4). The result-ing average intensities over these time intervals are shown inFig. 6 as horizontal lines.
Average values of the OVI λλ1032–1037A, Si XII λ520Aand [Al XI ] λ550A line intensities in these four time inter-vals have been used to estimate the plasma parameters insidethe reconnecting region before, during and after the magneticreconnection. This has been done as follows: first, in orderto isolate the UV emission coming from the reconnecting re-gion, we computed the contribution of the plasma external tothis region and aligned along the line of sight to the observedintensity. To this end, we estimated the average coronal den-sity profile from daily LASCO pB images (using the standardpB inversion technique in the crude hypothesis of a spheri-cally symmetric corona). By assuming outflow speeds froma simple mass flux conservation, coronal temperatures givenby Gibson et al.(1999), line emissivities from the CHIANTIspectral code and streamer elemental abundances given byBemporad et al.(2003), we estimated the external coronalcontribution to the total OVI , Si XII and [Al XI ] line inten-sities by integrating the line emissivities along the entire lineof sight (excluding a region centered on the plane of the skywith extension along the line of sight equal to the projectedsouthwest steramer extension). By subtracting these valuesto the observed intensities we isolated the emission of thereconnecting region.
Then, intensities of OVI λλ1032–1037A lines have beenused to derive plasma densities with the standard techniquethat makes use of the ratio between the collisional and ra-diative components of the OVI λ1032A line (Noci et al.,1987). This technique, typically used in the hypothesis of astatic plasma, has been recently modified byAntonucci et al.(2005) to remove this hypothesis and take also the Dopplerdimming effect into account. Recently it has been suggested(Noci and Gavryuseva, 2007) that slow outflows are possible
1Seehttp://wwwsolar.nrl.navy.mil/chianti.html.
Ann. Geophys., 26, 3017–3024, 2008 www.ann-geophys.net/26/3017/2008/
A. Bemporad et al.: Reconnection processes induced by a CME 3023
below the altitude of 2R� along the boundaries of solar min-imum coronal streamers. Hence, in our computation we as-sumed that during the time interval 1 the plasma in the recon-necting region located at the streamer boundary is outflowingalong the pre-reconnection open fieldlines at∼50 km/s, inthe intervals 3 and 4 the outflow is negligible, while in inter-val 2 we assumed an intermediate speed of∼30 km/s. Densi-ties derived with this technique also depend on the unknownelectron temperatureTe: hence, assumingBemporad et al.(2003) streamer elemental abundances, we computed for dif-ferent temperatures the expected intensity of OVI , Si XII and[Al XI ] lines and we selected in each time interval theTe
value that better reproduces the observed intensities. Resultsfrom this technique are described and discussed in the nextsection.
6 Conclusions
Densities and temperatures inside and outside the reconnect-ing region are given in Table 1; in particular we concludethat before the CME this region was denser (∼+60%) andhotter (∼+50%) than the surrounding corona. Then, duringthe reconnection process, density and temperature increaserespectively by∼20% and∼30%; the results for the lasttime interval are only tentative because the OVI λ1037A linewas not included in the selected spectral range and the sep-aration between radiative and collisional components of theO VI λ1032A (needed to derive densities) has been done byassuming a constantI (1032)/I (1037) ratio. The observedtemperature increase can be due to the plasma that, pushedtowards the streamer by the CME expansion, is heated by anadiabatic compression. In this case the final temperatureTf
(in interval 3) reached by the compressed plasma would be
Tf = Ti ·
(ni
nf
)1−γ
' 2.0 × 10⁶ K
wherenf (m−3) is the electron density at the end of the re-connection process andni , Ti are the electron density andtemperature before the reconnection starts (see values in Ta-ble 1). This final temperature is slightly smaller than thatwe determined, but the difference is below the statistical un-certainties associated with our estimates. We may concludethat the plasma heating provided by the conversion of mag-netic to thermal energy via reconnection is, if any, negligi-ble: adiabatic compression heating dominates. This can beexplained by taking into account that the observed reconnec-tion occurred at high levels in the corona (1.8R�) where themagnetic fields are weak. However, starting from a typicalcoronal magnetic field of∼1–0.1 G, the density of magneticenergy isum=B2/(2µ)=4×10−3–4×10−5 J m−3; this valueis comparable with the observed variation of gas internal en-ergy density, which is given by
1e = 3K(nf Tf − niTi
)' 3 × 10⁻⁴J m−3
Table 1. Plasma parameters inside the reconnecting region.
Interval Te (K) ne (m−3)
Pre-rec. 1.8×10⁶ 6.5×10¹²
Rec. 2.2×10⁶ 7.2×10¹²
Main 2.5×10⁶ 7.6×10¹²
Post-rec. >2.5×10⁶ >1.0×10¹³
Corona 1.2×10⁶ 4.0×10¹²
This implies that magnetic fields close to the streamer bound-ary have to be lower than 1 G.
In conclusion, in this work we had the unique opportunityto study the evolution of plasma parameters inside a recon-necting region: we point out that this is the first time that areconnection process has been directly observed within theUVCS field of view as the progressive merging of two fea-tures. As we have shown, this process has been induced bythe nearby expansion of a CME: this may suggest that theinteraction of CMEs with extended coronal structures couldalso play a role in the overall evolution of these events. In thefuture we plan also to analyze the evolution of UV lines in-side the CME in order to derive informations on the plasmaphysical parameters at the CME front and void. Moreover,from the study of geometrical properties of the evolving cur-rent sheet in white light during the streamer detachment weplan also to derive informations on the reconnection rate andto compare this parameter with values predicted by CMEmodels.
Acknowledgements.A. Bemporad and G. Poletto thank ISSI (Inter-national Space Science Institute, Bern) for the hospitality providedto the members of the team on the Role of Current Sheets in the So-lar Eruptive Phenomena, where many ideas presented in this workhave been discussed. A. Bemporad and G. Poletto acknowledgesupport from ASI/INAF I/05/07/0 and I/035/05/0.
Topical Editor R. Forsyth thanks two anonymous referees fortheir help in evaluating this paper.
References
Antiochos, S. K., DeVore, C. R., and Klimchuk, J. A.: A Modelfor Solar Coronal Mass Ejections, Astrophys. J., 510, 485–493,1999.
Antonucci, E., Abbo, L., and Dodero, M. A.: Slow wind and mag-netic topology in the solar minimum corona in 1996–1997, As-tron. Astrophys., 435, 669–711, 2005.
Bemporad, A., Poletto, G., Suess, S. T., et al.: Current Sheet Evolu-tion in the Aftermath of a CME Event, Astrophys. J., 638, 1110–1128, 2006.
Bemporad, A., Poletto, G., Suess, S. T., et al.: Temporal Evolutionof a Streamer Complex: Coronal and in Situ Plasma Parameters,Astrophys. J., 593, 1146–1163, 2003.
www.ann-geophys.net/26/3017/2008/ Ann. Geophys., 26, 3017–3024, 2008

3024 A. Bemporad et al.: Reconnection processes induced by a CME
Brueckner, G. E., Howard, R. A., Koomen, M. J., et al.: The LargeAngle Spectroscopic Coronagraph (LASCO), Solar Phys., 162,357–402, 1995.
Ciaravella, A., Raymond, J. C., Li, J., et al.: Elemental Abundancesand Post-Coronal Mass Ejection Current Sheet in a Very Hot Ac-tive Region, Astrophys. J., 575, 1116–1130, 2002.
Demoulin, P., Klein, K.-L., Goff, C. P., et al.: Decametric N Burst:A Consequence of the Interaction of Two Coronal Mass Ejec-tions, Solar Phys., 240, 301–313, 2007.
Gibson, S. E., Fludra, A., Bagenal, F., et al.: Solar minimumstreamer densities and temperatures using Whole Sun Month co-ordinated data sets, J. Geophys. Res., 104, 9691–9700, 1999.
Goff, C. P., van Driel-Gesztelyi, L., Demoulin, P., et al.: A MultipleFlare Scenario where the Classic Long-Duration Flare Was Notthe Source of a CME, Solar Phys., 240, 283–299, 2007.
Ko, Y.-K., Raymond, J. C., Lin, J., et al.: Dynamical and Phys-ical Properties of a Post-Coronal Mass Ejection Current Sheet,Astrophys. J., 594, 1068–1084, 2003.
Kohl, J. L., Esser, R., Gardner, L. D., et al.: The Ultraviolet Coron-agraph Spectrometer for the Solar and Heliospheric Observatory,Solar Phys., 162, 313–356, 1995.
Lin, J. and Forbes, T. G.: Effects of reconnection on the coronalmass ejection process, J. Geophys. Res., 105, 2375–2392, 2000.
Liu, Y., Jiang, Y.-C., Ji, H.-S., et al.: Observational Evidence of aMagnetic Flux Rope Eruption Associated with the X3 Flare on2002 July 15, Astrophys. J., 593, L137–L140, 2003.
Noci, G., Kohl, J. L., and Withbroe, G. L.: Solar wind diagnosticsfrom Doppler-enhanced scattering, Astrophys. J., 315, 706–715,1987.
Noci, G. and Gavryuseva, E.: Plasma Outflows in Coronal Stream-ers, Astrophys. J., 658, L63–L66, 2007.
Raymond, J. C., Ciaravella, A., Dobrzycka, D., et al.: Far-Ultraviolet Spectra of Fast Coronal Mass Ejections Associatedwith X-Class Flares, Astrophys. J., 597, 1106–1117, 2003.
Wang, Y.-M. and Sheeley, N. R.: Observations of Flux Rope Forma-tion in the Outer Corona, Astrophys. J., 650, 1172–1183, 2006.
Zhang, Y.-Z. and Wang, J.-X.: A Catastrophic Flux Rope in aQuadrupole Magnetic Field for Coronal Mass Ejections, Astro-phys. J., 663, 592–597, 2007.
Ann. Geophys., 26, 3017–3024, 2008 www.ann-geophys.net/26/3017/2008/