magnetic properties - shodhgangashodhganga.inflibnet.ac.in/bitstream/10603/11826/10/10...electrons...
TRANSCRIPT

Chapter VI
MAGNETIC PROPERTIES
6.1 INTRODUCTION
All materials display some magnetic response, however most effects are
very small. Magnetism originates from the movement of electric charges. The
electrons in an atom govern magnetic properties of matter in two different ways.
The first is the electron acting as a spinning charged sphere, where the spin
resembles the magnetic field of a tiny bar magnet. The spin is a quantum
mechanical property and can be oriented in one of two directions, in the .up. (1)
direction or the .down. (1) direction. The second is the effect of the electron
circulating around the nucleus of the atom, which resembles a current loop [1].
The flow of charge in a circular current loop produces magnetic lines of force
known as a dipole [2]. In a bar magnet the magnetic force lines flow around the
dipole from north to south as depicted in Figure 6.1.
Figure 6.1 Magnetic field lines in a bar magnet
104

The magnetic moment of a material is the measure of the strength of the
dipole. An electron in an atom has a magnetic moment due to its spin and orbital
motion.
An orbiting electron's response to an applied magnetic field is governed
by the spin configuration of the material. The orbital motions of electrons create
atomic current loops, which generate the magnetic field. Therefore, all materials
inherently possess magnetic fields generated by the orbital motions of their
electrons.
6.2.1 Magnetization Terms
The quantities of magnetism are defined by fundamental concepts of
magnetic dipoles consisting of equal and opposite moments. Free currents
generate fields classified in terms of magnetic field strength or intensity (H) [3].
The magnetic induction (B) of a material is a function of H and the magnetization
or polarization (M) (Equation 6.2.1.1).
B=H + 47cM (6.2.1.1)
The magnetization (M) can be understood as the density of net magnetic
dipole moments (1) in a material (Equation 6.2.1.2).
M = µ total/ V (6.2.1.2)
The 4it factor in Equation 6.2.1.1 originates from the unit field created by a unit
polar on the surface of a sphere of 1 cm radius, which encloses the pole with a
surface area of 4it cm2 [4, 5]. The magnetic susceptibility (x) is a measure of the
effectiveness of an applied magnetic field for inducing a magnetic dipole in the
105

material. Magnetic permeability (1,1) is a ratio of the magnetic induction and
magnetic field strength (Equation 6.2.1.3).
1K1 B
_H = 6.2.1.3
If a material does not respond to an applied magnetic field the magnetic
permeability is simply the magnetic permeability of space (10), where
1,10 = 47( x le Tesla-m/A.
6.2.2 Magnetic Domains
The aligned spin arrangements in ferromagnetic, antiferromagnetic and
ferromagnetic materials are subdivided into regions (domains) throughout the
bulk material. Weiss proposed that the driving force for formation of magnetic
domains is to minimize the field energy of a magnetized material. The balance of
the energy necessary to form a domain wall and the energy conserved by the
existence of domains defines the lower limit of a domain size and therefore
domain formation is a finite process. The size of a domain is approximately 0.05
to 0.5 pm and is dependent on the intrinsic properties of each material [6]. The
boundary between two neighboring domains is a domain wall, which consists of a
rotation of the direction of the magnetic moment between discrete domains.
Figure 6.2.2 Domain wall [7].
106

Figure 6.2.2 Domain wall
6.2.3 Hysteresis
In an unmagnetized ferromagnetic or ferrimagnetic material the
collections of parallel spins in a domain are randomly oriented throughout the
material and therefore collectively self-cancel resulting in a minimal to zero net
magnetization. When placed in the presence of a sufficiently large external
magnetic field, the spins in each domain rotate parallel to the direction of the
applied magnetic field until all the dipoles are aligned. The plateau region of the
magnetization curve is the saturation magnetization (Ms) (Figure 6.2.3). Ms is a
measure of the magnetization (M) per gram basis and is given by
Ms = M/ p { emu/g} 6.2.3.1
where p is the density of the material (Equation 6.2.3.1). The smooth
curve depicts the rotation of the vector moment in the domain wall as the
magnetic field strength (H) is varied, actually occurs in very small jumps and is
referred to as the Barkhausen effect [3].
107

Magnetic Fit4d Intensity (Knot)
img
Figure 6.2.3 Magnetization (M) versus magnetic field strength (H) where Ms is the saturation magnetization (MR) is the remanence magnetization, and He is the coercivity.
When the applied field is decreased magnetization decreases. In multi-
domain bulk materials, demagnetization occurs primarily via spin rotation through
the domain walls [2,7]. If the demagnetization curve, during the removal of the
applied field, does not follow the initial magnetization curve, the material displays
hysteresis, which is the lag observed in Figure 6.2.3.
Remanence magnetization (Mr) is the magnetization remaining at zero applied
field (H = 0,). The magnetic field applied in the negative direction required to
return the magnetization to zero is the coercive force (I-1c) [8].
108
6.2.4 Magnetic Anisotropy
A magnetic material can be magnetized in any direction. The dependence
of magnetization on the direction of magnetization is known as magnetic
anisotropy.
The energy associated with the alignment of spins is described in its
simplest form as a uniaxial system given by equation
Ea =K sin 20 6.2.4.1
where K is the magnetic anisotropy energy constant and 0 is the angle
between Ms and the easy axis. The easy axis of a crystalline specimen is the
preferred direction of the total magnetization of the dipoles of a given material
[3]. Magnetocrystalline anisotropy is derived from spin-orbit coupling, which is
an intrinsic property dependent on the crystallographic orientation of the sample
and is independent of particle shape [8]. The magnetic susceptibility is greatest
when the saturation magnetization is induced along the easy axis of a material.
Shape anisotropy is the effect of the induced magnetization on the physical shape
of the specimen and is a significant factor for nonspherical materials [3].
6.2.5 Magnetic Properties of Small Particles Single Domain Particles
The width of a domain wall is a function of the magnetocrystalline
anisotropy, the exchange energy and lattice spacing of the crystal structure. The
domain wall is approximately a few hundred angstroms thick [9, 10]. As the
particle size decreases, the number of magnetic domains per particle decreases
109

down to the limit where it is energetically unfavorable for a domain wall to exist
[11, 12].
In 1930 Frenkel and Dorfman first formulated theories regarding the
single domain nature of particles below a critical diameter in 1930 [13]. In this
critical size range the nanoparticles are single domain materials. In the presence
of an applied magnetic field, the spins orientation and subsequent magnetic
saturation is achieved with lower field strengths than with the analogous bulk
materials. The magnetic moment of each particle is —405 times larger than for
transition metal ions and saturation magnetization is reached at applied magnetic
fields as low as 1 kOe [14]. When the field is decreased, demagnetization is
dependent on coherent rotation of the spins, which results in large coercive forces.
The large coercive force in single domain particles is due to magnetocrystalline
and shape anisotropies for nonspherical particles. The coercive force is also
dependent on particle size as shown in Figure 6.2.5.1
Figure 6.2.5.1 Coercivity as a function of particle sized (Dsp is the superparamagnetic size and Ds is the single domain particle size)
As particles the size of these single domain particles decreases, the
coercive force decreases. Moreover, the shape anisotropy increases as the aspect
110

ratio of a particle increases. Therefore, elongated single-domain particles (Figure
6.2.5.1) can display large coercive forces [11,12].
Superparamagnetism
The magnetic anisotropy, which keeps a particle magnetized in specific
direction, is generally proportional to the volume of a particle [15]. As the size of
the particle decreases, the energy associated with the uniaxial anisotropy (K)
decreases until thermal energy is sufficient to overcome any preferential
orientation of the moment in the particle. A single domain particle that reaches
magnetization equilibrium at experimental temperatures in short times relative to
the measurement time is commonly referred to as superparamagnetic. (Figure
6.2.5.2) [11].
Figure 6.2.5.2: 6.2.5.2: Domain structures observed in magnetic particles: a) superparamagnetic b) single domain particle c) multi-domain
particle
6.2.6 Magnetostriction
Magnetic materials experience changes in dimensions during
magnetization .This phenomenon is related to the thermal anomalies shown by
ferromagnetic substances around Curie point. For cubic materials, the changes in
dimension are isotropic i.e. only volume changes, but for hexagonal ferrites the
change of volume and shape is observed. These changes occur even when the
111

material is cubic but the magnetic order in non-cubic. This phenomenon is due to
the dependence of exchange energy on inter-atomic spacing.
6.2.7 Low Field and Low Temperature Magnetization Measurements Using
SQUID
Superconducting Quantum Interference Device (SQUID) is the most
sensitive device for magnetic field detection. The device has been developed for
traditional low temperature superconductors requiring cooling with liquid Helium
to 4 Kelvin (-269 °C). This measurement device is capable of measuring magnetic
fields in the order of femto tesla.
SQUID are the most sensitive detectors of magnetic flux. A SQUID is, in
essence, a flux to voltage transducer providing an output voltage i.e. periodic in
the applied flux with a period of one flux quantum, 4 0 = h/2e .One is generally
able to detect an output signal corresponding to flux change of much less than (I).
SQUID is able to measure any physical quantity that can be converted to flux, ex.
magnetic field, magnetic field gradient, current, voltage, displacement and
magnetic susceptibility. SQUID combines two physical phenomenon, flux
quantization and Josephson tunneling.
6.3 Initial Permeability
The origin of permeability of ferrites has been a subject of research for the
last so many years. Basically two processes are responsible for permeability viz.
(i) rotations of domains
(ii) domain wall displacement
112

It is generally assumed that the initial permeability is caused by the
reversible displacement of the domain walls, the contribution of rotation of spin
inside each domain being negligibly small on account of relatively high crystal
anisotropy. In polycrystalline ferrites, due to sintering, certain amount of pores are
present. In such a structure, domain walls will extend from pore to pore so that
they are not free to move. These pores have a considerable demagnetizing effect,
which leads to rather intrinsic pattern of Weiss domains. Hence it is impossible to
say in advance which kind of magnetization process will give the predominant
contribution to the initial permeability.
For the reversible rotational process, Chikazumi [16] has given the
permeability as
(u-1) =(constant) Ms 2 Sin° /K1 6.3.1
where 0 is the angle between Ms and u, for reversible wall processes,
permeability is ,
(u-1) = (constant) Ms 2S/a 6.3.2
where S= wall surface area
a =Second order derivative of wall energy with respect to wall
displacement.
At low frequency domain wall motion is a dominant mechanism. The
second source of initial permeability viz. domain rotation is largely responsible
for the high frequency permeability.
113

6.3.1 Models of Permeability
(i) Globus Model
Globus [17,18] has developed a model in which the initial permeability is
mainly due to the reversible motion of domain walls under a very small magnetic
field and contribution of the spin rotation is rather negligible. In this model the
domain wall is pinned at the grain boundaries and they bulge under the
application of magnetic field until the critical field is reached when the wall gets
unpinned. In such a model
(.4-1) = 3 Ms2D/16y 6.3.1.1
where Ms is saturation magnetization ,D is grain diameter and y is domain wall
energy per unit area as y— I MCI
= Ms2D/ I Kii 6.3.1.2
Such a model can be extended to the case where the domain walls are
pinned at intergranular pores i.e. span of domain wall.
Globus and co-workers [18, 19] realized that in polycrystalline ferrites the
magnetization mechanism might be different due to granular structure of ferrites.
They developed a model in which domain wall bulging of 180 ° instead of domain
wall displacement is responsible for the initial permeability.
In another model they [20,21] used the existence of easy axis in each
grain, the domain walls, under the influence of flux forces, tend to align
themselves along the director circle as best as they can in order to minimize the
demagnetizing field.
114

(iii) Non Magnetic Grain Boundary Model
The non-magnetic grain boundary model has been developed by
Johnson[22]. This model can account for the entire grain size dependence of at
low anisotropy as the Globus model cannot account for grain size dependence of
permeability when intergranular domain walls are absent. This model describes
the grain size dependence of rotational permeability in polycrystalline materials
[23]. According to this model there is almost linear dependence of permeability
on grain size for fine grained polycrystals where D<< pi 6.
It is given by the relation
Pe = pi D / (1,8 +D) 6.3.1.3
where li e = effective permeability, = complex
permeability ,
D= grain size, 6 =grain boundary thickness
For larger grain size where D>> 6, the model predicts constant
rotational permeability equivalent to that in single crystal of the same material
i.e. lie —
115

(iv) Two Pinning Model
In this model it is assumed that a component that varies with spatial co-
ordinates along the grain boundary is responsible for permeability [24-27]. The
microstress origin is due to disorientation of magnetic axis of the grains and their
sources are located on the grain boundary. As a result of alternation of the region
with best and worst coincidence on grain boundary, the magnetostrictional
deformation creates the inhomogeneous stress along grain boundary. Thus domain
wall is linked near grain boundary with the regions of increased anisotropy.
AK = (I 1(1 - I KID
6.3.1.4
6.3.2 Dependence of Initial Permeability
(i) Temperature Dependence
Temperature dependence of initial permeability is many times an
important parameter in a magnetic component. From the graph of variation of
initial permeability with temperature, the slope at a specific temperature can be
expressed as a material parameter called the temperature factor which is defined
as
Ti = AT/ Al.t,2 6.3.2.1
Where Ail, is the difference in permeability at temperatures T i and T2
respectively and AT is the change in temperature.
The temperature factor can be used to predict the variation in magnetic
properties of a magnetic component. A thermal hysteresis is observed when
temperature is cycled from higher temperature above Tc to lower temperature.
116

This is explained by taking into account the domain wall pinning component
between the intrinsic parameter Ms and K1 around the transition point [28].
(ii) Microstructure Dependence
The initial permeability is dependent on grain size, density and porosity.
Porosity causes hindrance to domain wall motion and it is very damaging to initial
permeability [29]. Microstructure plays a very important role because of fine
grains where there is reversal of magnetization by rotation since the domain walls
are energetically favorable in fine grains. Also the coercive force increases with
porosity because of internal demagnetizing field where the decrease in
permeability is caused by same cause. The larger grain size causes reduction in
initial permeability due to presence of voids that induce demagnetizing field and
impede domain wall motion. thus the grain size is a very important parameter in
the permeability. A duplex structure is undesirable because it lowers the
permeability. It is often due to particle impurity, which produces rapid growth
locally while other impeded areas are unaffected [13, 30].
(iii) Frequency Dependence
At low frequencies the domain wall motion is dominant mechanism and
permeability is almost independent of frequency. The domain structure is
responsible for high frequency permeability. At low frequencies, the applied field
causes domain wall shift and this motion results in change in net magnetization.
At high frequencies, the domain wall inertia precludes any appreciable wall
motion but the mechanism can rotate within each domain. This mechanism is
117

same as ferromagnetic resonance. Smit and Wijn [31] have explained the
extension of the loss over a relatively broad frequency region in terms of
additional effects upon the resonance condition due to demagnetizing field in the
domain structure.
6.4 A.C. Susceptibility
Curie temperature is one of the important parameters of any ferrite system.
The ferrimagnetic materials show quite resemblance in their magnetic properties
to those of ferromagnetic class. These materials show hysteresis and susceptibility
below transformation temperature i.e. Curie temperature. It is intrinsic property of
the spinel ferrites, which can be controlled by preparation conditions, sintering
temperature and doping of additives [32]. The microstructure, porosity and grain
size play dominant roles in deciding the a.c. susceptibility. A.C. Susceptibility
studies explore the existence of multidomain (MD), single domain (SD) and super
paramagnetic particles in the material. From the susceptibility curves, the Curie
temperature and domain structure can be estimated.
The different magnetic properties of Mn-Zn ferrite samples prepared by
both thermal decomposition technique and microwave decomposition technique
viz Saturation magnetization, hysteresis loss, initial permeability, a.c.
susceptibility, were studied.
118
6.5 EXPERIMENTAL TECHNIQUES
6.5.1 Saturation Magnetization and Hysteresis Loss
Sample preparation for measurement
Fine powders of samples Mn x Zni, Fee 04 obtained by both methods of
decomposition were pressed into pellets of the size 10mm diameter and of
thickness ranging between 2mm to 3mm under a pressure of 75KN applied for 3
minutes. Five sets of pellets were sintered in nitrogen atmosphere at temperatures,
950°C, 1050°C, 1150°C, 1250°C and 1350°C respectively for 3 hours separately in
a programmable carbolite furnace by setting heating and cooling rate at 5 °C per
minute.
The saturation magnetization and hysteresis loss measurements on the
samples were carried out using a high field hysteresis loop tracer described by
Likhite et al [33] and supplied by Arun electronics, Mumbai India. This
instrument consists of three major parts, electromagnet, pick-up coil and
balancing and integrating circuits.
The high field hysteresis loop tracer consists of an electromagnet working
on 50Hz mains frequency. The alternating magnetic field of about 3600 Oersted is
produced in an air gap of about 1 cm, in the instrument and a special balancing
coil is used to measure the saturation magnetization of the sample in the air gap.
Depending upon the magnetic induction in the specimen, pick-up coil produces a
field proportional to the magnetic induction of the specimen. A supporting coil
produces a signal which is equivalent to the strength of the magnetic field. When
119

the respective signals are supplied to the vertical and horizontal plates of an
oscilloscope, it displays a hysteresis loop on the screen.
A digital AC voltmeter, which connected to the output, displayed the RMS
value of the signal proportional to the saturation magnetization of the sample. The
calibration of the instrument was carried out using pure nickel as a standard
substance having magnetization of 53.34 emu/g.
Hysteresis loss was calculated by measuring the area of the loop.
Magnetic measurements were also carried out using vibrating sample
magnetometer (VSM) OXFORD (Oxford Instruments) MagLabVSM and EV
series VSM model EV-5 from ADE US. Retentivity and coercivity was also
obtained from VSM data.
Temperature and low field dependence measurements MH at 35K upto 5
Tesla & MT at 100 Oe from 1.8K to 300K. were studied by Quantum Design
MPMS-x17 SQUID magnetometer. The Mn-Zn nanoparticles for temperature-
dependent magnetization study was cooled from room temperature to 5K under
zero magnetic field.
6.5.2 Initial Permeability
Sample preparation for measurement
The fine powders obtained by thermal decomposition were pressed into
torroids of height ranging between 3mm. to 4mm. with inner and outer diameters
of 1cm and 2cms respectively by application of 75kN pressure for 5mins. The
torroids were sintered at 950 °C /1050°C /1150°C /1250°C /1350°C in nitrogen
atmosphere for 3hrs in a progressive manner. The heating and cooling rate was
120

fixed at 5°C /min during each sintering. Permeability measurements were carried
out after each temperature sintering. A fresh new winding of 100 turns of super
enameled doubly insulated copper wire of guage 33 was wound on each torroid
after each temperature sintering to carry out initial permeability (n) and loss
factor measurements as a function of temperature and frequency.
Inductance and loss factor values were recorded starting from room temperature
to 500 °C with a frequency variation from 50Hz to1MHz using HP 4284A
precision LCR meter.
The initial permeability (n) was calculated from the formulae
L=0.0046gi N2 h In (OD/ID)
Where L is inductance in Henry, N is the number of turns of copper wire on
torroid, h is height of the core in metres, OD is outer diameter of torroid in
metres, and ID is the inner diameter of torroid in metres.
121
6.5.3 A.C. Susceptibility
A.C. Susceptibility measurements of the powdered as well as sintered
samples were made using computerized Pulse field A.C. susceptibility apparatus
described by Likhite et al [34].
The apparatus consists of Helmholtz coil, two pick-up coils, furnace,
sample holder, a temperature measuring device, a control unit, data acquisition
system, a power supply to run the furnace and a PC with related software to
execute the run cycle. The Helmholtz coil is powered to produce pulsating
magnetic field. To avoid over heating of coils, a glass jacket with water
circulation was used. The furnace was inserted in glass jacket and was placed at
the centre of the pick-up coil. The sample holder was made up of quartz tube
fused at one end. The height of the sample holder was maintained at the centre of
the coils. The sample of known weight was placed in the sample holder; The data,
that is, magnetization (emu/gm ) as a function of temperature collected by the data
acquisition system is directly saved in a file on the PC which simultaneously
shows the progress of the curve. The temperature of the furnace was maintained
by a power supply and was measured by using platinum Rhodium thermocouple.
The sample was gradually heated and the magnetic moments were recorded at
various temperatures. The heating was continued till the magnetization (emu/gm)
signal reduces to zero. This happens when curie temperature is achieved.
122

75 - E 70 - bo 65 E 60 - a) • 55 -
• v■I
o • 50 - .1-74 45 - • 40 • 35 - bo E 30
0 T-44
(4 cd
25 20 - 15
10 —
6.6 RESULTS AND DISCUSSION
6.6.1 Saturation Magnetization
— 0— unsint. — 0— 950C —A-1050C —v-1150C - - 1250C —4 — 1350C
0.35 0.40 0.45 0.50 0.55 0.60 0.65
concentration of Mn
(a) Fig. 6.6.1.1(a): Variation of Saturation magnetization with conc. of Mn for
various sintering temperatures for the samples prepared by thermal decomposition
123

Satu
ratio
n m
agne
tiza
tion
in e
mu
/ gm
80
75
70
65
60
55
50
45
40
35
30 —
25 —
20 —
15-
10-
5—
—N— Unsint. —0— 950C
A— 1050C —v— 1150C —4— 1250C —4 — 1350C
0 0.45 0.50 0.55 0.60 0.65 0.70 0.75
Concentration of Mn
(b)
Fig. 6.6.1.1(b) :Variation of Saturation magnetization with conc. of Mn for various sintering temperatures for the samples prepared by microwave induced decomposition
124

The saturation magnetization for the samples prepared using thermal
decomposition technique Fig 6.6.1.1(a) shows two peaks. A local maximum is
found to appear for the sample Mno.4Zn0 6Fe204 that becomes more prominent for
sample sintered at 1150°C, the same is found to shift towards lower concentration
Mno . 35Zno 65Fe204 for sample sintered at 1050 °C. The second maximum, which is
more prominent, is seen to appear for Mn o 6oZno.40Fe204 sintered at 950°C,
1150 °C,1250°Cand1350°C; this maximum is found to occur at a lower Mn
concentration Mno55Zno.45Fe204 for samples sintered at 1050 °C with a dip for
Mno 45Zno.55Fe204. The unsintered sample shows a maximum value of saturation
magnetization, which is 51.63emu/gm for Mno.65Zno.35Fe204•
For the samples decomposed using microwave decomposition, the over all values
of saturation magnetization for unsintered samples are found to be higher the
highest being 63.03emu/g for the sample Mno.6 5Zn0.3 5Fe204. The samples sintered
at 950 °C are found to show a very unusual behavior almost all with exception of
Mno 65Zno 35Fe204 and Mno 67Zno 33Fe204 are found to show a ferrimagnetic to
paramagnetic phase transition. The ferrimagnetic behavior starts to re-appear in
the set of samples sintered at 1050C with a peak appearing at Mno 63Zno 37Fe204.
This peak is found to shift towards higher Mn concentration in the sample as can
be seen in Fig 6.6.1.1(b). The unsintered sample and the sample sintered at
1250 °C and1350°C are found to show two prominent peaks for saturation
magnetization. A high saturation magnetization of 74.54 emu/gm is observed for
the sample Mno ano 33Fe204 sintered at 1350 °C. This is higher as compared to
the samples prepared by the thermal decomposition method [35].
125

-801
1,0 -0.5 0.0 0.5
Field in Tesla
A 1.0
M
80 -
0- P
-20 - ;I I=
1
.; -eill 1
-SO -I - r
—........--.....
T ' T
-0.5 0,0
B 0.5 I .0
Field in. Tesla Fig 6.6.1.2.: Shows magnetic hysteresis curves obtained on VSM at room
temperature for as prepared samples (A) Mno 65Zno 35Fe204 (B) Mn 0 67Zn 0 33 Fe204 •
126
I
C
- 60
- 80
-1.0 -0.5 0.0 0.5 1.0
Field in Tesla
-10000 -5000 6 5000 10000
Field in Oe
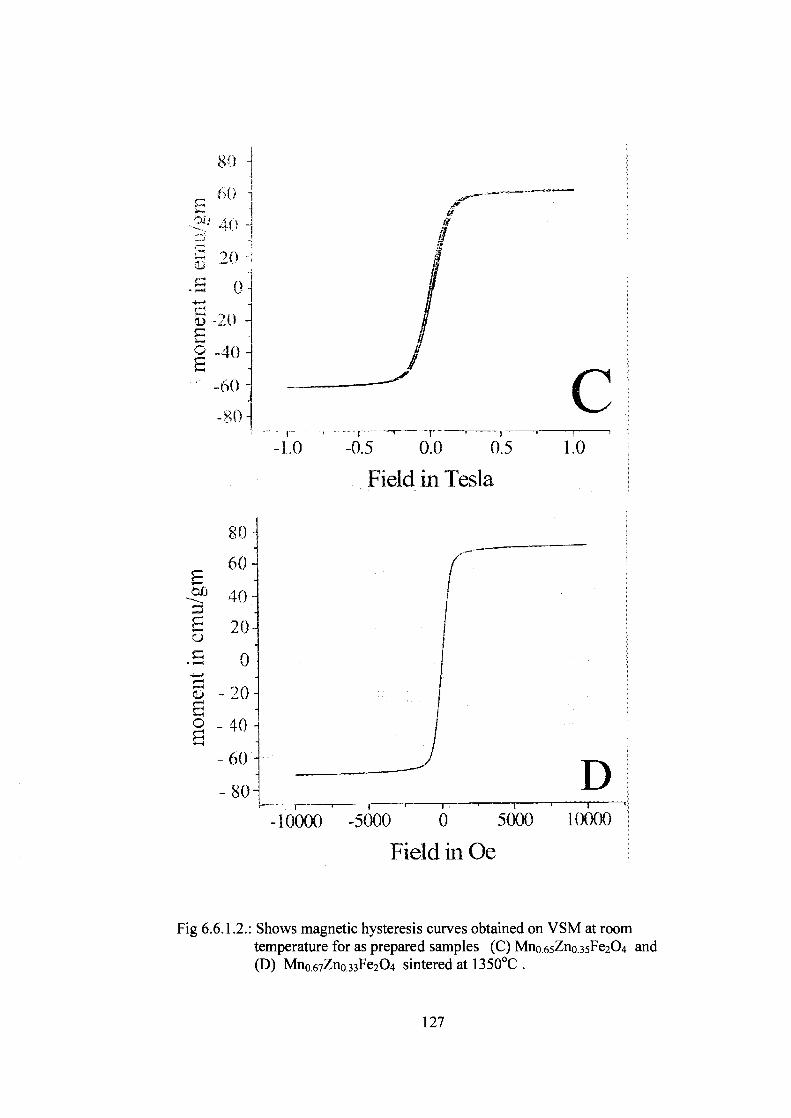
Fig 6.6.1.2.: Shows magnetic hysteresis curves obtained on VSM at room temperature for as prepared samples (C) Mno 65Zno.35Fe204 and (D) Mno 67Zno 33Fe204 sintered at 1350 °C .
127

Table 6.6.1 Magnetic properties of Mno ano3sFe2,04 and MnooZno 33Fe204 unsintered and sintered at 1350 °C.
Sample Mn„Zn (1-x) Fe204
Sintering temperature
°c
Retentivity Mr emu/gm
Saturation Magnetization Ms emu/gm
Squareness Mr/Ms
Coercivity Hc Oe
x=0.65 unsintered 30.74 63.20 0.65 86 x=0.67 unsintered 14.33 62.21 0.02 14.6 x=0.65 13500c 5.3227 64.58 0.0956288 47.2 x=0.67 13500c 0.1017 72.31 0.0015 1.06
A decrease in coercivity value Hc and squareness (Mr /Ms) is observed
for sintered samples as well as for increasing x value. This decrease can be
attributed to an increase in grain size and decrease in porosity of the sample.
The high values of retentivity Mr and the coercivity Hc for unsintered
sample Mn065Zno35Fe204 tend to shows single domain (SD) behavior of the
sample whereas the lower values of retentivity Mr and the coercivity Hc for
unsintered sample Mno ano33Fe204 indicates multi domain (MD) behavior of the
sample. MD samples contain more number of domain walls. The
magnetization/demagnetization due to domain wall movement requires lower
energy compared to that required for domain rotation [36]. Hence Mr and Hc
values in MD samples are lower compared to SD samples. On sintering the
samples the grain size increases and the material is expected to loose its SD
behavior. This phenomenon can be seen in sample Mno ano3sFe2,04 which
shows low values for Mr and Hc and a higher value for saturation magnetization
Ms when the sample is sintered at 1350 °C.
When the sample Mno 67Zno.33Fe204 is sintered at 1350 °C it is found to
show unusual behavior. The coercivity Hc drastically reduces to 1.06 Oe and the
128

—0— Unsintd. —•— 950C
A 1050C —v— 1150C
a 1350C
I ' I ' I I
squareness (Mr /Ms) reduces to 0.0015 which is extremely low. The saturation
magnetization increases to 72.31 emu/gm with zero power loss.
Hysteresis Loss
The hysteresis losses as shown in (fig.6.6.1.3) are found to be quite low
then reported [37,38] for unsintered as well as for sintered samples and are found
to depend on concentration of Mn and sintering temperature.
750 - 700 -
a) 650 - c-) 600 -,c) 550 - cid 500
450 ci) 400
350 cf)
-
-
300
cf) 250
;- ■ a) 200
150
I..* 100 -1-1-1
50
0
0.35 0.40 0.45 0.50 0.55 0.60 0.65
Conc. of Mn
(a) Fig. 6.6.1.3(a): Variation of Hysteresis loss with conc. of Mn for various
sintering temperatures for the samples prepared by thermal decomposition.
129

—0— Unsint. — 0— 950C —A— 1050C —v— 1150C
- 1250C —4— 1350C
700
600
500
CI) CA C)
(3) 1-4 400
CI) • •-1
C.)
CI) • 300 (3) 0 ;-4 •
4-•)(1) I, NC)
;-4 200 (I)
100
0.40 0.45 0.50 0.55 0.60 0.65
0.70
0.75
Concentration of Mn
(b) Fig. 6.6.1.3(b): Variation of Hysteresis loss with conc. of Mn for various
sintering temperatures for the samples prepared by Microwave induced decomposition.
SQUID measurements
Field dependent data were taken by sweeping the field while holding the
sample at fixed temperature, whereas the temperature dependence of the
saturation magnetization was measured by applying field of 1000e.
130

12 -
10 -
8 -
-2 -
100 0e
0 50 100 150 200 250 300
T(K)
(a)
4
100 -
50 -
E rn
E 0
-50 -
-100 -
-60000 -40000 -20000 0 20000 40000 60000
Magnetic Field (Oe)
(b)
Fig.6.6.1.4: (a) Temperature dependence of magnetization (b) Field dependent magnetization for as prepared sample Mn 0 . 70 Zn 030Fe204 prepared by Microwave decomposition.
131

SQUID measurements
Field dependent data were taken by sweeping the field while holding the
sample at fixed temperature, whereas the temperature dependence of the
saturation magnetization was measured by applying field of 1000e.
The magnetization of the sample was measured with the increase in
temperature when a field of 1000e is applied (fig 6.6.1.4a). The total
magnetization of the Mn-Zn nanoparticles is zero at 25K since the applied
magnetic field is not strong enough to overcome the magnetic anisotropy alone.
When the temperature rises, the magnetic anisotropy in some nanoparticles is
overcome due to thermal activation and the magnetization directions of these
nanoparticles align with the applied field, similar to a typical paramagnetic
material. The magnetization increases with temperature and a maximum is
reached at around 250K. This temperature is known as blocking temperature.
Beyond this temperature the magnetization is found to decrease with increasing
temperature. When the temperature reaches the blocking temperature, the
magnetization directions of almost all of the nanoparticles point to the field
directions and gives a high magnetization. As the temperature increases above
the blocking temperature, the sample follows a typical paramagnetic behavior of
decreasing magnetization [1,2].
The magnetic field dependence of magnetization of sample
Mn 0 70 Zn 0 30 Fe204 is shown in fig 6.6.1.4b. The field dependent magnetization
plot at 35K displays that the magnetization of the superparamagnetic
nanoparticles changes direction in unison with the direction reversal of the
132

applied magnetic field. Therefore, the magnetization direction changes
simultaneously with the reversal of the applied field at 35K [1,2]. A high
magnetization of 101 emu /gm is obtained for the sample at 5T.
6.6.2 Permeability and Loss Factor
Initial permeability (.4a) is an important magnetic parameter, which decides
the suitability of a ferrite for particular application. It is technologically important
extrinsic magnetic property, which is influenced by the microstructure, which in
turn depends upon the method of preparation. The initial permeability is
dependent on grain size, density and porosity of the material [39].
The Variation of permeability with the temperature for the samples
prepared by thermal decomposition and sintered at 950 °C, 1050°C, 1150°C,
1250°C and 1350°C is shown in Fig. 6.6.2.1(a, b, c, d & e) It is observed that
initial permeability increases slowly, reaches peak value at a certain temperature
and drops gradually to zero at Curie temperature. The maximum in initial
permeability corresponds to the point of zero anisotropy field [40]. The increase
in permeability with temperature is due to the fact that the anisotropy decreases
faster with temperature than the saturation magnetization.
133

14000 —
12000 —
10000 —
8000 —
6000 —
4000 —
2000 —
0 —
Init
ial p
erm
eabi
lity
Initi
al p
erm
eabi
lity
28000
26000
24000
22000
20000
18000
16000
14000
12000
10000
8000
6000
4000
2000
0
-2000
500 5 5 0 0 50 100 150 200 250 300 350 400 450
-2000 0 5 10 100 150 200
Temperature in degrees
(a)
2 50
Tem perature in degrees
(b)
Fig.6.6.2.1: Variation of initial permeability with temperature for sample Mn x Zn Fe2O4 Sintered at (a) 950 °C (b) 1050 °C
134

15000 —
Init
ial p
erm
eabi
lity
— IN— 0.65M n — 0— O.60M n
A— 0.55M n —v— 0.45M n
4 0.40M n —4— 0.35M n
20000 —
10000 —
5000 —
o —
22000
20000
18000
16000
14000
12000
10000
8000
6000
4000
2000
Initi
al p
erm
eab
ility
100 200 300 400 500
Temperature in degrees
(d)
0 100 200 300 400 500
Temperature in degrees
Fig.6.6.2.1: Variation of initial permeability with temperature for sample Mn x Zn Fe204 Sintered at (c) 1150 °C (d) 1250 °C
135

—•— 0.65Mn — 8— 0.60\41 - 0.55M, —•- 0.45Mn
o.4orvt, -4 0.35Mn
Temperature in degrees
(e)
Fig.6.6.2.1e: Variation of initial permeability with temperature for sample Mn x Zn Fe2O4 Sintered at 1350 °C
136

The variation of initial permeability with temperature for the sample
Mn 0 . 45 Zn 0.55 Fe2O4 sintered at 950 °C, 1050 °C, 1150 °C, 1250 °C and 1350 °C
is as shown in Fig.6.6.2.1. The drops are observed near Curie temperature and a
high value of initial permeability 25,472 at 150 °C for frequency 50Hz obtained
for sample Mn 0.45 Zn 0.55 Fe204 sintered at 1050 °C is much higher than the
reported values [41]. Samples Mn 035 Zn 0.65 Fe204, Mn 0,60 Zn 0 . 40 Fe2O4 and Mn
0.65 Zn 0.35 Fe2O4 when sintered at 950 °C shows very low room temperature
permeabilities where as, sample Mn 0.40 Zn 0.60 Fe2O4 shows high value of 2,753
and the sample Mn 0. 45 Zn 0 . 55 Fe2O4 shows a value of 13,831 for room
temperature permeability. However, the overall permeabilities for this sample are
found to increase as the temperature increases. Room temperature permeability
values are drastically changed when the same samples are sintered at 1050 °C.
Mn 0.40 Zn 0.60 Fe204, Mn 0. 45 Zn 0.55 Fe2O4 and Mn 0.55 Zn 0.45 Fe2O4 show
very low values whereas Mn 0 . 60 Zn 0 . 40 Fe2O4 shows higher value of pi and the
sample Mn 0. 65 Zn o . 35 Fe2O4 shows highest room temperature value for iu which is
higher than 10,000.
Sample Mn 0 . 45 Zn 0 . 55 Fe2O4 shows a high value of permeability i.e.
19,563 at 150°C when sintered at 1150 °C where as sample Mn 0 60Zno 40Fe204
shows a high value of permeability i.e. 20,042 at 100 °C when sintered at 1250 °C
.Samples when sintered at 1350 °C, Mn 0 55Zn 0 45Fe204 showed a high value of
initial permeability i.e.22,141 at 100 °C All these samples show broad peaks
followed by a gradual fall near Curie temperature as expected. For samples
sintered at 950 °C the curie temperatures is beyond 250 °C where as for samples
137

sintered at 1050 °C the Curie temperature lies between 100 °C and 500 °C.
Fig.6.6.2.2 (b)shows variation of maximum values of pi with Sintering
temperature for sample Mn 0 a5 Zn 0 . 55 Fe204. The variation of maximum value of
the permeability for the sample is found to show a peak at 1050 °C and a fall
followed by a rise at sintering temperature 1350 °C. Fig. 6.6.2.2 (a & b) can be
related to the existence of different crystalline phases which the samples
undergoes at different sintering temperatures [42] This is evident from the SEM
photographs and TEM photograph depicted in Fig. 6.6.2.3 (a, b, c, d ,e & f)
The initial permeability of high permeability material depends to a large
extent on mobility of the Bloch's domain walls. To obtain high permeability it is
important to reduce the crystalline anisotropy and the magnetrostriction. Ferrites
in particular are burdened with magnetic imperfections. Voids in bodies that are
not completely densified, non-magnetic inclusions are the factors, which give, rise
to internal magnetostatic energy. The stable domain configuration in a material is
always such is to minimize this energy. The loss that occurs is proportional to
imperfections of materials as well it's anisotropy, both crystalline and strain. High
permeability may be expected in polycrystalline material that are homogeneous,
dense and have composition that has very low value of anisotropy. Anisotropy is
temperature dependent property. Effect of this depends on the composition. The
anisotropy in Mn-Zn ferrite is highly dependent on the material composition. For
some compositions of Mn-Zn anisotropy takes negative value at room
temperature, increases monotonically with temperature to zero at Curie
temperature whereas for certain combinations of Mn-Zn it takes a negative value
138

increases to zero, takes a positive value and decreases to attain a zero value at
Curie temperature. This behavior is strongly reflected in the initial permeability of
the material. The initial permeability rises to maximum at both zero anisotropy
points with a saddle corresponding to the temperature at which anisotropy has a
maximum positive value [42, 43]. Well-adjusted sintering conditions support the
design of microstructure and resulting magnetic properties of the sample. SEM
micrographs (Fig.6.6.2.3) show the morphology of sample Mn 0 45 Zn o.55 Fe204
sintered at 950 °C, 1050 °C, 1150 °C, 1250 °C and 1350 °C respectively.
The sample sintered at 950 °C Fig. 6.6.2.3 (a) shows a more compact
microstructure with well-developed grains, however the existence of non-
magnetic voids is also large. The density of the sample is 2587Kg/m 3 . The
samples sintered at 1050 °C Fig. 6.6.2.3 (b) shows larger polycrystalline grains
with less non-magnetic voids and a density of 3200Kg/m 3 . The sample exhibits a
high value of permeability. The samples sintered at 1150 °C fig. 6.6.2.3 (c) shows
formation of well developed crystals and has a density of 3983Kg/m 3 . The
anisotropy for this sample is expected to be higher due to blocking of domain wall
movement and the strain isotropy, which is a result of increase in lattice stress.
The sample sintered at 1250 °C shown in fig. 6.6.2.3 (d) appears to be posses a
very high value of anisotropy and magnetrostriction compared to other samples.
This appears to be a stage with substantial magnetic imperfections and poor grain
growth. The sample has a density of 3867 Kg/m 3 . A different crystalline phase
with fewer imperfections is obtained for sample sintered at 1350 °C (Fig. 6.6.2.3
e). The density of this sample is found to be 3925Kg/m 3 .
139

The microstructures show different crystalline phases, which are
responsible for variations in anisotropy and domain wall movement in the sample.
Fig. 6.6.2.3 confirms the existence of polycrystalline phase in the sample
sintered at 1050 °C, which is one of the factors for enhancing the permeability
value of the sample.
140

--- 950C —• — 1 050C
1150C — v — 1250C
1350C
50 100 150 200 250 300 350 400 450 500
Temperature in Degrees
28000
26000
24000
22000
20000
18000
16000
14000
12000
10000
8000
6000
4000
2000
0
Init
ial P
erm
eabi
lity
(a)
- —0 .45 M n
26000 —
24000 —
22000 —
4. 20000 — .7" 18000 —
1 16000
14000 —
12000 —
10000 —
8000 —
6000 900
10 '00 11 '00 1200
s intering tem perature 1300 1400
(b)
Fig.6.6.2.2: (a) The variation of Initial permeability with temperature for the sample Mn a 45 Zn 0.55 Fe2O4 sintered at different temperatures.
(b) Variation of maximum value of initial permeability with sintering temperature for Mn o. 45 Zn o 55 Fe2O4
141

(a)
(b)
(e)
Fig.6.6.2.3: SEM Photographs of Mn 0 45 Zn o.ss Fe204 sintered in nitrogen atmosphere for 3hours at, (a) 950C(b) 1050C, (c) 1150C, (d) 1250C (e) 1350C .
142

(0
Fig.6.6.2.3: TEM Photograph of sample Mn 0 . 45 Zn 0 . 55 Fe204 sintered at 1050C.
143

o — • *
Rel
ativ
e lo
ss f
acto
r
160 -
140 -
120 -
100 -
80 -
60 -
40 -
20 -
—•-0.65Mn - - 0.60Mn
- - - 0.55Mn — v - 0.45mn
0.40Mn —•-0.35Mn
• • 1 • *—* * vow,* --* **********
2 3 4
Log f
5 6
2.0x10 2 -
Rel
ativ
e lo
ss f
acto
r 1.5x10 2 -
1.0x10 2 -
5.0x10 1 -
0.0 -
- -- 27C - -- 70C - --100C ---150C —•— 200C - 250C
300C • — 350C
•
• • • ***01* —0 ***111**1101*
-20
2
3 4 5 6
Log f
(b)
Fig.6.6.2.4 : Variation of relative loss factor with frequency (a) samples Mn x Zni_x Fe2O4 sintered at 1150 °C (b) Sample Mn 0 . 45 Zn 055Fe204 sintered at 1050 °C at different temperatures.
144

The ratio tans to Ili known as relative loss factor (rlf) is plotted against frequency
as shown in fig.6.6.2.4. It is observed that for some samples the value of rlf
rapidly decreases as the frequency is increased whereas it remains extremely low
for most of the samples for all sintering temperatures. The rlf is found to depend
on composition and microstructure of the sample, which is decided by sintering
profiles of the sample. In the present work the rlf values obtained range from 10 2
to as low as 10-6 , in the frequency range 50Hz to1MHz
6.6.3 A.C. Susceptibility
For ferrimagnetic materials, the variation of a.c. susceptibility versus
temperature has been reported by many workers [44-46]. From these curves the
curie temperature and domain structure have been estimated. It has also been
found that at curie temperature the curve drops almost to zero. Below curie
temperature, ferrites exhibit ferrimagnetic nature. Above curie temperature,
magnetic transition occurs from ferrimagnetic to paramagnetic.
In the present study, AC susceptibility measurements were carried out on low
field a.c. susceptibility equipment as well as on pulse field a.c. susceptibility
equipment.
The plots of the variation of normalized susceptibility (XT XRT ) with
temperature (T) are shown in fig.6.6.3.1
145

No
rma
lized
Su
scep
tibili
ty 0.8 —
0.6 —
0.4 —
0 2 —
0.0 —
300 350 400 450
T in K
500
■
550
1.0 —0— 0 .7 0 M n 0 .3 0 M n
Fig. 6.6.3.1: Normalized susceptibility (ratio XT IX (300)) as a function of temperature for Mnx Zn i-x Fe2O4
02 0.3 0.4 0.5 0.6 0.7
0.8
Unceriration of at (1-x)
Fig 6.6.3.2: Variation of Curie temperature with concentration of Zn in Mn (x) Zn i-x Fe2O4
146

Table 6.6.3.1 : Experimentally determined curie temperatures for samples Mn x Zn i_x Fe2O4 prepared by thermal decomposition method
Zinc Conc.
Unsintered Sintered 950C
Sintered 1350c
1-X Tc Tc Tc
0.30 550 540 520
0.35 570 528 510
0.40 750 524 510
0.45 580 500 490
0.50 610 480 440
0.55 380 430 400
0.60 675 390 360
0.65 590 365 330
0.70 400 320 310
Curie temperature for samples in nano phase were found to be size
dependent. A high Tc of 750K and a low Tc of 380K were observed for the
samples. The A.C. susceptibility curves obtained on low field a.c. susceptibility
equipment for unsintered and sintered samples prepared using thermal
decomposition (fig.6.6.3.2) are typical to curves obtained for fine particle ferrite.
The nature of the x ac — T plots for sample Mn 0.70 Zn 0 . 30 Fe2O4 exhibits SD
behavior whereas sample Mn 0 . 30 Zn 0 .70 Fe204 exhibits a mixture of SD and MD
behavior with other samples with x= 0.65, 0.6,0.55,0.5,0.45,0.4,0.35 exhibiting
near SD behavior [47]. It can therefore be concluded that, the normalized
susceptibility versus temperature curves indicate ferrimagnetic behavior [48,49].
147

From these curves the curie temperatures of all the samples are determined. The
lowest Tc of 310K and the highest Tc of 730K was obtained for Mn o.3o Zn 0.70
Fe2O4 and Mn 0.70 Zn 0.30 Fe2O4 respectively. For sintered samples the curie
temperature was found to decrease with increase in sintering temperature.
Fig 6.6 shows the susceptibility curves obtained on pulse field a.c. susceptibility
equipment for the samples prepared by thermal decomposition.
A high Tc of 725K and a low Tc of 484K were observed for the samples Mn 0.45
Zn 0.55 Fe2O4 and Mn 0.55 Zn 0.45 Fe2O4 respectively.
148

48
36
S 30
24
18
12
(a) (b)
32
28
1 24
20
16
12
s
8 30 74 118 162 206 250 294 338 382
Temature (•c)
O S
Spec
ific
Mag
neti
zati
on
(enu
/gn)
48
S
2
2 4
6 • '•
S 1 71 9 1 111 131 15 I. 1 71 A. 91
ahrnilack r- 't C
c
Fig 6.6.3.3: Variation of Specific magnetization with temperature for the samples (a) Mn 0.40 Zn 0.60 Fe204 (b) Mn 0.45 Zn 0 . 55 Fe204 and (c) Mn 0.55 Zn 0.45 Fe204
149

30
1 26
o az
10
Spec
ific
Mag
neti
za
tio
n
(enu
/gn
)
2 30 50 70 90 110 130 150 170 190
Tengrratur.
64
(c)
(a)
The pulse field A.C. susceptibility curves obtained for unsintered samples
prepared using microwave decomposition are shown in (fig.6.6.1)
30 136 242 348 454 560 !tar-. C -e)
(b)
64
36
I
22
,22
"
98 6a 94 126 138 198 222 234 286 Tnnoaratur. •e9
(d)
Fig 6.6.3.4: Variation of Specific magnetization with temperature for the samples (a) Mn 0.40 Zn 0.60 Fe204 (b) Mn 0.50 Zn 0.50 Fe204
(c) Mn 0.60 Zn o ao Fe204 (d) Mn 0 . 63 Zn 0.37 Fe204
150

6
56
40
; 24
16
0 78 102 126 150 179 198 222 31 59 87 115 143 171 199 227 233
Tarmera to Ir• ( • c ) l'enros rrrrrr C•c•
(e) (0
0 30 6 4 98 132 166 200 234 268 302
Termaer-alture
(g)
Fig 6.6.3.4: Variation of Specific magnetization with temperature for the samples (e) Mn 0 . 65 Zn 0 . 35 Fe204 (0 Mn 0.67 Zn 0.33 Fe204 and (g) Mn 0 . 70 Zn 0.30 Fe204
Spe
cif
ic
Mag
ne
tiz
ati
on
(e
mu/
gm
)
80
70
60
30
.40
30
20
1
From these curves the curie temperatures of all the samples are determined.
151

Table 6.6.3.2: Curie temperatures for samples Mn x Zn 1 -x Fe204 prepared by microwave decomposition method
Conc. of Mn
Unsintered
1-X Tc in K
0.40 523
0.50 613
0.60 513
0.63 593
0.65 519
0.67 558
0.70 626
The lowest Tc of 519K and the highest Tc of 626K was obtained for Mn
0.60 Zn 0.40 Fe2O4 and Mn 0.70 Zn 0.30 Fe2O4 respectively. From the plots it appears
that most of the samples prepared using microwave decomposition exhibits a
mixed SD-MD behavior.
152

(a) (b)
69
56
1
V
5. 40
29
16
a
30 58 86 119 142 170 190 226 259 Temperature *8)
70
60
50
• 40
0
U30
t 20
80
70
Specific Magnetization
fenuign
)
60
50
40
30
20
10
0 38 70 102 134 166 198 230 262 294
Temmeratur. C..)
Fig 6.6.3.5: Variation of Specific magnetization with temperature for the samples sintered at 1350°C (a) Mn 0 . 55 Zn 0.45 Fe204 (b) Mn 0.60 Zn 0.40 Fe204 and (c) Mn 0.65 Zn 0.35 Fe204
153

For sintered samples the curie temperature was found to be in the range of
400K to 600K. It is observed that Curie temperature decreases with sintering
temperature. Curie temperature was found to change with change in concentration
of Zinc in the sample [50,51].
154

References
[1] A. Beiser, Modern Technical Physics, 2 ed., Cummings Publishing
Company, Menlo Park, (1973).
[2] C. Kittel, Introduction to Solid State Physics, Wiley, New York, (1976).
[3] C. M. Sorensen, Nanoscale Materials in Chemistry , John Wiley and Sons,
Inc., New York, (2001) 169.
[4] P. C. Scholten, J. of Magnetism and Magnetic Materials 57 (1995)
149.
[5] C. Chen, Magnetism and Metallurgy of Soft Magnetic Materials, Dover
Publications,Inc., New York, (1986).
[6] D. J. Dunlop, Science 41,(1972) 176.
[7] S. R. Elliott, The Physics and Chemistry of Solids, John Wiley & Sons,
New York, (1998).
[8] D. L. Leslie-Pelecky, R. D. Rieke, Chemistry of Materials 8 (1996) 1770.
[9] S. Wells, University of Wales (Wales), (1989).
[10] J. Smit, H. P. J. Wijn, Ferrites, John Wiley & Sons, New York, (1959).
[11] M. Ozaki, in Fine Particles: Synthesis, Characterization, and Mechanisms of
Growth,Vol. 92 (Ed.: T. Sugimoto), Marcel Dekker, Inc., New York, 2000.
[12] E. P. Wohlfarth, J. of Magnetism and Magnetic Materials 39 (1983)
39.
[13] C. P. Bean, J. D. Livingston, J. of Applied Physics 30 (1959) 120.
[14] E. Blum, A. Cebers, M. M. Maiorov, Magnetic Fluids,
Walter de Gruyter, Berlin, (1997).
155

[15] R. H. Kodama, A. E. Berkowitz, Physical Review B 59, (1999) 6321.
[16] S. Chikazumi "Physics of Magnetism" Wiely, New York (1996).
[17] A. Globus J.Physique Coll.,C1 (1963) C1.1-C1.15.
[18] A. Globus Cardiff ConfUSA, (1975).
[19] A. Globus and P. Duplex Phys.Stat Solidi , 31 (1968) 75.
[20] A. Globus and M. Gayut IEEE Transactions on magnetics, 6 (1970) 614.
[21] A. Globus, Thesis, Univ. of Paris, France (1963).
[22] M. T. Johnson and E.G.Vissar IEEE Trans. Magn. MAG-26 (1990) 1987.
[23] P. J. Vender Zaag, J.J.M.Ruigrok, A.Noordermeer,M.H.W.M.van Deiden,
P.J.Por, Recveltk, D.M.Sonnet and J.N.Chapman. J.Appl.Phys,74 (6)
(1993) 4085.
[24] H. Piscard and A.Globus , Phys. Rev. B 24 (1981) 6610.
[25] G. Rankis Bull. Latv. Acad.Sci., Phys Tech. Sci., N2 (1984) 27.
[26] A. Globus J.Phys. (France) 38 (1977) 1.
[27] J. Gieraltowski, "Interdependence between the grain size and the wall
dimension in magnetically soft ferrites", Ferrites, Proc. International Conf.,
Japan (1980) 277.
[28] H.Rikukawa ,IEEE Trans. On Magn., 18 (1982) 1535.
[29] C.Guillaud Proc. IEEE, 704 (B) (1957) 165.
[30] C. Kittel, Physical Reviews, 70 (1946) 965.
[31] J. Smit and H.P.J.Wijn "Ferrites" John Wiley, New york, (1959).
[32] Sattar A A and El-Shokrofy K M J. Phys. IV France 7 Colloq (1997) , Cl-
245.
156

[33] S.D.Likhite and C. Radhakrishnamurthy and P.W.Sahasrabudhe,
Rev.Sci.Instr. 25, (1965), 302.
[34] S.D.Likhite and C.Radhakrishnamurthy,curr.sci. 35 (1966) 534.
[35]R.B. Tangsali, S.H. Keluskar, G.K.Naik, J.S.Budkuley , International
J. of Nanoscience 3, (4 & 5) (2004) 1-9.
[36] A. Verma, T. C. Goel, R. G. Mendiratta, P. Kishan,
J. Magn. Magn. Mater. 208 (2000) 13-19.
[37] S R Murthy, Bull. Mater. Sci., 26 ( 5) ( 2003) 499-503.
[38] M.Muroi, J.Amighian, R.Street and P.G.Mc Cormick, Digest of 8 th int. Conf.
Ferrites, Kyoto, Japan, 2000.
[39] Rondinone A. J., Samia A.C. S., Zhang Z. J. J. Phys. Chem. B,
103 (1999) 6876.
[40] Chao Liu, Bingsou Zou, Adam J. Rondinonen and Z. John Zhang J. of
Phys. Chem. B, 104 (2000) 1141-1145.
[41] Goldman, Modern Ferrite Technology«, Van Nostrand Reihold 1990,
New York (1997) 286-287.
[42] K. J. Standley, 'Oxide Magnetic Materials' (oxford: claredon Press, 1972).
[43] S. H. Keluskar R.B. Tangsali , G.K.Naik, J.S.Budkuley,
J. of Magnetism and magnetic Materials. (In Press)
[44]. J. Schnettler, »Physics of Electronic Ceramics, Part B«, Marcel Dekker,
Inc, 1972 New York
157

[45] Verma, T. C. Goel, R.G. Mendiratta, P. Kishan, J. of Magnetism and
Magnetic Materials 208 (2000) 13-19.
[46] C. Radhakrisnamurty, J.Geol. Soc.India, 26(9) (1985) 640.
[47] R.V. Upadhaya, G.J. Baldha and R.G. Kulkarni, Mater. Res. Bull. 21
(1986) 1015.
[48] G.J. Baldha and R.G. Kulkarni, Solid State Commun. 53 (1985)11.
[49] J. Hopkinson, Philos. Trans. R. Soc. (Lon.) 180 (1889) 443.
[50] C.Radhakrishnamurty, S.D. Likhite, E. R. Deutsch and G.S. Murthy, Phys.
Earth and Planet. Inter., 130 (1982) 281.
[51] R.S.Chaughule, C.Radhakrinamurty, E.V.Sampathkumaran,S.K.Malik and
R.Vijayraghavan, Mat Res. Bull. 18 (1983) 817.
[52] Radhakrishnamurthy C, Likhite S D and Sastry N P Philos.Mag. 23 (1971)
503.
[53] Radhakrishnamurthy C, Likhite S D and Sahasrabudhe P. W. Proc.
Indian Acad. Sci. (Chem. Sci.) A87 (1978) 245.
158