magicbox report - unicef
TRANSCRIPT

COVID-19MagicBox report10 October 2020
Understanding the effects of physical distancing measures on human behavior using near-real-time mobility data
Manuel Garcia-Herranz, Andrea Martini, Vedran Sekara, Do-Hyung Kim

10 Oct 2020
Why this report ? ..................................................................................................... page 3
Recaps ...................................................................................................................... page 4
Introduction ............................................................................................................ page 6
Highlights ................................................................................................................ page 8
Data ......................................................................................................................... page 9
Limitations ............................................................................................................ page 10
Indicators .............................................................................................................. page 11
Global overview .................................................................................................... page 14
Comparison across countries ............................................................................. page 15
Summary ............................................................................................................... page 18
Annex I (country level analysis) ............................................................................ page 19
Annex II (comparison of data sources) .................................................................page 30
Document overview
More info at: https://www.unicef.org/innovation/magicbox/covid

10 Oct 2020
Why this report?
UNICEF has focused, since the beginning of the pandemic, on understanding the socioeconomic impacts of COVID
and how it affect the most vulnerable children. Special attention has been put on mitigating the effects of non-
pharmaceutical interventions on areas such as: education, non-COVID vaccination campaigns, access to
healthcare, mental health, nutrition, and poverty.
These efforts require fine-grained and up-to-date data on important indicators alongside better tools to untangle
their complex interrelationships to COVID-19 (see Tracking the situation of children during COVID-19).
Human mobility data from MagicBox allows us to study the direct impacts of physical distancing policies. We do
this across multiple dimensions, from how socio-economic inequalities result in unequal changes in daily travel
patterns, to the effectiveness of policies, and their sustainability over time.
Mobility data is also used as a key layer to better understand the special needs that communities may have in access
to services or support, and in order to ultimately develop more targeted, efficient and context-aware control
measures for COVID-19.
10 Oct 2020
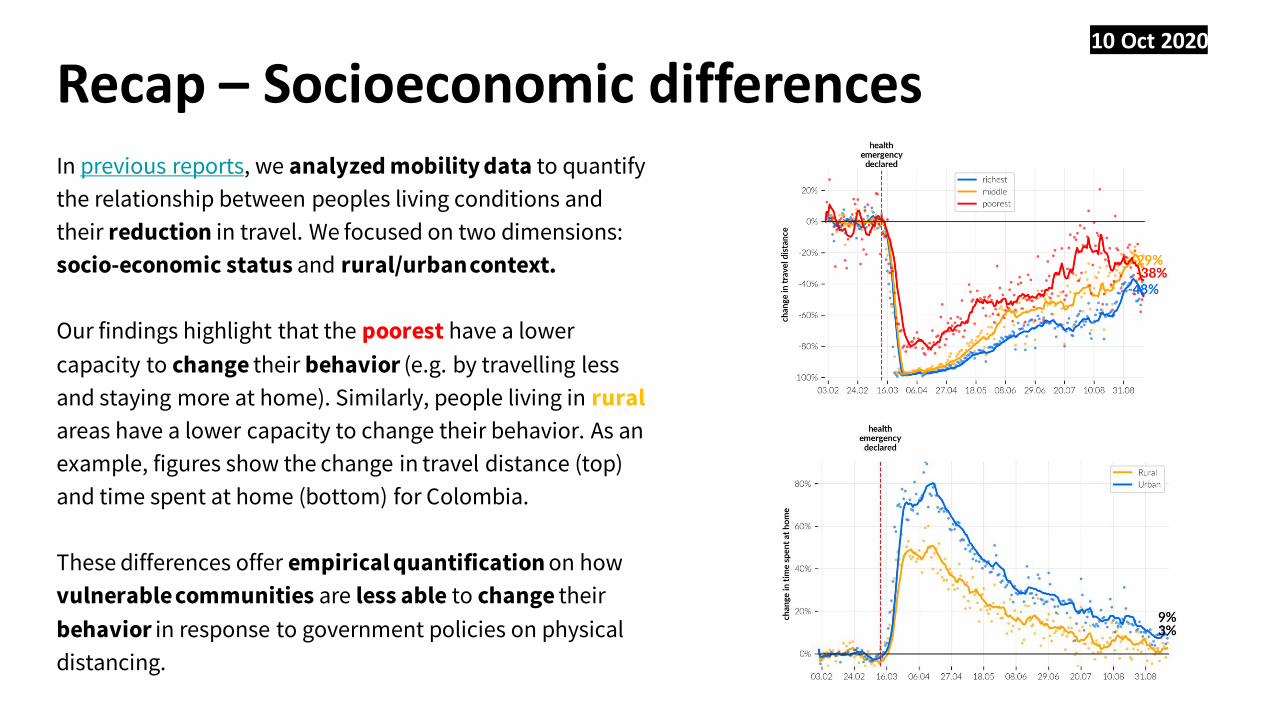
Recap – Socioeconomic differencesIn previous reports, we analyzed mobility data to quantify
the relationship between peoples living conditions and
their reduction in travel. We focused on two dimensions:
socio-economic status and rural/urban context.
Our findings highlight that the poorest have a lower
capacity to change their behavior (e.g. by travelling less
and staying more at home). Similarly, people living in rural
areas have a lower capacity to change their behavior. As an
example, figures show the change in travel distance (top)
and time spent at home (bottom) for Colombia.
These differences offer empirical quantification on how
vulnerable communities are less able to change their
behavior in response to government policies on physical
distancing.

10 Oct 2020
A study from Tokyo [4] (see bottom figures) shows that
mobility restrictions have the highest impact on children
under 15.
Near-real-time mobility is therefore a valuable indicator to
assess the impacts of government policies on different
societal groups.
Many governments have introduced physical distancing
measures to fight the transmission of COVID-19, including
schools closures (see top figures from UNICEF’s Data &
Analytics Platform [1]). For many children, especially in low-
and middle-income contexts, these restrictions affect not only
their education but their access to health services and
nutrition. Closing school has a plethora of other side effects as
well, e.g. an higher drop-off rate and the increase of early
pregnancy and child labour [1, 2, 3].
Recap – Effects on children
[1] UNICEF, Government responses to COVID-19 and affected populations.
[2] UNICEF, Tracking the situation of children during COVID-19.[3] UNICEF, COVID-19 and children.[4] C-19 Global Data Science Project. Research paper: https://arxiv.org/pdf/2006.05573.pdf.
School closures by country on 15 April 2020. Number of children affected by school closures worldwide per educational stage as of 28 Sept. 2020 (top) and its variation over time (bottom)
10 Oct 2020
Assessing the impact of governmental physical distancing policies on people's mobility at the scale of a whole country is challenging since traditional methods like surveys may not provide timely and accurate information. For this purpose, the use ofbig data from connected devices may offer an alternative source to monitor near-real-time changes in mobility, possible in part thanks to globally available datasets like those released by Google or Apple. Many governments have embraced this opportunity as a key tool for COVID-19 response [1].
Empirical insights on how human mobility patterns change due to COVID-19 and associated response efforts is critical to better understand risk, improve forecasting models, assess possible socioeconomic impacts and to identify potential vulnerabilities.Two essential ingredients to accomplish this is the availability of high-resolution data, and the technical capacity to analyze it.
UNICEF Country Offices are already using mobility data to help governments with COVID-19 response, examples include:
• Indonesia: Using insights from mobility data at the level of single towns/villages to help inform decisions on when to ease or tighten restrictions and to balance the social, economic and educational realities with public health risks [2].
• Colombia: Supporting the Ministry of Health and the Ministry of Education with insights to mitigate the impacts of physical distancing measures, assess the risk at school level after reopening, and feed epidemiological models to inform preventive actions.
• Sierra Leone: Supporting the development of a tool to estimate movements between locations to assist with predicting disease spread, inform decisions on lockdown characteristic, and assess the success of lockdown measures.
Introduction
[1]: Spain, Italy, Germany.[2]: Indonesia.

10 Oct 2020
Report overviewThis report examines the effects that governmental policies on physical distancing have on human
mobility through the reduction of people's daily travel distances, and their influence on COVID-19
cases. It analyzes data from 10 programme countries and 2 high-income countries, aiming to
understand the impact of timing on policy implementation on COVID-19 cases.
This deck shows insights for 10 programme countries (listed alphabetically):
Colombia, Cote d'Ivoire, India, Indonesia, Malaysia, Mexico, Mozambique, Myanmar, Nigeria and
Ukraine.
Moreover, this deck includes a comparison of mobility indicators from two data sources for 2
non-programme countries in Annex II:
Germany and United Kingdom.

10 Oct 2020
Some highlightsMost countries introduced physical distancing measures at the same time (mid-March) despite very different epidemic contexts.
More research is needed to understand influence effects in adopting preventive policies versus reactive ones.
Physical distancing policies remain high in most countries.
1. Policies resulted in an actual reduction of people's movement, but:
• Countries with the most stringent policies do not necessarily show the biggest reduction in human mobility.
• Mobility drop is maximal within a week after policies implementation but decays over time to slowly return to normal.
More research is needed to understand applicability and sustainability of control measures, especially in the most vulnerable contexts.
2. Policies effect on the epidemic seems unequal. The timing in their application (reactive vs preventive) can be one key factor:
• Policies were able to "bend the curve" of the epidemic in countries that had a peak in mid-March.
• Unclear/dubious effect on the epidemic evolution for countries that applied them in mid-March while they still not had a
clear ongoing wave.
Further research is needed to assess the causal relationship between timing of measures and future development of cases. Other factors that could
explain it include people relaxing their behavior in respecting protection measures (interpersonal distance, wearing masks, hand hygiene) as well as
their perception of social relationships and trust in others and institutions.

10 Oct 2020
What data are we usingMobility
We use aggregated mobility data provided by Cuebiq, which collects first-party data from anonymized users who
have opted-in to provide access to their location data through a GDPR-compliant framework. Additionally,
anonymized and aggregated mobility data from Vodafone is used for comparison purposes.
COVID-19
New confirmed cases and deaths worldwide are provided by the European Centre for Disease Prevention and
Control (ECDC) and are publicly available at https://www.ecdc.europa.eu/en/publications-data/download-todays-
data-geographic-distribution-covid-19-cases-worldwide.
Government policies
Public health, socio-economic and physical distancing policies are collected by implementation date and updated
weekly by ACAPS at https://www.acaps.org/covid19-government-measures-dataset. The Blavatnik School of
Government, Oxford University provides several indicators including a stringency index that quantifies the strictness
of physical distancing and mobility restriction policies implemented by governments. See more
at https://www.bsg.ox.ac.uk/research/research-projects/oxford-covid-19-government-response-tracker.

10 Oct 2020
Limitations of current approachMobility
The data presented here is collected through smartphones, but not everybody has a smartphone. Especially the
most vulnerable are not represented in phone and smartphone datasets. Through a data partnership with
Vodafone, we can compare data from different technologies, allowing us to shed some initial light on potential
representativeness and bias.
To make mobility analysis more representative we need:
o Additional data partnerships with local mobile network operators.
o More research and collaborations with local academics and data science groups to adapt the analysis to the local
context: e.g. large cities, socioeconomic impacts and causalities, epidemic risk.
COVID-19
The case numbers we use are officially reported numbers, however, these are lower than the actual numbers of
infected, especially in the first phase of the epidemic and for countries with limited testing capacity.

10 Oct 2020
In the following slides, we present a side-by-side comparison of 3 indicators for different countries, as described below.
o Stringency Index (top graph in black):
It quantifies the stringency of governmental physical distancing policies. Data includes: the limitation of public gatherings, travel bans, movement restrictions, closure of public services and non-essential businesses, shelter-in-place measures and lockdowns. Each of these is weighted with a given score.
The index goes from 0 (low strictness) to 100 (max stringency), which is attained only by 15 countries.
Government policies indicator

10 Oct 2020
o Changes in travel distance (middle graph in blue):
Changes are calculated for each day with respect to a baseline from February 2020 considered as the 'normal'. Dots represent daily values while the line is the average over the past 7 days.
When the actual travel distance is zero, the indicator equals –100%.
Mobility indicator

10 Oct 2020
o New COVID-19 cases per 100k population (bottom graph in red):
Number of reported cases from official sources per 100k inhabitants in the country. Dots represent the daily value while the line is the average over the past 7 days.
COVID-19 cases indicator

10 Oct 2020
When were the strictest policies implemented?In the map, countries are colored according to when they reached their period of maximum stringency, grouped in periods of two weeks.
Most governments implemented their strictest measures on physical distancing between 16 of March and 20 of April, despite the number of cases reported on that date varies across countries, as shown in the bottom map.

10 Oct 2020Timings and effects - Countries comparisonNote: case graphs have different scales. See the Annex I for a detailed country-level analysis.
Colombia Cote d’Ivoire IndonesiaIndia
Mexico MyanmarMozambique
Malaysia
Nigeria Ukraine
Germany
UK
Non-programme Programme
Data from: BlavatnikSchool of Government, Cuebiq, ECDC.
Analysis from: UNICEF MagicBox

10 Oct 2020
Colombia Cote d’Ivoire IndonesiaIndia
Mexico MyanmarMozambique
Malaysia
Nigeria Ukraine
Note: case graphs have identical scales. See the Annex I for a detailed country-level analysis.
Germany
UK
Timings and effects - Countries comparison
Non-programme Programme
Data from: BlavatnikSchool of Government, Cuebiq, ECDC.
Analysis from: UNICEF MagicBox

10 Oct 2020
Cote d’IvoireColombia India
Mozambique Nigeria Ukraine
For each country, the stringency index is the black line, while the grey lines represent neighboring countries.
All countries analyzed except Indonesia, Myanmar and Mozambique introduced the highest policy restrictions around mid-March, independent on the number of reported cases (high or low). This suggests that actions in non-programmecountries influenced policy implementations in countries with few cases. In some countries (Colombia, India, Mexico, and Myanmar) policies stringency remains high, while in others (Cote d'Ivoire, Indonesia, Mozambique, Malaysia, Nigeria, and Ukraine) has been relaxed.
Indonesia
C hina
Mexico Myanmar
Malaysia
C h i na C h i na
R u s sia
C h i na
Germany
UK
U S A
Non-programme Programme
Policy stringency across countries Data from: BlavatnikSchool of Government.
Analysis from: UNICEF MagicBox

Summary• In the absence of a vaccine, reducing the virus transmission rate is a challenging and critical
component of COVID response. Information campaigns on safe practices like hand washing or proper mask wearing etiquette have been coupled with policies aimed at reducing human contacts, from closing schools to lockdown policies.
• Our analysis shows that governmental policies related to mobility restrictions and physical distancing has dramatically reduced people's movements but their impact on COVID transmission vary across countries. Although some countries still have highly stringent measures, they seems to not have served the purpose as the number of cases are still increasing.
• Timing of interventions is vital in order to control the evolution of the epidemic. However, it is unclear what impact testing strategies have on the reported number of cases and how this relates to the implementation of policy measures. In particular, countries with low testing capacity may dramatically underestimate the number of actual cases.

Annex ICountry level analysis

10 Oct 2020
• Increasingly strict measures have been introduced since mid of March to reduce COVID-19 transmission.
• The measures drastically reduced mobility by up to 95%. After re-opening mobility is slowly returning to normal, and at the end of August was 37% below normal.
• New COVID-19 cases show a delayed peak at the beginning of August, four and a half months after the health emergency was declared. At present, policy stringency remains high, but mobility is returning to normal.
Colombia
Comparison between stringency, mobility and casesData from: BlavatnikSchool of Government, Cuebiq, ECDC.
Analysis from: UNICEF MagicBox

10 Oct 2020
Cote d’Ivoire
• Strict measures were introduced mid-March to reduce COVID-19 transmission but have slowly been lifted since May.
• Government measures drastically reducedmobility to around 50% of normal. Since the re-opening, mobility has steadily increased up to pre-curfew level at the beginning of August.
• New COVID-19 cases do not show a peak during the period of most stringent policies but one and a half month later, from mid of June to beginning of August, where policy stringency was reduced.
Comparison between stringency, mobility and casesData from: BlavatnikSchool of Government, Cuebiq, ECDC.
Analysis from: UNICEF MagicBox

10 Oct 2020
• Increasingly strict measures have been introduced since beginning of March to reduce COVID-19 transmission, reaching the highest possible stringency index of 100 (the highest seen across all countries). Partial lifting of measures occurred at the beginning of May.
• Government measures drastically reduced mobility to around 90% with a plateau until measures were partially lifted at the beginning of May.
• New COVID-19 cases do not show a peak during the period of strictest policies but, at present, the curve is still increasing.
India
Comparison between stringency, mobility and casesData from: BlavatnikSchool of Government, Cuebiq, ECDC.
Analysis from: UNICEF MagicBox

10 Oct 2020
• Measures have been slowly introduced since the beginning of March to reduce COVID-19 transmission. In comparison to other countries, the stringency index is the lowest.
• Government measures drastically reducedmobility up to 70% below the normal. The reduction remained constant until the measures were lifted. Since then mobility has steadily increased.
• New COVID-19 cases do not show a peak during the period of most stringent policies. Instead the number of new cases has continually been growing.
Indonesia
Comparison between stringency, mobility and casesData from: BlavatnikSchool of Government, Cuebiq, ECDC.
Analysis from: UNICEF MagicBox

10 Oct 2020
• Strict measures were introduced mid-March to reduce COVID-19 transmission, but the stringency is lower than other countries.
• Government measures drastically reduced mobility to around 90% below normal. The reduction was constant until measures were loosened. Since then, mobility has slowly recovered and is back to near normal values
• New COVID-19 cases peak right after the lockdown but have decreased since mid-April. The number of new cases reached a steady level in June (where stringency was reduced).
Malaysia
Comparison between stringency, mobility and casesData from: BlavatnikSchool of Government, Cuebiq, ECDC.
Analysis from: UNICEF MagicBox

10 Oct 2020
• Strict measures were introduced in March to reduce COVID-19 transmission and have since remained high.
• Government measures drastically reduced mobility to around 70% below normal. Since the partial reopening mobility has been slowly rising and is currently 48% below normal.
• New COVID-19 cases did not peak during the period of most stringent policies. Instead, they have steadily been rising, potentially peaking in end July.
Mexico
Comparison between stringency, mobility and casesData from: BlavatnikSchool of Government, Cuebiq, ECDC.
Analysis from: UNICEF MagicBox

10 Oct 2020
• Measures were initially introduced in mid-March to reduce COVID-19 transmission. In June they were further increased, but later relaxed. Overall, the stringency index is the second lowest after Indonesia.
• Government measures initially reduced mobility to around 50% of normal. But mobility has steadily been rising to levels above normal, despite the stringency index being high.
• New COVID-19 cases does not show a peak during the period of most stringent policies but have been steadily increasing.
Mozambique
Comparison between stringency, mobility and casesData from: BlavatnikSchool of Government, Cuebiq, ECDC.
Analysis from: UNICEF MagicBox

10 Oct 2020
• Measures were slowly introduced since end-Marchto reduce COVID-19 transmission and have been increased till mid-April. Since then, the stringency index has remained high.
• Government measures reduced mobility to initially 90% below normal (aligned with the period of strictest measures). Since then mobility has increased again from mid-April till beginning of June when it stabilized around a constant level at 40% below normal. From end-August, it decreased again to a value around 80% below normal, similar to the one of mid-March.
• New COVID-19 cases remained low before and during the lockdown. Instead, Myanmar shown an abrupt increase in mid-August, despite high policy stringency and low mobility. It is unclear if spike in cases is linked to better testing in the country.
Myanmar
Comparison between stringency, mobility and casesData from: BlavatnikSchool of Government, Cuebiq, ECDC.
Analysis from: UNICEF MagicBox

10 Oct 2020
• Strict measures were introduced end-March to reduce COVID-19 transmission. Starting June, measures have been gradually relaxed.
• Initial measures drastically reduced mobility to approx. 85% below normal. Since May mobility has been rising constantly till end-August when it started to decrease again up to 39% below normal.
• New COVID-19 cases do not show a peak during the period of most stringent restrictions. Instead cases peak from beginning of June and remain high until end of July when they decreased.
Nigeria
Comparison between stringency, mobility and casesData from: BlavatnikSchool of Government, Cuebiq, ECDC.
Analysis from: UNICEF MagicBox

10 Oct 2020
• Strict measures were implemented mid-Marchto reduce COVID-19 transmission, and lasted until June where the country was partially re-opened
• Government measures drastically reduced mobility to around 60% below normal. Since re-opening mobility has increased to above normal levels. This is because “normal behavior” is defined as movements in February, and mobility is different during summer months.
• The number of new COVID-19 cases does not peak during the period of most stringent measures, however, it is likely the lockdown prevented a large-scale outbreak. Cases have increased at a faster pace after the partial reopening.
Ukraine
Comparison between stringency, mobility and casesData from: BlavatnikSchool of Government, Cuebiq, ECDC.
Analysis from: UNICEF MagicBox

Annex IIComparison of data sources
• For some countries we have multiple data sources obtained from different data sharing partnerships. A recent agreement with Vodafone allows for the comparison of smartphone (Cuebiq) mobility indicators with those provided by the mobile network operator.
• Similar trends are observed in the decrease of travel distance and the increase of time spent at home as a consequence of mobility restrictions.
• For those countries with low smarthphone penetration or limited 4G connectivity, data from mobile network operators may be the most representative in terms of coverage, especially for areas far from main cities.

10 Oct 2020
• Strict measures were introduced mid-March to reduce COVID-19 transmission.
• These measures drastically reduced mobility. Comparing mobile phone data (Vodafone) to smartphone data (Cuebiq) we find that the drop in mobility was 40% and 80% below normal, respectively. The difference between the values is due to different data collection mechanisms and aggregation procedures. For instance, Vodafone data underestimates the number of short trips as data is collected at antenna level.
• The number of COVID-19 cases peaks around the day with highest mobility reduction, approx. 2 weeks after lockdown.
Comparison between stringency, mobility and casesData from: BlavatnikSchool of Government, Cuebiq + Vodafone, ECDC.
Analysis from: UNICEF MagicBox
Germany

10 Oct 2020
• Strict measures were introduced mid-March to reduce COVID-19 transmission.
• Containment measures drastically reduced mobility. Comparing mobile phone data (Vodafone) to smartphone data (Cuebiq)mobility was reduced by 55% and 90% below normal, respectively. Differences between values is due to different data collection mechanisms and aggregation procedures.
• The number of COVID-19 cases peaked in mid-March and remained high until May. The UK implemented a lock-down when cases were drastically rising.
United Kingdom
Comparison between stringency, mobility and casesData from: BlavatnikSchool of Government, Cuebiq + Vodafone, ECDC.
Analysis from: UNICEF MagicBox