magic formula white paper
DESCRIPTION
A detailed look at how the magic formula works, what it is made of and how it performs.TRANSCRIPT
Page 1 of 5
A Guide to the Magic Formula Investment Strategy
Catalyst Capital Advisors LLC www.catalystmutualfunds.com
$0
$200,000
$400,000
$600,000
$800,000
$1,000,000
$1,200,000
$1,400,000
$1,600,000
19
88
19
89
19
90
19
91
19
92
19
93
19
94
19
95
19
96
19
97
19
98
19
99
20
00
20
01
20
02
20
03
20
04
20
05
20
06
20
07
20
08
20
09
20
10
$10,000 Return (Magic Formula) $10,000 Return (S&P 500)
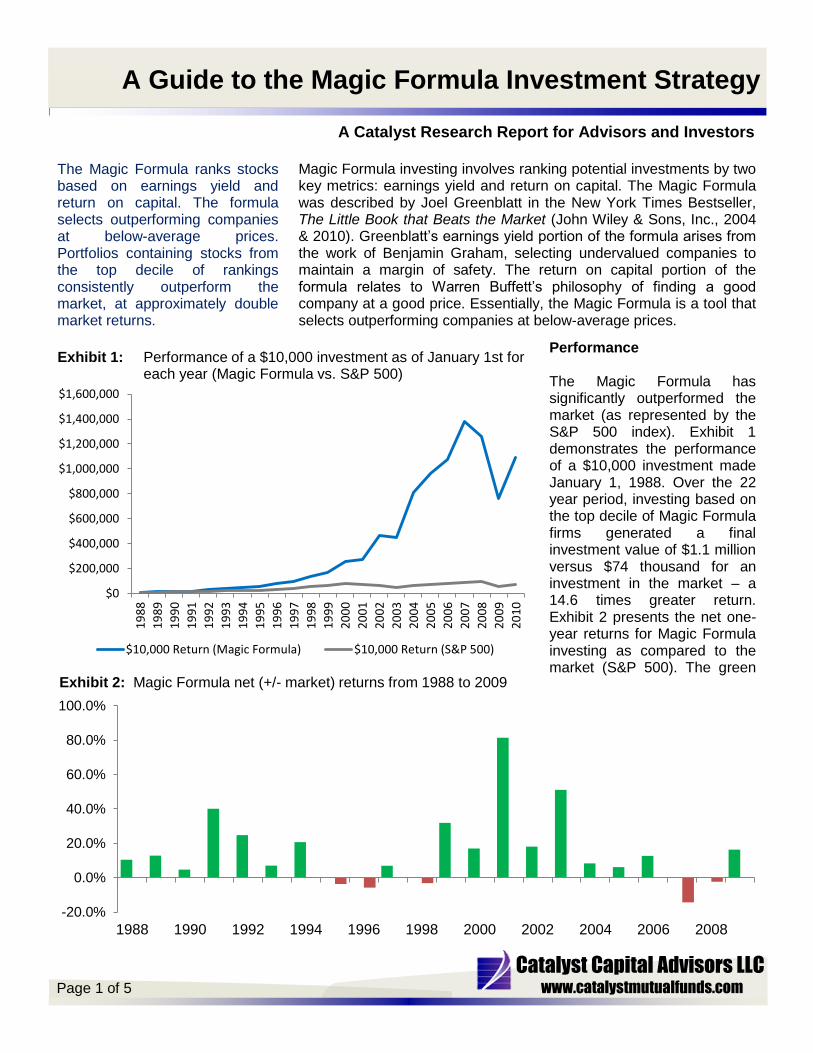
Exhibit 1: Performance of a $10,000 investment as of January 1st for each year (Magic Formula vs. S&P 500)
A Catalyst Research Report for Advisors and Investors
The Magic Formula ranks stocks based on earnings yield and return on capital. The formula selects outperforming companies at below-average prices. Portfolios containing stocks from the top decile of rankings consistently outperform the market, at approximately double market returns.
Performance The Magic Formula has significantly outperformed the market (as represented by the S&P 500 index). Exhibit 1 demonstrates the performance of a $10,000 investment made January 1, 1988. Over the 22 year period, investing based on the top decile of Magic Formula firms generated a final investment value of $1.1 million versus $74 thousand for an investment in the market – a 14.6 times greater return. Exhibit 2 presents the net one-year returns for Magic Formula investing as compared to the market (S&P 500). The green
Magic Formula investing involves ranking potential investments by two key metrics: earnings yield and return on capital. The Magic Formula was described by Joel Greenblatt in the New York Times Bestseller, The Little Book that Beats the Market (John Wiley & Sons, Inc., 2004 & 2010). Greenblatt’s earnings yield portion of the formula arises from the work of Benjamin Graham, selecting undervalued companies to maintain a margin of safety. The return on capital portion of the formula relates to Warren Buffett’s philosophy of finding a good company at a good price. Essentially, the Magic Formula is a tool that selects outperforming companies at below-average prices.
-20.0%
0.0%
20.0%
40.0%
60.0%
80.0%
100.0%
1988 1990 1992 1994 1996 1998 2000 2002 2004 2006 2008
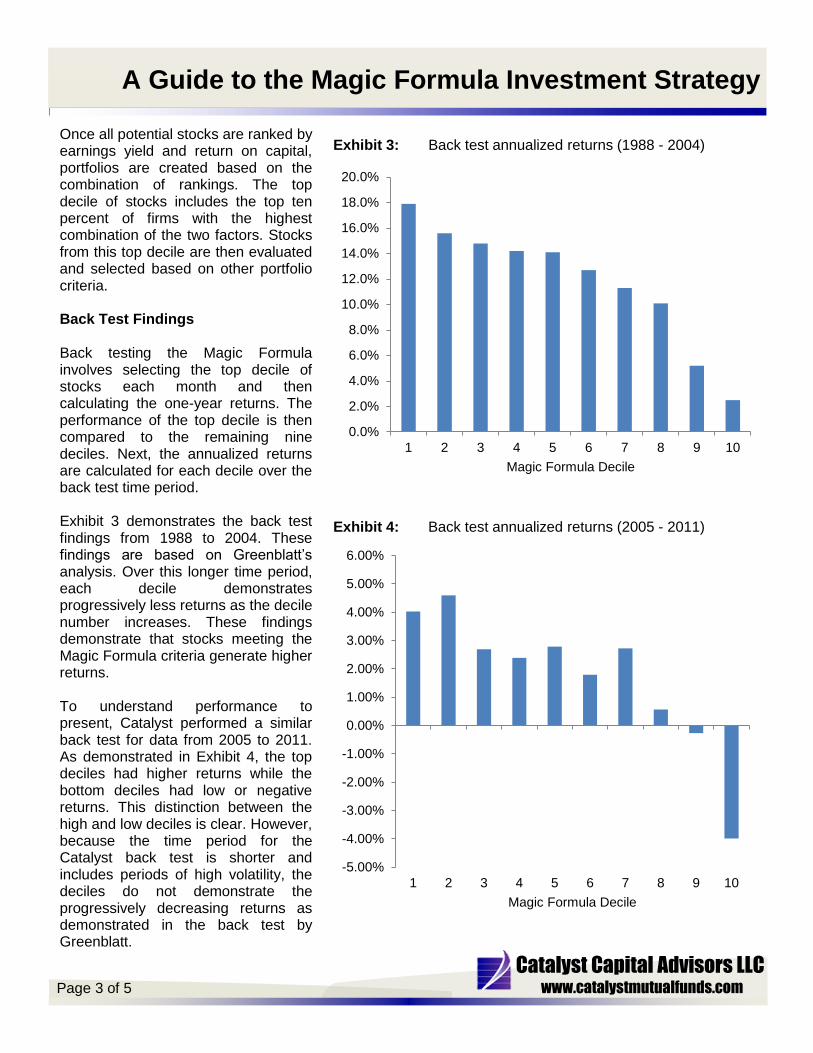
Exhibit 2: Magic Formula net (+/- market) returns from 1988 to 2009

Page 2 of 5
A Guide to the Magic Formula Investment Strategy
Catalyst Capital Advisors LLC www.catalystmutualfunds.com
Year Magic Formula
One-year Return Market (S&P 500) One-year Return
Net (+/- Market) Return
1988 27.1% 16.6% 10.5%
1989 44.6% 31.7% 12.9%
1990 1.7% -3.1% 4.8%
1991 70.6% 30.5% 40.1%
1992 32.4% 7.6% 24.8%
1993 17.2% 10.1% 7.1%
1994 22.0% 1.3% 20.7%
1995 34.0% 37.6% -3.6%
1996 17.3% 23.0% -5.7%
1997 40.4% 33.4% 7.0%
1998 25.5% 28.6% -3.1%
1999 53.0% 21.0% 32.0%
2000 7.9% -9.1% 17.0%
2001 69.6% -11.9% 81.5%
2002 -4.0% -22.1% 18.1%
2003 79.9% 28.7% 51.2%
2004 19.3% 10.9% 8.4%
2005 11.1% 4.9% 6.2%
2006 28.5% 15.8% 12.7%
2007 -8.8% 5.5% -14.3%
2008 -39.3% -37.0% -2.3%
2009 42.9% 26.5% 16.4%
bars represent years with positive net returns while the red bars represent years with negative net returns. Table 1 presents the one-year returns by year for the Magic Formula investment strategy (column 2), the S&P 500 index (column 3), and the net returns (+/- market) of the Magic Formula (column 4). The one-year returns are derived from Greenblatt’s back test findings. Greenblatt created monthly portfolios and calculated the one-year return for each portfolio. The returns listed for the year take into account the monthly portfolio returns. During most years, the Magic Formula demonstrated positive net returns. Although some individual years displayed negative net returns, Greenblatt concluded that, when looking at returns over three year periods from 1988 to 2004, 169 of 169 three year periods had positive net returns. Furthermore, all three year periods generated positive returns.
Table 1: Magic Formula and Market Returns 1988 - 2009
Magic Formula Strategy Application of the Magic Formula requires ranking stocks by highest earnings yield and highest return on capital. Rather than evaluating the highest in each category individually, the highest combination of the two factors ranks the highest in the Magic Formula investment strategy. For example, the 15th highest ranked stock for earnings yield and 25th highest ranked stock for return on capital could be the highest combination of the two factors; on the other hand, the highest ranked earnings yield stock could correspond to the 190th ranked return on capital, resulting in only the 50th highest rank for the Magic Formula strategy. Earnings yield is a measure of how much the company earns compared to how much the company costs. Value stocks typically have high earnings yields. For the purpose of the Magic Formula investment strategy, earnings yield is a measure of EBIT / Enterprise Value. This measure is used rather than Price to Earnings (P/E) to remove debt and tax effects and put companies on a level field. Return on capital is a measure of how much the company earns compared to how much capital was required. When comparing a company with high return on capital to a company with low return on capital, the company with the higher return on capital generates higher returns with the same amount of investment in the firm’s operations. Firms with sustained high return on capital (compared to the industry) generally have a competitive advantage that makes them a good investment choice. For the purpose of the Magic Formula investment strategy, return on capital is a measure of EBIT / (Fixed Assets + Net Working Capital). Again, EBIT is used to allow comparison of firms with different debt and tax structures.
Page 3 of 5
A Guide to the Magic Formula Investment Strategy
Catalyst Capital Advisors LLC www.catalystmutualfunds.com
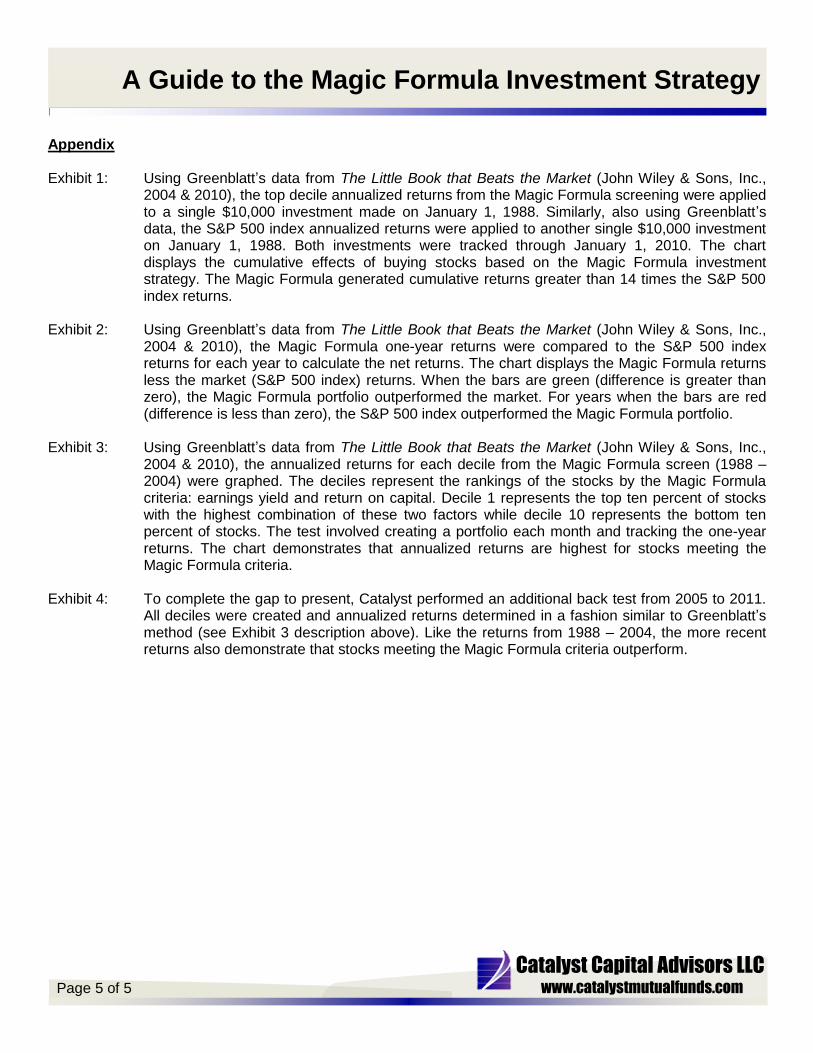
Once all potential stocks are ranked by earnings yield and return on capital, portfolios are created based on the combination of rankings. The top decile of stocks includes the top ten percent of firms with the highest combination of the two factors. Stocks from this top decile are then evaluated and selected based on other portfolio criteria. Back Test Findings Back testing the Magic Formula involves selecting the top decile of stocks each month and then calculating the one-year returns. The performance of the top decile is then compared to the remaining nine deciles. Next, the annualized returns are calculated for each decile over the back test time period. Exhibit 3 demonstrates the back test findings from 1988 to 2004. These findings are based on Greenblatt’s analysis. Over this longer time period, each decile demonstrates progressively less returns as the decile number increases. These findings demonstrate that stocks meeting the Magic Formula criteria generate higher returns. To understand performance to present, Catalyst performed a similar back test for data from 2005 to 2011. As demonstrated in Exhibit 4, the top deciles had higher returns while the bottom deciles had low or negative returns. This distinction between the high and low deciles is clear. However, because the time period for the Catalyst back test is shorter and includes periods of high volatility, the deciles do not demonstrate the progressively decreasing returns as demonstrated in the back test by Greenblatt.
0.0%
2.0%
4.0%
6.0%
8.0%
10.0%
12.0%
14.0%
16.0%
18.0%
20.0%
1 2 3 4 5 6 7 8 9 10
Magic Formula Decile
Exhibit 3: Back test annualized returns (1988 - 2004)
-5.00%
-4.00%
-3.00%
-2.00%
-1.00%
0.00%
1.00%
2.00%
3.00%
4.00%
5.00%
6.00%
1 2 3 4 5 6 7 8 9 10
Magic Formula Decile
Exhibit 4: Back test annualized returns (2005 - 2011)

Page 4 of 5
A Guide to the Magic Formula Investment Strategy
Catalyst Capital Advisors LLC www.catalystmutualfunds.com
In closing, we hope that we have given advisors and investors some insight into the Magic Formula investment strategy. We believe that investors looking to maximize returns should have exposure to this type of investment strategy that can provide returns that outperform the market. *It is important to remember that there are risks inherent in any investment and that there is no assurance that any asset class or index will provide positive performance over time. Portfolios that invest in equities are subject to general risks, including market risk, which could negatively impact the performance that an investor recognizes from his or her portfolio. Market and economic factors can change rapidly, resulting in materially different returns. Past performance of the Magic Formula strategy does not guarantee future returns. No inference should be drawn that managed accounts will be profitable in the future. This document has been published by Catalyst Capital Advisors LLC solely for the purpose of providing information about the Magic Formula investment strategy.
Conclusion Why do we believe the Magic Formula investment strategy outperforms? First, it is intuitive. Investing by the Magic Formula criteria involves selecting outperforming companies at below-average prices. These investment principles have proven track records from proven investors, including Graham and Buffett. Second, numerous findings and back test data confirm that the investment strategy outperforms. These findings demonstrate that the Magic Formula generates returns that are approximately double market returns (as represented by the S&P 500 index).
In Summary:
Earnings yield targets companies with below-average prices Return on capital selects outperforming companies The Magic Formula ranks companies by the highest combination of earnings yield and return
on capital The Magic Formula investment strategy builds upon proven investment techniques Academic and back test findings conclude that the Magic Formula investment strategy
outperforms the market
Page 5 of 5
A Guide to the Magic Formula Investment Strategy
Catalyst Capital Advisors LLC www.catalystmutualfunds.com
Appendix Exhibit 1: Using Greenblatt’s data from The Little Book that Beats the Market (John Wiley & Sons, Inc.,
2004 & 2010), the top decile annualized returns from the Magic Formula screening were applied to a single $10,000 investment made on January 1, 1988. Similarly, also using Greenblatt’s data, the S&P 500 index annualized returns were applied to another single $10,000 investment on January 1, 1988. Both investments were tracked through January 1, 2010. The chart displays the cumulative effects of buying stocks based on the Magic Formula investment strategy. The Magic Formula generated cumulative returns greater than 14 times the S&P 500 index returns.
Exhibit 2: Using Greenblatt’s data from The Little Book that Beats the Market (John Wiley & Sons, Inc.,
2004 & 2010), the Magic Formula one-year returns were compared to the S&P 500 index returns for each year to calculate the net returns. The chart displays the Magic Formula returns less the market (S&P 500 index) returns. When the bars are green (difference is greater than zero), the Magic Formula portfolio outperformed the market. For years when the bars are red (difference is less than zero), the S&P 500 index outperformed the Magic Formula portfolio.
Exhibit 3: Using Greenblatt’s data from The Little Book that Beats the Market (John Wiley & Sons, Inc.,
2004 & 2010), the annualized returns for each decile from the Magic Formula screen (1988 – 2004) were graphed. The deciles represent the rankings of the stocks by the Magic Formula criteria: earnings yield and return on capital. Decile 1 represents the top ten percent of stocks with the highest combination of these two factors while decile 10 represents the bottom ten percent of stocks. The test involved creating a portfolio each month and tracking the one-year returns. The chart demonstrates that annualized returns are highest for stocks meeting the Magic Formula criteria.
Exhibit 4: To complete the gap to present, Catalyst performed an additional back test from 2005 to 2011.
All deciles were created and annualized returns determined in a fashion similar to Greenblatt’s method (see Exhibit 3 description above). Like the returns from 1988 – 2004, the more recent returns also demonstrate that stocks meeting the Magic Formula criteria outperform.