madrid yearly review 2017 - wipo - world intellectual ... yearly review 2017 international...
TRANSCRIPT

MadridYearly Review 2017
International Registrationof Marks
2017
Madrid Yearly Review 2017
International Registration of Marks
WIPO, 2017
First published 2017
World Intellectual Property Organization 34, chemin des Colombettes, P.O. Box 18 CH-1211 Geneva 20, Switzerland
ISBN: 978-92-805-2862-6
Attribution 3.0 IGO license (CC BY 3.0 IGO)
Except where otherwise indicated, this publication is licensed under the Creative Commons Attribution 3.0 IGO License.
The user is allowed to reproduce, distribute, adapt, translate and publicly perform this publication, including for commercial purposes, without explicit permission, provided that the content is accompanied by an acknowledgement that WIPO is the source and that it is clearly indicated if changes were made to the original content.
Suggested citation: WIPO (2017), Madrid Yearly Review 2017: International Registration of Marks, WIPO, Geneva.
Adaptation/translation/derivatives should not carry any official emblem or logo, unless they have been approved and validated by WIPO. Please contact us via the WIPO website to obtain permission.
For any derivative work, please include the following disclaimer: “The Secretariat of WIPO assumes no liability or responsibility with regard to the transformation or translation of the original content.”
When content published by WIPO, such as images, graphics, trademarks or logos, is attributed to a third-party, the user of such content is solely responsible for clearing the rights with the right holder(s).
To view a copy of this license, please visit https://creativecommons.org/licenses/by/3.0/igo/
Statistical tables A25, B9 and C12 are licensed under the Creative Commons Attribution Non-Commercial No Derivatives 3.0 IGO License. The user is allowed to reproduce, distribute, and publicly perform this content without explicit permission from WIPO, provided that the content is accompanied by an acknowledgement that WIPO is the source. No part of this content can be used for commercial purposes and adapted/translated/modified without the prior permission of WIPO. Please contact us via the WIPO website to obtain permission.
To view a copy of this license, please visit: https://creativecommons.org/licenses/by-nc-nd/3.0/igo/
The designations employed and the presentation of material throughout this publication do not imply the expression of any opinion whatsoever on the part of WIPO concerning the legal status of any country, territory or area or of its authorities, or concerning the delimitation of its frontiers or boundaries.
This publication is not intended to reflect the views of the Member States or the WIPO Secretariat.
The mention of specific companies or products of manufacturers does not imply that they are endorsed or recommended by WIPO in preference to others of a similar nature that are not mentioned.
Photo credit: iStock/© Klod
Printed in Switzerland
3
Table of contents
Acknowledgements 4
Further information 4
Key numbers 5
Section AStatistics on Madrid international applications 7Highlights 7
Standard figures and tables 11
Section BStatistics on Madrid international registrations 31Highlights 31
Standard figures and tables 33
Section CStatistics on renewals and active Madrid international registrations 41Highlights 41
Standard figures and tables 44
Section DStatistics on administration, revenue and fees 55Highlights 55
Standard figures and tables 57
Annexes A brief presentation of the Madrid System 65
Data description 69
List of abbreviations 70
Glossary 71
Nice classes and industry sectors 74
List of Madrid members 76
4
Acknowledgements
The Madrid Yearly Review was prepared under the direction of Francis Gurry (Director General) and super-vised by Carsten Fink (Chief Economist). The report was prepared by a team led by Ryan Lamb; the team comprised Kyle Bergquist, Mosahid Khan, Bruno Le Feuvre and Hao Zhou, all from the Economics and Statistics Division.
Thanks go to colleagues from the Brands and Designs Sector for providing valuable comments on drafts at various stages.
Samiah Do Carmo Figueiredo and Caterina Valles Galmès provided valuable administrative support. Gratitude is also due to Toby Boyd and Brenda O’Hanlon for editing the Review, to the Communications Division for preparing the design and to staff in the Printing Plant for their services.
Further information
Online resources
The electronic version of the Review as well as the images and underlying data used to produce all figures and tables can be downloaded at www.wipo.int/ipstats. This webpage also provides links to the IP Statistics Data Center – offering access to WIPO’s sta-tistical data – and to the IP Statistical Country Profiles.
The following resources are available on WIPO’s website:
Information on the Madrid System
www.wipo.int/madrid
Contact information
Economics and Statistics Division
Website: www.wipo.int/ipstats
e-mail: [email protected]
5
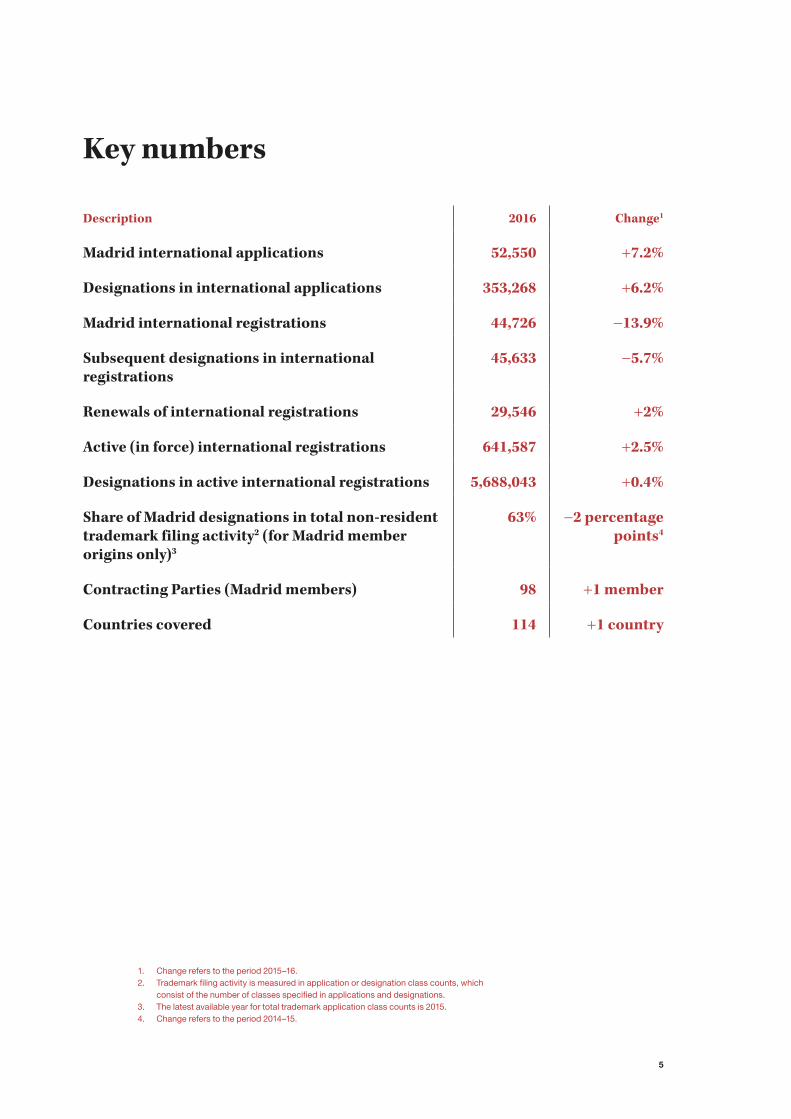
Key numbers
Description 2016 Change1
Madrid international applications 52,550 +7.2%
Designations in international applications 353,268 +6.2%
Madrid international registrations 44,726 -13.9%
Subsequent designations in international registrations
45,633 -5.7%
Renewals of international registrations 29,546 +2%
Active (in force) international registrations 641,587 +2.5%
Designations in active international registrations 5,688,043 +0.4%
Share of Madrid designations in total non-resident trademark filing activity2 (for Madrid member origins only)3
63% -2 percentage points4
Contracting Parties (Madrid members) 98 +1 member
Countries covered 114 +1 country
1. Change refers to the period 2015–16.2. Trademark filing activity is measured in application or designation class counts, which
consist of the number of classes specified in applications and designations.3. The latest available year for total trademark application class counts is 2015.4. Change refers to the period 2014–15.

6

SECT
ION
A
7
Section AStatistics on Madrid international applications
Highlights
Marking the 125th anniversary of the Madrid System, international trademark applications exceeded 50,000 for the first time
An estimated 52,550 international trademark appli-cations were filed under the WIPO-administered Madrid System in 2016 (figure 1). That is a record number. The annual growth rate of 7.2% was the fastest recorded since 2010 and much faster than 2015’s modest increase of 1%. The increase was driven by strong growth in applications from both China and Germany. China’s increase accounted for more than one-third (36.8%) of total growth, while that of Germany represented about one-fifth (20.8%).
The Madrid System continues to increase its geographical scope
Brunei Darussalam joined the Madrid System in 2016, bringing total membership to 98. With this accession, the Madrid System now offers trademark holders the ability to obtain protection for their branded products and services in an area covering a total of 114 countries.
Figure 1Trend in international applications
Source: Standard �gure A1.
2000 2002 2004 2006 2008 2010 2012 2014 2016
Application year
0
20,000
40,000
60,000
Ma
dri
d a
pp
lica
tio
ns
Who were the largest users of the Madrid System in 2016?
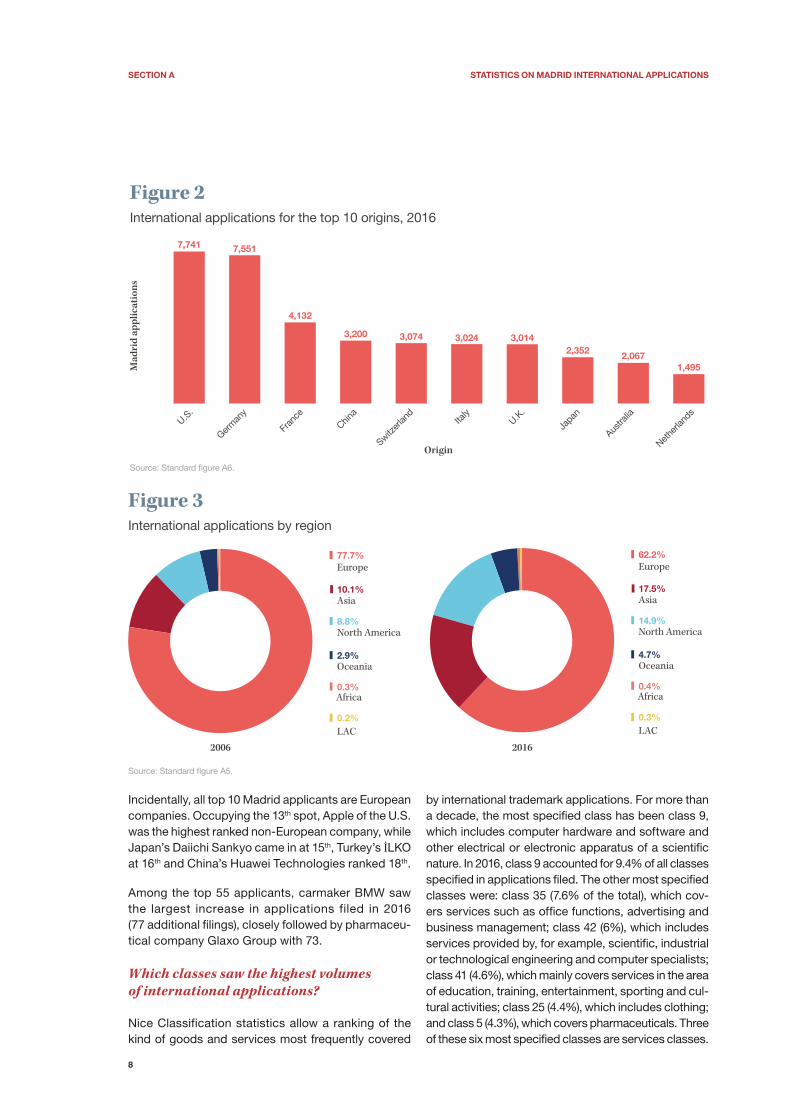
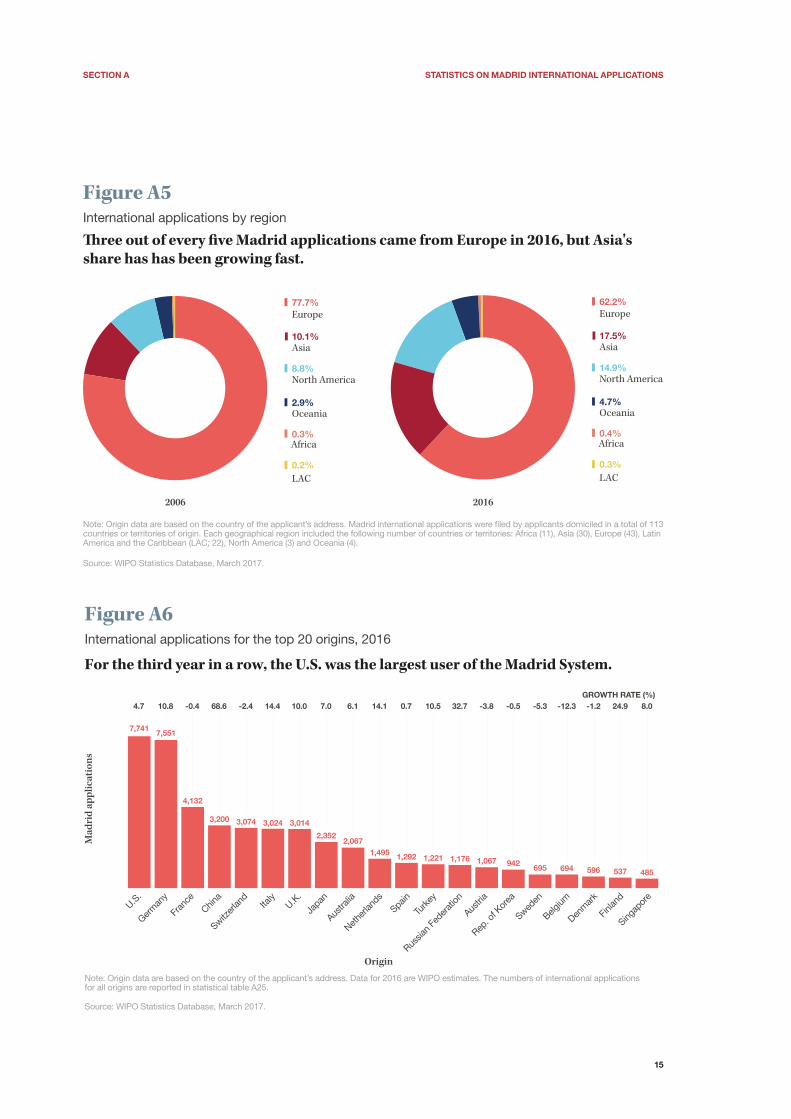
For the third year in a row, the United States of America (U.S.) remained the largest user of the Madrid System. International applications filed by applicants located in the U.S. reached 7,741. These were followed by applications from Germany (7,551), France (4,132) and China (3,200) (figure 2). Applicants domiciled in China filed about 1,300 more Madrid applications in 2016 than in 2015. The resulting remarkably high growth of 68.6% pushed China from ninth largest origin in 2015 to fourth largest in 2016.
Combined, the top 10 origins of applications accounted for 72% of all international applications filed in 2016. Applicants from Madrid member countries located on the European continent filed 62.2% of all international applications, followed by those in Asia (17.5%), which has seen an increase of about seven percentage points compared to its share a decade earlier (figure 3).
Germany (+10.8%), Italy (+14.4%) and the U.K. (+10%) – three larger European countries – saw strong growth, whereas France (-0.4%) recorded a small decline in applications.
Among the top 20 origins, the Russian Federation (+32.7%), Finland (+24.9%) and the Netherlands (+14.1%) also recorded high annual growth. On the other hand, seven of the top origins saw declines, with Belgium (-12.3%) recording the sharpest.
Fourth-ranked China, 12th-ranked Turkey (1,221) and 13th-ranked Russian Federation (1,176) are the only three middle-income countries appearing in the top 20 (standard figure A6).
Which companies filed the most Madrid international applications in 2016?
Filing 150 applications in 2016, L’Oréal of France became the top Madrid applicant for the first time. It was followed by the U.K.’s Glaxo Group (141), BMW (117) and Lidl (112) – both of Germany – and Switzerland’s Novartis (94), which after holding the top spot for five years in a row, dropped to 5th position in 2016.
SectIon A StAtIStIcS on MAdRId InteRnAtIonAl ApplIcAtIonS
8
Figure 2International applications for the top 10 origins, 2016
Source: Standard �gure A6.
U.S.
Germ
any
Fran
ceChin
a
Switzer
land
Italy
U.K.
Japa
n
Austra
lia
Nethe
rland
s
7,741 7,551
4,132
3,200 3,074 3,024 3,0142,352 2,067
1,495
Origin
Ma
dri
d a
pp
lica
tio
ns
Figure 3International applications by region
Source: Standard �gure A5.
Europe
Asia
Oceania
Africa
LAC
77.7%
10.1%
2.9%
North America8.8%
0.3%
0.2%
Europe
Asia
Oceania
Africa
LAC
62.2%
17.5%
4.7%
North America14.9%
0.4%
0.3%
2006 2016
Incidentally, all top 10 Madrid applicants are European companies. Occupying the 13th spot, Apple of the U.S. was the highest ranked non-European company, while Japan’s Daiichi Sankyo came in at 15th, Turkey’s İLKO at 16th and China’s Huawei Technologies ranked 18th.
Among the top 55 applicants, carmaker BMW saw the largest increase in applications filed in 2016 (77 additional filings), closely followed by pharmaceu-tical company Glaxo Group with 73.
Which classes saw the highest volumes of international applications?
Nice Classification statistics allow a ranking of the kind of goods and services most frequently covered
by international trademark applications. For more than a decade, the most specified class has been class 9, which includes computer hardware and software and other electrical or electronic apparatus of a scientific nature. In 2016, class 9 accounted for 9.4% of all classes specified in applications filed. The other most specified classes were: class 35 (7.6% of the total), which cov-ers services such as office functions, advertising and business management; class 42 (6%), which includes services provided by, for example, scientific, industrial or technological engineering and computer specialists; class 41 (4.6%), which mainly covers services in the area of education, training, entertainment, sporting and cul-tural activities; class 25 (4.4%), which includes clothing; and class 5 (4.3%), which covers pharmaceuticals. Three of these six most specified classes are services classes.
SectIon A StAtIStIcS on MAdRId InteRnAtIonAl ApplIcAtIonS
9
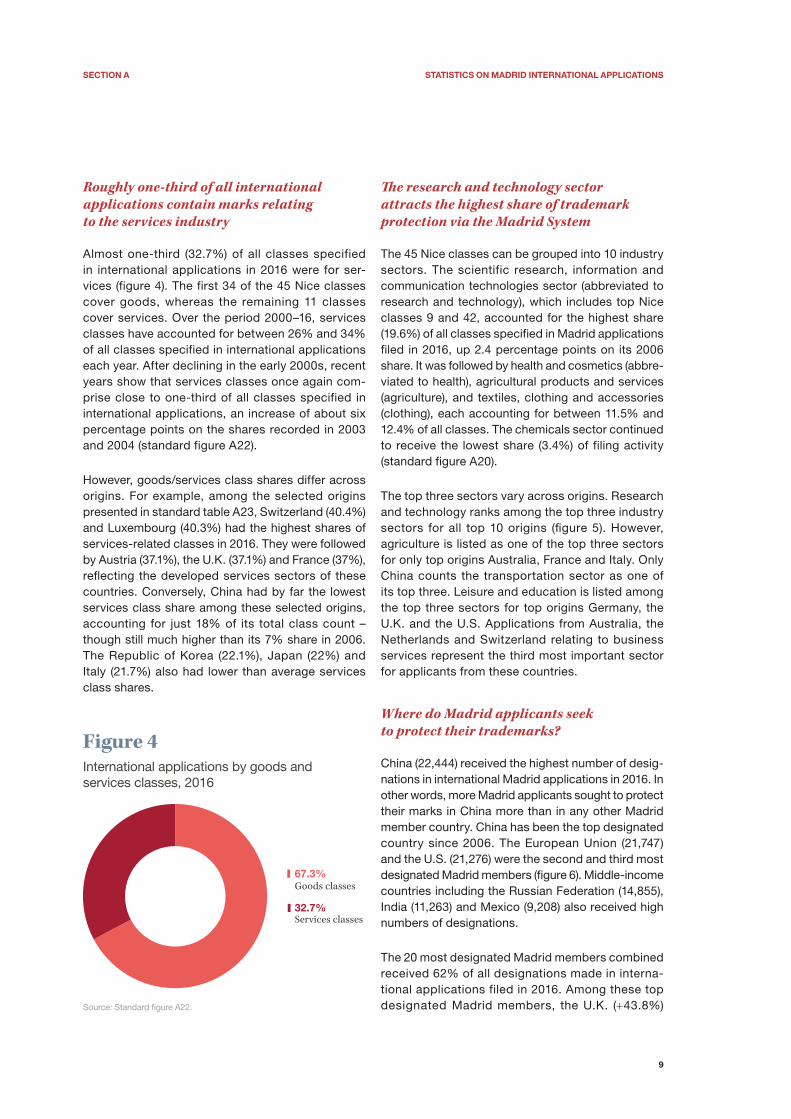
Roughly one-third of all international applications contain marks relating to the services industry
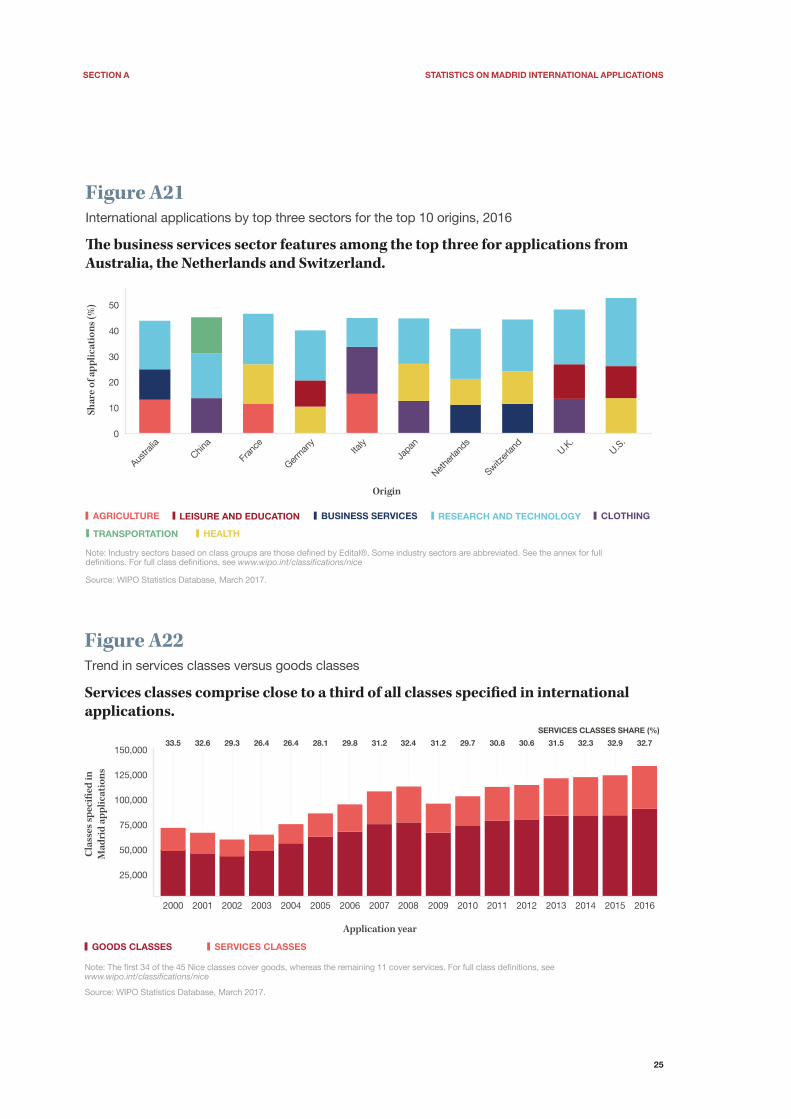
Almost one-third (32.7%) of all classes specified in international applications in 2016 were for ser-vices (figure 4). The first 34 of the 45 Nice classes cover goods, whereas the remaining 11 classes cover services. Over the period 2000–16, services classes have accounted for between 26% and 34% of all classes specified in international applications each year. After declining in the early 2000s, recent years show that services classes once again com-prise close to one-third of all classes specified in international applications, an increase of about six percentage points on the shares recorded in 2003 and 2004 (standard figure A22).
However, goods/services class shares differ across origins. For example, among the selected origins presented in standard table A23, Switzerland (40.4%) and Luxembourg (40.3%) had the highest shares of services-related classes in 2016. They were followed by Austria (37.1%), the U.K. (37.1%) and France (37%), reflecting the developed services sectors of these countries. Conversely, China had by far the lowest services class share among these selected origins, accounting for just 18% of its total class count – though still much higher than its 7% share in 2006. The Republic of Korea (22.1%), Japan (22%) and Italy (21.7%) also had lower than average services class shares.
Figure 4International applications by goods and services classes, 2016
Source: Standard �gure A22.
Goods classes
Services classes
67.3%
32.7%
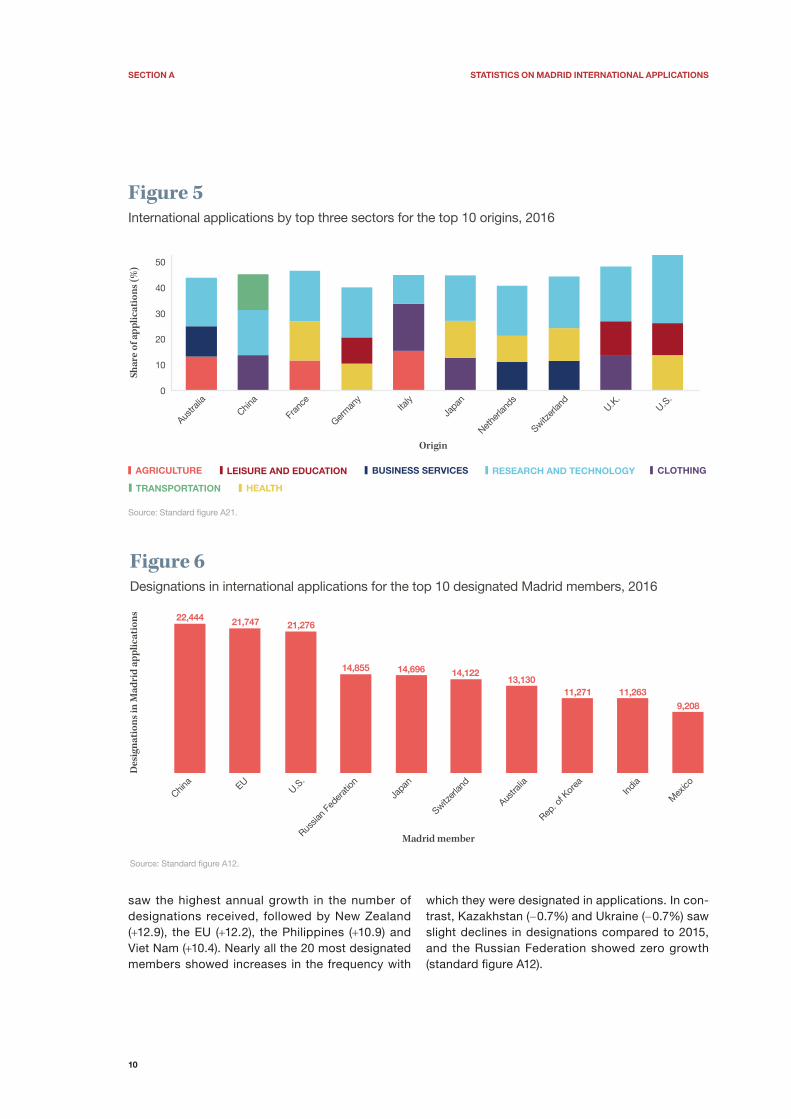
The research and technology sector attracts the highest share of trademark protection via the Madrid System
The 45 Nice classes can be grouped into 10 industry sectors. The scientific research, information and communication technologies sector (abbreviated to research and technology), which includes top Nice classes 9 and 42, accounted for the highest share (19.6%) of all classes specified in Madrid applications filed in 2016, up 2.4 percentage points on its 2006 share. It was followed by health and cosmetics (abbre-viated to health), agricultural products and services (agriculture), and textiles, clothing and accessories (clothing), each accounting for between 11.5% and 12.4% of all classes. The chemicals sector continued to receive the lowest share (3.4%) of filing activity (standard figure A20).
The top three sectors vary across origins. Research and technology ranks among the top three industry sectors for all top 10 origins (figure 5). However, agriculture is listed as one of the top three sectors for only top origins Australia, France and Italy. Only China counts the transportation sector as one of its top three. Leisure and education is listed among the top three sectors for top origins Germany, the U.K. and the U.S. Applications from Australia, the Netherlands and Switzerland relating to business services represent the third most important sector for applicants from these countries.
Where do Madrid applicants seek to protect their trademarks?
China (22,444) received the highest number of desig-nations in international Madrid applications in 2016. In other words, more Madrid applicants sought to protect their marks in China more than in any other Madrid member country. China has been the top designated country since 2006. The European Union (21,747) and the U.S. (21,276) were the second and third most designated Madrid members (figure 6). Middle-income countries including the Russian Federation (14,855), India (11,263) and Mexico (9,208) also received high numbers of designations.
The 20 most designated Madrid members combined received 62% of all designations made in interna-tional applications filed in 2016. Among these top designated Madrid members, the U.K. (+43.8%)
SectIon A StAtIStIcS on MAdRId InteRnAtIonAl ApplIcAtIonS
10
Figure 5International applications by top three sectors for the top 10 origins, 2016
Source: Standard �gure A21.
0
10
20
30
40
50
Sh
are
of
ap
pli
cati
on
s (%
)
Austra
liaChin
a
Fran
ce
Germ
any
Italy
Japa
n
Nethe
rland
s
Switzer
land
U.K.
U.S.
Origin
AGRICULTURE LEISURE AND EDUCATION BUSINESS SERVICES RESEARCH AND TECHNOLOGY CLOTHING
TRANSPORTATION HEALTH
Figure 6Designations in international applications for the top 10 designated Madrid members, 2016
Source: Standard �gure A12.
22,444 21,747 21,276
14,855 14,696 14,12213,130
11,271 11,2639,208
China EU
U.S.
Russia
n Fed
erat
ion
Japa
n
Switzer
land
Austra
lia
Rep. o
f Kor
eaInd
ia
Mex
ico
Madrid member
Des
ign
ati
on
s in
Ma
dri
d a
pp
lica
tio
ns
saw the highest annual growth in the number of designations received, followed by New Zealand (+12.9), the EU (+12.2), the Philippines (+10.9) and Viet Nam (+10.4). Nearly all the 20 most designated members showed increases in the frequency with
which they were designated in applications. In con-trast, Kazakhstan (-0.7%) and Ukraine (-0.7%) saw slight declines in designations compared to 2015, and the Russian Federation showed zero growth (standard figure A12).
SectIon A StAtIStIcS on MAdRId InteRnAtIonAl ApplIcAtIonS
11
Standard figures and tablesMadrid international applications
A1 Trend in international applications 12
A2 Top Madrid applicants, 2016 12
A3 International applications by origin, 2016 14
A4 International applications by income group 14
A5 International applications by region 15
A6 International applications for the top 20 origins, 2016 15
Designations in Madrid international applications
A7 Trend in designations in international applications and average number of designations per application 16
A8 Distribution of designations per international application, 2016 16
A9 Designations in international applications for the top 20 origins, 2016 17
A10 Distribution of designations per international application for the top 20 origins, 2016 17
A11 Distribution of the number of designations per international application for the top six origins, 2016 18
A12 Designations in international applications for the top 20 designated Madrid members, 2016 19
A13 Designations in international applications for the top 20 origins and top 15 designated Madrid members, 2016 19
A14 Distribution of designations in international applications for the top 15 designated Madrid members received from their top 3 origins, 2016 20
Route: Direct versus Madrid
A15 Trends in non-resident direct applications and Madrid designations for Madrid origins only 21
A16 Trend in the use of the Madrid route for Madrid origins only 21
Nice classes specified in Madrid international applications
A17 Trend in the number of classes specified in international applications 22
A18 Distribution of the number of classes specified per international application, 2016 22
A19 Classes specified in international applications, 2016 23
A20 International applications by industry sector, 2016 24
A21 International applications by top three sectors for the top 10 origins, 2016 25
A22 Trend in services classes versus goods classes 25
A23 Goods classes versus services classes in applications for selected origins, 2006 versus 2016 26
A24 International applications by top three sectors for selected Madrid members, 2016 26
Statistical table
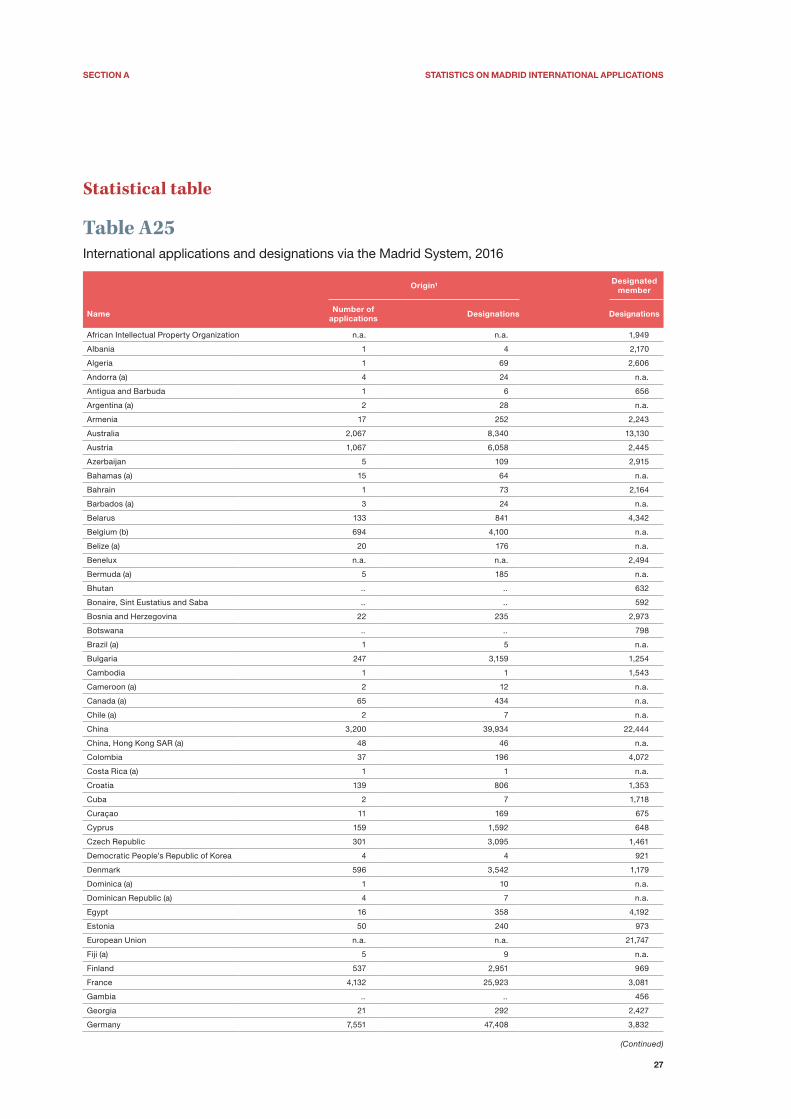
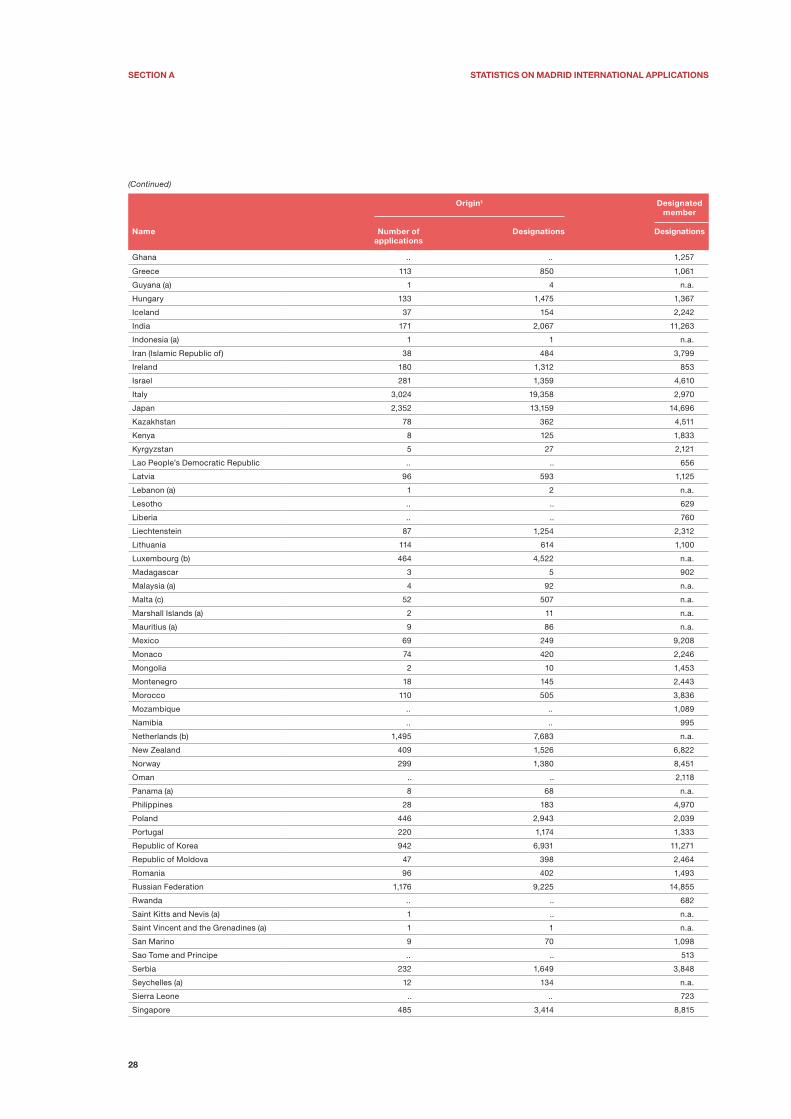
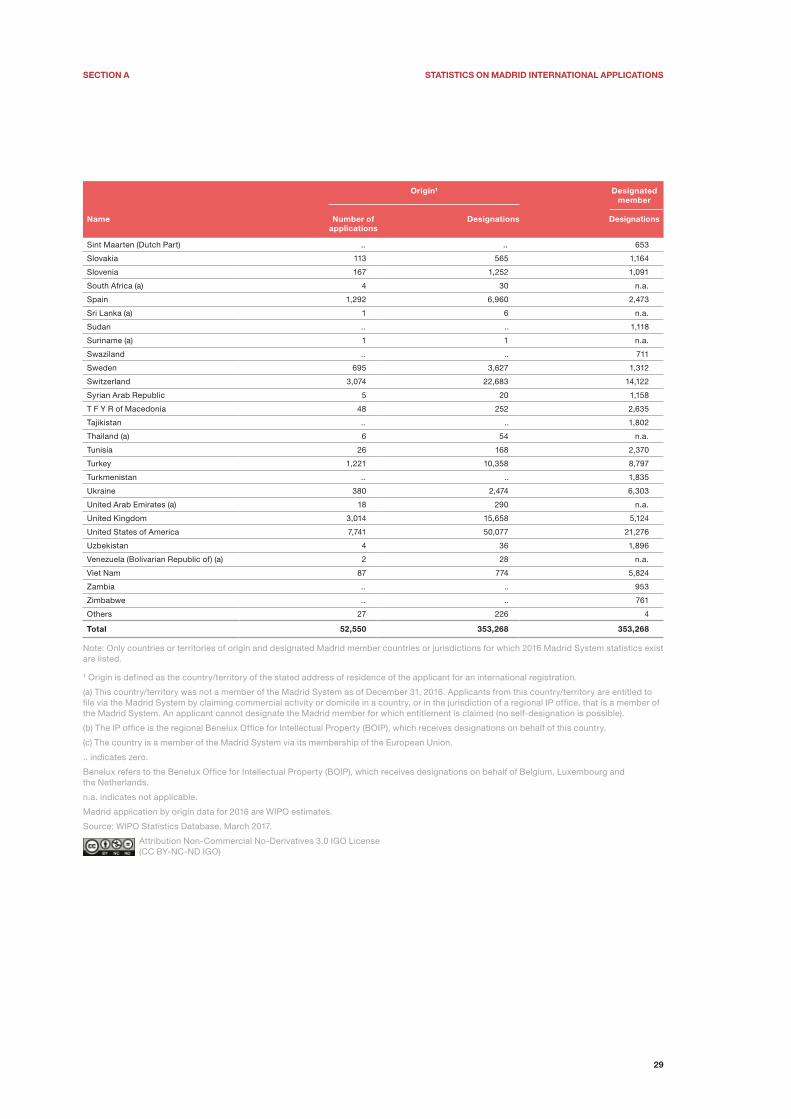
A25 International applications and designations via the Madrid System, 2016 27
SectIon A StAtIStIcS on MAdRId InteRnAtIonAl ApplIcAtIonS
12
Madrid international applications
60,000
50,000
40,000
30,000
20,000
0
2000 2001 2002 2003 2004 2005 2006 2007 2008 2009 2010 2011 2012 2013 2014 2015 2016
21.1
-2.0-6.7
6.3
22.614.8
7.6 10.13.5
10.7 5.8 5.7 5.4 3.0 1.07.2
-13.8
MADRID APPLICATIONS GROWTH RATE (%)
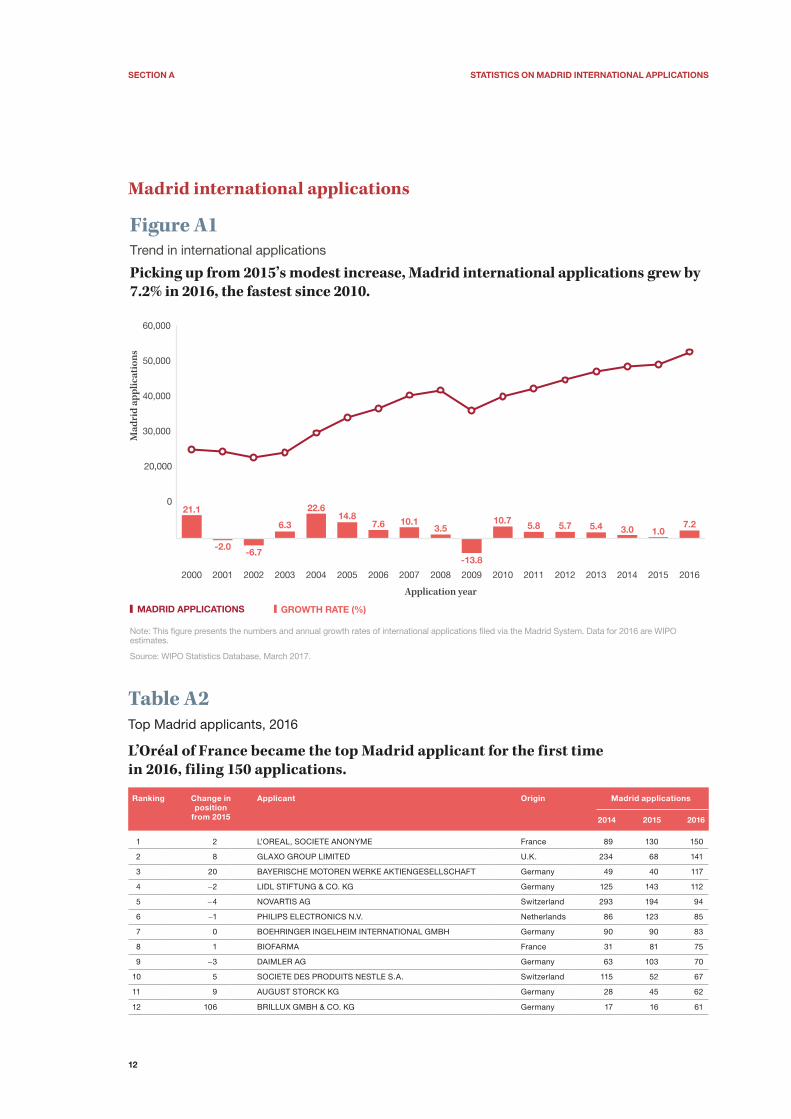
Figure A1Trend in international applications
Picking up from 2015’s modest increase, Madrid international applications grew by 7.2% in 2016, the fastest since 2010.
Note: This �gure presents the numbers and annual growth rates of international applications �led via the Madrid System. Data for 2016 are WIPO estimates.
Source: WIPO Statistics Database, March 2017.
Ma
dri
d a
pp
lica
tio
ns
Application year
Table A2Top Madrid applicants, 2016
L’Oréal of France became the top Madrid applicant for the first time in 2016, filing 150 applications.
Ranking change in position
from 2015
Applicant origin Madrid applications
2014 2015 2016
1 2 L’OREAL, SOCIETE ANONYME France 89 130 150
2 8 GLAXO GROUP LIMITED U.K. 234 68 141
3 20 BAYERISCHE MOTOREN WERKE AKTIENGESELLSCHAFT Germany 49 40 117
4 -2 LIDL STIFTUNG & CO. KG Germany 125 143 112
5 -4 NOVARTIS AG Switzerland 293 194 94
6 -1 PHILIPS ELECTRONICS N.V. Netherlands 86 123 85
7 0 BOEHRINGER INGELHEIM INTERNATIONAL GMBH Germany 90 90 83
8 1 BIOFARMA France 31 81 75
9 -3 DAIMLER AG Germany 63 103 70
10 5 SOCIETE DES PRODUITS NESTLE S.A. Switzerland 115 52 67
11 9 AUGUST STORCK KG Germany 28 45 62
12 106 BRILLUX GMBH & CO. KG Germany 17 16 61
SectIon A StAtIStIcS on MAdRId InteRnAtIonAl ApplIcAtIonS
13
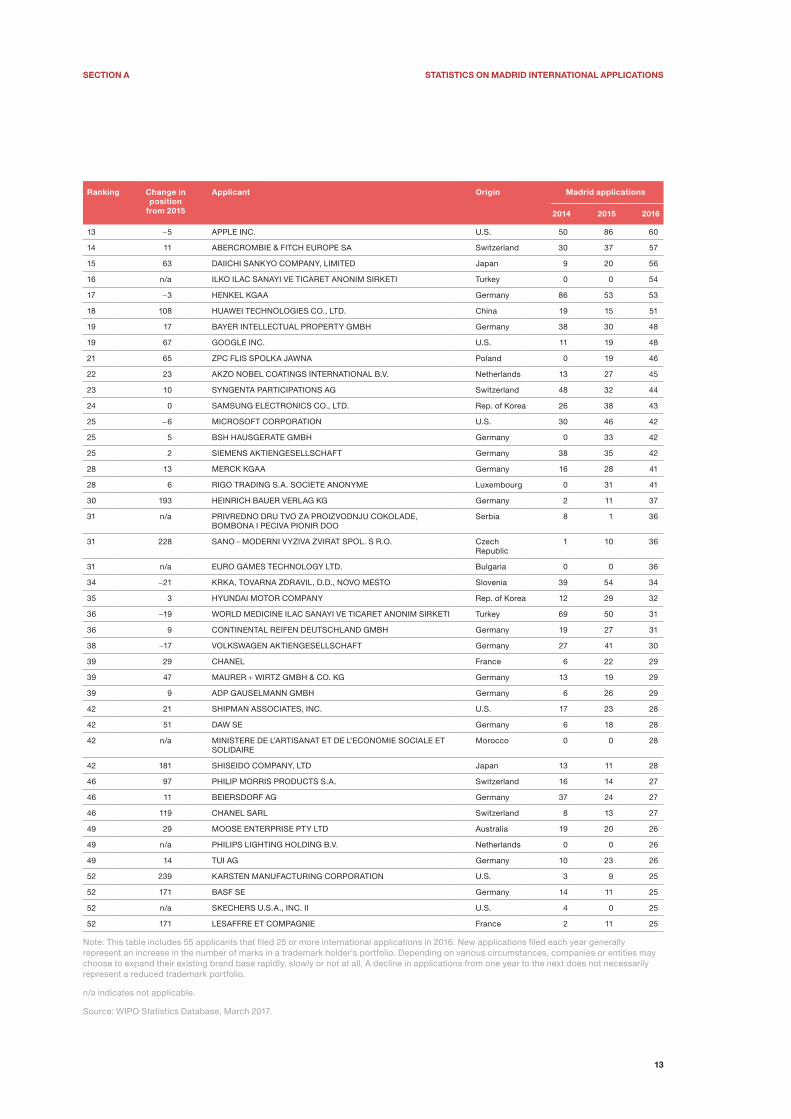
Ranking change in position
from 2015
Applicant origin Madrid applications
2014 2015 2016
13 -5 APPLE INC. U.S. 50 86 60
14 11 ABERCROMBIE & FITCH EUROPE SA Switzerland 30 37 57
15 63 DAIICHI SANKYO COMPANY, LIMITED Japan 9 20 56
16 n/a ILKO ILAC SANAYI VE TICARET ANONIM SIRKETI Turkey 0 0 54
17 -3 HENKEL KGAA Germany 86 53 53
18 108 HUAWEI TECHNOLOGIES CO., LTD. China 19 15 51
19 17 BAYER INTELLECTUAL PROPERTY GMBH Germany 38 30 48
19 67 GOOGLE INC. U.S. 11 19 48
21 65 ZPC FLIS SPOLKA JAWNA Poland 0 19 46
22 23 AKZO NOBEL COATINGS INTERNATIONAL B.V. Netherlands 13 27 45
23 10 SYNGENTA PARTICIPATIONS AG Switzerland 48 32 44
24 0 SAMSUNG ELECTRONICS CO., LTD. Rep. of Korea 26 38 43
25 -6 MICROSOFT CORPORATION U.S. 30 46 42
25 5 BSH HAUSGERATE GMBH Germany 0 33 42
25 2 SIEMENS AKTIENGESELLSCHAFT Germany 38 35 42
28 13 MERCK KGAA Germany 16 28 41
28 6 RIGO TRADING S.A. SOCIETE ANONYME Luxembourg 0 31 41
30 193 HEINRICH BAUER VERLAG KG Germany 2 11 37
31 n/a PRIVREDNO DRU TVO ZA PROIZVODNJU COKOLADE, BOMBONA I PECIVA PIONIR DOO
Serbia 8 1 36
31 228 SANO - MODERNI VYZIVA ZVIRAT SPOL. S R.O. Czech Republic
1 10 36
31 n/a EURO GAMES TECHNOLOGY LTD. Bulgaria 0 0 36
34 -21 KRKA, TOVARNA ZDRAVIL, D.D., NOVO MESTO Slovenia 39 54 34
35 3 HYUNDAI MOTOR COMPANY Rep. of Korea 12 29 32
36 -19 WORLD MEDICINE ILAC SANAYI VE TICARET ANONIM SIRKETI Turkey 69 50 31
36 9 CONTINENTAL REIFEN DEUTSCHLAND GMBH Germany 19 27 31
38 -17 VOLKSWAGEN AKTIENGESELLSCHAFT Germany 27 41 30
39 29 CHANEL France 6 22 29
39 47 MAURER + WIRTZ GMBH & CO. KG Germany 13 19 29
39 9 ADP GAUSELMANN GMBH Germany 6 26 29
42 21 SHIPMAN ASSOCIATES, INC. U.S. 17 23 28
42 51 DAW SE Germany 6 18 28
42 n/a MINISTERE DE L’ARTISANAT ET DE L’ECONOMIE SOCIALE ET SOLIDAIRE
Morocco 0 0 28
42 181 SHISEIDO COMPANY, LTD Japan 13 11 28
46 97 PHILIP MORRIS PRODUCTS S.A. Switzerland 16 14 27
46 11 BEIERSDORF AG Germany 37 24 27
46 119 CHANEL SARL Switzerland 8 13 27
49 29 MOOSE ENTERPRISE PTY LTD Australia 19 20 26
49 n/a PHILIPS LIGHTING HOLDING B.V. Netherlands 0 0 26
49 14 TUI AG Germany 10 23 26
52 239 KARSTEN MANUFACTURING CORPORATION U.S. 3 9 25
52 171 BASF SE Germany 14 11 25
52 n/a SKECHERS U.S.A., INC. II U.S. 4 0 25
52 171 LESAFFRE ET COMPAGNIE France 2 11 25
Note: This table includes 55 applicants that filed 25 or more international applications in 2016. New applications filed each year generally represent an increase in the number of marks in a trademark holder’s portfolio. Depending on various circumstances, companies or entities may choose to expand their existing brand base rapidly, slowly or not at all. A decline in applications from one year to the next does not necessarily represent a reduced trademark portfolio.
n/a indicates not applicable.
Source: WIPO Statistics Database, March 2017.
SectIon A StAtIStIcS on MAdRId InteRnAtIonAl ApplIcAtIonS
14
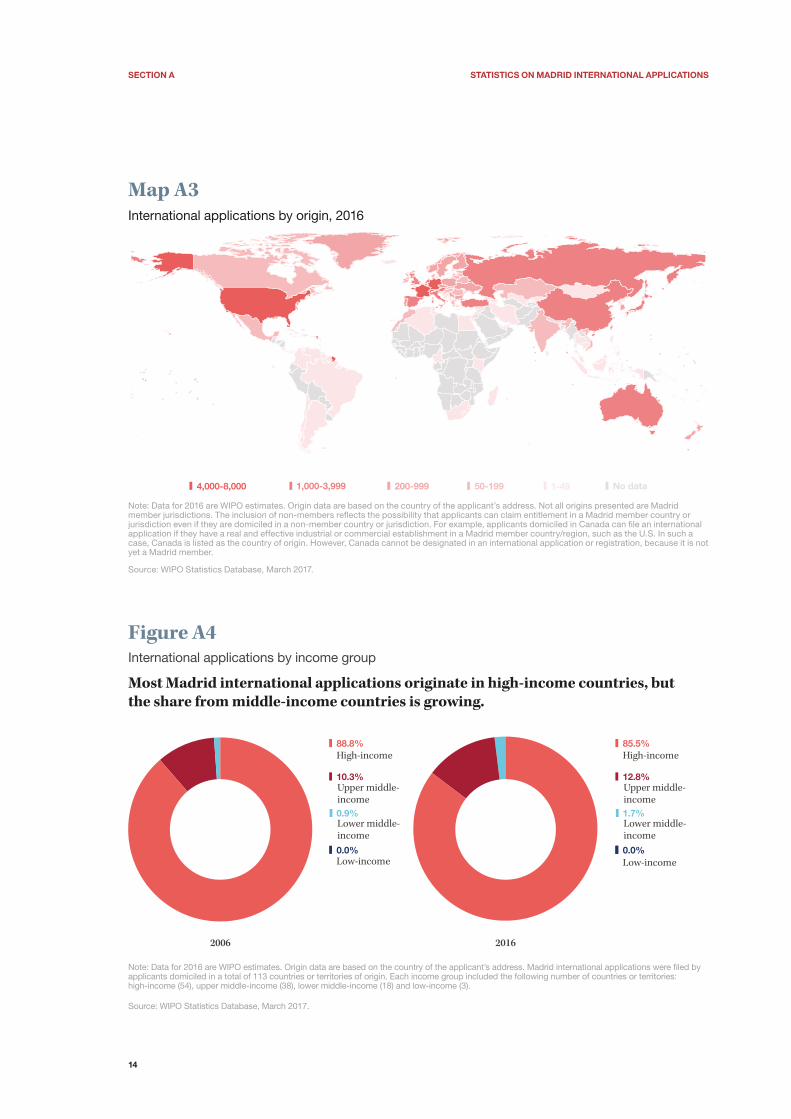
Map A3International applications by origin, 2016
4,000-8,000 1,000-3,999 50-199200-999 1-49 No data
Note: Data for 2016 are WIPO estimates. Origin data are based on the country of the applicant’s address. Not all origins presented are Madrid member jurisdictions. The inclusion of non-members reflects the possibility that applicants can claim entitlement in a Madrid member country or jurisdiction even if they are domiciled in a non-member country or jurisdiction. For example, applicants domiciled in Canada can file an international application if they have a real and effective industrial or commercial establishment in a Madrid member country/region, such as the U.S. In such a case, Canada is listed as the country of origin. However, Canada cannot be designated in an international application or registration, because it is not yet a Madrid member.
Source: WIPO Statistics Database, March 2017.
Figure A4International applications by income group
Most Madrid international applications originate in high-income countries, but the share from middle-income countries is growing.
Note: Data for 2016 are WIPO estimates. Origin data are based on the country of the applicant’s address. Madrid international applications were �led by applicants domiciled in a total of 113 countries or territories of origin. Each income group included the following number of countries or territories: high-income (54), upper middle-income (38), lower middle-income (18) and low-income (3).
Source: WIPO Statistics Database, March 2017.
High-income
Low-income
88.8%
0.9%
0.0%
10.3%Upper middle-income
Lower middle-income
2006
High-income
Low-income
85.5%
1.7%
0.0%
12.8%Upper middle-income
Lower middle-income
2016
SectIon A StAtIStIcS on MAdRId InteRnAtIonAl ApplIcAtIonS
15
Figure A5International applications by region
�ree out of every �ve Madrid applications came from Europe in 2016, but Asia's share has has been growing fast.
Note: Origin data are based on the country of the applicant’s address. Madrid international applications were �led by applicants domiciled in a total of 113 countries or territories of origin. Each geographical region included the following number of countries or territories: Africa (11), Asia (30), Europe (43), Latin America and the Caribbean (LAC; 22), North America (3) and Oceania (4).
Source: WIPO Statistics Database, March 2017.
Europe
Asia
Oceania
Africa
LAC
77.7%
10.1%
2.9%
North America8.8%
0.3%
0.2%
2006
Europe
Asia
Oceania
Africa
LAC
62.2%
17.5%
4.7%
North America14.9%
0.4%
0.3%
2016
U.S.
Germ
any
Fran
ceChin
a
Switzer
land
Italy
U.K.
Japa
n
Austra
lia
Nethe
rland
sSpa
in
Turk
ey
Russia
n Fed
erat
ion
Austri
a
Rep. o
f Kor
ea
Sweden
Belgium
Denm
ark
Finlan
d
Singap
ore
7,741 7,551
4,132
3,200 3,074 3,024 3,014
2,3522,067
1,495 1,292 1,221 1,176 1,067 942695 694 596 537 485
Figure A6International applications for the top 20 origins, 2016
For the third year in a row, the U.S. was the largest user of the Madrid System.
Note: Origin data are based on the country of the applicant’s address. Data for 2016 are WIPO estimates. The numbers of international applicationsfor all origins are reported in statistical table A25.
Source: WIPO Statistics Database, March 2017.
4.7 68.6 -2.4 10.0 7.0 0.7 10.5 32.7 -3.8 -0.5 -12.3 -1.2 24.9 8.010.8 -0.4 14.4 6.1 14.1 -5.3GROWTH RATE (%)
Origin
Ma
dri
d a
pp
lica
tio
ns
SectIon A StAtIStIcS on MAdRId InteRnAtIonAl ApplIcAtIonS
16
Designations in Madrid international applications
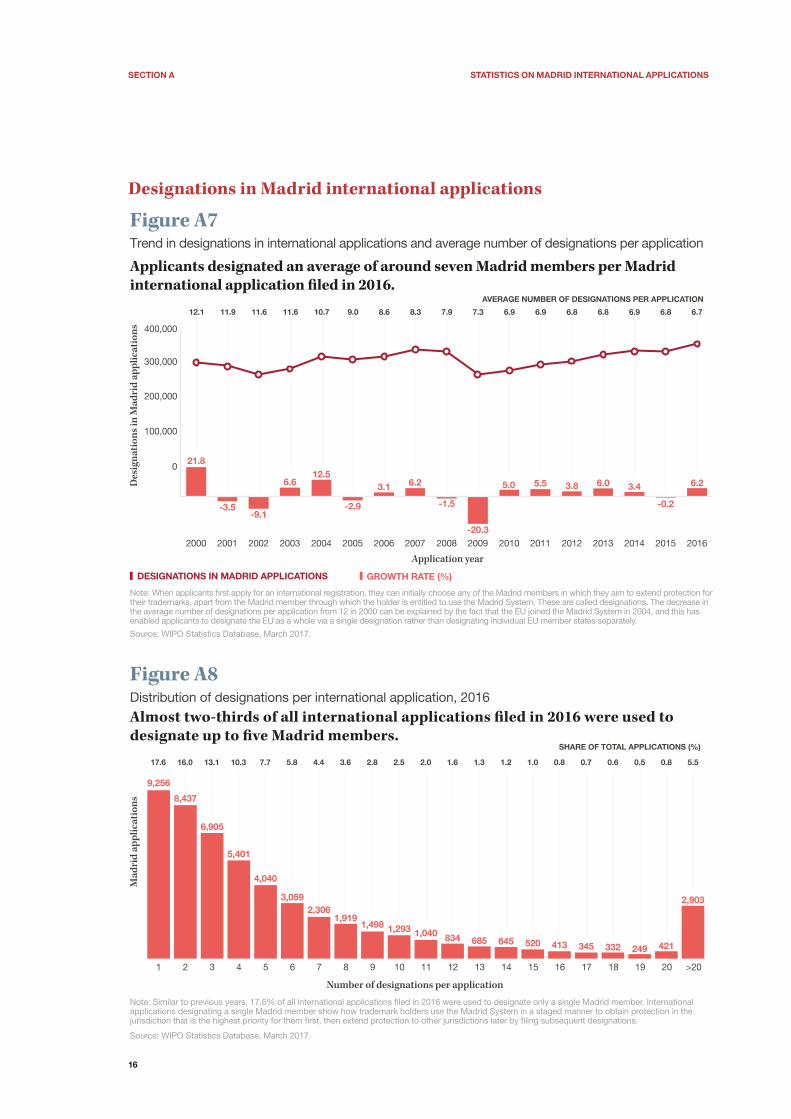
Figure A7Trend in designations in international applications and average number of designations per application
Applicants designated an average of around seven Madrid members per Madrid international application �led in 2016.
Note: When applicants �rst apply for an international registration, they can initially choose any of the Madrid members in which they aim to extend protection fortheir trademarks, apart from the Madrid member through which the holder is entitled to use the Madrid System. These are called designations. The decrease inthe average number of designations per application from 12 in 2000 can be explained by the fact that the EU joined the Madrid System in 2004, and this hasenabled applicants to designate the EU as a whole via a single designation rather than designating individual EU member states separately.
Source: WIPO Statistics Database, March 2017.
2000 2001 2002 2003 2004 2005 2006 2007 2008 2009 2010 2011 2012 2013 2014 2015 2016
21.8
-3.5-9.1
6.612.5
-2.9
3.1 6.2
-1.5
5.0 5.5 3.8 6.0 3.4
-0.2
6.2
-20.3
12.1 10.7 9.0 8.3 7.9 6.9 6.8 6.8 6.9 6.811.9 11.6 11.6 8.6 7.3 6.9 6.7
Des
ign
ati
on
s in
Ma
dri
d a
pp
lica
tio
ns
Application year
DESIGNATIONS IN MADRID APPLICATIONS GROWTH RATE (%)
AVERAGE NUMBER OF DESIGNATIONS PER APPLICATION
400,000
300,000
200,000
100,000
0
Figure A8Distribution of designations per international application, 2016
Almost two-thirds of all international applications �led in 2016 were used to designate up to �ve Madrid members.
Note: Similar to previous years, 17.6% of all international applications �led in 2016 were used to designate only a single Madrid member. International applications designating a single Madrid member show how trademark holders use the Madrid System in a staged manner to obtain protection in the jurisdiction that is the highest priority for them �rst, then extend protection to other jurisdictions later by �ling subsequent designations.
Source: WIPO Statistics Database, March 2017.
Ma
dri
d a
pp
lica
tio
ns
Number of designations per application
9,256
8,437
6,905
5,401
4,040
3,0592,306
1,9191,498 1,293 1,040 834 685 645 520 413 345 332 249 421
17.6 10.3 7.7 4.4 3.6 2.0 1.6 1.3 1.2 1.0 0.7 0.6 0.5 0.816.0 13.1 5.8 2.8 2.5 0.8
2,903
5.5
SHARE OF TOTAL APPLICATIONS (%)
1 2 3 4 5 6 7 8 9 10 11 12 13 14 15 16 17 18 19 20 >20
SectIon A StAtIStIcS on MAdRId InteRnAtIonAl ApplIcAtIonS
17
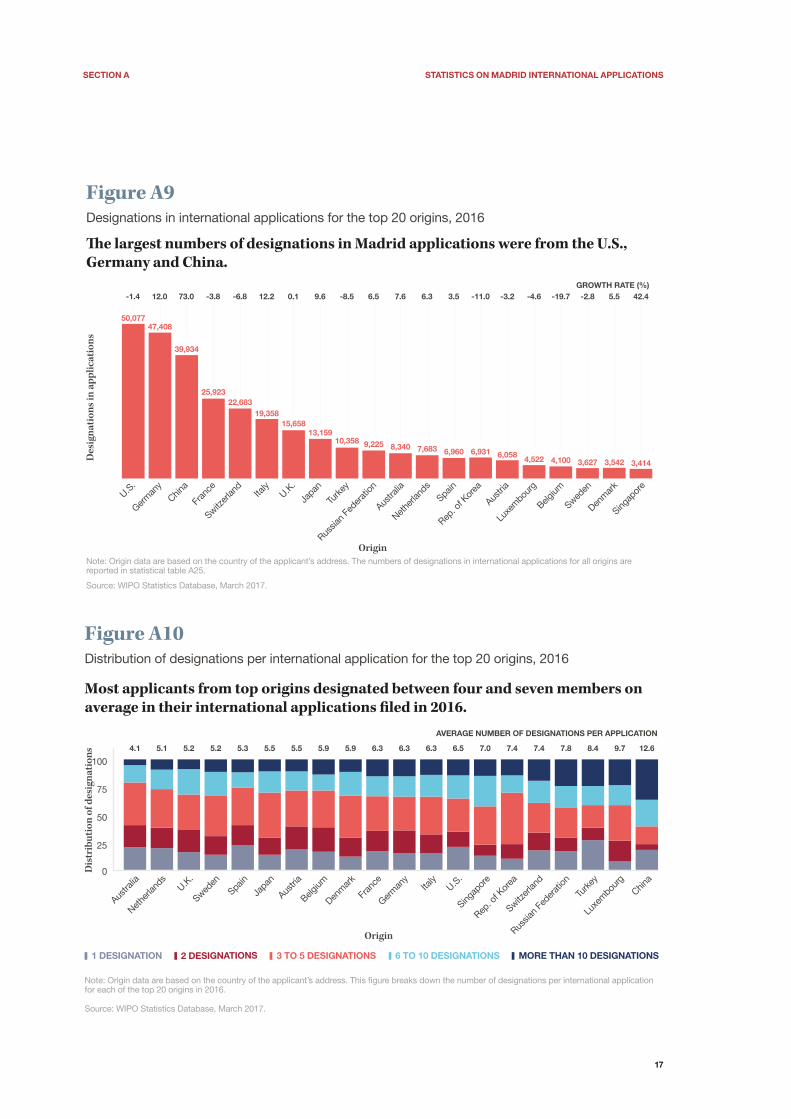
Figure A9Designations in international applications for the top 20 origins, 2016
�e largest numbers of designations in Madrid applications were from the U.S., Germany and China.
Note: Origin data are based on the country of the applicant’s address. The numbers of designations in international applications for all origins arereported in statistical table A25.
Source: WIPO Statistics Database, March 2017.
U.S.
Germ
any
China
Fran
ce
Switzer
land
Italy
U.K.
Japa
n
Turk
ey
Russia
n Fed
erat
ion
Austra
lia
Nethe
rland
sSpa
in
Rep. o
f Kor
ea
Austri
a
Luxe
mbo
urg
Belgium
Sweden
Denm
ark
Singap
ore
50,07747,408
39,934
25,92322,683
19,35815,658
13,15910,358 9,225 8,340 7,683 6,960 6,931 6,058 4,522 4,100 3,627 3,542 3,414
-1.4 -3.8 -6.8 0.1 9.6 7.6 6.3 3.5 -11.0 -3.2 -19.7 -2.8 5.5 42.412.0 73.0 12.2 -8.5 6.5 -4.6GROWTH RATE (%)
Origin
Des
ign
ati
on
s in
ap
pli
cati
on
s
Figure A10Distribution of designations per international application for the top 20 origins, 2016
Most applicants from top origins designated between four and seven members on average in their international applications �led in 2016.
Note: Origin data are based on the country of the applicant’s address. This �gure breaks down the number of designations per international applicationfor each of the top 20 origins in 2016.
Source: WIPO Statistics Database, March 2017.
1 DESIGNATION 2 DESIGNATIONS 3 TO 5 DESIGNATIONS 6 TO 10 DESIGNATIONS MORE THAN 10 DESIGNATIONS
Austra
lia
Nethe
rland
sU.K
.
Sweden
Spain
Japa
n
Austri
a
Belgium
Denm
ark
Fran
ce
Germ
any
Italy
U.S.
Singap
ore
Rep. o
f Kor
ea
Switzer
land
Russia
n Fed
erat
ion
Turk
ey
Luxe
mbo
urg
China
0
25
50
75
100
4.1 5.1 5.2 5.2 5.3 5.5 5.5 5.9 5.9 6.3 6.3 6.3 6.5 7.0 7.4 7.4 7.8 8.4 9.7 12.6
Origin
AVERAGE NUMBER OF DESIGNATIONS PER APPLICATION
Dist
ribut
ion
of d
esig
natio
ns
SectIon A StAtIStIcS on MAdRId InteRnAtIonAl ApplIcAtIonS
18
ITALYSWITZERLAND
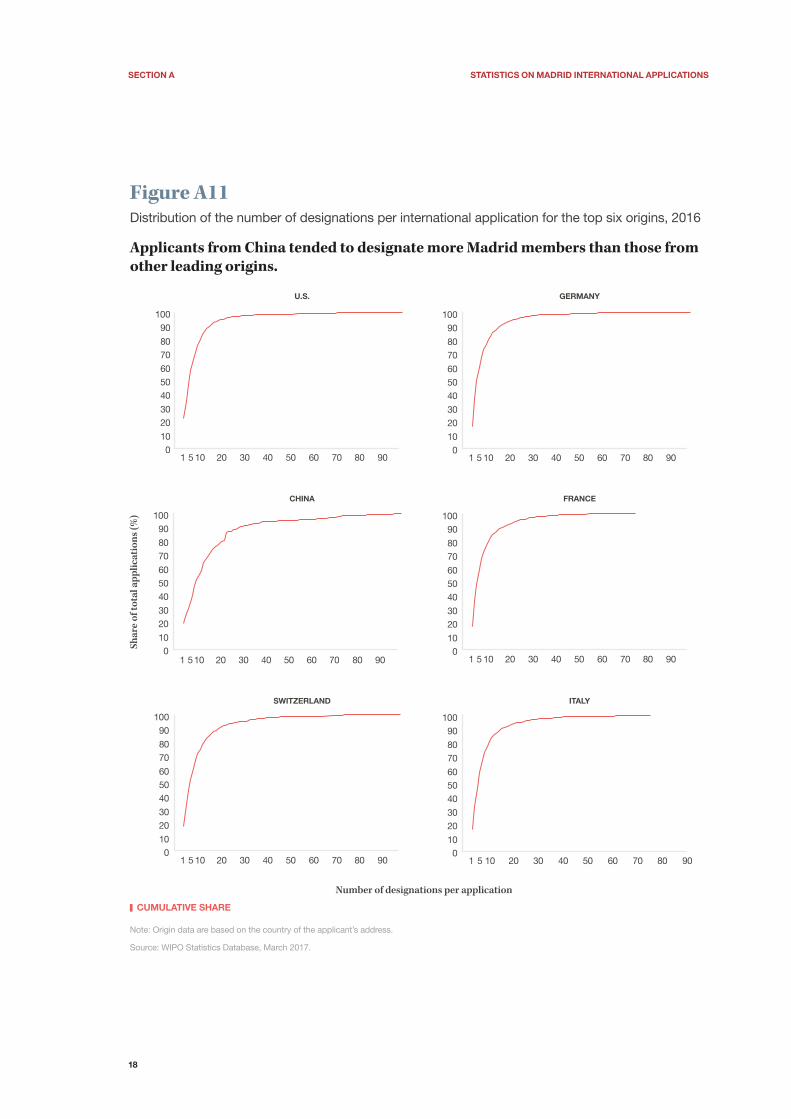
Figure A11Distribution of the number of designations per international application for the top six origins, 2016
Applicants from China tended to designate more Madrid members than those from other leading origins.
Note: Origin data are based on the country of the applicant’s address.
Source: WIPO Statistics Database, March 2017.
FRANCECHINA
GERMANYU.S.
CUMULATIVE SHARE
Number of designations per application
Sh
are
of
tota
l ap
pli
cati
on
s (%
)
010
2030
405060
7080
90100
1 5 10 20 30 40 50 60 70 80 90
010
2030
405060
7080
90100
1 5 10 20 30 40 50 60 70 80 90
010
2030
405060
7080
90100
1 510 20 30 40 50 60 70 80 90
010
2030
405060
7080
90100
1 5 10 20 30 40 50 60 70 80 90
010
2030
405060
7080
90100
1 5 10 20 30 40 50 60 70 80 90
010
2030
405060
7080
90100
1 5 10 20 30 40 50 60 70 80 90

SectIon A StAtIStIcS on MAdRId InteRnAtIonAl ApplIcAtIonS
19
Figure A12Designations in international applications for the top 20 designated Madrid members, 2016
China was the most designated country in 2016, a position it has held for thepast decade.
Note: The numbers of designations in applications for all Madrid members are reported in statistical table A25.
Source: WIPO Statistics Database, March 2017.
China EU
U.S.
Russia
n Fed
erat
ion
Japa
n
Switzer
land
Austra
lia
Rep. o
f Kor
eaInd
ia
Mex
ico
Singap
ore
Turk
ey
Norway
New Z
ealan
d
Ukrain
e
Viet N
am U.K.
Philipp
ines
Israe
l
Kazak
hsta
n
22,444 21,747 21,276
14,855 14,696 14,12213,130
11,271 11,263
9,208 8,815 8,797 8,4516,822 6,303 5,824 5,124 4,970 4,610 4,511
6.3 0.0 8.4 9.3 7.5 6.5 2.0 6.6 12.9 -0.7 43.8 10.9 3.3 -0.712.2 10.3 7.9 9.9 8.7 10.4
GROWTH RATE (%)
Madrid member
Des
ign
ati
on
s in
ap
pli
cati
on
s
Table A13Designations in international applications for the top 20 origins and top 15 designated Madrid members, 2016
designated Madrid member (number of designations)
origin
ch
ina
eU
U.S
.
Ru
ssia
n F
ed
era
tio
n
Jap
an
Sw
itze
rlan
d
Au
stra
lia
Re
p. o
f K
ore
a
Ind
ia
Mex
ico
Sin
ga
po
re
turk
ey
no
rwa
y
new
Z
ea
lan
d
Uk
rain
e
Australia 962 953 1,299 201 531 110 31 293 385 141 514 77 131 774 43
Austria 320 340 373 256 166 635 137 103 114 90 61 178 168 48 116
Belgium 283 294 303 201 143 244 118 92 131 62 70 108 117 51 87
China 43 892 1,457 1,416 1,210 711 1,141 1,193 1,531 826 956 820 434 748 686
Denmark 255 209 355 164 186 183 185 139 110 70 94 114 314 92 53
France 1,821 1,406 1,790 1,168 1,126 1,569 762 696 682 624 655 697 636 336 507
Germany 3,273 2,628 3,282 2,482 1,906 4,498 1,559 1,511 1,521 1,140 880 1,825 1,792 609 962
Italy 1,776 982 1,761 1,287 1,040 992 635 692 575 451 375 678 393 243 392
Japan 1,402 1,275 1,462 448 8 322 566 1,094 557 299 820 257 227 243 116
Luxembourg 213 191 226 180 124 245 127 106 94 82 104 120 128 69 78
Netherlands 618 652 677 367 328 444 309 206 319 184 173 282 346 169 133
Rep. of Korea
630 414 623 193 508 73 205 6 252 141 269 148 60 106 77
(Continued)

SectIon A StAtIStIcS on MAdRId InteRnAtIonAl ApplIcAtIonS
20
(Continued)
designated Madrid member (number of designations)
origin
ch
ina
eU
U.S
.
Ru
ssia
n F
ed
era
tio
n
Jap
an
Sw
itze
rla
nd
Au
stra
lia
Re
p. o
f K
ore
a
Ind
ia
Mex
ico
Sin
ga
po
re
turk
ey
no
rwa
y
new
Z
ea
lan
d
Uk
rain
e
Russian Federation
610 250 248 6 77 86 50 86 146 42 50 119 68 19 443
Singapore 287 191 263 79 205 55 211 195 187 48 28 47 35 93 34
Spain 509 190 658 359 293 221 207 187 202 499 123 203 115 73 134
Sweden 357 126 416 202 260 250 216 165 166 104 80 128 389 78 41
Switzerland 1,219 1,955 1,269 911 940 107 611 666 590 587 572 680 598 316 401
Turkey 257 276 353 448 109 152 97 83 142 57 70 - 86 37 274
U.K. 1,448 1,390 1,853 576 1,015 621 1,378 511 674 495 547 353 423 615 144
U.S. 3,918 4,989 96 1,667 3,459 1,508 3,412 2,396 2,020 2,592 1,661 1,037 1,155 1,657 491
Others 2,243 2,144 2,512 2,244 1,062 1,096 1,173 851 865 674 713 926 836 446 1,091
total 22,444 21,747 21,276 14,855 14,696 14,122 13,130 11,271 11,263 9,208 8,815 8,797 8,451 6,822 6,303
Note: Origin data are based on the country of the applicant’s address. The table shows the numbers of designations made in Madrid applications for the top 15 designated Madrid members from the top 20 origins in 2016. In the Madrid System, it is not possible for a trademark holder to designate, in an international application, the Madrid member through which the holder is entitled to use the Madrid System. However, a trademark holder may be entitled to use the Madrid System through more than one member. The holder may be domiciled in one member, have the nationality of another, and have an industrial or commercial establishment in yet another Madrid member. In this table, where designations exist for an origin that is the same as the designated Madrid member, this indicates that a trademark holder residing in that country of origin was entitled to file an international application through another Madrid member.
Source: WIPO Statistics Database, March 2017.
Figure A14Distribution of designations in international applications for the top 15 designated Madridmembers received from their top 3 origins, 2016
China is featured among the top origins of designations received by 9 of the top 20 Madrid members in 2016.
Source: WIPO Statistics Database, March 2017.
Madrid member
AUSTRALIA SWITZERLAND CHINA U.K. FRANCE U.S. GERMANY
Austra
liaChin
a EUInd
ia
Japan
Mex
ico
New Z
ealan
d
Norway
Rep. o
f Kor
ea
Russia
n Fed
erat
ion
Singap
ore
Switzer
land
Turk
eyU.S
.
Ukrain
e0
20
40
60
Shar
e of d
esig
natio
ns (%
)
SectIon A StAtIStIcS on MAdRId InteRnAtIonAl ApplIcAtIonS
21
Route: Direct versus Madrid
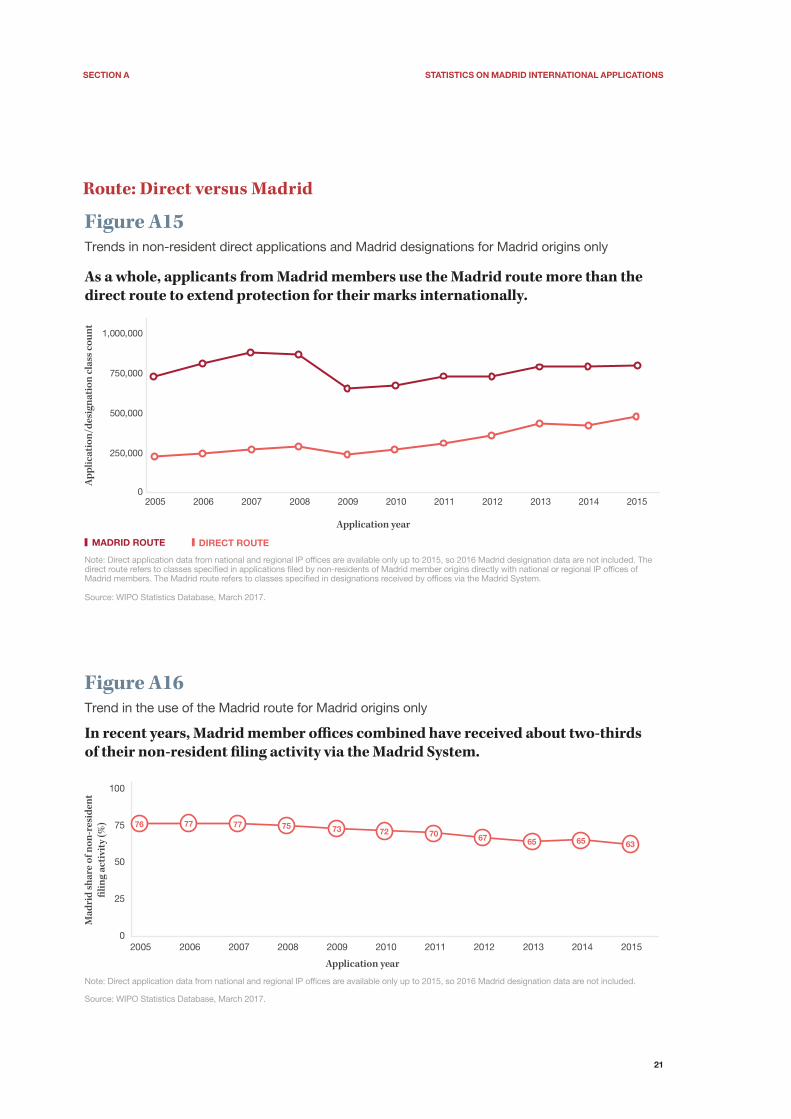
Figure A15Trends in non-resident direct applications and Madrid designations for Madrid origins only
As a whole, applicants from Madrid members use the Madrid route more than the direct route to extend protection for their marks internationally.
Note: Direct application data from national and regional IP of�ces are available only up to 2015, so 2016 Madrid designation data are not included. The direct route refers to classes speci�ed in applications �led by non-residents of Madrid member origins directly with national or regional IP of�ces of Madrid members. The Madrid route refers to classes speci�ed in designations received by of�ces via the Madrid System.
Source: WIPO Statistics Database, March 2017.
0
250,000
500,000
750,000
1,000,000
2005 2006 2007 2008 2009 2010 2011 2012 2013 2014 2015
MADRID ROUTE DIRECT ROUTE
Application year
Ap
pli
cati
on
/des
ign
ati
on
cla
ss c
ou
nt
Figure A16Trend in the use of the Madrid route for Madrid origins only
In recent years, Madrid member o�ces combined have received about two-thirdsof their non-resident �ling activity via the Madrid System.
Note: Direct application data from national and regional IP of�ces are available only up to 2015, so 2016 Madrid designation data are not included.
Source: WIPO Statistics Database, March 2017.
0
25
50
75
100
2005 2006 2007 2008 2009 2010 2011 2012 2013 2014 2015
76 77 77 75 73 72 70 67 65 65 63
Application year
Mad
rid sh
are o
f non
-res
iden
t �l
ing a
ctiv
ity (%
)
SectIon A StAtIStIcS on MAdRId InteRnAtIonAl ApplIcAtIonS
22
Nice classes specified in Madrid international applications
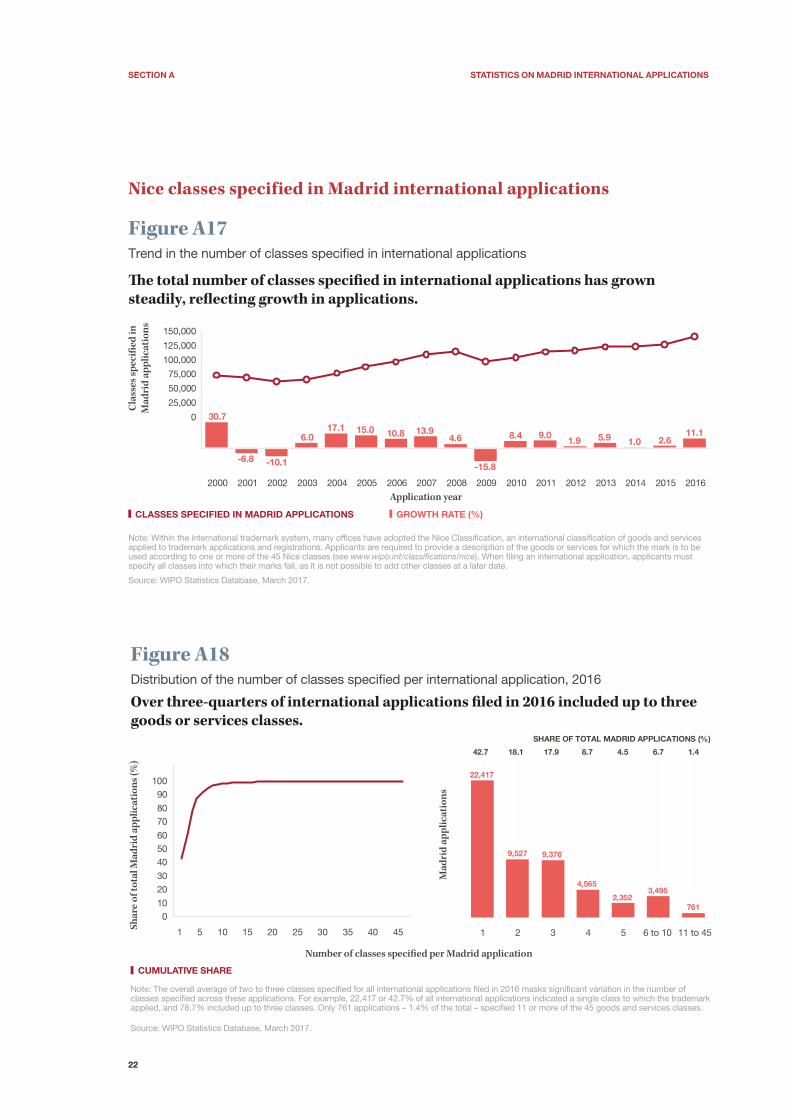
Figure A17Trend in the number of classes speci�ed in international applications
�e total number of classes speci�ed in international applications has grown steadily, re�ecting growth in applications.
Note: Within the international trademark system, many of�ces have adopted the Nice Classi�cation, an international classi�cation of goods and services applied to trademark applications and registrations. Applicants are required to provide a description of the goods or services for which the mark is to be used according to one or more of the 45 Nice classes (see www.wipo.int/classifications/nice). When �ling an international application, applicants must specify all classes into which their marks fall, as it is not possible to add other classes at a later date.
Source: WIPO Statistics Database, March 2017.
30.7
-6.8 -10.1
6.017.1 15.0 10.8 13.9
4.6
-15.8
8.4 9.01.9 5.9 1.0 2.6
11.1
0
25,000
50,000
75,000
100,000
125,000
150,000
2000 2001 2002 2003 2004 2005 2006 2007 2008 2009 2010 2011 2012 2013 2014 2015 2016
Application year
CLASSES SPECIFIED IN MADRID APPLICATIONS GROWTH RATE (%)
Cla
sses
sp
eci�
ed i
n
Ma
dri
d a
pp
lica
tio
ns
Figure A18Distribution of the number of classes speci ed per international application, 2016
Over three-quarters of international applications �led in 2016 included up to three goods or services classes.
Note: The overall average of two to three classes speci ed for all international applications led in 2016 masks signi cant variation in the number of classes speci ed across these applications. For example, 22,417 or 42.7% of all international applications indicated a single class to which the trademark applied, and 78.7% included up to three classes. Only 761 applications – 1.4% of the total – speci ed 11 or more of the 45 goods and services classes.
Source: WIPO Statistics Database, March 2017.
010
2030
405060
7080
90100
1 5 10 15 20 25 30 35 40 45
SHARE OF TOTAL MADRID APPLICATIONS (%)
42.7 18.1 17.9 8.7 4.5 6.7 1.4
22,417
9,527 9,376
4,565
2,3523,495
761
1 2 3 4 5 6 to 10 11 to 45
Number of classes speci�ed per Madrid application
Shar
e of t
otal
Mad
rid ap
plic
atio
ns (%
)
Mad
rid ap
plic
atio
ns
CUMULATIVE SHARE
SectIon A StAtIStIcS on MAdRId InteRnAtIonAl ApplIcAtIonS
23
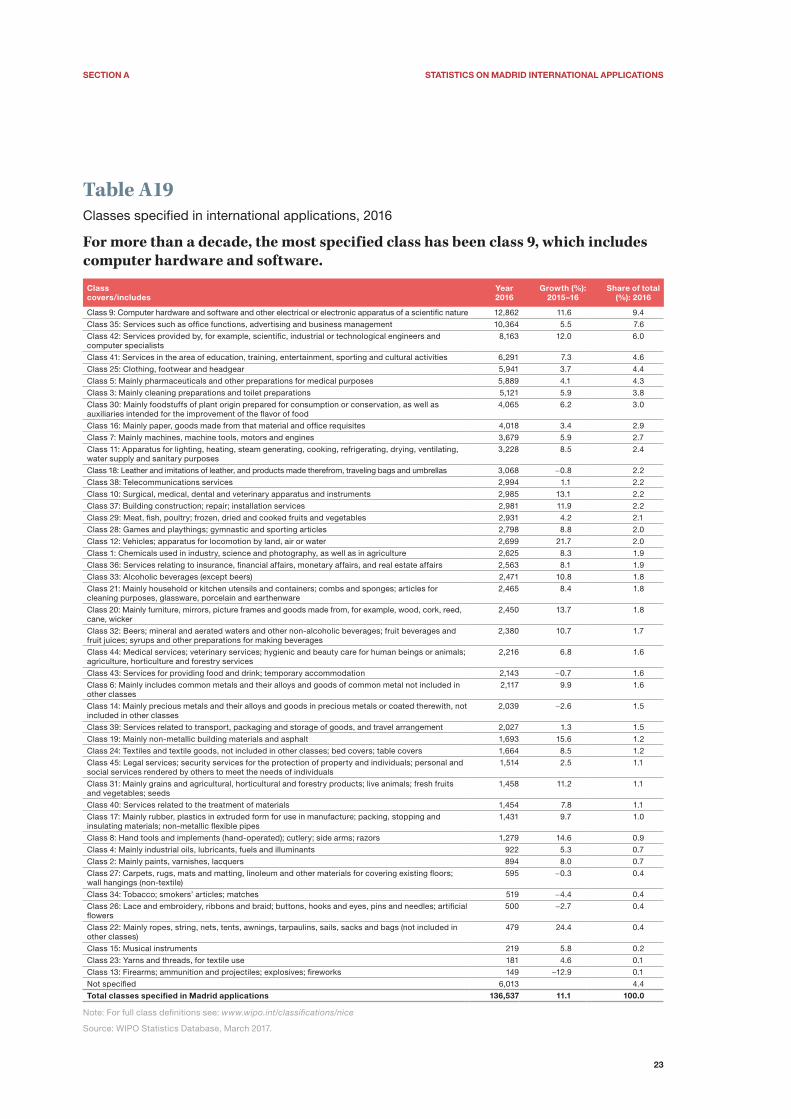
Table A19Classes specified in international applications, 2016
For more than a decade, the most specified class has been class 9, which includes computer hardware and software.
classcovers/includes
Year2016
Growth (%): 2015–16
Share of total (%): 2016
Class 9: Computer hardware and software and other electrical or electronic apparatus of a scientific nature 12,862 11.6 9.4
Class 35: Services such as office functions, advertising and business management 10,364 5.5 7.6
Class 42: Services provided by, for example, scientific, industrial or technological engineers and computer specialists
8,163 12.0 6.0
Class 41: Services in the area of education, training, entertainment, sporting and cultural activities 6,291 7.3 4.6
Class 25: Clothing, footwear and headgear 5,941 3.7 4.4
Class 5: Mainly pharmaceuticals and other preparations for medical purposes 5,889 4.1 4.3
Class 3: Mainly cleaning preparations and toilet preparations 5,121 5.9 3.8
Class 30: Mainly foodstuffs of plant origin prepared for consumption or conservation, as well as auxiliaries intended for the improvement of the flavor of food
4,065 6.2 3.0
Class 16: Mainly paper, goods made from that material and office requisites 4,018 3.4 2.9
Class 7: Mainly machines, machine tools, motors and engines 3,679 5.9 2.7
Class 11: Apparatus for lighting, heating, steam generating, cooking, refrigerating, drying, ventilating, water supply and sanitary purposes
3,228 8.5 2.4
Class 18: Leather and imitations of leather, and products made therefrom, traveling bags and umbrellas 3,068 -0.8 2.2
Class 38: Telecommunications services 2,994 1.1 2.2
Class 10: Surgical, medical, dental and veterinary apparatus and instruments 2,985 13.1 2.2
Class 37: Building construction; repair; installation services 2,981 11.9 2.2
Class 29: Meat, fish, poultry; frozen, dried and cooked fruits and vegetables 2,931 4.2 2.1
Class 28: Games and playthings; gymnastic and sporting articles 2,798 8.8 2.0
Class 12: Vehicles; apparatus for locomotion by land, air or water 2,699 21.7 2.0
Class 1: Chemicals used in industry, science and photography, as well as in agriculture 2,625 8.3 1.9
Class 36: Services relating to insurance, financial affairs, monetary affairs, and real estate affairs 2,563 8.1 1.9
Class 33: Alcoholic beverages (except beers) 2,471 10.8 1.8
Class 21: Mainly household or kitchen utensils and containers; combs and sponges; articles for cleaning purposes, glassware, porcelain and earthenware
2,465 8.4 1.8
Class 20: Mainly furniture, mirrors, picture frames and goods made from, for example, wood, cork, reed, cane, wicker
2,450 13.7 1.8
Class 32: Beers; mineral and aerated waters and other non-alcoholic beverages; fruit beverages and fruit juices; syrups and other preparations for making beverages
2,380 10.7 1.7
Class 44: Medical services; veterinary services; hygienic and beauty care for human beings or animals; agriculture, horticulture and forestry services
2,216 6.8 1.6
Class 43: Services for providing food and drink; temporary accommodation 2,143 -0.7 1.6
Class 6: Mainly includes common metals and their alloys and goods of common metal not included in other classes
2,117 9.9 1.6
Class 14: Mainly precious metals and their alloys and goods in precious metals or coated therewith, not included in other classes
2,039 -2.6 1.5
Class 39: Services related to transport, packaging and storage of goods, and travel arrangement 2,027 1.3 1.5
Class 19: Mainly non-metallic building materials and asphalt 1,693 15.6 1.2
Class 24: Textiles and textile goods, not included in other classes; bed covers; table covers 1,664 8.5 1.2
Class 45: Legal services; security services for the protection of property and individuals; personal and social services rendered by others to meet the needs of individuals
1,514 2.5 1.1
Class 31: Mainly grains and agricultural, horticultural and forestry products; live animals; fresh fruits and vegetables; seeds
1,458 11.2 1.1
Class 40: Services related to the treatment of materials 1,454 7.8 1.1
Class 17: Mainly rubber, plastics in extruded form for use in manufacture; packing, stopping and insulating materials; non-metallic flexible pipes
1,431 9.7 1.0
Class 8: Hand tools and implements (hand-operated); cutlery; side arms; razors 1,279 14.6 0.9
Class 4: Mainly industrial oils, lubricants, fuels and illuminants 922 5.3 0.7
Class 2: Mainly paints, varnishes, lacquers 894 8.0 0.7
Class 27: Carpets, rugs, mats and matting, linoleum and other materials for covering existing floors; wall hangings (non-textile)
595 -0.3 0.4
Class 34: Tobacco; smokers’ articles; matches 519 -4.4 0.4
Class 26: Lace and embroidery, ribbons and braid; buttons, hooks and eyes, pins and needles; artificial flowers
500 -2.7 0.4
Class 22: Mainly ropes, string, nets, tents, awnings, tarpaulins, sails, sacks and bags (not included in other classes)
479 24.4 0.4
Class 15: Musical instruments 219 5.8 0.2
Class 23: Yarns and threads, for textile use 181 4.6 0.1
Class 13: Firearms; ammunition and projectiles; explosives; fireworks 149 -12.9 0.1
Not specified 6,013 4.4
total classes specified in Madrid applications 136,537 11.1 100.0
Note: For full class definitions see: www.wipo.int/classifications/nice
Source: WIPO Statistics Database, March 2017.
SectIon A StAtIStIcS on MAdRId InteRnAtIonAl ApplIcAtIonS
24
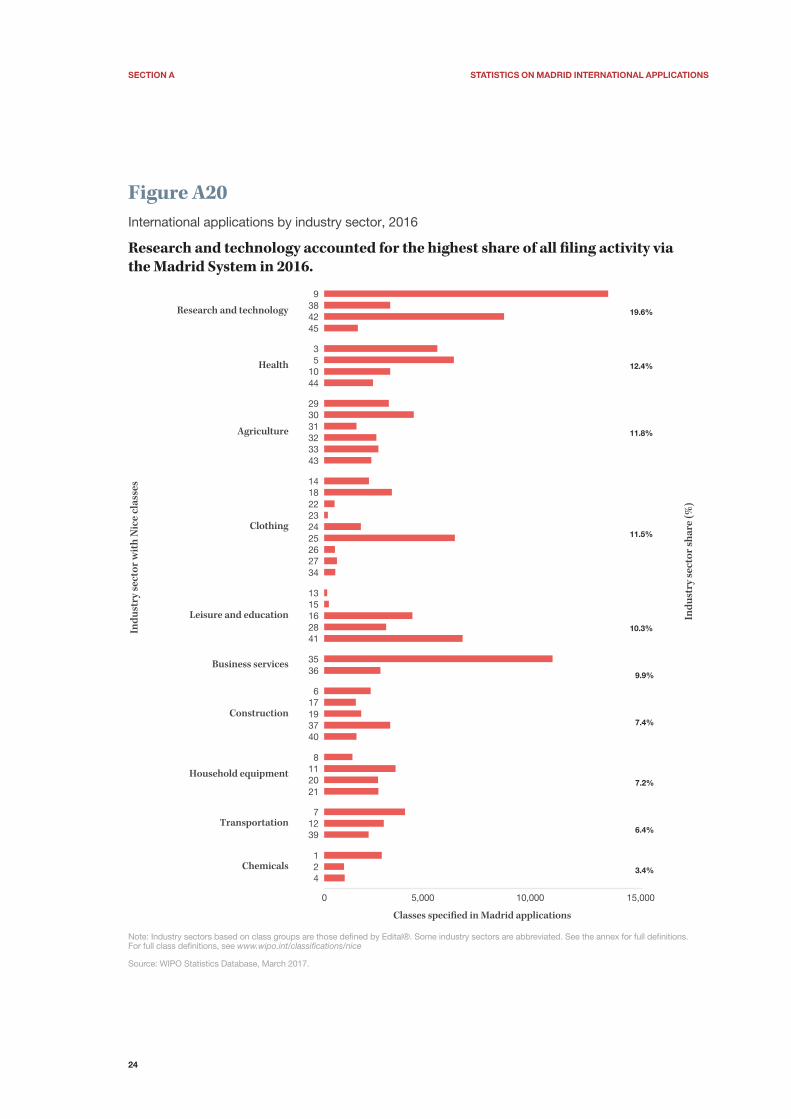
Figure A20
International applications by industry sector, 2016
Research and technology accounted for the highest share of all �ling activity via the Madrid System in 2016.
Note: Industry sectors based on class groups are those de�ned by Edital®. Some industry sectors are abbreviated. See the annex for full de�nitions.For full class de�nitions, see www.wipo.int/classifications/nice
Source: WIPO Statistics Database, March 2017.
19.6%
12.4%
11.8%
11.5%
10.3%
9.9%
7.4%
7.2%
6.4%
3.4%
Ind
ust
ry s
ecto
r sh
are
(%
)
0 5,000 10,000 15,000
Classes speci�ed in Madrid applications
Chemicals
Transportation
Household equipment
Construction
Business services
Leisure and education
Clothing
Agriculture
Health
Research and technology
421
39127
2120118
403719176
3635
4128161513
342726252423221814
433332313029
441053
4542389
Ind
ust
ry s
ecto
r w
ith
Nic
e cl
ass
es
SectIon A StAtIStIcS on MAdRId InteRnAtIonAl ApplIcAtIonS
25
Figure A21International applications by top three sectors for the top 10 origins, 2016
�e business services sector features among the top three for applications from Australia, the Netherlands and Switzerland.
Note: Industry sectors based on class groups are those de�ned by Edital®. Some industry sectors are abbreviated. See the annex for fullde�nitions. For full class de�nitions, see www.wipo.int/classifications/nice
Source: WIPO Statistics Database, March 2017.
0
10
20
30
40
50
Sh
are
of
ap
pli
cati
on
s (%
)
Austra
liaChin
a
Fran
ce
Germ
any
Italy
Japa
n
Nethe
rland
s
Switzer
land
U.K.
U.S.
Origin
AGRICULTURE LEISURE AND EDUCATION BUSINESS SERVICES RESEARCH AND TECHNOLOGY CLOTHING
TRANSPORTATION HEALTH
Figure A22Trend in services classes versus goods classes
Services classes comprise close to a third of all classes speci�ed in international applications.
Note: The �rst 34 of the 45 Nice classes cover goods, whereas the remaining 11 cover services. For full class de�nitions, see www.wipo.int/classifications/nice
Source: WIPO Statistics Database, March 2017.
2000 2001 2002 2003 2004 2005 2006 2007 2008 2009 2010 2011 2012 2013 2014 2015 2016
33.5 32.6 29.3 26.4 26.4 28.1 29.8 31.2 32.4 31.2 29.7 30.8 30.6 31.5 32.3 32.9 32.7
25,000
50,000
75,000
100,000
125,000
150,000
Clas
ses s
peci
�ed
in
Mad
rid ap
plic
atio
ns
Application year
SERVICES CLASSES SHARE (%)
GOODS CLASSES SERVICES CLASSES

SectIon A StAtIStIcS on MAdRId InteRnAtIonAl ApplIcAtIonS
26
Table A23Goods classes versus services classes in applications for selected origins, 2006 versus 2016
Goods and services class shares vary across origins.
2006 (%) 2016 (%) change in services classes share
compared to 2006 (percentage points)
origin Goods Services Goods Services
Switzerland 63.9 36.1 59.6 40.4 4.3
Luxembourg 69.0 31.0 59.7 40.3 9.3
United Kingdom 69.0 31.0 62.9 37.1 6.1
Austria 64.5 35.5 62.9 37.1 1.6
France 68.0 32.0 63.0 37.0 5.0
Netherlands 63.8 36.2 64.3 35.7 -0.5
United States of America 67.9 32.1 64.4 35.6 3.5
Australia 70.0 30.0 65.0 35.0 5.0
Spain 69.0 31.0 65.0 35.0 4.0
Sweden 63.2 36.8 65.5 34.5 -2.3
Denmark 71.4 28.6 66.2 33.8 5.2
Germany 72.0 28.0 67.2 32.8 4.8
Belgium 72.0 28.0 69.1 30.9 2.9
Russian Federation 67.7 32.3 71.5 28.5 -3.8
Hungary 62.1 37.9 73.1 26.9 -11.0
Turkey 81.8 18.2 74.1 25.9 7.7
Republic of Korea 81.1 18.9 77.9 22.1 3.2
Japan 83.5 16.5 78.0 22.0 5.5
Italy 83.6 16.4 78.3 21.7 5.3
China 93.0 7.0 82.0 18.0 11.0
Note: The first 34 of the 45 Nice classes cover goods, whereas the remaining 11 cover services. For full class definitions, see www.wipo.int/classifications/nice
Source: WIPO Statistics Database, March 2017.
Figure A24International applications by top three sectors for selected Madrid members, 2016
Agricultural products and services attract considerable �ling in Algeria, Austria and the African Intellectual Property Organization (OAPI), which covers 17 African countries.
Note: Industry sectors based on class groups are those de�ned by Edital®. Some industry sectors are abbreviated. See the annex for full de�nitions.For full class de�nitions, see www.wipo.int/classifications/nice
Source: WIPO Statistics Database, March 2017.
0
10
20
30
40
50
Madrid member
Algeria
Austri
aChin
aInd
ia
Kenya
Mex
icoOAPI
Russia
n Fed
erat
ion U.K.
U.S.
Sh
are
of
ap
pli
cati
on
s (%
)
AGRICULTURE LEISURE AND EDUCATION BUSINESS SERVICES RESEARCH AND TECHNOLOGY CLOTHING
HEALTH
SectIon A StAtIStIcS on MAdRId InteRnAtIonAl ApplIcAtIonS
27
Statistical table
Table A25International applications and designations via the Madrid System, 2016
origin¹ designated member
name number of applications designations designations
African Intellectual Property Organization n.a. n.a. 1,949
Albania 1 4 2,170
Algeria 1 69 2,606
Andorra (a) 4 24 n.a.
Antigua and Barbuda 1 6 656
Argentina (a) 2 28 n.a.
Armenia 17 252 2,243
Australia 2,067 8,340 13,130
Austria 1,067 6,058 2,445
Azerbaijan 5 109 2,915
Bahamas (a) 15 64 n.a.
Bahrain 1 73 2,164
Barbados (a) 3 24 n.a.
Belarus 133 841 4,342
Belgium (b) 694 4,100 n.a.
Belize (a) 20 176 n.a.
Benelux n.a. n.a. 2,494
Bermuda (a) 5 185 n.a.
Bhutan .. .. 632
Bonaire, Sint Eustatius and Saba .. .. 592
Bosnia and Herzegovina 22 235 2,973
Botswana .. .. 798
Brazil (a) 1 5 n.a.
Bulgaria 247 3,159 1,254
Cambodia 1 1 1,543
Cameroon (a) 2 12 n.a.
Canada (a) 65 434 n.a.
Chile (a) 2 7 n.a.
China 3,200 39,934 22,444
China, Hong Kong SAR (a) 48 46 n.a.
Colombia 37 196 4,072
Costa Rica (a) 1 1 n.a.
Croatia 139 806 1,353
Cuba 2 7 1,718
Curaçao 11 169 675
Cyprus 159 1,592 648
Czech Republic 301 3,095 1,461
Democratic People’s Republic of Korea 4 4 921
Denmark 596 3,542 1,179
Dominica (a) 1 10 n.a.
Dominican Republic (a) 4 7 n.a.
Egypt 16 358 4,192
Estonia 50 240 973
European Union n.a. n.a. 21,747
Fiji (a) 5 9 n.a.
Finland 537 2,951 969
France 4,132 25,923 3,081
Gambia .. .. 456
Georgia 21 292 2,427
Germany 7,551 47,408 3,832
(Continued)
SectIon A StAtIStIcS on MAdRId InteRnAtIonAl ApplIcAtIonS
28
(Continued)
origin¹ designated member
name number of applications
designations designations
Ghana .. .. 1,257
Greece 113 850 1,061
Guyana (a) 1 4 n.a.
Hungary 133 1,475 1,367
Iceland 37 154 2,242
India 171 2,067 11,263
Indonesia (a) 1 1 n.a.
Iran (Islamic Republic of) 38 484 3,799
Ireland 180 1,312 853
Israel 281 1,359 4,610
Italy 3,024 19,358 2,970
Japan 2,352 13,159 14,696
Kazakhstan 78 362 4,511
Kenya 8 125 1,833
Kyrgyzstan 5 27 2,121
Lao People’s Democratic Republic .. .. 656
Latvia 96 593 1,125
Lebanon (a) 1 2 n.a.
Lesotho .. .. 629
Liberia .. .. 760
Liechtenstein 87 1,254 2,312
Lithuania 114 614 1,100
Luxembourg (b) 464 4,522 n.a.
Madagascar 3 5 902
Malaysia (a) 4 92 n.a.
Malta (c) 52 507 n.a.
Marshall Islands (a) 2 11 n.a.
Mauritius (a) 9 86 n.a.
Mexico 69 249 9,208
Monaco 74 420 2,246
Mongolia 2 10 1,453
Montenegro 18 145 2,443
Morocco 110 505 3,836
Mozambique .. .. 1,089
Namibia .. .. 995
Netherlands (b) 1,495 7,683 n.a.
New Zealand 409 1,526 6,822
Norway 299 1,380 8,451
Oman .. .. 2,118
Panama (a) 8 68 n.a.
Philippines 28 183 4,970
Poland 446 2,943 2,039
Portugal 220 1,174 1,333
Republic of Korea 942 6,931 11,271
Republic of Moldova 47 398 2,464
Romania 96 402 1,493
Russian Federation 1,176 9,225 14,855
Rwanda .. .. 682
Saint Kitts and Nevis (a) 1 .. n.a.
Saint Vincent and the Grenadines (a) 1 1 n.a.
San Marino 9 70 1,098
Sao Tome and Principe .. .. 513
Serbia 232 1,649 3,848
Seychelles (a) 12 134 n.a.
Sierra Leone .. .. 723
Singapore 485 3,414 8,815
SectIon A StAtIStIcS on MAdRId InteRnAtIonAl ApplIcAtIonS
29
origin¹ designated member
name number of applications
designations designations
Sint Maarten (Dutch Part) .. .. 653
Slovakia 113 565 1,164
Slovenia 167 1,252 1,091
South Africa (a) 4 30 n.a.
Spain 1,292 6,960 2,473
Sri Lanka (a) 1 6 n.a.
Sudan .. .. 1,118
Suriname (a) 1 1 n.a.
Swaziland .. .. 711
Sweden 695 3,627 1,312
Switzerland 3,074 22,683 14,122
Syrian Arab Republic 5 20 1,158
T F Y R of Macedonia 48 252 2,635
Tajikistan .. .. 1,802
Thailand (a) 6 54 n.a.
Tunisia 26 168 2,370
Turkey 1,221 10,358 8,797
Turkmenistan .. .. 1,835
Ukraine 380 2,474 6,303
United Arab Emirates (a) 18 290 n.a.
United Kingdom 3,014 15,658 5,124
United States of America 7,741 50,077 21,276
Uzbekistan 4 36 1,896
Venezuela (Bolivarian Republic of) (a) 2 28 n.a.
Viet Nam 87 774 5,824
Zambia .. .. 953
Zimbabwe .. .. 761
Others 27 226 4
total 52,550 353,268 353,268
Note: Only countries or territories of origin and designated Madrid member countries or jurisdictions for which 2016 Madrid System statistics exist are listed.
¹ Origin is defined as the country/territory of the stated address of residence of the applicant for an international registration.
(a) This country/territory was not a member of the Madrid System as of December 31, 2016. Applicants from this country/territory are entitled to file via the Madrid System by claiming commercial activity or domicile in a country, or in the jurisdiction of a regional IP office, that is a member of the Madrid System. An applicant cannot designate the Madrid member for which entitlement is claimed (no self-designation is possible).
(b) The IP office is the regional Benelux Office for Intellectual Property (BOIP), which receives designations on behalf of this country.
(c) The country is a member of the Madrid System via its membership of the European Union.
.. indicates zero.
Benelux refers to the Benelux Office for Intellectual Property (BOIP), which receives designations on behalf of Belgium, Luxembourg and the Netherlands.
n.a. indicates not applicable.
Madrid application by origin data for 2016 are WIPO estimates.
Source: WIPO Statistics Database, March 2017.
Attribution Non-Commercial No-Derivatives 3.0 IGO License (CC BY-NC-ND IGO)

30
31
SECT
ION
B
Section BStatistics on Madrid international registrations
Highlights
WIPO recorded almost 45,000 international registrations in 2016
After 125 years of existence, the Madrid System recently recorded its 1.3 millionth international trademark regis-tration. The long-term trend for registrations broadly fol-lows that for applications. However, despite an increase in the number of international applications filed in 2016, the 44,726 international registrations recorded in the same year represent a 13.9% decrease compared to 2015. This decrease was mainly due to the deployment of a new back-end IT system in 2016, which occasioned a temporary contraction of the production capacity of the International Bureau (IB) of WIPO. It should be noted, however, that registrations can fluctuate considerably from one year to the next due to a number of factors, such as the time it takes for international applications to be processed at offices of origin before being sent to the IB, and the processing time required at the IB itself.
How has the trend in subsequent designations evolved over time?
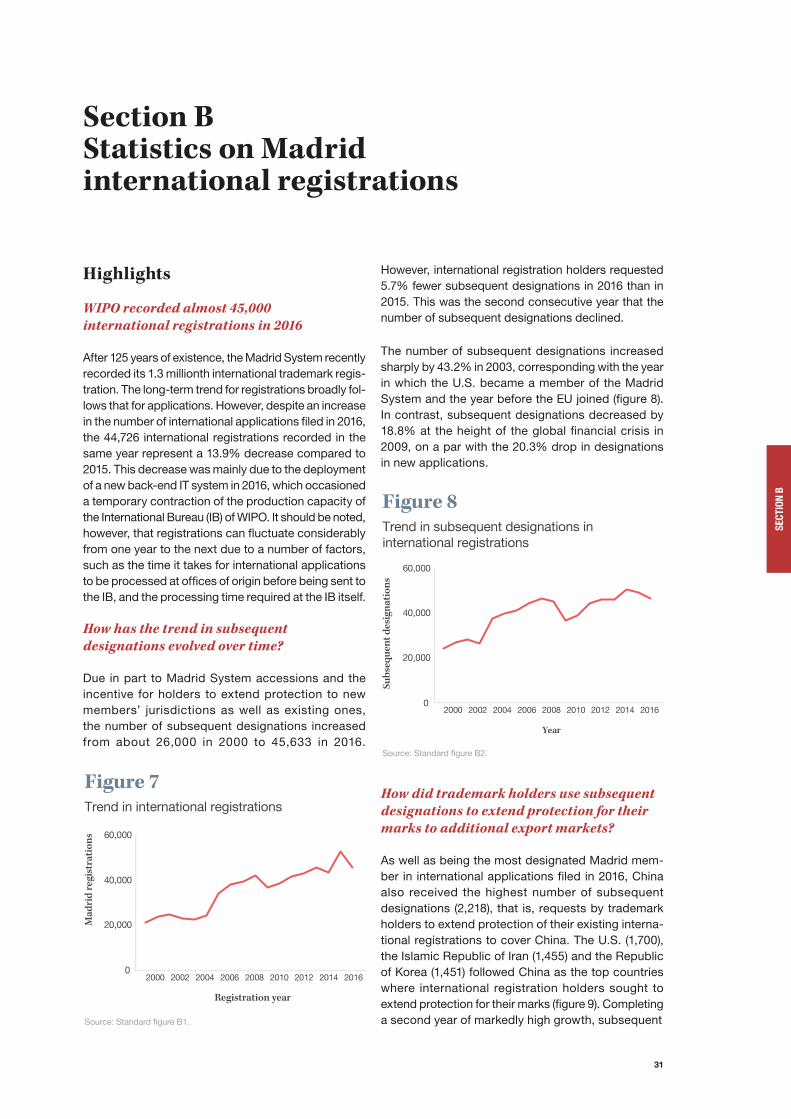
Due in part to Madrid System accessions and the incentive for holders to extend protection to new members’ jurisdictions as well as existing ones, the number of subsequent designations increased from about 26,000 in 2000 to 45,633 in 2016.
Figure 7Trend in international registrations
Source: Standard �gure B1.
2000 2002 2004 2006 2008 2010 2012 2014 2016
Registration year
0
20,000
40,000
60,000
Mad
rid re
gist
ratio
ns
However, international registration holders requested 5.7% fewer subsequent designations in 2016 than in 2015. This was the second consecutive year that the number of subsequent designations declined.
The number of subsequent designations increased sharply by 43.2% in 2003, corresponding with the year in which the U.S. became a member of the Madrid System and the year before the EU joined (figure 8). In contrast, subsequent designations decreased by 18.8% at the height of the global financial crisis in 2009, on a par with the 20.3% drop in designations in new applications.
Figure 8Trend in subsequent designations in international registrations
Source: Standard �gure B2.
2000 2002 2004 2006 2008 2010 2012 2014 2016
Year
0
20,000
40,000
60,000
Subs
eque
nt d
esig
natio
ns
How did trademark holders use subsequent designations to extend protection for their marks to additional export markets?
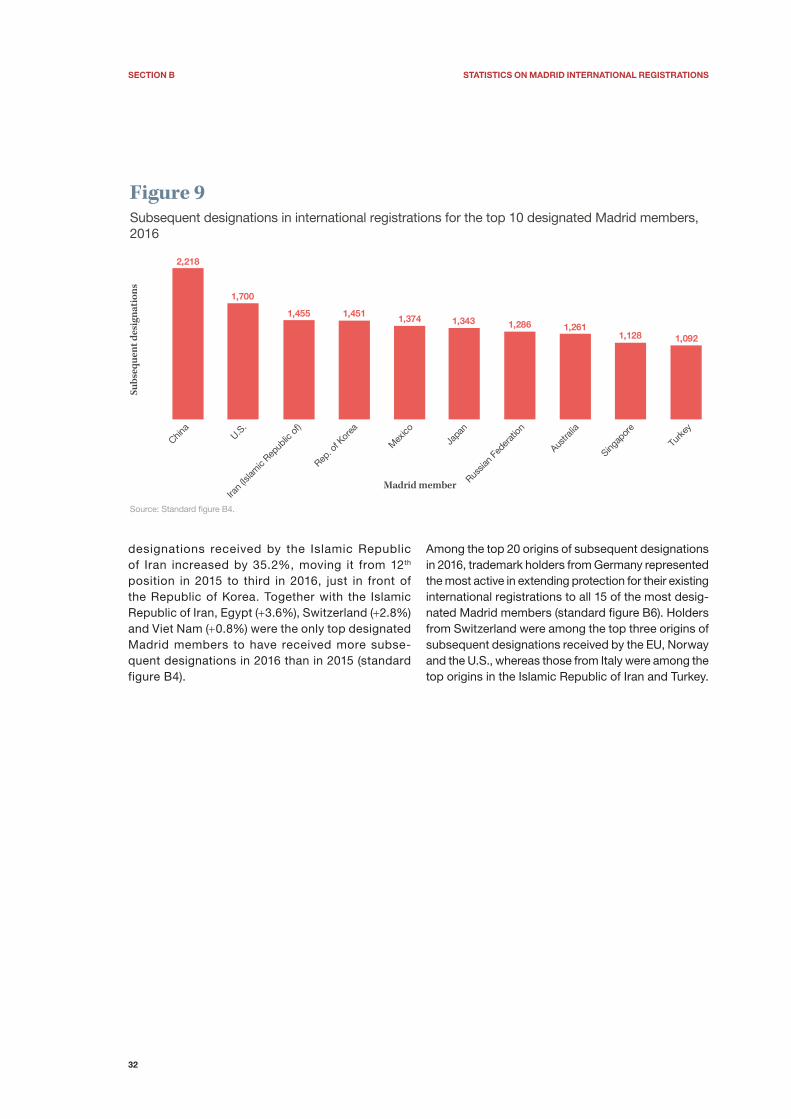
As well as being the most designated Madrid mem-ber in international applications filed in 2016, China also received the highest number of subsequent designations (2,218), that is, requests by trademark holders to extend protection of their existing interna-tional registrations to cover China. The U.S. (1,700), the Islamic Republic of Iran (1,455) and the Republic of Korea (1,451) followed China as the top countries where international registration holders sought to extend protection for their marks (figure 9). Completing a second year of markedly high growth, subsequent
SectIon B StAtIStIcS on MAdRId InteRnAtIonAl ReGIStRAtIonS
32
Figure 9Subsequent designations in international registrations for the top 10 designated Madrid members, 2016
Source: Standard �gure B4.
Subs
eque
nt d
esig
natio
ns
2,218
1,700
1,455 1,451 1,374 1,343 1,286 1,2611,128 1,092
China
U.S.
Iran (
Islam
ic Rep
ublic
of)
Rep. o
f Kor
ea
Mex
ico
Japa
n
Russia
n Fe
dera
tion
Austra
lia
Singap
ore
Turk
ey
Madrid member
designations received by the Islamic Republic of Iran increased by 35.2%, moving it from 12th position in 2015 to third in 2016, just in front of the Republic of Korea. Together with the Islamic Republic of Iran, Egypt (+3.6%), Switzerland (+2.8%) and Viet Nam (+0.8%) were the only top designated Madrid members to have received more subse-quent designations in 2016 than in 2015 (standard figure B4).
Among the top 20 origins of subsequent designations in 2016, trademark holders from Germany represented the most active in extending protection for their existing international registrations to all 15 of the most desig-nated Madrid members (standard figure B6). Holders from Switzerland were among the top three origins of subsequent designations received by the EU, Norway and the U.S., whereas those from Italy were among the top origins in the Islamic Republic of Iran and Turkey.
SectIon B StAtIStIcS on MAdRId InteRnAtIonAl ReGIStRAtIonS
33
Standard figures and tablesMadrid international registrations
B1 Trend in international registrations 34
B2 Trend in subsequent designations in international registrations 34
B3 Subsequent designations in international registrations for the top 20 origins, 2016 35
B4 Subsequent designations in international registrations for the top 20 designated Madrid members, 2016 35
B5 Subsequent designations in international registrations for the top 20 origins and top 15 designated Madrid members, 2016 36
B6 Distribution of subsequent designations in international registrations for the top 15 designated Madrid members received from their top 3 origins, 2016 36
B7 Trend in provisional refusals of designations in international registrations 37
B8 Provisional refusals of designations by selected designated Madrid members, 2016 37
Statistical table
B9 International registrations and subsequent designations via the Madrid System, 2016 38

SectIon B StAtIStIcS on MAdRId InteRnAtIonAl ReGIStRAtIonS
34
Madrid international registrations
60,000
40,000
20,000
0
2000 2001 2002 2003 2004 2005 2006 2007 2008 2009 2010 2011 2012 2013 2014 2015 2016
MADRID REGISTRATIONS GROWTH RATE (%)
Figure B1Trend in international registrations
Madrid international registrations have doubled in the past decade and a half.
Source: WIPO Statistics Database, March 2017.
Mad
rid re
gist
ratio
ns
Registration year
14.44.4
-7.3 -1.7
7.0
41.9
12.23.3 6.5
-12.3
4.5 8.5 3.1 5.9
-4.5
22.4
-13.9
13.23.6
-6.0
43.2
5.8 4.4 7.4 5.3
-3.5-18.8
6.8 13.14.6 0.1
10.0
-3.3 -5.7
60,000
40,000
20,000
0
2000 2001 2002 2003 2004 2005 2006 2007 2008 2009 2010 2011 2012 2013 2014 2015 2016
SUBSEQUENT DESIGNATIONS GROWTH RATE (%)
Figure B2Trend in subsequent designations in international registrations
�e long-term trend shows that subsequent designations have increased from about 26,000 in 2000 to almost 46,000 in 2016.
Source: WIPO Statistics Database, March 2017.
Subs
eque
nt d
esig
natio
ns
Year

SectIon B StAtIStIcS on MAdRId InteRnAtIonAl ReGIStRAtIonS
35
Figure B3Subsequent designations in international registrations for the top 20 origins, 2016
German holders were the most active in extending protection for their marks to other Madrid members in 2016.
Note: Origin data are based on the country of the registration holder’s address. The numbers of subsequent designations in international registrations for all origins are reported in statistical table B9.
Source: WIPO Statistics Database, March 2017.
Origin
Germ
any
U.S.
Fran
ce Italy
Switzer
land
Japan
U.K.
Spain
Nethe
rland
s
Turk
ey
Russia
n Fe
derat
ionChin
a
Austri
a
Belgium
Czech
Rep
ublic
Austra
lia
Denm
ark
Sweden
Luxe
mbou
rg
Poland
7,032
5,283
4,570
3,809 3,793
2,139 2,027 1,822 1,7111,451 1,320
1,025 1,010672 645 608 591 583 562 515
0.0 18.2 -10.1 2.2 -19.1 7.6 -15.1 -13.9 0.4 -9.1 -3.8 -30.0 30.8 -31.2 47.3 -34.8 -30.3 -21.0 27.7 12.0
GROWTH RATE (%)
Subs
eque
nt d
esig
natio
ns
Figure B4Subsequent designations in international registrations for the top 20 designated Madrid members, 2016
Not only was China the most designated Madrid member in applications in 2016, it also received the highest number of subsequent designations.
Note: The numbers of subsequent designations in international registrations for all Madrid members are reported in statistical table B9.
Source: WIPO Statistics Database, March 2017.
Madrid member
China
U.S.
Iran
(Islam
ic Rep
ublic
of)
Rep. o
f Kor
ea
Mex
ico
Japan
Russia
n Fe
derat
ion
Austra
lia
Singap
ore
Turk
ey
Viet N
am
New Z
ealan
d
Switzer
land EU
Norway
Israe
l
Colom
biaEgy
pt
Ukrain
e
Kazak
hsta
n
GROWTH RATE (%)
2,218
1,700
1,455 1,451 1,374 1,3431,286 1,261
1,128 1,092 1,056 1,000 970 958 925 900 880 836 801 700
-6.6 -13.5 35.2 -17.9 -19.3 -8.0 -10.8 -10.8 -2.6 -9.8 0.8 -17.2 2.8 -6.4 -6.9 -3.6 -18.6 3.6 -3.7 -20.9
Subs
eque
nt d
esig
natio
ns

SectIon B StAtIStIcS on MAdRId InteRnAtIonAl ReGIStRAtIonS
36
Table B5Subsequent designations in international registrations for the top 20 origins and top 15 designated Madrid members, 2016
designated Madrid member (number of subsequent designations)
origin
ch
ina
U.S
.
Ira
n (I
sla
mic
R
ep
ub
lic o
f)
Re
p. o
f K
ore
a
Mex
ico
Jap
an
Ru
ssia
n F
ed
era
tio
n
Au
stra
lia
Sin
ga
po
re
turk
ey
Vie
t n
am
new
Ze
ala
nd
Sw
itze
rla
nd
eU
no
rwa
y
Australia 62 42 6 45 28 46 18 - 27 10 27 37 12 31 7
Austria 52 41 39 31 30 24 24 24 22 22 27 25 30 10 14
Belgium 36 29 15 28 30 26 25 25 23 11 11 17 14 25 13
China 3 24 14 17 31 24 14 13 11 17 30 34 14 14 19
Czech Republic 18 25 14 13 14 14 12 14 10 12 16 13 5 7 4
Denmark 22 33 23 23 12 24 16 25 14 23 21 18 29 11 21
France 219 198 174 173 157 152 130 145 114 96 104 91 100 70 76
Germany 503 309 318 222 201 209 255 206 154 202 161 155 202 194 163
Italy 171 184 200 147 140 129 111 129 110 106 87 67 76 50 74
Japan 49 95 44 75 56 6 59 70 77 52 87 49 44 81 36
Luxembourg 10 22 28 7 21 20 7 11 9 15 13 10 12 3 8
Netherlands 103 91 52 51 65 53 56 67 38 51 32 44 50 37 50
Poland 10 11 6 32 10 10 6 8 8 10 7 2 3 1 10
Russian Federation 70 27 26 18 10 24 - 11 12 20 23 11 14 18 15
Spain 77 70 64 61 83 49 46 42 49 55 35 35 43 15 42
Sweden 42 25 13 22 21 24 20 18 23 21 23 17 30 6 26
Switzerland 175 199 120 111 91 121 105 105 91 66 66 83 5 112 96
Turkey 46 47 49 24 14 27 25 15 14 - 13 10 17 11 15
United Kingdom 111 77 56 90 84 63 62 70 71 81 46 67 58 30 55
United States of America 191 1 89 162 169 180 166 149 139 129 138 130 112 109 105
Others 248 150 105 99 107 118 129 114 112 93 89 85 100 123 76
total 2,218 1,700 1,455 1,451 1,374 1,343 1,286 1,261 1,128 1,092 1,056 1,000 970 958 925
Note: Origin data are based on the country of the registration holder’s address.
Source: WIPO Statistics Database, March 2017.
Figure B6Distribution of subsequent designations in international registrations for the top 15 designated Madrid members received from their top 3 origins, 2016
Italy was one of the top origins in the Islamic Republic of Iran and Turkey.
Source: WIPO Statistics Database, March 2017.
FRANCE GERMANY ITALY SWITZERLAND U.S.
Origin
0
10
20
30
40
50
Austra
liaChin
a EU
Iran
(Islam
ic Rep
ublic
of)
Japan
Mex
ico
New Z
ealan
d
Norway
Rep. o
f Kor
ea
Russia
n Fe
derat
ion
Singap
ore
Switzer
land
Turk
eyU.S
.
Viet N
am
Shar
e of s
ubse
quen
t de
signa
tions
(%)

SectIon B StAtIStIcS on MAdRId InteRnAtIonAl ReGIStRAtIonS
37
120,000
80,000
40,000
0
2000 2001 2002 2003 2004 2005 2006 2007 2008 2009 2010 2011 2012 2013 2014 2015 2016
PROVISIONAL REFUSALS GROWTH RATE (%)
Figure B7Trend in provisional refusals of designations in international registrations
Provisional refusals fell by 1.7% in 2016.
Source: WIPO Statistics Database, March 2017.
Pro
visi
on
al r
efu
sals
Year
-3.5
18.7
5.0
-8.0
10.7
21.5 25.9
3.9
-1.8
2.6
-4.5 -3.7
6.4 9.015.5 12.7
-1.7
Figure B8Provisional refusals of designations by selected designated Madrid members, 2016
�e U.S. and the Republic of Korea issued the largest numbers of provisional refusals of designations in 2016.
Source: WIPO Statistics Database, March 2017.
Madrid member
U.S.
Rep. o
f Kore
a
Japan
China
India
Russia
n Fe
dera
tion
Mex
ico EU
Singap
ore
Austra
liaIsr
ael
Philipp
ines
Norway
Switzer
land
Turk
ey
Viet N
am
New Z
ealan
d
Kazak
hsta
n
Colom
bia
Repub
lic o
f Mold
ova
SHARE OF TOTAL PROVISIONAL REFUSALS (%)
19,855
9,327 8,804 8,6147,702 7,412
5,195 4,2533,322 3,081
2,318 2,232 2,160 2,103 1,614 1,539 1,508 1,435 981 891
18.2 8.5 8.1 7.9 7.1 6.8 4.8 3.9 3.0 2.8 2.1 2.0 2.0 1.9 1.5 1.4 1.4 1.3 0.9 0.8
Pro
visi
on
al r
efu
sals

SectIon B StAtIStIcS on MAdRId InteRnAtIonAl ReGIStRAtIonS
38
Statistical table
Table B9International registrations and subsequent designations via the Madrid System, 2016
origin¹ designated member
name number of registrations Subsequent designations Subsequent designations
African Intellectual Property Organization n.a. n.a. 477
Albania 4 9 472
Algeria 5 .. 669
Andorra (a) 7 .. n.a.
Angola (a) 1 .. n.a.
Antigua and Barbuda 1 .. 101
Argentina (a) 2 .. n.a.
Armenia 21 39 399
Australia 1,667 608 1,261
Austria 973 1,010 168
Azerbaijan 2 .. 530
Bahamas (a) 14 13 n.a.
Bahrain 1 1 577
Barbados (a) 1 3 n.a.
Belarus 111 115 583
Belgium (b) 606 672 n.a.
Belize (a) 22 3 n.a.
Benelux n.a. n.a. 193
Bermuda (a) 6 .. n.a.
Bhutan .. .. 112
Bonaire, Sint Eustatius and Saba .. .. 101
Bosnia and Herzegovina 21 7 490
Botswana .. .. 169
Brazil (a) 2 .. n.a.
Bulgaria 156 142 174
Cambodia .. .. 441
Canada (a) 44 24 n.a.
Chile (a) 1 .. n.a.
China 2,961 1,025 2,218
Colombia 24 4 880
Costa Rica (a) 1 .. n.a.
Croatia 127 55 185
Cuba 1 7 499
Curaçao 5 10 145
Cyprus 123 141 120
Czech Republic 276 645 174
Democratic People’s Republic of Korea 8 .. 124
Democratic Republic of the Congo (a) 1 .. n.a.
Denmark 473 591 178
Dominica (a) 1 .. n.a.
Dominican Republic (a) 4 .. n.a.
Egypt 17 82 836
Estonia 48 52 139
European Union n.a. n.a. 958
Fiji (a) 2 .. n.a.
Finland 430 410 178
France 3,718 4,570 221
Gambia .. .. 145
Georgia 27 19 443
Germany 6,462 7,032 241
Ghana .. .. 290
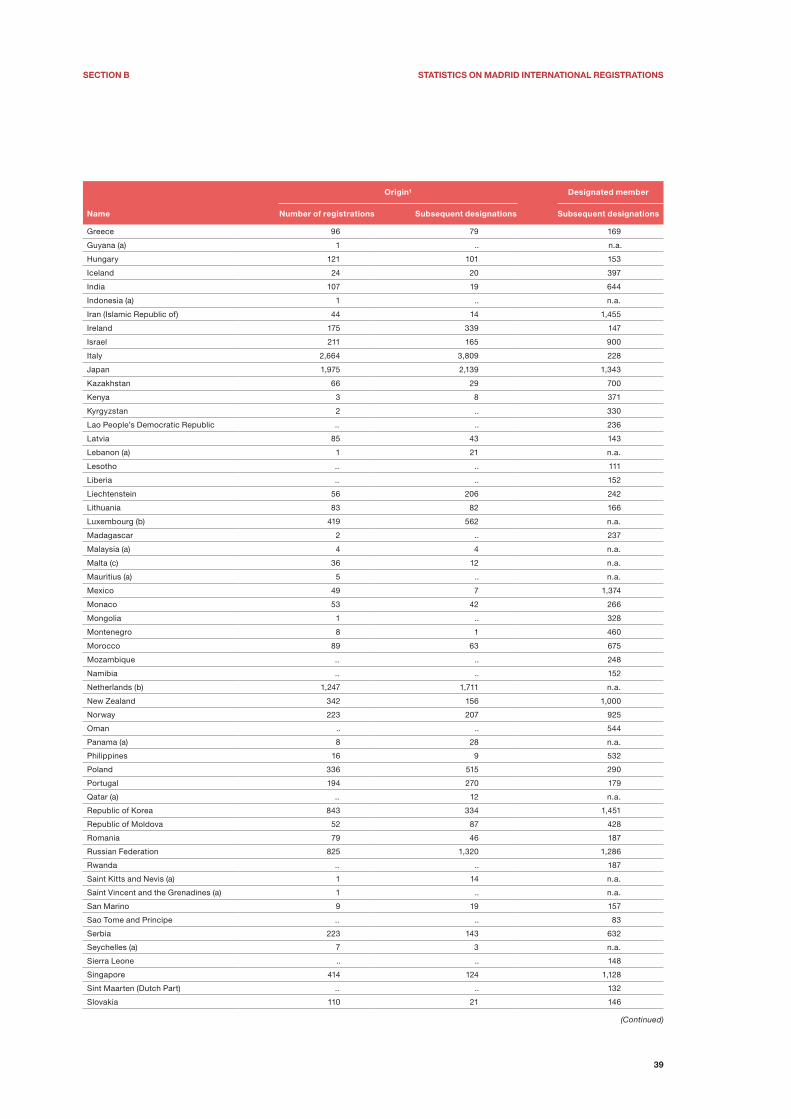
SectIon B StAtIStIcS on MAdRId InteRnAtIonAl ReGIStRAtIonS
39
origin¹ designated member
name number of registrations Subsequent designations Subsequent designations
Greece 96 79 169
Guyana (a) 1 .. n.a.
Hungary 121 101 153
Iceland 24 20 397
India 107 19 644
Indonesia (a) 1 .. n.a.
Iran (Islamic Republic of) 44 14 1,455
Ireland 175 339 147
Israel 211 165 900
Italy 2,664 3,809 228
Japan 1,975 2,139 1,343
Kazakhstan 66 29 700
Kenya 3 8 371
Kyrgyzstan 2 .. 330
Lao People’s Democratic Republic .. .. 236
Latvia 85 43 143
Lebanon (a) 1 21 n.a.
Lesotho .. .. 111
Liberia .. .. 152
Liechtenstein 56 206 242
Lithuania 83 82 166
Luxembourg (b) 419 562 n.a.
Madagascar 2 .. 237
Malaysia (a) 4 4 n.a.
Malta (c) 36 12 n.a.
Mauritius (a) 5 .. n.a.
Mexico 49 7 1,374
Monaco 53 42 266
Mongolia 1 .. 328
Montenegro 8 1 460
Morocco 89 63 675
Mozambique .. .. 248
Namibia .. .. 152
Netherlands (b) 1,247 1,711 n.a.
New Zealand 342 156 1,000
Norway 223 207 925
Oman .. .. 544
Panama (a) 8 28 n.a.
Philippines 16 9 532
Poland 336 515 290
Portugal 194 270 179
Qatar (a) .. 12 n.a.
Republic of Korea 843 334 1,451
Republic of Moldova 52 87 428
Romania 79 46 187
Russian Federation 825 1,320 1,286
Rwanda .. .. 187
Saint Kitts and Nevis (a) 1 14 n.a.
Saint Vincent and the Grenadines (a) 1 .. n.a.
San Marino 9 19 157
Sao Tome and Principe .. .. 83
Serbia 223 143 632
Seychelles (a) 7 3 n.a.
Sierra Leone .. .. 148
Singapore 414 124 1,128
Sint Maarten (Dutch Part) .. .. 132
Slovakia 110 21 146
(Continued)
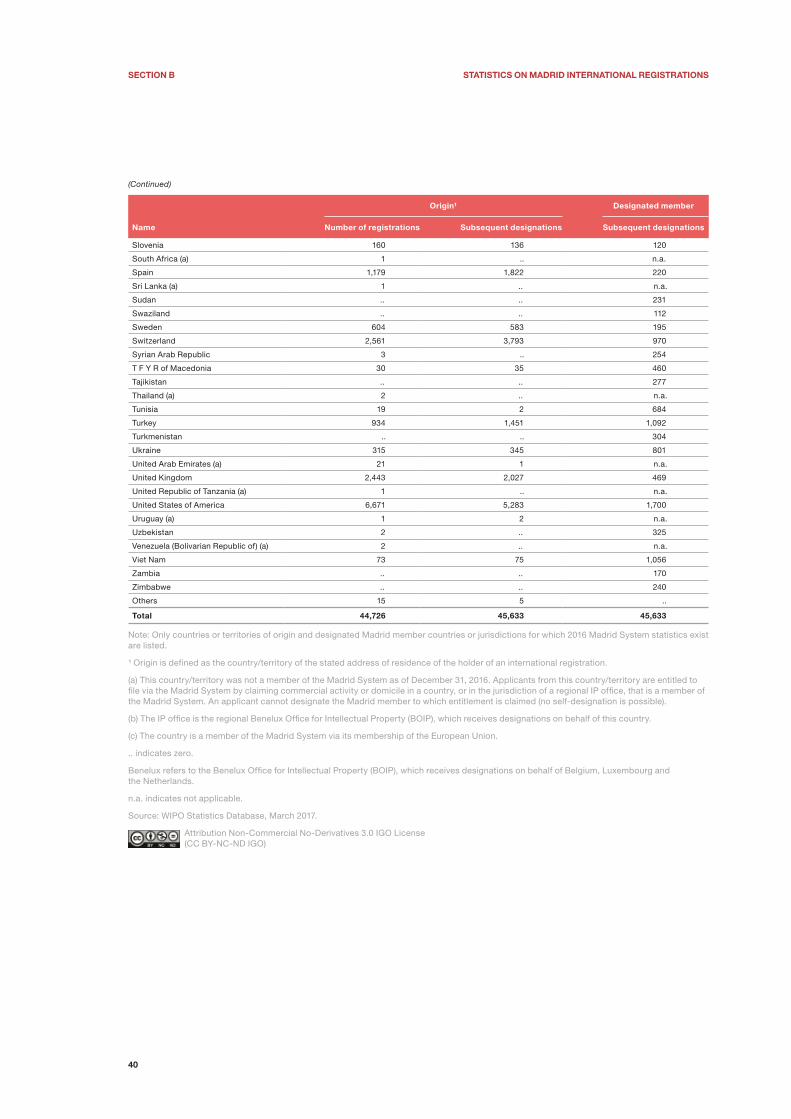
SectIon B StAtIStIcS on MAdRId InteRnAtIonAl ReGIStRAtIonS
40
(Continued)
origin¹ designated member
name number of registrations Subsequent designations Subsequent designations
Slovenia 160 136 120
South Africa (a) 1 .. n.a.
Spain 1,179 1,822 220
Sri Lanka (a) 1 .. n.a.
Sudan .. .. 231
Swaziland .. .. 112
Sweden 604 583 195
Switzerland 2,561 3,793 970
Syrian Arab Republic 3 .. 254
T F Y R of Macedonia 30 35 460
Tajikistan .. .. 277
Thailand (a) 2 .. n.a.
Tunisia 19 2 684
Turkey 934 1,451 1,092
Turkmenistan .. .. 304
Ukraine 315 345 801
United Arab Emirates (a) 21 1 n.a.
United Kingdom 2,443 2,027 469
United Republic of Tanzania (a) 1 .. n.a.
United States of America 6,671 5,283 1,700
Uruguay (a) 1 2 n.a.
Uzbekistan 2 .. 325
Venezuela (Bolivarian Republic of) (a) 2 .. n.a.
Viet Nam 73 75 1,056
Zambia .. .. 170
Zimbabwe .. .. 240
Others 15 5 ..
total 44,726 45,633 45,633
Note: Only countries or territories of origin and designated Madrid member countries or jurisdictions for which 2016 Madrid System statistics exist are listed.
¹ Origin is defined as the country/territory of the stated address of residence of the holder of an international registration.
(a) This country/territory was not a member of the Madrid System as of December 31, 2016. Applicants from this country/territory are entitled to file via the Madrid System by claiming commercial activity or domicile in a country, or in the jurisdiction of a regional IP office, that is a member of the Madrid System. An applicant cannot designate the Madrid member to which entitlement is claimed (no self-designation is possible).
(b) The IP office is the regional Benelux Office for Intellectual Property (BOIP), which receives designations on behalf of this country.
(c) The country is a member of the Madrid System via its membership of the European Union.
.. indicates zero.
Benelux refers to the Benelux Office for Intellectual Property (BOIP), which receives designations on behalf of Belgium, Luxembourg and the Netherlands.
n.a. indicates not applicable.
Source: WIPO Statistics Database, March 2017.
Attribution Non-Commercial No-Derivatives 3.0 IGO License (CC BY-NC-ND IGO)

41
SECT
ION
C
Section CStatistics on renewals and active Madrid international registrations
Highlights
Annual renewals of international registrations continue to climb, approaching 30,000
International registration holders renewed 29,546 reg-istrations in 2016, representing an increase of 2% on 2015 and the fifth consecutive year of growth. The number of renewals in a given year depends on both the number of registrations and the number of renewals recorded 10 years previously, so the trend seen in figure 10 is only a partial reflection of the trend in registrations with a 10-year lag. In just one year, renewals of Madrid registrations doubled, from about 8,150 in 2005 to just over 16,600 in 2006. Since then, they have trended upwards, notwithstanding a modest decline in 2011. The high growth in renewals in 2006 resulted from a change in the renewal period from 20 to 10 years that came into effect in 1996.
Holders from Germany, France and Switzerland recorded the highest numbers of renewals
Holders from Germany (7,726), France (4,546) and Switzerland (2,573) recorded the highest numbers of registration renewals in 2016 (figure 11), reflecting these countries’ long-standing membership of the Madrid System. Their holders’ stocks of international
Figure 10Trend in renewals of international registrations
Source: Standard �gure C1.
2000 2002 2004 2006 2008 2010 2012 2014 2016
Year
0
10,000
20,000
30,000
Ren
ewa
ls o
f M
ad
rid
reg
istr
ati
on
s
registrations have often been maintained for many decades (standard figure C8). Together, these three origins accounted for half of all renewals in 2016.
Although half the top 20 origins for renewals in 2016 saw near-zero growth or declines compared to the previous year, several recorded increases in excess of 30%, namely Hungary (+83.3%), Finland (+40%), Sweden (36.9%) and the Russian Federation (+31.7%) (standard figure C2).
Nearly half of all international registrations recorded over the past 125 years are still active
Approximately 641,500 of the 1.3 million international registrations recorded since the creation of the Madrid System were active, that is in force, in 2016. The num-ber of active Madrid registrations has grown steadily year on year, increasing from about 381,000 in 2000 (figure 12). The total number of registrations in force grew by 2.5% in 2016.
Together, holders from four countries own almost half of all active international registrations
Madrid registration holders domiciled in Germany owned 124,495 active registrations in 2016, corre-sponding to nearly 20% of the total. Holders domiciled in France (80,911) had about 13% of the total and for those in Switzerland (54,941) and the U.S. (54,748), the share was about 9% each (figure 13).
Among the top 20 origins, the Republic of Korea (+16.5%) and the U.S. (+11.3%) experienced the highest one-year growth in 2016, followed by Japan (+9%), Australia (+8.6%) and China (+8.3%). In contrast, 5 of the 20 top origins saw slight declines of between 0.5% and 2.5% in active registrations compared to 2015 (standard figure C8).
Designated members Switzerland and China top the list for designations in active registrations
In 2016, Switzerland (245,302) was once again the Madrid member with the highest number of designations

SectIon c StAtIStIcS on RenewAlS And ActIVe MAdRId InteRnAtIonAl ReGIStRAtIonS
42
Figure 11Renewals of international registrations for the top 10 origins, 2016
Source: Standard �gure C2.
Ren
ewa
ls o
f M
ad
rid
reg
istr
ati
on
s
7,726
4,546
2,573 2,5391,743 1,467
993 887 756 745
Germ
any
Fran
ce
Switzer
land
Italy
Nethe
rland
sU.S
.
Spain
Austri
a
Belgium U.K
.
Origin
Figure 12Trend in active international registrations
Source: Standard �gure C6.
Activ
e Mad
rid re
gist
ratio
ns
2000 2002 2004 2006 2008 2010 2012 2014 2016
Year
200,000
300,000
500,000
400,000
600,000
700,000
Note: Origin data are based on the country of the registration holder’s address.
Figure 13Active international registrations for the top 10 origins, 2016
Source: Standard �gure C8.
Activ
e Mad
rid re
gist
ratio
ns
124,495
80,911
54,941 54,74846,865
27,576 25,601 23,711 20,190 19,157
Germ
any
Fran
ce
Switzer
land
U.S.
Italy
Nethe
rland
sU.K
.
China
Japa
nSpa
in
Origin
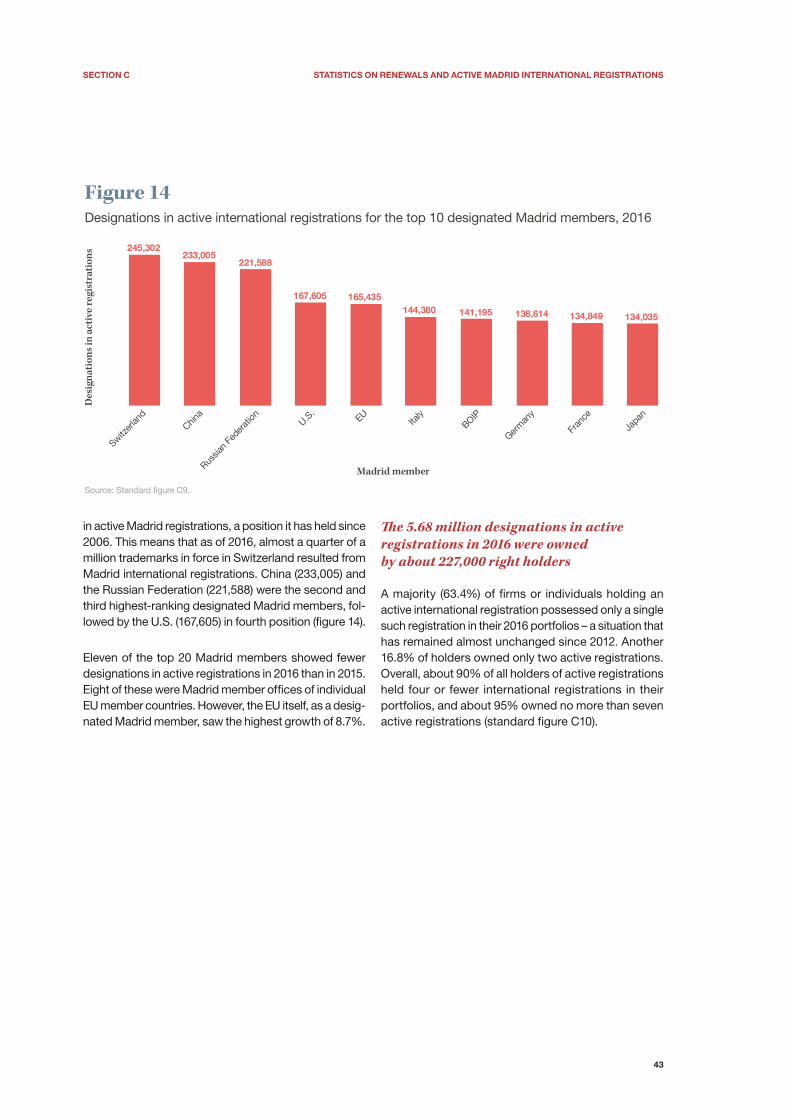
SectIon c StAtIStIcS on RenewAlS And ActIVe MAdRId InteRnAtIonAl ReGIStRAtIonS
43
Figure 14Designations in active international registrations for the top 10 designated Madrid members, 2016
Source: Standard �gure C9.
Desig
natio
ns in
activ
e reg
istra
tions
245,302233,005
221,588
167,605 165,435144,380 141,195 138,614 134,849 134,035
Switzer
land
China
Russia
n Fed
erat
ion U.S.
EU Italy
BOIP
Germ
any
Fran
ce
Japa
n
Madrid member
in active Madrid registrations, a position it has held since 2006. This means that as of 2016, almost a quarter of a million trademarks in force in Switzerland resulted from Madrid international registrations. China (233,005) and the Russian Federation (221,588) were the second and third highest-ranking designated Madrid members, fol-lowed by the U.S. (167,605) in fourth position (figure 14).
Eleven of the top 20 Madrid members showed fewer designations in active registrations in 2016 than in 2015. Eight of these were Madrid member offices of individual EU member countries. However, the EU itself, as a desig-nated Madrid member, saw the highest growth of 8.7%.
The 5.68 million designations in active registrations in 2016 were owned by about 227,000 right holders
A majority (63.4%) of firms or individuals holding an active international registration possessed only a single such registration in their 2016 portfolios – a situation that has remained almost unchanged since 2012. Another 16.8% of holders owned only two active registrations. Overall, about 90% of all holders of active registrations held four or fewer international registrations in their portfolios, and about 95% owned no more than seven active registrations (standard figure C10).

SectIon c StAtIStIcS on RenewAlS And ActIVe MAdRId InteRnAtIonAl ReGIStRAtIonS
44
Standard figures and tablesRenewals of Madrid international registrations
C1 Trend in renewals of international registrations 45
C2 Renewals of international registrations for the top 20 origins, 2016 45
C3 Trend in designations in renewals of international registrations 46
C4 Designations in renewals of international registrations for the top 20 origins, 2016 46
C5 Top 20 designated Madrid members in renewals of international registrations, 2016 47
Active Madrid international registrations
C6 Trend in active international registrations 47
C7 Trend in designations in active international registrations 48
C8 Active international registrations for the top 20 origins, 2016 48
C9 Designations in active international registrations for the top 20 designated Madrid members, 2016 49
C10 Distribution of active international registrations per right holder, 2016 49
C11 Classes specified in active international registrations, 2016 50
Statistical table
C12 Renewals of international registrations and designations via the Madrid System, 2016 51
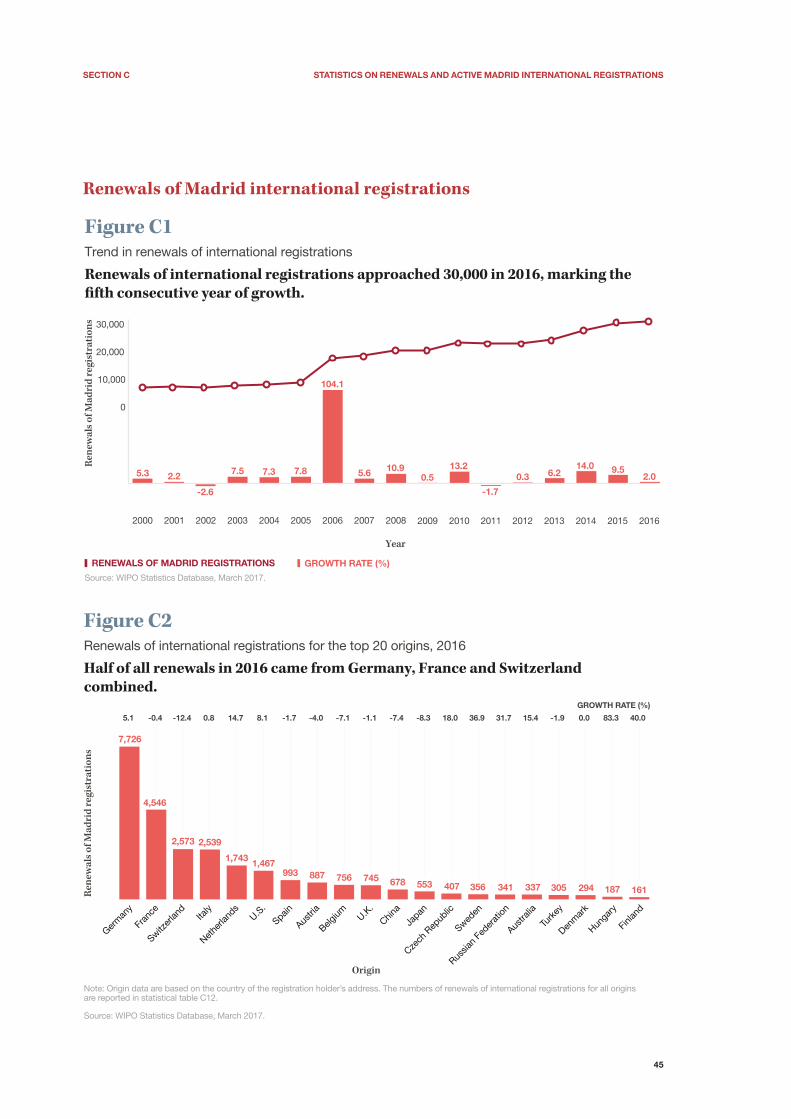
SectIon c StAtIStIcS on RenewAlS And ActIVe MAdRId InteRnAtIonAl ReGIStRAtIonS
45
Renewals of Madrid international registrations
Figure C1Trend in renewals of international registrations
Renewals of international registrations approached 30,000 in 2016, marking the �fth consecutive year of growth.
Source: WIPO Statistics Database, March 2017.
GROWTH RATE (%)RENEWALS OF MADRID REGISTRATIONS
5.3 2.2
-2.6
7.5 7.3 7.8
104.1
5.6 10.90.5
13.2
-1.7
0.3 6.214.0 9.5
2.0
30,000
20,000
10,000
0
2000 2001 2002 2003 2004 2005 2006 2007 2008 2009 2010 2011 2012 2013 2014 2015 2016
Ren
ewa
ls o
f M
ad
rid
reg
istr
ati
on
s
Year
7,726
4,546
2,573 2,539
1,743 1,467993 887 756 745 678 553 407 356 341 337 305 294 187 161
Figure C2Renewals of international registrations for the top 20 origins, 2016
Half of all renewals in 2016 came from Germany, France and Switzerland combined.
Note: Origin data are based on the country of the registration holder’s address. The numbers of renewals of international registrations for all origins are reported in statistical table C12.
Source: WIPO Statistics Database, March 2017.
Origin
Germ
any
Fran
ce
Switzer
land
Italy
Nethe
rland
sU.S
.
Spain
Austri
a
Belgium U.K
.
China
Japan
Czech
Rep
ublic
Sweden
Russia
n Fe
derat
ion
Austra
lia
Turk
ey
Denm
ark
Hunga
ry
Finlan
d
5.1 -0.4 -12.4 0.8 14.7 8.1 -1.7 -4.0 -7.1 -1.1 -7.4 -8.3 18.0 36.9 31.7 15.4 -1.9 0.0 83.3 40.0
GROWTH RATE (%)
Ren
ewa
ls o
f M
ad
rid
reg
istr
ati
on
s
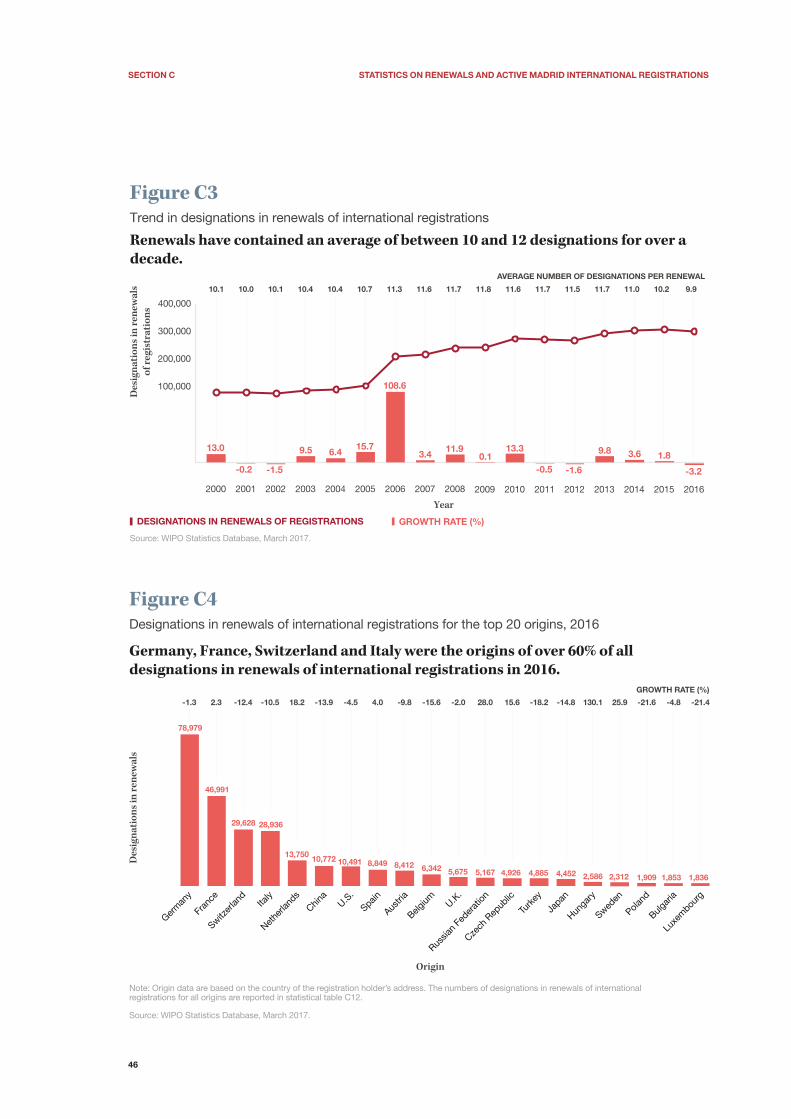
SectIon c StAtIStIcS on RenewAlS And ActIVe MAdRId InteRnAtIonAl ReGIStRAtIonS
46
Des
ign
ati
on
s in
ren
ewa
ls
of
reg
istr
ati
on
s
Trend in designations in renewals of international registrations
Renewals have contained an average of between 10 and 12 designations for over a decade.
Source: WIPO Statistics Database, March 2017.
GROWTH RATE (%)DESIGNATIONS IN RENEWALS OF REGISTRATIONS
400,000
300,000
200,000
100,000
2000 2001 2002 2003 2004 2005 2006 2007 2008 2009 2010 2011 2012 2013 2014 2015 2016
Year
AVERAGE NUMBER OF DESIGNATIONS PER RENEWAL
13.0
-0.2 -1.5
9.5 6.415.7
108.6
3.411.9
0.113.3
-0.5 -1.6
9.8 3.6 1.8
-3.2
10.1 10.0 10.1 10.4 10.4 10.7 11.3 11.6 11.7 11.8 11.6 11.7 11.5 11.7 11.0 10.2 9.9
Figure C3
Japan
Hunga
ry
Sweden
Poland
Bulgar
ia
Luxe
mbou
rg
GROWTH RATE (%)
15.6 -18.2 -14.8 130.1 25.9 -21.6 -4.8 -21.4
4,926 4,885 4,452 2,586 2,312 1,909 1,853 1,836
Figure C4Designations in renewals of international registrations for the top 20 origins, 2016
Germany, France, Switzerland and Italy were the origins of over 60% of all designations in renewals of international registrations in 2016.
Note: Origin data are based on the country of the registration holder’s address. The numbers of designations in renewals of international registrations for all origins are reported in statistical table C12.
Source: WIPO Statistics Database, March 2017.
Origin
Germ
any
Fran
ce
Switzer
land
Italy
Nethe
rland
s
China
U.S.
Spain
Austri
a
Belgium U.K
.
Russia
n Fe
derat
ion
Czech
Rep
ublic
Turk
ey
Des
ign
ati
on
s in
ren
ewa
ls
-2.0 28.0
5,675 5,167
-1.3 2.3 -12.4 -10.5 18.2 -13.9 -4.5 4.0 -9.8 -15.6
78,979
46,991
29,628 28,936
13,750 10,772 10,491 8,849 8,412 6,342
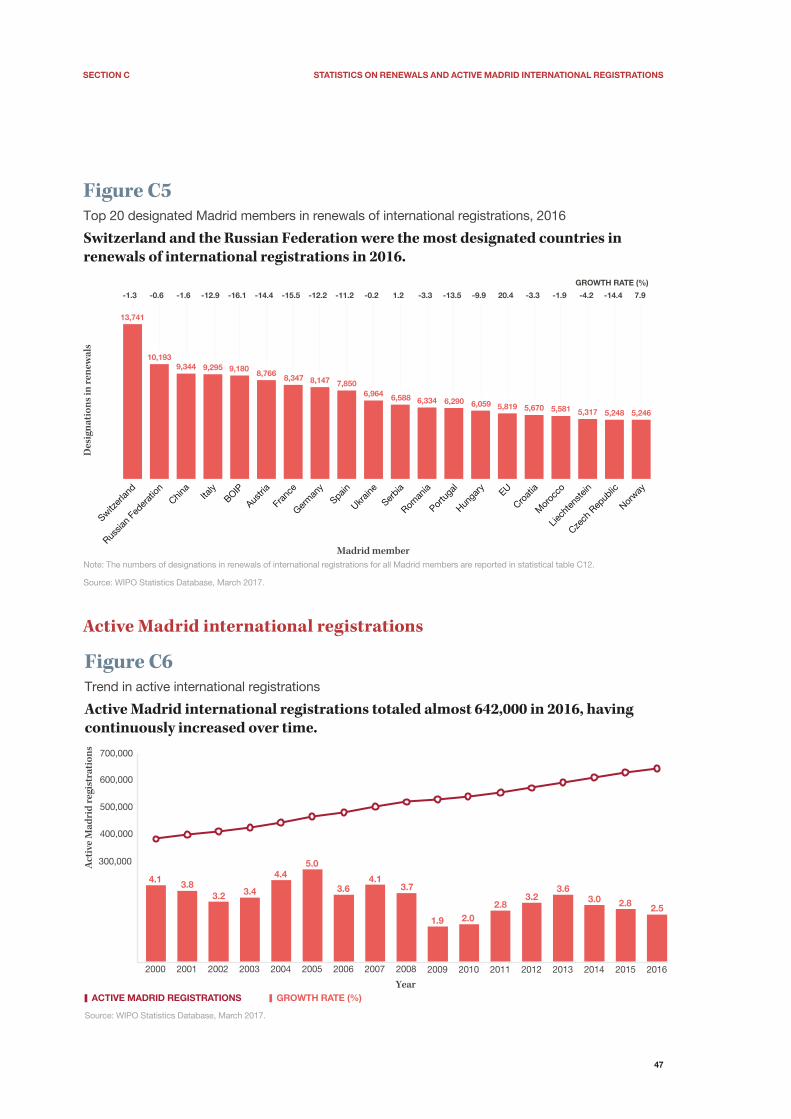
SectIon c StAtIStIcS on RenewAlS And ActIVe MAdRId InteRnAtIonAl ReGIStRAtIonS
47
Figure C5Top 20 designated Madrid members in renewals of international registrations, 2016
Switzerland and the Russian Federation were the most designated countries in renewals of international registrations in 2016.
Note: The numbers of designations in renewals of international registrations for all Madrid members are reported in statistical table C12.
Source: WIPO Statistics Database, March 2017.
Madrid member
Switzer
land
Russia
n Fe
derat
ionChin
aIta
lyBOIP
Austri
a
Fran
ce
Germ
any
Spain
Ukrain
e
Serbia
Roman
ia
Portu
gal
Hunga
ry EU
Croat
ia
Mor
occo
Liech
tens
tein
Czech
Rep
ublic
Norway
GROWTH RATE (%)
Des
ign
ati
on
s in
ren
ewa
ls
-1.6-1.3 -0.6 -12.9 -16.1 -14.4 -15.5 -12.2 -11.2 -0.2
13,741
10,1939,344 9,295 9,180 8,766 8,347 8,147 7,850
6,964
1.2 -3.3 -13.5 -9.9 20.4 -3.3 -1.9 -4.2 -14.4 7.9
6,588 6,334 6,290 6,059 5,819 5,670 5,581 5,317 5,248 5,246
Active Madrid international registrations
Figure C6Trend in active international registrations
Active Madrid international registrations totaled almost 642,000 in 2016, having continuously increased over time.
Source: WIPO Statistics Database, March 2017.
GROWTH RATE (%)ACTIVE MADRID REGISTRATIONS
600,000
700,000
400,000
500,000
300,000
2000 2001 2002 2003 2004 2005 2006 2007 2008 2009 2010 2011 2012 2013 2014 2015 2016
Activ
e Mad
rid re
gist
ratio
ns
Year
4.1 3.83.2 3.4
4.45.0
3.64.1
3.7
1.9 2.02.8
3.23.6
3.0 2.8 2.5
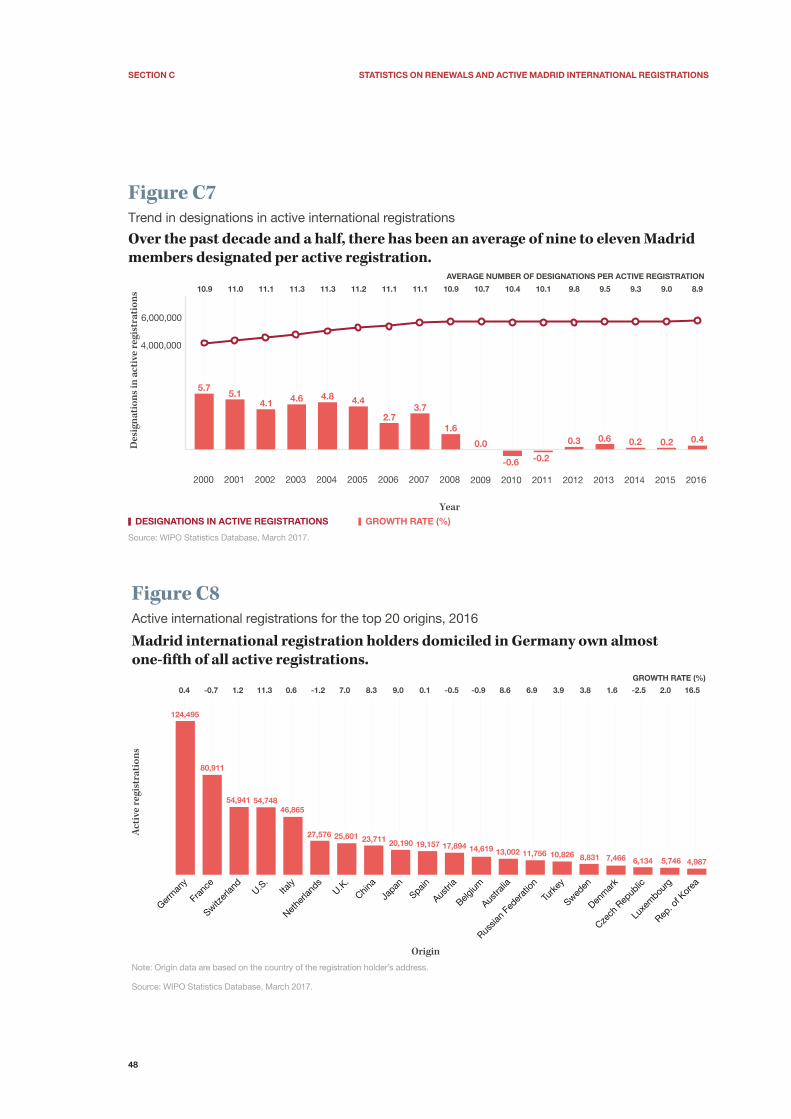
SectIon c StAtIStIcS on RenewAlS And ActIVe MAdRId InteRnAtIonAl ReGIStRAtIonS
48
Figure C7Trend in designations in active international registrations
Over the past decade and a half, there has been an average of nine to eleven Madrid members designated per active registration.
Source: WIPO Statistics Database, March 2017.
GROWTH RATE (%)DESIGNATIONS IN ACTIVE REGISTRATIONS
6,000,000
4,000,000
2000 2001 2002 2003 2004 2005 2006 2007 2008 2009 2010 2011 2012 2013 2014 2015 2016
Year
AVERAGE NUMBER OF DESIGNATIONS PER ACTIVE REGISTRATION
5.75.1
4.1 4.6 4.8 4.4
2.73.7
1.6
0.0
-0.6 -0.2
0.3 0.6 0.2 0.2 0.4
10.410.9 11.0 11.1 11.3 11.3 11.2 11.1 11.1 10.9 10.7 10.1 9.8 9.5 9.3 9.0 8.9
Desig
natio
ns in
activ
e reg
istra
tions
Figure C8Active international registrations for the top 20 origins, 2016
Madrid international registration holders domiciled in Germany own almost one-�fth of all active registrations.
Note: Origin data are based on the country of the registration holder’s address.
Source: WIPO Statistics Database, March 2017.
Origin
Germ
any
Fran
ce
Switzer
land
U.S.
Italy
Nethe
rland
sU.K
.
China
Japan
Spain
Austri
a
Belgium
Austra
lia
Russia
n Fe
derat
ion
Turk
ey
Sweden
Denm
ark
Czech
Rep
ublic
Luxe
mbou
rg
Rep. o
f Kor
ea
GROWTH RATE (%)
Activ
e reg
istra
tions
-0.5 -0.9 8.6 6.9 3.9 3.8 1.6 -2.5 2.0 16.5
17,894 14,619 13,002 11,756 10,826 8,831 7,466 6,134 5,746 4,987
0.4 -0.7 1.2 11.3 0.6 -1.2 7.0 8.3 9.0 0.1
124,495
80,911
54,941 54,74846,865
27,576 25,601 23,711 20,190 19,157
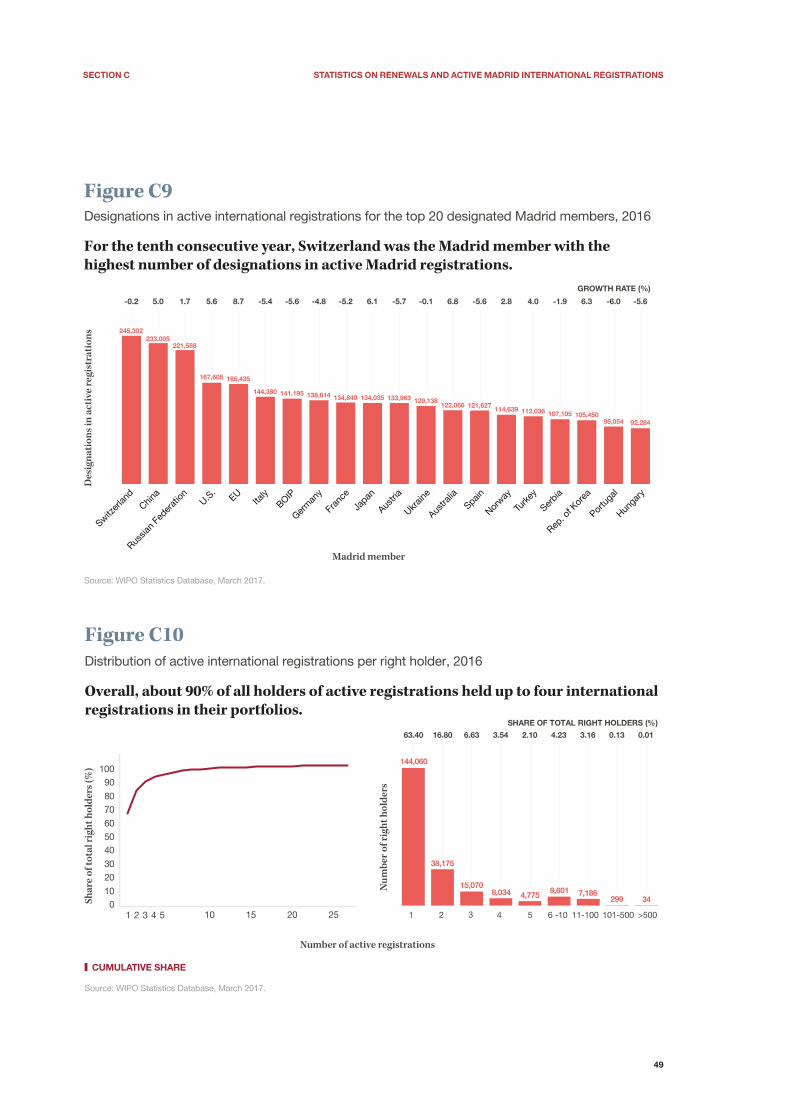
SectIon c StAtIStIcS on RenewAlS And ActIVe MAdRId InteRnAtIonAl ReGIStRAtIonS
49
Figure C9
Russia
n Fe
derat
ion U.S.
EUIta
lyBOIP
Germ
any
Fran
ce
Japan
Austri
a
Ukrain
e
Austra
liaSpain
Norway
Turk
ey
Serbia
Rep. o
f Kor
ea
Portu
gal
Hunga
ry
Designations in active international registrations for the top 20 designated Madrid members, 2016
For the tenth consecutive year, Switzerland was the Madrid member with the highest number of designations in active Madrid registrations.
Source: WIPO Statistics Database, March 2017.
Madrid member
Switzer
land
China
GROWTH RATE (%)
Desig
natio
ns in
activ
e reg
istra
tions
245,302233,005
221,588
167,605 165,435
144,380 141,195 138,614 134,849 134,035
-5.7 -0.1 6.8 -5.6 2.8 4.0 -1.9 6.3 -6.0 -5.6
133,963 129,138122,066 121,627 114,639 112,036 107,105 105,450
95,054 92,284
-0.2 5.0 1.7 5.6 8.7 -5.4 -5.6 -4.8 -5.2 6.1
Figure C10Distribution of active international registrations per right holder, 2016
Overall, about 90% of all holders of active registrations held up to four international registrations in their portfolios.
Source: WIPO Statistics Database, March 2017.
010
2030
405060
7080
90100
1 52 3 4 10 15 20 25
SHARE OF TOTAL RIGHT HOLDERS (%)
1 2 3 4 5 6 -10 11-100 101-500 >500
Number of active registrations
Sh
are
of
tota
l rig
ht
ho
lder
s (%
)
Nu
mb
er o
f ri
gh
t h
old
ers
CUMULATIVE SHARE
63.40 16.80 6.63 3.54 2.10 4.23 3.16 0.13 0.01
144,060
38,175
15,0708,034 4,775 9,601 7,186
299 34
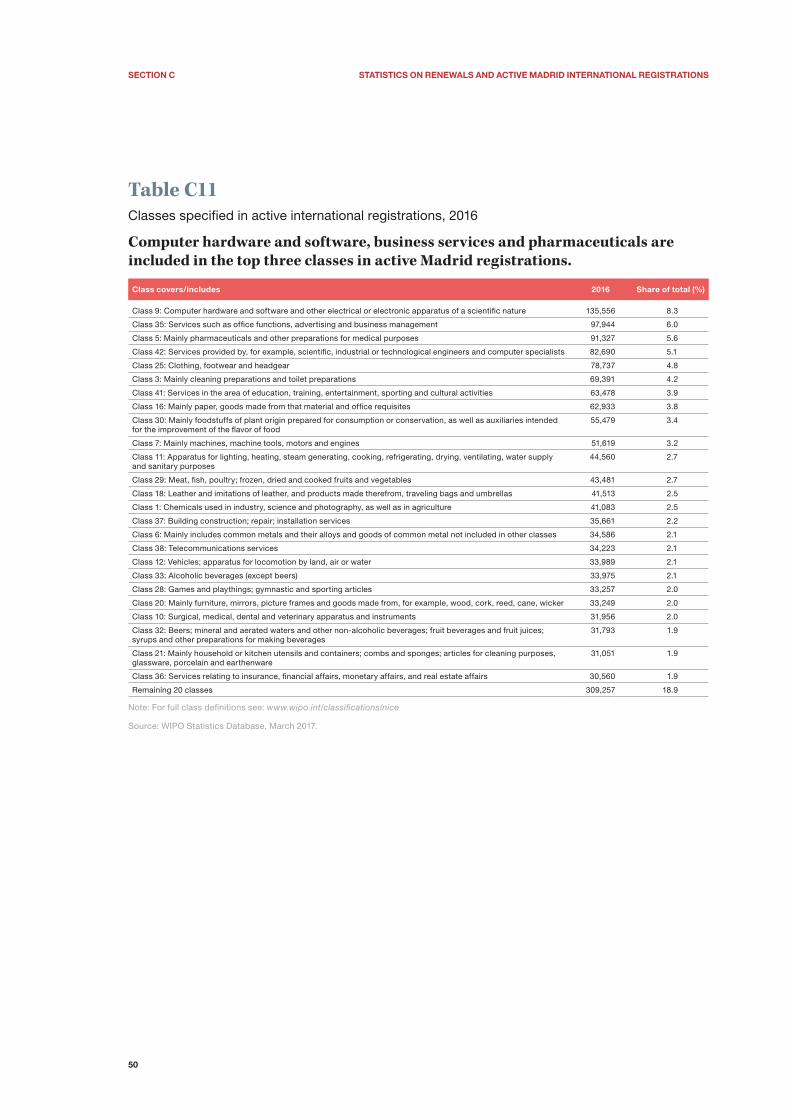
SectIon c StAtIStIcS on RenewAlS And ActIVe MAdRId InteRnAtIonAl ReGIStRAtIonS
50
Table C11Classes specified in active international registrations, 2016
Computer hardware and software, business services and pharmaceuticals are included in the top three classes in active Madrid registrations.
class covers/includes 2016 Share of total (%)
Class 9: Computer hardware and software and other electrical or electronic apparatus of a scientific nature 135,556 8.3
Class 35: Services such as office functions, advertising and business management 97,944 6.0
Class 5: Mainly pharmaceuticals and other preparations for medical purposes 91,327 5.6
Class 42: Services provided by, for example, scientific, industrial or technological engineers and computer specialists 82,690 5.1
Class 25: Clothing, footwear and headgear 78,737 4.8
Class 3: Mainly cleaning preparations and toilet preparations 69,391 4.2
Class 41: Services in the area of education, training, entertainment, sporting and cultural activities 63,478 3.9
Class 16: Mainly paper, goods made from that material and office requisites 62,933 3.8
Class 30: Mainly foodstuffs of plant origin prepared for consumption or conservation, as well as auxiliaries intended for the improvement of the flavor of food
55,479 3.4
Class 7: Mainly machines, machine tools, motors and engines 51,619 3.2
Class 11: Apparatus for lighting, heating, steam generating, cooking, refrigerating, drying, ventilating, water supply and sanitary purposes
44,560 2.7
Class 29: Meat, fish, poultry; frozen, dried and cooked fruits and vegetables 43,481 2.7
Class 18: Leather and imitations of leather, and products made therefrom, traveling bags and umbrellas 41,513 2.5
Class 1: Chemicals used in industry, science and photography, as well as in agriculture 41,083 2.5
Class 37: Building construction; repair; installation services 35,661 2.2
Class 6: Mainly includes common metals and their alloys and goods of common metal not included in other classes 34,586 2.1
Class 38: Telecommunications services 34,223 2.1
Class 12: Vehicles; apparatus for locomotion by land, air or water 33,989 2.1
Class 33: Alcoholic beverages (except beers) 33,975 2.1
Class 28: Games and playthings; gymnastic and sporting articles 33,257 2.0
Class 20: Mainly furniture, mirrors, picture frames and goods made from, for example, wood, cork, reed, cane, wicker 33,249 2.0
Class 10: Surgical, medical, dental and veterinary apparatus and instruments 31,956 2.0
Class 32: Beers; mineral and aerated waters and other non-alcoholic beverages; fruit beverages and fruit juices; syrups and other preparations for making beverages
31,793 1.9
Class 21: Mainly household or kitchen utensils and containers; combs and sponges; articles for cleaning purposes, glassware, porcelain and earthenware
31,051 1.9
Class 36: Services relating to insurance, financial affairs, monetary affairs, and real estate affairs 30,560 1.9
Remaining 20 classes 309,257 18.9
Note: For full class definitions see: www.wipo.int/classifications/nice
Source: WIPO Statistics Database, March 2017.
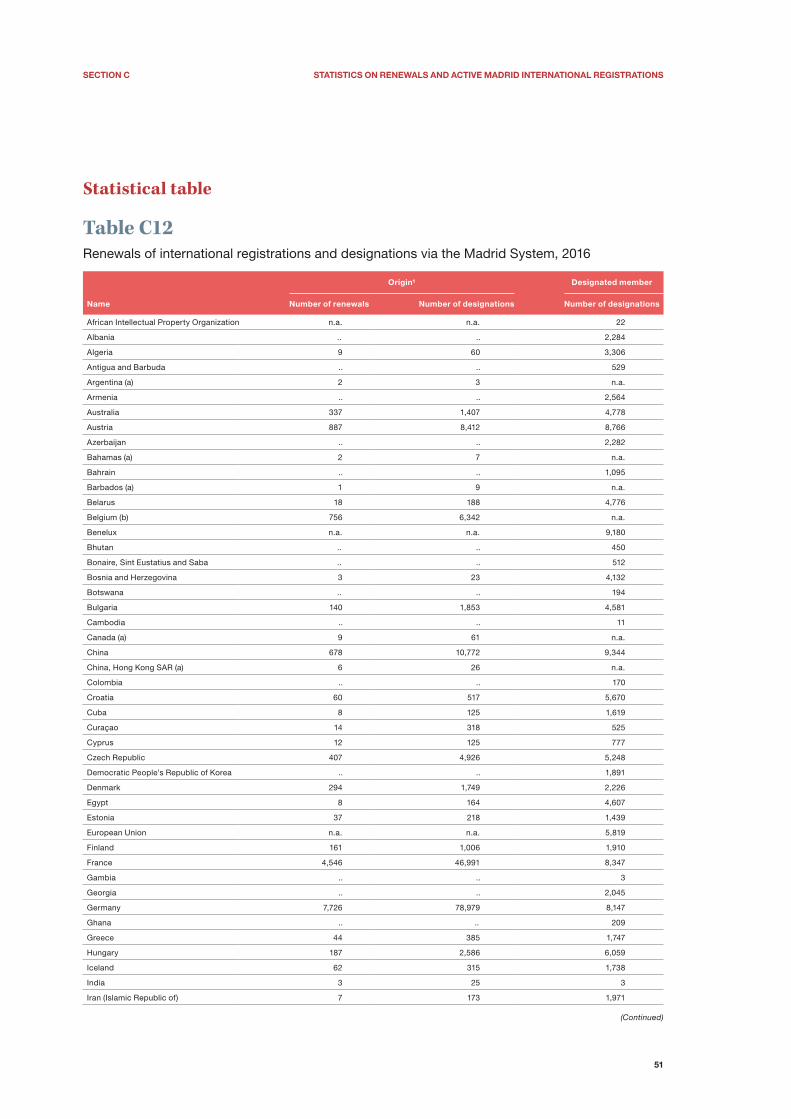
SectIon c StAtIStIcS on RenewAlS And ActIVe MAdRId InteRnAtIonAl ReGIStRAtIonS
51
Statistical table
Table C12Renewals of international registrations and designations via the Madrid System, 2016
origin¹ designated member
name number of renewals number of designations number of designations
African Intellectual Property Organization n.a. n.a. 22
Albania .. .. 2,284
Algeria 9 60 3,306
Antigua and Barbuda .. .. 529
Argentina (a) 2 3 n.a.
Armenia .. .. 2,564
Australia 337 1,407 4,778
Austria 887 8,412 8,766
Azerbaijan .. .. 2,282
Bahamas (a) 2 7 n.a.
Bahrain .. .. 1,095
Barbados (a) 1 9 n.a.
Belarus 18 188 4,776
Belgium (b) 756 6,342 n.a.
Benelux n.a. n.a. 9,180
Bhutan .. .. 450
Bonaire, Sint Eustatius and Saba .. .. 512
Bosnia and Herzegovina 3 23 4,132
Botswana .. .. 194
Bulgaria 140 1,853 4,581
Cambodia .. .. 11
Canada (a) 9 61 n.a.
China 678 10,772 9,344
China, Hong Kong SAR (a) 6 26 n.a.
Colombia .. .. 170
Croatia 60 517 5,670
Cuba 8 125 1,619
Curaçao 14 318 525
Cyprus 12 125 777
Czech Republic 407 4,926 5,248
Democratic People’s Republic of Korea .. .. 1,891
Denmark 294 1,749 2,226
Egypt 8 164 4,607
Estonia 37 218 1,439
European Union n.a. n.a. 5,819
Finland 161 1,006 1,910
France 4,546 46,991 8,347
Gambia .. .. 3
Georgia .. .. 2,045
Germany 7,726 78,979 8,147
Ghana .. .. 209
Greece 44 385 1,747
Hungary 187 2,586 6,059
Iceland 62 315 1,738
India 3 25 3
Iran (Islamic Republic of) 7 173 1,971
(Continued)

SectIon c StAtIStIcS on RenewAlS And ActIVe MAdRId InteRnAtIonAl ReGIStRAtIonS
52
(Continued)
origin¹ designated member
name number of renewals number of designations number of designations
Ireland 23 221 1,324
Israel .. .. 296
Italy 2,539 28,936 9,295
Japan 553 4,452 4,797
Kazakhstan 9 44 3,298
Kenya 4 300 1,034
Kyrgyzstan .. .. 2,362
Lao People’s Democratic Republic .. .. 7
Latvia 55 552 2,548
Lesotho .. .. 508
Liberia .. .. 803
Liechtenstein 100 1,445 5,317
Lithuania 35 198 1,779
Luxembourg (b) 153 1,836 n.a.
Madagascar .. .. 127
Malaysia (a) 2 6 n.a.
Malta (c) 2 2 n.a.
Marshall Islands (a) 1 13 n.a.
Mauritius (a) 1 4 n.a.
Mexico 7 139 209
Monaco 46 512 5,021
Mongolia .. .. 1,652
Montenegro .. .. 4,437
Morocco 58 284 5,581
Mozambique .. .. 750
Namibia .. .. 631
Netherlands (b) 1,743 13,750 n.a.
New Zealand 7 24 144
Norway 125 1,018 5,246
Oman .. .. 331
Panama (a) 1 22 n.a.
Philippines .. .. 2
Poland 159 1,909 4,705
Portugal 129 920 6,290
Republic of Korea 66 543 3,872
Republic of Moldova 5 70 3,160
Romania 61 681 6,334
Russian Federation 341 5,167 10,193
Rwanda .. .. 31
San Marino 4 80 2,872
Sao Tome and Principe .. .. 58
Serbia 86 675 6,588
Sierra Leone .. .. 577
Singapore 66 360 3,742
Sint Maarten (Dutch Part) .. .. 525
Slovakia 71 864 4,519
Slovenia 124 1,674 4,222
South Africa (a) 2 9 n.a.
Spain 993 8,849 7,850
Sudan .. .. 1,359
Swaziland .. .. 568
Sweden 356 2,312 1,980
Switzerland 2,573 29,628 13,741
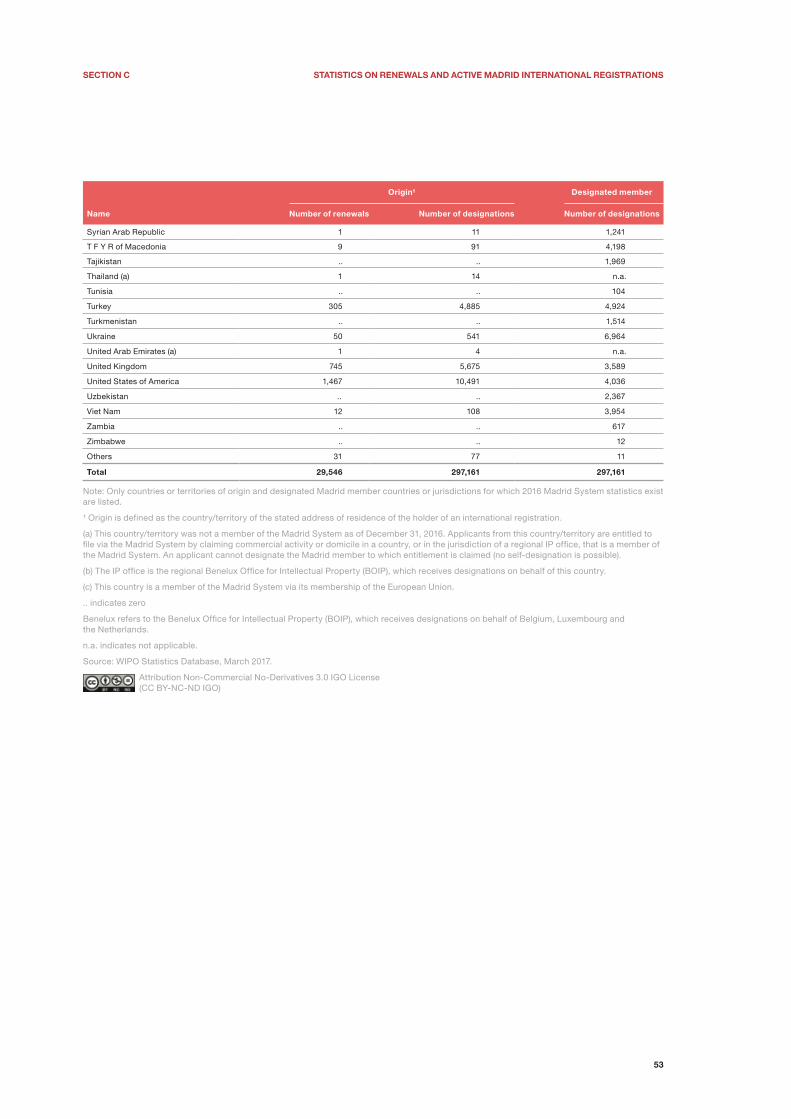
SectIon c StAtIStIcS on RenewAlS And ActIVe MAdRId InteRnAtIonAl ReGIStRAtIonS
53
origin¹ designated member
name number of renewals number of designations number of designations
Syrian Arab Republic 1 11 1,241
T F Y R of Macedonia 9 91 4,198
Tajikistan .. .. 1,969
Thailand (a) 1 14 n.a.
Tunisia .. .. 104
Turkey 305 4,885 4,924
Turkmenistan .. .. 1,514
Ukraine 50 541 6,964
United Arab Emirates (a) 1 4 n.a.
United Kingdom 745 5,675 3,589
United States of America 1,467 10,491 4,036
Uzbekistan .. .. 2,367
Viet Nam 12 108 3,954
Zambia .. .. 617
Zimbabwe .. .. 12
Others 31 77 11
total 29,546 297,161 297,161
Note: Only countries or territories of origin and designated Madrid member countries or jurisdictions for which 2016 Madrid System statistics exist are listed.
¹ Origin is defined as the country/territory of the stated address of residence of the holder of an international registration.
(a) This country/territory was not a member of the Madrid System as of December 31, 2016. Applicants from this country/territory are entitled to file via the Madrid System by claiming commercial activity or domicile in a country, or in the jurisdiction of a regional IP office, that is a member of the Madrid System. An applicant cannot designate the Madrid member to which entitlement is claimed (no self-designation is possible).
(b) The IP office is the regional Benelux Office for Intellectual Property (BOIP), which receives designations on behalf of this country.
(c) This country is a member of the Madrid System via its membership of the European Union.
.. indicates zero
Benelux refers to the Benelux Office for Intellectual Property (BOIP), which receives designations on behalf of Belgium, Luxembourg and the Netherlands.
n.a. indicates not applicable.
Source: WIPO Statistics Database, March 2017.
Attribution Non-Commercial No-Derivatives 3.0 IGO License (CC BY-NC-ND IGO)

54
55
SECT
ION
D
Section DStatistics on administration, revenue and fees
Highlights
Three-quarters of all international applications in 2016 were sent to the International Bureau electronically
Electronic transmission was introduced in 1998, and its share of total transmissions had reached just 0.2% by the end of that year. Since then, the share of applications received electronically by the International Bureau (IB) has increased significantly. In 2013 and 2014, slightly more than half (52%) of all applications received by the IB were transmitted electronically by all offices of origin combined. This share increased by almost 23 percentage points to reach 74.5% in 2016 (standard figure D1).
Four of every five international applications are filed in English
In 2016, 81.6% of applications were filed in English, with French accounting for 15.8% and Spanish for 2.7% (standard figure D2). The low share of filings in Spanish since its introduction as a filing language in 2004 is due to the fact that, to date, the Madrid System includes only four Spanish-speaking countries (Colombia, Cuba, Mexico and Spain), with Spain the only one listed among the top 20 origins of interna-tional applications (standard figure A6).
Over one-third of all international applications received in 2016 were irregular
International applications that fail to meet all the formal requirements are considered by the IB to be irregular. In such instances, the IB informs both the Madrid member’s IP office of origin and the applicant of the irregularities. Responsibility for remedying such irregularities lies with the IP office of origin or with the applicant, depending on the nature of the irreg-ularity. In 2016, 38.5% of international applications contained irregularities. For the past decade, this share has ranged from 28% to 39% of all international applications filed (standard figure D4).
Changes in ownership of international registrations remain relatively low
An international registration may change ownership following assignment of a mark, the merger of one or more companies, a court decision, or for other reasons. The change is subject to the recording of the new owner as the new holder of the registration in the International Register, and the new holder must fulfill the requirements necessary for holding an international registration. These include having the required connection to a Madrid mem-ber, which means being a national of, or being domiciled in, or having a real and effective industrial or commercial establishment in a Madrid member’s jurisdiction.
In 2016, there were approximately 13,600 changes in ownership of active international registrations – about 3,700 fewer than in 2015, representing a decline of 21.4%. The share of changes in ownership relative to the number of active registrations is small and has remained relatively stable over time. Only 2.1% of all active registrations changed ownership in 2016 (standard figure D5).
The bulk of cancellations of international registrations are partial, so although its scope may be limited, the registration remains valid
For the first five years of its existence, a Madrid international registration depends upon the so-called “basic mark” – an application directly filed in or a resulting registration issued by a Madrid member which must precede the international application. Madrid member IP offices acting as offices of origin are obliged to notify the IB of decisions concerning the ceasing of effect of basic marks made within the five-year dependency period. Where this is the case, the office of origin is obliged to request the IB to cancel an international registration to the same extent as the basic mark (in part or entirely: Article 6 of the Agreement and the Protocol). The IB then records the cancellation in the International Register and informs the offices of the designated Madrid members as well as the holder of the international registration.

SectIon d StAtIStIcS on AdMInIStRAtIon, ReVenUe And FeeS
56
In 2016, 2,831 international registrations were canceled in part or entirely (standard figure D6). Partial cancella-tions comprised the bulk of all cancellations, meaning that most basic marks (applications/registrations) remained valid but with some limitation regarding the goods and services for which they were protected. In contrast, just over one-third (34.3%) of all cancellations in 2016 were total in nature. Where an international
registration is canceled due to the ceasing of effect of the basic mark, the Madrid Protocol offers the holder the possibility of transforming the international registration into a national or regional application in each of the designated Madrid members within three months, counted from the date of the recording in the International Register of the cancellation of the international registration.

SectIon d StAtIStIcS on AdMInIStRAtIon, ReVenUe And FeeS
57
Standard figures and tablesD1 Trend in applications by medium of transmission 58
D2 Trend in applications by filing language 58
D3 Trend in translations 59
D4 Trend in irregularities in international applications 59
D5 Trend in changes in ownership 60
D6 Trend in cancellations due to ceasing of effect of the basic mark as notified by offices of origin 60
D7 Trend in cancellations by international registration holders 61
D8 Trend in renunciations 61
D9 Trend in total revenue collected by the International Bureau 62
D10 Fees distributed to Madrid members by the International Bureau 62
D11 International registration fees 63
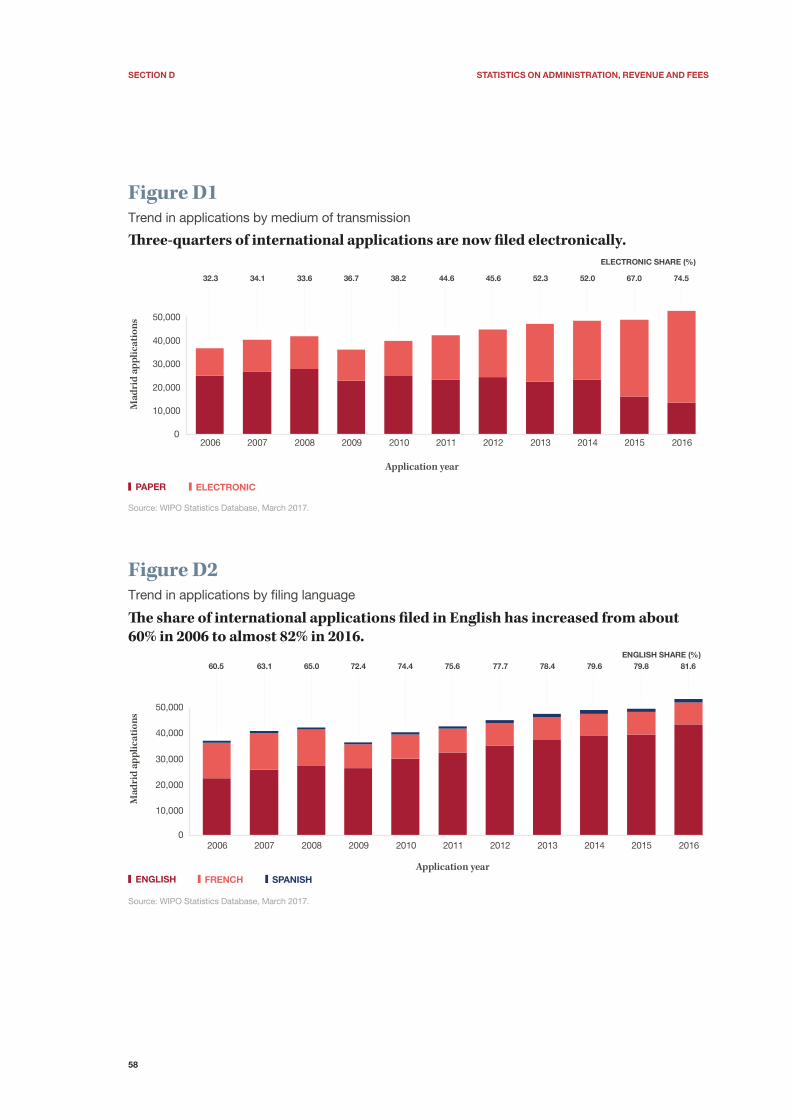
SectIon d StAtIStIcS on AdMInIStRAtIon, ReVenUe And FeeS
58
PAPER ELECTRONIC
Figure D1Trend in applications by medium of transmission
�ree-quarters of international applications are now �led electronically.
Source: WIPO Statistics Database, March 2017.
ELECTRONIC SHARE (%)
32.3 34.1 33.6 36.7 38.2 44.6 45.6 52.3 52.0 67.0 74.5
0
10,000
20,000
30,000
40,000
50,000
Ma
dri
d a
pp
lica
tio
ns
2006 2007 2008 2009 2010 2011 2012 2013 2014 2015 2016
Application year
ENGLISH FRENCH SPANISH
�e share of international applications �led in English has increased from about 60% in 2006 to almost 82% in 2016.
Figure D2Trend in applications by �ling language
Source: WIPO Statistics Database, March 2017.
ENGLISH SHARE (%)60.5 63.1 65.0 72.4 74.4 75.6 77.7 78.4 79.6 79.8 81.6
10,000
0
20,000
30,000
40,000
50,000
Ma
dri
d a
pp
lica
tio
ns
2006 2007 2008 2009 2010 2011 2012 2013 2014 2015 2016
Application year

SectIon d StAtIStIcS on AdMInIStRAtIon, ReVenUe And FeeS
59
ENGLISH FRENCH SPANISH
Of the approximately 8.6 million words translated in 2016, 79% were translated from English, 19% from French and about 2% from Spanish.
Figure D3Trend in translations
Note: This �gure presents the total number of words translated by the IB from each of the three languages that are required for recording andpublishing international registrations.
Source: WIPO Statistics Database, March 2017.
ENGLISH SHARE (%)
56.2 57.9 61.2 62.9 66.8 69.8 73.1 76.1 74.8 79.1 79.2
0
2,000,000
4,000,000
6,000,000
8,000,000
10,000,000
Wo
rds
tra
nsl
ate
d
2006 2007 2008 2009 2010 2011 2012 2013 2014 2015 2016
Year
ERROR FEE IRREGULAR
For each year over the past decade, irregularities have been reported in between 28% and 39% of all international applications �led.
Figure D4Trend in irregularities in international applications
Note: There are three types of irregularities: irregularities with regard to the classi�cation of goods and services; irregularities with regard to the indication of goods and services; and other irregularities.
Source: WIPO Statistics Database, March 2017.
SHARE OF IRREGULARITIES IN TOTAL (%)
38.3 35.5 34.1 28.4 30.4 34.2 35.0 36.3 36.8 39.0 38.5
0
10,000
20,000
30,000
40,000
50,000
Ma
dri
d a
pp
lica
tio
ns
2006 2007 2008 2009 2010 2011 2012 2013 2014 2015 2016
Year

SectIon d StAtIStIcS on AdMInIStRAtIon, ReVenUe And FeeS
60
CHANGES IN OWNERSHIP OF MADRID REGISTRATIONS GROWTH RATE (%)
On average less than 3% of all active registrations have had a change in ownership each year.
Figure D5Trend in changes in ownership
Note: The change in ownership of an international registration may be total or partial. It may relate to all or just some of the goods and services coveredby the international registration, and may be made in respect of all or some of the designated Madrid members.
Source: WIPO Statistics Database, March 2017.
21.4 17.02.3 0.2
-8.1
2.3
-2.2
10.7
-16.8
40.3
-21.4
CHANGE/ACTIVE REGISTRATION SHARE (%)
2.5 2.8 2.8 2.8 2.5 2.5 2.4 2.5 2.0 2.8 2.1
0
5,000
10,000
15,000
20,000
2006 2007 2008 2009 2010 2011 2012 2013 2014 2015 2016
Year
Chan
ges i
n ow
ners
hip
of
Mad
rid re
gist
ratio
ns
Note: Madrid member of�ces acting as of�ces of origin are obliged to notify the IB of decisions concerning the ceasing of effect of basic marks made within the �ve-year dependency period. Where this is the case, the of�ce of origin is obliged to request the IB to cancel an international registration to the same extent (in part or entirely: Article 6 of the Agreement and the Protocol).
PARTIAL CANCELLATIONS OF MADRID REGISTRATIONS TOTAL CANCELLATIONS OF MADRID REGISTRATIONS
About 2,800 international registrations were canceled in part or entirely in 2016.
Figure D6Trend in cancellations due to ceasing of effect of the basic mark as noti�ed by of�ces of origin
Source: WIPO Statistics Database, March 2017.
TOTAL CANCELLATIONS SHARE (%)
32.3 35.2 29.4 37.2 40.5 35.0 26.1 31.7 37.4 33.0 34.3
0
1,000
2,000
3,000
4,000
5,000
2006 2007 2008 2009 2010 2011 2012 2013 2014 2015 2016
Year
Ca
nce
lla
tio
ns
du
e to
cea
sin
g o
f e�
ect
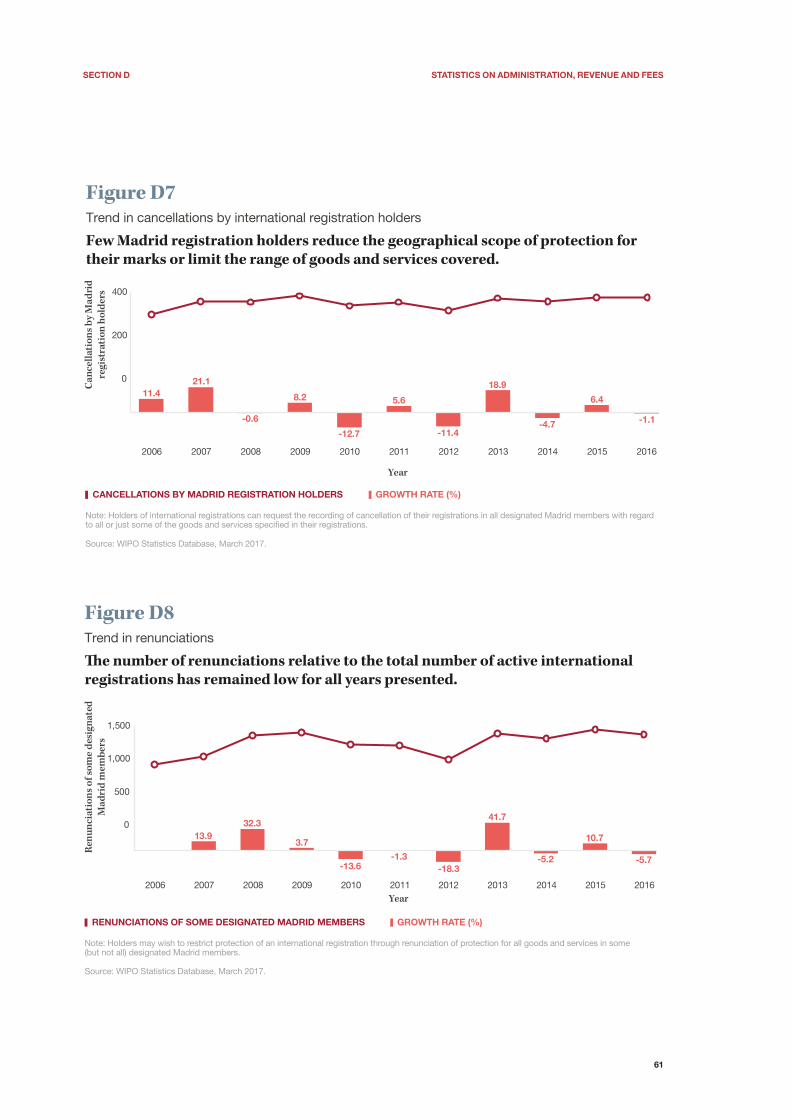
SectIon d StAtIStIcS on AdMInIStRAtIon, ReVenUe And FeeS
61
CANCELLATIONS BY MADRID REGISTRATION HOLDERS GROWTH RATE (%)
Few Madrid registration holders reduce the geographical scope of protection for their marks or limit the range of goods and services covered.
Figure D7Trend in cancellations by international registration holders
Note: Holders of international registrations can request the recording of cancellation of their registrations in all designated Madrid members with regardto all or just some of the goods and services speci�ed in their registrations.
Source: WIPO Statistics Database, March 2017.
11.421.1
-0.6
8.2
-12.7
5.6
-11.4
18.9
-4.7
6.4
-1.1
0
200
400
2006 2007 2008 2009 2010 2011 2012 2013 2014 2015 2016
Year
Ca
nce
lla
tio
ns
by
Ma
dri
d
reg
istr
ati
on
ho
lder
s
Note: Holders may wish to restrict protection of an international registration through renunciation of protection for all goods and services in some(but not all) designated Madrid members.
RENUNCIATIONS OF SOME DESIGNATED MADRID MEMBERS GROWTH RATE (%)
�e number of renunciations relative to the total number of active international registrations has remained low for all years presented.
Figure D8Trend in renunciations
Source: WIPO Statistics Database, March 2017.
13.932.3
3.7
-13.6-1.3
-18.3
41.7
-5.2
10.7
-5.7
0
500
1,000
1,500
2006 2007 2008 2009 2010 2011 2012 2013 2014 2015 2016Year
Renu
ncia
tions
of s
ome d
esig
nate
d M
adrid
mem
bers
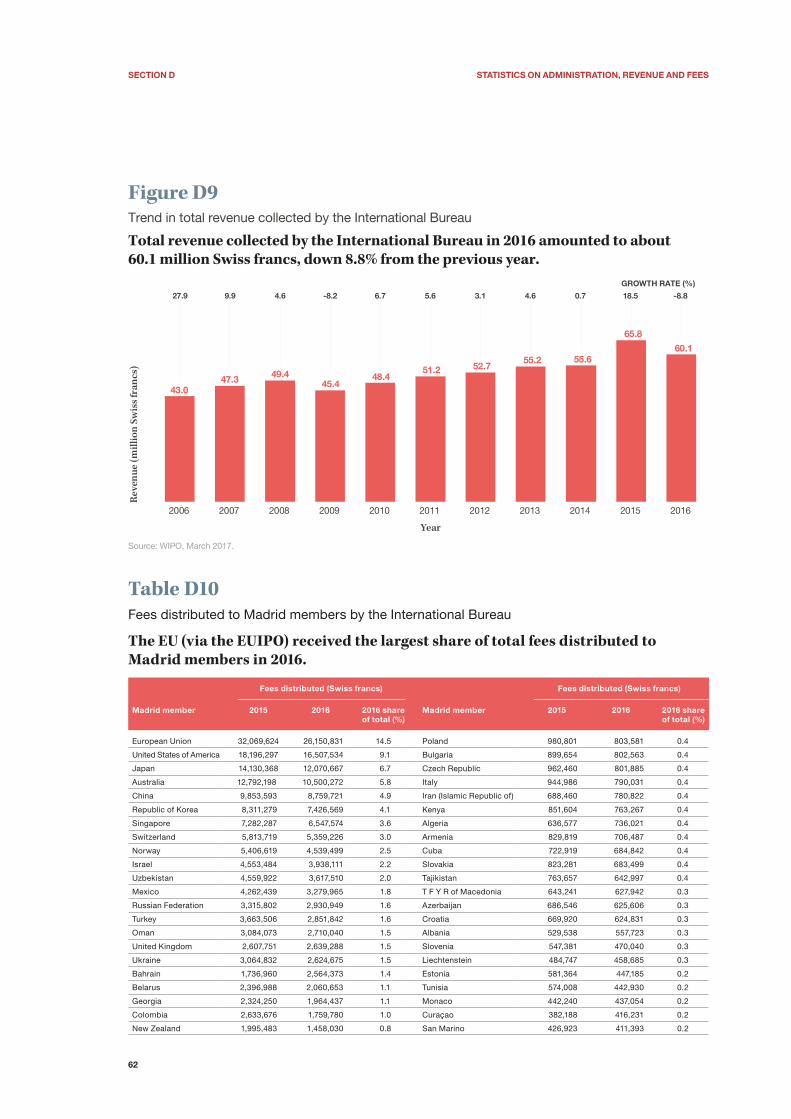
SectIon d StAtIStIcS on AdMInIStRAtIon, ReVenUe And FeeS
62
Total revenue collected by the International Bureau in 2016 amounted to about 60.1 million Swiss francs, down 8.8% from the previous year.
Source: WIPO, March 2017.
Figure D9Trend in total revenue collected by the International Bureau
GROWTH RATE (%)
27.9 9.9 4.6 -8.2 6.7 5.6 3.1 4.6 0.7 18.5 -8.8
43.047.3 49.4
45.448.4
51.2 52.755.2 55.6
65.8
60.1
Re
ven
ue
(m
illi
on
Sw
iss
fra
ncs
)
2006 2007 2008 2009 2010 2011 2012 2013 2014 2015 2016
Year
Table D10Fees distributed to Madrid members by the International Bureau
The EU (via the EUIPO) received the largest share of total fees distributed to Madrid members in 2016.
Fees distributed (Swiss francs) Fees distributed (Swiss francs)
Madrid member 2015 2016 2016 share of total (%)
Madrid member 2015 2016 2016 share of total (%)
European Union 32,069,624 26,150,831 14.5 Poland 980,801 803,581 0.4
United States of America 18,196,297 16,507,534 9.1 Bulgaria 899,654 802,563 0.4
Japan 14,130,368 12,070,667 6.7 Czech Republic 962,460 801,885 0.4
Australia 12,792,198 10,500,272 5.8 Italy 944,986 790,031 0.4
China 9,853,593 8,759,721 4.9 Iran (Islamic Republic of) 688,460 780,822 0.4
Republic of Korea 8,311,279 7,426,569 4.1 Kenya 851,604 763,267 0.4
Singapore 7,282,287 6,547,574 3.6 Algeria 636,577 736,021 0.4
Switzerland 5,813,719 5,359,226 3.0 Armenia 829,819 706,487 0.4
Norway 5,406,619 4,539,499 2.5 Cuba 722,919 684,842 0.4
Israel 4,553,484 3,938,111 2.2 Slovakia 823,281 683,499 0.4
Uzbekistan 4,559,922 3,617,510 2.0 Tajikistan 763,657 642,997 0.4
Mexico 4,262,439 3,279,965 1.8 T F Y R of Macedonia 643,241 627,942 0.3
Russian Federation 3,315,802 2,930,949 1.6 Azerbaijan 686,546 625,606 0.3
Turkey 3,663,506 2,851,842 1.6 Croatia 669,920 624,831 0.3
Oman 3,084,073 2,710,040 1.5 Albania 529,538 557,723 0.3
United Kingdom 2,607,751 2,639,288 1.5 Slovenia 547,381 470,040 0.3
Ukraine 3,064,832 2,624,675 1.5 Liechtenstein 484,747 458,685 0.3
Bahrain 1,736,960 2,564,373 1.4 Estonia 581,364 447,185 0.2
Belarus 2,396,988 2,060,653 1.1 Tunisia 574,008 442,930 0.2
Georgia 2,324,250 1,964,437 1.1 Monaco 442,240 437,054 0.2
Colombia 2,633,676 1,759,780 1.0 Curaçao 382,188 416,231 0.2
New Zealand 1,995,483 1,458,030 0.8 San Marino 426,923 411,393 0.2
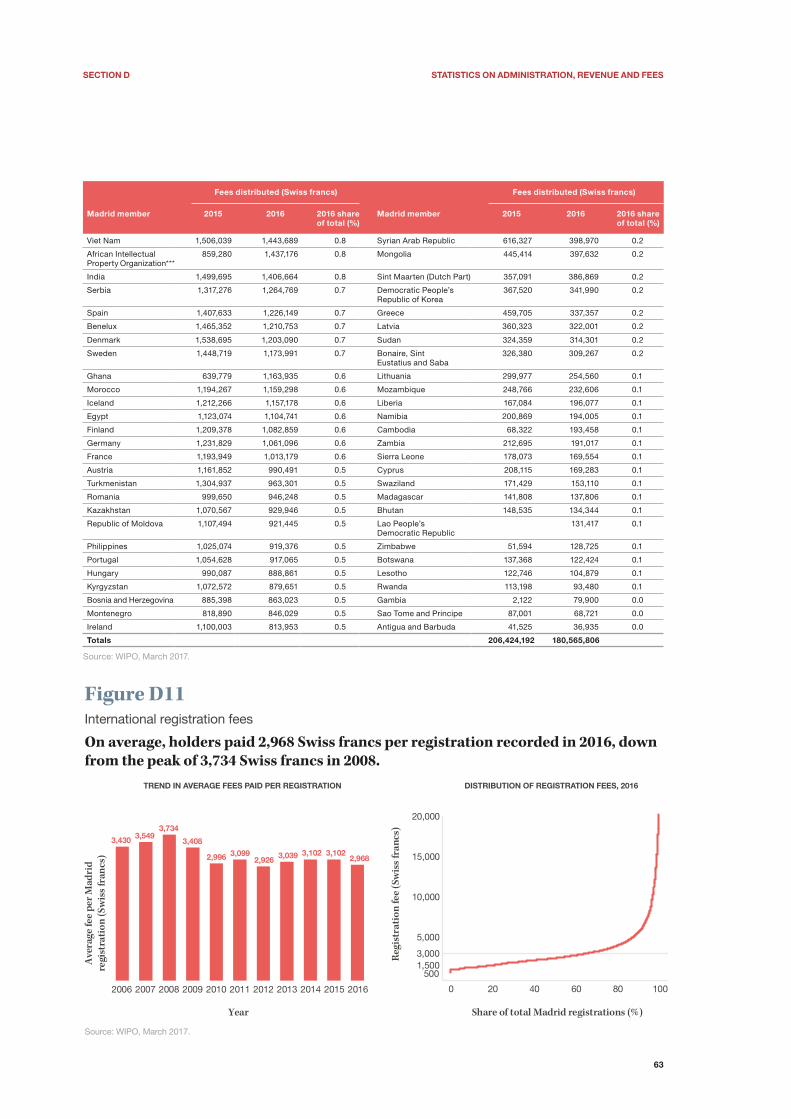
SectIon d StAtIStIcS on AdMInIStRAtIon, ReVenUe And FeeS
63
Fees distributed (Swiss francs) Fees distributed (Swiss francs)
Madrid member 2015 2016 2016 share of total (%)
Madrid member 2015 2016 2016 share of total (%)
Viet Nam 1,506,039 1,443,689 0.8 Syrian Arab Republic 616,327 398,970 0.2
African Intellectual Property Organization***
859,280 1,437,176 0.8 Mongolia 445,414 397,632 0.2
India 1,499,695 1,406,664 0.8 Sint Maarten (Dutch Part) 357,091 386,869 0.2
Serbia 1,317,276 1,264,769 0.7 Democratic People’s Republic of Korea
367,520 341,990 0.2
Spain 1,407,633 1,226,149 0.7 Greece 459,705 337,357 0.2
Benelux 1,465,352 1,210,753 0.7 Latvia 360,323 322,001 0.2
Denmark 1,538,695 1,203,090 0.7 Sudan 324,359 314,301 0.2
Sweden 1,448,719 1,173,991 0.7 Bonaire, Sint Eustatius and Saba
326,380 309,267 0.2
Ghana 639,779 1,163,935 0.6 Lithuania 299,977 254,560 0.1
Morocco 1,194,267 1,159,298 0.6 Mozambique 248,766 232,606 0.1
Iceland 1,212,266 1,157,178 0.6 Liberia 167,084 196,077 0.1
Egypt 1,123,074 1,104,741 0.6 Namibia 200,869 194,005 0.1
Finland 1,209,378 1,082,859 0.6 Cambodia 68,322 193,458 0.1
Germany 1,231,829 1,061,096 0.6 Zambia 212,695 191,017 0.1
France 1,193,949 1,013,179 0.6 Sierra Leone 178,073 169,554 0.1
Austria 1,161,852 990,491 0.5 Cyprus 208,115 169,283 0.1
Turkmenistan 1,304,937 963,301 0.5 Swaziland 171,429 153,110 0.1
Romania 999,650 946,248 0.5 Madagascar 141,808 137,806 0.1
Kazakhstan 1,070,567 929,946 0.5 Bhutan 148,535 134,344 0.1
Republic of Moldova 1,107,494 921,445 0.5 Lao People’s Democratic Republic
131,417 0.1
Philippines 1,025,074 919,376 0.5 Zimbabwe 51,594 128,725 0.1
Portugal 1,054,628 917,065 0.5 Botswana 137,368 122,424 0.1
Hungary 990,087 888,861 0.5 Lesotho 122,746 104,879 0.1
Kyrgyzstan 1,072,572 879,651 0.5 Rwanda 113,198 93,480 0.1
Bosnia and Herzegovina 885,398 863,023 0.5 Gambia 2,122 79,900 0.0
Montenegro 818,890 846,029 0.5 Sao Tome and Principe 87,001 68,721 0.0
Ireland 1,100,003 813,953 0.5 Antigua and Barbuda 41,525 36,935 0.0
totals 206,424,192 180,565,806
Source: WIPO, March 2017.
On average, holders paid 2,968 Swiss francs per registration recorded in 2016, down from the peak of 3,734 Swiss francs in 2008.
Figure D11International registration fees
Source: WIPO, March 2017.
3,430 3,5493,734
3,408
2,996 3,0992,926 3,039 3,102 3,102
2,968
2006 2007 2008 2009 2010 2011 2012 2013 2014 2015 2016
Year
5001,5003,000
5,000
10,000
15,000
20,000
Reg
istr
ati
on
fe
e (S
wis
s fr
an
cs)
0 20 40 60 80 100
Share of total Madrid registrations (%)
Ave
rag
e fe
e p
er
Ma
dri
d
regi
stra
tio
n (
Sw
iss
fra
ncs
)
TREND IN AVERAGE FEES PAID PER REGISTRATION DISTRIBUTION OF REGISTRATION FEES, 2016

64

65
A brief presentation of the Madrid System
Map AMadrid members in 2016
Source: World Intellectual Property Organization (WIPO), March 2017.
The Madrid System makes it possible for a trademark holder to apply for trademark registration in multiple countries by filing a single international application via a national or regional intellectual property (IP) office.1 It simplifies the process of multinational trademark registration by eliminating the need to file a separate application in each jurisdiction in which protection is sought. The System also simplifies managing the mark after registration, as it is possible to centrally request and record further changes or to renew the registration through a single procedural step.
Originally, two treaties administered by the World Intellectual Property Organization (WIPO) governed the Madrid System for the International Registration of Marks. These treaties are the Madrid Agreement Concerning the International Registration of Marks and the Protocol Relating to the Madrid Agreement – referred to jointly as the Madrid System. The Madrid Agreement was concluded in 1891, and the Madrid Protocol came into operation in 1996. With Algeria’s accession to the Madrid Protocol in October 2015, the last remaining member to be a party only to the Madrid
1. This publication uses the generic term “IP office” to refer to a national or regional office that receives trademark applications and issues registrations, since not all are specifically named “trademark office”.
Agreement joined the Protocol, effectively making Madrid a one-treaty system. On October 11, 2016, the Madrid Union Assembly consolidated this situation when it decided to freeze accessions to the Madrid Agreement, with the result that it will no longer be possible for a new member to accede to the Agreement only. As of December 31, 2016, the System comprised 98 Contracting Parties (map A). The 96 countries which are party to the Agreement and/or the Protocol, as well as two intergovernmental organizations – namely, the European Union (EU) covering 28 countries, and the African Intellectual Property Organization (OAPI) cov-ering 17 countries that are party to the Protocol – are referred to as Contracting Parties (Madrid members), and together form the Madrid Union.
Advantages offered by the Madrid System
The Madrid System offers many advantages to both applicants and IP offices compared with the alternative method of obtaining international protection for marks, the so-called Paris or direct route. The Paris route involves filing separate applications in a number of coun-tries or regions using rights established under the Paris Convention for the Protection of Industrial Property. By contrast, the Madrid System allows trademark holders
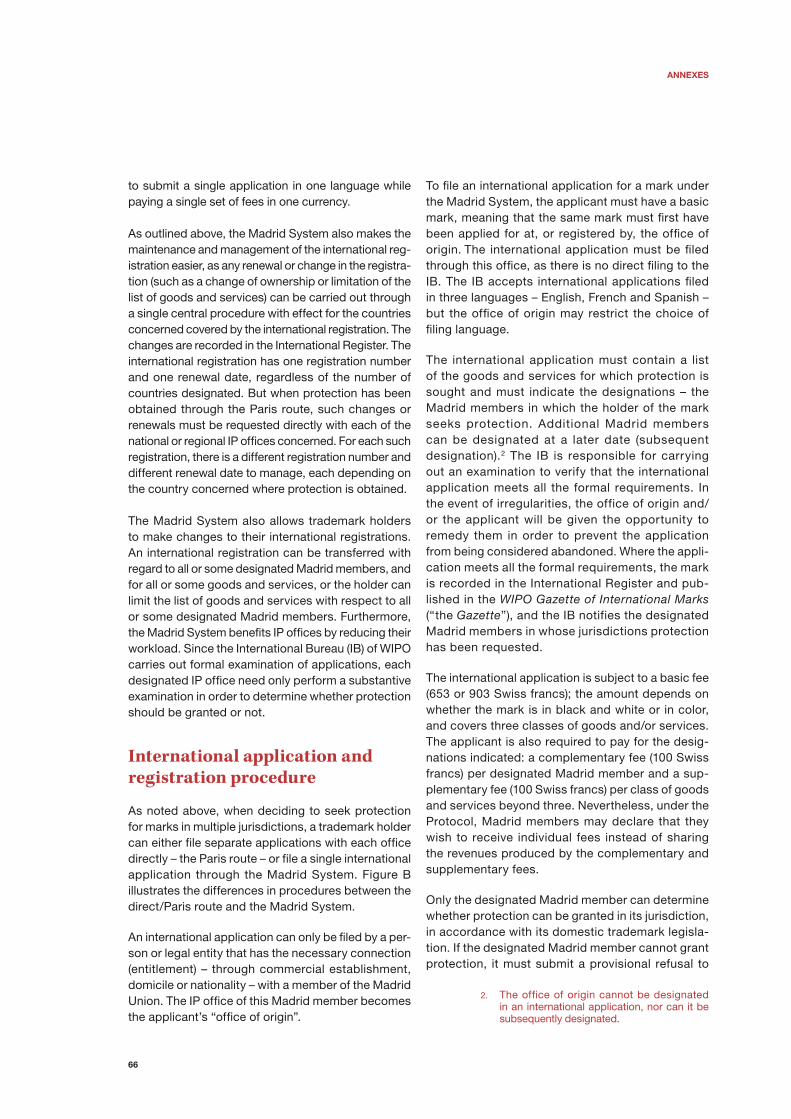
ANNEXES
66
to submit a single application in one language while paying a single set of fees in one currency.
As outlined above, the Madrid System also makes the maintenance and management of the international reg-istration easier, as any renewal or change in the registra-tion (such as a change of ownership or limitation of the list of goods and services) can be carried out through a single central procedure with effect for the countries concerned covered by the international registration. The changes are recorded in the International Register. The international registration has one registration number and one renewal date, regardless of the number of countries designated. But when protection has been obtained through the Paris route, such changes or renewals must be requested directly with each of the national or regional IP offices concerned. For each such registration, there is a different registration number and different renewal date to manage, each depending on the country concerned where protection is obtained.
The Madrid System also allows trademark holders to make changes to their international registrations. An international registration can be transferred with regard to all or some designated Madrid members, and for all or some goods and services, or the holder can limit the list of goods and services with respect to all or some designated Madrid members. Furthermore, the Madrid System benefits IP offices by reducing their workload. Since the International Bureau (IB) of WIPO carries out formal examination of applications, each designated IP office need only perform a substantive examination in order to determine whether protection should be granted or not.
International application and registration procedure
As noted above, when deciding to seek protection for marks in multiple jurisdictions, a trademark holder can either file separate applications with each office directly – the Paris route – or file a single international application through the Madrid System. Figure B illustrates the differences in procedures between the direct/Paris route and the Madrid System.
An international application can only be filed by a per-son or legal entity that has the necessary connection (entitlement) – through commercial establishment, domicile or nationality – with a member of the Madrid Union. The IP office of this Madrid member becomes the applicant’s “office of origin”.
To file an international application for a mark under the Madrid System, the applicant must have a basic mark, meaning that the same mark must first have been applied for at, or registered by, the office of origin. The international application must be filed through this office, as there is no direct filing to the IB. The IB accepts international applications filed in three languages – English, French and Spanish – but the office of origin may restrict the choice of filing language.
The international application must contain a list of the goods and services for which protection is sought and must indicate the designations – the Madrid members in which the holder of the mark seeks protection. Additional Madrid members can be designated at a later date (subsequent designation).2 The IB is responsible for carrying out an examination to verify that the international application meets all the formal requirements. In the event of irregularities, the office of origin and/or the applicant will be given the opportunity to remedy them in order to prevent the application from being considered abandoned. Where the appli-cation meets all the formal requirements, the mark is recorded in the International Register and pub-lished in the WIPO Gazette of International Marks (“the Gazette”), and the IB notifies the designated Madrid members in whose jurisdictions protection has been requested.
The international application is subject to a basic fee (653 or 903 Swiss francs); the amount depends on whether the mark is in black and white or in color, and covers three classes of goods and/or services. The applicant is also required to pay for the desig-nations indicated: a complementary fee (100 Swiss francs) per designated Madrid member and a sup-plementary fee (100 Swiss francs) per class of goods and services beyond three. Nevertheless, under the Protocol, Madrid members may declare that they wish to receive individual fees instead of sharing the revenues produced by the complementary and supplementary fees.
Only the designated Madrid member can determine whether protection can be granted in its jurisdiction, in accordance with its domestic trademark legisla-tion. If the designated Madrid member cannot grant protection, it must submit a provisional refusal to
2. The office of origin cannot be designated in an international application, nor can it be subsequently designated.

ANNEXES
67
the IB within the time limit concerned (12 months, or 18 months where a Madrid member has declared that it will apply such longer time limit). If no refusal is communicated by a designated Madrid member within the specific refusal period, or if a designated Madrid member issues a grant of protection within that period, the mark is then considered protected in that Madrid member’s jurisdiction.
For the first five years from the date of the interna-tional registration, the international registration is
dependent on the basic mark. The office of origin must inform the IB of any change concerning the scope of protection regarding the basic mark. Where the basic mark is abandoned or canceled (totally or partially) during this dependency period, the consequence is that the international registration is canceled to the same extent (totally or partially). When this happens, the cancellation of the inter-national registration is published in the Gazette, and the designated Madrid members concerned are notified.
Figure BOverview of the registration process direct or “paris” route
national / regionalIP offices
Markapplications
are filed with
that issue
Registrations
are the object of
Marks
the Madrid System
Markapplications
Madrid memberoffice
which submits the request1 for an International Registration to
International Bureau
Marks
WIPO Gazette of International
Marks
statement of grant (optional) or a refusal (period of 12 to 18 months)
Offices of designated
Madrid membersrecorded in the International Register and published in the
International registrations
Date of international registration (provided the International Bureau receives the application within two months of that date). If not, the international registration date is the date the International Bureau received the application.
0If no refusal is submitted within the prescribed time limit (12 or 18 months) the international registration is considered valid within its jurisdiction and has the effect as a grant of protection in the jurisdiction concerned.
14-20months 2Claimed priority date2
(maximum of 6 months from the filing
date)
notifies the offices of designated Madrid members
are the object ofare filed with a
issues
Notes:
1 An application for international registration (an “international application”) may be filed only by a natural person or a legal entity that has a real and effective industrial or commercial establishment in, or is domiciled in, or is a national of a country which is party to the Madrid System; that has such an establishment in, or is domiciled in, the territory of an intergovernmental organization which is party to the Madrid System; or that is a national of a member state of such an organization.
2 An applicant can claim priority of a first national or regional application in an international application within six months of the filing of that first application.
Source: WIPO, March 2017.

ANNEXES
68
International registrations are valid for a period of 10 years and may be renewed for further periods of 10 years. In most jurisdictions, trademark protection can be renewed indefinitely. The IB administers the renewal process by sending a reminder to hold-ers and their respective representatives (if any) six months before renewal is due. The international reg-istration may be renewed in respect of all designated Madrid members or in respect of only some of them. However, it is not possible for the holder to make voluntary changes to the list of goods and services at the time of the renewal. Therefore, if holders wish
at the time of renewal to remove some of the goods and services from the international registration, they must separately request the recording of limitation or cancellation in respect of those goods and services before the due date for renewal.
For more information regarding the Madrid System, visit: www.wipo.int/madrid
69
Data description
Data are compiled by WIPO in the processing of interna-tional applications and registrations through the Madrid System. Complete data exist up to calendar year 2016. Statistics on the number of direct application class counts at national and regional IP offices are extracted from the WIPO Statistics Database, primarily based on WIPO’s Annual IP Survey, through which WIPO receives offices’ statistics four months or more after the end of the year concerned. The latest available year to date for complete direct application data is therefore 2015.
In editions of the Madrid Yearly Review before 2016, many indicators were based on international regis-tration data. With the aim of better understanding the behavior of an applicant when first filing a Madrid international application, the 2016 and 2017 edi-tions enlarged their scope by primarily focusing on application data, albeit while still reporting pertinent registration statistics.
The application statistics used are based on the origi-nal filing date at a Madrid member office of origin. This removes the time lag between the date on which an application is first filed at an office of origin and the date it is received and recorded by WIPO. The 2016 data on applications by origin are estimated, as not all applications filed at offices of origin had been trans-mitted to WIPO at the time the Review was drafted. Data published in WIPO’s press release of March 15, 2017 and related infographics may slightly differ from those published in the Review, because these data are continually updated as WIPO receives more data from offices of origin of Madrid members.
The figures shown in this publication are subject to change.3
3. Regular updates are available at www.wipo.int/ipstats
70
List of abbreviations
BOIP Benelux Office for Intellectual PropertyEU European UnionEUIPO European Union Intellectual Property OfficeIB International Bureau of WIPOIP intellectual propertyOAPI Organisation Africaine de la Propriété
Intellectuelle (English: African Intellectual Property Organization)
U.K. United KingdomU.S. United States of AmericaWIPO World Intellectual Property Organization

71
Glossary
This glossary provides definitions of key technical terms and concepts used in trademark registration systems and the Madrid System.
Applicant: An individual or legal entity that files an application. There may be more than one applicant in an application.
Application: The formal request for the protection of a trademark at a national or regional IP office, which usu-ally examines the application and decides whether to grant or refuse protection in the jurisdiction concerned. (See also “International application”.)
Application date: The date on which an IP office receives an application that meets the minimum filing formality requirements. This may also be referred to as the filing date.
Basic application: The national or regional application on which an international application is based.
Basic mark: The national or regional application (basic application) or the registration (basic registration) on which an international application is based.
Basic registration: The national or regional registration on which an international application is based.
cancellation: A procedure to cancel the effects of an international registration for all or some goods and ser-vices in respect of all the Madrid members designated in a given international registration.
class: Refers to the classes defined in the Nice Classification. Classes indicate the categories of goods and services for which trademark protection is requested. (See “Nice Classification”.)
class count: The number of classes specified in a trademark application or registration. In the Madrid System and at certain offices, an applicant can file an application that specifies one or more of the 45 goods and services classes of the Nice Classification. Offices use either a single-class or multi-class filing system. The Madrid System is a multi-class system.
contracting party (Madrid member): A state or intergovernmental organization – for example, the European Union (EU) or the African Intellectual Property
Organization (OAPI) – that is party to the Madrid Agreement and/or the Madrid Protocol.
designation: The request, in an international registra-tion, for protection in a Madrid member’s jurisdiction.
direct route: See “Paris route”.
entitlement: In order to file an international applica-tion, the applicant needs to be entitled to do so, by having a connection with a member of the Madrid System through domicile, nationality or having a real and effective industrial or commercial establishment in one of the Contracting Parties to the Madrid System.
Holder: The person or legal entity in whose name an international registration is recorded.
Intellectual property (Ip): Refers to creations of the mind: inventions, literary and artistic works, and symbols, names, images and designs used in commerce.
International application: An application for interna-tional registration under the Madrid System, which is a request for protection of a trademark in one or more Madrid members. An international application must be based on a basic mark.
International Bureau (IB): The International Bureau of WIPO administers the Madrid System. It is responsible for procedural tasks related to international appli-cations, as well as the subsequent management of international registrations.
International Register: A register maintained by the IB, in which international applications that con-form to the applicable requirements are recorded as international registrations. Changes made to these registrations are also recorded in the International Register.
International registration: An application for inter-national registration of a mark leads to its recording in the International Register, and the publication of the international registration in the WIPO Gazette of International Marks. If the international registration is not refused protection by a designated Madrid member, it will have the same effect as a national or regional trademark registration made under the law applicable in that Madrid member’s jurisdiction.
ANNEXES
72
International registrations in force: International registrations currently enjoying a 10-year period of protection. To remain in force, registrations must be renewed. In most jurisdictions, a mark can be main-tained indefinitely and is renewed on a 10-year basis.
Invalidation: A designated Madrid member can inval-idate an international registration in its jurisdiction in accordance with its national or regional legislation. Invalidation is not subject to appeal. The invalidation is entered in the International Register and the holder is informed.
limitation: Limitation is a procedure for restricting the list of goods and services in respect of all or some of the designated Contracting Parties in an international registration.
Madrid Agreement (concerning the International Registration of Marks): A treaty administered by the IB of WIPO that governs the system of international registration of trademarks and service marks. (See “Madrid System”.)
Madrid member (contracting party): A state or intergovernmental organization – for example the European Union (EU) or the African Intellectual Property Organization (OAPI) – that is party to the Madrid Agreement and/or the Madrid Protocol.
Madrid protocol (protocol Relating to the Madrid Agreement): A treaty administered by the IB of WIPO that governs the system of international registration of trademarks and service marks. (See “Madrid System”.)
Madrid route: The Madrid route (the Madrid System) is an alternative to the direct national or regional route (also called the Paris route).
Madrid System: An abbreviation describing two pro-cedural treaties for the international registration of trademarks, namely the Madrid Agreement for the International Registration of Marks and the Protocol relating to that Agreement. The Madrid System is administered by the International Bureau of WIPO.
national registration: A trademark right issued (reg-istered) by an IP office of a country.
nice classification (ncl): The abbreviated form of the International Classification of Goods and Services for the Purposes of Registering Marks, an international classification established under the Nice Agreement.
The Nice Classification consists of 45 classes, which are divided into 34 classes for goods and 11 for ser-vices. (See also “Class” above.)
non-resident application: An application filed with an IP office of a given country/jurisdiction by an applicant residing or established in another country/jurisdiction.
opposition: An administrative process for disputing the validity of a trademark right. An opposition procedure is often limited to a specific time period before or after the right has been granted. For the Madrid System, oppo-sition procedures are accommodated and are defined by national laws of designated Madrid members.
origin: The country/territory of residence, nationality or establishment of the applicant filing a trademark application. The country of the applicant’s address is used to determine the origin of the application. In the Madrid System, the office of origin is the IP office of the Madrid member in which the applicant is entitled to file an international application.
paris convention: The Paris Convention for the Protection of Industrial Property is one of the most important IP treaties, as it establishes general principles applicable for all IP rights. For example, the “right of priority” enables an applicant, when filing an application for an IP right in countries other than the original country of filing, to claim priority of an earlier application filed up to six months previously.
paris route: An alternative to the Madrid route, the Paris route (also called the “direct route”) enables individual IP applications to be filed directly with an IP office that is a signatory of the Paris Convention.
priority date: The filing date of the application on the basis of which priority is claimed. (See “Paris Convention” above.)
Regional application: A trademark application filed with an IP office having regional jurisdiction over more than one country. There are currently three regional offices that represent members of the Madrid System: the Benelux Office for Intellectual Property (BOIP) (for Belgium, Luxembourg and the Netherlands), the European Union Intellectual Property Office (EUIPO), and the African Intellectual Property Organization (OAPI).
Regional registration: A trademark right issued (reg-istered) by an IP office having regional jurisdiction.
ANNEXES
73
Registration: An exclusive right for marks, which is issued to a holder by an IP office. Registrations are issued to holders so that they may exclusively exploit their marks for a limited period of time. (See “International registration”.)
Renewal: The process by which a trademark right is maintained (kept in force). This usually consists of paying renewal fees to an IP office at regular inter-vals. If renewal fees are not paid or, in some juris-dictions, if the holder cannot prove that the mark is being actively used, the registration may lapse. Once recorded, an international registration is valid for a period of 10 years and can be renewed for additional 10-year periods on payment of the prescribed fees. International registrations must be renewed in order to remain active. To facilitate the renewal process, the IB sends an unofficial reminder to holders and their representatives (if any) six months before renewal is due. The international registration may be renewed in respect of all designated Madrid members or only some of them.
Renunciation: A procedure intended to abandon the effects of an international registration for all the goods and services in respect of one or some of the desig-nated Madrid members.
Resident application: An application filed with an IP office by an applicant residing or established in the country/region in which that office has jurisdic-tion. Resident applications are sometimes referred to as domestic applications. A resident registra-tion is an IP right issued on the basis of a resident application.
Statement of Grant of protection: A communication from the IP office of a designated Madrid member
notifying the IB that it has granted protection within its jurisdiction.
Subsequent designation: A designation made sub-sequently to an international registration to extend its geographical scope.
trademark: A sign used by the owner of specific goods or services to distinguish them from those of others. Depending on the jurisdiction, a trademark can consist of words and combinations of words (for instance, slogans), names, logos, figures and images, letters, numbers, smells, sounds and moving images, or a combination thereof. The procedures for regis-tering trademarks are governed by the legislation and procedures of national and regional IP offices and WIPO. Trademark rights are limited to the jurisdiction of the IP office that registers the trademark. Trademarks can be registered by filing an application at the relevant national or regional office(s), or by filing an international application through the Madrid System.
WIPO Gazette of International Marks: The official publication of the Madrid System published weekly online and containing information regarding new inter-national registrations, renewals, subsequent designa-tions and modifications affecting existing international registrations.
world Intellectual property organization (wIpo): A United Nations specialized agency dedicated to the promotion of innovation and creativity for the eco-nomic, social and cultural development of all coun-tries through a balanced and effective international IP system. Established in 1967, WIPO’s mandate is to promote the protection of IP throughout the world through cooperation among states and in collaboration with other international organizations.
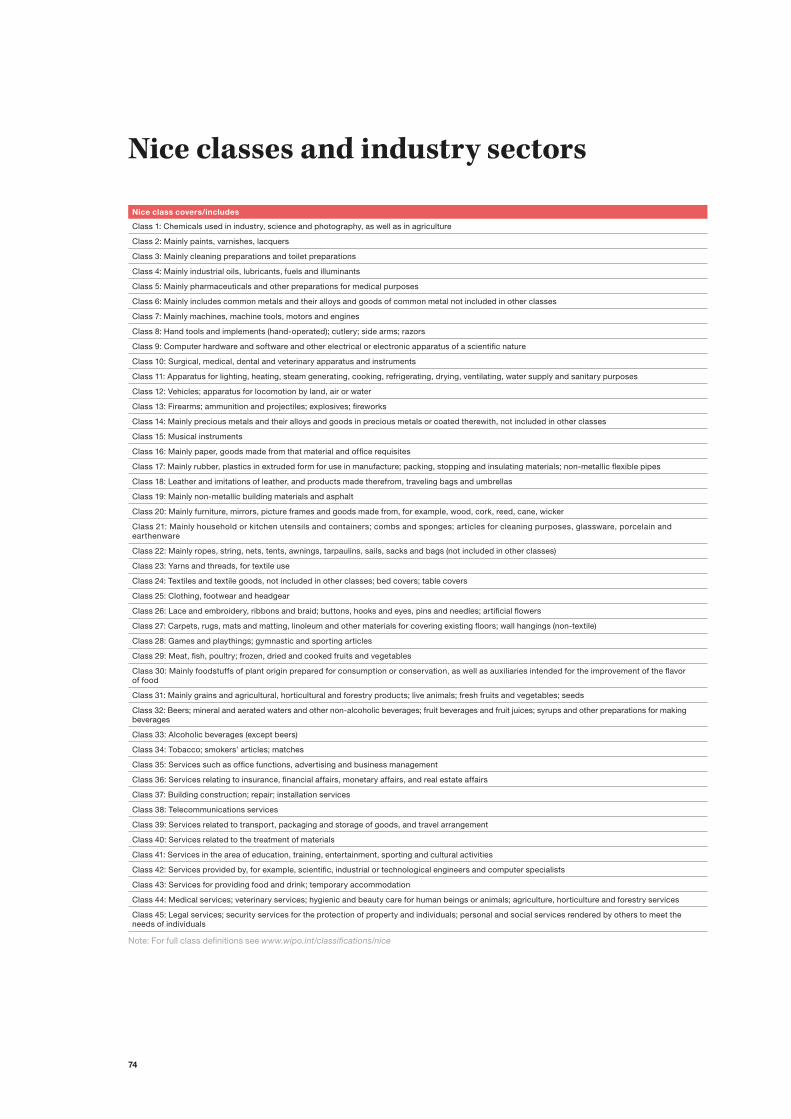
74
Nice classes and industry sectors
nice class covers/includes
Class 1: Chemicals used in industry, science and photography, as well as in agriculture
Class 2: Mainly paints, varnishes, lacquers
Class 3: Mainly cleaning preparations and toilet preparations
Class 4: Mainly industrial oils, lubricants, fuels and illuminants
Class 5: Mainly pharmaceuticals and other preparations for medical purposes
Class 6: Mainly includes common metals and their alloys and goods of common metal not included in other classes
Class 7: Mainly machines, machine tools, motors and engines
Class 8: Hand tools and implements (hand-operated); cutlery; side arms; razors
Class 9: Computer hardware and software and other electrical or electronic apparatus of a scientific nature
Class 10: Surgical, medical, dental and veterinary apparatus and instruments
Class 11: Apparatus for lighting, heating, steam generating, cooking, refrigerating, drying, ventilating, water supply and sanitary purposes
Class 12: Vehicles; apparatus for locomotion by land, air or water
Class 13: Firearms; ammunition and projectiles; explosives; fireworks
Class 14: Mainly precious metals and their alloys and goods in precious metals or coated therewith, not included in other classes
Class 15: Musical instruments
Class 16: Mainly paper, goods made from that material and office requisites
Class 17: Mainly rubber, plastics in extruded form for use in manufacture; packing, stopping and insulating materials; non-metallic flexible pipes
Class 18: Leather and imitations of leather, and products made therefrom, traveling bags and umbrellas
Class 19: Mainly non-metallic building materials and asphalt
Class 20: Mainly furniture, mirrors, picture frames and goods made from, for example, wood, cork, reed, cane, wicker
Class 21: Mainly household or kitchen utensils and containers; combs and sponges; articles for cleaning purposes, glassware, porcelain and earthenware
Class 22: Mainly ropes, string, nets, tents, awnings, tarpaulins, sails, sacks and bags (not included in other classes)
Class 23: Yarns and threads, for textile use
Class 24: Textiles and textile goods, not included in other classes; bed covers; table covers
Class 25: Clothing, footwear and headgear
Class 26: Lace and embroidery, ribbons and braid; buttons, hooks and eyes, pins and needles; artificial flowers
Class 27: Carpets, rugs, mats and matting, linoleum and other materials for covering existing floors; wall hangings (non-textile)
Class 28: Games and playthings; gymnastic and sporting articles
Class 29: Meat, fish, poultry; frozen, dried and cooked fruits and vegetables
Class 30: Mainly foodstuffs of plant origin prepared for consumption or conservation, as well as auxiliaries intended for the improvement of the flavor of food
Class 31: Mainly grains and agricultural, horticultural and forestry products; live animals; fresh fruits and vegetables; seeds
Class 32: Beers; mineral and aerated waters and other non-alcoholic beverages; fruit beverages and fruit juices; syrups and other preparations for making beverages
Class 33: Alcoholic beverages (except beers)
Class 34: Tobacco; smokers’ articles; matches
Class 35: Services such as office functions, advertising and business management
Class 36: Services relating to insurance, financial affairs, monetary affairs, and real estate affairs
Class 37: Building construction; repair; installation services
Class 38: Telecommunications services
Class 39: Services related to transport, packaging and storage of goods, and travel arrangement
Class 40: Services related to the treatment of materials
Class 41: Services in the area of education, training, entertainment, sporting and cultural activities
Class 42: Services provided by, for example, scientific, industrial or technological engineers and computer specialists
Class 43: Services for providing food and drink; temporary accommodation
Class 44: Medical services; veterinary services; hygienic and beauty care for human beings or animals; agriculture, horticulture and forestry services
Class 45: Legal services; security services for the protection of property and individuals; personal and social services rendered by others to meet the needs of individuals
Note: For full class definitions see www.wipo.int/classifications/nice
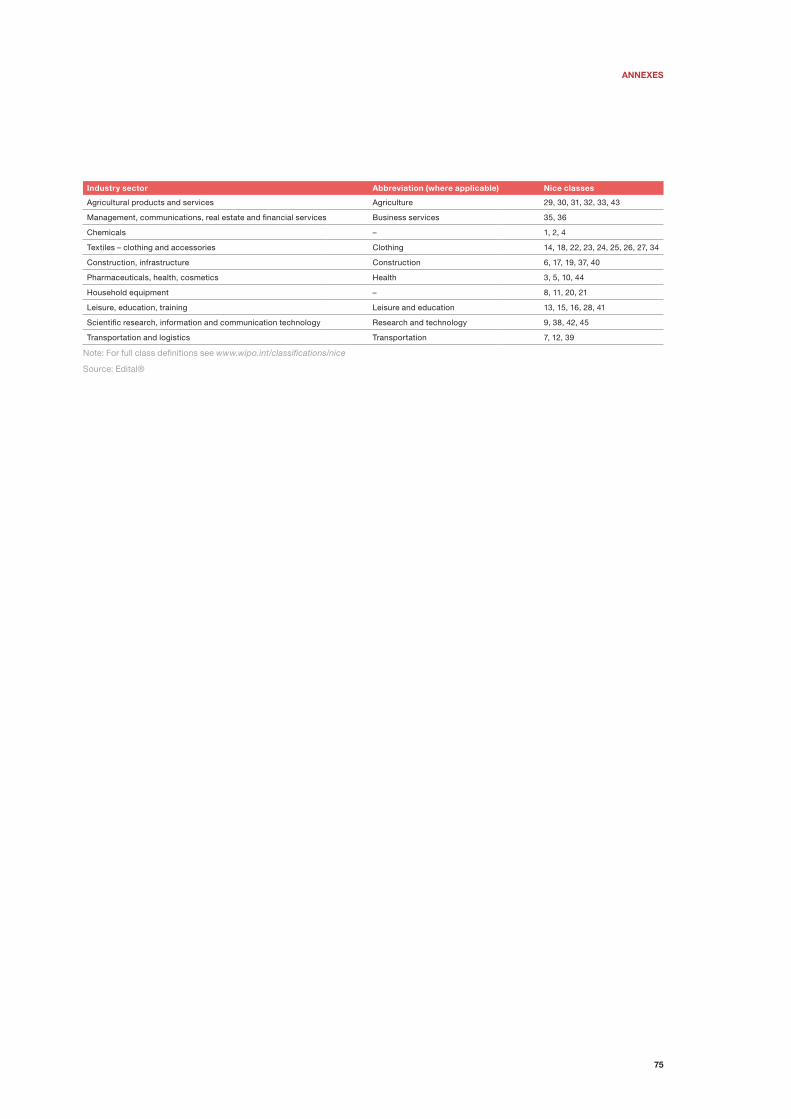
ANNEXES
75
Industry sector Abbreviation (where applicable) nice classes
Agricultural products and services Agriculture 29, 30, 31, 32, 33, 43
Management, communications, real estate and financial services Business services 35, 36
Chemicals – 1, 2, 4
Textiles – clothing and accessories Clothing 14, 18, 22, 23, 24, 25, 26, 27, 34
Construction, infrastructure Construction 6, 17, 19, 37, 40
Pharmaceuticals, health, cosmetics Health 3, 5, 10, 44
Household equipment – 8, 11, 20, 21
Leisure, education, training Leisure and education 13, 15, 16, 28, 41
Scientific research, information and communication technology Research and technology 9, 38, 42, 45
Transportation and logistics Transportation 7, 12, 39
Note: For full class definitions see www.wipo.int/classifications/nice
Source: Edital®
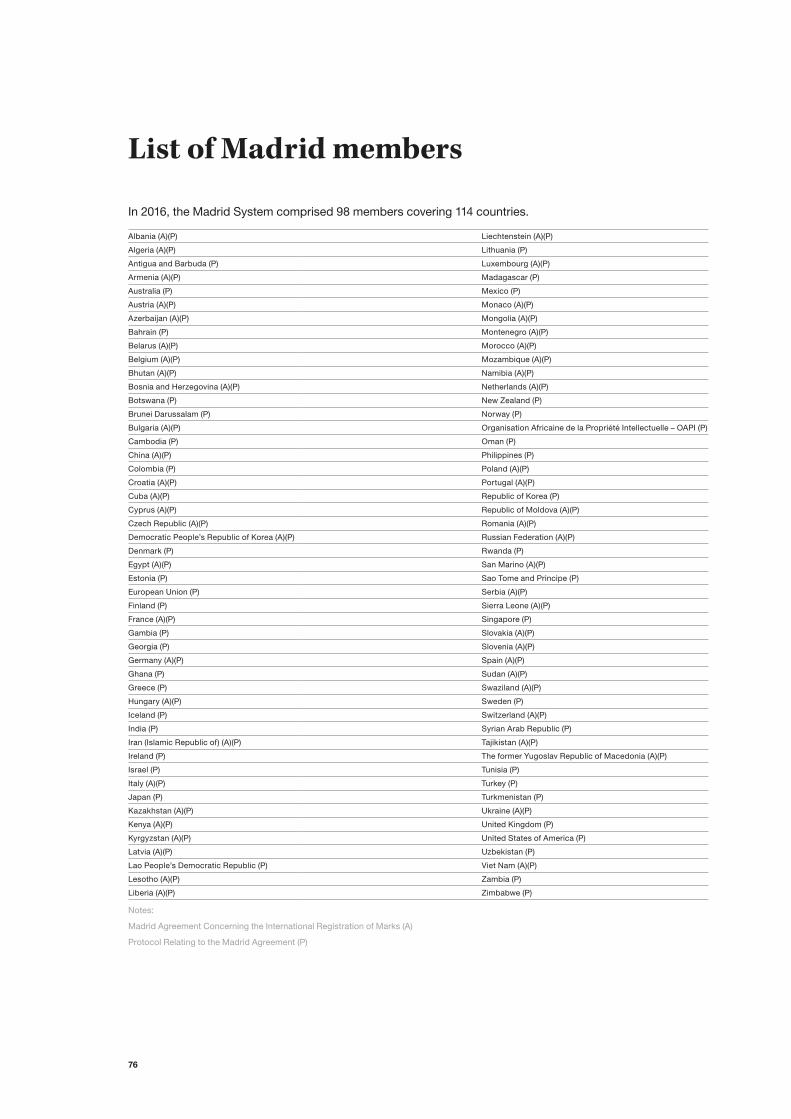
76
List of Madrid members
In 2016, the Madrid System comprised 98 members covering 114 countries.
Albania (A)(P) Liechtenstein (A)(P)
Algeria (A)(P) Lithuania (P)
Antigua and Barbuda (P) Luxembourg (A)(P)
Armenia (A)(P) Madagascar (P)
Australia (P) Mexico (P)
Austria (A)(P) Monaco (A)(P)
Azerbaijan (A)(P) Mongolia (A)(P)
Bahrain (P) Montenegro (A)(P)
Belarus (A)(P) Morocco (A)(P)
Belgium (A)(P) Mozambique (A)(P)
Bhutan (A)(P) Namibia (A)(P)
Bosnia and Herzegovina (A)(P) Netherlands (A)(P)
Botswana (P) New Zealand (P)
Brunei Darussalam (P) Norway (P)
Bulgaria (A)(P) Organisation Africaine de la Propriété Intellectuelle – OAPI (P)
Cambodia (P) Oman (P)
China (A)(P) Philippines (P)
Colombia (P) Poland (A)(P)
Croatia (A)(P) Portugal (A)(P)
Cuba (A)(P) Republic of Korea (P)
Cyprus (A)(P) Republic of Moldova (A)(P)
Czech Republic (A)(P) Romania (A)(P)
Democratic People’s Republic of Korea (A)(P) Russian Federation (A)(P)
Denmark (P) Rwanda (P)
Egypt (A)(P) San Marino (A)(P)
Estonia (P) Sao Tome and Principe (P)
European Union (P) Serbia (A)(P)
Finland (P) Sierra Leone (A)(P)
France (A)(P) Singapore (P)
Gambia (P) Slovakia (A)(P)
Georgia (P) Slovenia (A)(P)
Germany (A)(P) Spain (A)(P)
Ghana (P) Sudan (A)(P)
Greece (P) Swaziland (A)(P)
Hungary (A)(P) Sweden (P)
Iceland (P) Switzerland (A)(P)
India (P) Syrian Arab Republic (P)
Iran (Islamic Republic of) (A)(P) Tajikistan (A)(P)
Ireland (P) The former Yugoslav Republic of Macedonia (A)(P)
Israel (P) Tunisia (P)
Italy (A)(P) Turkey (P)
Japan (P) Turkmenistan (P)
Kazakhstan (A)(P) Ukraine (A)(P)
Kenya (A)(P) United Kingdom (P)
Kyrgyzstan (A)(P) United States of America (P)
Latvia (A)(P) Uzbekistan (P)
Lao People’s Democratic Republic (P) Viet Nam (A)(P)
Lesotho (A)(P) Zambia (P)
Liberia (A)(P) Zimbabwe (P)
Notes:
Madrid Agreement Concerning the International Registration of Marks (A)
Protocol Relating to the Madrid Agreement (P)
WIPO Publication No. 940E/17
ISBN 978-92-805-2862-6
World Intellectual Property Organization34, chemin des ColombettesP.O. Box 18CH-1211 Geneva 20Switzerland
Tel: + 41 22 338 91 11Fax: + 41 22 733 54 28
For contact details of WIPO’s External Offices visit: www.wipo.int/about-wipo/en/offices/