madhava ram
TRANSCRIPT
Tamil Nadu Urban Infrastructure
Financial Services Limited (TNUIFSL)
Final Report Final Report
forfor
City Corporate cum Business PlanCity Corporate cum Business Plan
for for
SE
PT
EM
BE
R 2
009
SE
PT
EM
BE
R 2
009
S T
A G
E
S T
A G
E ��
IVIV
C L
U S
T E
R
C L
U S
T E
R ��
VV
Voyants Solutions Pvt. LtdLevel � 4, �Diamond Dune�323, P.H. Road, Chennai � 600 029Tele: 044 4269 8584 Fax: 044 2668 1180E-mail: [email protected]
Voyants Solutions Pvt. LtdLevel � 4, �Diamond Dune�323, P.H. Road, Chennai � 600 029Tele: 044 4269 8584 Fax: 044 2668 1180E-mail: [email protected]
Submitted by:Submitted by:
for for
MadhavaramMadhavaram TownTown((TiruvallurTiruvallur District)District)
Final Report City Corporate Cum Business Plan
EXECUTIVE SUMMARY � MADHAVARAM MUNICIPALITY
1. CITY CORPORATE CUM BUSINESS PLAN � CONTEXT and CONTENT
The Tamil Nadu Urban Infrastructure Financial Services (TNUIFSL) aims to assist municipality in
strengthening and improving its financial position for effective capital investment
management and urban service delivery. The CMA and TNUIFSL have initiated the process
of preparing the CCCBP for the municipality to enhance the vision of stakeholders in the
growth of the town. The objective of this study is
1. To assess the present status of infrastructure facilities available in the ULB and to
suggest a comprehensive infrastructure plan with capital investment plan to meet
the future needs.
2. To outline issues in revenue realization in the ULB and suggest measures for revenue
enhancement & financial improvement in the ULB
3. In consultations with Stake holders and Council, suggest Action Plan and FOP to
implement the infrastructure plan.
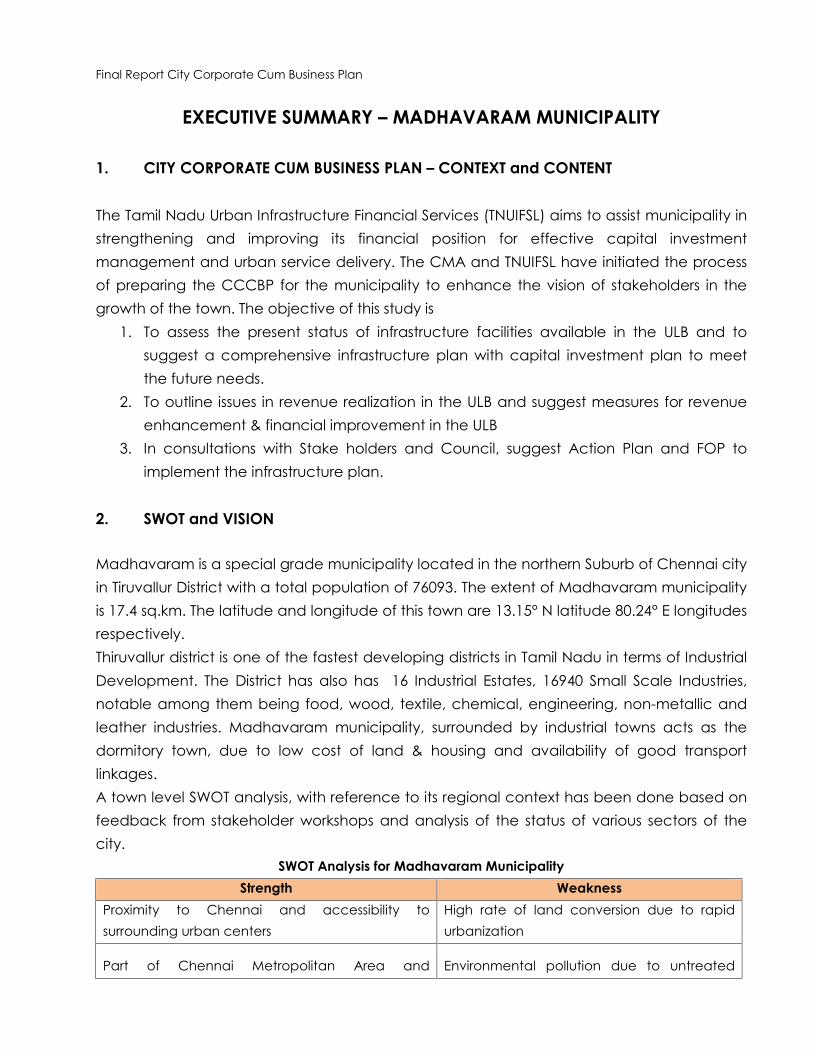
2. SWOT and VISION
Madhavaram is a special grade municipality located in the northern Suburb of Chennai city
in Tiruvallur District with a total population of 76093. The extent of Madhavaram municipality
is 17.4 sq.km. The latitude and longitude of this town are 13.15° N latitude 80.24° E longitudes
respectively.
Thiruvallur district is one of the fastest developing districts in Tamil Nadu in terms of Industrial
Development. The District has also has 16 Industrial Estates, 16940 Small Scale Industries,
notable among them being food, wood, textile, chemical, engineering, non-metallic and
leather industries. Madhavaram municipality, surrounded by industrial towns acts as the
dormitory town, due to low cost of land & housing and availability of good transport
linkages.
A town level SWOT analysis, with reference to its regional context has been done based on
feedback from stakeholder workshops and analysis of the status of various sectors of the
city.
SWOT Analysis for Madhavaram Municipality
Strength Weakness
Proximity to Chennai and accessibility to
surrounding urban centers
High rate of land conversion due to rapid
urbanization
Part of Chennai Metropolitan Area and Environmental pollution due to untreated
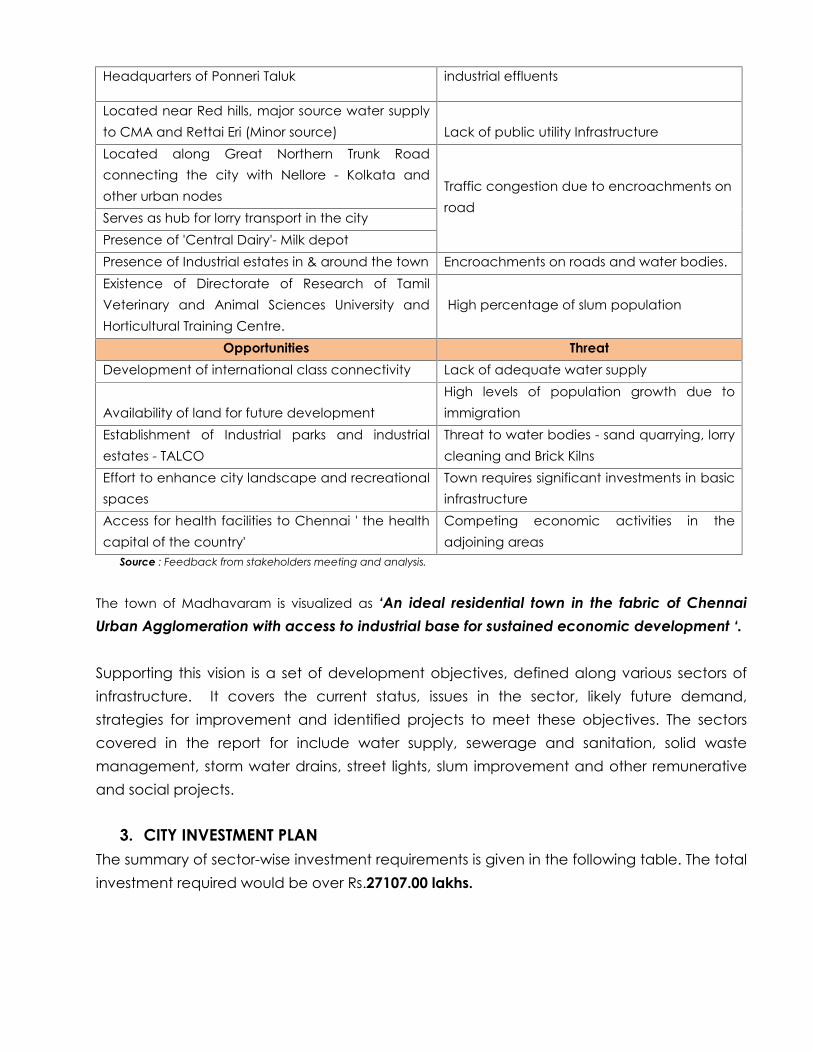
Headquarters of Ponneri Taluk industrial effluents
Located near Red hills, major source water supply
to CMA and Rettai Eri (Minor source) Lack of public utility Infrastructure
Located along Great Northern Trunk Road
connecting the city with Nellore - Kolkata and
other urban nodes Traffic congestion due to encroachments on
road Serves as hub for lorry transport in the city
Presence of 'Central Dairy'- Milk depot
Presence of Industrial estates in & around the town Encroachments on roads and water bodies.
Existence of Directorate of Research of Tamil
Veterinary and Animal Sciences University and
Horticultural Training Centre.
High percentage of slum population
Opportunities Threat
Development of international class connectivity Lack of adequate water supply
Availability of land for future development
High levels of population growth due to
immigration
Establishment of Industrial parks and industrial
estates - TALCO
Threat to water bodies - sand quarrying, lorry
cleaning and Brick Kilns
Effort to enhance city landscape and recreational
spaces
Town requires significant investments in basic
infrastructure
Access for health facilities to Chennai ' the health
capital of the country'
Competing economic activities in the
adjoining areas
Source : Feedback from stakeholders meeting and analysis.
The town of Madhavaram is visualized as �An ideal residential town in the fabric of Chennai
Urban Agglomeration with access to industrial base for sustained economic development �.
Supporting this vision is a set of development objectives, defined along various sectors of
infrastructure. It covers the current status, issues in the sector, likely future demand,
strategies for improvement and identified projects to meet these objectives. The sectors
covered in the report for include water supply, sewerage and sanitation, solid waste
management, storm water drains, street lights, slum improvement and other remunerative
and social projects.
3. CITY INVESTMENT PLAN
The summary of sector-wise investment requirements is given in the following table. The total
investment required would be over Rs.27107.00 lakhs.
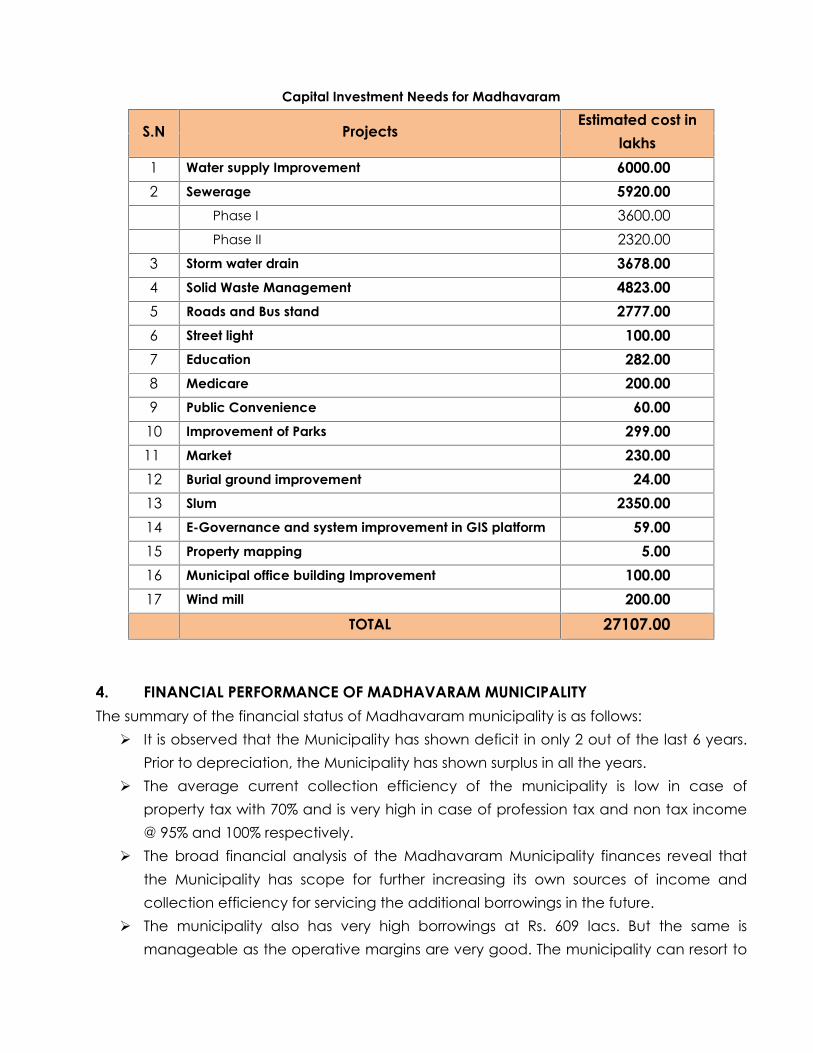
Capital Investment Needs for Madhavaram
S.N Projects Estimated cost in
lakhs
1 Water supply Improvement 6000.00
2 Sewerage 5920.00
Phase I 3600.00
Phase II 2320.00
3 Storm water drain 3678.00
4 Solid Waste Management 4823.00
5 Roads and Bus stand 2777.00
6 Street light 100.00
7 Education 282.00
8 Medicare 200.00
9 Public Convenience 60.00
10 Improvement of Parks 299.00
11 Market 230.00
12 Burial ground improvement 24.00
13 Slum 2350.00
14 E-Governance and system improvement in GIS platform 59.00
15 Property mapping 5.00
16 Municipal office building Improvement 100.00
17 Wind mill 200.00
TOTAL 27107.00
4. FINANCIAL PERFORMANCE OF MADHAVARAM MUNICIPALITY
The summary of the financial status of Madhavaram municipality is as follows:
It is observed that the Municipality has shown deficit in only 2 out of the last 6 years.
Prior to depreciation, the Municipality has shown surplus in all the years.
The average current collection efficiency of the municipality is low in case of
property tax with 70% and is very high in case of profession tax and non tax income
@ 95% and 100% respectively.
The broad financial analysis of the Madhavaram Municipality finances reveal that
the Municipality has scope for further increasing its own sources of income and
collection efficiency for servicing the additional borrowings in the future.
The municipality also has very high borrowings at Rs. 609 lacs. But the same is
manageable as the operative margins are very good. The municipality can resort to
further borrowings for new project, which can be serviced from existing revenues and
additional income to be generated.
To summarise, the overall income pattern of the Madhavaram Municipality indicates more
positive features than negative features. The positive trends are on the income side, where
the Municipality has higher growth rate.
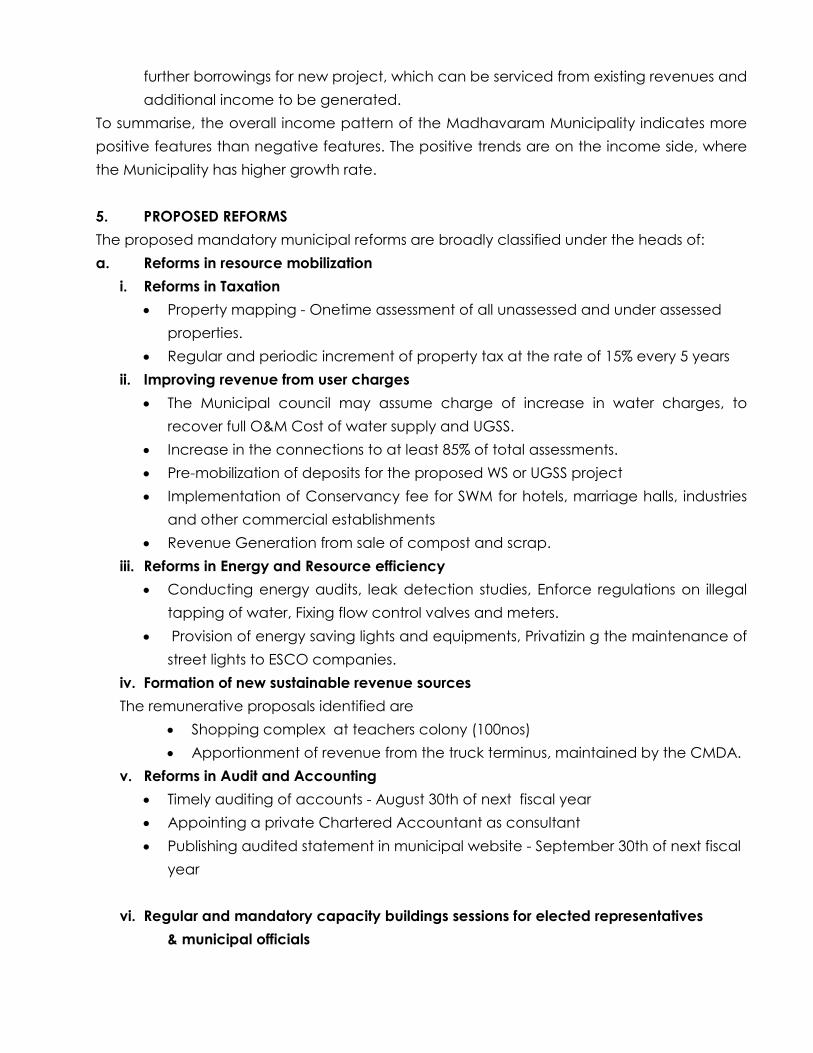
5. PROPOSED REFORMS
The proposed mandatory municipal reforms are broadly classified under the heads of:
a. Reforms in resource mobilization
i. Reforms in Taxation
Property mapping - Onetime assessment of all unassessed and under assessed
properties.
Regular and periodic increment of property tax at the rate of 15% every 5 years
ii. Improving revenue from user charges
The Municipal council may assume charge of increase in water charges, to
recover full O&M Cost of water supply and UGSS.
Increase in the connections to at least 85% of total assessments.
Pre-mobilization of deposits for the proposed WS or UGSS project
Implementation of Conservancy fee for SWM for hotels, marriage halls, industries
and other commercial establishments
Revenue Generation from sale of compost and scrap.
iii. Reforms in Energy and Resource efficiency
Conducting energy audits, leak detection studies, Enforce regulations on illegal
tapping of water, Fixing flow control valves and meters.
Provision of energy saving lights and equipments, Privatizin g the maintenance of
street lights to ESCO companies.
iv. Formation of new sustainable revenue sources
The remunerative proposals identified are
Shopping complex at teachers colony (100nos)
Apportionment of revenue from the truck terminus, maintained by the CMDA.
v. Reforms in Audit and Accounting
Timely auditing of accounts - August 30th of next fiscal year
Appointing a private Chartered Accountant as consultant
Publishing audited statement in municipal website - September 30th of next fiscal
year
vi. Regular and mandatory capacity buildings sessions for elected representatives
& municipal officials

6. PROJECT CASH FLOWS AND FOP RESULTS :
The Municipality has deficit prior to depreciation in 17 out of the future 20 years and
the cumulative cash flows are also negative for all the next 20 years.
The full projects investment scenario indicates that Madhavaram Municipality would
end up with a positive cumulative cash deficit of only Rs. 14830 lacs by the end of FY
2028-29 (after 20 years)
On �Full Project Investment Scenario� basis, Madhavaram�s own revenues
(comprising taxes, user charges and other income) could grow from Rs. 385 lacs in FY
2006-07 to Rs. 1812 lacs by FY 2028-29, implying an absolute growth of 19%.
Madhavaram also needs to explore scope for private sector participation for
development of remunerative projects and city beautification projects that have
been identified by Madhavaram.
A comprehensive energy audit is required, given that 70% of its operations and
maintenance expenditure is spent on electricity charges.
7. BORROWING AND INVESTMENT CAPACITY
The borrowing and investment capacities of the town are arrived considering the revenue
income and expenditure under the sustainable scenario, after implementation of the
mandatory reforms proposed in this report.
The investment capacity for the sustainable scenario can be summed up as below:
Summary of Borrowing and Investment Capacity
Description Base case Scenario 1 Sustainable Scenario 2
Borrowing Capacity Rs. 2480.20 lacs -
Investment Capacity (BC/0.04) Rs. 9920.80 lacs -
Investment Requirement - Rs. 27107.00 lacs
Sustainable Investment Capacity % - IC / IR - -
The investment capacity of Madhavaram Municipality on �As is Where Basis� works out to
Rs. 9921 lacs.
The investment capacity of Madhavaram Municipality works to Nil in case of Scenario II
with all projects identified in CCP taken in to consideration.
The same is on account of high capital cost and operation & maintenance on major
projects like water supply, underground sewerage, solid waste management, strom
water drains etc. The higher capital cost results in higher borrowings and annuity,
causing deficit in cash flows.
Both water supply and sewerage are showing cumulative cash deficit of around Rs. 9000
lacs by end of 20 years on account of high operation & maintenance expenses and
annuity.
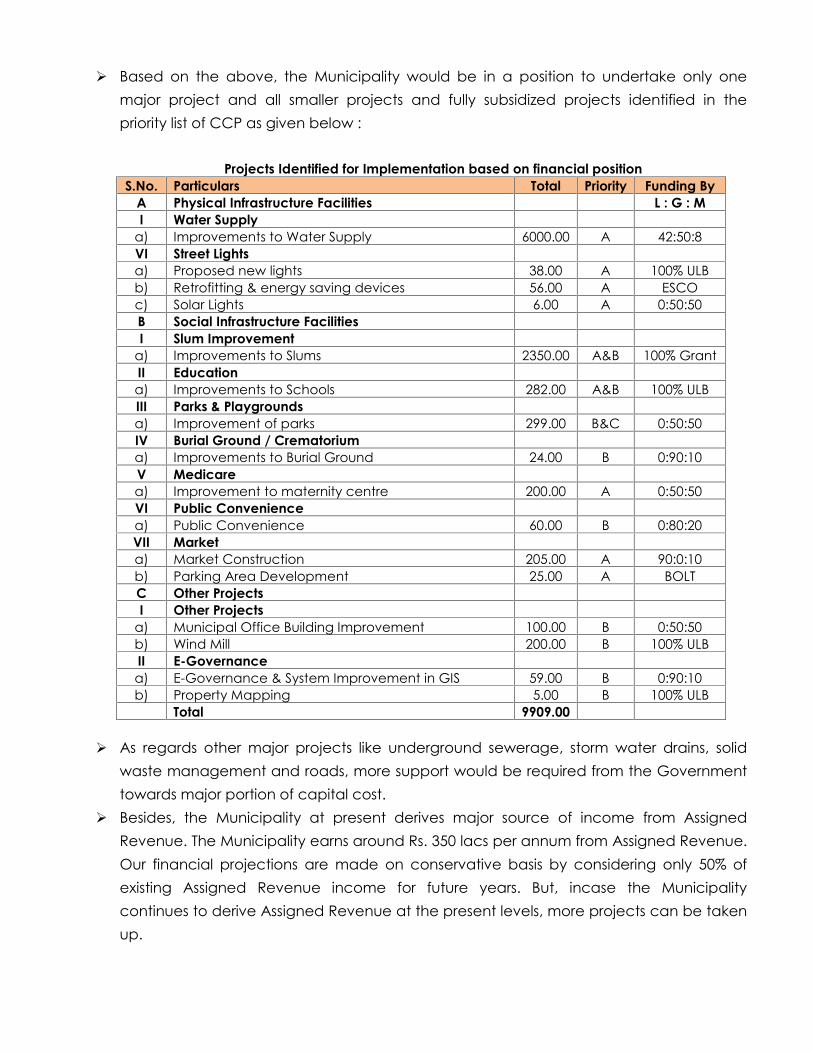
Based on the above, the Municipality would be in a position to undertake only one
major project and all smaller projects and fully subsidized projects identified in the
priority list of CCP as given below :
Projects Identified for Implementation based on financial position
S.No. Particulars Total Priority Funding By
A Physical Infrastructure Facilities L : G : M
I Water Supply
a) Improvements to Water Supply 6000.00 A 42:50:8
VI Street Lights
a) Proposed new lights 38.00 A 100% ULB
b) Retrofitting & energy saving devices 56.00 A ESCO
c) Solar Lights 6.00 A 0:50:50
B Social Infrastructure Facilities
I Slum Improvement
a) Improvements to Slums 2350.00 A&B 100% Grant
II Education
a) Improvements to Schools 282.00 A&B 100% ULB
III Parks & Playgrounds
a) Improvement of parks 299.00 B&C 0:50:50
IV Burial Ground / Crematorium
a) Improvements to Burial Ground 24.00 B 0:90:10
V Medicare
a) Improvement to maternity centre 200.00 A 0:50:50
VI Public Convenience
a) Public Convenience 60.00 B 0:80:20
VII Market
a) Market Construction 205.00 A 90:0:10
b) Parking Area Development 25.00 A BOLT
C Other Projects
I Other Projects
a) Municipal Office Building Improvement 100.00 B 0:50:50
b) Wind Mill 200.00 B 100% ULB
II E-Governance
a) E-Governance & System Improvement in GIS 59.00 B 0:90:10
b) Property Mapping 5.00 B 100% ULB
Total 9909.00
As regards other major projects like underground sewerage, storm water drains, solid
waste management and roads, more support would be required from the Government
towards major portion of capital cost.
Besides, the Municipality at present derives major source of income from Assigned
Revenue. The Municipality earns around Rs. 350 lacs per annum from Assigned Revenue.
Our financial projections are made on conservative basis by considering only 50% of
existing Assigned Revenue income for future years. But, incase the Municipality
continues to derive Assigned Revenue at the present levels, more projects can be taken
up.
Final Report: Madhavaram Municipality
- i -
Voyants Solutions Private Limited
TTTAAABBBLLLEEE OOOFFF CCCOOONNNTTTEEENNNTTTSSS
111 BBBAAACCCKKKGGGRRROOOUUUNNNDDD AAANNNDDD MMMEEETTTHHHOOODDDOOOLLLOOOGGGIIICCCAAALLL FFFRRRAAAMMMEEEWWWOOORRRKKK OOOFFF TTTHHHEEE SSSTTTUUUDDDYYY ... ... ... ... ... ... ... ... ... 111000 1.1 BACKGROUND ....................................................................................................................... 10 1.2 OBJECTIVES ............................................................................................................................. 10 1.3 SCOPE OF WORK: .................................................................................................................. 10 1.4 STAGE III: DRAFT FINAL STAGE .............................................................................................. 11 1.5 PRESENTATION AND DISCUSSION WITH REVIEW COMMITTEE ......................................... 12 1.5.1 DISCUSSION WITH STAKEHOLDERS ....................................................................................... 13 222 TTTOOOWWWNNN PPPRRROOOFFFIIILLLEEE ... ... ... ... ... ... ... ... ... ... ... ... ... ... ... ... ... ... ... ... ... ... ... ... ... ... ... ... ... ... ... ... ... ... ... ... ... ... ... ... ... ... ... ... ... ... ... ... ... ... ... ... ... ... ... ... ... ... ... ... ... ... ... ... ... ... ... ... ... ... ... ... ... ... ... ... ... ... ... ... ... ... ... ... ... ... ... ... ... ... ... ... ... ... ... ... ... ... ... ... ... ... ... ... ... ... ... 111444 2.1 MADHAVARAM . . . TOWN PROFILE .................................................................................... 14 2.2 HISTORY OF THE MUNICIPALITY ............................................................................................ 14 2.3 POPULATION CHARACTERISTICS ......................................................................................... 15 2.3.1 POPULATION DISTRIBUTION ................................................................................................... 15 2.3.2 POPULATION GROWTH .......................................................................................................... 16 2.3.3 POPULATION PROJECTIONS ................................................................................................. 16 2.3.4 SLUM POPULATION ................................................................................................................. 16 2.3.5 SEX RATIO ................................................................................................................................. 16 2.3.6 LITERACY .................................................................................................................................. 17 333 EEECCCOOONNNOOOMMMIIICCC DDDEEEVVVEEELLLOOOPPPMMMEEENNNTTT AAANNNDDD PPPHHHYYYSSSIIICCCAAALLL PPPLLLAAANNNNNNIIINNNGGG ... ... ... ... ... ... ... ... ... ... ... ... ... ... ... ... ... ... ... ... ... ... ... ... ... ... ... ... ... ... ... ... ... ... ... ... 111888 3.1 URBAN ECONOMIC DEVELOPMENT - SITUATION ANALYSIS. ........................................... 18 3.1.1 OCCUPATIONAL PATTERN ............................................................................................................ 18 3.2 PHYSICAL PLANNING ............................................................................................................. 19 3.2.1 PHYSICAL GROWTH TREND ................................................................................................... 19 3.2.2 LAND USE ANALYSIS ............................................................................................................... 20 3.3 GROWTH MANAGEMENT ISSUES .......................................................................................... 23 444 SSSTTTAAAKKKEEEHHHOOOLLLDDDEEERRRSSS CCCOOONNNSSSUUULLLTTTAAATTTIIIOOONNNSSS ... ... ... ... ... ... ... ... ... ... ... ... ... ... ... ... ... ... ... ... ... ... ... ... ... ... ... ... ... ... ... ... ... ... ... ... ... ... ... ... ... ... ... ... ... ... ... ... ... ... ... ... ... ... ... ... ... ... ... ... ... ... ... ... ... ... ... ... ... ... ... ... 222444 4.1 CITY OPINION SURVEY ........................................................................................................... 24 4.2 KEY ISSUES HIGHLIGHTED IN THE CONSULTATION MEETING ............................................ 24 4.2.1 SECTOR PRIORITISATION ........................................................................................................ 24 4.2.1.1 PHYSICAL INFRASTRUCTURE PRIORITY ................................................................................. 25 4.2.1.2 SOCIAL INFRASTRUCTURE PRIORITY: .................................................................................... 25 4.2.1.3 ENVIRONMENTAL ISSUES ....................................................................................................... 26 555 VVVIIISSSIIIOOONNN AAANNNDDD SSSTTTRRRAAATTTEEEGGGIIICCC PPPLLLAAANNN ... ... ... ... ... ... ... ... ... ... ... ... ... ... ... ... ... ... ... ... ... ... ... ... ... ... ... ... ... ... ... ... ... ... ... ... ... ... ... ... ... ... ... ... ... ... ... ... ... ... ... ... ... ... ... ... ... ... ... ... ... ... ... ... ... ... ... ... ... ... ... ... ... ... ... ... ... ... ... ... 222888 5.1 TOWN LEVEL SWOT ................................................................................................................. 28 5.2 VISION FORMULATION ........................................................................................................... 29 5.3 STRATEGY OPTION FOR ECONOMIC DEVELOPMENT....................................................... 29 666 HHHOOOUUUSSSIIINNNGGG IIINNNCCCLLLUUUDDDIIINNNGGG SSSLLLUUUMMMSSS ... ... ... ... ... ... ... ... ... ... ... ... ... ... ... ... ... ... ... ... ... ... ... ... ... ... ... ... ... ... ... ... ... ... ... ... ... ... ... ... ... ... ... ... ... ... ... ... ... ... ... ... ... ... ... ... ... ... ... ... ... ... ... ... ... ... ... ... ... ... ... ... ... ... ... ... ... ... ... ... ... 333333 6.1 EXISTING HOUSING SCENARIO ............................................................................................. 33 6.1.1 HOUSING CONDITION .................................................................................................................. 33 6.2 EXISTING SLUM SCENARIO .................................................................................................... 33 6.2.1 SLUM POPULATION ....................................................................................................................... 33 6.2.2 ISSUES .......................................................................................................................................... 33 6.3 ISSUES ........................................................................................................................................ 34 6.4 PROPOSAL ............................................................................................................................... 34 777 IIINNNSSSTTTIIITTTUUUTTTIIIOOONNNAAALLL FFFRRRAAAMMMEEEWWWOOORRRKKK ... ... ... ... ... ... ... ... ... ... ... ... ... ... ... ... ... ... ... ... ... ... ... ... ... ... ... ... ... ... ... ... ... ... ... ... ... ... ... ... ... ... ... ... ... ... ... ... ... ... ... ... ... ... ... ... ... ... ... ... ... ... ... ... ... ... ... ... ... ... ... ... ... ... ... ... ... ... ... ... 333555
Final Report: Madhavaram Municipality
- ii -
Voyants Solutions Private Limited
7.1 ELECTED COUNCIL ................................................................................................................. 35 7.2 EXECUTIVE WING .................................................................................................................... 36 7.2.1 GENERAL ADMINISTRATION .......................................................................................................... 36 7.2.2 HEALTH SECTION .......................................................................................................................... 37 7.2.3 ENGINEERING SECTION................................................................................................................. 37 7.2.4 TOWN PLANNING SECTION ........................................................................................................... 37 7.2.5 ACCOUNTS SECTION .................................................................................................................... 37 7.3 CITIZEN�S CHARTER ................................................................................................................. 38 7.4 INFORMATION CENTRE .......................................................................................................... 38 7.5 STAFF STRENGTH POSITION AND VACANCY POSITION .................................................... 38 7.6 ADDITIONAL STAFF REQUIREMENT: ...................................................................................... 40 7.7 INSTITUTIONAL FRAMEWORK FOR SERVICE DELIVERY ...................................................... 40 7.8 ORGANIZATION MANAGEMENT .......................................................................................... 41 888 UUURRRBBBAAANNN IIINNNFFFRRRAAASSSTTTRRRUUUCCCTTTUUURRREEE AAANNNDDD SSSEEERRRVVVIIICCCEEESSS ... ... ... ... ... ... ... ... ... ... ... ... ... ... ... ... ... ... ... ... ... ... ... ... ... ... ... ... ... ... ... ... ... ... ... ... ... ... ... ... ... ... ... ... ... ... ... ... ... ... ... ... ... ... ... ... ... ... 444222 8.1 WATER SUPPLY ........................................................................................................................ 42 8.1.1 EXISTING SCENARIO FOR WATER SUPPLY ........................................................................................ 42 8.1.2 STORAGE AND DISTRIBUTION ......................................................................................................... 44 8.1.3 PERFORMANCE INDICATORS ......................................................................................................... 44 8.1.4 ISSUES .......................................................................................................................................... 44 8.1.5 DEMAND SUPPLY SCENARIO ......................................................................................................... 45 8.1.6 PROPOSAL .................................................................................................................................. 45 8.2 SEWERAGE ............................................................................................................................... 45 8.2.1 SEWERAGE .................................................................................................................................. 45 8.2.2 ISSUES .......................................................................................................................................... 46 8.2.3 PROPOSAL BY MUNICIPALITY ........................................................................................................ 46 8.3 STORM WATER DRAINAGE .................................................................................................... 46 8.3.1 EXISTING CONDITION OF STORM WATER DRAINAGE ...................................................................... 46 8.3.2 PERFORMANCE INDICATORS ......................................................................................................... 47 8.3.3 ISSUES IN STORM WATER DRAINAGE AND HOUSEHOLD DRAINAGE .................................................. 47 8.3.4 PROPOSAL .................................................................................................................................. 47 8.4 SOLID WASTE MANAGEMENT ............................................................................................... 47 8.4.1 EXISTING SITUATION ...................................................................................................................... 47 8.4.2 PRIMARY COLLECTION ................................................................................................................. 48 8.4.3 SECONDARY COLLECTION ........................................................................................................... 49 8.4.4 ISSUES .......................................................................................................................................... 49 8.4.5 PROPOSAL .................................................................................................................................. 50 8.5 STREET LIGHTING ..................................................................................................................... 50 8.5.1 STATUS OF STREET LIGHTING .......................................................................................................... 50 8.5.2 PERFORMANCE INDICATORS ......................................................................................................... 50 8.5.3 ISSUES .......................................................................................................................................... 50 8.5.4 PROPOSAL .................................................................................................................................. 51 8.6 ROAD ....................................................................................................................................... 51 8.6.1 TOWN LEVEL ROAD NETWORK AND HIERARCHY ............................................................................ 51 8.6.2 PARKING ..................................................................................................................................... 51 8.6.3 TRUCK TERMINUS .......................................................................................................................... 52 8.6.4 PERFORMANCE INDICATORS ......................................................................................................... 52
Final Report: Madhavaram Municipality
- iii -
Voyants Solutions Private Limited
8.6.5 PUBLIC TRANSPORT SYSTEM ........................................................................................................... 52 8.6.6 ISSUES .......................................................................................................................................... 52 8.6.7 PROPOSALS ................................................................................................................................. 52 8.7 SOCIAL INFRASTRUCTURE FACILITIES ................................................................................... 53 8.7.1 EDUCATIONAL FACILITIES .............................................................................................................. 53 8.7.2 EXISTING SCENARIO IN EDUCATIONAL FACILITIES ............................................................................ 53 8.7.3 ISSUES IN EDUCATIONAL SECTOR ................................................................................................... 53 8.7.4 PROPOSAL .................................................................................................................................. 53 8.7.5 HEALTH FACILITIES ........................................................................................................................ 53 8.7.6 ISSUES .......................................................................................................................................... 54 8.7.7 PROPOSAL .................................................................................................................................. 54 8.7.8 PUBLIC CONVENIENCE ................................................................................................................. 54 8.7.9 PROPOSAL .................................................................................................................................. 55 8.7.10 MARKET FACILITIES........................................................................................................................ 55 8.7.11 BURIAL GROUND .......................................................................................................................... 56 8.7.12 ISSUES .......................................................................................................................................... 56 8.7.13 PROPOSAL .................................................................................................................................. 56 8.7.14 PARKS AND PLAYGROUND FACILITIES ............................................................................................. 56 8.7.15 PROPOSAL .................................................................................................................................. 57 999 MMMUUUNNNIIICCCIIIPPPAAALLL FFFIIINNNAAANNNCCCEEE ... ... ... ... ... ... ... ... ... ... ... ... ... ... ... ... ... ... ... ... ... ... ... ... ... ... ... ... ... ... ... ... ... ... ... ... ... ... ... ... ... ... ... ... ... ... ... ... ... ... ... ... ... ... ... ... ... ... ... ... ... ... ... ... ... ... ... ... ... ... ... ... ... ... ... ... ... ... ... ... ... ... ... ... ... ... ... ... ... ... ... ... ... ... ... ... 555888 9.1 OVERVIEW ............................................................................................................................... 58 9.2 GENERAL DETAILS ................................................................................................................... 58 9.3 RECEIPTS ................................................................................................................................... 58 9.3.1 PROPERTY TAX ............................................................................................................................. 58 9.3.2 PROFESSION TAX .......................................................................................................................... 60 9.3.3 ASSIGNED REVENUES .................................................................................................................... 61 9.3.4 REVENUE DEVOLUTION FUNDS IN AID OF REVENUE EXPENDITURE ...................................................... 62 9.3.5 WATER CHARGES ........................................................................................................................ 62 9.3.6 DRAINAGE CHARGES................................................................................................................... 63 9.3.7 SERVICE CHARGES & FEES ........................................................................................................... 63 9.3.8 INCOME FROM PROPERTIES & OTHER INCOME............................................................................... 63 9.4 EXPENDITURE ........................................................................................................................... 64 9.4.1 ESTABLISHMENT EXPENSES ............................................................................................................. 64 9.4.2 O&M EXPENSES � WATER SUPPLY ................................................................................................ 65 9.4.3 O&M EXPENSES � STREET LIGHTS & OTHERS .................................................................................. 65 9.4.4 ADMINISTRATION & OTHER EXPENSES ............................................................................................ 66 9.5 SUMMARY OF FINANCES ....................................................................................................... 66 9.6 KEY FINANCIAL INDICATORS ................................................................................................ 70 9.7 MEASURES TO BE TAKEN FOR IMPROVING COLLECTION EFFICIENCY ............................ 72 111000 CCCAAAPPPIIITTTAAALLL IIINNNVVVEEESSSTTTMMMEEENNNTTT NNNEEEEEEDDDSSS FFFOOORRR IIIDDDEEENNNTTTIIIFFFIIIEEEDDD PPPRRROOOJJJEEECCCTTTSSS ... ... ... ... ... ... ... ... ... ... ... ... ... ... ... ... ... ... ... ... ... ... ... ... ... ... ... ... 777555 10.1 PHYSICAL INFRASTRUCTURE - IMPROVEMENT NEEDS ...................................................... 75 10.1.1 WATER SUPPLY:............................................................................................................................ 75 10.1.2 SEWERAGE SYSTEM ....................................................................................................................... 76 10.1.3 STORM WATER DRAINAGE ............................................................................................................ 76 10.1.4 SOLID WASTE MANAGEMENT ....................................................................................................... 77 10.1.5 STREET LIGHT ................................................................................................................................ 79

Final Report: Madhavaram Municipality
- iv -
Voyants Solutions Private Limited
10.1.6 ROADS AND TRANSPORTATION ...................................................................................................... 80 10.1.7 EDUCATIONAL INSTITUTIONS .......................................................................................................... 81 10.1.8 HEALTH FACILITIES ........................................................................................................................ 81 10.1.9 PUBLIC CONVENIENCE ................................................................................................................. 83 10.1.10 PARKS AND PLAY GROUND .......................................................................................................... 83 10.1.11 MARKET ...................................................................................................................................... 84 10.1.12 BURIAL GROUND DEVELOPMENT .................................................................................................. 85 10.1.13 SLUM IMPROVEMENT .................................................................................................................... 85 10.1.14 SYSTEM IMPROVEMENT GIS PLATFORM .......................................................................................... 86 10.2 OTHER PROJECTS .................................................................................................................... 86 10.3 OTHER DEPARTMENT PROJECTS ........................................................................................... 87 10.4 PROPOSED UNDER CDP FOR CHENNAI METROPOLITAN AREA ..................................... 88 10.5 SUMMARY OF CAPITAL INVESTMENTS ................................................................................. 89 111111 RRRIIISSSKKK AAANNNDDD MMMIIITTTIIIGGGAAATTTIIIOOONNN MMMEEEAAASSSUUURRREEESSS ... ... ... ... ... ... ... ... ... ... ... ... ... ... ... ... ... ... ... ... ... ... ... ... ... ... ... ... ... ... ... ... ... ... ... ... ... ... ... ... ... ... ... ... ... ... ... ... ... ... ... ... ... ... ... ... ... ... ... ... ... ... ... ... ... ... ... ... ... ... ... ... 999111 11.1 PROJECT RISK AND MITIGATION MEASURES ...................................................................... 91 111222 RRREEEFFFOOORRRMMMSSS AAANNNDDD AAACCCTTTIIIOOONNN PPPLLLAAANNN ... ... ... ... ... ... ... ... ... ... ... ... ... ... ... ... ... ... ... ... ... ... ... ... ... ... ... ... ... ... ... ... ... ... ... ... ... ... ... ... ... ... ... ... ... ... ... ... ... ... ... ... ... ... ... ... ... ... ... ... ... ... ... ... ... ... ... ... ... ... ... ... ... ... ... ... ... ... ... ... ... ... 999555 12.1 PRESENT SCENARIO IN URBAN REFORMS ........................................................................... 95 12.2 PROPOSED INTERVENTIONS AT STATE LEVEL ...................................................................... 96 12.3 PROPOSED INTERVENTION AT MUNICIPAL LEVEL ............................................................ 102 12.3.1 REFORMS IN RESOURCE MOBILISATION ........................................................................................ 102 12.3.2 ACTION PLAN : IMPROVING REVENUE FROM OWN SOURCES ........................................................ 102 12.3.3 ACTION PLAN : IMPROVING REVENUE FROM USER CHARGES ........................................................ 104 12.3.4 ACTION PLAN: FORMATION OF NEW SUSTAINABLE REVENUE BASES ................................................ 105 12.3.5 ACTION PLAN: PRIVATISATION INITIATIVES .................................................................................... 107 12.3.6 ACTION PLAN: ENERGY & RESOURCE EFFICIENCY ........................................................................ 108 12.3.7 ACTION PLAN: COMPUTERIZATION AND E-GOVERNANCE............................................................. 111 12.3.8 ACTION PLAN: ACCOUNTS AND AUDITING ................................................................................. 112 12.3.9 ACTION PLAN: INSTITUTIONAL MANAGEMENT .............................................................................. 112 12.3.10 A. CAPACITY BUILDING FOR ELECTED REPRESENTATIVES AND COMMITTEE MEMBERS ...................... 113 12.3.11 B. CAPACITY BUILDING FOR ULB STAFF ....................................................................................... 114 12.3.12 REFORMS IN MUNICIPAL SERVICE DELIVERY ................................................................................. 117 111333 AAASSSSSSEEETTT MMMAAANNNAAAGGGEEEMMMEEENNNTTT PPPLLLAAANNN ... ... ... ... ... ... ... ... ... ... ... ... ... ... ... ... ... ... ... ... ... ... ... ... ... ... ... ... ... ... ... ... ... ... ... ... ... ... ... ... ... ... ... ... ... ... ... ... ... ... ... ... ... ... ... ... ... ... ... ... ... ... ... ... ... ... ... ... ... ... ... ... ... ... ... ... ... ... ... ... ... ... ... 111111888 13.1 ACTIVITIES OF ASSET MANAGEMENT PLAN (AMP) .......................................................... 118 13.2 INFRASTRUCTURE ASSETS ..................................................................................................... 119 13.2.1 MOVABLE AND IMMOVABLE ASSETS ............................................................................................ 119 13.3 PRIORITY ASSET MANAGEMENT OPTIONS......................................................................... 120 13.4 PROPOSED NEW ASSETS ...................................................................................................... 121 111444 FFFIIINNNAAANNNCCCIIIAAALLL AAANNNDDD OOOPPPEEERRRAAATTTIIINNNGGG PPPLLLAAANNN ... ... ... ... ... ... ... ... ... ... ... ... ... ... ... ... ... ... ... ... ... ... ... ... ... ... ... ... ... ... ... ... ... ... ... ... ... ... ... ... ... ... ... ... ... ... ... ... ... ... ... ... ... ... ... ... ... ... ... ... ... ... ... ... ... ... ... ... ... ... ... 111222333 14.1 CAPITAL INVESTMENT PLAN ................................................................................................ 123 14.2 OTHER PROJECTS AND ON GOING PROJECTS ............................................................... 125 14.3 MEANS OF FINANCE ............................................................................................................ 126 14.4 FINANCIAL SUSTAINABILITY ................................................................................................. 132 14.5 BASIC ASSUMPTIONS FOR PROJECTIONS : ....................................................................... 132 14.5.1 INCOME .................................................................................................................................... 133 14.5.2 EXPENDITURE ............................................................................................................................. 138 14.5.3 COLLECTIONS ............................................................................................................................ 140
Final Report: Madhavaram Municipality
- v -
Voyants Solutions Private Limited
14.6 ANNUITY FACTOR ................................................................................................................. 141 14.7 PROJECT CASH FLOWS AND FOP RESULTS : .................................................................... 141 14.8 IMPACT OF POTENTIAL IMPROVEMENTS ........................................................................... 149 14.9 SCENARIO I - ESTIMATION OF INVESTMENT CAPACITY ON AS IS WHERE BASIS ......... 150 14.10 SCENARIO II - ESTIMATION OF BORROWING AND INVESTMENT CAPACITY WITH
PROJECTS .............................................................................................................................. 150 14.11 KEY INDICATORS OF SCENARIO II ...................................................................................... 151 14.12 INFERENCE ............................................................................................................................. 151 AAANNNNNNEEEXXXUUURRREEE ... ... ... ... ... ... ... ... ... ... ... ... ... ... ... ... ... ... ... ... ... ... ... ... ... ... ... ... ... ... ... ... ... ... ... ... ... ... ... ... ... ... ... ... ... ... ... ... ... ... ... ... ... ... ... ... ... ... ... ... ... ... ... ... ... ... ... ... ... ... ... ... ... ... ... ... ... ... ... ... ... ... ... ... ... ... ... ... ... ... ... ... ... ... ... ... ... ... ... ... ... ... ... ... ... ... ... ... ... ... ... ... ... ... ... ... ... ... ... ... ... ... ... ... ... 111555444
Final Report: Madhavaram Municipality
- vi -
Voyants Solutions Private Limited
LLLIIISSSTTT OOOFFF FFFIIIGGGUUURRREEESSS
Figure 2-1: Regional Setting of Madhavaram Municipality ............................................................. 15
Figure 3-1: Growth Direction .................................................................................................................. 20
Figure 3-2: CMA � Existing Land use 2006 - Madhavaram............................................................... 21
Figure 3-3: Proposed Land use 2026 - Madhavaram ....................................................................... 21
Figure 3-4: Town Map � Madhavaram municipality ......................................................................... 22
Figure 4-1: Priorities for Physical Infrastructure .................................................................................... 25
Figure 4-2: Priorities for Social Infrastructure........................................................................................ 26
Figure 4-3: Priorities for Environmental Protection ............................................................................. 27
Figure 6-1: Housing Condition ............................................................................................................... 33
Figure 7-1: Organisational structure of Madhavaram Municipality ............................................... 36
Figure 8-1: Water Supply Layout in Madhavaram Municipality ..................................................... 43
Final Report: Madhavaram Municipality
- vii -
Voyants Solutions Private Limited
LLLIIISSSTTT OOOFFF TTTAAABBBLLLEEESSS
Table 2-1: Urban Population Share in the Town and the Region ................................................... 16
Table 2-2: Population Growth in Madhavaram Municipality.......................................................... 16
Table 2-3: Population projection .......................................................................................................... 16
Table 2-4: Comparative Sex Ratio........................................................................................................ 17
Table 2-5: Comparative Literacy .......................................................................................................... 17
Table 3-1: Work Force Participation Ratio in Madhavaram Town ................................................. 18
Table 3-2: classification of Main Workers in Madhavaram Town ................................................... 19
Table 5-1: Town level SWOT ................................................................................................................... 28
Table 7-1: Staff Strength and Additional Staff Requirement ........................................................... 38
Table 7-2: Additional Staff Requirement ............................................................................................. 40
Table 7-3: Institutional Framework for Urban Service Delivery ........................................................ 40
Table 8-1: General details of Water Supply ........................................................................................ 42
Table 8-2: Demand supply gap for project population ................................................................... 45
Table 8-3: Status of UGSS proposals ..................................................................................................... 46
Table 8-4 � Existing Strom water Condition ......................................................................................... 47
Table 8-5 � SWM-General details .......................................................................................................... 47
Table 8-6 � Sources of Waste Generation .......................................................................................... 48
Table 8-7: Solid Waste Collection in Madhavaram Town ............................................................... 49
Table 8-8: Existing Street Light and energy consumption ................................................................ 50
Table 8-9: Types of Roads in Madhavaram Municipality ................................................................. 51
Table 8-10: Existing Educational facilities in Madhavaram Town ................................................... 53
Table 8-11: Classification of modes of sanitary waste disposal by type ....................................... 54
Table 8-12: Existing public toilets facilities ........................................................................................... 55
Table 8-13: Existing park and open space ......................................................................................... 56
Table 9-1: Property Tax Components .................................................................................................. 59
Table 9-2: Property Tax Assessments .................................................................................................... 59
Table 9-3: Property Tax � Growth during last 6 years ........................................................................ 59
Table 9-4: Property Tax � Demand Collection % (Rs. in lacs) .......................................................... 59
Table 9-5: Profession Tax � Growth during last 6 years ..................................................................... 60
Table 9-6: Profession Tax � Demand Collection % (Rs. in lacs) ....................................................... 60
Table 9-7: Assigned Revenue � Growth & % of Total Income (Rs. in lacs) .................................... 61
Table 9-8: Devolution Fund � Growth & % of Total Income (Rs. in lacs) ........................................ 62
Table 9-9: Salary of Employers ............................................................................................................... 63
Table 9-10: Service Charges & Fees � Growth & % of Total Income (Rs. in lacs) ........................ 63
Table 9-11: Income from Properties & Other Income � Growth & % of Total Income (Rs. in
lacs) ............................................................................................................................................................ 64
Table 9-12: Non Tax Income � Demand Collection % (Rs. in lacs) ................................................. 64
Table 9-13: Establishment Expenses � Growth & % of Total Expenditure (Rs. in lacs) ................. 65
Table 9-14: O&M Expenses (Water Supply) � Growth & % of Total Expenditure (Rs. in lacs) .... 65
Table 9-15: O&M Expenses (Street Lights & Others) � Growth & % of Total Expt (Rs. in lacs) .... 66
Table 9-16: Administration Expenses � Growth & % of Total Expenditure (Rs. in lacs) ................ 66
Table 9-17: Summary of Finances for last 6 years (Rs. in lacs) ......................................................... 66
Table 9-18: Head-wise Income & Expenditure for last 6 years (Rs. in lacs)................................... 67
Table 9-19: Borrowings of the Municipality (Rs. in lacs) .................................................................... 68
Final Report: Madhavaram Municipality
- viii -
Voyants Solutions Private Limited
Table 9-20: Status of Contributions & Grants ...................................................................................... 69
Table 9-21: Resource Mobilisation Indicators ..................................................................................... 70
Table 9-22: Fund Application Indicators ............................................................................................. 71
Table 9-23: Liability Management Indicators ..................................................................................... 71
Table 9-24: Financial Performance Indicators ................................................................................... 72
Table 9-25: Efficiency Indicators ........................................................................................................... 72
Table 10-1: Graded tariff structure - UGSS .......................................................................................... 76
Table 10-2: Capital Investment Needs for the Storm Water Drains ............................................... 77
Table 10-3: Capital Investment Needs for the Solid Waste Management .................................. 78
Table 10-4: Capital Investment Needs for the Street Light .............................................................. 79
Table 10-5: Capital Investment Needs for the Road and Transportation..................................... 80
Table 10-6: Capital Investment Needs for the Educational Institutions ........................................ 81
Table 10-7: Capital Investment Needs for the Maternity center .................................................... 82
Table 10-8: Capital Investment Needs for Public Conveniences .................................................. 83
Table 10-9: Capital Investment Needs for the Parks and Play Grounds ....................................... 83
Table 10-10: Capital Investment Needs for Market .......................................................................... 84
Table 10-11: Capital Investment Needs for Burial Ground Development .................................... 85
Table 10-12: Capital Investment Needs for Slum Improvement ..................................................... 85
Table 10-13: Capital Investment Needs for System Improvement and e-Governance ............ 86
Table 10-14: Capital Investment Needs for Other projects ............................................................. 87
Table 10-15: Projects to be taken by other departments ................................................................ 88
Table 10-16: Summary of Investment plan � Chennai Metropolitan Area ................................... 88
Table 10-17: Summary of Capital Investment .................................................................................... 89
Table 11-1: As per the Guidelines on Environmental & Social Concerns of CCCBP projects �
Madhavaram .............................................................................................................................................. 91
Table 12-1: Road Map - Improving revenue from own sources ................................................... 104
Table 12-2: Road Map improving revenue from user charges ..................................................... 105
Table 12-3: Road Map for Formation of new sustainable revenue bases ................................. 106
Table 12-4: Road Map for Privatization initiatives ............................................................................ 108
Table 12-5: Road Map for Energy and Resource efficiency ......................................................... 109
Table 12-6: Central and state government incentives .................................................................. 110
Table 12-7: Wind Energy Generator project details - Abstract .................................................... 110
Table 12-8: Road Map for Computerization and E-Governance ................................................ 112
Table 12-9: Road Map for Accounts & auditing and Industrial Management ......................... 113
Table 12-10: Technical Assistance for Elected representatives .................................................... 113
Table 12-11: Technical Assistance for ULB staff ................................................................................ 114
Table 12-12: Road map for implementation of all projects .......................................................... 116
Table 12-13: Road map Reform Agenda Municipal Service Delivery ........................................ 117
Table 13-1: Land Assets � Proposed use ............................................................................................ 120
Table 13-2: Income from Proposed new Projects ........................................................................... 121
Table 13-3: New Assets for the year -2009-10 to 2013 -14 .............................................................. 122
Table 14-1: Projects to be executed by the Municipality .............................................................. 123
Table 14-2: Projects to be executed by Other Agencies .............................................................. 125
Table 14-3:Projects under Implementation by the Municipality .................................................. 126
Table 14-4: Multi Year Investment Plan and Means of Finance ................................................... 127
Table 14-5: Consolidated Means of Finance .................................................................................. 131

Final Report: Madhavaram Municipality
- ix -
Voyants Solutions Private Limited
Table 14-6: Ratio of Property tax ........................................................................................................ 133
Table 14-7: Water supply Charges � Existing .................................................................................... 134
Table 14-8: House Service Connections � Percentage .................................................................. 135
Table 14-9: Sewage Charges .............................................................................................................. 136
Table 14-10: Assumptions - Increase in Expenditure ....................................................................... 138
Table 14-11: Assumptions � O&M ....................................................................................................... 138
Table 14-12: Assumptions � Provision of doubtful debts ................................................................. 140
Table 14-13: Assumptions � Property tax collection ........................................................................ 140
Table 14-14: Assumptions � Profession tax ........................................................................................ 140
Table 14-15: Assumptions � Other Non Tax Income ........................................................................ 140
Table 14-16: Assumptions � Water Charges ..................................................................................... 140
Table 14-17: Assumptions � Drainage Charges ............................................................................... 141
Table 14-18: Terms of Loan Funding for Proposed Investments .................................................... 141
Table 14-19: Consolidated Income & Expenditure for next 20 years (up to FY 2028-29)......... 143
Table 14-20: Consolidated Balance Sheet for next 20 years (up to FY 2028 � 29) .................... 145
Table 14-21: Key Indicators .................................................................................................................. 151
Chapter - 1 Final Report: Madhavaram Municipality
- 10 -
Voyants Solutions Private Limited
111 BBBAAACCCKKKGGGRRROOOUUUNNNDDD AAANNNDDD MMMEEETTTHHHOOODDDOOOLLLOOOGGGIIICCCAAALLL FFFRRRAAAMMMEEEWWWOOORRRKKK OOOFFF TTTHHHEEE SSSTTTUUUDDDYYY
1.1 BACKGROUND
The Tamil Nadu Urban Infrastructure Financial Services Limited (TNUIFSL) aims to assist
Madhavaram Municipality in strengthening and improving its financial position for
effective capital investment management and urban service delivery. The
municipality has good potential for immediate implementation of financial reforms
for which it is essential to formulate a City Corporate Cum Business Plan (CCCBP).
The CMA and TNUIFSL have initiated the process of preparing CCCBP for the
municipality with the vision of stakeholders growth of the town.
1.2 OBJECTIVES
The objective of this exercise is to visualise the town in the next 25 -30 years and
1. Define the growth direction and service up-gradations in relation to the
activity mix / growth;
2. Assess the demand for the projects specified by the ULB, and come out with
gap in services with respect to the vision;
3. Broadly outline the infrastructure needs;
4. Define specific rehabilitation of infrastructure and capital improvement needs
with regard to provision of infrastructure in slums and other areas;
5. Indicate the priority of projects
6. Define revenue enhancement and revenue management improvements
required to sustain the rehabilitation proposed;
7. Suggest reforms required in local administration and service delivery including
public private partnership in infrastructure development
8. Suggest Measures to address common growth and infrastructure issues and to
promote integrated development
1.3 SCOPE OF WORK:
The scope of work covers the following:
1. To assess the demand for the Projects listed out by these municipalities.
2. Financial Assessment of the ULBS- an assessment of the ULB finances for the past
5 years, in terms of sources and uses of funds, base and basis of levy, revision
history and impacts, state assignment and transfer-base and basis of transfer
and its predictability; use of funds outstanding liabilities (loans, power dues,
pension etc) and a review of revenue and service management
arrangements. Levels of service and quality of municipal services in both poor

Chapter - 1 Final Report: Madhavaram Municipality
- 11 -
Voyants Solutions Private Limited
and non-poor localities. Staffing and management arrangements in delivery of
services.
3. Outline issues in revenue realisation, quality of existing assets in relation to
service levels and coverage and institutional constraints. Develop quick
indicators of performance, based on the following:
Current coverage and additional population during medium term (10 years)
Unit cost indicates city level investment requirements for Up-gradation of
city wide infrastructures.
To improve service coverage and asset quality
Define priority assets and indicative costs of rehabilitation
Conduct fiscal impact analysis of investments: life-cycle of O&M costs,
revenues from project and costs/impacts on finances and of not doing the
project.
Explore funding options for rehabilitation facilities.
4. Prepare a financial and operating plan (FOP). The FOP in the medium time frame
works for the ULBs and shall present the following.
A. Areas of reduction in expenditure
Energy audit resulting in savings energy.
Leak detection resulting either in connection or in the tariff (or)
Privatizing the MSW collection and identifying a BoT operator for eliminating,
composting etc, items of revenue can be identified.
Laying of cement concrete road /Fly ash and savings on a maintenance cost
resulting in increasing operating surplus.
Water recycling /refuse
Rejuvenation of tanks and reduction of cost/liters of water produced
Privatization & options for raising revenue
C. Options for increasing the revenues through non traditional methods
Land development for raising revenues
Suggestions for improvement of revenues.
5 Prepare a draft Memorandum of Association (MoA) between ULB and TNUIFSL.
The MoA will act as the base line (based on the situation Analysis) and the
Performance Benchmarks to be monitored along with other financial targets
and outputs from the financial and operating plan.
5. Initiate consultations with council and local stakeholders on the priorities
redefine priorities.
6. Finalize Action plan for the city, with a resolution from the council on the
priorities and commitment to implement revenue and management
improvement measures.
1.4 STAGE III: DRAFT FINAL STAGE
Under this stage of City Corporate cum Business Plan has two tasks.
1. In the First Task, Financial and Operating Plan (FOP) will be prepared outlining
Chapter - 1 Final Report: Madhavaram Municipality
- 12 -
Voyants Solutions Private Limited
the revenue enhancement measures required to sustain proposed
investments after accounting for O&M and debt servicing requirements.
Suggest suitable actions for project sizing and/or project implementation and
action plan to sustain investments based on capital investment needs listed
above. It will also suggest suitable actions for project sizing and/or project
implementation and action plans to sustain investments based on the capital
investment needs.
2. In the 2nd Task Draft MoA between ULB and TNUIFSL will be prepared.
The final stage would incorporate the Municipal Council resolution passed by the
Municipal Council to effectively implement the proposed urban reforms in the
CCCBP.
1.5 PRESENTATION AND DISCUSSION WITH REVIEW COMMITTEE
The review meeting for Revised Draft Final Report was held on 24th June 2009 at the
office of TNUIFSL. The minutes of the meeting and the consultants reply are given
below:
COMMON POINTS
1. To correct the grade of the ULBs as revised by the Government.
The grades of the Municipalities have been updated as per the latest revisions.
2. To highlight the requirement of capital / revenue grant to implement and
operate all the new schemes.
The actual requirement of capital / revenue grant for each town along with the
funding pattern has been clearly indicated in section 14.1& 14.3 of chapter14.
3. To indicate following in the executive summary of the report
a) List of projects under the sustainable scenario along with the year wise
phasing of the projects identified.
b) The assumption made on the means of finance.
The list of projects, year wise phasing and the assumptions made on the means of
finance have been added in the executive summary under the table � Projects
Identified for implementation based on financial position� in the executive
summaries.
Chapter - 1 Final Report: Madhavaram Municipality
- 13 -
Voyants Solutions Private Limited
TOWN SPECIFIC COMMENT
Madhavaram
The consultants were requested to revise the assumptions on means of
finance in accordance with JNNURM norms and revise the FOP
accordingly.
The means of Finance for Madhavaram have been revised as per JnNURM
scheme. The assumptions are give in the table �Projects Identified for
implementation based on financial position� in the executive summary.
The minutes of meeting for review committee held during this period of study is given
in Annexure I d.
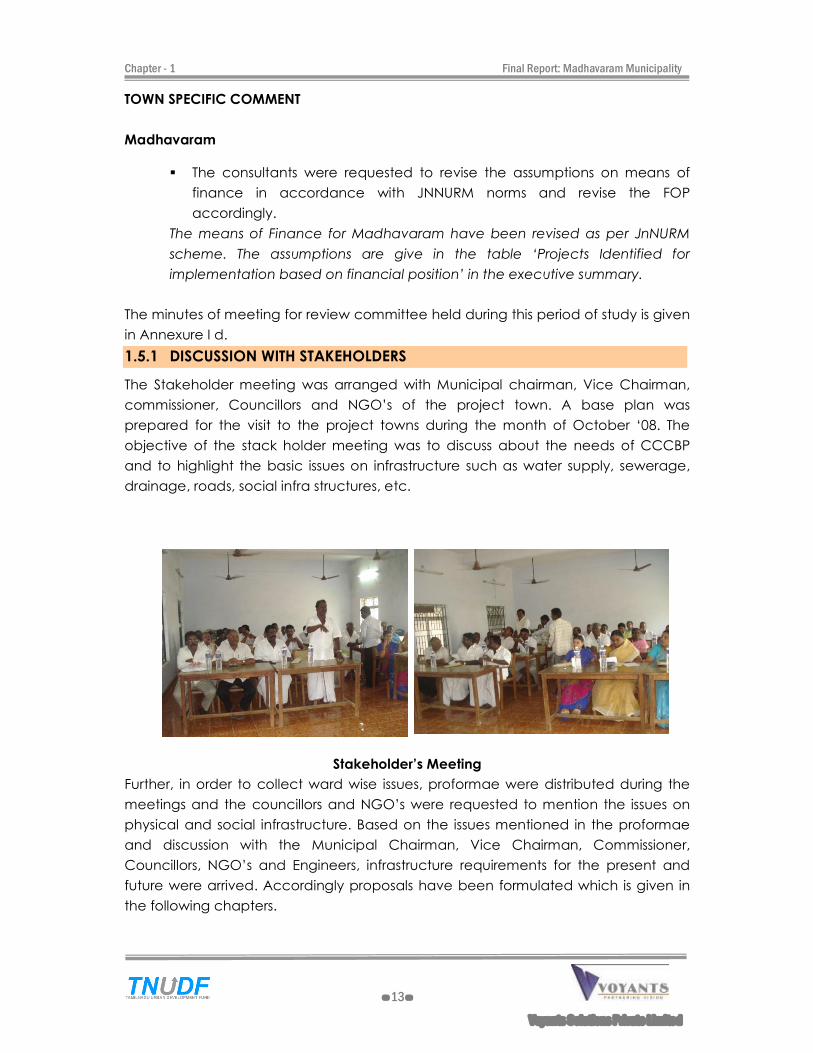
1.5.1 DISCUSSION WITH STAKEHOLDERS
The Stakeholder meeting was arranged with Municipal chairman, Vice Chairman,
commissioner, Councillors and NGO�s of the project town. A base plan was
prepared for the visit to the project towns during the month of October �08. The
objective of the stack holder meeting was to discuss about the needs of CCCBP
and to highlight the basic issues on infrastructure such as water supply, sewerage,
drainage, roads, social infra structures, etc.
Stakeholder�s Meeting
Further, in order to collect ward wise issues, proformae were distributed during the
meetings and the councillors and NGO�s were requested to mention the issues on
physical and social infrastructure. Based on the issues mentioned in the proformae
and discussion with the Municipal Chairman, Vice Chairman, Commissioner,
Councillors, NGO�s and Engineers, infrastructure requirements for the present and
future were arrived. Accordingly proposals have been formulated which is given in
the following chapters.
Chapter - 2 Final Report: Madhavaram Municipality
- 14 -
Voyants Solutions Private Limited
222 TTTOOOWWWNNN PPPRRROOOFFFIIILLLEEE
2.1 MADHAVARAM . . . TOWN PROFILE
Madhavaram is a special grade municipality located in the northern Suburb of
Chennai city in Thiruvallur District with a total population of 76093. The extent of
Madhavaram municipality is 17.4 sq.km and was formed in the year 1970.
The �Madhavaram Milk Dairy �, at Madhavaram is the first state owned co-operative
milk producing unit of �Aavin�. The town has a University for Animal Husbandry and
Veterinary Sciences, Horticulture Centre and Palm center within its limits.
Madhavaram municipality is geographically located at 13.15° N Latitude 80.24° E
Longitude.
This Municipality has 30 wards. Madhavaram is the head quarters of Ponneri Taluk.
The average elevation of the town is 13 metres (42 feet) above MSL.
The nearest Airport is at Chennai situated at a distance 25 km from the town.
2.2 HISTORY OF THE MUNICIPALITY
As per G.O Ms 2394 RDRLA dt 19.11.1970 Madhavaram panchayat was constituted
into 3rd grade township, and then Upgraded to 2nd grade municipality vide G.O
M.S.114 Municipal Administration and Water supply department dt 31.05.1994 and
further upgraded from 2nd Grade Municipality to 1st Grade Municipality w.e.f
22.05.1998. The Madhavaram Municipality was upgraded as special grade
municipality as per G.O (MS) No 238 dt 2.12.2008.
Chapter - 2 Final Report: Madhavaram Municipality
- 15 -
Voyants Solutions Private Limited
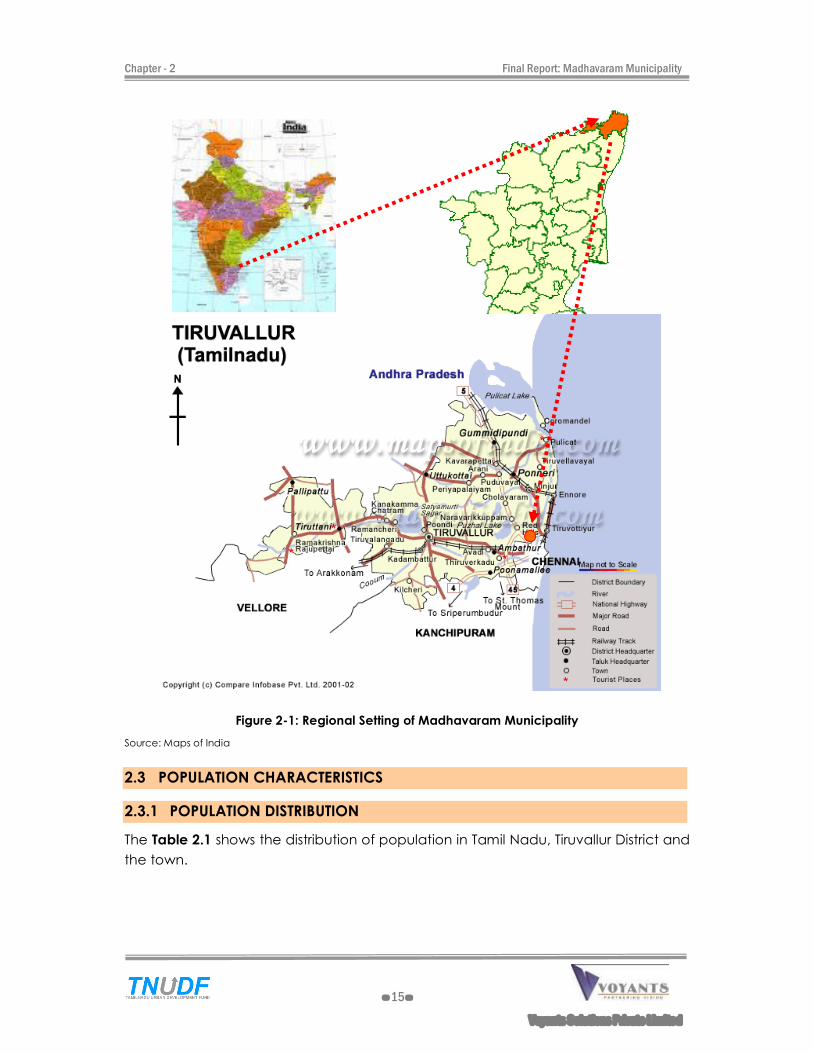
Figure 2-1: Regional Setting of Madhavaram Municipality
Source: Maps of India
2.3 POPULATION CHARACTERISTICS
2.3.1 POPULATION DISTRIBUTION
The Table 2.1 shows the distribution of population in Tamil Nadu, Tiruvallur District and
the town.
Chapter - 2 Final Report: Madhavaram Municipality
- 16 -
Voyants Solutions Private Limited
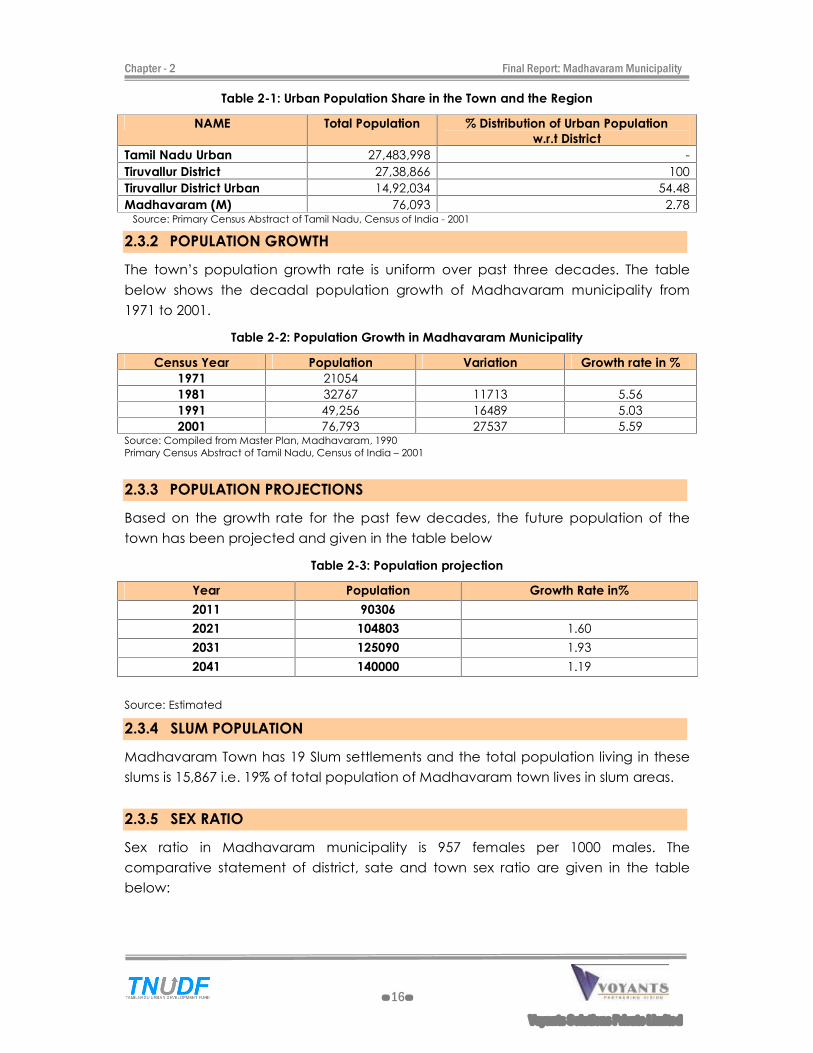
Table 2-1: Urban Population Share in the Town and the Region
NAME Total Population % Distribution of Urban Population
w.r.t District
Tamil Nadu Urban 27,483,998 -
Tiruvallur District 27,38,866 100
Tiruvallur District Urban 14,92,034 54.48
Madhavaram (M) 76,093 2.78 Source: Primary Census Abstract of Tamil Nadu, Census of India - 2001
2.3.2 POPULATION GROWTH
The town�s population growth rate is uniform over past three decades. The table
below shows the decadal population growth of Madhavaram municipality from
1971 to 2001.
Table 2-2: Population Growth in Madhavaram Municipality
Census Year Population Variation Growth rate in %
1971 21054
1981 32767 11713 5.56
1991 49,256 16489 5.03
2001 76,793 27537 5.59 Source: Compiled from Master Plan, Madhavaram, 1990
Primary Census Abstract of Tamil Nadu, Census of India � 2001
2.3.3 POPULATION PROJECTIONS
Based on the growth rate for the past few decades, the future population of the
town has been projected and given in the table below
Table 2-3: Population projection
Year Population Growth Rate in%
2011 90306
2021 104803 1.60
2031 125090 1.93
2041 140000 1.19
Source: Estimated
2.3.4 SLUM POPULATION
Madhavaram Town has 19 Slum settlements and the total population living in these
slums is 15,867 i.e. 19% of total population of Madhavaram town lives in slum areas.
2.3.5 SEX RATIO
Sex ratio in Madhavaram municipality is 957 females per 1000 males. The
comparative statement of district, sate and town sex ratio are given in the table
below:
Chapter - 2 Final Report: Madhavaram Municipality
- 17 -
Voyants Solutions Private Limited
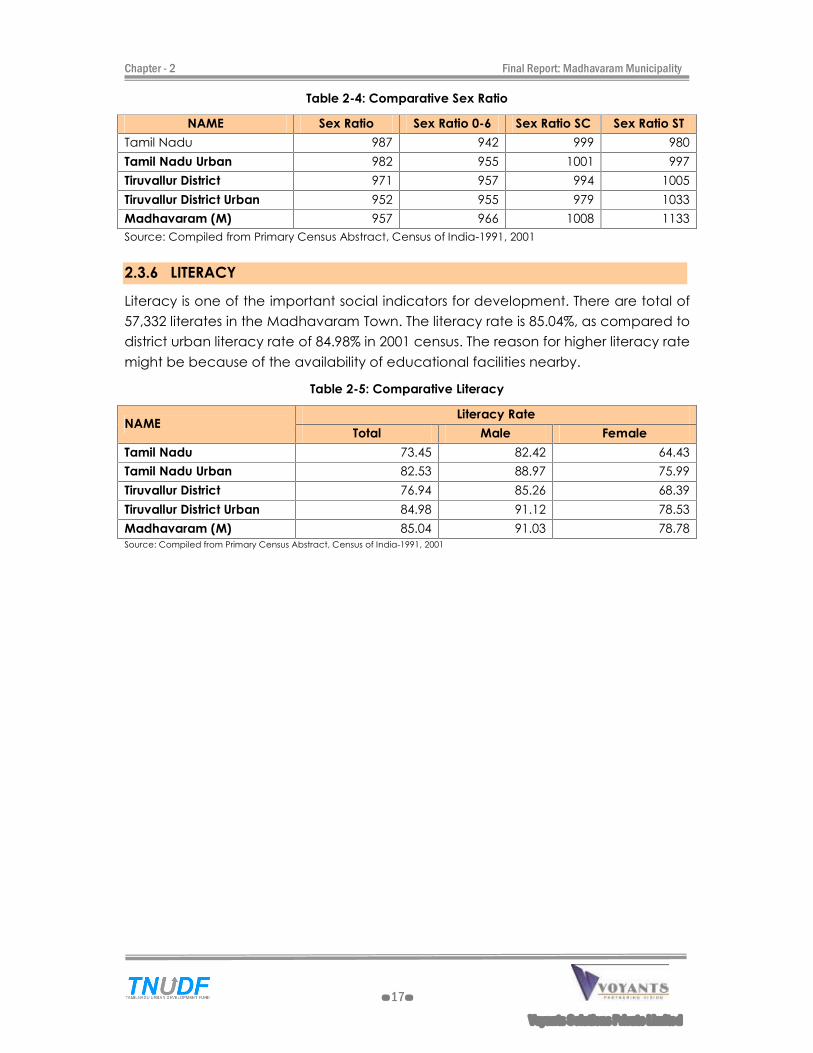
Table 2-4: Comparative Sex Ratio
NAME Sex Ratio Sex Ratio 0-6 Sex Ratio SC Sex Ratio ST
Tamil Nadu 987 942 999 980
Tamil Nadu Urban 982 955 1001 997
Tiruvallur District 971 957 994 1005
Tiruvallur District Urban 952 955 979 1033
Madhavaram (M) 957 966 1008 1133
Source: Compiled from Primary Census Abstract, Census of India-1991, 2001
2.3.6 LITERACY
Literacy is one of the important social indicators for development. There are total of
57,332 literates in the Madhavaram Town. The literacy rate is 85.04%, as compared to
district urban literacy rate of 84.98% in 2001 census. The reason for higher literacy rate
might be because of the availability of educational facilities nearby.
Table 2-5: Comparative Literacy
NAME Literacy Rate
Total Male Female
Tamil Nadu 73.45 82.42 64.43
Tamil Nadu Urban 82.53 88.97 75.99
Tiruvallur District 76.94 85.26 68.39
Tiruvallur District Urban 84.98 91.12 78.53
Madhavaram (M) 85.04 91.03 78.78
Source: Compiled from Primary Census Abstract, Census of India-1991, 2001
Chapter - 3 Final Report: Madhavaram Municipality
- 18 -
Voyants Solutions Private Limited
333 EEECCCOOONNNOOOMMMIIICCC DDDEEEVVVEEELLLOOOPPPMMMEEENNNTTT AAANNNDDD PPPHHHYYYSSSIIICCCAAALLL PPPLLLAAANNNNNNIIINNNGGG
3.1 URBAN ECONOMIC DEVELOPMENT - SITUATION ANALYSIS.
Thiruvallur district is one of the fastest developing districts in Tamil Nadu in terms of
Industrial Development. The district has many leading industries like Madras
Refineries, Madras Fertilizers, Manali Petro Chemicals, MRF, Ashok Leyland, TI Cycles,
Britannia India Ltd, Parry India Ltd and Hindustan Motors.
Glass, rubber, plastics and ceramic industries are located at also Thiruvallur district
and Gummidipoondi around Chennai. It also boasts of the Ennore Thermal Power
Station and the Avadi Tank Factory. A cluster of chemical industries is located at
Manali and Ambattur, west of Madhavaram municipality, housing multi-product
industries providing direct and indirect employment opportunities to thousands of
people. The District has also has 16 Industrial Estates, 16940 Small Scale Industries,
notable among them being food, wood, textile, chemical, engineering, non-
metallic and leather industries.
Madhavaram acts as the dormitory town to the surrounding industrial clusters, due to
low cost of land & housing and availability of good transport linkages. Madhavaram
is also as the stop gap for more than 5,000 trucks to Chennai, Airport and Ennore sea
ports from the surrounding export zones.
3.1.1 Occupational Pattern
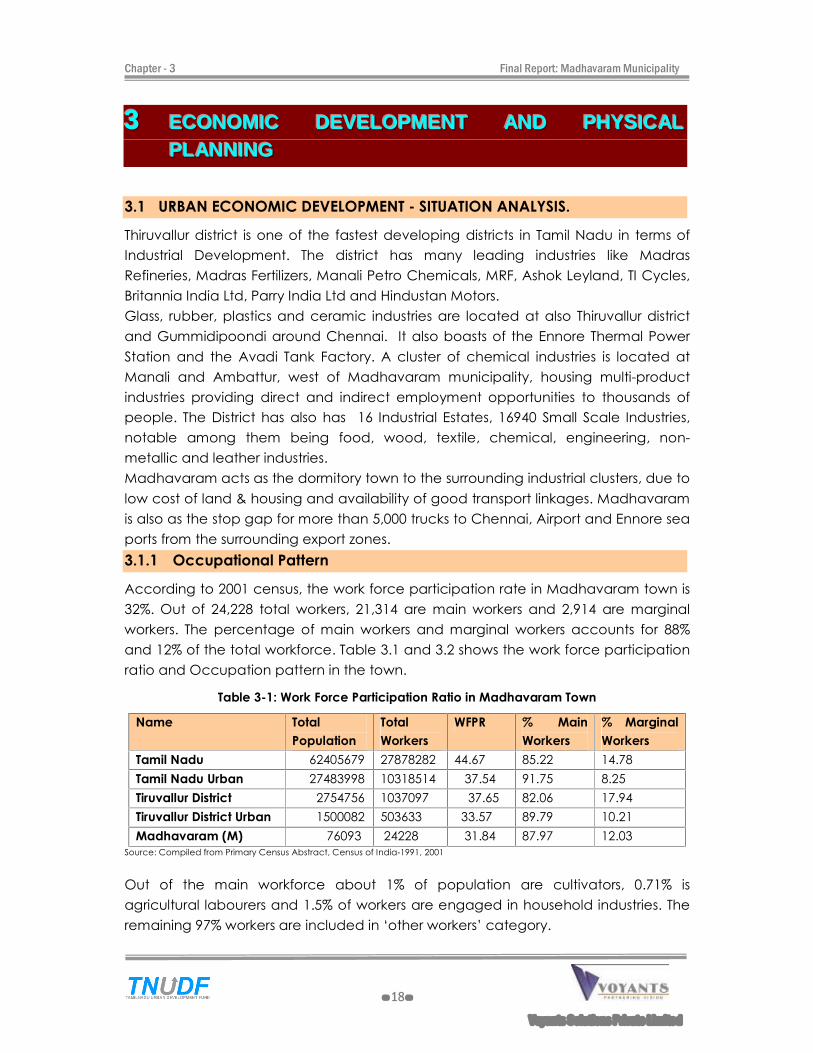
According to 2001 census, the work force participation rate in Madhavaram town is
32%. Out of 24,228 total workers, 21,314 are main workers and 2,914 are marginal
workers. The percentage of main workers and marginal workers accounts for 88%
and 12% of the total workforce. Table 3.1 and 3.2 shows the work force participation
ratio and Occupation pattern in the town.
Table 3-1: Work Force Participation Ratio in Madhavaram Town
Name Total
Population
Total
Workers
WFPR % Main
Workers
% Marginal
Workers
Tamil Nadu 62405679 27878282 44.67 85.22 14.78
Tamil Nadu Urban 27483998 10318514 37.54 91.75 8.25
Tiruvallur District 2754756 1037097 37.65 82.06 17.94
Tiruvallur District Urban 1500082 503633 33.57 89.79 10.21
Madhavaram (M) 76093 24228 31.84 87.97 12.03
Source: Compiled from Primary Census Abstract, Census of India-1991, 2001
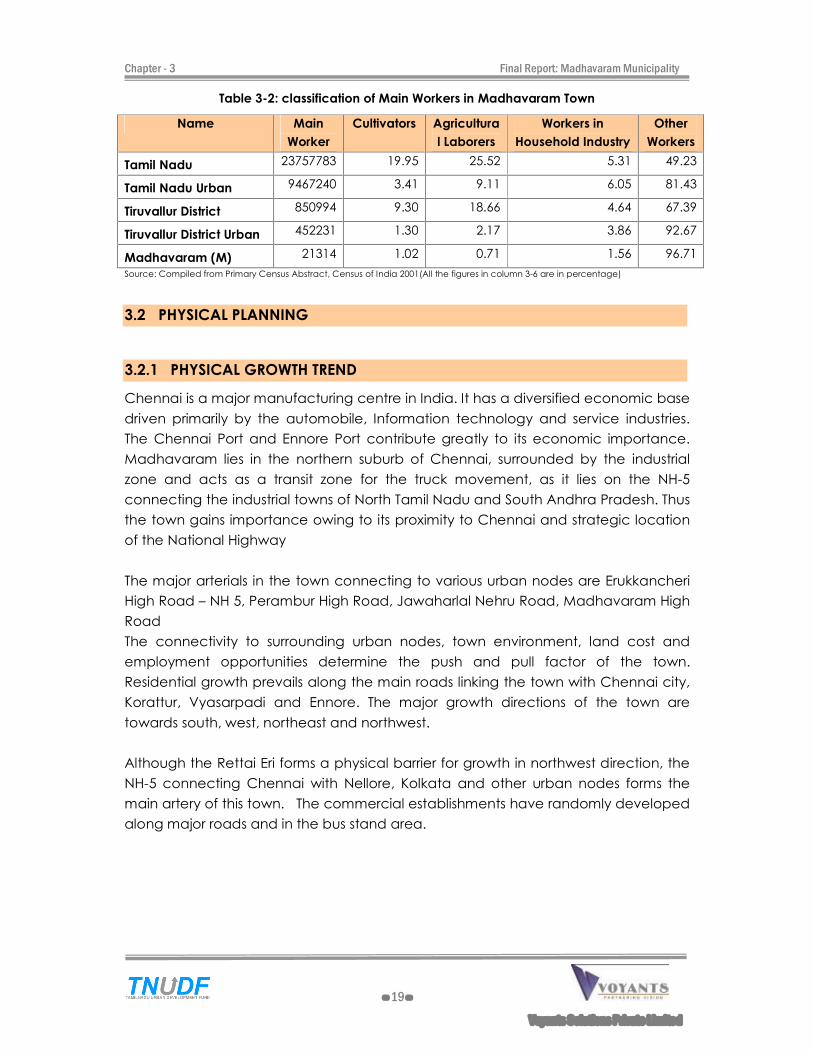
Out of the main workforce about 1% of population are cultivators, 0.71% is
agricultural labourers and 1.5% of workers are engaged in household industries. The
remaining 97% workers are included in �other workers� category.
Chapter - 3 Final Report: Madhavaram Municipality
- 19 -
Voyants Solutions Private Limited
Table 3-2: classification of Main Workers in Madhavaram Town
Name Main
Worker
Cultivators Agricultura
l Laborers
Workers in
Household Industry
Other
Workers
Tamil Nadu 23757783 19.95 25.52 5.31 49.23
Tamil Nadu Urban 9467240 3.41 9.11 6.05 81.43
Tiruvallur District 850994 9.30 18.66 4.64 67.39
Tiruvallur District Urban 452231 1.30 2.17 3.86 92.67
Madhavaram (M) 21314 1.02 0.71 1.56 96.71
Source: Compiled from Primary Census Abstract, Census of India 2001(All the figures in column 3-6 are in percentage)
3.2 PHYSICAL PLANNING
3.2.1 PHYSICAL GROWTH TREND
Chennai is a major manufacturing centre in India. It has a diversified economic base
driven primarily by the automobile, Information technology and service industries.
The Chennai Port and Ennore Port contribute greatly to its economic importance.
Madhavaram lies in the northern suburb of Chennai, surrounded by the industrial
zone and acts as a transit zone for the truck movement, as it lies on the NH-5
connecting the industrial towns of North Tamil Nadu and South Andhra Pradesh. Thus
the town gains importance owing to its proximity to Chennai and strategic location
of the National Highway
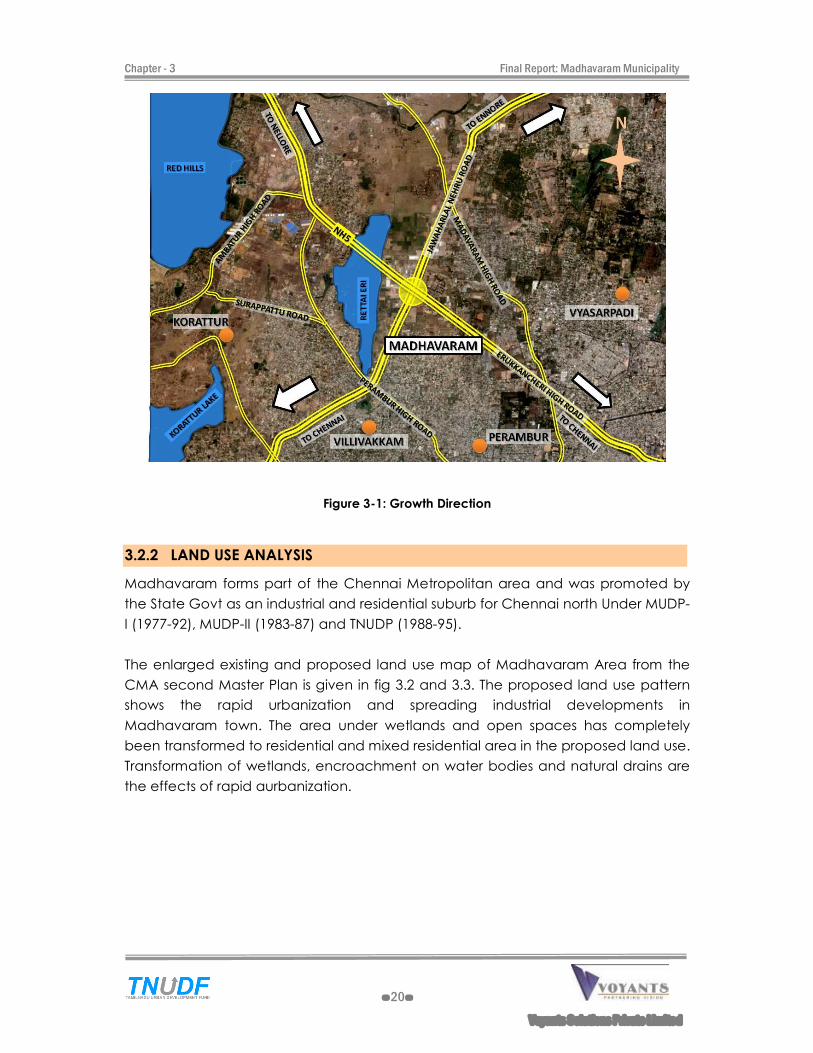
The major arterials in the town connecting to various urban nodes are Erukkancheri
High Road � NH 5, Perambur High Road, Jawaharlal Nehru Road, Madhavaram High
Road
The connectivity to surrounding urban nodes, town environment, land cost and
employment opportunities determine the push and pull factor of the town.
Residential growth prevails along the main roads linking the town with Chennai city,
Korattur, Vyasarpadi and Ennore. The major growth directions of the town are
towards south, west, northeast and northwest.
Although the Rettai Eri forms a physical barrier for growth in northwest direction, the
NH-5 connecting Chennai with Nellore, Kolkata and other urban nodes forms the
main artery of this town. The commercial establishments have randomly developed
along major roads and in the bus stand area.
Chapter - 3 Final Report: Madhavaram Municipality
- 20 -
Voyants Solutions Private Limited
Figure 3-1: Growth Direction
3.2.2 LAND USE ANALYSIS
Madhavaram forms part of the Chennai Metropolitan area and was promoted by
the State Govt as an industrial and residential suburb for Chennai north Under MUDP-
I (1977-92), MUDP-II (1983-87) and TNUDP (1988-95).
The enlarged existing and proposed land use map of Madhavaram Area from the
CMA second Master Plan is given in fig 3.2 and 3.3. The proposed land use pattern
shows the rapid urbanization and spreading industrial developments in
Madhavaram town. The area under wetlands and open spaces has completely
been transformed to residential and mixed residential area in the proposed land use.
Transformation of wetlands, encroachment on water bodies and natural drains are
the effects of rapid aurbanization.
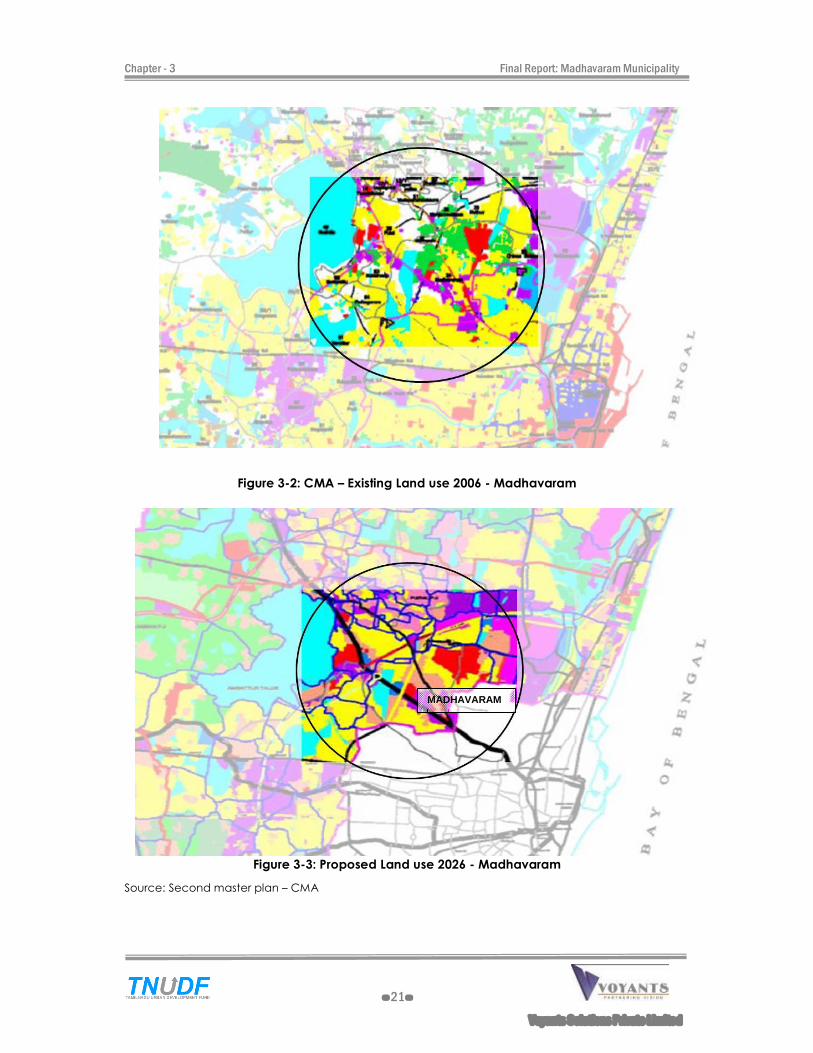
Chapter - 3 Final Report: Madhavaram Municipality
- 21 -
Voyants Solutions Private Limited
Figure 3-2: CMA � Existing Land use 2006 - Madhavaram
Figure 3-3: Proposed Land use 2026 - Madhavaram
Source: Second master plan � CMA
MADHAVARAM
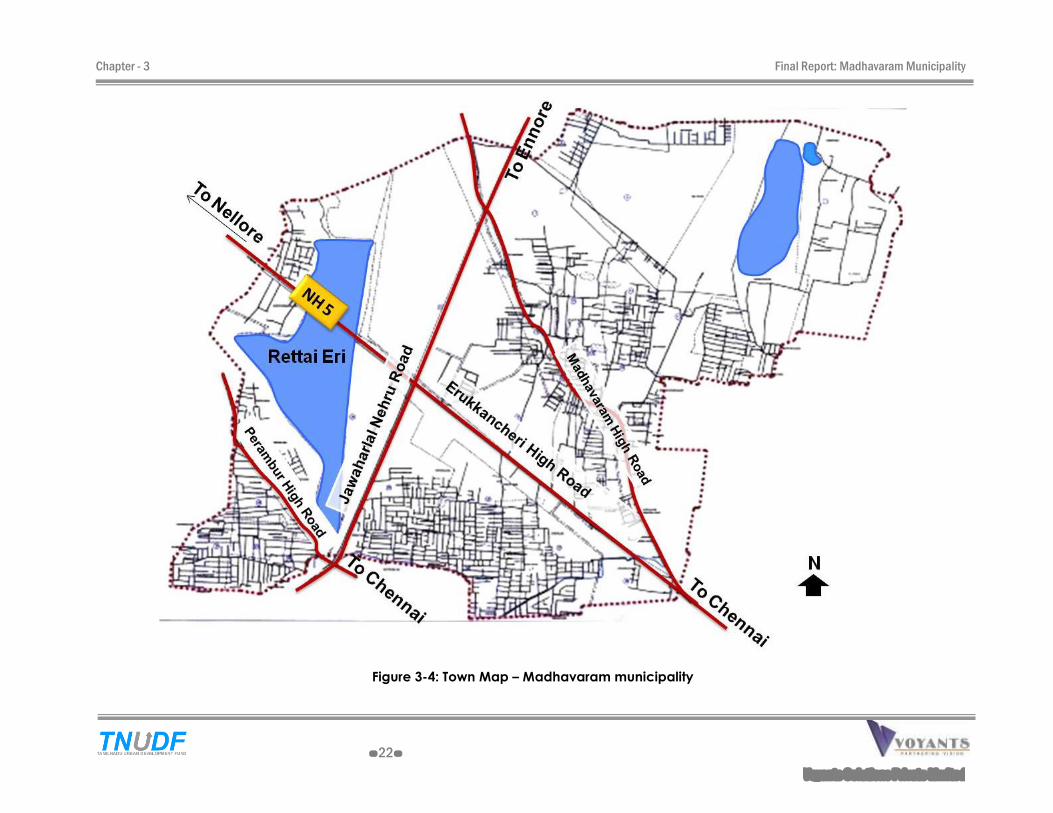
Chapter - 3 Final Report: Madhavaram Municipality
- 22 -
Voyants Solutions Private Limited
Figure 3-4: Town Map � Madhavaram municipality

Chapter - 3 Final Report: Madhavaram Municipality
- 23 -
Voyants Solutions Private Limited
3.3 GROWTH MANAGEMENT ISSUES
Need to conserve water bodies
The Rettai eri, a water sub source for CMWSSB located at Madhavaram, also
serves as the recharge system for underground aquifers and flood
accommodators during monsoon. The major issues related to Rettai Eri are
encroachment upon the natural drainage system and catchment areas. A
perimeter of about 300 m surrounding the water body is rich in bio diversity and
needs to be preserved, as it forms a part of the Rettai Eri- Manali wetlands.
This could also serve as an Bio-Eco park for the North Chennai area, which
critically lacks recreational spaces.Effective tie-ups of professionals, including
ecologists, hydrologists, economists, watershed management specialists,
planners and decision makers is to be linked with local expertise for effective
environmental management of wetlands and the Rettai eri .
Need for infrastructural improvements
The upcoming industrial developments, development of MAP region and the
existing regional linkages would further boost the economic development of
the region. This will lead to the rapid increase in migrated population to
Madhavaram. Necessary basic infrastructure facilities including good quality
affordable housing, health, education and recreational facilities need to be
provided to achieve a better standard of living.
Strengthening of municipal revenue resource
The connectivity to port and industrial clusters, and the presence of Truck
terminus within the limit has gained the name as �Transit hub for truck
transportation�. Reforms for revenue enhancement need to be under taken by
the urban local body to generate revenue from the CMDA owned truck
terminus and other private players in this area. The modalities are addressed in
detail under Reform Agenda section of Chapter-12.
Need for guided development for a sustained economic growth
Madhavaram at present is a residential town for the surrounding industrial
centers. The transformation of wetlands into mixed land use will be fast in future
years causing congestion and unsafe environmental conditions. Thus guided
development and regular monitoring of upcoming developments are the key
factors in providing safe and healthy environment to live in.
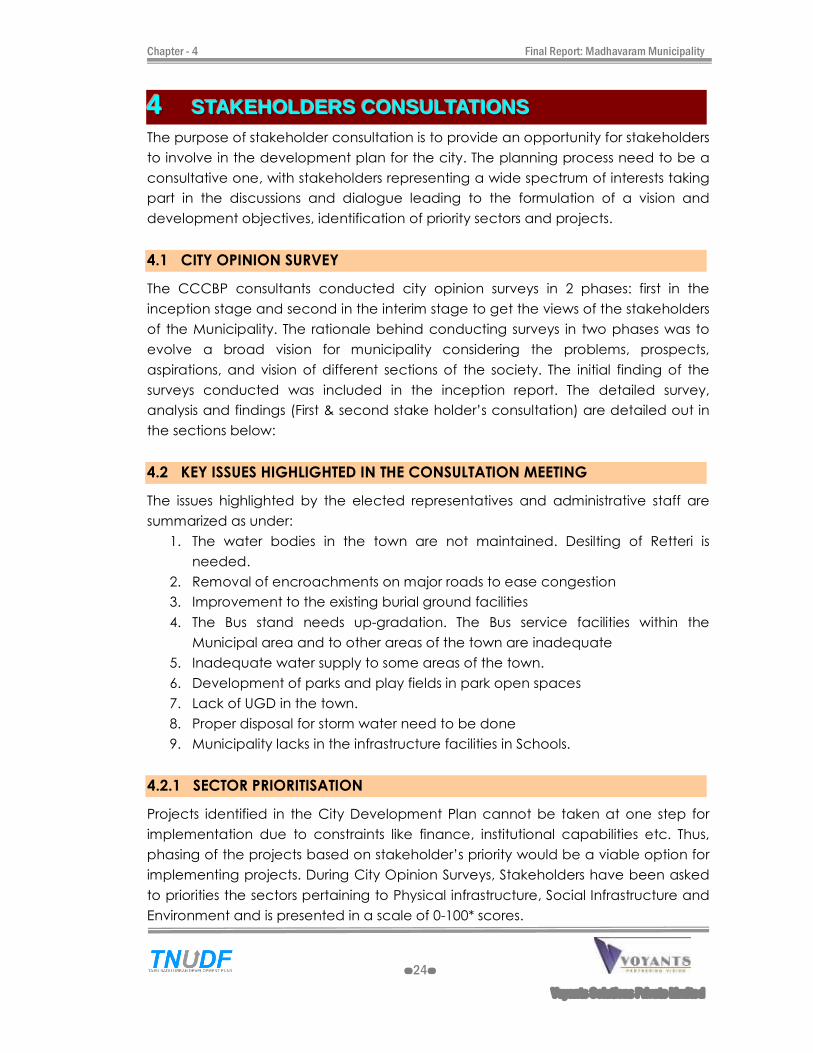
Chapter - 4 Final Report: Madhavaram Municipality
- 24 -
Voyants Solutions Private Limited
444 SSSTTTAAAKKKEEEHHHOOOLLLDDDEEERRRSSS CCCOOONNNSSSUUULLLTTTAAATTTIIIOOONNNSSS The purpose of stakeholder consultation is to provide an opportunity for stakeholders
to involve in the development plan for the city. The planning process need to be a
consultative one, with stakeholders representing a wide spectrum of interests taking
part in the discussions and dialogue leading to the formulation of a vision and
development objectives, identification of priority sectors and projects.
4.1 CITY OPINION SURVEY
The CCCBP consultants conducted city opinion surveys in 2 phases: first in the
inception stage and second in the interim stage to get the views of the stakeholders
of the Municipality. The rationale behind conducting surveys in two phases was to
evolve a broad vision for municipality considering the problems, prospects,
aspirations, and vision of different sections of the society. The initial finding of the
surveys conducted was included in the inception report. The detailed survey,
analysis and findings (First & second stake holder�s consultation) are detailed out in
the sections below:
4.2 KEY ISSUES HIGHLIGHTED IN THE CONSULTATION MEETING
The issues highlighted by the elected representatives and administrative staff are
summarized as under:
1. The water bodies in the town are not maintained. Desilting of Retteri is
needed.
2. Removal of encroachments on major roads to ease congestion
3. Improvement to the existing burial ground facilities
4. The Bus stand needs up-gradation. The Bus service facilities within the
Municipal area and to other areas of the town are inadequate
5. Inadequate water supply to some areas of the town.
6. Development of parks and play fields in park open spaces
7. Lack of UGD in the town.
8. Proper disposal for storm water need to be done
9. Municipality lacks in the infrastructure facilities in Schools.
4.2.1 SECTOR PRIORITISATION
Projects identified in the City Development Plan cannot be taken at one step for
implementation due to constraints like finance, institutional capabilities etc. Thus,
phasing of the projects based on stakeholder�s priority would be a viable option for
implementing projects. During City Opinion Surveys, Stakeholders have been asked
to priorities the sectors pertaining to Physical infrastructure, Social Infrastructure and
Environment and is presented in a scale of 0-100* scores.
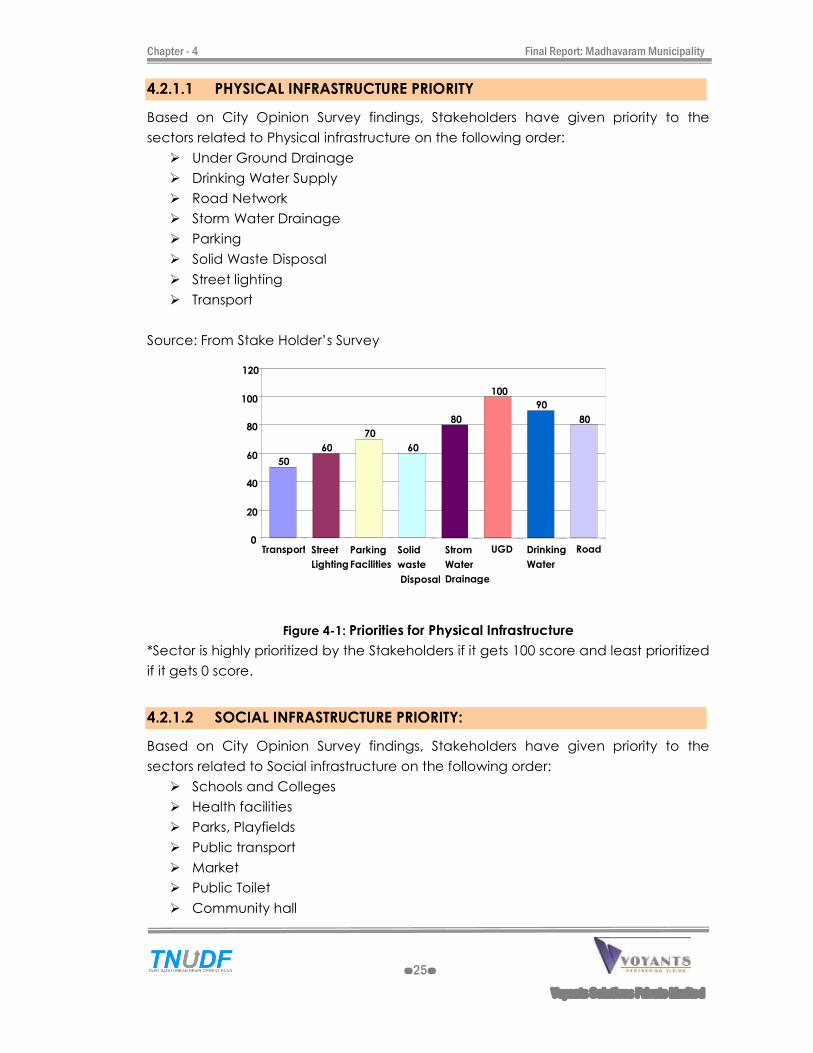
Chapter - 4 Final Report: Madhavaram Municipality
- 25 -
Voyants Solutions Private Limited
4.2.1.1 PHYSICAL INFRASTRUCTURE PRIORITY
Based on City Opinion Survey findings, Stakeholders have given priority to the
sectors related to Physical infrastructure on the following order:
Under Ground Drainage
Drinking Water Supply
Road Network
Storm Water Drainage
Parking
Solid Waste Disposal
Street lighting
Transport
Source: From Stake Holder�s Survey
*Sector is highly prioritized by the Stakeholders if it gets 100 score and least prioritized
if it gets 0 score.
4.2.1.2 SOCIAL INFRASTRUCTURE PRIORITY:
Based on City Opinion Survey findings, Stakeholders have given priority to the
sectors related to Social infrastructure on the following order:
Schools and Colleges
Health facilities
Parks, Playfields
Public transport
Market
Public Toilet
Community hall
Figure 4-1: Priorities for Physical Infrastructure
50
60
70
60
80
100
90
80
0
20
40
60
80
100
120
Transport Street
Lighting
Parking
Facilities
Solid
waste
Disposal
Strom
Water
Drainage
UGD Drinking
Water
Road
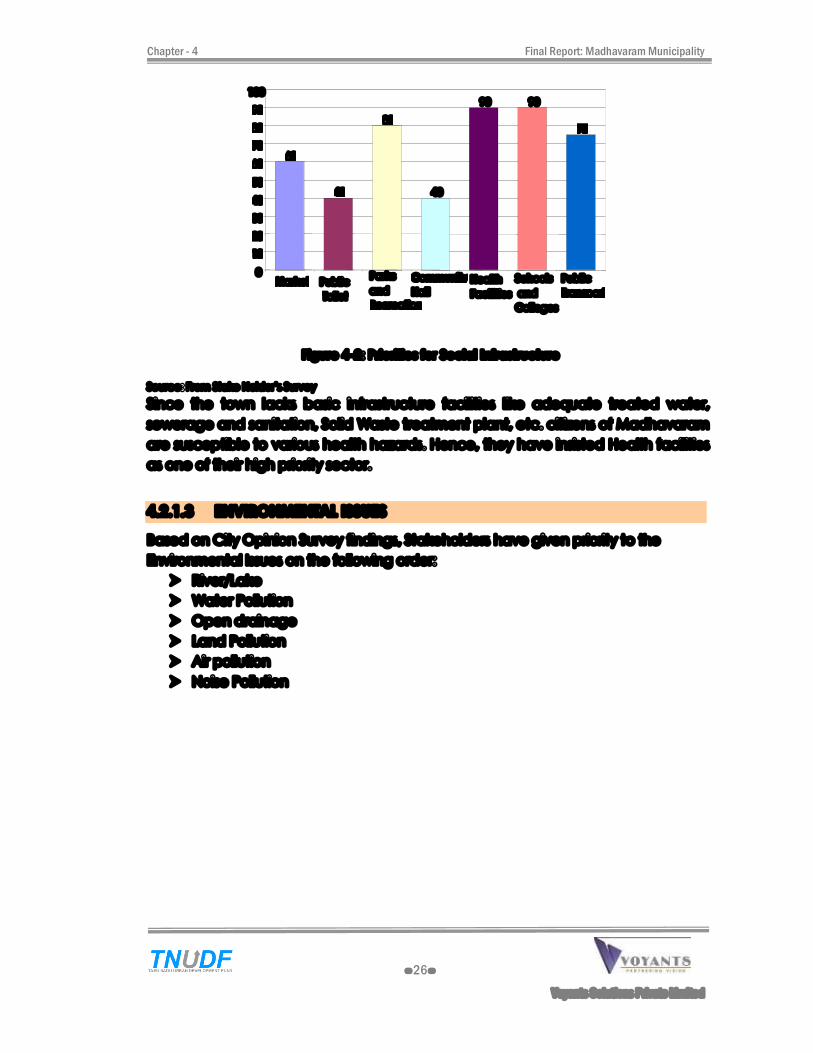
Chapter - 4 Final Report: Madhavaram Municipality
- 26 -
Voyants Solutions Private Limited
Figure 4-2: Priorities for Social Infrastructure
Source: From Stake Holder�s Survey
Since the town lacks basic infrastructure facilities like adequate treated water,
sewerage and sanitation, Solid Waste treatment plant, etc. citizens of Madhavaram
are susceptible to various health hazards. Hence, they have insisted Health facilities
as one of their high priority sector.
4.2.1.3 ENVIRONMENTAL ISSUES
Based on City Opinion Survey findings, Stakeholders have given priority to the
Environmental Issues on the following order:
River/Lake
Water Pollution
Open drainage
Land Pollution
Air pollution
Noise Pollution
60
40
80
40
90 90
75
0
10
20
30
40
50
60
70
80
90
100
Market Public
Toilet
Parks
and
Recreation
Community
Hall
Health
Facilities
Schools
and
Colleges
Public
Transport
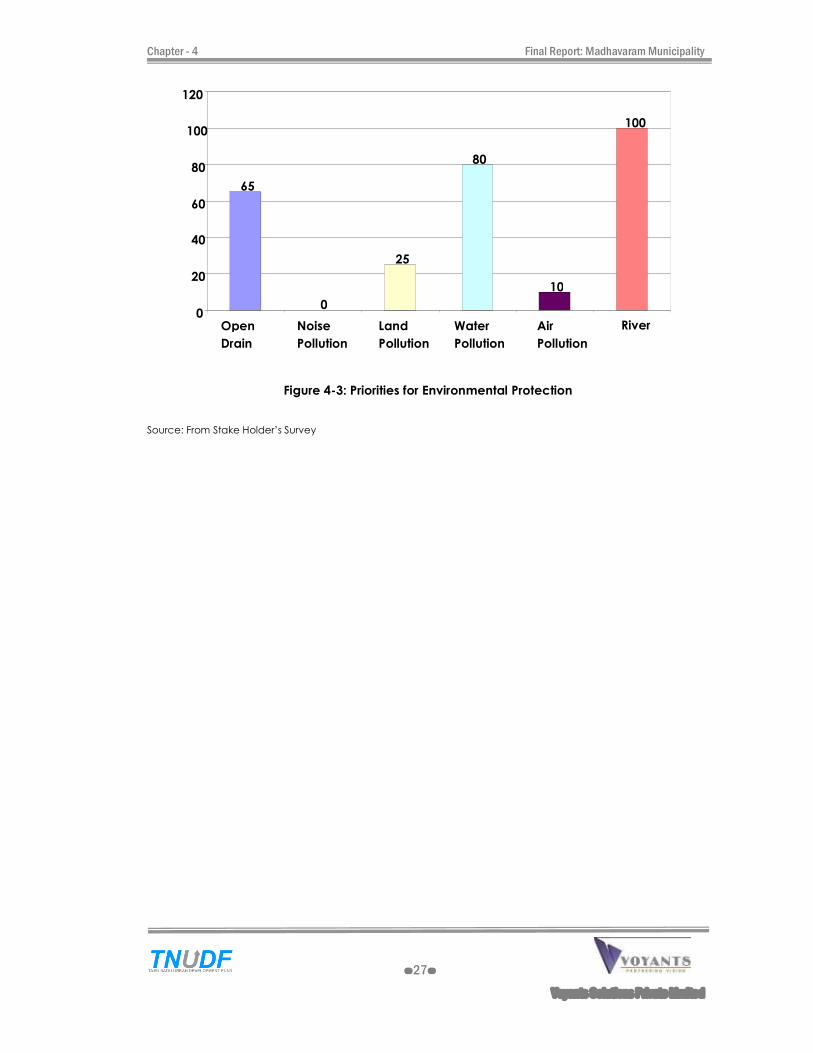
Chapter - 4 Final Report: Madhavaram Municipality
- 27 -
Voyants Solutions Private Limited
Figure 4-3: Priorities for Environmental Protection
Source: From Stake Holder�s Survey
65
0
25
80
10
100
0
20
40
60
80
100
120
Open
Drain
Noise
Pollution
Land
Pollution
Water
Pollution
Air
Pollution
River
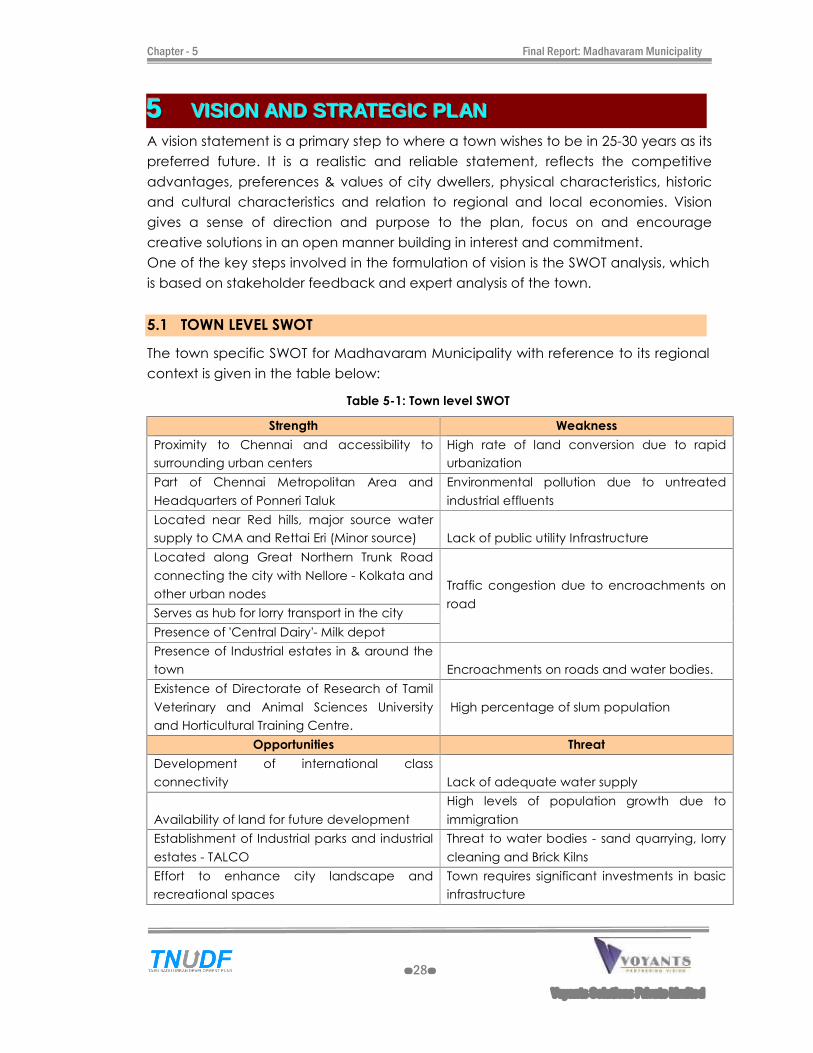
Chapter - 5 Final Report: Madhavaram Municipality
- 28 -
Voyants Solutions Private Limited
555 VVVIIISSSIIIOOONNN AAANNNDDD SSSTTTRRRAAATTTEEEGGGIIICCC PPPLLLAAANNN A vision statement is a primary step to where a town wishes to be in 25-30 years as its
preferred future. It is a realistic and reliable statement, reflects the competitive
advantages, preferences & values of city dwellers, physical characteristics, historic
and cultural characteristics and relation to regional and local economies. Vision
gives a sense of direction and purpose to the plan, focus on and encourage
creative solutions in an open manner building in interest and commitment.
One of the key steps involved in the formulation of vision is the SWOT analysis, which
is based on stakeholder feedback and expert analysis of the town.
5.1 TOWN LEVEL SWOT
The town specific SWOT for Madhavaram Municipality with reference to its regional
context is given in the table below:
Table 5-1: Town level SWOT
Strength Weakness
Proximity to Chennai and accessibility to
surrounding urban centers
High rate of land conversion due to rapid
urbanization
Part of Chennai Metropolitan Area and
Headquarters of Ponneri Taluk
Environmental pollution due to untreated
industrial effluents
Located near Red hills, major source water
supply to CMA and Rettai Eri (Minor source) Lack of public utility Infrastructure
Located along Great Northern Trunk Road
connecting the city with Nellore - Kolkata and
other urban nodes Traffic congestion due to encroachments on
road Serves as hub for lorry transport in the city
Presence of 'Central Dairy'- Milk depot
Presence of Industrial estates in & around the
town Encroachments on roads and water bodies.
Existence of Directorate of Research of Tamil
Veterinary and Animal Sciences University
and Horticultural Training Centre.
High percentage of slum population
Opportunities Threat
Development of international class
connectivity Lack of adequate water supply
Availability of land for future development
High levels of population growth due to
immigration
Establishment of Industrial parks and industrial
estates - TALCO
Threat to water bodies - sand quarrying, lorry
cleaning and Brick Kilns
Effort to enhance city landscape and
recreational spaces
Town requires significant investments in basic
infrastructure
Chapter - 5 Final Report: Madhavaram Municipality
- 29 -
Voyants Solutions Private Limited
Access for health facilities to Chennai ' the
health capital of the country'
Competing economic activities in the
adjoining areas
5.2 VISION FORMULATION
Vision statement for the town is arrived based on the feed backs received from the
stake holders, regional growth opportunities and expert survey of the municipal
services for the perspective year of 2030. Vision forms an essential step in building a
physical and Socio-economic development strategy.
The Madhavaram municipality is envisioned as �An ideal residential town in the
fabric of Chennai Urban Agglomeration with access to industrial base for sustained
economic development �
However to achieve this vision and to translate it into Strategies and Projects, the
mission statements are evolved.
Mission 1:
To achieve a Sustainable Environment by 2015 so as to prepare Madhavaram as
competing City for induced investments
Mission 2 :
To develop identified areas both in as well as outside the town limit, the following
action areas are required to achieve the above mentioned mission.
Improved level of Urban service delivery
Regulating Physical Growth
Strengthening Municipal finance
Improving Urban environment
Strengthening the Ulb and Improving Urban governance practices.
Improved Transport Infrastructure
5.3 STRATEGY OPTION FOR ECONOMIC DEVELOPMENT
Chennai, the fourth largest metropolis in India is the focus of economic, social and
cultural development. Government has been considering declaring the areas
adjoining the CMA as a Region comprising parts of Thiruvallur and Kancheepuram
Districts for preparing Regional Plan, considering the developments coming up in
the Kelambakkam-Tiruporur, Orgadam-Sriperumbudur and Gummidipoondi-Ponneri
areas. Madhavaram lies in the Gummidipoondi-Ponneri area. The economic
development strategies to harvest the proposed development initiatives for the
town is as follows
1. Benefit from the proximity to Chennai City to generate employment
opportunities and Socio - economic development.
Chapter - 5 Final Report: Madhavaram Municipality
- 30 -
Voyants Solutions Private Limited
Madhavaram municipality is situated in the northern suburb of Chennai City
and forms a part of Chennai Metropolitan Area. The Development of Chennai
- Manali - Ennore Corridor linking to Ennore Port and the Great Northern Trunk
Road connecting the city with Nellore and Kolkata further adds the base for
development.
2. Strengthening the regional linkages � MRTS connectivity
The municipality serves as service center to the city due to the presence of
Madhavaram Central Dairy which supplies milk to the city and the truck
terminal that serves as a hub for lorry transport in the city. Madhavaram being
a part of Chennai urban agglomeration, the road and rail linkages need to be
strengthened. These regional linkages will further boost up the economic
growth directly and indirectly.
3. Good quality services, housing and recreational areas � Neighborhood town
The spiraling scope for industrial development in the region will create high
demand on infrastructure services, housing and recreational facilities.
Madhavaram serves as a residential neighborhood. Improving the service
sector such as local body services, health, education and recreational
facilities, establishment of regional linkages would not only increase the
employment opportunities but also improve standards of living in this suburb.
4. Build on the industrial base to create further scope for development.
To strengthen the economic base of the region, promotion of industries is an
indispensable requirement. Therefore, the following efforts may be initiated to
stimulate industrial development.
Establishment of Warehouses
Establishment of industrial parks and SEZs in the region
Guidance through research and training institutes
Establishment of Industrial Estates
Development of IT/ITES parks
a. Establishment of Warehouses
Chennai has been gradually emerging as a key warehousing hub in the south due
to strong infrastructural support, good connectivity and presence of ports.
Moreover, land parcels are available in the suburbs and peripheral areas at
competitive prices. The NH-4 which links Chennai to the western cities like Bangaluru
and Mumbai has become the source of warehousing operation in the state. The
northern areas of the city like Madhavaram and Red Hills which connect the cities
to Hyderabad and Kolkata in the east have also grown in prominence in
warehousing. The traditional warehousing centres in Red Hills and Madhavaram,

Chapter - 5 Final Report: Madhavaram Municipality
- 31 -
Voyants Solutions Private Limited
which are well linked to the ports has amble potential for establishment of
warehouses.
b. Establishment of industrial parks and SEZs in the region
Traditionally, North Chennai has been the centre for industrial investment.
Development of SEZs and Industrial parks in this region abutting NH 5 will generate
more �blue collar� jobs in line with the potential assessed for the area.
c. Guidance through research and training institutes
Numbers of unskilled and semi-skilled workers are bound to rapidly increase due to
migration from rural areas and saturation of agriculture sector. Therefore, vocational
educational institutions in the CMA have to be strengthened and reoriented to
meet the market demand.
c. Establishment of Industrial Estates
Small-scale industrial sector is a powerful tool to generate more industrial
employment. Therefore, infrastructure facilities may be upgraded for industrial
estates and relief measures can be initiated to rehabilitate viable sick units. The
system of common application form and the single window clearance can be
extended to small-scale industries.
Action has been initiated by SIDCO to establish Flatted Factory Blocks in
Madhavaram. [�Flatted factory� means a premises having group of non-hazardous
small industrial units having not more than 50 workers. These units may be located in
multi-storeyed buildings]. Development of flatted factories and industrial clusters will
further generate employment.
d. Development of IT/ITES parks
The Real estate investors who have focused on the southern part of Chennai started
looking at opportunities in the north of the city due to the low land cost. Several
IT/ITES companies have set up operations in the North Chennai suburb. Providing a
conducive environment needed for multi nationals to set up shops would facilitate
the development in the region.
5. Effort to Conserve Natural Environment
The Manali-Madhavaram jheel ecosystem is listed in the Directory of
Wetlands published by World Wildlife Fund (WWF). The Madhavaram jheel is
situated near the Manali jheel covering an area of 30 acres. It has patches of
floating vegetation: lily, wetland rushes and islands of grasses.
The iheels harbour native fish such as tilapia, freshwater gastropod,
applesnail, insects such as dragonfly, damselfly, pond skater, diving beetle
and keelback water snakes. Birds like pheasant-tailed jacanas, sandpipers,
Chapter - 5 Final Report: Madhavaram Municipality
- 32 -
Voyants Solutions Private Limited
snipes, stints, stilts, lapwings, plovers, terns, gulls, moorhen, dabchick, snake
bird or darter, winter-visiting waders and wagtails, ducks like the whistling teal,
cotton teal and the migratory garganey teal, three different species of
bittern, egret and raptors like osprey and the marsh harrier are found in the
Madhavaram jheel.
Household Sewage and the Effluents from Madhavaram Dairy cause oxygen
depletion in the water leading to fish mortality. Due to silting, the storage
capacity of both the jheels has reduced. The lack of comprehensive wetland
policy, Master plan, unplanned urbanization and growing population has
taken their toll on wetlands. Hence, comprehensive approach is needed to
conserve the wetland natural environment in the town.
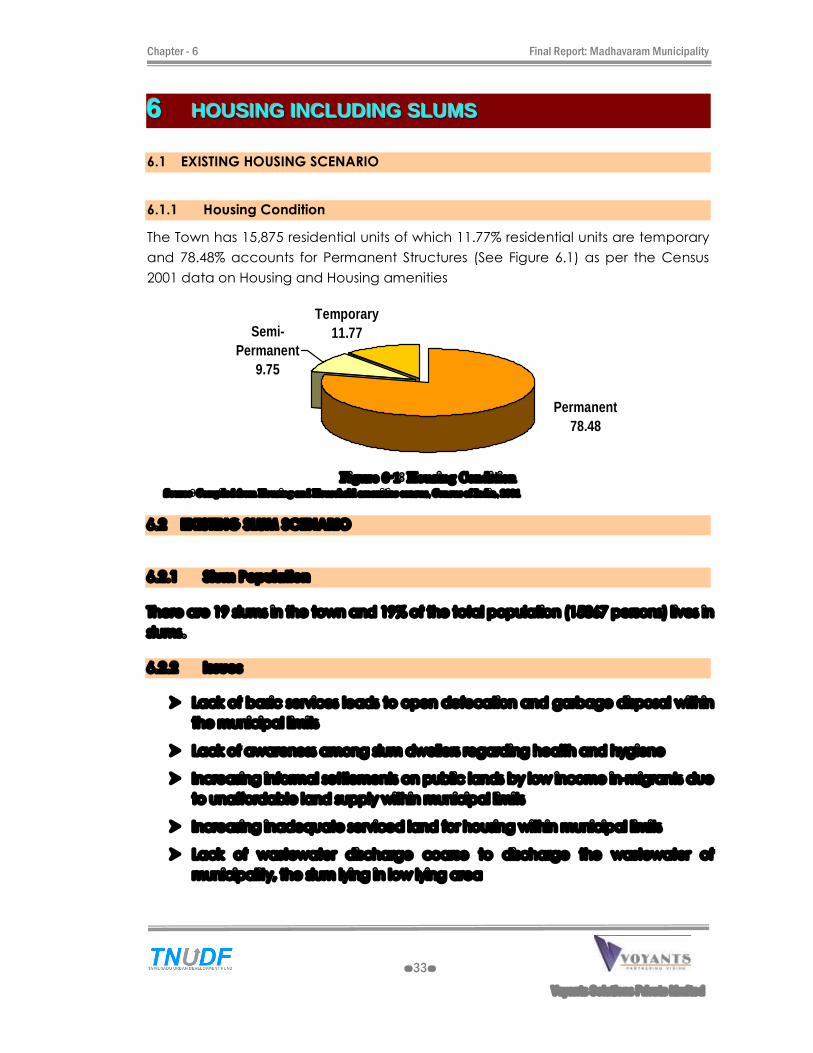
Chapter - 6 Final Report: Madhavaram Municipality
- 33 -
Voyants Solutions Private Limited
666 HHHOOOUUUSSSIIINNNGGG IIINNNCCCLLLUUUDDDIIINNNGGG SSSLLLUUUMMMSSS
6.1 EXISTING HOUSING SCENARIO
6.1.1 Housing Condition
The Town has 15,875 residential units of which 11.77% residential units are temporary
and 78.48% accounts for Permanent Structures (See Figure 6.1) as per the Census
2001 data on Housing and Housing amenities
Temporary11.77Semi-
Permanent9.75
Permanent78.48
Figure 6-1: Housing Condition
Source: Compiled from Housing and Household amenities census, Census of India, 2001
6.2 EXISTING SLUM SCENARIO
6.2.1 Slum Population
There are 19 slums in the town and 19% of the total population (15867 persons) lives in
slums.
6.2.2 Issues
Lack of basic services leads to open defecation and garbage disposal within
the municipal limits
Lack of awareness among slum dwellers regarding health and hygiene
Increasing informal settlements on public lands by low income in-migrants due
to unaffordable land supply within municipal limits
Increasing inadequate serviced land for housing within municipal limits
Lack of wastewater discharge coarse to discharge the wastewater of
municipality, the slum lying in low lying area
Chapter - 6 Final Report: Madhavaram Municipality
- 34 -
Voyants Solutions Private Limited
6.3 ISSUES
Due to improper monitoring and implementation of development regulation
more than one-third of the town population lives in slums (36.94% of the total
population live in slums)
Lack of basic services leads to open defecation and garbage disposal within
the municipal limits
Lack of awareness among slum dwellers regarding health and hygiene
Increasing informal settlements on public lands by low income in-migrants due
o unaffordable land supply within municipal limits
Increasing inadequate serviced land for housing within municipal limits
Lack of awareness regarding health and hygiene
Lack of wastewater discharge coarse to discharge the wastewater of
municipality, the slum lying in low lying area
6.4 PROPOSAL
The additional proposals identified are detailed out in chapter 10.
Chapter � 7 Final report: Madhavaram Municipality
- 35 -
Voyants Solutions Private Limited
777 IIINNNSSSTTTIIITTTUUUTTTIIIOOONNNAAALLL FFFRRRAAAMMMEEEWWWOOORRRKKK
In order to give effect to the provisions of 74th CAA, the municipal structure was
revised to include elected council to the already existing administrative setup. For
this purpose elections were held in every municipality under the new act once in
every 5 year. The organizational structure of the Madhavaram Municipality generally
consists of Elected Council and Executive wing.
7.1 ELECTED COUNCIL
The Elected Council, the political wing consists of 30 elected councilors. Each
Councilor represents one electoral ward. The Councilors in turn elect the
Chairperson as head of the Municipal Council. The chairman is the head of the
municipal council and he is assisted by vice chairman.
To assist the council in its functioning, the following 4 administrative committees
have been constituted namely:
Appointment committee
Agreement/Contract Committee
Taxation Appeal Committee
Local Planning Authority
The committees consists of the Chairman, the Municipal Commissioner and elected
Councilors as members. Appointment Committee is a statutory committee, and the
Chairman of the Municipality is also the Chairman of the committee. The
Committee is responsible for making appointments for posts which fall under the
purview of the Appointing Committee. Contract Committee is another statutory
committee and quotation of works is finalized by the Contract Committee. The
Taxation Appeal Committee is responsible for hearing of appeals of the tax items.
The Council is the decision making as well as policy making body.
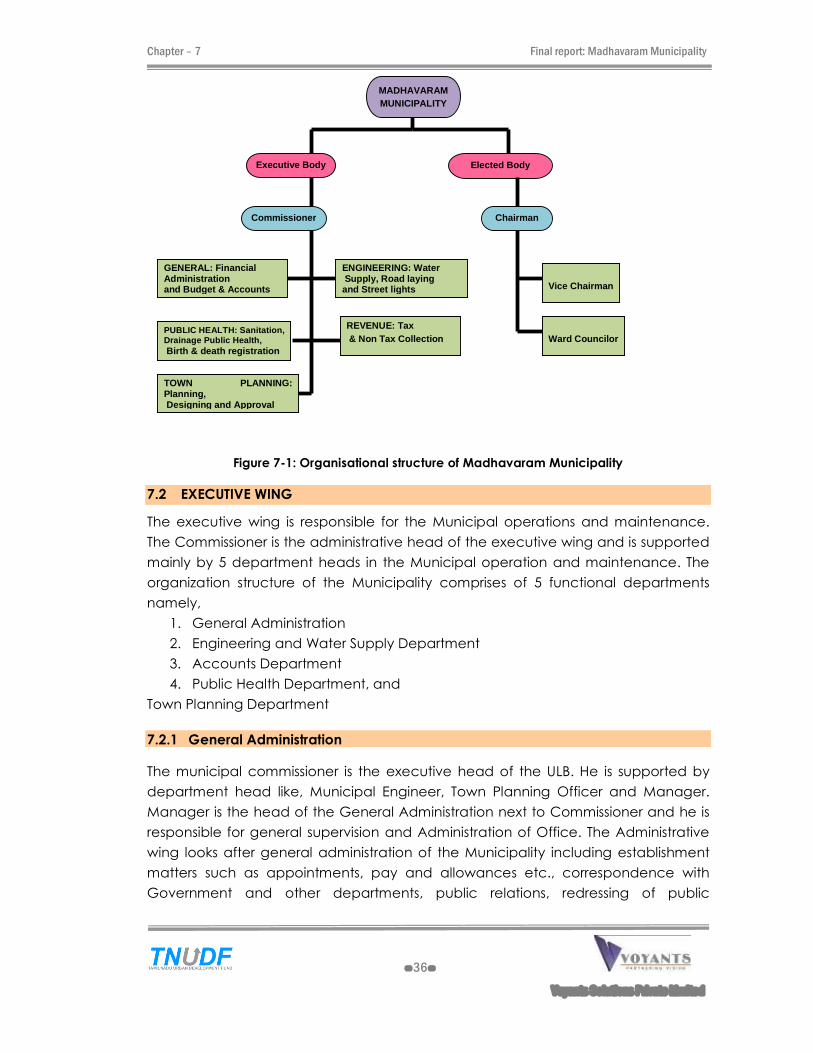
Chapter � 7 Final report: Madhavaram Municipality
- 36 -
Voyants Solutions Private Limited
Figure 7-1: Organisational structure of Madhavaram Municipality
7.2 EXECUTIVE WING
The executive wing is responsible for the Municipal operations and maintenance.
The Commissioner is the administrative head of the executive wing and is supported
mainly by 5 department heads in the Municipal operation and maintenance. The
organization structure of the Municipality comprises of 5 functional departments
namely,
1. General Administration
2. Engineering and Water Supply Department
3. Accounts Department
4. Public Health Department, and
Town Planning Department
7.2.1 General Administration
The municipal commissioner is the executive head of the ULB. He is supported by
department head like, Municipal Engineer, Town Planning Officer and Manager.
Manager is the head of the General Administration next to Commissioner and he is
responsible for general supervision and Administration of Office. The Administrative
wing looks after general administration of the Municipality including establishment
matters such as appointments, pay and allowances etc., correspondence with
Government and other departments, public relations, redressing of public
MADHAVARAM MUNICIPALITY
Executive Body
Commissioner
GENERAL: Financial Administration and Budget & Accounts
ENGINEERING: Water Supply, Road laying and Street lights
REVENUE: Tax & Non Tax Collection
PUBLIC HEALTH: Sanitation, Drainage Public Health, Birth & death registration
TOWN PLANNING: Planning, Designing and Approval
Elected Body
Chairman
Vice Chairman
Ward Councilor
Chapter � 7 Final report: Madhavaram Municipality
- 37 -
Voyants Solutions Private Limited
grievances, legal matters and lawsuits and all matters related to office
administration. All establishment matters are dealt with in the General Administration
7.2.2 Health Section
The Municipal Sanitary officer is the overall in-charge of the Health Section. He looks
after the prevention of Food Adulteration, conservatory work including sweeping of
Streets maintenance of Drainage, controlling of epidemic diseases, ensuring of
license to D&O trades, Birth and Death Registration, issuing birth and death
certificate and also responsible for removing of dead animals and stray animals. The
Sanitary Supervisor and Sanitary Workers are assisting the Municipal Health Officer.
The Municipal Health Officer is also responsible for solid waste management.
7.2.3 Engineering Section
The Municipal Engineer is the over-all in-charge of Engineering Section. Municipal
Engineer will control the Assistant Engineer, Technical Assistant, Road Mazdoor,
Electrical Superintendent, Wireman, Helper and Fitter working in the section. The
Municipal Engineer looks after the maintenance of Street lights, Road laying,
construction of building, drainage, maintenance of parks, head works and
municipal vehicles. The other subordinate officers are assisting the Engineer to look
after the above work.
7.2.4 Town Planning Section
In Madhavaram Municipality, the Town Planning Officer is the over all in-charge of
the section. He looks after the work of preparation of Master Plan, maintaining the
land use as per the approved master plan, Licensing of plan building, booking of
unauthorized construction, approval of lay out in the town limit, controlling and
removing the encroachment in the town. The Town Planning Inspector will assist the
Town Planning Officer in the planning of future development of the town and allied
works.
7.2.5 Accounts Section
The Accounts section is included in General Section. The Accountant is the Head of
the wing and controlling financial matters. It involves into preparation of Budget
discipline and Actual based Accounting System.
The Revenue section is headed by the Revenue Inspector and the inspector is
supported by Bill Collectors with the task collection of taxes and Non-taxes and is
held responsible for the entire collection of Revenue.
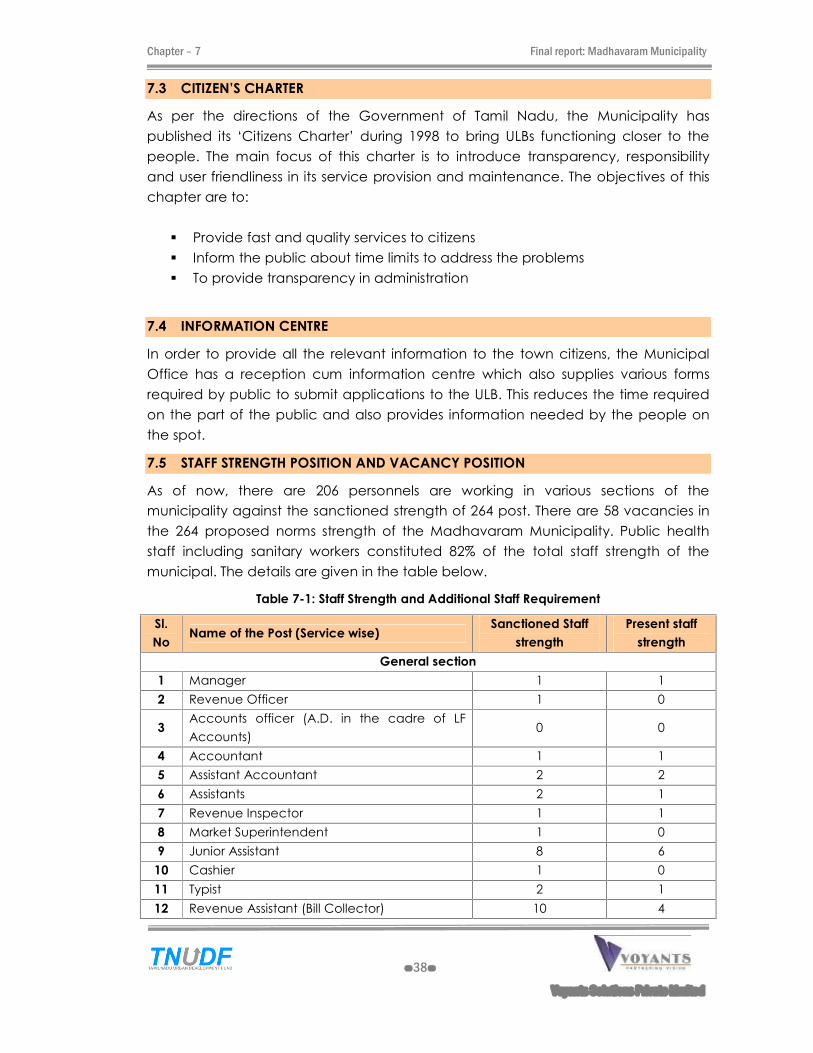
Chapter � 7 Final report: Madhavaram Municipality
- 38 -
Voyants Solutions Private Limited
7.3 CITIZEN�S CHARTER
As per the directions of the Government of Tamil Nadu, the Municipality has
published its �Citizens Charter� during 1998 to bring ULBs functioning closer to the
people. The main focus of this charter is to introduce transparency, responsibility
and user friendliness in its service provision and maintenance. The objectives of this
chapter are to:
Provide fast and quality services to citizens
Inform the public about time limits to address the problems
To provide transparency in administration
7.4 INFORMATION CENTRE
In order to provide all the relevant information to the town citizens, the Municipal
Office has a reception cum information centre which also supplies various forms
required by public to submit applications to the ULB. This reduces the time required
on the part of the public and also provides information needed by the people on
the spot.
7.5 STAFF STRENGTH POSITION AND VACANCY POSITION
As of now, there are 206 personnels are working in various sections of the
municipality against the sanctioned strength of 264 post. There are 58 vacancies in
the 264 proposed norms strength of the Madhavaram Municipality. Public health
staff including sanitary workers constituted 82% of the total staff strength of the
municipal. The details are given in the table below.
Table 7-1: Staff Strength and Additional Staff Requirement
Sl.
No Name of the Post (Service wise)
Sanctioned Staff
strength
Present staff
strength
General section
1 Manager 1 1
2 Revenue Officer 1 0
3 Accounts officer (A.D. in the cadre of LF
Accounts) 0 0
4 Accountant 1 1
5 Assistant Accountant 2 2
6 Assistants 2 1
7 Revenue Inspector 1 1
8 Market Superintendent 1 0
9 Junior Assistant 8 6
10 Cashier 1 0
11 Typist 2 1
12 Revenue Assistant (Bill Collector) 10 4
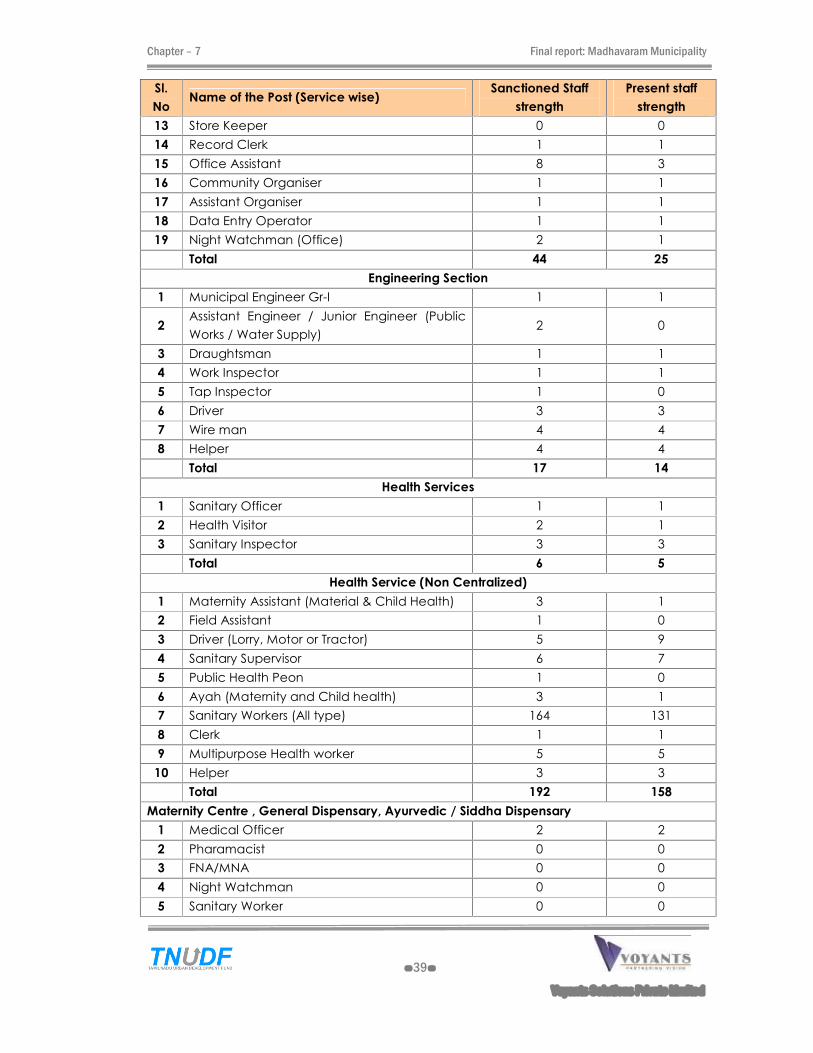
Chapter � 7 Final report: Madhavaram Municipality
- 39 -
Voyants Solutions Private Limited
Sl.
No Name of the Post (Service wise)
Sanctioned Staff
strength
Present staff
strength
13 Store Keeper 0 0
14 Record Clerk 1 1
15 Office Assistant 8 3
16 Community Organiser 1 1
17 Assistant Organiser 1 1
18 Data Entry Operator 1 1
19 Night Watchman (Office) 2 1
Total 44 25
Engineering Section
1 Municipal Engineer Gr-I 1 1
2 Assistant Engineer / Junior Engineer (Public
Works / Water Supply) 2 0
3 Draughtsman 1 1
4 Work Inspector 1 1
5 Tap Inspector 1 0
6 Driver 3 3
7 Wire man 4 4
8 Helper 4 4
Total 17 14
Health Services
1 Sanitary Officer 1 1
2 Health Visitor 2 1
3 Sanitary Inspector 3 3
Total 6 5
Health Service (Non Centralized)
1 Maternity Assistant (Material & Child Health) 3 1
2 Field Assistant 1 0
3 Driver (Lorry, Motor or Tractor) 5 9
4 Sanitary Supervisor 6 7
5 Public Health Peon 1 0
6 Ayah (Maternity and Child health) 3 1
7 Sanitary Workers (All type) 164 131
8 Clerk 1 1
9 Multipurpose Health worker 5 5
10 Helper 3 3
Total 192 158
Maternity Centre , General Dispensary, Ayurvedic / Siddha Dispensary
1 Medical Officer 2 2
2 Pharamacist 0 0
3 FNA/MNA 0 0
4 Night Watchman 0 0
5 Sanitary Worker 0 0
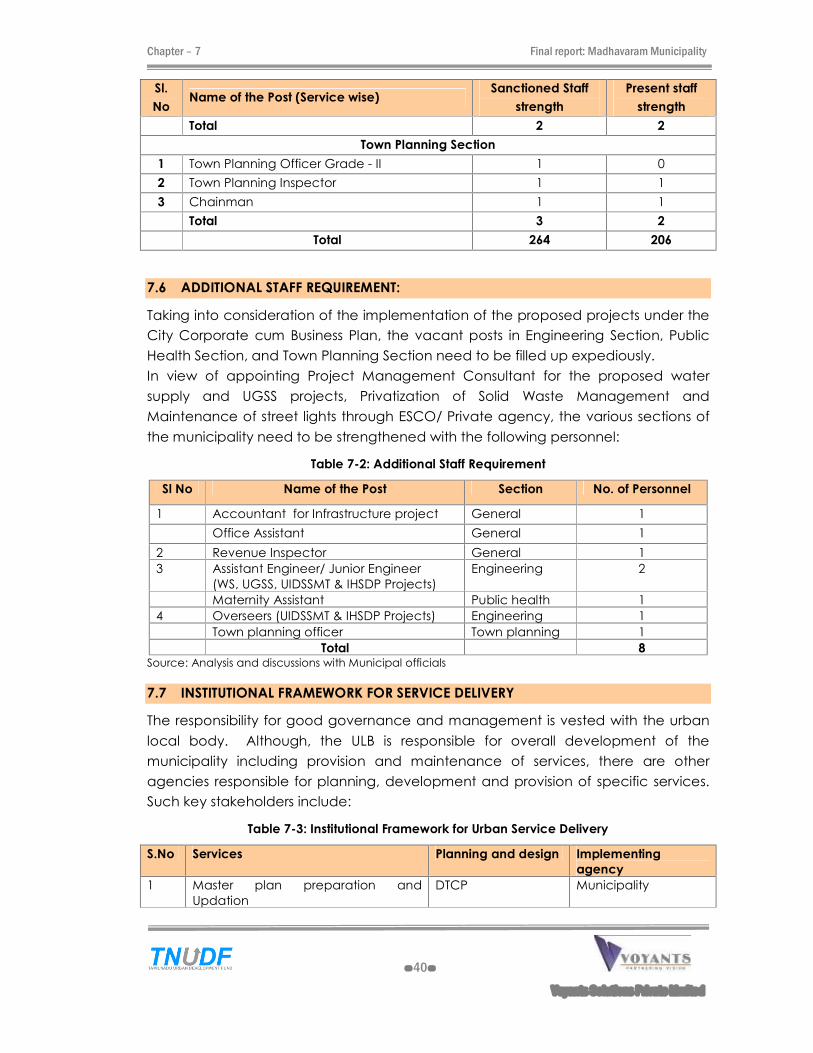
Chapter � 7 Final report: Madhavaram Municipality
- 40 -
Voyants Solutions Private Limited
Sl.
No Name of the Post (Service wise)
Sanctioned Staff
strength
Present staff
strength
Total 2 2
Town Planning Section
1 Town Planning Officer Grade - II 1 0
2 Town Planning Inspector 1 1
3 Chainman 1 1
Total 3 2
Total 264 206
7.6 ADDITIONAL STAFF REQUIREMENT:
Taking into consideration of the implementation of the proposed projects under the
City Corporate cum Business Plan, the vacant posts in Engineering Section, Public
Health Section, and Town Planning Section need to be filled up expediously.
In view of appointing Project Management Consultant for the proposed water
supply and UGSS projects, Privatization of Solid Waste Management and
Maintenance of street lights through ESCO/ Private agency, the various sections of
the municipality need to be strengthened with the following personnel:
Table 7-2: Additional Staff Requirement
Sl No Name of the Post Section No. of Personnel
1 Accountant for Infrastructure project General 1
Office Assistant General 1
2 Revenue Inspector General 1
3 Assistant Engineer/ Junior Engineer
(WS, UGSS, UIDSSMT & IHSDP Projects)
Engineering 2
Maternity Assistant Public health 1
4 Overseers (UIDSSMT & IHSDP Projects) Engineering 1
Town planning officer Town planning 1
Total 8
Source: Analysis and discussions with Municipal officials
7.7 INSTITUTIONAL FRAMEWORK FOR SERVICE DELIVERY
The responsibility for good governance and management is vested with the urban
local body. Although, the ULB is responsible for overall development of the
municipality including provision and maintenance of services, there are other
agencies responsible for planning, development and provision of specific services.
Such key stakeholders include:
Table 7-3: Institutional Framework for Urban Service Delivery
S.No Services Planning and design Implementing
agency
1 Master plan preparation and
Updation
DTCP Municipality
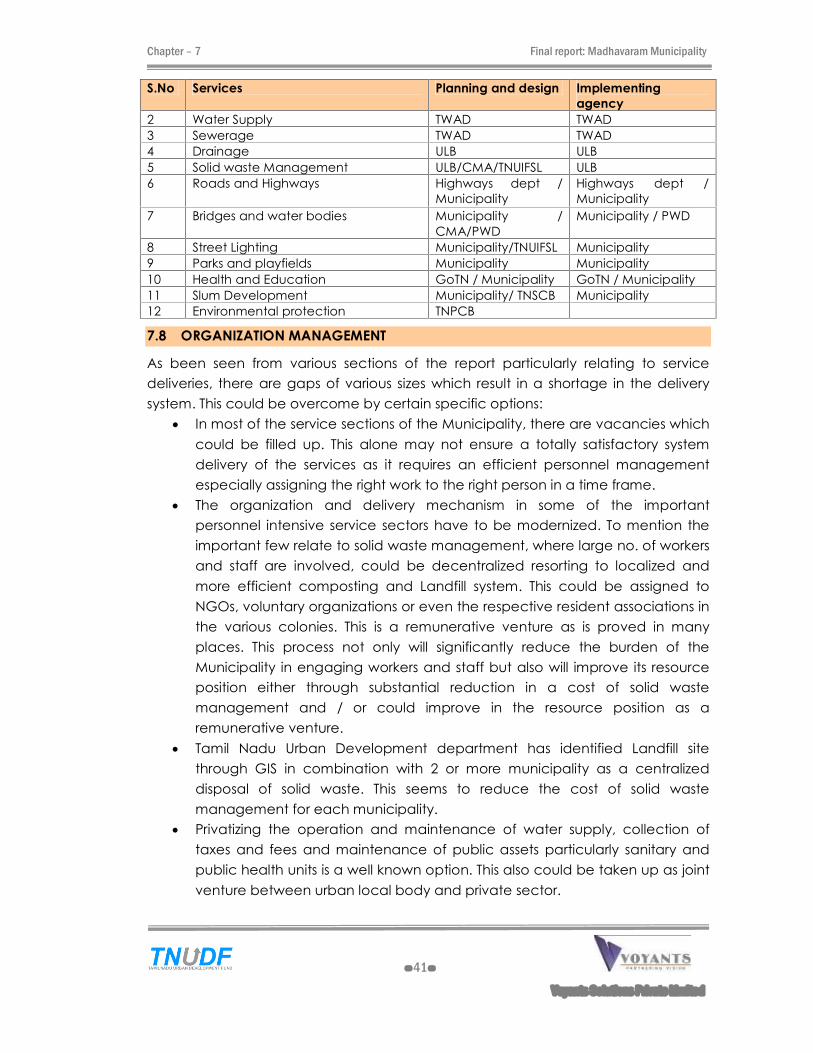
Chapter � 7 Final report: Madhavaram Municipality
- 41 -
Voyants Solutions Private Limited
S.No Services Planning and design Implementing
agency
2 Water Supply TWAD TWAD
3 Sewerage TWAD TWAD
4 Drainage ULB ULB
5 Solid waste Management ULB/CMA/TNUIFSL ULB
6 Roads and Highways Highways dept /
Municipality
Highways dept /
Municipality
7 Bridges and water bodies Municipality /
CMA/PWD
Municipality / PWD
8 Street Lighting Municipality/TNUIFSL Municipality
9 Parks and playfields Municipality Municipality
10 Health and Education GoTN / Municipality GoTN / Municipality
11 Slum Development Municipality/ TNSCB Municipality
12 Environmental protection TNPCB
7.8 ORGANIZATION MANAGEMENT
As been seen from various sections of the report particularly relating to service
deliveries, there are gaps of various sizes which result in a shortage in the delivery
system. This could be overcome by certain specific options:
In most of the service sections of the Municipality, there are vacancies which
could be filled up. This alone may not ensure a totally satisfactory system
delivery of the services as it requires an efficient personnel management
especially assigning the right work to the right person in a time frame.
The organization and delivery mechanism in some of the important
personnel intensive service sectors have to be modernized. To mention the
important few relate to solid waste management, where large no. of workers
and staff are involved, could be decentralized resorting to localized and
more efficient composting and Landfill system. This could be assigned to
NGOs, voluntary organizations or even the respective resident associations in
the various colonies. This is a remunerative venture as is proved in many
places. This process not only will significantly reduce the burden of the
Municipality in engaging workers and staff but also will improve its resource
position either through substantial reduction in a cost of solid waste
management and / or could improve in the resource position as a
remunerative venture.
Tamil Nadu Urban Development department has identified Landfill site
through GIS in combination with 2 or more municipality as a centralized
disposal of solid waste. This seems to reduce the cost of solid waste
management for each municipality.
Privatizing the operation and maintenance of water supply, collection of
taxes and fees and maintenance of public assets particularly sanitary and
public health units is a well known option. This also could be taken up as joint
venture between urban local body and private sector.
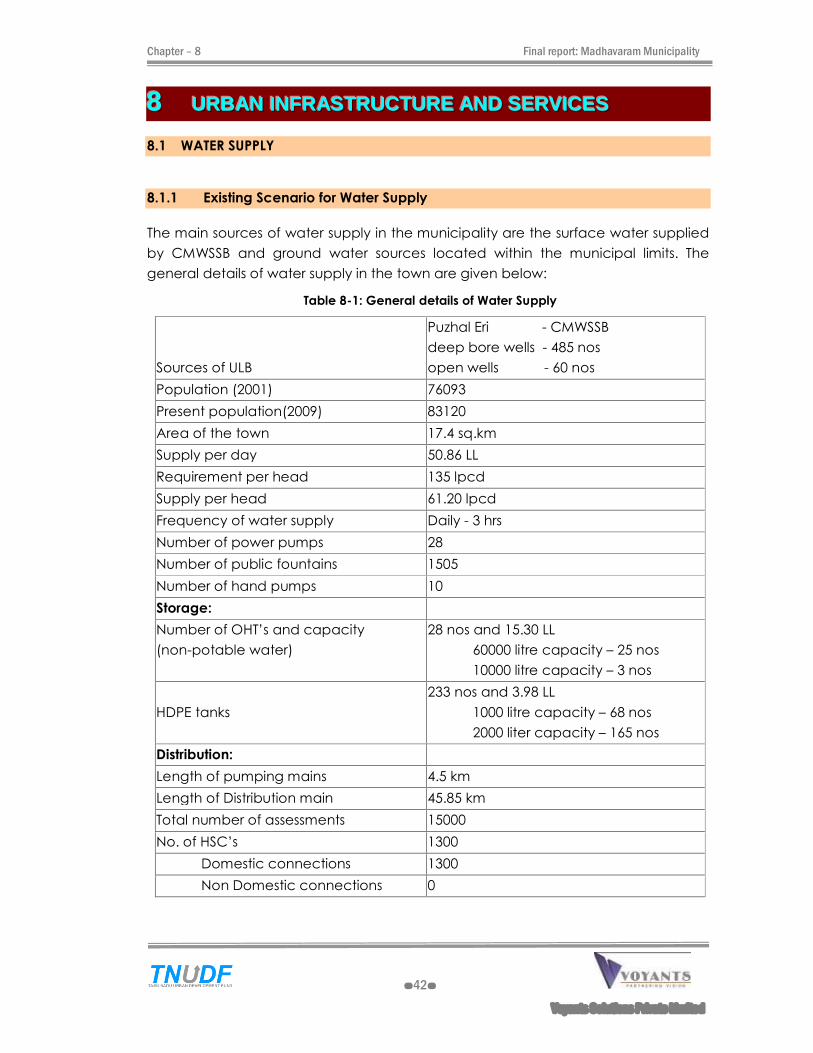
Chapter � 8 Final report: Madhavaram Municipality
- 42 -
Voyants Solutions Private Limited
888 UUURRRBBBAAANNN IIINNNFFFRRRAAASSSTTTRRRUUUCCCTTTUUURRREEE AAANNNDDD SSSEEERRRVVVIIICCCEEESSS
8.1 WATER SUPPLY
8.1.1 Existing Scenario for Water Supply
The main sources of water supply in the municipality are the surface water supplied
by CMWSSB and ground water sources located within the municipal limits. The
general details of water supply in the town are given below:
Table 8-1: General details of Water Supply
Sources of ULB
Puzhal Eri - CMWSSB
deep bore wells - 485 nos
open wells - 60 nos
Population (2001) 76093
Present population(2009) 83120
Area of the town 17.4 sq.km
Supply per day 50.86 LL
Requirement per head 135 lpcd
Supply per head 61.20 lpcd
Frequency of water supply Daily - 3 hrs
Number of power pumps 28
Number of public fountains 1505
Number of hand pumps 10
Storage:
Number of OHT�s and capacity
(non-potable water)
28 nos and 15.30 LL
60000 litre capacity � 25 nos
10000 litre capacity � 3 nos
HDPE tanks
233 nos and 3.98 LL
1000 litre capacity � 68 nos
2000 liter capacity � 165 nos
Distribution:
Length of pumping mains 4.5 km
Length of Distribution main 45.85 km
Total number of assessments 15000
No. of HSC�s 1300
Domestic connections 1300
Non Domestic connections 0
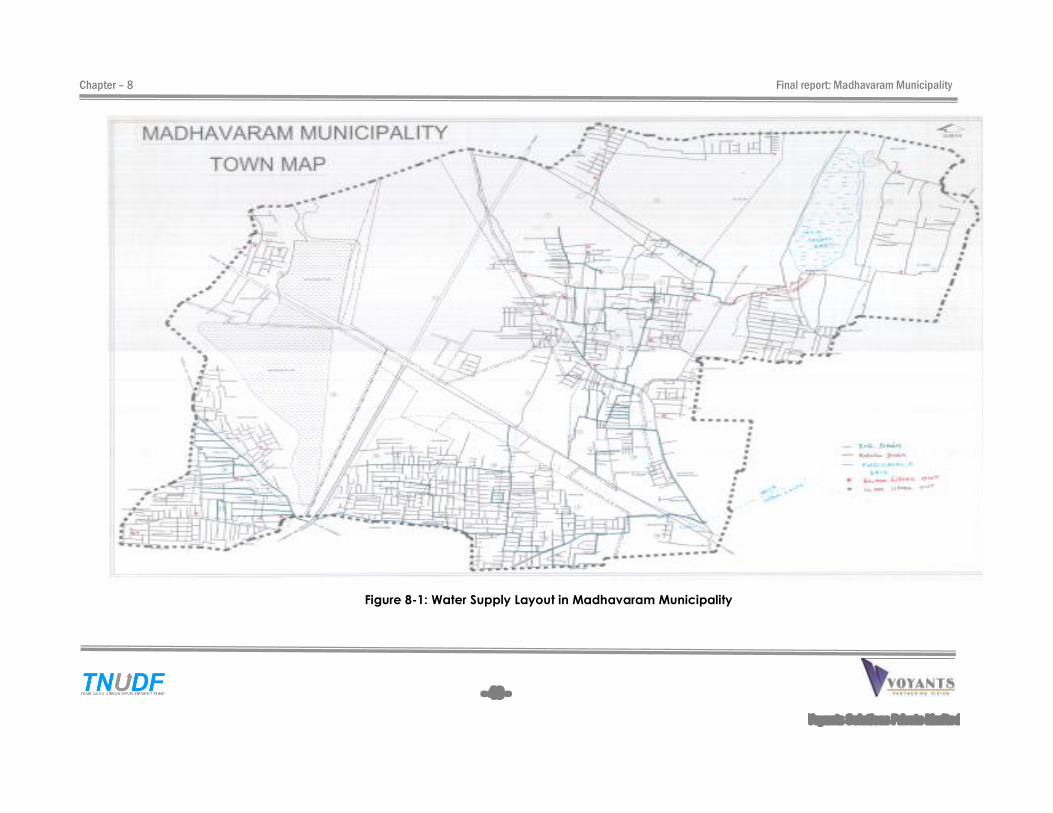
Chapter � 8 Final report: Madhavaram Municipality
- 43 -
Voyants Solutions Private Limited
Figure 8-1: Water Supply Layout in Madhavaram Municipality
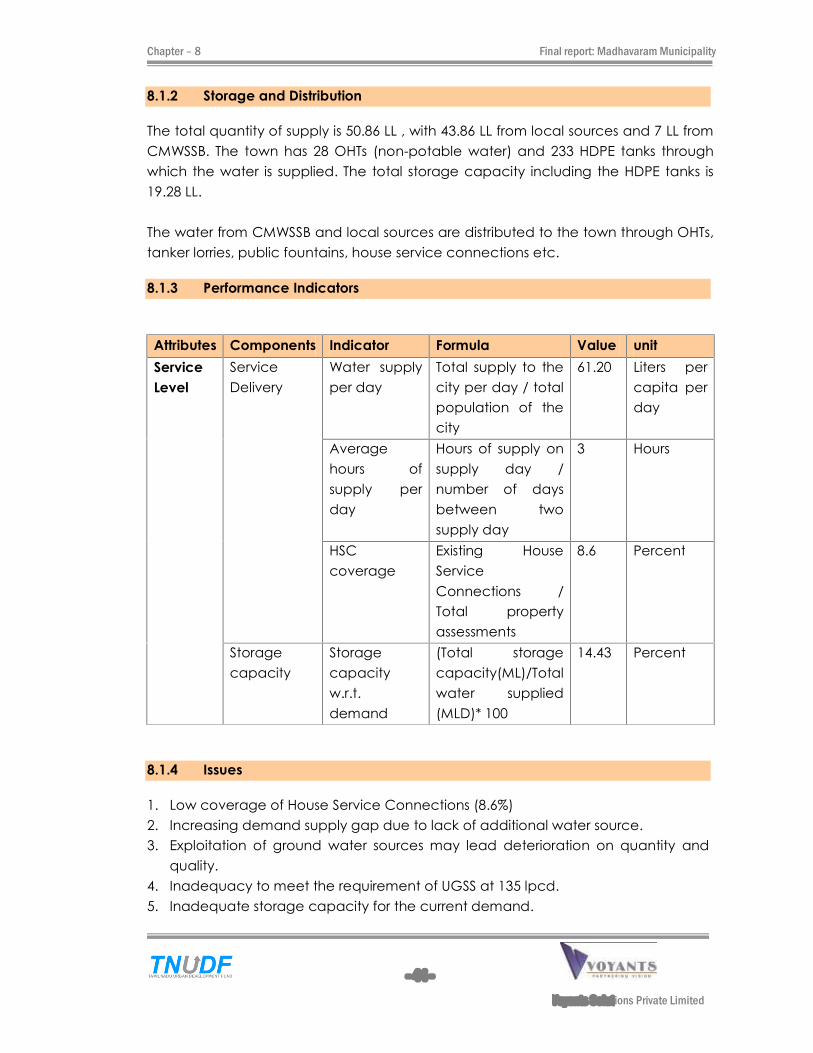
Chapter � 8 Final report: Madhavaram Municipality
- 44 -
Voyants Solutions Private Limited
8.1.2 Storage and Distribution
The total quantity of supply is 50.86 LL , with 43.86 LL from local sources and 7 LL from
CMWSSB. The town has 28 OHTs (non-potable water) and 233 HDPE tanks through
which the water is supplied. The total storage capacity including the HDPE tanks is
19.28 LL.
The water from CMWSSB and local sources are distributed to the town through OHTs,
tanker lorries, public fountains, house service connections etc.
8.1.3 Performance Indicators
Attributes Components Indicator Formula Value unit
Service
Level
Service
Delivery
Water supply
per day
Total supply to the
city per day / total
population of the
city
61.20 Liters per
capita per
day
Average
hours of
supply per
day
Hours of supply on
supply day /
number of days
between two
supply day
3 Hours
HSC
coverage
Existing House
Service
Connections /
Total property
assessments
8.6 Percent
Storage
capacity
Storage
capacity
w.r.t.
demand
(Total storage
capacity(ML)/Total
water supplied
(MLD)* 100
14.43 Percent
8.1.4 Issues
1. Low coverage of House Service Connections (8.6%)
2. Increasing demand supply gap due to lack of additional water source.
3. Exploitation of ground water sources may lead deterioration on quantity and
quality.
4. Inadequacy to meet the requirement of UGSS at 135 lpcd.
5. Inadequate storage capacity for the current demand.
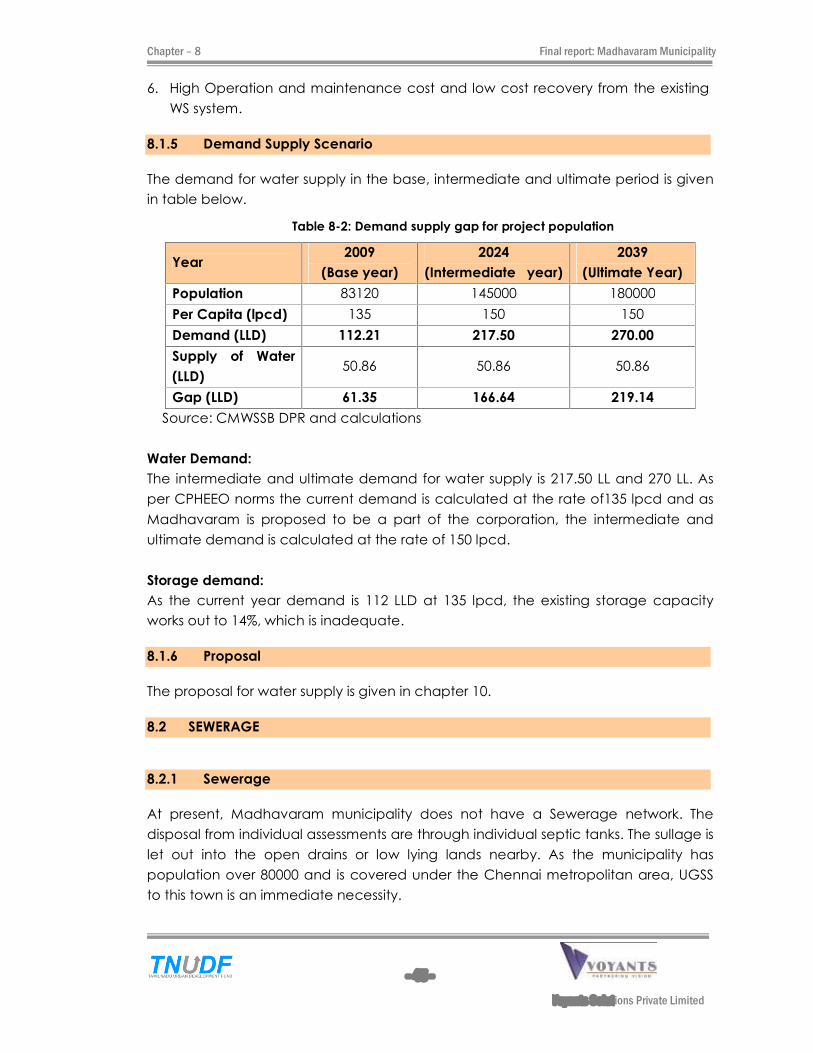
Chapter � 8 Final report: Madhavaram Municipality
- 45 -
Voyants Solutions Private Limited
6. High Operation and maintenance cost and low cost recovery from the existing
WS system.
8.1.5 Demand Supply Scenario
The demand for water supply in the base, intermediate and ultimate period is given
in table below.
Table 8-2: Demand supply gap for project population
Year 2009
(Base year)
2024
(Intermediate year)
2039
(Ultimate Year)
Population 83120 145000 180000
Per Capita (lpcd) 135 150 150
Demand (LLD) 112.21 217.50 270.00
Supply of Water
(LLD) 50.86 50.86 50.86
Gap (LLD) 61.35 166.64 219.14
Source: CMWSSB DPR and calculations
Water Demand:
The intermediate and ultimate demand for water supply is 217.50 LL and 270 LL. As
per CPHEEO norms the current demand is calculated at the rate of135 lpcd and as
Madhavaram is proposed to be a part of the corporation, the intermediate and
ultimate demand is calculated at the rate of 150 lpcd.
Storage demand:
As the current year demand is 112 LLD at 135 lpcd, the existing storage capacity
works out to 14%, which is inadequate.
8.1.6 Proposal
The proposal for water supply is given in chapter 10.
8.2 SEWERAGE
8.2.1 Sewerage
At present, Madhavaram municipality does not have a Sewerage network. The
disposal from individual assessments are through individual septic tanks. The sullage is
let out into the open drains or low lying lands nearby. As the municipality has
population over 80000 and is covered under the Chennai metropolitan area, UGSS
to this town is an immediate necessity.
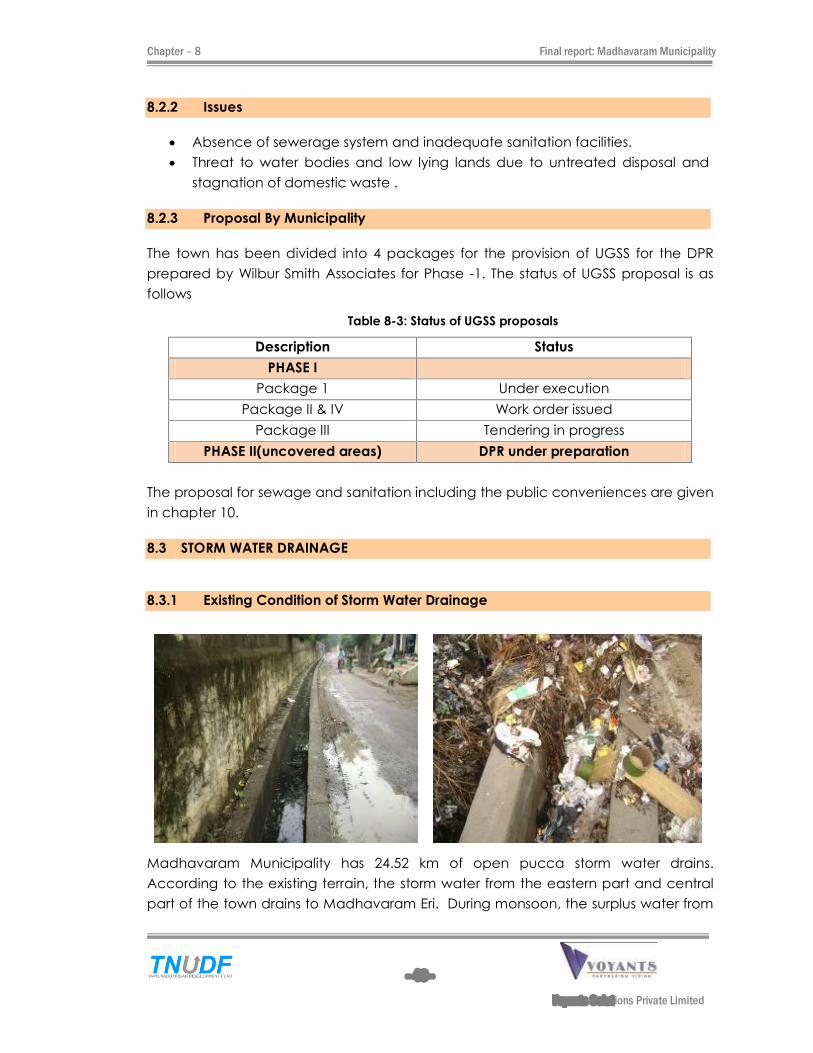
Chapter � 8 Final report: Madhavaram Municipality
- 46 -
Voyants Solutions Private Limited
8.2.2 Issues
Absence of sewerage system and inadequate sanitation facilities.
Threat to water bodies and low lying lands due to untreated disposal and
stagnation of domestic waste .
8.2.3 Proposal By Municipality
The town has been divided into 4 packages for the provision of UGSS for the DPR
prepared by Wilbur Smith Associates for Phase -1. The status of UGSS proposal is as
follows
Table 8-3: Status of UGSS proposals
Description Status
PHASE I
Package 1 Under execution
Package II & IV Work order issued
Package III Tendering in progress
PHASE II(uncovered areas) DPR under preparation
The proposal for sewage and sanitation including the public conveniences are given
in chapter 10.
8.3 STORM WATER DRAINAGE
8.3.1 Existing Condition of Storm Water Drainage
Madhavaram Municipality has 24.52 km of open pucca storm water drains.
According to the existing terrain, the storm water from the eastern part and central
part of the town drains to Madhavaram Eri. During monsoon, the surplus water from
Chapter � 8 Final report: Madhavaram Municipality
- 47 -
Voyants Solutions Private Limited
Retteri reaches the sea through Thanikachalam canal (connecting canal to
Buckingham Canal) via Madhavaram which is causing inundation. The details of
road length and existing drains are given below:
Table 8-4 � Existing Strom water Condition
S.No Description Length in km
1 Total length of roads and streets 127.17
2 Length of existing Drain 24.52
8.3.2 Performance Indicators
Service level Indicator Normative
Standard Existing status
Percentage of road length with storm water
drains 130% 20%
8.3.3 Issues in Storm Water Drainage and Household Drainage
Absence of comprehensive drainage system.
Water stagnation is increasing due to dumping of household waste into the
drains
Stagnation of water during monsoon causes damage to private and public
property.
Inadequate storm water drainage coverage.
Inadequate trunk drains leading to the major water bodies in the
surroundings.
8.3.4 Proposal
The proposal for storm water drainage system for horizon year is given in chapter 10.
8.4 SOLID WASTE MANAGEMENT
8.4.1 Existing situation
The daily average waste generation in Madhavaram municipality is 52 Metric Tonnes
(MT) which works out to 625 grams per capita per day. The salient features of the
solid waste management in Madhavaram municipality are given below:
Table 8-5 � SWM-General details
S.No Description units Numbers
1 Total Solid waste Generation MT 52
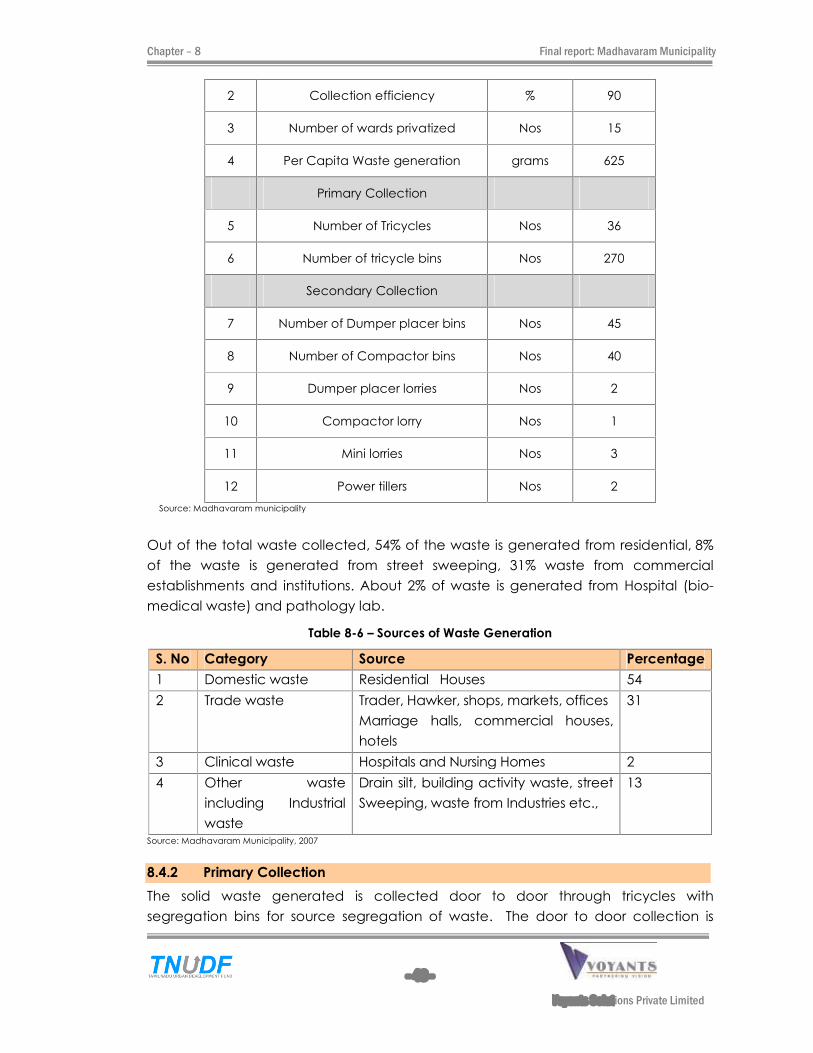
Chapter � 8 Final report: Madhavaram Municipality
- 48 -
Voyants Solutions Private Limited
2 Collection efficiency % 90
3 Number of wards privatized Nos 15
4 Per Capita Waste generation grams 625
Primary Collection
5 Number of Tricycles Nos 36
6 Number of tricycle bins Nos 270
Secondary Collection
7 Number of Dumper placer bins Nos 45
8 Number of Compactor bins Nos 40
9 Dumper placer lorries Nos 2
10 Compactor lorry Nos 1
11 Mini lorries Nos 3
12 Power tillers Nos 2
Source: Madhavaram municipality
Out of the total waste collected, 54% of the waste is generated from residential, 8%
of the waste is generated from street sweeping, 31% waste from commercial
establishments and institutions. About 2% of waste is generated from Hospital (bio-
medical waste) and pathology lab.
Table 8-6 � Sources of Waste Generation
S. No Category Source Percentage
1 Domestic waste Residential Houses 54
2 Trade waste
Trader, Hawker, shops, markets, offices
Marriage halls, commercial houses,
hotels
31
3 Clinical waste Hospitals and Nursing Homes 2
4 Other waste
including Industrial
waste
Drain silt, building activity waste, street
Sweeping, waste from Industries etc.,
13
Source: Madhavaram Municipality, 2007
8.4.2 Primary Collection
The solid waste generated is collected door to door through tricycles with
segregation bins for source segregation of waste. The door to door collection is

Chapter � 8 Final report: Madhavaram Municipality
- 49 -
Voyants Solutions Private Limited
privatized in 15 wards. There are about 85 container bins (dumper placer bins and
compactor bins) which are placed at various locations of the town.
8.4.3 Secondary Collection
The waste collected in the dumper placer
and compactor bins are transferred to the
compost yard through dumper placer lorries,
compactor lorry and mini lorries. At present
the waste collected is dumped in the
dumping yard located at Kilburn Nagar (3.66
acres).
Table 8-7: Solid Waste Collection in Madhavaram Town
Type of Practices Availability Practice Duration
Yes No Daily Half
Weekly
Weekly
House-to-house waste collection
Central collection
Street sweeping and collection of
sweeping wastes
Secondary Segregation
Desilting of storm water drains
Desilting of service drains
Secondary waste collection
Transportation of wastes
Disposal of wastes Source: Public Health Department, Madhavaram Municipality, 2006-07
8.4.4 Issues
Uncontrolled littering along main roads & streets.
Absence of effective public participation in segregation of recyclable waste
Lack of adequate infrastructure in compost yard
Kilburn Nagar Compost Yard
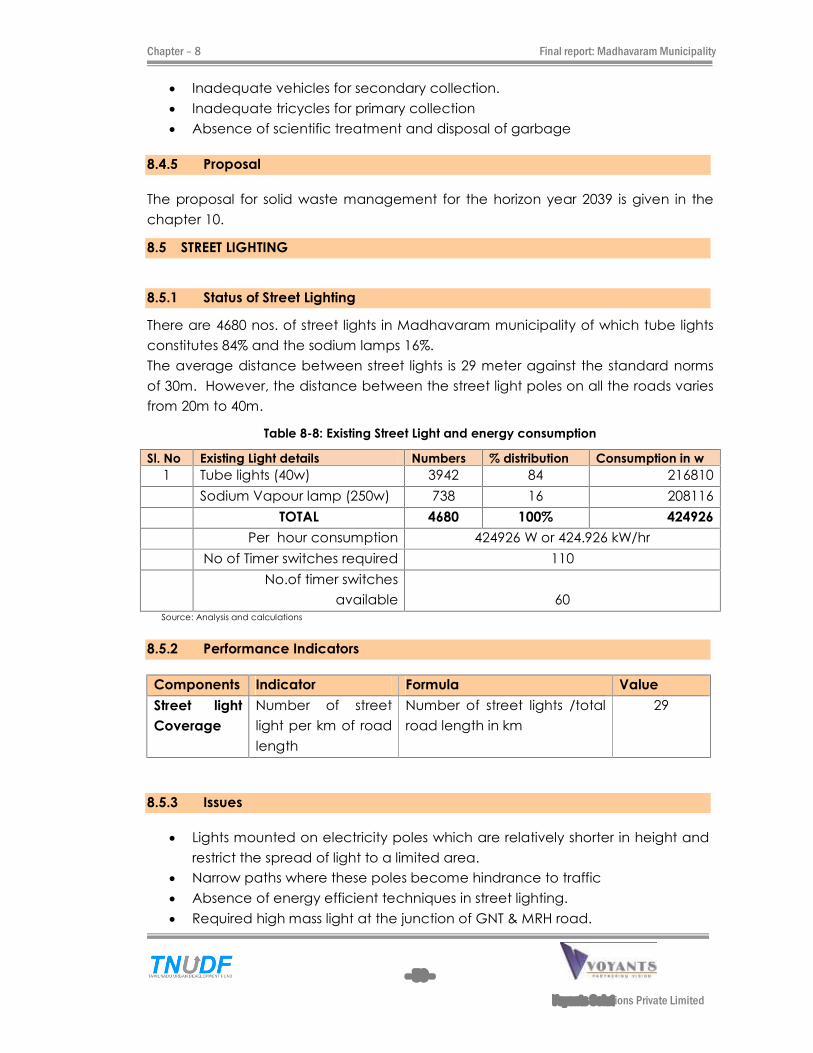
Chapter � 8 Final report: Madhavaram Municipality
- 50 -
Voyants Solutions Private Limited
Inadequate vehicles for secondary collection.
Inadequate tricycles for primary collection
Absence of scientific treatment and disposal of garbage
8.4.5 Proposal
The proposal for solid waste management for the horizon year 2039 is given in the
chapter 10.
8.5 STREET LIGHTING
8.5.1 Status of Street Lighting
There are 4680 nos. of street lights in Madhavaram municipality of which tube lights
constitutes 84% and the sodium lamps 16%.
The average distance between street lights is 29 meter against the standard norms
of 30m. However, the distance between the street light poles on all the roads varies
from 20m to 40m.
Table 8-8: Existing Street Light and energy consumption
Sl. No Existing Light details Numbers % distribution Consumption in w
1 Tube lights (40w) 3942 84 216810
Sodium Vapour lamp (250w) 738 16 208116
TOTAL 4680 100% 424926
Per hour consumption 424926 W or 424.926 kW/hr
No of Timer switches required 110
No.of timer switches
available 60
Source: Analysis and calculations
8.5.2 Performance Indicators
Components Indicator Formula Value
Street light
Coverage
Number of street
light per km of road
length
Number of street lights /total
road length in km
29
8.5.3 Issues
Lights mounted on electricity poles which are relatively shorter in height and
restrict the spread of light to a limited area.
Narrow paths where these poles become hindrance to traffic
Absence of energy efficient techniques in street lighting.
Required high mass light at the junction of GNT & MRH road.

Chapter � 8 Final report: Madhavaram Municipality
- 51 -
Voyants Solutions Private Limited
8.5.4 Proposal
The proposal for improving street light facilities is given in chapter 10.
8.6 ROAD
Madhavaram lies on the NH-5 in the northern suburb of Chennai, connecting the
industrial towns of North Tamil Nadu and South Andhra Pradesh.
The major road network in the town connecting to various urban nodes are
Erukkancheri High Road � NH 5, Perambur High Road, Jawaharlal Nehru Road,
Madhavaram High Road.
8.6.1 Town Level Road Network and Hierarchy
The circulation roads in the town are
maintained by the municipality and partly by
Highways Department. The total length of
road network in the town is 127.17 km. The
category of the roads maintained by the
municipality is given in table below:
Table 8-9: Types of Roads in Madhavaram Municipality
S. No. Type of Roads Length in
km
Percentage
1 Highways 10.00 -
Municipal roads
2 B.T. Roads 101.08 79.50
3 C.C. Roads 5.31 4.20
4 WBM Roads 16.79 13.20
5 Earthen 3.99 3.10
Total municipal road length 127.17 100%
Total road length in the town 137.17
Source: Madhavaram Municipality
8.6.2 Parking
There is no authorized parking area in the town. The private vehicles such as auto-
rickshaws, four wheelers especially trucks, two wheelers are generally parked on
road intersection or along the road sides leading to congestion and reducing the
carrying capacity of the roads.
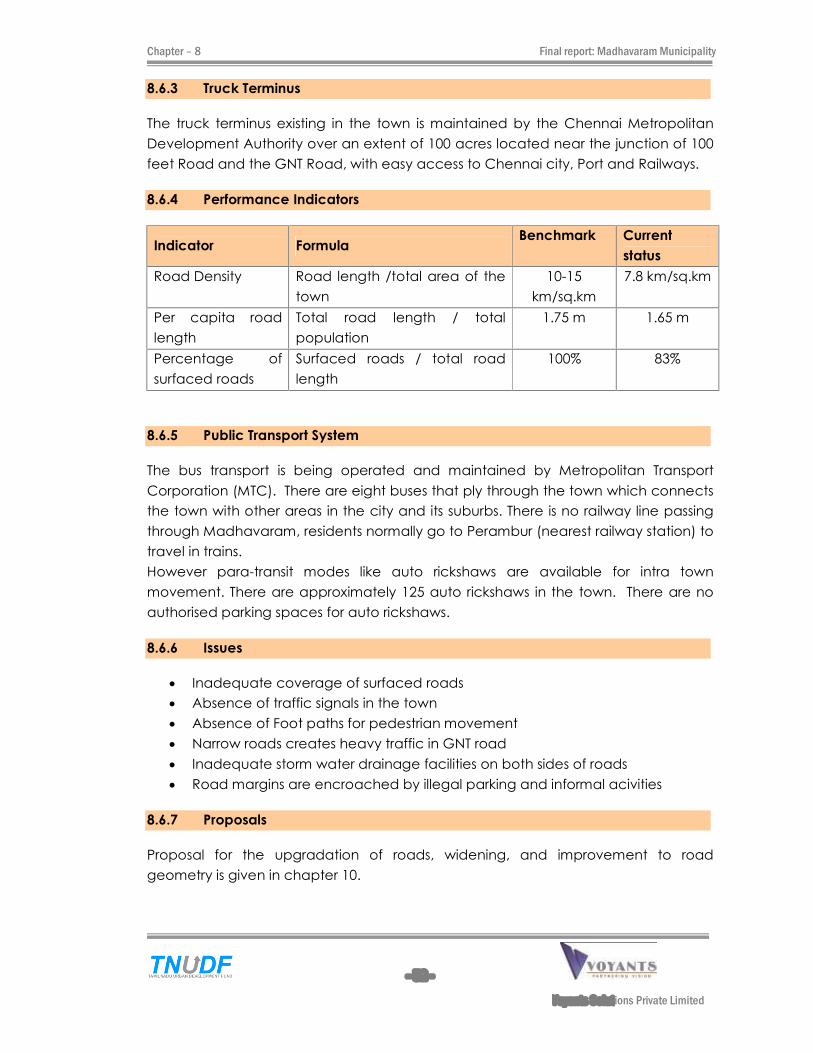
Chapter � 8 Final report: Madhavaram Municipality
- 52 -
Voyants Solutions Private Limited
8.6.3 Truck Terminus
The truck terminus existing in the town is maintained by the Chennai Metropolitan
Development Authority over an extent of 100 acres located near the junction of 100
feet Road and the GNT Road, with easy access to Chennai city, Port and Railways.
8.6.4 Performance Indicators
Indicator Formula Benchmark Current
status
Road Density Road length /total area of the
town
10-15
km/sq.km
7.8 km/sq.km
Per capita road
length
Total road length / total
population
1.75 m 1.65 m
Percentage of
surfaced roads
Surfaced roads / total road
length
100% 83%
8.6.5 Public Transport System
The bus transport is being operated and maintained by Metropolitan Transport
Corporation (MTC). There are eight buses that ply through the town which connects
the town with other areas in the city and its suburbs. There is no railway line passing
through Madhavaram, residents normally go to Perambur (nearest railway station) to
travel in trains.
However para-transit modes like auto rickshaws are available for intra town
movement. There are approximately 125 auto rickshaws in the town. There are no
authorised parking spaces for auto rickshaws.
8.6.6 Issues
Inadequate coverage of surfaced roads
Absence of traffic signals in the town
Absence of Foot paths for pedestrian movement
Narrow roads creates heavy traffic in GNT road
Inadequate storm water drainage facilities on both sides of roads
Road margins are encroached by illegal parking and informal acivities
8.6.7 Proposals
Proposal for the upgradation of roads, widening, and improvement to road
geometry is given in chapter 10.
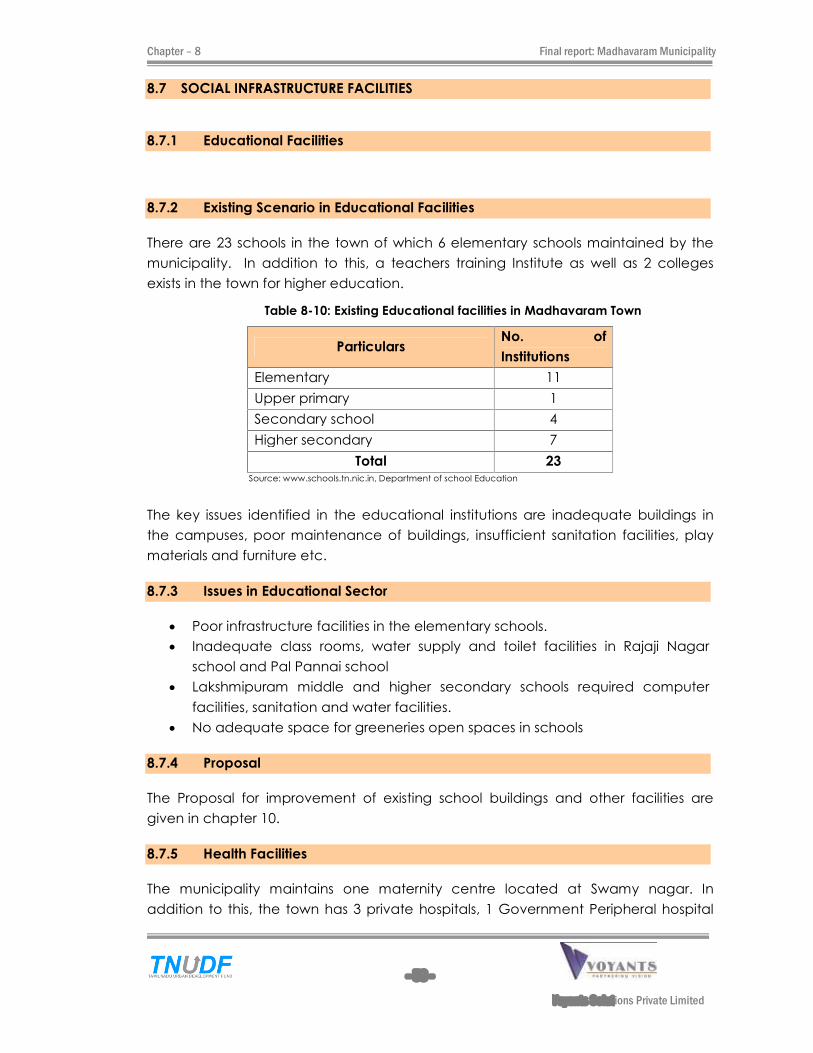
Chapter � 8 Final report: Madhavaram Municipality
- 53 -
Voyants Solutions Private Limited
8.7 SOCIAL INFRASTRUCTURE FACILITIES
8.7.1 Educational Facilities
8.7.2 Existing Scenario in Educational Facilities
There are 23 schools in the town of which 6 elementary schools maintained by the
municipality. In addition to this, a teachers training Institute as well as 2 colleges
exists in the town for higher education.
Table 8-10: Existing Educational facilities in Madhavaram Town
Particulars No. of
Institutions
Elementary 11
Upper primary 1
Secondary school 4
Higher secondary 7
Total 23
Source: www.schools.tn.nic.in, Department of school Education
The key issues identified in the educational institutions are inadequate buildings in
the campuses, poor maintenance of buildings, insufficient sanitation facilities, play
materials and furniture etc.
8.7.3 Issues in Educational Sector
Poor infrastructure facilities in the elementary schools.
Inadequate class rooms, water supply and toilet facilities in Rajaji Nagar
school and Pal Pannai school
Lakshmipuram middle and higher secondary schools required computer
facilities, sanitation and water facilities.
No adequate space for greeneries open spaces in schools
8.7.4 Proposal
The Proposal for improvement of existing school buildings and other facilities are
given in chapter 10.
8.7.5 Health Facilities
The municipality maintains one maternity centre located at Swamy nagar. In
addition to this, the town has 3 private hospitals, 1 Government Peripheral hospital
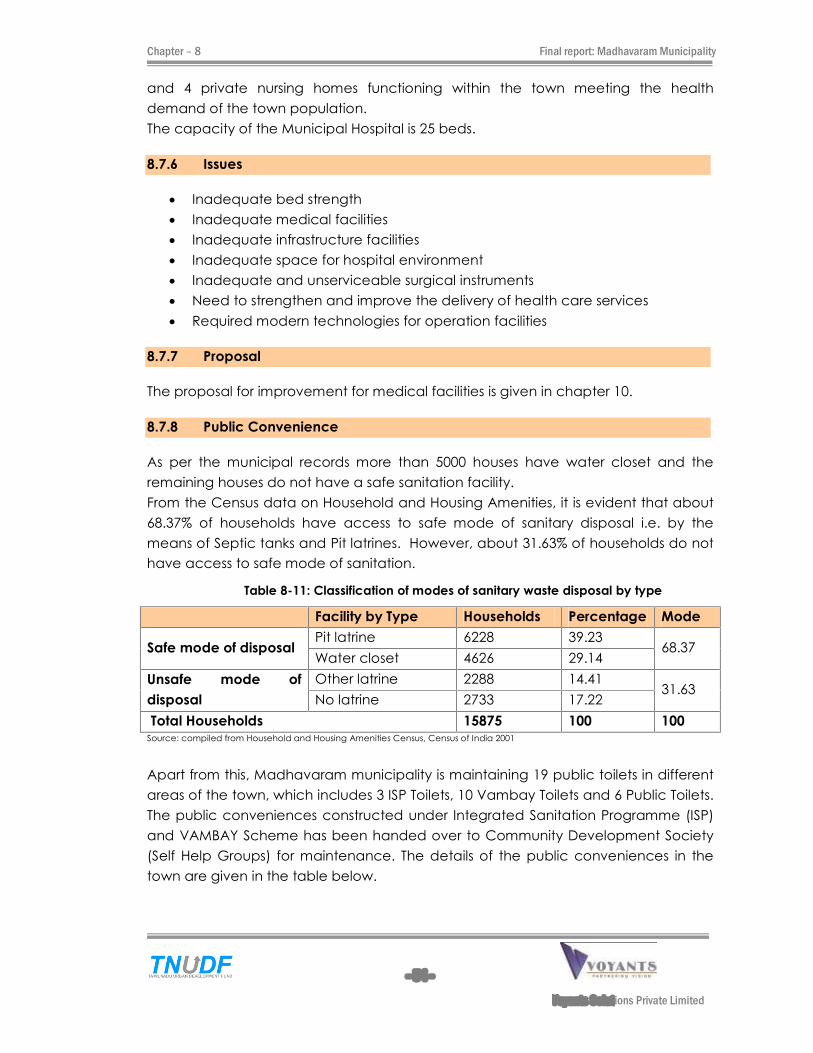
Chapter � 8 Final report: Madhavaram Municipality
- 54 -
Voyants Solutions Private Limited
and 4 private nursing homes functioning within the town meeting the health
demand of the town population.
The capacity of the Municipal Hospital is 25 beds.
8.7.6 Issues
Inadequate bed strength
Inadequate medical facilities
Inadequate infrastructure facilities
Inadequate space for hospital environment
Inadequate and unserviceable surgical instruments
Need to strengthen and improve the delivery of health care services
Required modern technologies for operation facilities
8.7.7 Proposal
The proposal for improvement for medical facilities is given in chapter 10.
8.7.8 Public Convenience
As per the municipal records more than 5000 houses have water closet and the
remaining houses do not have a safe sanitation facility.
From the Census data on Household and Housing Amenities, it is evident that about
68.37% of households have access to safe mode of sanitary disposal i.e. by the
means of Septic tanks and Pit latrines. However, about 31.63% of households do not
have access to safe mode of sanitation.
Table 8-11: Classification of modes of sanitary waste disposal by type
Facility by Type Households Percentage Mode
Safe mode of disposal Pit latrine 6228 39.23
68.37 Water closet 4626 29.14
Unsafe mode of
disposal
Other latrine 2288 14.41 31.63
No latrine 2733 17.22
Total Households 15875 100 100
Source: compiled from Household and Housing Amenities Census, Census of India 2001
Apart from this, Madhavaram municipality is maintaining 19 public toilets in different
areas of the town, which includes 3 ISP Toilets, 10 Vambay Toilets and 6 Public Toilets.
The public conveniences constructed under Integrated Sanitation Programme (ISP)
and VAMBAY Scheme has been handed over to Community Development Society
(Self Help Groups) for maintenance. The details of the public conveniences in the
town are given in the table below.
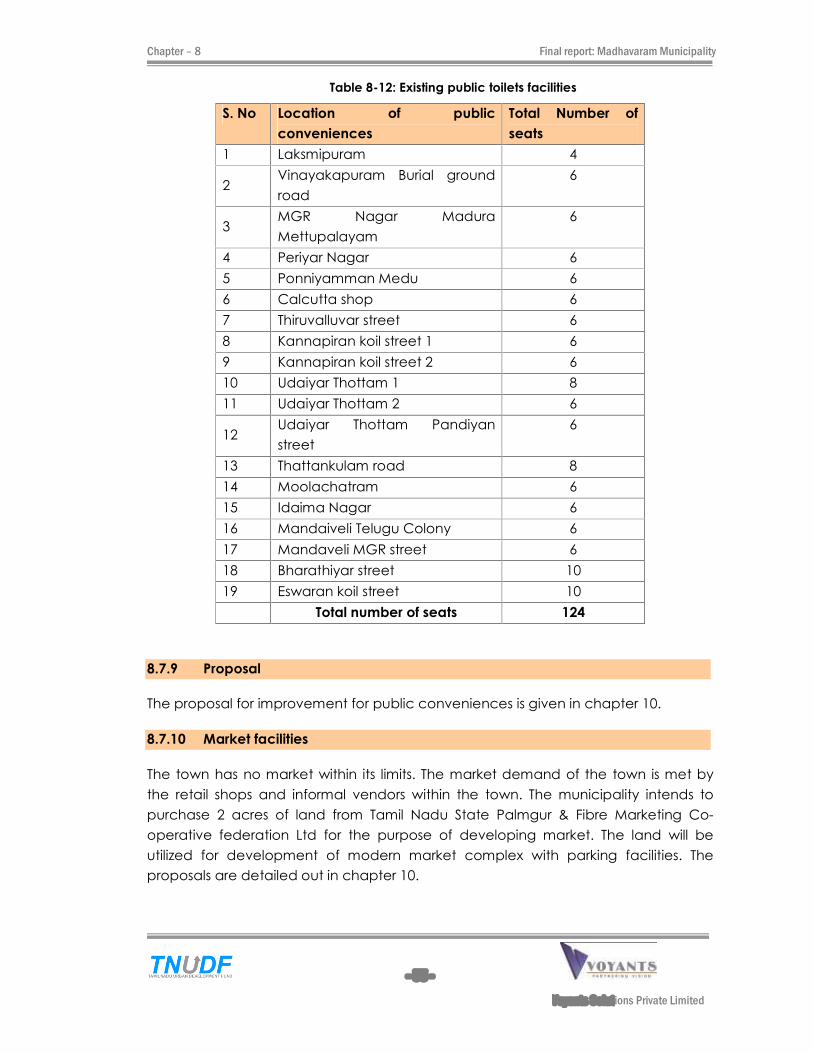
Chapter � 8 Final report: Madhavaram Municipality
- 55 -
Voyants Solutions Private Limited
Table 8-12: Existing public toilets facilities
S. No Location of public
conveniences
Total Number of
seats
1 Laksmipuram 4
2 Vinayakapuram Burial ground
road
6
3 MGR Nagar Madura
Mettupalayam
6
4 Periyar Nagar 6
5 Ponniyamman Medu 6
6 Calcutta shop 6
7 Thiruvalluvar street 6
8 Kannapiran koil street 1 6
9 Kannapiran koil street 2 6
10 Udaiyar Thottam 1 8
11 Udaiyar Thottam 2 6
12 Udaiyar Thottam Pandiyan
street
6
13 Thattankulam road 8
14 Moolachatram 6
15 Idaima Nagar 6
16 Mandaiveli Telugu Colony 6
17 Mandaveli MGR street 6
18 Bharathiyar street 10
19 Eswaran koil street 10
Total number of seats 124
8.7.9 Proposal
The proposal for improvement for public conveniences is given in chapter 10.
8.7.10 Market facilities
The town has no market within its limits. The market demand of the town is met by
the retail shops and informal vendors within the town. The municipality intends to
purchase 2 acres of land from Tamil Nadu State Palmgur & Fibre Marketing Co-
operative federation Ltd for the purpose of developing market. The land will be
utilized for development of modern market complex with parking facilities. The
proposals are detailed out in chapter 10.
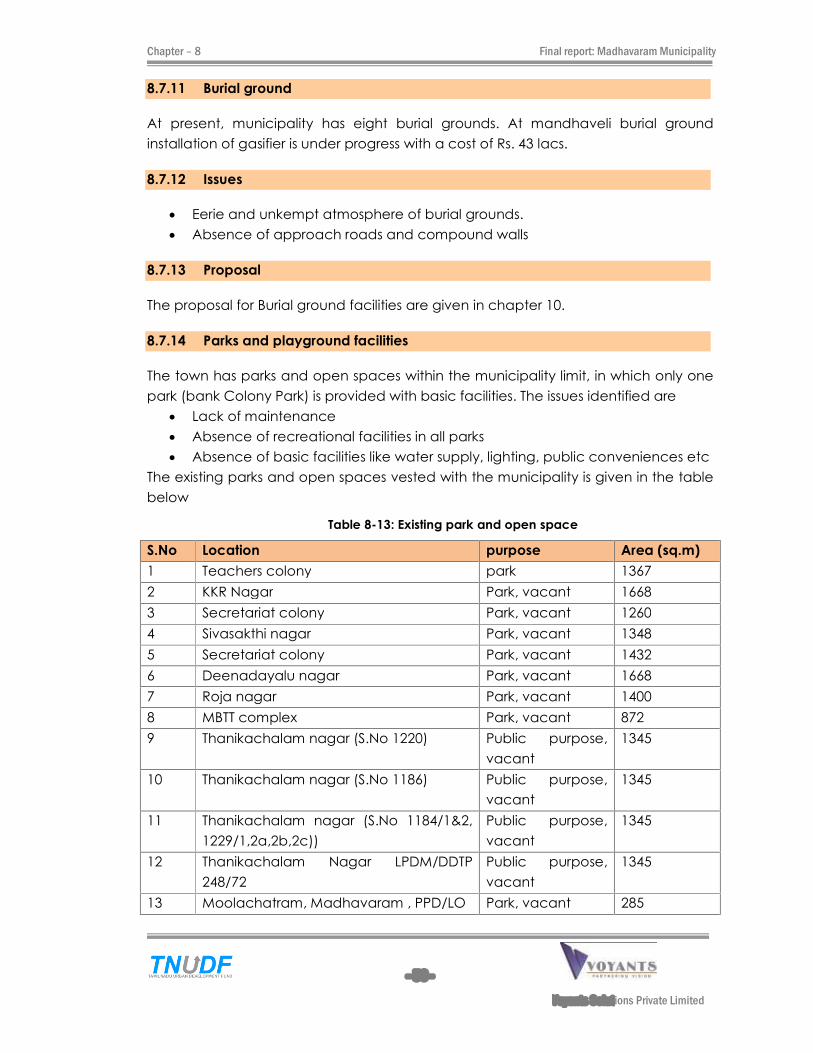
Chapter � 8 Final report: Madhavaram Municipality
- 56 -
Voyants Solutions Private Limited
8.7.11 Burial ground
At present, municipality has eight burial grounds. At mandhaveli burial ground
installation of gasifier is under progress with a cost of Rs. 43 lacs.
8.7.12 Issues
Eerie and unkempt atmosphere of burial grounds.
Absence of approach roads and compound walls
8.7.13 Proposal
The proposal for Burial ground facilities are given in chapter 10.
8.7.14 Parks and playground facilities
The town has parks and open spaces within the municipality limit, in which only one
park (bank Colony Park) is provided with basic facilities. The issues identified are
Lack of maintenance
Absence of recreational facilities in all parks
Absence of basic facilities like water supply, lighting, public conveniences etc
The existing parks and open spaces vested with the municipality is given in the table
below
Table 8-13: Existing park and open space
S.No Location purpose Area (sq.m)
1 Teachers colony park 1367
2 KKR Nagar Park, vacant 1668
3 Secretariat colony Park, vacant 1260
4 Sivasakthi nagar Park, vacant 1348
5 Secretariat colony Park, vacant 1432
6 Deenadayalu nagar Park, vacant 1668
7 Roja nagar Park, vacant 1400
8 MBTT complex Park, vacant 872
9 Thanikachalam nagar (S.No 1220) Public purpose,
vacant
1345
10 Thanikachalam nagar (S.No 1186) Public purpose,
vacant
1345
11 Thanikachalam nagar (S.No 1184/1&2,
1229/1,2a,2b,2c))
Public purpose,
vacant
1345
12 Thanikachalam Nagar LPDM/DDTP
248/72
Public purpose,
vacant
1345
13 Moolachatram, Madhavaram , PPD/LO Park, vacant 285
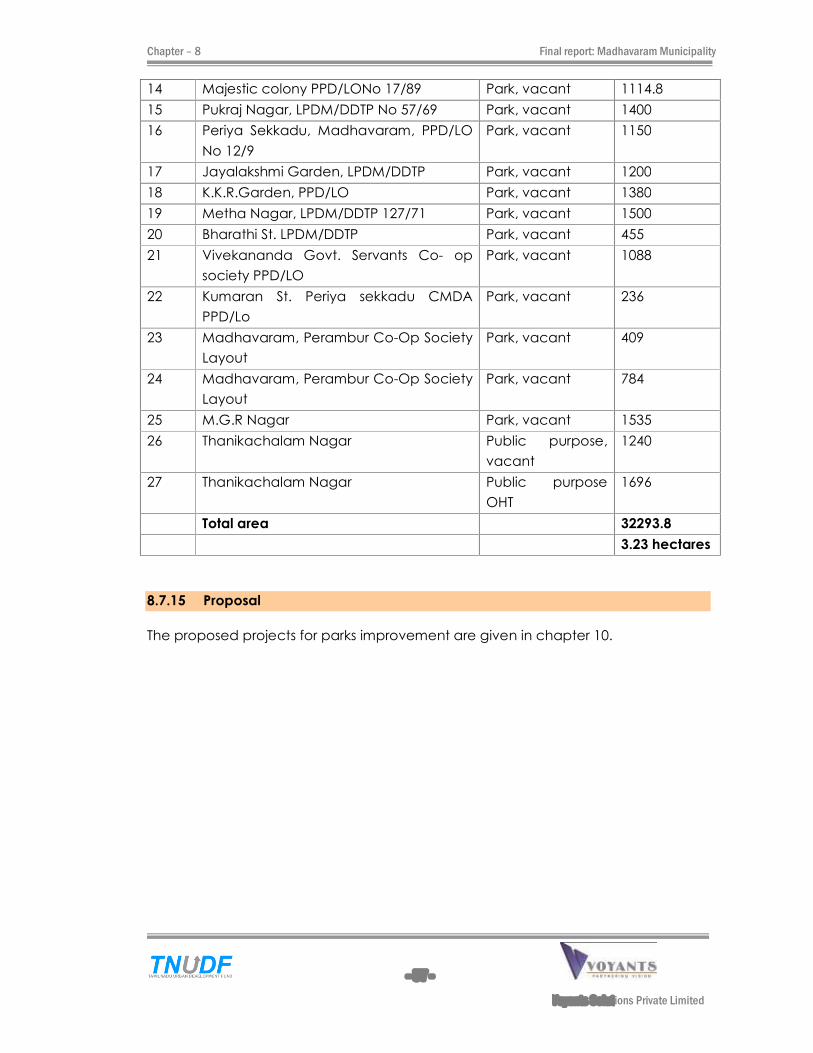
Chapter � 8 Final report: Madhavaram Municipality
- 57 -
Voyants Solutions Private Limited
14 Majestic colony PPD/LONo 17/89 Park, vacant 1114.8
15 Pukraj Nagar, LPDM/DDTP No 57/69 Park, vacant 1400
16 Periya Sekkadu, Madhavaram, PPD/LO
No 12/9
Park, vacant 1150
17 Jayalakshmi Garden, LPDM/DDTP Park, vacant 1200
18 K.K.R.Garden, PPD/LO Park, vacant 1380
19 Metha Nagar, LPDM/DDTP 127/71 Park, vacant 1500
20 Bharathi St. LPDM/DDTP Park, vacant 455
21 Vivekananda Govt. Servants Co- op
society PPD/LO
Park, vacant 1088
22 Kumaran St. Periya sekkadu CMDA
PPD/Lo
Park, vacant 236
23 Madhavaram, Perambur Co-Op Society
Layout
Park, vacant 409
24 Madhavaram, Perambur Co-Op Society
Layout
Park, vacant 784
25 M.G.R Nagar Park, vacant 1535
26 Thanikachalam Nagar Public purpose,
vacant
1240
27 Thanikachalam Nagar Public purpose
OHT
1696
Total area 32293.8
3.23 hectares
8.7.15 Proposal
The proposed projects for parks improvement are given in chapter 10.
Chapter �9 Final Report: Madhavaram Municipality
- 58 -
Voyants Solutions Private Limited
999 MMMUUUNNNIIICCCIIIPPPAAALLL FFFIIINNNAAANNNCCCEEE
9.1 OVERVIEW
Madhavaram Municipality maintains a municipal fund for managing the finances of
the Municipality. The accounts of the municipal fund were maintained on cash
based single entry system till the year 1999-2000. From 1.4.2000 onwards, accrual
based double entry book keeping system was implemented. The Municipality
maintains accounts separately for General Fund, Water Supply and Sewerage Fund
and Education Fund.
This Section contains a description of the municipal finances, the sources and uses
of funds, and an assessment of municipal finances based on important financial
indicators.
9.2 GENERAL DETAILS
Madhavaram is located at Thiruvallur District and the total population as per 2001
census is 76793 Nos. The urban poor comprise about 48% of the total population.
The total number of slums is 19 Nos. with total slum population of 37200 nos, which
aggregates to 48% of total population.
It is a Grade I municipality.
9.3 RECEIPTS
Receipts under the Revenue Account include taxes and fees, grants, water &
sewerage charges, income from properties, service charges charges & fees and
other income.
9.3.1 Property Tax
Property Tax is the single largest tax revenue source and accounts for around 27% of
the total revenue. This tax is levied on residential, commercial, industrial and vacant
lands. The property tax is levied on the basis of Annual Rental Value of the property.
The property tax is levied on the annual value of the property, which is determined
on the basis of gross rent at which the property can be reasonably expected to be
let out.
The Municipality currently charges property tax @ 12.5% per annum on the basis of
Annual Rental Value. The components of property tax are as below :
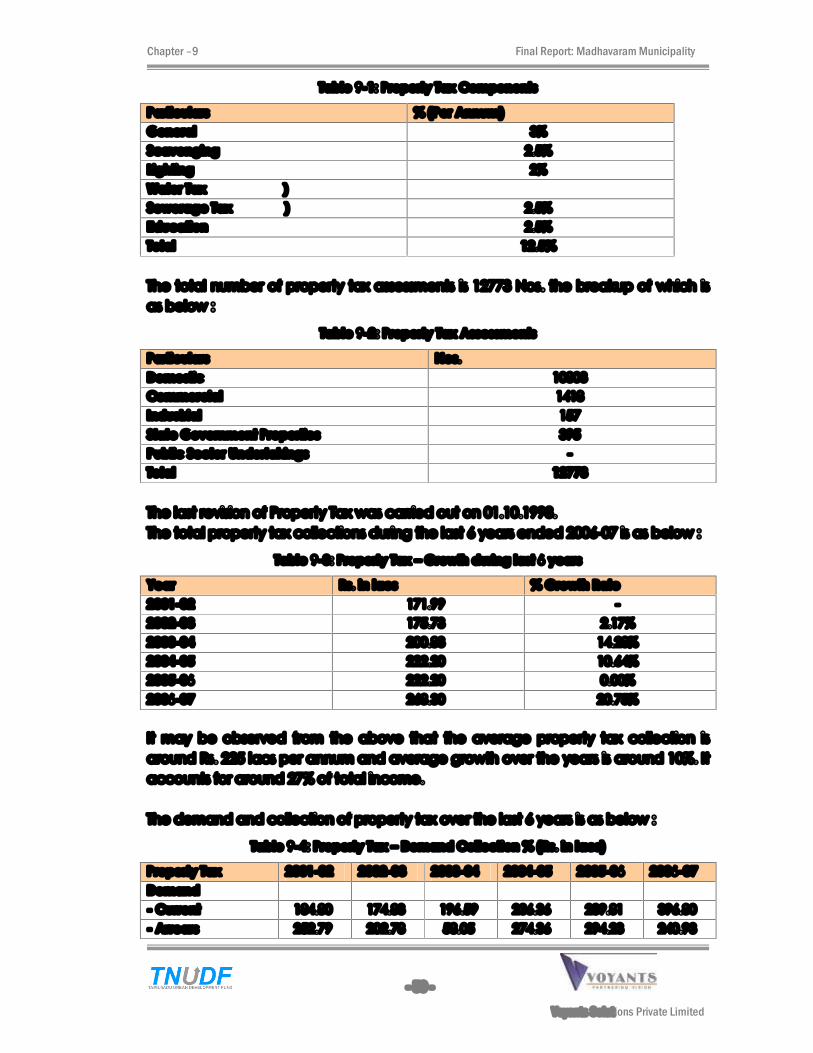
Chapter �9 Final Report: Madhavaram Municipality
- 59 -
Voyants Solutions Private Limited
Table 9-1: Property Tax Components
Particulars % (Per Annum)
General 3%
Scavenging 2.5%
Lighting 2%
Water Tax )
Sewerage Tax ) 2.5%
Education 2.5%
Total 12.5%
The total number of property tax assessments is 12773 Nos. the breakup of which is
as below :
Table 9-2: Property Tax Assessments
Particulars Nos.
Domestic 10803
Commercial 1418
Industrial 157
State Government Properties 395
Public Sector Undertakings -
Total 12773
The last revision of Property Tax was carried out on 01.10.1998.
The total property tax collections during the last 6 years ended 2006-07 is as below :
Table 9-3: Property Tax � Growth during last 6 years
Year Rs. in lacs % Growth Rate
2001-02 171.99 -
2002-03 175.73 2.17%
2003-04 200.83 14.28%
2004-05 222.20 10.64%
2005-06 222.20 0.00%
2006-07 268.30 20.75%
It may be observed from the above that the average property tax collection is
around Rs. 225 lacs per annum and average growth over the years is around 10%. It
accounts for around 27% of total income.
The demand and collection of property tax over the last 6 years is as below :
Table 9-4: Property Tax � Demand Collection % (Rs. in lacs)
Property Tax 2001-02 2002-03 2003-04 2004-05 2005-06 2006-07
Demand
- Current 184.80 174.83 196.59 236.36 239.81 396.80
- Arrears 252.79 202.78 58.05 274.36 294.23 240.93
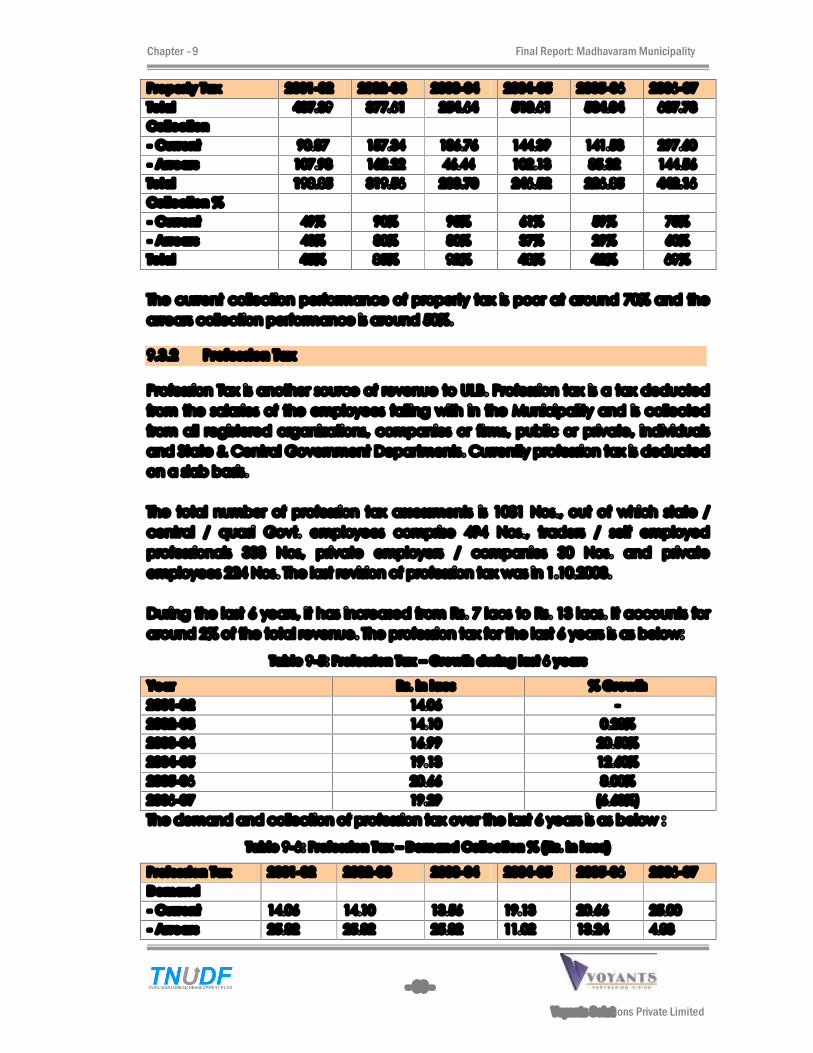
Chapter �9 Final Report: Madhavaram Municipality
- 60 -
Voyants Solutions Private Limited
Property Tax 2001-02 2002-03 2003-04 2004-05 2005-06 2006-07
Total 437.39 377.61 254.64 510.61 534.04 637.73
Collection
- Current 90.87 157.34 186.76 144.39 141.53 297.60
- Arrears 107.98 162.22 46.44 102.13 85.32 144.56
Total 198.85 319.56 233.70 246.52 226.85 442.16
Collection %
- Current 49% 90% 95% 61% 59% 75%
- Arrears 43% 80% 80% 37% 29% 60%
Total 45% 85% 92% 48% 42% 69%
The current collection performance of property tax is poor at around 70% and the
arrears collection performance is around 50%.
9.3.2 Profession Tax
Profession Tax is another source of revenue to ULB. Profession tax is a tax deducted
from the salaries of the employees falling with in the Municipality and is collected
from all registered organizations, companies or firms, public or private, individuals
and State & Central Government Departments. Currently profession tax is deducted
on a slab basis.
The total number of profession tax assessments is 1081 Nos., out of which state /
central / quasi Govt. employees comprise 494 Nos., traders / self employed
professionals 333 Nos, private employers / companies 30 Nos. and private
employees 224 Nos. The last revision of profession tax was in 1.10.2003.
During the last 6 years, it has increased from Rs. 7 lacs to Rs. 13 lacs. It accounts for
around 2% of the total revenue. The profession tax for the last 6 years is as below:
Table 9-5: Profession Tax � Growth during last 6 years
Year Rs. in lacs % Growth
2001-02 14.06 -
2002-03 14.10 0.28%
2003-04 16.99 20.50%
2004-05 19.13 12.60%
2005-06 20.66 8.00%
2006-07 19.29 (6.63%)
The demand and collection of profession tax over the last 6 years is as below :
Table 9-6: Profession Tax � Demand Collection % (Rs. in lacs)
Profession Tax 2001-02 2002-03 2003-04 2004-05 2005-06 2006-07
Demand
- Current 14.06 14.10 13.56 19.13 20.66 25.00
- Arrears 25.82 25.82 25.82 11.02 13.24 4.83
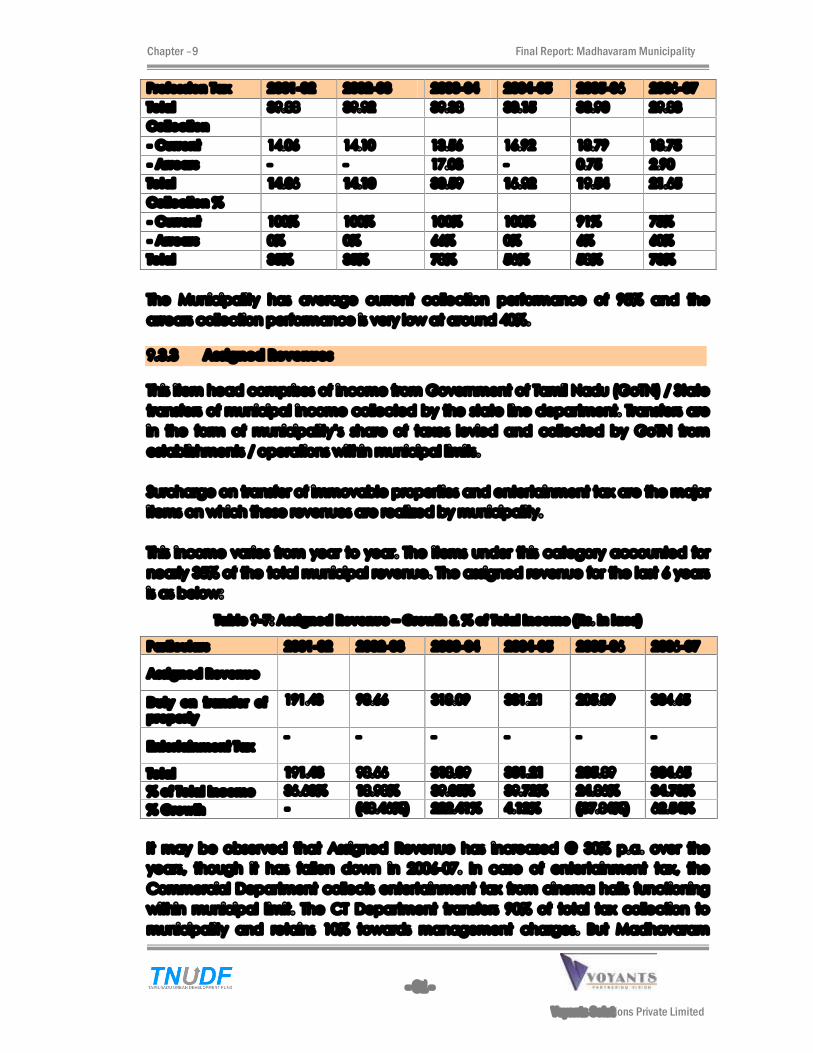
Chapter �9 Final Report: Madhavaram Municipality
- 61 -
Voyants Solutions Private Limited
Profession Tax 2001-02 2002-03 2003-04 2004-05 2005-06 2006-07
Total 39.88 39.92 39.38 30.15 33.90 29.83
Collection
- Current 14.06 14.10 13.56 16.92 18.79 18.75
- Arrears - - 17.03 - 0.75 2.90
Total 14.06 14.10 30.59 16.92 19.54 21.65
Collection %
- Current 100% 100% 100% 100% 91% 75%
- Arrears 0% 0% 66% 0% 6% 60%
Total 35% 35% 78% 56% 58% 73%
The Municipality has average current collection performance of 95% and the
arrears collection performance is very low at around 40%.
9.3.3 Assigned Revenues
This item head comprises of income from Government of Tamil Nadu (GoTN) / State
transfers of municipal income collected by the state line department. Transfers are
in the form of municipality�s share of taxes levied and collected by GoTN from
establishments / operations within municipal limits.
Surcharge on transfer of immovable properties and entertainment tax are the major
items on which these revenues are realized by municipality.
This income varies from year to year. The items under this category accounted for
nearly 35% of the total municipal revenue. The assigned revenue for the last 6 years
is as below:
Table 9-7: Assigned Revenue � Growth & % of Total Income (Rs. in lacs)
Particulars 2001-02 2002-03 2003-04 2004-05 2005-06 2006-07
Assigned Revenue
Duty on transfer of
property
191.43 98.66 318.09 331.21 205.89 334.65
Entertainment Tax - - - - - -
Total 191.43 98.66 318.09 331.21 205.89 334.65
% of Total Income 36.63% 18.98% 39.05% 39.72% 24.86% 34.73%
% Growth - (48.46%) 222.41% 4.12% (37.84%) 62.54%
It may be observed that Assigned Revenue has increased @ 30% p.a. over the
years, though it has fallen down in 2006-07. In case of entertainment tax, the
Commercial Department collects entertainment tax from cinema halls functioning
within municipal limit. The CT Department transfers 90% of total tax collection to
municipality and retains 10% towards management charges. But Madhavaram
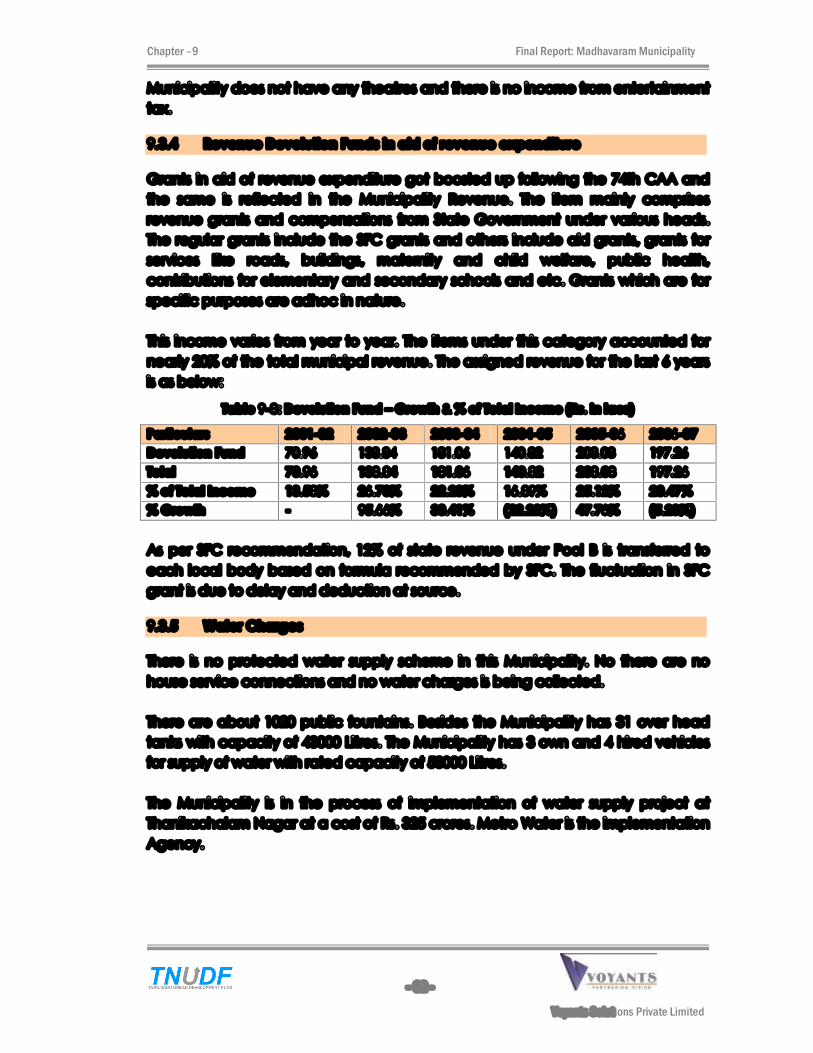
Chapter �9 Final Report: Madhavaram Municipality
- 62 -
Voyants Solutions Private Limited
Municipality does not have any theatres and there is no income from entertainment
tax.
9.3.4 Revenue Devolution Funds in aid of revenue expenditure
Grants in aid of revenue expenditure got boosted up following the 74th CAA and
the same is reflected in the Municipality Revenue. The item mainly comprises
revenue grants and compensations from State Government under various heads.
The regular grants include the SFC grants and others include aid grants, grants for
services like roads, buildings, maternity and child welfare, public health,
contributions for elementary and secondary schools and etc. Grants which are for
specific purposes are adhoc in nature.
This income varies from year to year. The items under this category accounted for
nearly 20% of the total municipal revenue. The assigned revenue for the last 6 years
is as below:
Table 9-8: Devolution Fund � Growth & % of Total Income (Rs. in lacs)
Particulars 2001-02 2002-03 2003-04 2004-05 2005-06 2006-07
Devolution Fund 70.96 138.84 181.06 140.82 208.08 197.26
Total 70.96 138.84 181.06 140.82 208.08 197.26
% of Total Income 13.58% 26.70% 22.23% 16.89% 25.12% 20.47%
% Growth - 95.66% 30.41% (22.22%) 47.76% (5.20%)
As per SFC recommendation, 12% of state revenue under Pool B is transferred to
each local body based on formula recommended by SFC. The fluctuation in SFC
grant is due to delay and deduction at source.
9.3.5 Water Charges
There is no protected water supply scheme in this Municipality. No there are no
house service connections and no water charges is being collected.
There are about 1020 public fountains. Besides the Municipality has 31 over head
tanks with capacity of 43000 Litres. The Municipality has 3 own and 4 hired vehicles
for supply of water with rated capacity of 58000 Litres.
The Municipality is in the process of implementation of water supply project at
Thanikachalam Nagar at a cost of Rs. 325 crores. Metro Water is the implementation
Agency.
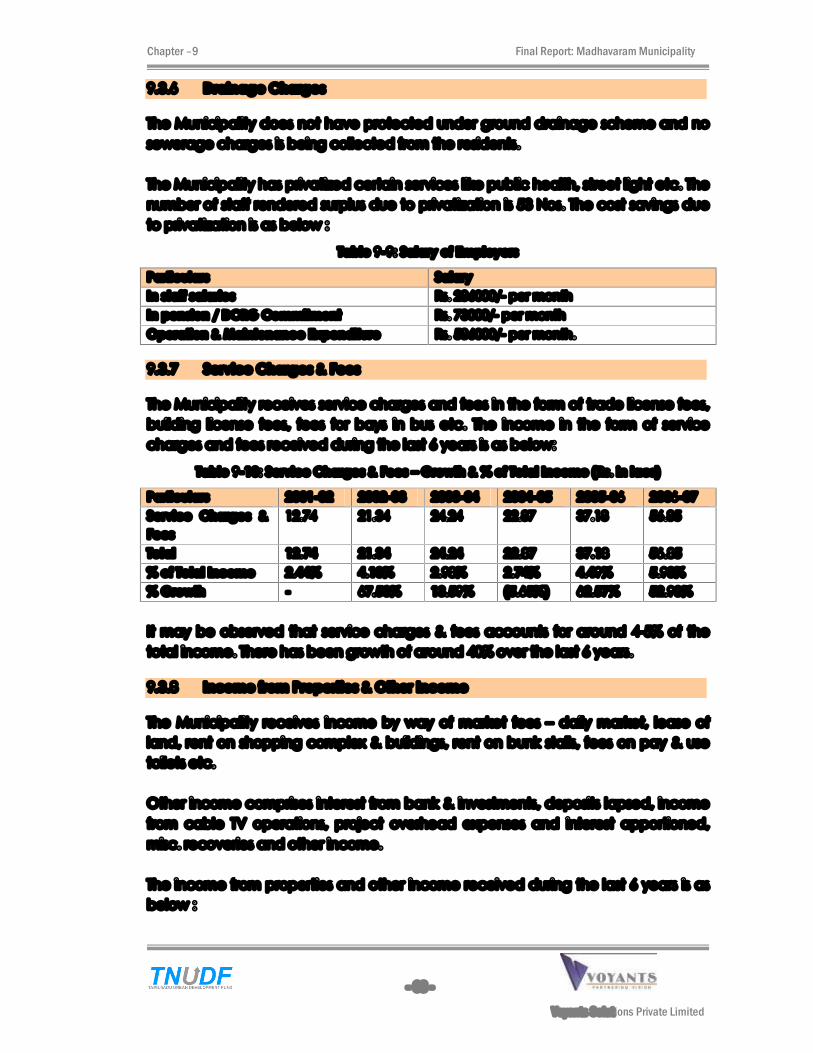
Chapter �9 Final Report: Madhavaram Municipality
- 63 -
Voyants Solutions Private Limited
9.3.6 Drainage Charges
The Municipality does not have protected under ground drainage scheme and no
sewerage charges is being collected from the residents.
The Municipality has privatized certain services like public health, street light etc. The
number of staff rendered surplus due to privatization is 53 Nos. The cost savings due
to privatization is as below :
Table 9-9: Salary of Employers
Particulars Salary
In staff salaries Rs. 286000/- per month
In pension / DCRG Commitment Rs. 73000/- per month
Operation & Maintenance Expenditure Rs. 586000/- per month.
9.3.7 Service Charges & Fees
The Municipality receives service charges and fees in the form of trade license fees,
building license fees, fees for bays in bus etc. The income in the form of service
charges and fees received during the last 6 years is as below:
Table 9-10: Service Charges & Fees � Growth & % of Total Income (Rs. in lacs)
Particulars 2001-02 2002-03 2003-04 2004-05 2005-06 2006-07
Service Charges &
Fees
12.74 21.34 24.24 22.87 37.18 56.85
Total 12.74 21.34 24.24 22.87 37.18 56.85
% of Total Income 2.44% 4.10% 2.98% 2.74% 4.49% 5.90%
% Growth - 67.50% 13.59% (5.65%) 62.57% 52.90%
It may be observed that service charges & fees accounts for around 4-5% of the
total income. There has been growth of around 40% over the last 6 years.
9.3.8 Income from Properties & Other Income
The Municipality receives income by way of market fees � daily market, lease of
land, rent on shopping complex & buildings, rent on bunk stalls, fees on pay & use
toilets etc.
Other income comprises interest from bank & investments, deposits lapsed, income
from cable TV operations, project overhead expenses and interest apportioned,
misc. recoveries and other income.
The income from properties and other income received during the last 6 years is as
below :
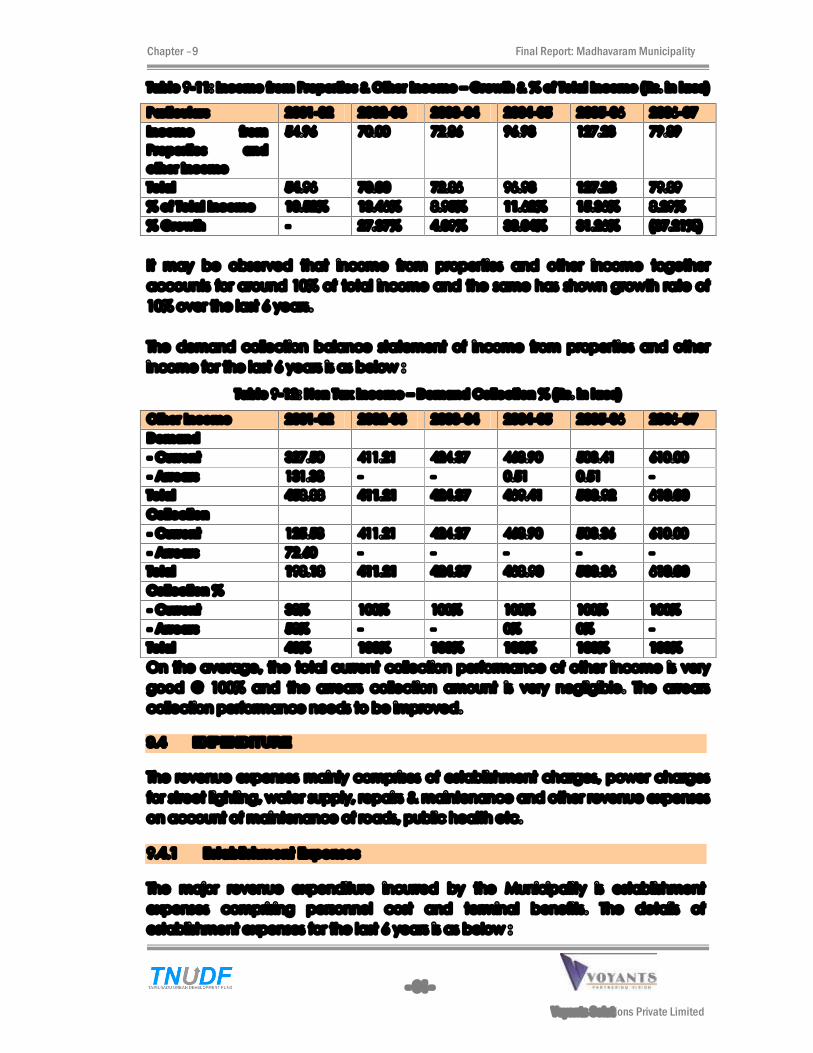
Chapter �9 Final Report: Madhavaram Municipality
- 64 -
Voyants Solutions Private Limited
Table 9-11: Income from Properties & Other Income � Growth & % of Total Income (Rs. in lacs)
Particulars 2001-02 2002-03 2003-04 2004-05 2005-06 2006-07
Income from
Properties and
other income
54.96 70.00 72.86 96.93 127.23 79.89
Total 54.96 70.00 72.86 96.93 127.23 79.89
% of Total Income 10.52% 13.46% 8.95% 11.62% 15.36% 8.29%
% Growth - 27.37% 4.09% 33.04% 31.26% (37.21%)
It may be observed that income from properties and other income together
accounts for around 10% of total income and the same has shown growth rate of
10% over the last 6 years.
The demand collection balance statement of income from properties and other
income for the last 6 years is as below :
Table 9-12: Non Tax Income � Demand Collection % (Rs. in lacs)
Other Income 2001-02 2002-03 2003-04 2004-05 2005-06 2006-07
Demand
- Current 327.50 411.21 424.37 468.90 503.41 610.00
- Arrears 131.38 - - 0.51 0.51 -
Total 458.88 411.21 424.37 469.41 503.92 610.00
Collection
- Current 125.58 411.21 424.37 468.90 503.36 610.00
- Arrears 72.60 - - - - -
Total 198.18 411.21 424.37 468.90 503.36 610.00
Collection %
- Current 38% 100% 100% 100% 100% 100%
- Arrears 58% - - 0% 0% -
Total 43% 100% 100% 100% 100% 100%
On the average, the total current collection performance of other income is very
good @ 100% and the arrears collection amount is very negligible. The arrears
collection performance needs to be improved.
9.4 EXPENDITURE
The revenue expenses mainly comprises of establishment charges, power charges
for street lighting, water supply, repairs & maintenance and other revenue expenses
on account of maintenance of roads, public health etc.
9.4.1 Establishment Expenses
The major revenue expenditure incurred by the Municipality is establishment
expenses comprising personnel cost and terminal benefits. The details of
establishment expenses for the last 6 years is as below :
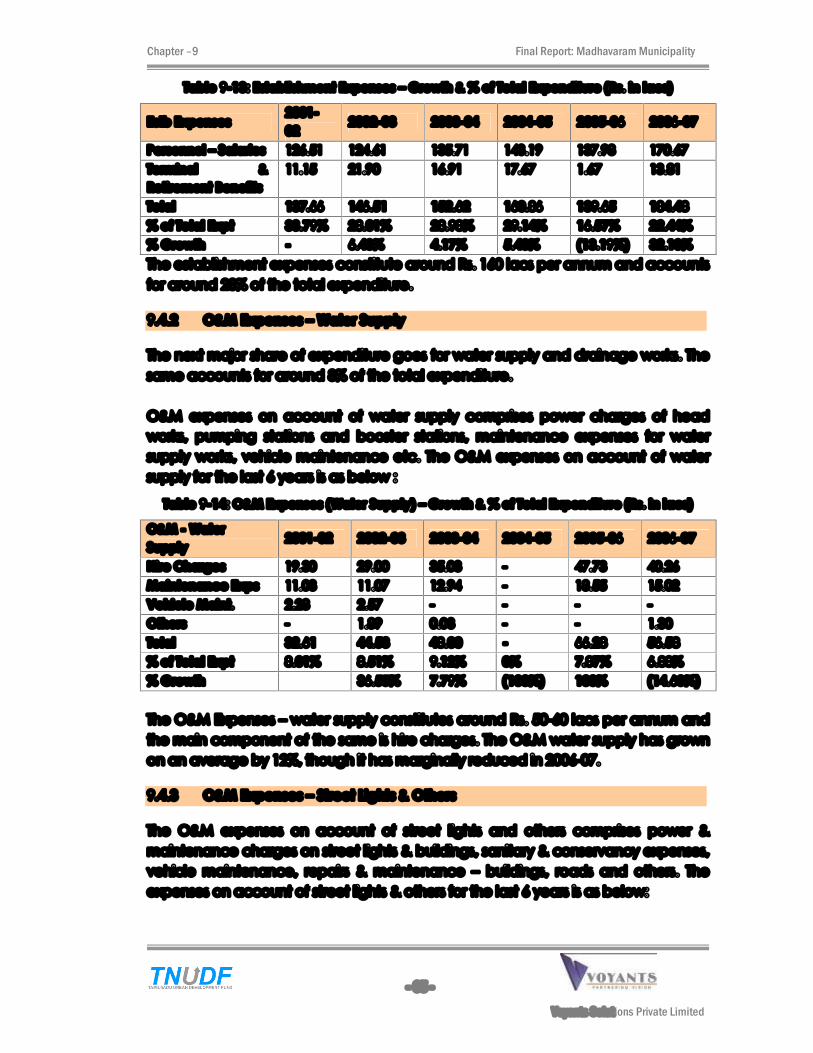
Chapter �9 Final Report: Madhavaram Municipality
- 65 -
Voyants Solutions Private Limited
Table 9-13: Establishment Expenses � Growth & % of Total Expenditure (Rs. in lacs)
Estb Expenses 2001-
02 2002-03 2003-04 2004-05 2005-06 2006-07
Personnel � Salaries 126.51 124.61 135.71 143.19 137.98 170.67
Terminal &
Retirement Benefits
11.15 21.90 16.91 17.67 1.67 13.81
Total 137.66 146.51 152.62 160.86 139.65 184.48
% of Total Expt 33.79% 28.01% 28.98% 29.14% 16.57% 22.44%
% Growth - 6.43% 4.17% 5.40% (13.19%) 32.10%
The establishment expenses constitute around Rs. 160 lacs per annum and accounts
for around 28% of the total expenditure.
9.4.2 O&M Expenses � Water Supply
The next major share of expenditure goes for water supply and drainage works. The
same accounts for around 8% of the total expenditure.
O&M expenses on account of water supply comprises power charges of head
works, pumping stations and booster stations, maintenance expenses for water
supply works, vehicle maintenance etc. The O&M expenses on account of water
supply for the last 6 years is as below :
Table 9-14: O&M Expenses (Water Supply) � Growth & % of Total Expenditure (Rs. in lacs)
O&M - Water
Supply 2001-02 2002-03 2003-04 2004-05 2005-06 2006-07
Hire Charges 19.30 29.00 35.03 - 47.73 40.26
Maintenance Exps 11.03 11.07 12.94 - 18.55 15.02
Vehicle Maint. 2.28 2.57 - - - -
Others - 1.89 0.03 - - 1.30
Total 32.61 44.53 48.00 - 66.28 56.58
% of Total Expt 8.01% 8.51% 9.12% 0% 7.87% 6.88%
% Growth 36.55% 7.79% (100%) 100% (14.63%)
The O&M Expenses � water supply constitutes around Rs. 50-60 lacs per annum and
the main component of the same is hire charges. The O&M water supply has grown
on an average by 12%, though it has marginally reduced in 2006-07.
9.4.3 O&M Expenses � Street Lights & Others
The O&M expenses on account of street lights and others comprises power &
maintenance charges on street lights & buildings, sanitary & conservancy expenses,
vehicle maintenance, repairs & maintenance � buildings, roads and others. The
expenses on account of street lights & others for the last 6 years is as below:
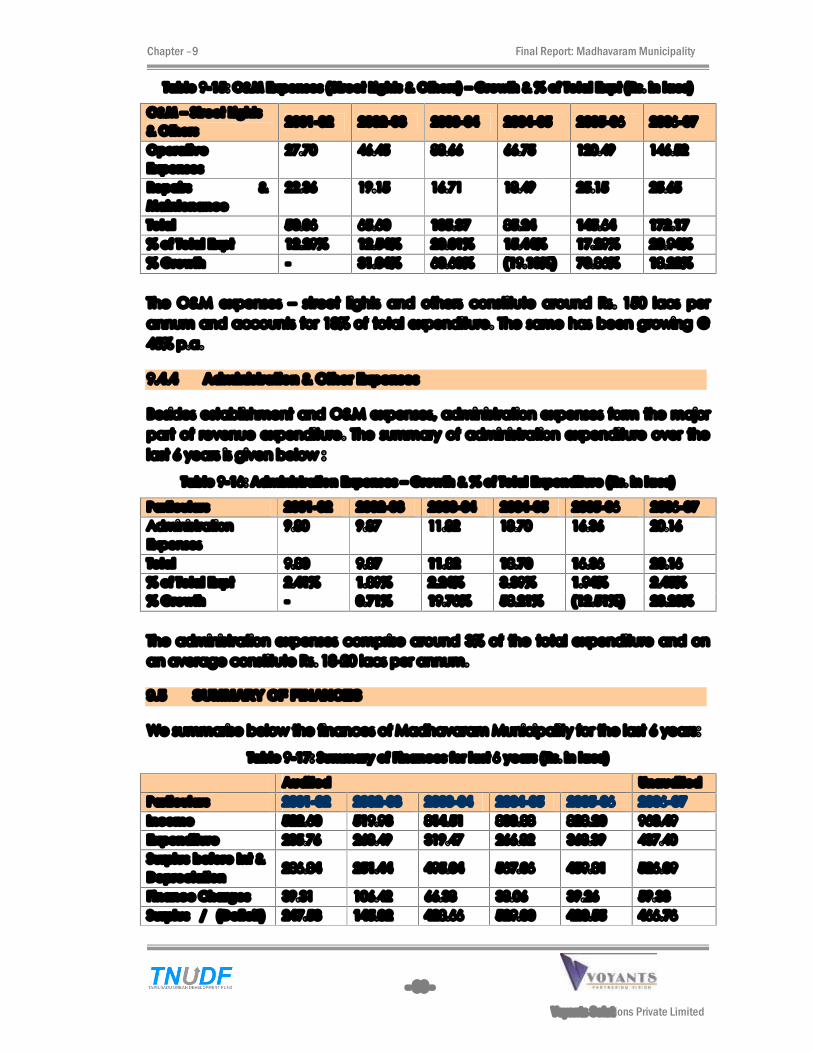
Chapter �9 Final Report: Madhavaram Municipality
- 66 -
Voyants Solutions Private Limited
Table 9-15: O&M Expenses (Street Lights & Others) � Growth & % of Total Expt (Rs. in lacs)
O&M � Street Lights
& Others 2001-02 2002-03 2003-04 2004-05 2005-06 2006-07
Operative
Expenses
27.70 46.45 88.66 66.75 120.49 146.52
Repairs &
Maintenance
22.36 19.15 16.71 18.49 25.15 25.65
Total 50.06 65.60 105.37 85.24 145.64 172.17
% of Total Expt 12.29% 12.54% 20.01% 15.44% 17.29% 20.94%
% Growth - 31.04% 60.63% (19.10%) 70.86% 18.22%
The O&M expenses � street lights and others constitute around Rs. 150 lacs per
annum and accounts for 18% of total expenditure. The same has been growing @
45% p.a.
9.4.4 Administration & Other Expenses
Besides establishment and O&M expenses, administration expenses form the major
part of revenue expenditure. The summary of administration expenditure over the
last 6 years is given below :
Table 9-16: Administration Expenses � Growth & % of Total Expenditure (Rs. in lacs)
Particulars 2001-02 2002-03 2003-04 2004-05 2005-06 2006-07
Administration
Expenses
9.80 9.87 11.82 18.70 16.36 20.16
Total 9.80 9.87 11.82 18.70 16.36 20.16
% of Total Expt 2.41% 1.89% 2.24% 3.39% 1.94% 2.45%
% Growth - 0.71% 19.76% 58.21% (12.51%) 23.23%
The administration expenses comprise around 3% of the total expenditure and on
an average constitute Rs. 18-20 lacs per annum.
9.5 SUMMARY OF FINANCES
We summarise below the finances of Madhavaram Municipality for the last 6 years:
Table 9-17: Summary of Finances for last 6 years (Rs. in lacs)
Audited Unaudited
Particulars 2001-02 2002-03 2003-04 2004-05 2005-06 2006-07
Income 522.60 519.93 814.51 833.88 828.20 963.49
Expenditure 235.76 268.49 319.47 266.82 368.39 437.40
Surplus before Int &
Depreciation 286.84 251.44 495.04 567.06 459.81 526.09
Finance Charges 39.31 106.42 66.38 38.06 39.26 59.33
Surplus / (Deficit) 247.53 145.02 428.66 529.00 420.55 466.76
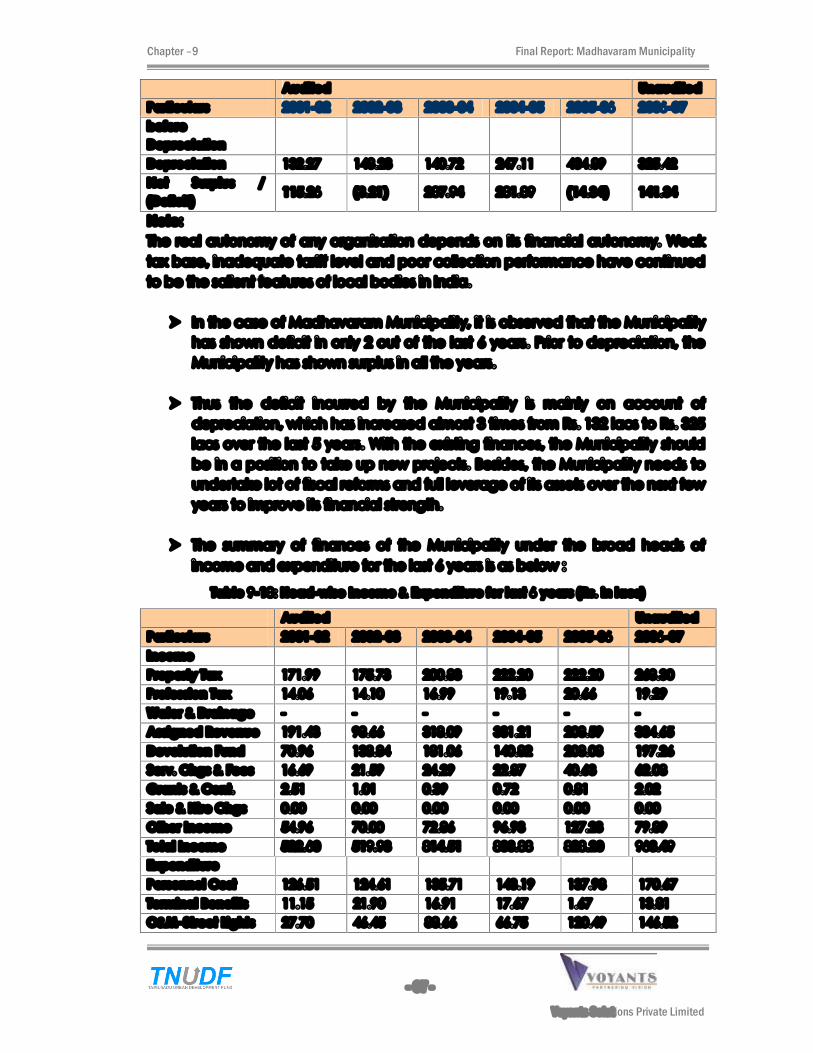
Chapter �9 Final Report: Madhavaram Municipality
- 67 -
Voyants Solutions Private Limited
Audited Unaudited
Particulars 2001-02 2002-03 2003-04 2004-05 2005-06 2006-07
before
Depreciation
Depreciation 132.27 148.23 140.72 247.11 434.89 325.42
Net Surplus /
(Deficit) 115.26 (3.21) 287.94 281.89 (14.34) 141.34
Note:
The real autonomy of any organisation depends on its financial autonomy. Weak
tax base, inadequate tariff level and poor collection performance have continued
to be the salient features of local bodies in India.
In the case of Madhavaram Municipality, it is observed that the Municipality
has shown deficit in only 2 out of the last 6 years. Prior to depreciation, the
Municipality has shown surplus in all the years.
Thus the deficit incurred by the Municipality is mainly on account of
depreciation, which has increased almost 3 times from Rs. 132 lacs to Rs. 325
lacs over the last 5 years. With the existing finances, the Municipality should
be in a position to take up new projects. Besides, the Municipality needs to
undertake lot of fiscal reforms and full leverage of its assets over the next few
years to improve its financial strength.
The summary of finances of the Municipality under the broad heads of
income and expenditure for the last 6 years is as below :
Table 9-18: Head-wise Income & Expenditure for last 6 years (Rs. in lacs)
Audited Unaudited
Particulars 2001-02 2002-03 2003-04 2004-05 2005-06 2006-07
Income
Property Tax 171.99 175.73 200.83 222.20 222.20 268.30
Profession Tax 14.06 14.10 16.99 19.13 20.66 19.29
Water & Drainage - - - - - -
Assigned Revenue 191.43 98.66 318.09 331.21 208.59 334.65
Devolution Fund 70.96 138.84 181.06 140.82 208.08 197.26
Serv. Chgs & Fees 16.69 21.59 24.29 22.87 40.63 62.08
Grants & Cont. 2.51 1.01 0.39 0.72 0.81 2.02
Sale & Hire Chgs 0.00 0.00 0.00 0.00 0.00 0.00
Other Income 54.96 70.00 72.86 96.93 127.23 79.89
Total Income 522.60 519.93 814.51 833.88 828.20 963.49
Expenditure
Personnel Cost 126.51 124.61 135.71 143.19 137.98 170.67
Terminal Benefits 11.15 21.90 16.91 17.67 1.67 13.81
O&M�Street Lights 27.70 46.45 88.66 66.75 120.49 146.52
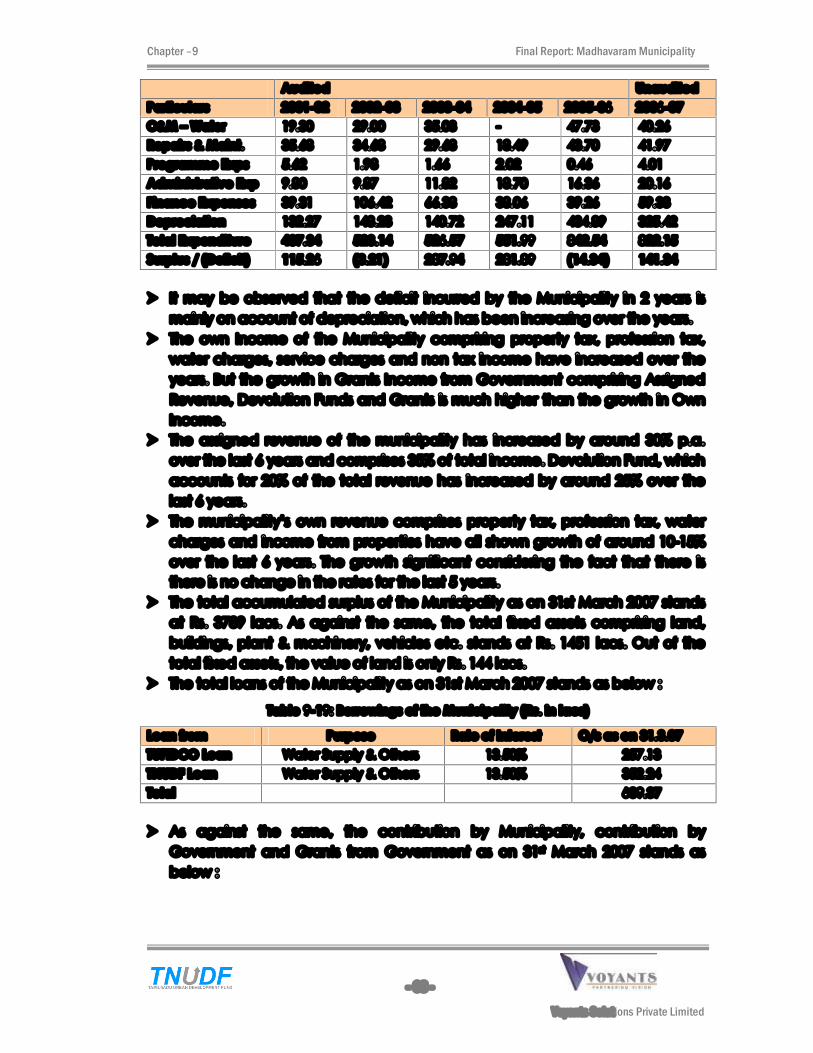
Chapter �9 Final Report: Madhavaram Municipality
- 68 -
Voyants Solutions Private Limited
Audited Unaudited
Particulars 2001-02 2002-03 2003-04 2004-05 2005-06 2006-07
O&M � Water 19.30 29.00 35.03 - 47.73 40.26
Repairs & Maint. 35.68 34.68 29.68 18.49 43.70 41.97
Programme Exps 5.62 1.98 1.66 2.02 0.46 4.01
Administrative Exp 9.80 9.87 11.82 18.70 16.36 20.16
Finance Expenses 39.31 106.42 66.38 38.06 39.26 59.33
Depreciation 132.27 148.23 140.72 247.11 434.89 325.42
Total Expenditure 407.34 523.14 526.57 551.99 842.54 822.15
Surplus / (Deficit) 115.26 (3.21) 287.94 281.89 (14.34) 141.34
It may be observed that the deficit incurred by the Municipality in 2 years is
mainly on account of depreciation, which has been increasing over the years.
The own Income of the Municipality comprising property tax, profession tax,
water charges, service charges and non tax income have increased over the
years. But the growth in Grants Income from Government comprising Assigned
Revenue, Devolution Funds and Grants is much higher than the growth in Own
Income.
The assigned revenue of the municipality has increased by around 30% p.a.
over the last 6 years and comprises 35% of total income. Devolution Fund, which
accounts for 20% of the total revenue has increased by around 25% over the
last 6 years.
The municipality�s own revenue comprises property tax, profession tax, water
charges and income from properties have all shown growth of around 10-15%
over the last 6 years. The growth significant considering the fact that there is
there is no change in the rates for the last 5 years.
The total accumulated surplus of the Municipality as on 31st March 2007 stands
at Rs. 3789 lacs. As against the same, the total fixed assets comprising land,
buildings, plant & machinery, vehicles etc. stands at Rs. 1451 lacs. Out of the
total fixed assets, the value of land is only Rs. 144 lacs.
The total loans of the Municipality as on 31st March 2007 stands as below :
Table 9-19: Borrowings of the Municipality (Rs. in lacs)
Loan from Purpose Rate of Interest O/s as on 31.3.07
TUFIDCO Loan Water Supply & Others 13.50% 257.13
TNUDF Loan Water Supply & Others 13.50% 352.24
Total 609.37
As against the same, the contribution by Municipality, contribution by
Government and Grants from Government as on 31st March 2007 stands as
below :
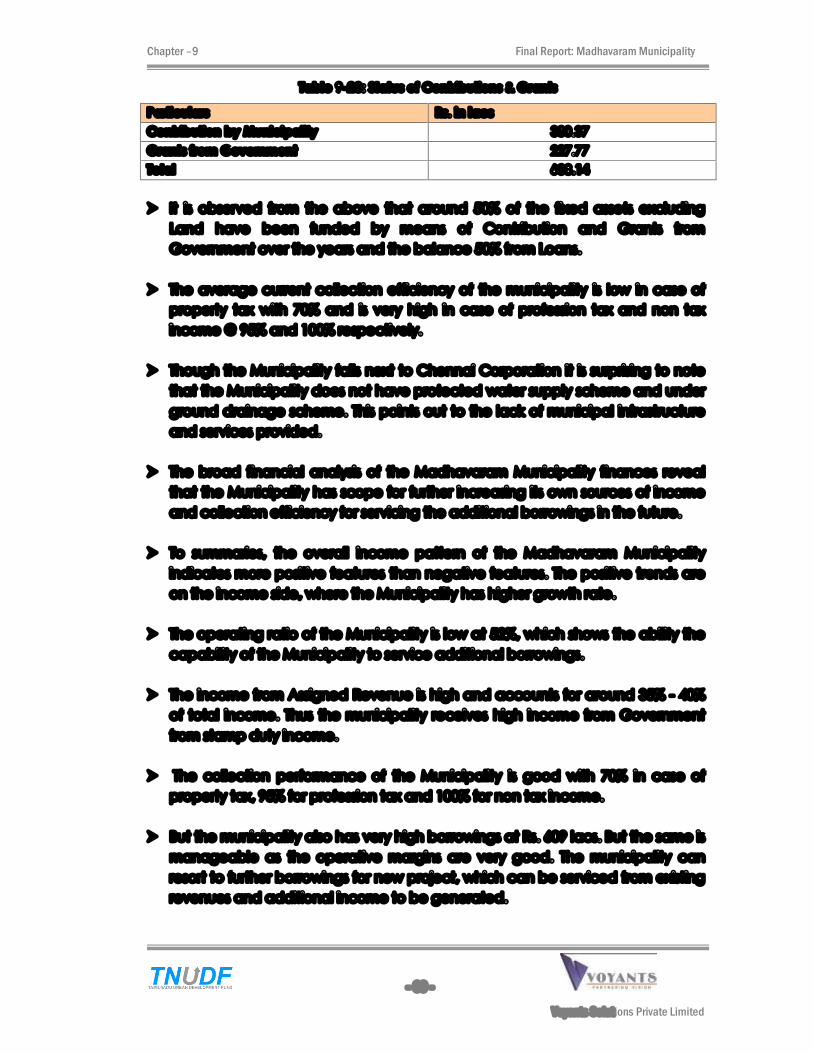
Chapter �9 Final Report: Madhavaram Municipality
- 69 -
Voyants Solutions Private Limited
Table 9-20: Status of Contributions & Grants
Particulars Rs. in lacs
Contribution by Municipality 380.37
Grants from Government 227.77
Total 608.14
It is observed from the above that around 50% of the fixed assets excluding
Land have been funded by means of Contribution and Grants from
Government over the years and the balance 50% from Loans.
The average current collection efficiency of the municipality is low in case of
property tax with 70% and is very high in case of profession tax and non tax
income @ 95% and 100% respectively.
Though the Municipality falls next to Chennai Corporation it is surprising to note
that the Municipality does not have protected water supply scheme and under
ground drainage scheme. This points out to the lack of municipal infrastructure
and services provided.
The broad financial analysis of the Madhavaram Municipality finances reveal
that the Municipality has scope for further increasing its own sources of income
and collection efficiency for servicing the additional borrowings in the future.
To summaries, the overall income pattern of the Madhavaram Municipality
indicates more positive features than negative features. The positive trends are
on the income side, where the Municipality has higher growth rate.
The operating ratio of the Municipality is low at 52%, which shows the ability the
capability of the Municipality to service additional borrowings.
The income from Assigned Revenue is high and accounts for around 35% - 40%
of total income. Thus the municipality receives high income from Government
from stamp duty income.
The collection performance of the Municipality is good with 70% in case of
property tax, 95% for profession tax and 100% for non tax income.
But the municipality also has very high borrowings at Rs. 609 lacs. But the same is
manageable as the operative margins are very good. The municipality can
resort to further borrowings for new project, which can be serviced from existing
revenues and additional income to be generated.
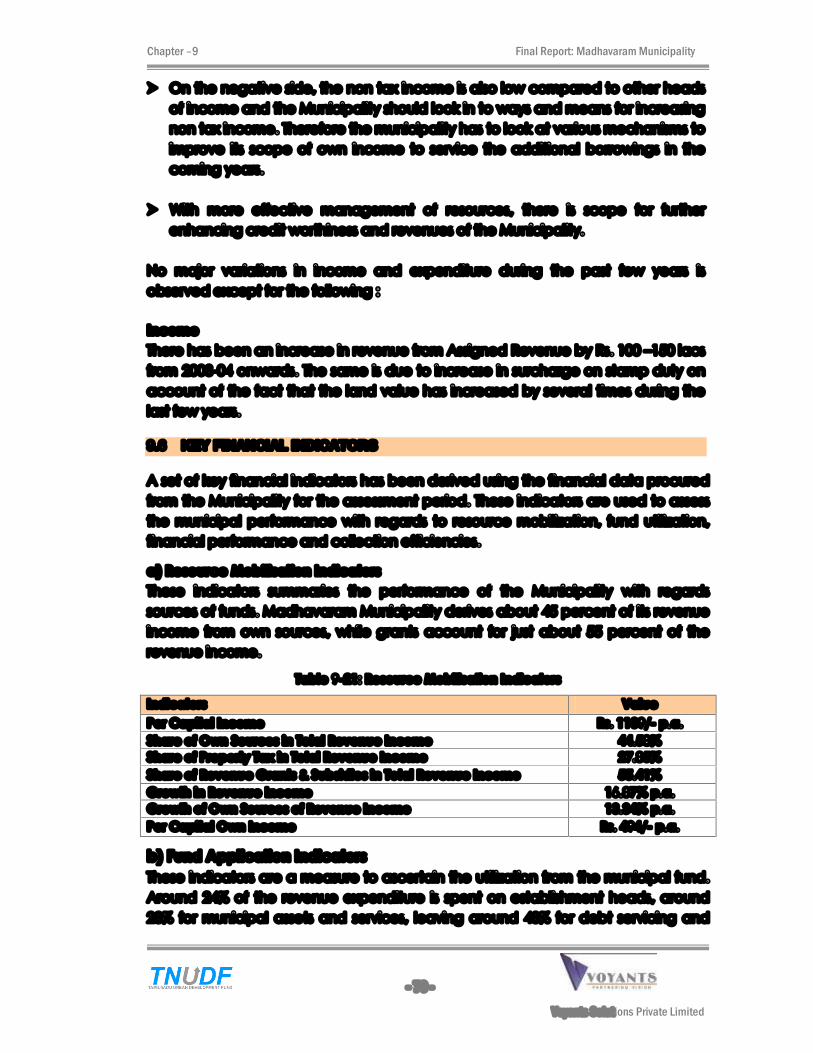
Chapter �9 Final Report: Madhavaram Municipality
- 70 -
Voyants Solutions Private Limited
On the negative side, the non tax income is also low compared to other heads
of income and the Municipality should look in to ways and means for increasing
non tax income. Therefore the municipality has to look at various mechanisms to
improve its scope of own income to service the additional borrowings in the
coming years.
With more effective management of resources, there is scope for further
enhancing credit worthiness and revenues of the Municipality.
No major variations in income and expenditure during the past few years is
observed except for the following :
Income
There has been an increase in revenue from Assigned Revenue by Rs. 100 �150 lacs
from 2003-04 onwards. The same is due to increase in surcharge on stamp duty on
account of the fact that the land value has increased by several times during the
last few years.
9.6 KEY FINANCIAL INDICATORS
A set of key financial indicators has been derived using the financial data procured
from the Municipality for the assessment period. These indicators are used to assess
the municipal performance with regards to resource mobilization, fund utilization,
financial performance and collection efficiencies.
a) Resource Mobilisation Indicators
These indicators summaries the performance of the Municipality with regards
sources of funds. Madhavaram Municipality derives about 45 percent of its revenue
income from own sources, while grants account for just about 55 percent of the
revenue income.
Table 9-21: Resource Mobilisation Indicators
Indicators Value
Per Capital Income Rs. 1109/- p.a.
Share of Own Sources in Total Revenue Income 44.58%
Share of Property Tax in Total Revenue Income 27.85%
Share of Revenue Grants & Subsidies in Total Revenue Income 55.41%
Growth in Revenue Income 16.87% p.a.
Growth of Own Sources of Revenue Income 13.34% p.a.
Per Capital Own Income Rs. 494/- p.a.
b) Fund Application Indicators
These indicators are a measure to ascertain the utilization from the municipal fund.
Around 24% of the revenue expenditure is spent on establishment heads, around
28% for municipal assets and services, leaving around 48% for debt servicing and

Chapter �9 Final Report: Madhavaram Municipality
- 71 -
Voyants Solutions Private Limited
administration expenses. Establishment expenditure accounts for about 20% of the
total revenue generated by the municipality.
Table 9-22: Fund Application Indicators
Indicators Value
Per Capita Expenditure Rs. 946/- p.a.
Share of Establishment Expenses in Total Revenue Expenditure 22.44%
Share of O&M Expenditure in Total Revenue Expenditure 27.82%
Share of Establishment Expenditure to Total Revenue Income 19.14%
Growth in Establishment Expenditure 6.80% p.a.
Growth in O&M Expenditure 35.33% p.a.
Growth in Total Revenue Expenditure 20.37% p.a.
c) Liability Management Indicators
These indicators are a measure to ascertain the utilization from the municipal fund
regarding debt servicing. The ratio of debt servicing to revenue income is at 18.31%
during the assessment period. The per capita average debt outstanding is very high
at Rs. 701/- and the per capita outstanding debt to property tax demand is around
227% of the property tax demand for the current year.
Table 9-23: Liability Management Indicators
Indicators Value
Per Capita Liability
- Outstanding Debt per Capita Rs. 701/-
- Outstanding Non Debt Liability per Capita -
- Total Outstanding Liability per Capita Rs. 701/-
As a proportion of Property Tax Current Demand
- Outstanding Debt as % of Property Tax Demand 227%
- Outstanding Non Debt Liability as % of Property Tax Demand -
- Total Outstanding Liability as % of Property Tax Demand 227%
As a proportion of Property Tax Own Revenue Income
- Outstanding Debt as % of Own Revenue Sources 163%
- Outstanding Non Debt Liability as % of Own Revenue Sources -
- Total Outstanding Liability as % of Own Revenue Sources 163%
Non Debt Liability as % of Total Liability -
Debt Servicing Ratio 18.31%
d) Overall Financial Performance Indicators
These indicators are a measure to assess the overall financial performance of the
Municipality with regards operational performance and effective growth in revenue
income and expenditure.
The average operating ratio during the assessment period is at 52%. The indicators
of growth in per capita income and expenditure item heads indicate the effective
growth, giving a performance measure relative to the growing population.
Madhavaram Municipality has demonstrated 12.59% annual growth in per capita
revenue income during the assessment period, while the per capita revenue
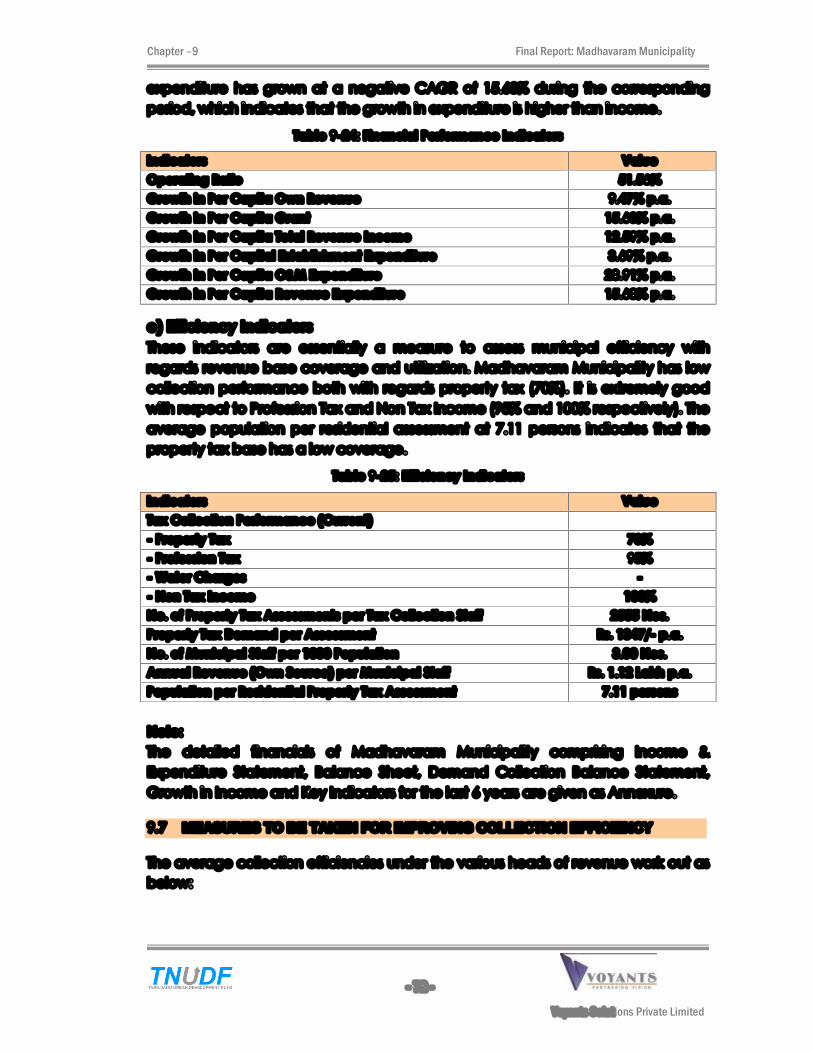
Chapter �9 Final Report: Madhavaram Municipality
- 72 -
Voyants Solutions Private Limited
expenditure has grown at a negative CAGR of 15.68% during the corresponding
period, which indicates that the growth in expenditure is higher than income.
Table 9-24: Financial Performance Indicators
Indicators Value
Operating Ratio 51.56%
Growth in Per Capita Own Revenue 9.47% p.a.
Growth in Per Capita Grant 15.63% p.a.
Growth in Per Capita Total Revenue Income 12.59% p.a.
Growth in Per Capital Establishment Expenditure 3.69% p.a.
Growth in Per Capita O&M Expenditure 28.91% p.a.
Growth in Per Capita Revenue Expenditure 15.68% p.a.
e) Efficiency Indicators
These indicators are essentially a measure to assess municipal efficiency with
regards revenue base coverage and utilization. Madhavaram Municipality has low
collection performance both with regards property tax (70%). It is extremely good
with respect to Profession Tax and Non Tax Income (95% and 100% respectively). The
average population per residential assessment at 7.11 persons indicates that the
property tax base has a low coverage.
Table 9-25: Efficiency Indicators
Indicators Value
Tax Collection Performance (Current)
- Property Tax 70%
- Profession Tax 95%
- Water Charges -
- Non Tax Income 100%
No. of Property Tax Assessments per Tax Collection Staff 2555 Nos.
Property Tax Demand per Assessment Rs. 1347/- p.a.
No. of Municipal Staff per 1000 Population 3.00 Nos.
Annual Revenue (Own Source) per Municipal Staff Rs. 1.12 Lakh p.a.
Population per Residential Property Tax Assessment 7.11 persons
Note:
The detailed financials of Madhavaram Municipality comprising Income &
Expenditure Statement, Balance Sheet, Demand Collection Balance Statement,
Growth in Income and Key Indicators for the last 6 years are given as Annexure.
9.7 MEASURES TO BE TAKEN FOR IMPROVING COLLECTION EFFICIENCY
The average collection efficiencies under the various heads of revenue work out as
below:
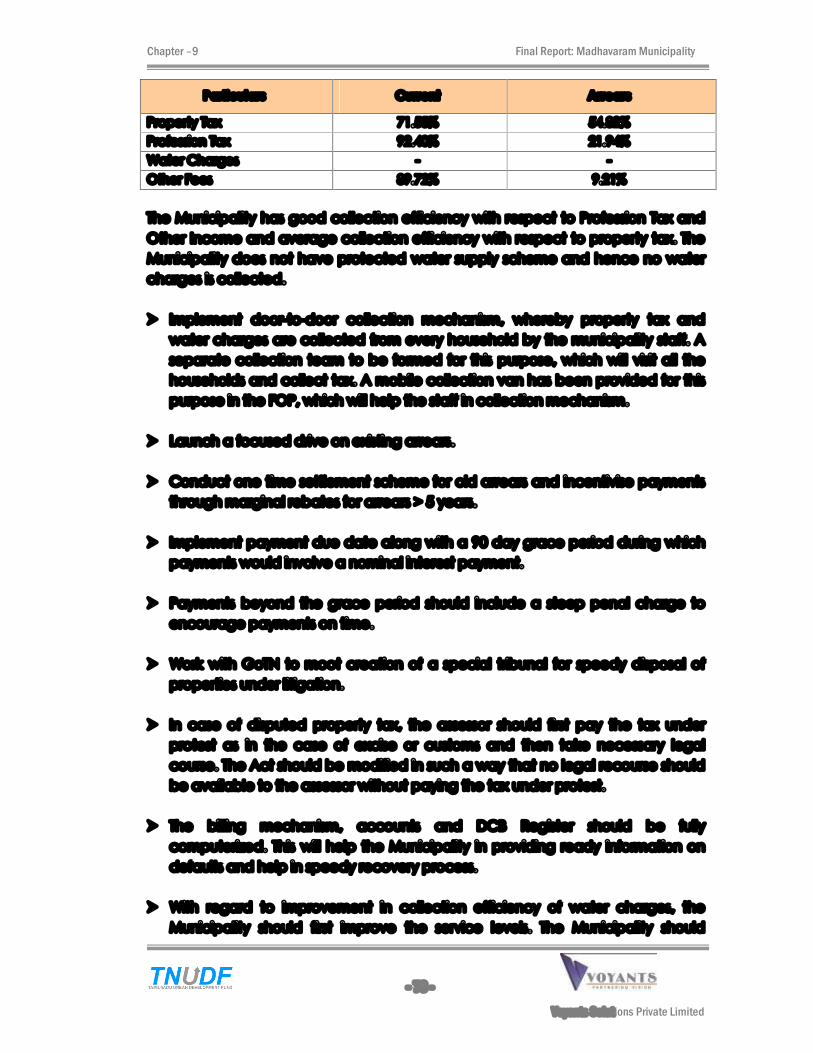
Chapter �9 Final Report: Madhavaram Municipality
- 73 -
Voyants Solutions Private Limited
Particulars Current Arrears
Property Tax 71.55% 54.82%
Profession Tax 92.40% 21.94%
Water Charges - -
Other Fees 89.72% 9.21%
The Municipality has good collection efficiency with respect to Profession Tax and
Other Income and average collection efficiency with respect to property tax. The
Municipality does not have protected water supply scheme and hence no water
charges is collected.
Implement door-to-door collection mechanism, whereby property tax and
water charges are collected from every household by the municipality staff. A
separate collection team to be formed for this purpose, which will visit all the
households and collect tax. A mobile collection van has been provided for this
purpose in the FOP, which will help the staff in collection mechanism.
Launch a focused drive on existing arrears.
Conduct one time settlement scheme for old arrears and incentivise payments
through marginal rebates for arrears > 5 years.
Implement payment due date along with a 90 day grace period during which
payments would involve a nominal interest payment.
Payments beyond the grace period should include a steep penal charge to
encourage payments on time.
Work with GoTN to moot creation of a special tribunal for speedy disposal of
properties under litigation.
In case of disputed property tax, the assessor should first pay the tax under
protest as in the case of excise or customs and then take necessary legal
course. The Act should be modified in such a way that no legal recourse should
be available to the assessor without paying the tax under protest.
The billing mechanism, accounts and DCB Register should be fully
computerized. This will help the Municipality in providing ready information on
defaults and help in speedy recovery process.
With regard to improvement in collection efficiency of water charges, the
Municipality should first improve the service levels. The Municipality should
Chapter �9 Final Report: Madhavaram Municipality
- 74 -
Voyants Solutions Private Limited
conduct a survey on the present service levels and identify places where
service levels are good. The Municipality should then do a focused drive on
these blocks with good service levels and implement various collection
measures given above.
The Municipality may also consider implementation of late payment fines and in
case of extreme overdue situations, disconnecting supply.
As regards blocks with low service levels, the Municipality should improve the
service levels and effect various measures to improve the service levels. Only
with improvement in service levels, the collection efficiencies can be improved.
As regards Other Fees, which basically comprises rent / lease from various assets
of the Municipality, the Municipality should send eviction notices to the
defaulters. Unlike property tax and water charges, the Municipality can enforce
eviction of defaulters.
Chapter � 10 Final Report: Madhavaram Municipality
- 75 -
Voyants Solutions Private Limited
111000 CCCAAAPPPIIITTTAAALLL IIINNNVVVEEESSSTTTMMMEEENNNTTT NNNEEEEEEDDDSSS FFFOOORRR IIIDDDEEENNNTTTIIIFFFIIIEEEDDD PPPRRROOOJJJEEECCCTTTSSS
All the projects relating to urban infrastructure, urban growth and development
have been identified through a conscious participatory process. The projects are in
the form of improvements and, extension of the existing services and facilities such
that the present inadequacies as per the norms and standards are made up and, in
addition meet the requirements of the projected population of the town during the
perspective period of plan.
Each project component, as identified has been verified in the field of their suitability
and feasibility in terms of location, coverage and adequacy and finalized with
intensive consultation with the office of the municipality and as suggested and
recommended in the review meetings of the previous stage of this exercise in the
office of TNUIFSL. The projects thus finalized and firmed up are detailed out in their
present status, gaps, projected requirements, cost estimates, capital needs, funding
pattern etc in the following section. These projects have been prioritized as
warranted in their importance over the implementation time frame.
The Sector wise projects and breakup of the investment are as follows
10.1 PHYSICAL INFRASTRUCTURE - IMPROVEMENT NEEDS
In chapter - 8 we had discussed about the existing situation and issues in the physical
Infrastructure sector. The improvement needs and the proposals identified for the
improvement of physical and social infrastructure are given in the chapter below.
10.1.1 Water Supply:
The DPR for water supply is under preparation by CMWSSB, and the proposals
identified will meet the intermediate and ultimate water supply demand. The project
components covered under the DPR proposals are
Source Augmentation
Laying of distribution lines and pumping mains
Pumping machineries and equipments
Rehabilitation of existing distribution network
Construction of 7 OHTs at various locations
Construction of treatment plant of 11.25 mld capacity
In addition to these, it is proposed to conduct energy audit studies and fixing of bulk
water meters at pumping mains, service reservoirs and water intensive assessments.
The capital cost of the water supply improvement projects identified by the CMWSSB
is estimated as Rs.6000.00 lakhs (including the cost escalation during tender
process).
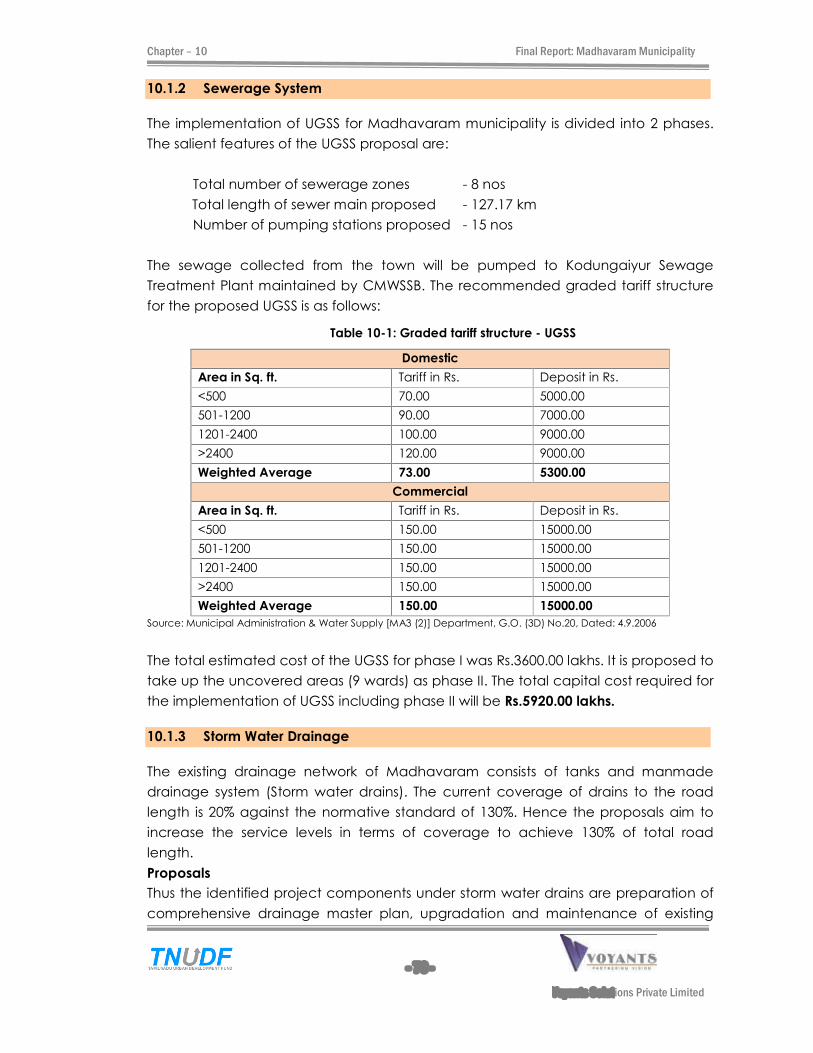
Chapter � 10 Final Report: Madhavaram Municipality
- 76 -
Voyants Solutions Private Limited
10.1.2 Sewerage System
The implementation of UGSS for Madhavaram municipality is divided into 2 phases.
The salient features of the UGSS proposal are:
Total number of sewerage zones - 8 nos
Total length of sewer main proposed - 127.17 km
Number of pumping stations proposed - 15 nos
The sewage collected from the town will be pumped to Kodungaiyur Sewage
Treatment Plant maintained by CMWSSB. The recommended graded tariff structure
for the proposed UGSS is as follows:
Table 10-1: Graded tariff structure - UGSS
Domestic
Area in Sq. ft. Tariff in Rs. Deposit in Rs.
<500 70.00 5000.00
501-1200 90.00 7000.00
1201-2400 100.00 9000.00
>2400 120.00 9000.00
Weighted Average 73.00 5300.00
Commercial
Area in Sq. ft. Tariff in Rs. Deposit in Rs.
<500 150.00 15000.00
501-1200 150.00 15000.00
1201-2400 150.00 15000.00
>2400 150.00 15000.00
Weighted Average 150.00 15000.00
Source: Municipal Administration & Water Supply [MA3 (2)] Department, G.O. (3D) No.20, Dated: 4.9.2006
The total estimated cost of the UGSS for phase I was Rs.3600.00 lakhs. It is proposed to
take up the uncovered areas (9 wards) as phase II. The total capital cost required for
the implementation of UGSS including phase II will be Rs.5920.00 lakhs.
10.1.3 Storm Water Drainage
The existing drainage network of Madhavaram consists of tanks and manmade
drainage system (Storm water drains). The current coverage of drains to the road
length is 20% against the normative standard of 130%. Hence the proposals aim to
increase the service levels in terms of coverage to achieve 130% of total road
length.
Proposals
Thus the identified project components under storm water drains are preparation of
comprehensive drainage master plan, upgradation and maintenance of existing
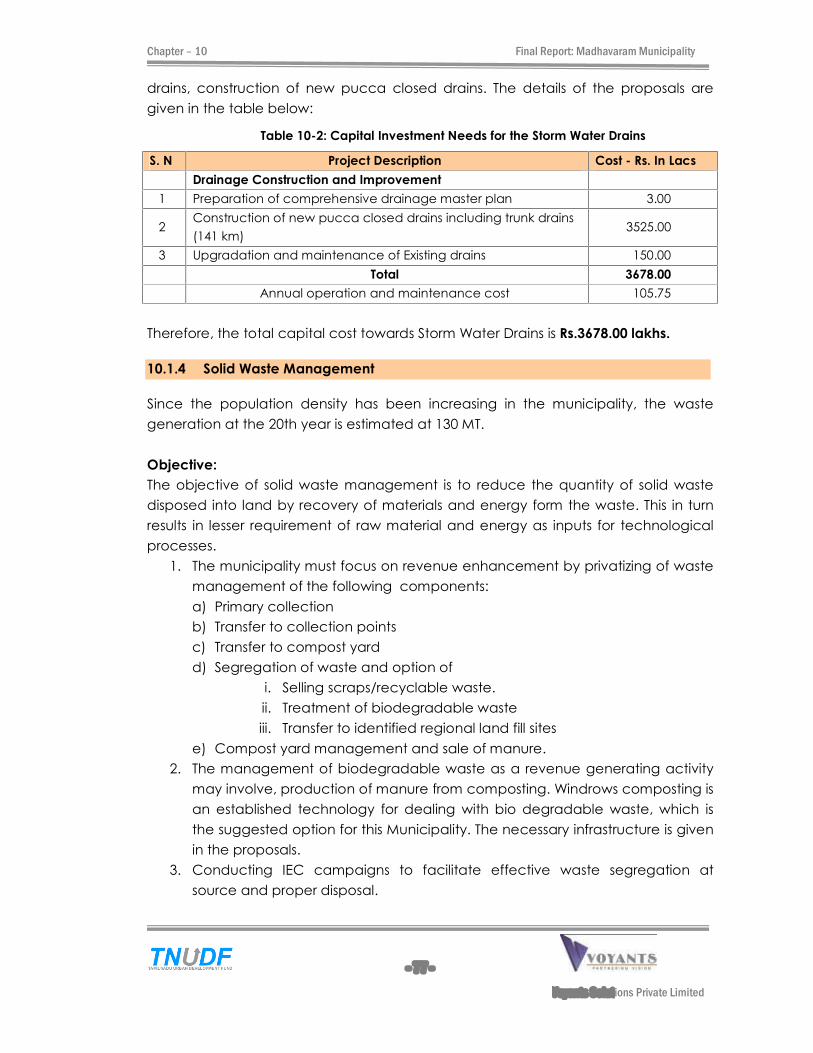
Chapter � 10 Final Report: Madhavaram Municipality
- 77 -
Voyants Solutions Private Limited
drains, construction of new pucca closed drains. The details of the proposals are
given in the table below:
Table 10-2: Capital Investment Needs for the Storm Water Drains
S. N Project Description Cost - Rs. In Lacs
Drainage Construction and Improvement
1 Preparation of comprehensive drainage master plan 3.00
2 Construction of new pucca closed drains including trunk drains
(141 km) 3525.00
3 Upgradation and maintenance of Existing drains 150.00
Total 3678.00
Annual operation and maintenance cost 105.75
Therefore, the total capital cost towards Storm Water Drains is Rs.3678.00 lakhs.
10.1.4 Solid Waste Management
Since the population density has been increasing in the municipality, the waste
generation at the 20th year is estimated at 130 MT.
Objective:
The objective of solid waste management is to reduce the quantity of solid waste
disposed into land by recovery of materials and energy form the waste. This in turn
results in lesser requirement of raw material and energy as inputs for technological
processes.
1. The municipality must focus on revenue enhancement by privatizing of waste
management of the following components:
a) Primary collection
b) Transfer to collection points
c) Transfer to compost yard
d) Segregation of waste and option of
i. Selling scraps/recyclable waste.
ii. Treatment of biodegradable waste
iii. Transfer to identified regional land fill sites
e) Compost yard management and sale of manure.
2. The management of biodegradable waste as a revenue generating activity
may involve, production of manure from composting. Windrows composting is
an established technology for dealing with bio degradable waste, which is
the suggested option for this Municipality. The necessary infrastructure is given
in the proposals.
3. Conducting IEC campaigns to facilitate effective waste segregation at
source and proper disposal.
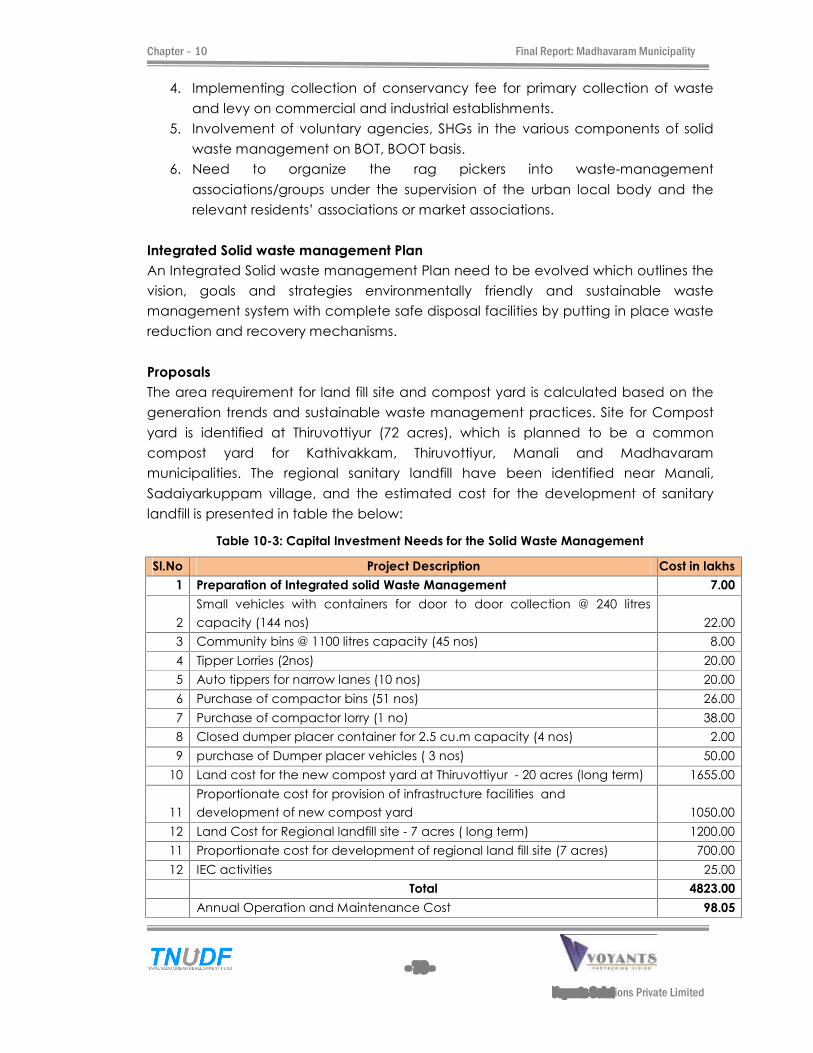
Chapter � 10 Final Report: Madhavaram Municipality
- 78 -
Voyants Solutions Private Limited
4. Implementing collection of conservancy fee for primary collection of waste
and levy on commercial and industrial establishments.
5. Involvement of voluntary agencies, SHGs in the various components of solid
waste management on BOT, BOOT basis.
6. Need to organize the rag pickers into waste-management
associations/groups under the supervision of the urban local body and the
relevant residents� associations or market associations.
Integrated Solid waste management Plan
An Integrated Solid waste management Plan need to be evolved which outlines the
vision, goals and strategies environmentally friendly and sustainable waste
management system with complete safe disposal facilities by putting in place waste
reduction and recovery mechanisms.
Proposals
The area requirement for land fill site and compost yard is calculated based on the
generation trends and sustainable waste management practices. Site for Compost
yard is identified at Thiruvottiyur (72 acres), which is planned to be a common
compost yard for Kathivakkam, Thiruvottiyur, Manali and Madhavaram
municipalities. The regional sanitary landfill have been identified near Manali,
Sadaiyarkuppam village, and the estimated cost for the development of sanitary
landfill is presented in table the below:
Table 10-3: Capital Investment Needs for the Solid Waste Management
Sl.No Project Description Cost in lakhs
1 Preparation of Integrated solid Waste Management 7.00
2
Small vehicles with containers for door to door collection @ 240 litres
capacity (144 nos) 22.00
3 Community bins @ 1100 litres capacity (45 nos) 8.00
4 Tipper Lorries (2nos) 20.00
5 Auto tippers for narrow lanes (10 nos) 20.00
6 Purchase of compactor bins (51 nos) 26.00
7 Purchase of compactor lorry (1 no) 38.00
8 Closed dumper placer container for 2.5 cu.m capacity (4 nos) 2.00
9 purchase of Dumper placer vehicles ( 3 nos) 50.00
10 Land cost for the new compost yard at Thiruvottiyur - 20 acres (long term) 1655.00
11
Proportionate cost for provision of infrastructure facilities and
development of new compost yard 1050.00
12 Land Cost for Regional landfill site - 7 acres ( long term) 1200.00
11 Proportionate cost for development of regional land fill site (7 acres) 700.00
12 IEC activities 25.00
Total 4823.00
Annual Operation and Maintenance Cost 98.05
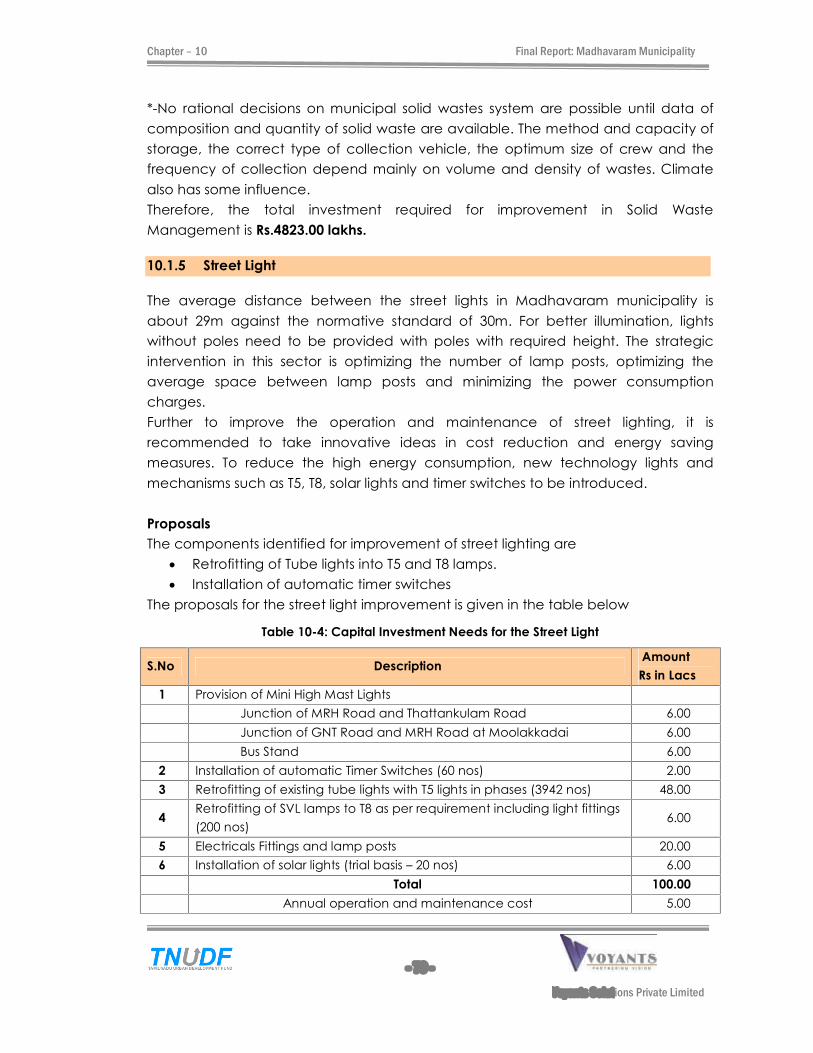
Chapter � 10 Final Report: Madhavaram Municipality
- 79 -
Voyants Solutions Private Limited
*-No rational decisions on municipal solid wastes system are possible until data of
composition and quantity of solid waste are available. The method and capacity of
storage, the correct type of collection vehicle, the optimum size of crew and the
frequency of collection depend mainly on volume and density of wastes. Climate
also has some influence.
Therefore, the total investment required for improvement in Solid Waste
Management is Rs.4823.00 lakhs.
10.1.5 Street Light
The average distance between the street lights in Madhavaram municipality is
about 29m against the normative standard of 30m. For better illumination, lights
without poles need to be provided with poles with required height. The strategic
intervention in this sector is optimizing the number of lamp posts, optimizing the
average space between lamp posts and minimizing the power consumption
charges.
Further to improve the operation and maintenance of street lighting, it is
recommended to take innovative ideas in cost reduction and energy saving
measures. To reduce the high energy consumption, new technology lights and
mechanisms such as T5, T8, solar lights and timer switches to be introduced.
Proposals
The components identified for improvement of street lighting are
Retrofitting of Tube lights into T5 and T8 lamps.
Installation of automatic timer switches
The proposals for the street light improvement is given in the table below
Table 10-4: Capital Investment Needs for the Street Light
S.No Description Amount
Rs in Lacs
1 Provision of Mini High Mast Lights
Junction of MRH Road and Thattankulam Road 6.00
Junction of GNT Road and MRH Road at Moolakkadai 6.00
Bus Stand 6.00
2 Installation of automatic Timer Switches (60 nos) 2.00
3 Retrofitting of existing tube lights with T5 lights in phases (3942 nos) 48.00
4 Retrofitting of SVL lamps to T8 as per requirement including light fittings
(200 nos) 6.00
5 Electricals Fittings and lamp posts 20.00
6 Installation of solar lights (trial basis � 20 nos) 6.00
Total 100.00
Annual operation and maintenance cost 5.00

Chapter � 10 Final Report: Madhavaram Municipality
- 80 -
Voyants Solutions Private Limited
Therefore, the total investment required for the improvement of street lighting in
Madhavaram municipality is Rs.100.00 lakhs.
10.1.6 Roads and transportation
The town has 17% of unsurfaced roads, which need to be surfaced. The new roads in
the newly developing areas need to be surfaced and should be provided with good
connectivity. In addition to this, all the existing BT roads need to be periodically
resurfaced. To regulate the illegal parking, specific parking areas need to be
provided with traffic markings to show parking areas and no parking areas.
In the light of new sewerage scheme, the construction of new roads, upgrading of
existing roads, resurfacing of roads etc., will be delayed by a few years for the area
covered under the sewerage scheme and water supply scheme.
Proposals
The proposals identified for road improvement is given in the table below
Table 10-5: Capital Investment Needs for the Road and Transportation
S. No Description Amount in
Rs lacs
1 Road Widening
Widening of internal circulation roads(Nachariamman street, New
Aliyar street II nd, Hasan street, Lane ) and road dividents 95.00
2 Road upgradation
W.B.M. Roads to BT (10 km) 200.00
W.B.M. Roads to BT (6.79 km) 170.00
Earthen Roads To CC (4 km) 100.00
3 Road Improvement
Relaying of B T road after UGD (101.08 km) 1516.00
Relaying CC road after UGD (5.31 km) 133.00
4 Road Junction improvement
Public Road, Near municipality office, at state highway junction. 50.00
5 Road Geometry Improvement � Pedestrian pathways, medians,
signages 125.00
6 New roads
Formation of new BT roads (6 km) 138.00
Formation of new CC roads (10 km) 250.00
Total 2777.00
Annual Operation and Maintenance cost 19.40
Therefore, the total capital investment required - for the improvement of roads in
Madhavaram municipality is Rs.2777.00 lakhs.

Chapter � 10 Final Report: Madhavaram Municipality
- 81 -
Voyants Solutions Private Limited
10.1.7 Educational Institutions
It is proposed for the improvement of exiting old buildings, water facilities, toilet
facilities, computers for elementary schools. The details of the proposals are given
below
Table 10-6: Capital Investment Needs for the Educational Institutions
S. No. Description Amount in Rs Lacs
1 Elementary Schools
Construction of new buildings at the 6 schools 252.00
Improvement of basic facilities at the 6 schools 30.00
Total 282.00
Therefore, the total capital investment required for the improvement of schools in
Madhavaram municipality is Rs.282.00 lakhs.
10.1.8 Health Facilities
Though the coverage of health services in urban areas is much better than the rural,
inadequate service delivery of drinking water and sanitation and the high
population density in the slums leads to rapid spread of infections. Thus, even though
there is a concentration of health care facilities in urban areas, the urban poor lack
access to such facilities.
Government of India has launched National Urban Health Mission (NUHM) which
aims to meet the needs of the urban poor, particularly the slum dwellers. This will be
done by investing in high-caliber health professionals, appropriate technology
through PPP, and health insurance for urban poor.
NUHM would ensure the following
Resources for addressing the health problems in urban areas, especially
among urban poor.
Need based city specific urban health care system to meet the diverse health
needs of the urban poor and other vulnerable sections.
Partnership with community for a more proactive involvement in planning,
implementation, and monitoring of health activities.
Institutional mechanism and management systems to meet the health-related
challenges of a rapidly growing urban population.
Framework for partnerships with NGOs, charitable hospitals, and other
stakeholders.
Two-tier system of risk pooling: (i) women�s Mahila Arogya Samiti to fulfil urgent
hard-cash needs for treatments; (ii) a Health Insurance Scheme for enabling
urban poor to meet medical treatment needs.
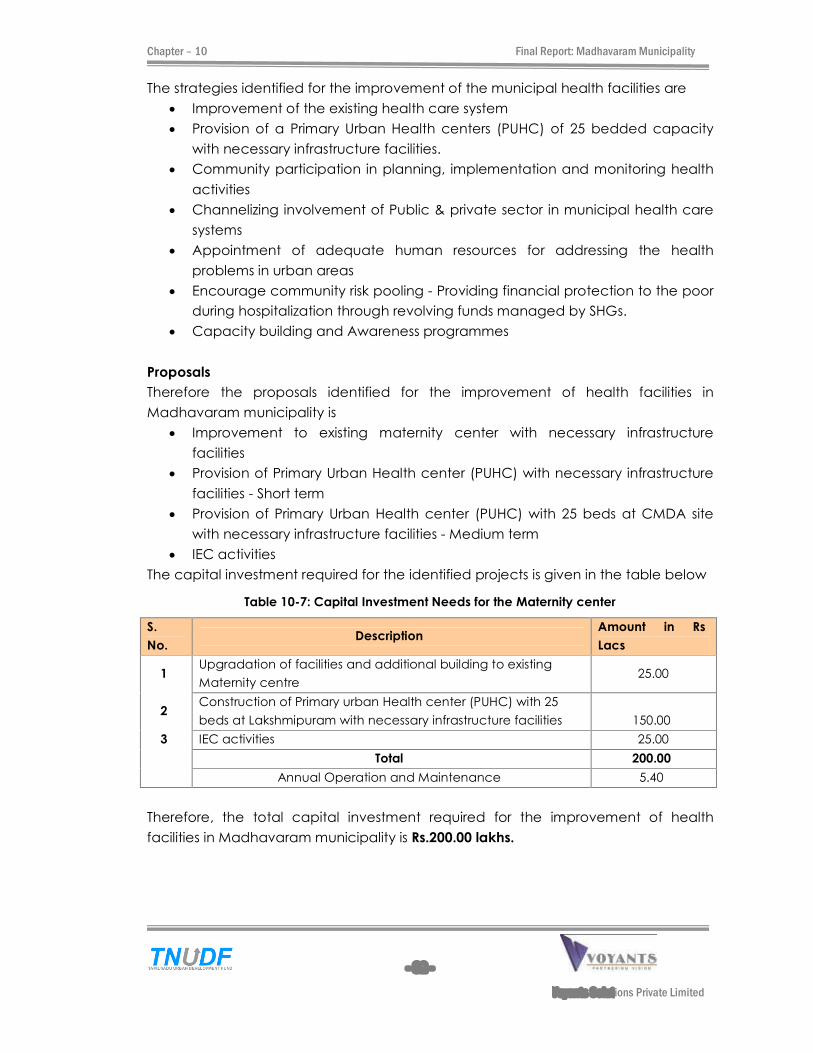
Chapter � 10 Final Report: Madhavaram Municipality
- 82 -
Voyants Solutions Private Limited
The strategies identified for the improvement of the municipal health facilities are
Improvement of the existing health care system
Provision of a Primary Urban Health centers (PUHC) of 25 bedded capacity
with necessary infrastructure facilities.
Community participation in planning, implementation and monitoring health
activities
Channelizing involvement of Public & private sector in municipal health care
systems
Appointment of adequate human resources for addressing the health
problems in urban areas
Encourage community risk pooling - Providing financial protection to the poor
during hospitalization through revolving funds managed by SHGs.
Capacity building and Awareness programmes
Proposals
Therefore the proposals identified for the improvement of health facilities in
Madhavaram municipality is
Improvement to existing maternity center with necessary infrastructure
facilities
Provision of Primary Urban Health center (PUHC) with necessary infrastructure
facilities - Short term
Provision of Primary Urban Health center (PUHC) with 25 beds at CMDA site
with necessary infrastructure facilities - Medium term
IEC activities
The capital investment required for the identified projects is given in the table below
Table 10-7: Capital Investment Needs for the Maternity center
S.
No. Description
Amount in Rs
Lacs
1 Upgradation of facilities and additional building to existing
Maternity centre 25.00
2 Construction of Primary urban Health center (PUHC) with 25
beds at Lakshmipuram with necessary infrastructure facilities 150.00
3 IEC activities 25.00
Total 200.00
Annual Operation and Maintenance 5.40
Therefore, the total capital investment required for the improvement of health
facilities in Madhavaram municipality is Rs.200.00 lakhs.
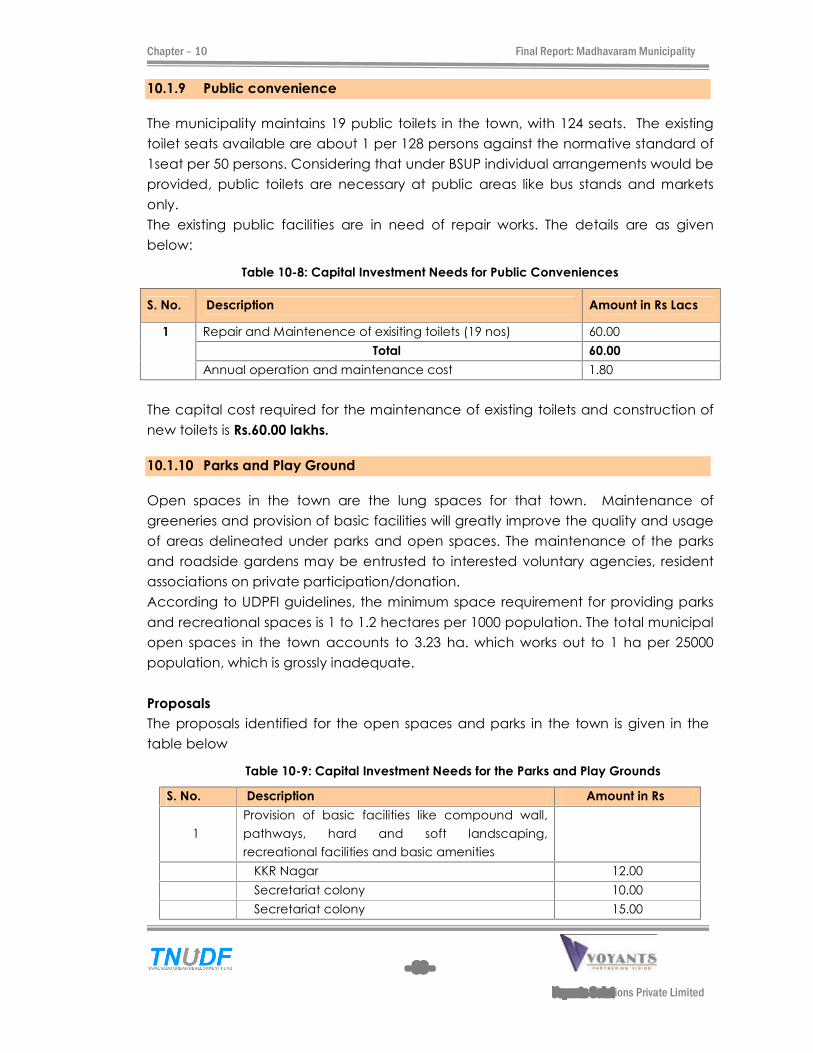
Chapter � 10 Final Report: Madhavaram Municipality
- 83 -
Voyants Solutions Private Limited
10.1.9 Public convenience
The municipality maintains 19 public toilets in the town, with 124 seats. The existing
toilet seats available are about 1 per 128 persons against the normative standard of
1seat per 50 persons. Considering that under BSUP individual arrangements would be
provided, public toilets are necessary at public areas like bus stands and markets
only.
The existing public facilities are in need of repair works. The details are as given
below:
Table 10-8: Capital Investment Needs for Public Conveniences
S. No. Description Amount in Rs Lacs
1 Repair and Maintenence of exisiting toilets (19 nos) 60.00
Total 60.00
Annual operation and maintenance cost 1.80
The capital cost required for the maintenance of existing toilets and construction of
new toilets is Rs.60.00 lakhs.
10.1.10 Parks and Play Ground
Open spaces in the town are the lung spaces for that town. Maintenance of
greeneries and provision of basic facilities will greatly improve the quality and usage
of areas delineated under parks and open spaces. The maintenance of the parks
and roadside gardens may be entrusted to interested voluntary agencies, resident
associations on private participation/donation.
According to UDPFI guidelines, the minimum space requirement for providing parks
and recreational spaces is 1 to 1.2 hectares per 1000 population. The total municipal
open spaces in the town accounts to 3.23 ha. which works out to 1 ha per 25000
population, which is grossly inadequate.
Proposals
The proposals identified for the open spaces and parks in the town is given in the
table below
Table 10-9: Capital Investment Needs for the Parks and Play Grounds
S. No. Description Amount in Rs
1
Provision of basic facilities like compound wall,
pathways, hard and soft landscaping,
recreational facilities and basic amenities
KKR Nagar 12.00
Secretariat colony 10.00
Secretariat colony 15.00
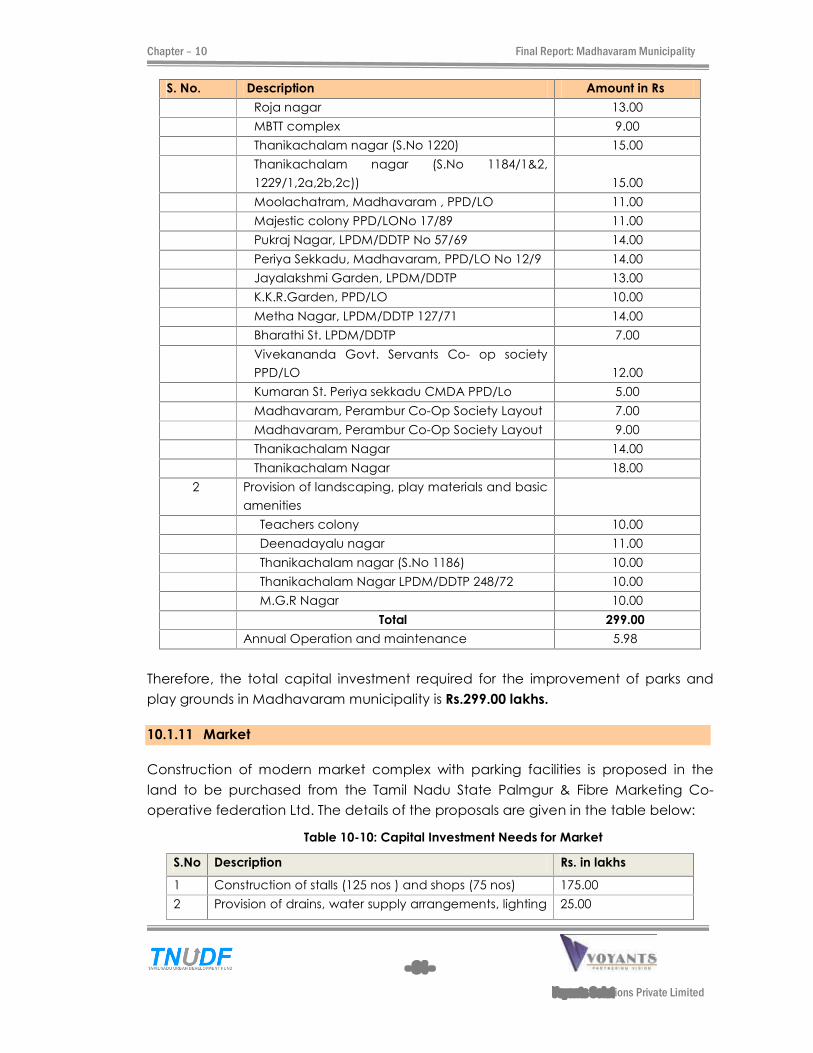
Chapter � 10 Final Report: Madhavaram Municipality
- 84 -
Voyants Solutions Private Limited
S. No. Description Amount in Rs
Roja nagar 13.00
MBTT complex 9.00
Thanikachalam nagar (S.No 1220) 15.00
Thanikachalam nagar (S.No 1184/1&2,
1229/1,2a,2b,2c)) 15.00
Moolachatram, Madhavaram , PPD/LO 11.00
Majestic colony PPD/LONo 17/89 11.00
Pukraj Nagar, LPDM/DDTP No 57/69 14.00
Periya Sekkadu, Madhavaram, PPD/LO No 12/9 14.00
Jayalakshmi Garden, LPDM/DDTP 13.00
K.K.R.Garden, PPD/LO 10.00
Metha Nagar, LPDM/DDTP 127/71 14.00
Bharathi St. LPDM/DDTP 7.00
Vivekananda Govt. Servants Co- op society
PPD/LO 12.00
Kumaran St. Periya sekkadu CMDA PPD/Lo 5.00
Madhavaram, Perambur Co-Op Society Layout 7.00
Madhavaram, Perambur Co-Op Society Layout 9.00
Thanikachalam Nagar 14.00
Thanikachalam Nagar 18.00
2 Provision of landscaping, play materials and basic
amenities
Teachers colony 10.00
Deenadayalu nagar 11.00
Thanikachalam nagar (S.No 1186) 10.00
Thanikachalam Nagar LPDM/DDTP 248/72 10.00
M.G.R Nagar 10.00
Total 299.00
Annual Operation and maintenance 5.98
Therefore, the total capital investment required for the improvement of parks and
play grounds in Madhavaram municipality is Rs.299.00 lakhs.
10.1.11 Market
Construction of modern market complex with parking facilities is proposed in the
land to be purchased from the Tamil Nadu State Palmgur & Fibre Marketing Co-
operative federation Ltd. The details of the proposals are given in the table below:
Table 10-10: Capital Investment Needs for Market
S.No Description Rs. in lakhs
1 Construction of stalls (125 nos ) and shops (75 nos) 175.00
2 Provision of drains, water supply arrangements, lighting 25.00
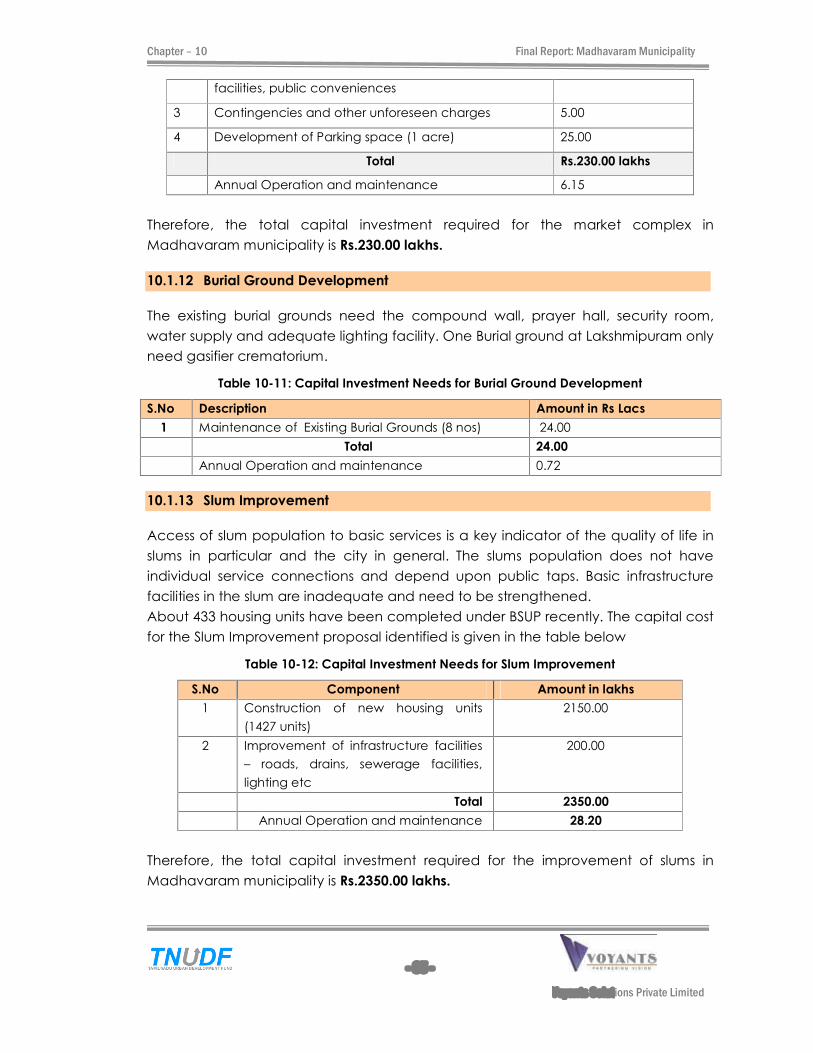
Chapter � 10 Final Report: Madhavaram Municipality
- 85 -
Voyants Solutions Private Limited
facilities, public conveniences
3 Contingencies and other unforeseen charges 5.00
4 Development of Parking space (1 acre) 25.00
Total Rs.230.00 lakhs
Annual Operation and maintenance 6.15
Therefore, the total capital investment required for the market complex in
Madhavaram municipality is Rs.230.00 lakhs.
10.1.12 Burial Ground Development
The existing burial grounds need the compound wall, prayer hall, security room,
water supply and adequate lighting facility. One Burial ground at Lakshmipuram only
need gasifier crematorium.
Table 10-11: Capital Investment Needs for Burial Ground Development
S.No Description Amount in Rs Lacs
1 Maintenance of Existing Burial Grounds (8 nos) 24.00
Total 24.00
Annual Operation and maintenance 0.72
10.1.13 Slum Improvement
Access of slum population to basic services is a key indicator of the quality of life in
slums in particular and the city in general. The slums population does not have
individual service connections and depend upon public taps. Basic infrastructure
facilities in the slum are inadequate and need to be strengthened.
About 433 housing units have been completed under BSUP recently. The capital cost
for the Slum Improvement proposal identified is given in the table below
Table 10-12: Capital Investment Needs for Slum Improvement
S.No Component Amount in lakhs
1 Construction of new housing units
(1427 units)
2150.00
2 Improvement of infrastructure facilities
� roads, drains, sewerage facilities,
lighting etc
200.00
Total 2350.00
Annual Operation and maintenance 28.20
Therefore, the total capital investment required for the improvement of slums in
Madhavaram municipality is Rs.2350.00 lakhs.

Chapter � 10 Final Report: Madhavaram Municipality
- 86 -
Voyants Solutions Private Limited
10.1.14 System Improvement GIS Platform
Till date there is no entirely dependable and realistic database for the town, in form
of topography, updated base map, assessment of properties in their location, size,
use and intensity, assets � lands and structures in their location, status, extent and
quality, topography, land parcels by town survey, numbers and sub divisions and so
on. All these can be updated with cent percent precision using high resolution
satellite imageries supplemented by cent percent primary survey. All these with
spatial and non-spatial data can be had on a GIS format which, on a click at any
features or site on the town map will provide the entire details including the
description of the features / address of the owner including tax paid etc. This is a
onetime comprehensive exercise to include the updated town map with town
survey, land parcels, structures, service network, assets with the relevant details and
description on a GIS format.
Property Mapping
Property taxes are the major source of revenue of ULBs in India. However, in most
cities, not all properties are assessed, records are not updated regularly, and tax
collection is far from satisfactory. ULBs can increase revenue by improving property
inventories, record management, public awareness and participation, and tax
collection.
As a first step, the municipality may initiate a door to door survey of all existing
properties, with details on size & built up area of the property, present use, number of
households, houses, size of families, etc. which would form a database for GIS
projects. At the rate of Rs.30.00 per property (including secondary works), the
estimated cost for the project would be Rs.5.00 lakhs. This would also aid in
identifying unassessed and under assessed properties, rationalization of property tax
etc.
Table 10-13: Capital Investment Needs for System Improvement and e-Governance
S.No Description Amount Rs.in Lakhs
GIS Mapping for Comprehensive Property Database 34.00
Property mapping 5.00
Software, Hardware & Networking for Municipality 25.00
Total 64.00
Annual operation and maintenance 1.92
Therefore, the total capital investment required is Rs.64.00 lakhs.
10.2 OTHER PROJECTS
a. Improvement to municipal office building
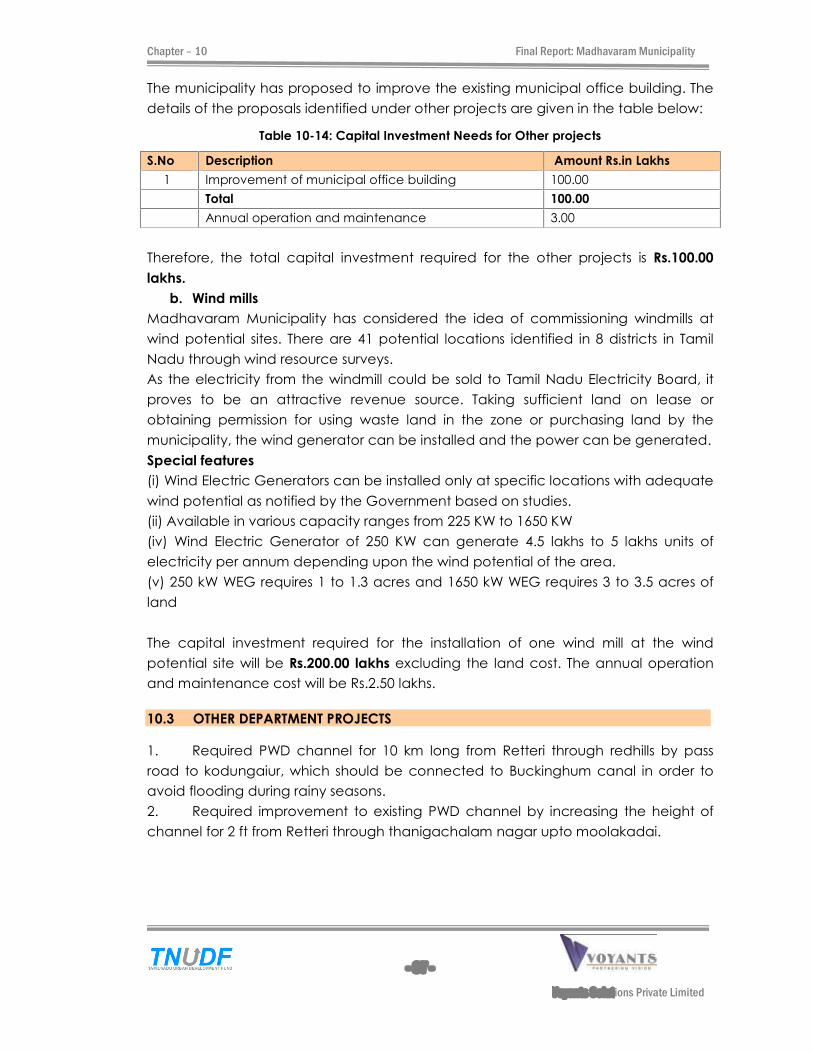
Chapter � 10 Final Report: Madhavaram Municipality
- 87 -
Voyants Solutions Private Limited
The municipality has proposed to improve the existing municipal office building. The
details of the proposals identified under other projects are given in the table below:
Table 10-14: Capital Investment Needs for Other projects
S.No Description Amount Rs.in Lakhs
1 Improvement of municipal office building 100.00
Total 100.00
Annual operation and maintenance 3.00
Therefore, the total capital investment required for the other projects is Rs.100.00
lakhs.
b. Wind mills
Madhavaram Municipality has considered the idea of commissioning windmills at
wind potential sites. There are 41 potential locations identified in 8 districts in Tamil
Nadu through wind resource surveys.
As the electricity from the windmill could be sold to Tamil Nadu Electricity Board, it
proves to be an attractive revenue source. Taking sufficient land on lease or
obtaining permission for using waste land in the zone or purchasing land by the
municipality, the wind generator can be installed and the power can be generated.
Special features
(i) Wind Electric Generators can be installed only at specific locations with adequate
wind potential as notified by the Government based on studies.
(ii) Available in various capacity ranges from 225 KW to 1650 KW
(iv) Wind Electric Generator of 250 KW can generate 4.5 lakhs to 5 lakhs units of
electricity per annum depending upon the wind potential of the area.
(v) 250 kW WEG requires 1 to 1.3 acres and 1650 kW WEG requires 3 to 3.5 acres of
land
The capital investment required for the installation of one wind mill at the wind
potential site will be Rs.200.00 lakhs excluding the land cost. The annual operation
and maintenance cost will be Rs.2.50 lakhs.
10.3 OTHER DEPARTMENT PROJECTS
1. Required PWD channel for 10 km long from Retteri through redhills by pass
road to kodungaiur, which should be connected to Buckinghum canal in order to
avoid flooding during rainy seasons.
2. Required improvement to existing PWD channel by increasing the height of
channel for 2 ft from Retteri through thanigachalam nagar upto moolakadai.
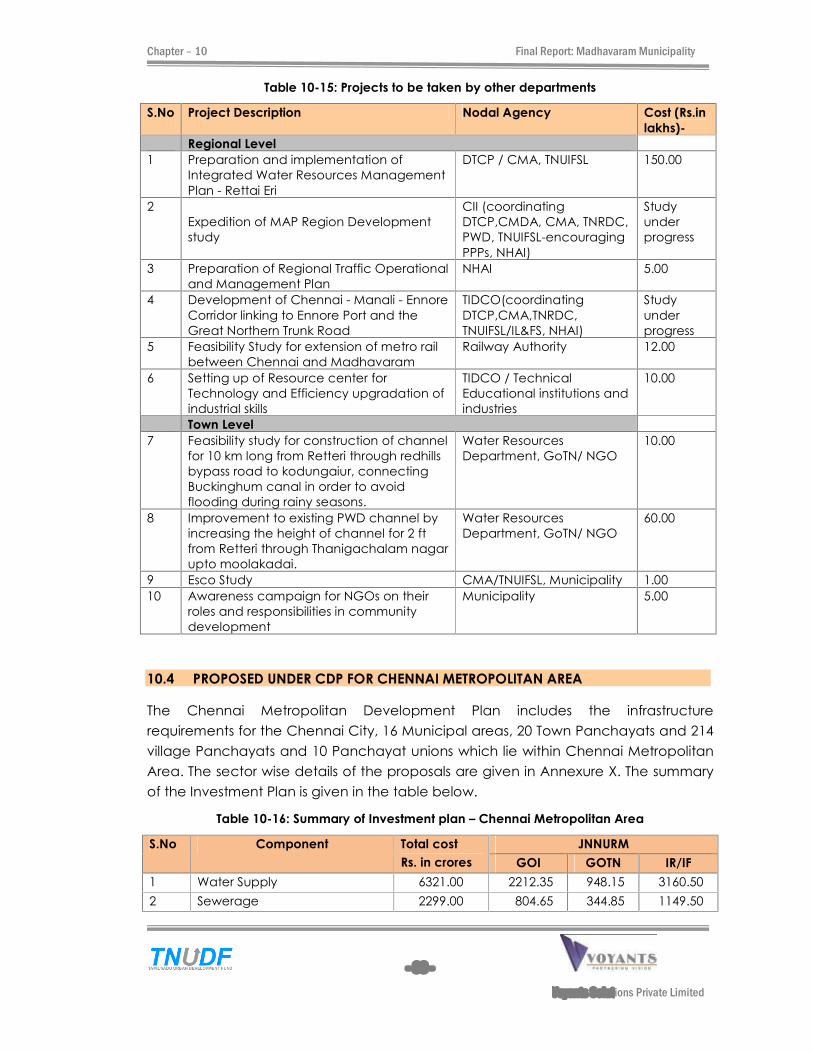
Chapter � 10 Final Report: Madhavaram Municipality
- 88 -
Voyants Solutions Private Limited
Table 10-15: Projects to be taken by other departments
S.No Project Description Nodal Agency Cost (Rs.in
lakhs)-
Regional Level
1 Preparation and implementation of
Integrated Water Resources Management
Plan - Rettai Eri
DTCP / CMA, TNUIFSL 150.00
2
Expedition of MAP Region Development
study
CII (coordinating
DTCP,CMDA, CMA, TNRDC,
PWD, TNUIFSL-encouraging
PPPs, NHAI)
Study
under
progress
3 Preparation of Regional Traffic Operational
and Management Plan
NHAI 5.00
4 Development of Chennai - Manali - Ennore
Corridor linking to Ennore Port and the
Great Northern Trunk Road
TIDCO(coordinating
DTCP,CMA,TNRDC,
TNUIFSL/IL&FS, NHAI)
Study
under
progress
5 Feasibility Study for extension of metro rail
between Chennai and Madhavaram
Railway Authority 12.00
6 Setting up of Resource center for
Technology and Efficiency upgradation of
industrial skills
TIDCO / Technical
Educational institutions and
industries
10.00
Town Level
7 Feasibility study for construction of channel
for 10 km long from Retteri through redhills
bypass road to kodungaiur, connecting
Buckinghum canal in order to avoid
flooding during rainy seasons.
Water Resources
Department, GoTN/ NGO
10.00
8 Improvement to existing PWD channel by
increasing the height of channel for 2 ft
from Retteri through Thanigachalam nagar
upto moolakadai.
Water Resources
Department, GoTN/ NGO
60.00
9 Esco Study CMA/TNUIFSL, Municipality 1.00
10 Awareness campaign for NGOs on their
roles and responsibilities in community
development
Municipality 5.00
10.4 PROPOSED UNDER CDP FOR CHENNAI METROPOLITAN AREA
The Chennai Metropolitan Development Plan includes the infrastructure
requirements for the Chennai City, 16 Municipal areas, 20 Town Panchayats and 214
village Panchayats and 10 Panchayat unions which lie within Chennai Metropolitan
Area. The sector wise details of the proposals are given in Annexure X. The summary
of the Investment Plan is given in the table below.
Table 10-16: Summary of Investment plan � Chennai Metropolitan Area
S.No Component Total cost
Rs. in crores
JNNURM
GOI GOTN IR/IF
1 Water Supply 6321.00 2212.35 948.15 3160.50
2 Sewerage 2299.00 804.65 344.85 1149.50
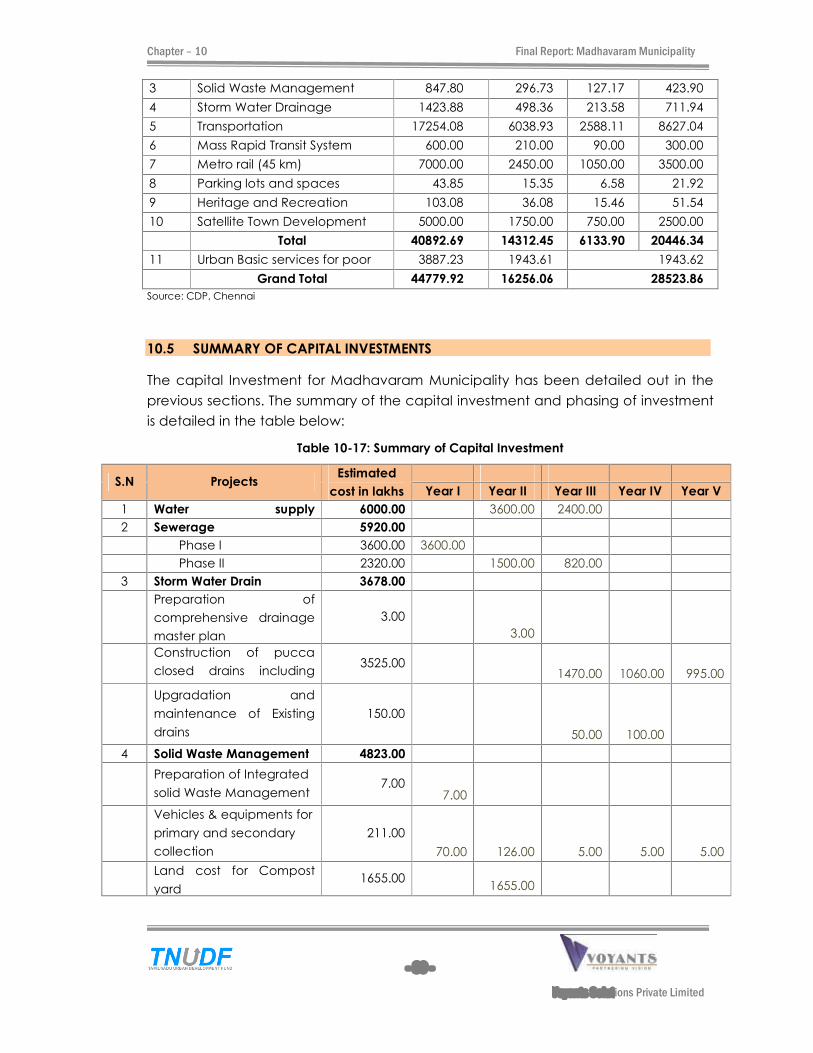
Chapter � 10 Final Report: Madhavaram Municipality
- 89 -
Voyants Solutions Private Limited
3 Solid Waste Management 847.80 296.73 127.17 423.90
4 Storm Water Drainage 1423.88 498.36 213.58 711.94
5 Transportation 17254.08 6038.93 2588.11 8627.04
6 Mass Rapid Transit System 600.00 210.00 90.00 300.00
7 Metro rail (45 km) 7000.00 2450.00 1050.00 3500.00
8 Parking lots and spaces 43.85 15.35 6.58 21.92
9 Heritage and Recreation 103.08 36.08 15.46 51.54
10 Satellite Town Development 5000.00 1750.00 750.00 2500.00
Total 40892.69 14312.45 6133.90 20446.34
11 Urban Basic services for poor 3887.23 1943.61 1943.62
Grand Total 44779.92 16256.06 28523.86
Source: CDP, Chennai
10.5 SUMMARY OF CAPITAL INVESTMENTS
The capital Investment for Madhavaram Municipality has been detailed out in the
previous sections. The summary of the capital investment and phasing of investment
is detailed in the table below:
Table 10-17: Summary of Capital Investment
S.N Projects Estimated
cost in lakhs
Year I Year II Year III Year IV Year V
1 Water supply 6000.00 3600.00 2400.00
2 Sewerage 5920.00
Phase I 3600.00 3600.00
Phase II 2320.00 1500.00 820.00
3 Storm Water Drain 3678.00
Preparation of
comprehensive drainage
master plan
3.00
3.00
Construction of pucca
closed drains including
trunk drains (140 km)
3525.00 1470.00 1060.00 995.00
Upgradation and
maintenance of Existing
drains
150.00
50.00 100.00
4 Solid Waste Management 4823.00
Preparation of Integrated
solid Waste Management 7.00
7.00
Vehicles & equipments for
primary and secondary
collection
211.00
70.00 126.00 5.00 5.00 5.00
Land cost for Compost
yard 1655.00
1655.00
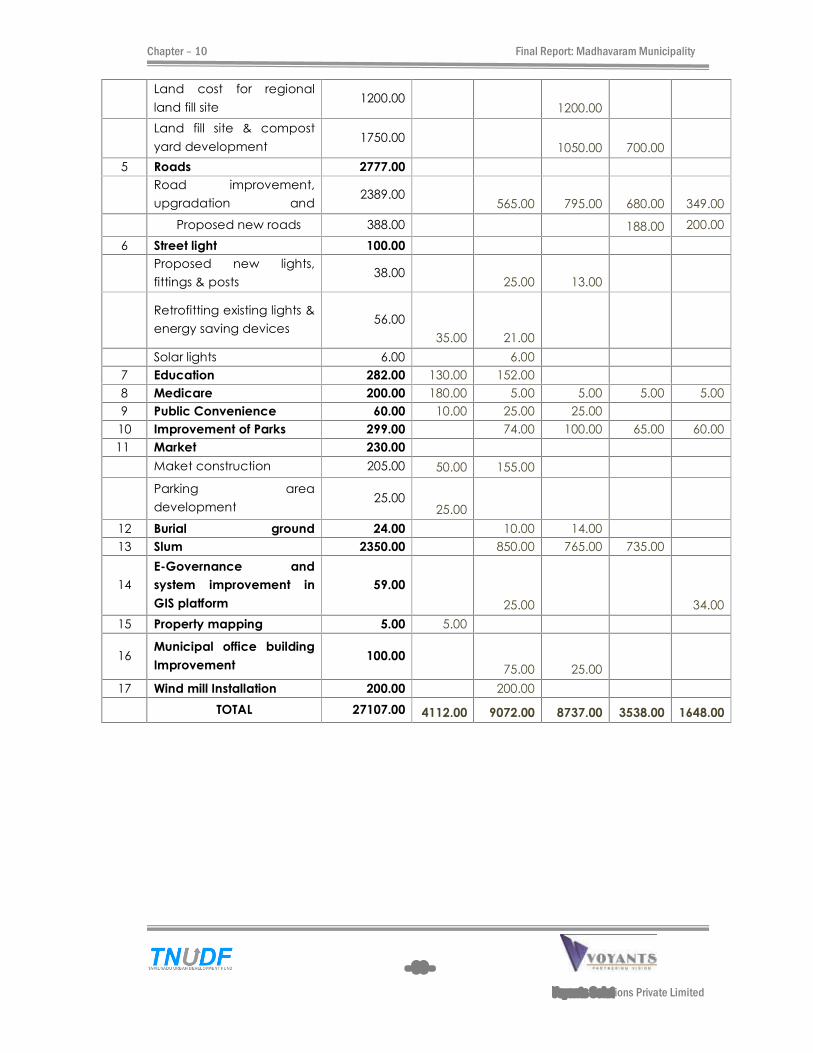
Chapter � 10 Final Report: Madhavaram Municipality
- 90 -
Voyants Solutions Private Limited
Land cost for regional
land fill site 1200.00
1200.00
Land fill site & compost
yard development 1750.00
1050.00 700.00
5 Roads 2777.00
Road improvement,
upgradation and 2389.00
565.00 795.00 680.00 349.00
Proposed new roads 388.00 188.00 200.00
6 Street light 100.00
Proposed new lights,
fittings & posts 38.00
25.00 13.00
Retrofitting existing lights &
energy saving devices 56.00
35.00 21.00
Solar lights 6.00 6.00
7 Education 282.00 130.00 152.00
8 Medicare 200.00 180.00 5.00 5.00 5.00 5.00
9 Public Convenience 60.00 10.00 25.00 25.00
10 Improvement of Parks 299.00 74.00 100.00 65.00 60.00
11 Market 230.00
Maket construction 205.00 50.00 155.00
Parking area
development 25.00
25.00
12 Burial ground 24.00 10.00 14.00
13 Slum 2350.00 850.00 765.00 735.00
14
E-Governance and
system improvement in
GIS platform
59.00
25.00 34.00
15 Property mapping 5.00 5.00
16 Municipal office building
Improvement 100.00
75.00 25.00
17 Wind mill Installation 200.00 200.00
TOTAL 27107.00 4112.00 9072.00 8737.00 3538.00 1648.00
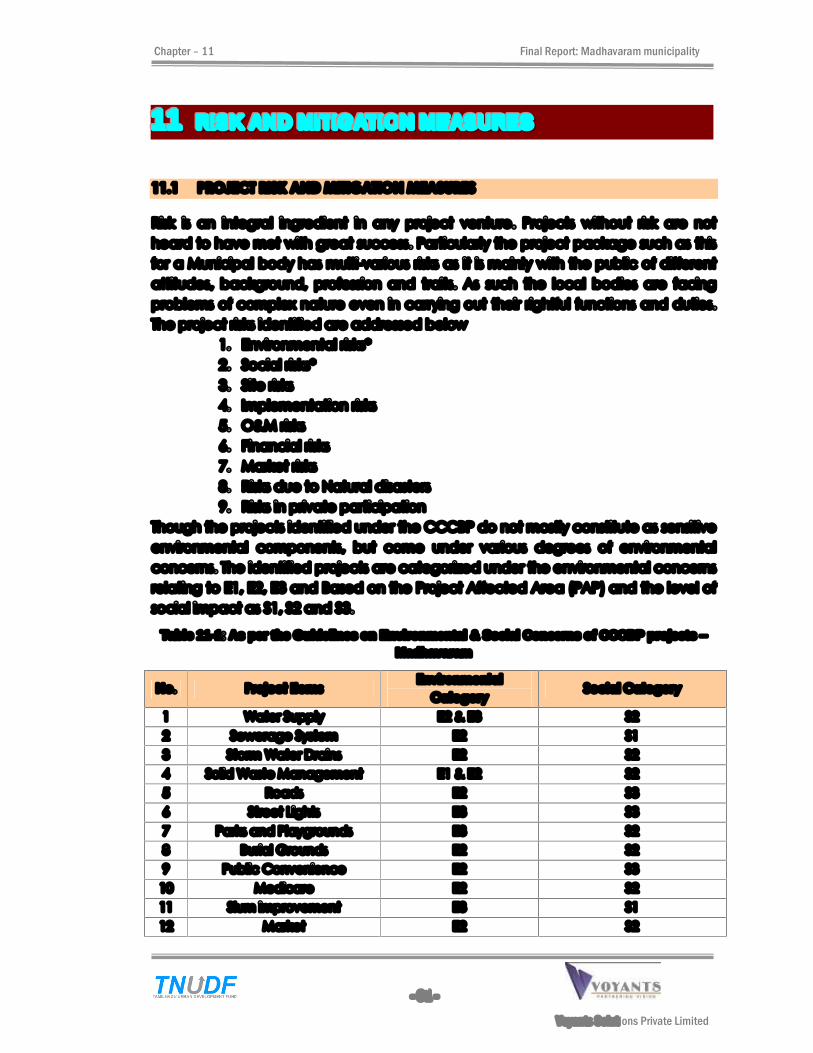
Chapter � 11 Final Report: Madhavaram municipality
- 91 -
Voyants Solutions Private Limited
111111 RRRIIISSSKKK AAANNNDDD MMMIIITTTIIIGGGAAATTTIIIOOONNN MMMEEEAAASSSUUURRREEESSS
11.1 PROJECT RISK AND MITIGATION MEASURES
Risk is an integral ingredient in any project venture. Projects without risk are not
heard to have met with great success. Particularly the project package such as this
for a Municipal body has multi-various risks as it is mainly with the public of different
attitudes, background, profession and traits. As such the local bodies are facing
problems of complex nature even in carrying out their rightful functions and duties.
The project risks identified are addressed below
1. Environmental risks*
2. Social risks*
3. Site risks
4. Implementation risks
5. O&M risks
6. Financial risks
7. Market risks
8. Risks due to Natural disasters
9. Risks in private participation
Though the projects identified under the CCCBP do not mostly constitute as sensitive
environmental components, but come under various degrees of environmental
concerns. The identified projects are categorized under the environmental concerns
relating to E1, E2, E3 and Based on the Project Affected Area (PAP) and the level of
social impact as S1, S2 and S3.
Table 11-1: As per the Guidelines on Environmental & Social Concerns of CCCBP projects � Madhavaram
No. Project Items Environmental
Category Social Category
1 Water Supply E2 & E3 S2
2 Sewerage System E2 S1
3 Storm Water Drains E2 S2
4 Solid Waste Management E1 & E2 S2
5 Roads E2 S3
6 Street Lights E3 S3
7 Parks and Playgrounds E3 S2
8 Burial Grounds E2 S2
9 Public Convenience E2 S3
10 Medicare E2 S2
11 Slum improvement E3 S1
12 Market E2 S2
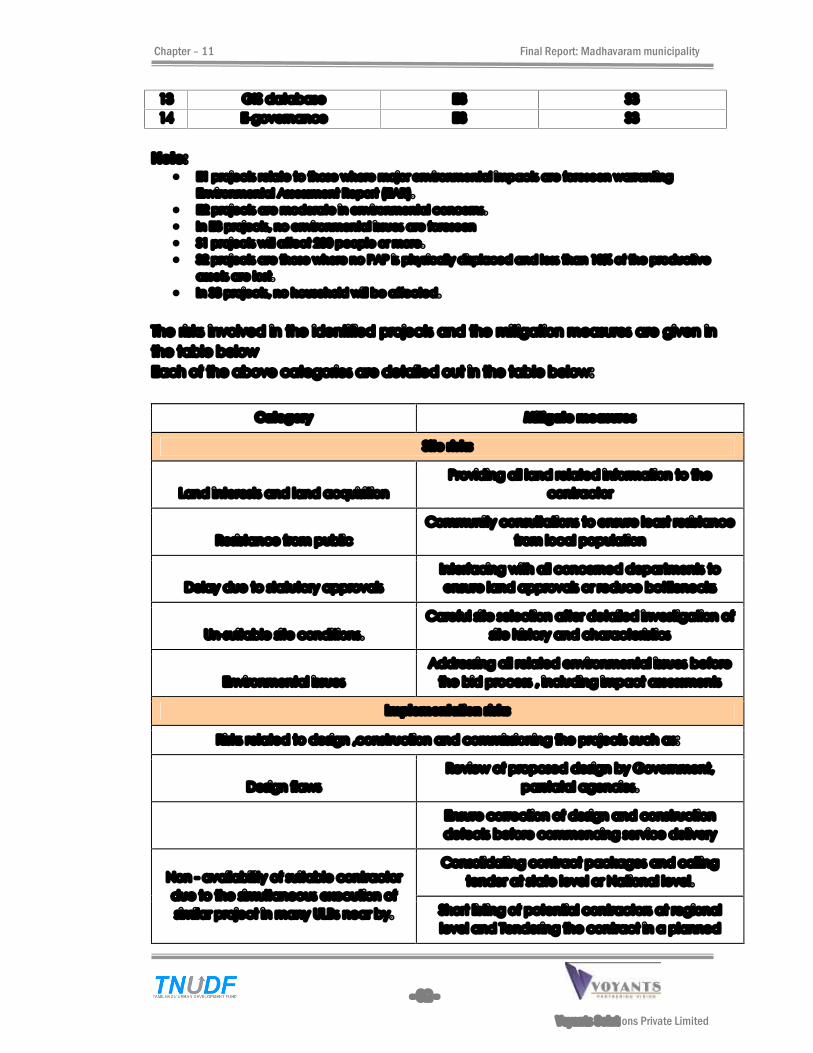
Chapter � 11 Final Report: Madhavaram municipality
- 92 -
Voyants Solutions Private Limited
13 GIS database E3 S3
14 E-governance E3 S3
Note:
� E1 projects relate to those where major environmental impacts are foreseen warranting
Environmental Assessment Report (EAR).
� E2 projects are moderate in environmental concerns.
� In E3 projects, no environmental issues are foreseen
� S1 projects will affect 200 people or more.
� S2 projects are those where no PAP is physically displaced and less than 10% of the productive
assets are lost.
� In S3 projects, no household will be affected.
The risks involved in the identified projects and the mitigation measures are given in
the table below
Each of the above categories are detailed out in the table below:
Category Mitigate measures
Site risks
Land interests and land acquisition
Providing all land related information to the
contractor
Resistance from public
Community consultations to ensure least resistance
from local population
Delay due to statutory approvals
Interfacing with all concerned departments to
ensure land approvals or reduce bottlenecks
Un-suitable site conditions.
Careful site selection after detailed investigation of
site history and characteristics
Environmental issues
Addressing all related environmental issues before
the bid process , including impact assessments
Implementation risks
Risks related to design ,construction and commissioning the projects such as:
Design flaws
Review of proposed design by Government,
parstatal agencies.
Ensure correction of design and construction
defects before commencing service delivery
Non - availability of suitable contractor
due to the simultaneous execution of
similar project in many ULBs near by.
Consolidating contract packages and calling
tender at state level or National level.
Short listing of potential contractors at regional
level and Tendering the contract in a planned
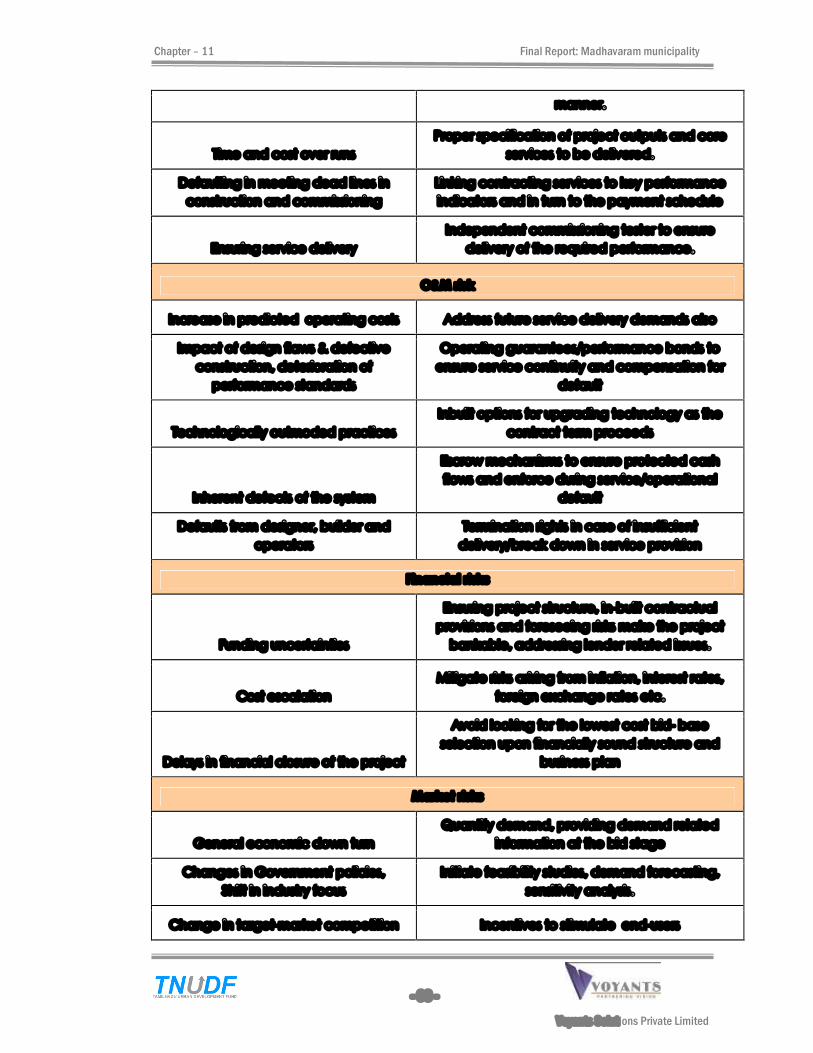
Chapter � 11 Final Report: Madhavaram municipality
- 93 -
Voyants Solutions Private Limited
manner.
Time and cost over runs
Proper specification of project outputs and core
services to be delivered.
Defaulting in meeting dead lines in
construction and commissioning
Linking contracting services to key performance
indicators and in turn to the payment schedule
Ensuring service delivery
Independent commissioning tester to ensure
delivery of the required performance.
O&M risk
Increase in predicted operating costs Address future service delivery demands also
Impact of design flaws & defective
construction, deterioration of
performance standards
Operating guarantees/performance bonds to
ensure service continuity and compensation for
default
Technologically outmoded practices
Inbuilt options for upgrading technology as the
contract term proceeds
Inherent defects of the system
Escrow mechanisms to ensure protected cash
flows and enforce during service/operational
default
Defaults from designer, builder and
operators
Termination rights in case of insufficient
delivery/break down in service provision
Financial risks
Funding uncertainties
Ensuring project structure, in-built contractual
provisions and foreseeing risks make the project
bankable, addressing lender related issues.
Cost escalation
Mitigate risks arising from inflation, interest rates,
foreign exchange rates etc.
Delays in financial closure of the project
Avoid looking for the lowest cost bid- base
selection upon financially sound structure and
business plan
Market risks
General economic down turn
Quantify demand, providing demand related
information at the bid stage
Changes in Government policies,
Shift in industry focus
Initiate feasibility studies, demand forecasting,
sensitivity analysis.
Change in target-market competition Incentives to stimulate end-users
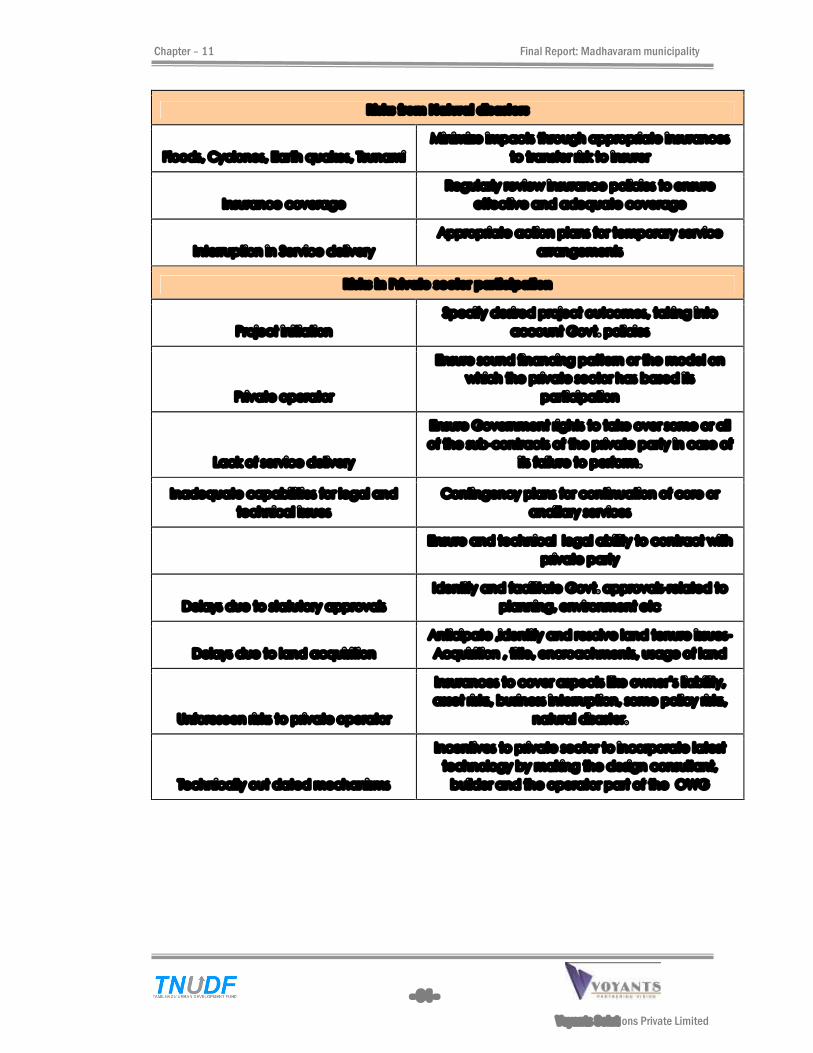
Chapter � 11 Final Report: Madhavaram municipality
- 94 -
Voyants Solutions Private Limited
Risks from Natural disasters
Floods, Cyclones, Earth quakes, Tsunami
Minimize impacts through appropriate insurances
to transfer risk to insurer
Insurance coverage
Regularly review insurance policies to ensure
effective and adequate coverage
Interruption in Service delivery
Appropriate action plans for temporary service
arrangements
Risks in Private sector participation
Project initiation
Specify desired project outcomes, taking into
account Govt. policies
Private operator
Ensure sound financing pattern or the model on
which the private sector has based its
participation
Lack of service delivery
Ensure Government rights to take over some or all
of the sub-contracts of the private party in case of
its failure to perform.
Inadequate capabilities for legal and
technical issues
Contingency plans for continuation of core or
ancillary services
Ensure and technical legal ability to contract with
private party
Delays due to statutory approvals
Identify and facilitate Govt. approvals-related to
planning, environment etc
Delays due to land acquisition
Anticipate ,identify and resolve land tenure issues-
Acquisition , title, encroachments, usage of land
Unforeseen risks to private operator
Insurances to cover aspects like owner�s liability,
asset risks, business interruption, some policy risks,
natural disaster.
Technically out dated mechanisms
Incentives to private sector to incorporate latest
technology by making the design consultant,
builder and the operator part of the OWG
Chapter � 12 Final Report: Madhavaram Municipality
- 95 -
Voyants Solutions Private Limited
111222 RRREEEFFFOOORRRMMMSSS AAANNNDDD AAACCCTTTIIIOOONNN PPPLLLAAANNN A City Corporate cum Business Plan (CCCBP) is essentially a road map to achieve a
set of development objectives within a specific period. This CCCBP has identified
gaps in municipal service delivery and institutional management, ascertained by
expert analysis and stakeholder feedback. The proposed interventions for the
Municipality are in the form of reforms, action plans and strategies to achieve the
same.
Strategies and Action Plans are the elements which bridge the gap between the
Proposed Reforms and implementation. The following sections detail out the
strategies and Action Plan plans for the proposed Reforms and interventions in the
areas of revenue enhancement, privatization, computerization initiatives, energy
efficiency and municipal service delivery.
12.1 PRESENT SCENARIO IN URBAN REFORMS
�Reforms and change are critical elements in development process; they become
more significant in urban development in the context of growth of towns and
consequent pressure on infrastructure and services, growth of poverty, etc. This is
compounded by institutional constraints like in capacity, fragmented structures,
functional overlaps and outdated processes and procedures. In addition, there has
been a paradigm shift in governance from the traditional top-down model. As a
result governance reforms have become imperative for efficient delivery of services,
provision and maintenance of infrastructure and to provide efficient and responsive
governance to the people. Recognizing the significance of reforms to provide
efficient and effective governance, the State Govt. has initiated and implementing
several urban sector reforms during the last few years.
The following are the key reforms implemented by the GoTN :
1. Devolution of funds: 3.5% of State�s total tax revenue passed on to urban local
bodies.
2. State Finance Commissions: Three consecutive state finance commissions
were setup for recommendations to Government.
3. Setting up of TNUDF: A successful private-public partnership initiative to tap
the capital market.
4. Accrual Based Accounting System: The new accounting system has been
implemented in all the urban local bodies.
5. Computerization and E-governance of select Municipal functions have been
successfully implemented in all urban local bodies.
6. Urban indicators: Performance assessment of ULBs initiated by CMA
Chapter � 12 Final Report: Madhavaram Municipality
- 96 -
Voyants Solutions Private Limited
7. Revision of Property tax : With effect from April 1.2008, subject to a maximum
of 1.25 times the existing tax structure.
8. Debt monitoring cell: It has been established with office of CMA with the
objective of collecting financial information on individual ULBs, assisting them
in making realistic financial projections and facilitating the Urban Local Bodies
to access the Capital Markets by information dissemination from CMA office.
9. GIS for 5 urban local bodies: Consultancy for Preparation of Property
mapping and Utility Mapping for Madurai, Coimbatore and Tiruchirappalli
Corporations and Rajapalayam & Gobichettipalayam Municipalities has
been initiated as a pilot project by the office of CMA.
10. ESCO Studies: TNUIFSL initiative for the Implementation of energy efficiency in
Water pumping and Street lighting systems under performance contract.
11. Right to Information Act, GoI : An Act to provide for setting out the practical
regime of right to information for citizens to secure access to information
under the control of public authorities, in order to promote transparency and
accountability in the working of every public authority.
12. Preparation of Human Development report for 5 Municipal Corporations under
TNUDP-III, Commissionerate of Municipal Administration- to identify the
strengths and weaknesses of each urban local body on the appropriate
parameters. This would enable them to propose and implement schemes to
overcome the shortcomings and improve the quality of life of their residents.
12.2 PROPOSED INTERVENTIONS AT STATE LEVEL
a. Property Tax
Implement a framework law for disputed properties, so that the assessees pay the
tax first and then carry out necessary litigation as in Central Govt. Depts.
b. Community participation law
Enacting the �Community Participation Law� that will make it mandatory for the
government and its agencies to get the view of citizens, mainly residents� welfare
associations and other citizens� groups, before starting any project.
c. Initiatives in Private Participation
a. Need for a policy frame work
Although the GoTN has not initiated the PPP policy, a clear policy to define the use
of PPPs, the basis for their use, provides political commitment and support for the
program. This could be vital particularly in the early years of PPP ventures. The main
points that may be addressed in the PPP policy are as listed below:
Chapter � 12 Final Report: Madhavaram Municipality
- 97 -
Voyants Solutions Private Limited
The Policy must stress on PPPs as a provider of better services to the urban
masses and not a tool to attract private investors to supplement Government
deficits.
The policy can provide clarity on other aspects, such as the approach
towards risk transfer, procurement, financing, and the need for transparency.
It should also encourage the discussion of key issues among different
stakeholders, for a better understanding of the main characteristics of PPPs,
their advantages, and their drawbacks. This would ensure a win-win situation
for both public and private sectors.
b. Need for a legal framework
At the National level, PPP law has been implemented in Gujarat, Andhra Pradesh
and Punjab. In Tamil Nadu, sector specific amendments have been used to
facilitate PPPs as in the case of Karur toll bridge wherein the �TN State Toll Act� was
amended to facilitate ULB to enter into BoT contract.
However, a PPP law would be beneficial in consolidating relevant legal provisions
into one, and legislating the process of procurement, development and regulation
of PPP projects, dispute settlements, which can be better enforced by law.
This is especially important at the ULB/ Regional levels where the techno-legal
capabilities might not be as good as at the State/ Central level. A model law at the
Central level or the existing laws in Gujarat, Andhra Pradesh and Punjab would serve
as base for GoTN.
c. Need for strengthening the institutional framework.
The PPP cell at the State level is a GoTN venture. To improve the turnaround in the
number of projects, expertise at TNUIFSL may be roped in for providing consultancy
services for PPP projects. A Regional PPP cell constituting authorities from GoTN,
TNUIFSL and Financial Institutions may be constituted, the expenses on which can be
borne by project basis. Alternatively, Private consultants could be appointed for
project structuring and PMC for specialised projects as in the case of TNHB JV
projects.
A single window approach system at the State or Regional levels through agencies
such as TNUIFSL for technical and contractual guidance for the ULBs aspiring to
execute the projects identified would also address the need for techno-legal
guidance for projects. After the first few projects, Regional authorities and the
executive heads of the ULBs (champions) would have gained considerable
knowledge which could be disseminated to the others. Constant transfer of
administrative �champions� also weaken reform initiatives.
Empanelling private investors and consultants for each sector, based on past
experience, size of the projects and PPP modality would also facilitate policy makers
to identify availability or gaps in the various sectors of urban infrastructure.
Chapter � 12 Final Report: Madhavaram Municipality
- 98 -
Voyants Solutions Private Limited
d. Information dissemination
At the central and bureaucratic levels, PPP workshops and seminars have been
conducted by the World Bank, ADB and the Department of Economic affairs. But
there has been little trickle down of information to the authorities in need of
information such as ULB officials, authorities of line agencies etc.
The first step in information dissemination could be setting up a publicly-accessible
database on PPPs at the state, regional and local levels to contain information on
o Contract design for various sectors
o Procedures for identifying, procuring and managing PPPs
o Transfer of risks
o Various PPP models
o Analysis of successes and failures
o Case studies of success models with regular performance updates
o Empanelled list of private operators under various sectors and models
at the National and State level.
o Regular updates form resource centres and personnel , on line paper
publications,
o Information on successful contractor, progress of awarded projects
and mile stones achieved.
o Sector toolkits can be developed once sufficient sector experience
has been achieved.
e. Need for Political consensus
Stable political consensus at state and Ulb levels from the EOI stage till the Financial
Closure of the project is one of the main factors that would determine the success of
PPP projects. In the case Tamil Nadu, the success of every PPP project will account
for creating conducive environment for prospective private investors.
f. Addressing size based constraints
Although projects of considerable size only are viable under PPP, clustering of similar
projects in the region would overcome this challenge faced by many small and
medium Towns in Tamil Nadu. A good example would be the WSPF under which WS
/ UGSS projects for 14 Municipalities have been clubbed to build a common
resource base.
g. Strategies for identifying PPP projects.
Step-1
From the compiled list of priority projects across all ULBs, investigate each
project sector wise and size wise for viability under PPP option.
Chapter � 12 Final Report: Madhavaram Municipality
- 99 -
Voyants Solutions Private Limited
Step-2
Analyze and compare against EPC projects for the benefits in terms of time,
cost, technology options and PPP model applicable. The more
advantageous option for the particular sector / project to be finalised.
Step -3
The projects selected under PPP ventures to be listed down and cross
referenced with the availability of private investors in a particular sector.
Unbundling of services would facilitate bridging any gaps in the availability of
private players and also would facilitate local firms in bidding for the project,
thus increasing competition.
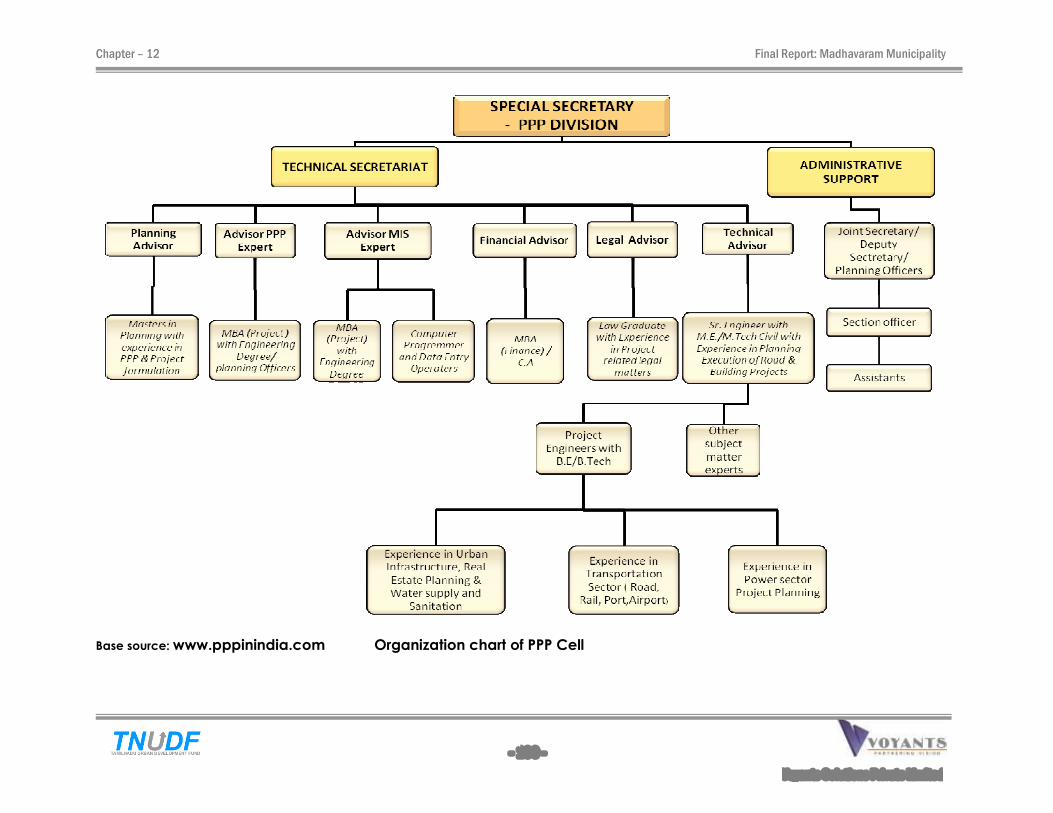
Chapter � 12 Final Report: Madhavaram Municipality
- 100 -
Voyants Solutions Private Limited
Base source: www.pppinindia.com Organization chart of PPP Cell
Chapter � 12 Final Report: Madhavaram Municipality
- 101 -
Voyants Solutions Private Limited
Infrastructural projects:
Water supply project
1. As regards water supply projects, the consultant proposes using available
local sources (surface water) in lieu of capital intensive projects from far off
sources. The enforcement of RWH in all buildings is a commendable initiative,
which has proven successful in improving the quality and quantity of ground
water table according to a recent study. Rejuvenation and protection of
water bodies and recycling, reuse of water is also a major issue to be
addressed in this regard. Participation of SHGS, voluntary organizations,
resident welfare associations need to be sought.
UGSS project
1. Highly engineered and mechanized conventional sewage treatments require
large Capital Investments, demand high maintenance costs and are not
feasible for the developing countries like ours. Capital intensive and highly
technological waste disposal solutions, utilizing indiscriminate collection and
large-scale disposal, do not consider the value of recovering organic waste
resources and do not promote recycling. The land required for the disposal of
treated wastewater in the conventional treatment systems is not readily
available. Alternative treatment systems like Root zone treatment methods
could be used.
2. GoTN may also encourage recycle of water, to meet requisite standards
rather than let them out into streams or sewage farms. This will not only
promote water recycling , but also resource recovery of minerals.
Integrated Water Resources Management Plan (IWRM) � The solution.
As a general rule, in the past with smaller populations, less intense economic
activity and with less affluent societies demanding much less water, supply of the
resource was usually much greater than demand for it. In such circumstances
water for agriculture, for industry, for domestic and all other uses could be
managed separately there being sufficient water to accommodate all needs
and there being little competition between uses and between users.
As populations have grown, as food production has increased, as economic
activity has developed and as societies have become more affluent, so
demand for water has burgeoned. The traditional fragmented or purely sectoral
approach is no longer viable and a more holistic approach is essential. This is the
rationale for the Integrated Water Resources Management (IWRM) approach
that has now been accepted internationally as the way forward for efficient and

Chapter � 12 Final Report: Madhavaram Municipality
- 102 -
Voyants Solutions Private Limited
sustainable development and management of the world�s limited water
resources and for coping with conflicting demands.
�IWRM is defined as a process that promotes the coordinated development and
management of water, land and related resources, in order to maximize the
resultant economic and social welfare in an equitable manner without
compromising the sustainability of vital ecosystems�.
Source: Status Report on Integrated Water Resources Management and Water
Efficiency Plans � UN water report.
12.3 PROPOSED INTERVENTION AT MUNICIPAL LEVEL
The Proposed Municipal intervention is broadly categorized under the heads of:
1. Reforms in Resource Mobilisation
2. Privatisation Initiatives
3. Energy & resource efficiency
4. Computerization and E-governance
5. Accounts and Auditing
6. Institutional Management
7. Municipal service delivery
12.3.1 Reforms in Resource Mobilisation
In an environment in which business activity is booming and urban infrastructure
threatens to become a constraint to growth, the municipalities are faced with an
unprecedented need to find substantial resources for development, and an
unprecedented opportunity to raise the same. The various options for enhancement
of Municipal revenue based is discussed below:
1. Improving revenue from own sources
2. Improving revenue from user charges
3. Formation of new sustainable revenue bases
12.3.2 Action Plan : Improving revenue from own sources
Strategy options :
i. Property and Profession tax
1. Expanding Property tax and Profession tax base.
Onetime assessment of all unassessed and under assessed properties. This
would increase the property tax revenue base by 20-30%. The project could
be taken up as a door �to �door survey of all existing properties, with details
on
Chapter � 12 Final Report: Madhavaram Municipality
- 103 -
Voyants Solutions Private Limited
1. Size & built up area of the property
2. Present use - residential, commercial, industrial or vacant.
3. Number of households, houses, size of families, etc.
Street naming and property numbering already undertaken by Govt. of Tamil
Nadu needs to be linked to this to streamline the study. At the rate of Rs.30.00
per property, the estimated cost for the project would be about Rs.5.00 lakhs.
Property mapping would form a database for GIS projects (Land use and
Utility Mapping), which is a long term project and in the rationalization of tax
structure. The participation of the SHGs, (youth and women) could be utilized
for the purpose.
Identifying and including omitted Profession tax assesses - This project is to be
linked to the property mapping exercise. An improvement of 20-30% on the
existing tax base could be expected.
2. Rebates on Property tax:
Most of the collections take place during the last quarter of the year. This
results in poor collection efficiency, wherein the ULB ends up collecting much
less taxes than the tax demand raised. The option of providing rebates upto
10% for �early birds� paying the tax during the 1st and 2nd quarter could be
explored. This would ensure timely spending on capital and operating
expenditure and efficient tax management systems.
3. Regular and periodic increment of property tax at 15% every 5 years.
4. Mobilizing a �Fast Track Litigation Campaign� to settle disputes on
properties.
5. Levying Vacant Land Tax as per the recommendations of Third State
Finance Commission. Empowering the municipality to convert non-
claimed lands to socially benefiting uses.
ii. Profession Tax Reform
Revising the profession tax based on the Third State Finance Commission
recommendations.
iii Regularization of unapproved construction
Regularization fees for unapproved constructions at the rate of 5 times the
existing building license fee.

Chapter � 12 Final Report: Madhavaram Municipality
- 104 -
Voyants Solutions Private Limited
Table 12-1: Road Map - Improving revenue from own sources
Sl.No Reforms Year of Implementation
Year 1 Year 2 Year 3 Year 4 Year 5
1 Property tax Reform
i Property Mapping √
ii Rebates on Property tax √
iii Regular and periodic
increment of property tax √
iv Mobilizing a �Fast Track
Litigation Campaign�
√
v Levying Vacant Land Tax √
2 Regularization of unapproved
construction √
12.3.3 Action Plan : Improving revenue from user charges
Strategy options
i. Water supply and UGSS
Approval of the Municipal council for the proposed tariff and deposit
structure to enhance the public contribution and meet the entire O&M cost.
Increase in the penetration of connections to at least 85% of total
assessments. This backed by higher collection efficiency and enforced
leakage losses (less than 15%) would further improve service delivery.
Levy Reasonable User Charges to recover full O&M Cost of water supply and
UGSS.
Implementation of graded tariff structure (UGSS) for domestic and non-
domestic connections. This needs to be linked to property mapping project
and type of assessment to be ensured.
Mandatory mobilisation of deposits for Capital intensive WS or UGSS projects
during pre-construction stage of the project.
ii. Solid Waste Management
Approval of the Municipal council for the proposed Solid waste conservancy
charges for commercial and industrial establishments during the base year
and after 5 years for domestic assessments.
For implementing collection of conservancy fee for Solid waste Management
.The proposed tariff structure is given below:
Domestic - Rs.5 per month.(medium term plan)
Commercial - Rs.10 per ton.
Industrial - Rs.15 per ton.
Bio-medical - Collected by IMA.
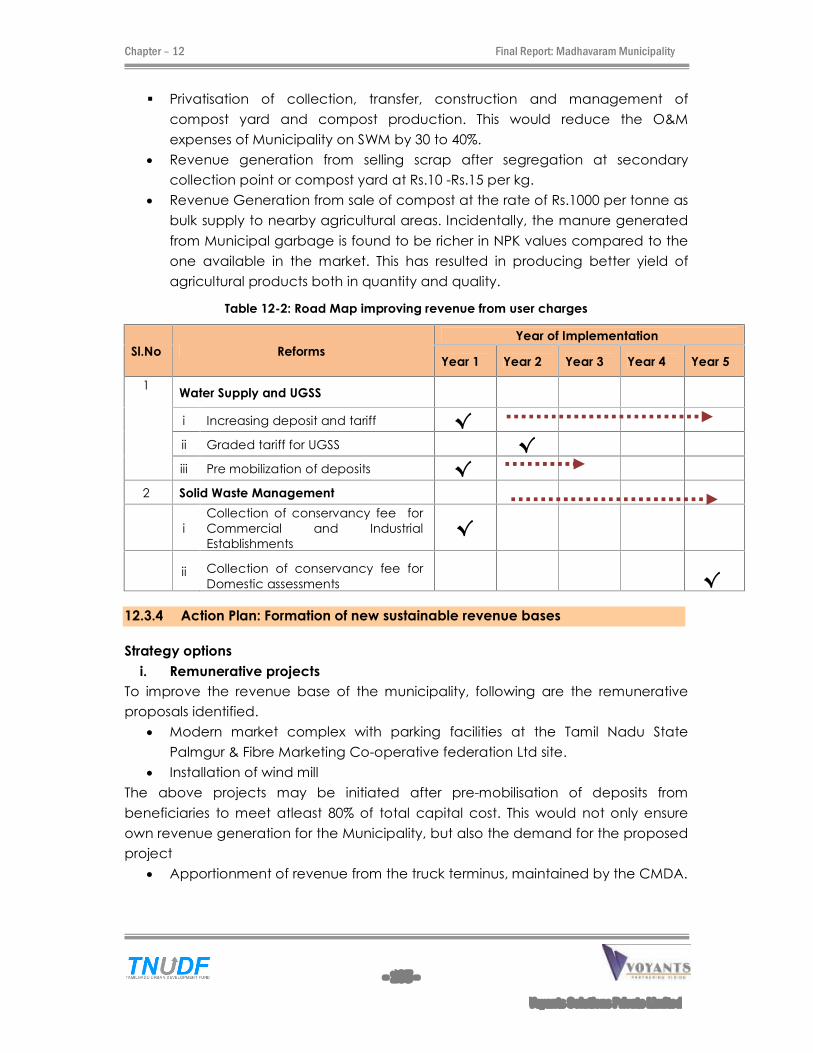
Chapter � 12 Final Report: Madhavaram Municipality
- 105 -
Voyants Solutions Private Limited
Privatisation of collection, transfer, construction and management of
compost yard and compost production. This would reduce the O&M
expenses of Municipality on SWM by 30 to 40%.
Revenue generation from selling scrap after segregation at secondary
collection point or compost yard at Rs.10 -Rs.15 per kg.
Revenue Generation from sale of compost at the rate of Rs.1000 per tonne as
bulk supply to nearby agricultural areas. Incidentally, the manure generated
from Municipal garbage is found to be richer in NPK values compared to the
one available in the market. This has resulted in producing better yield of
agricultural products both in quantity and quality.
Table 12-2: Road Map improving revenue from user charges
Sl.No Reforms
Year of Implementation
Year 1 Year 2 Year 3 Year 4 Year 5
1 Water Supply and UGSS
i Increasing deposit and tariff √
ii Graded tariff for UGSS √
iii Pre mobilization of deposits √
2 Solid Waste Management
i
Collection of conservancy fee for
Commercial and Industrial
Establishments √
ii Collection of conservancy fee for
Domestic assessments
√
12.3.4 Action Plan: Formation of new sustainable revenue bases
Strategy options
i. Remunerative projects
To improve the revenue base of the municipality, following are the remunerative
proposals identified.
Modern market complex with parking facilities at the Tamil Nadu State
Palmgur & Fibre Marketing Co-operative federation Ltd site.
Installation of wind mill
The above projects may be initiated after pre-mobilisation of deposits from
beneficiaries to meet atleast 80% of total capital cost. This would not only ensure
own revenue generation for the Municipality, but also the demand for the proposed
project
Apportionment of revenue from the truck terminus, maintained by the CMDA.
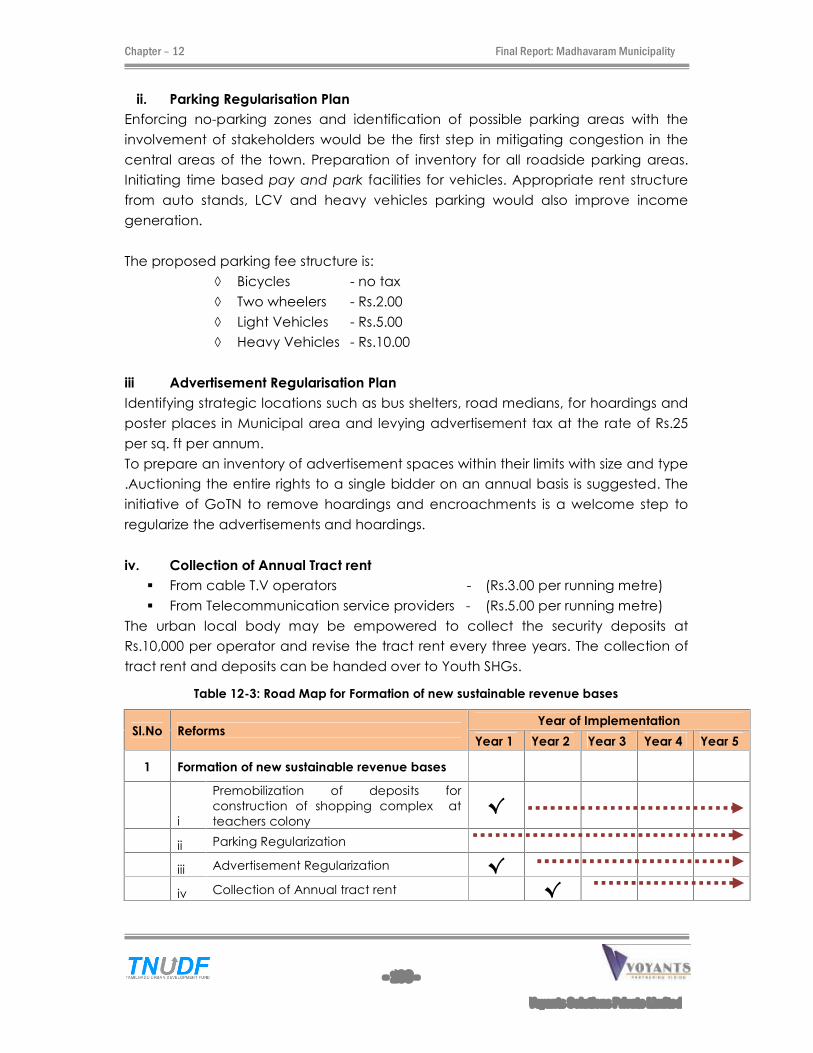
Chapter � 12 Final Report: Madhavaram Municipality
- 106 -
Voyants Solutions Private Limited
ii. Parking Regularisation Plan
Enforcing no-parking zones and identification of possible parking areas with the
involvement of stakeholders would be the first step in mitigating congestion in the
central areas of the town. Preparation of inventory for all roadside parking areas.
Initiating time based pay and park facilities for vehicles. Appropriate rent structure
from auto stands, LCV and heavy vehicles parking would also improve income
generation.
The proposed parking fee structure is:
Bicycles - no tax
Two wheelers - Rs.2.00
Light Vehicles - Rs.5.00
Heavy Vehicles - Rs.10.00
iii Advertisement Regularisation Plan
Identifying strategic locations such as bus shelters, road medians, for hoardings and
poster places in Municipal area and levying advertisement tax at the rate of Rs.25
per sq. ft per annum.
To prepare an inventory of advertisement spaces within their limits with size and type
.Auctioning the entire rights to a single bidder on an annual basis is suggested. The
initiative of GoTN to remove hoardings and encroachments is a welcome step to
regularize the advertisements and hoardings.
iv. Collection of Annual Tract rent
From cable T.V operators - (Rs.3.00 per running metre)
From Telecommunication service providers - (Rs.5.00 per running metre)
The urban local body may be empowered to collect the security deposits at
Rs.10,000 per operator and revise the tract rent every three years. The collection of
tract rent and deposits can be handed over to Youth SHGs.
Table 12-3: Road Map for Formation of new sustainable revenue bases
Sl.No Reforms Year of Implementation
Year 1 Year 2 Year 3 Year 4 Year 5
1 Formation of new sustainable revenue bases
i
Premobilization of deposits for
construction of shopping complex at
teachers colony √
ii Parking Regularization
iii Advertisement Regularization √
iv Collection of Annual tract rent √
Chapter � 12 Final Report: Madhavaram Municipality
- 107 -
Voyants Solutions Private Limited
12.3.5 Action Plan: Privatisation Initiatives
The present areas of privatization of the functions of the ULB in Tamil Nadu are
i. Solid waste management- all components.
ii. O&M of street lights.
iii. O&M of water supply distribution.
iv. AMC of public and pay & use toilet facilities.
v. Parks and parking lots Maintenance and user charges collection.
The GoTN states that this list is indicative and ULBs are free to explore more options.
This would not only save the O&M expenses, but also indirectly in pension and
gratuities. The various strategy options are discussed below:
Strategy options
1. Privatisation of Collection mechanism
Providing a computer fitted mobile van with online access to municipal
database for spot billing and collection of all taxes. Performance based
incentives can be given to the private operators at the rate of 5% of total
collection .The support of the Youth / Women SHGs or fan clubs can be sought
for the purpose of collection with adequate sensitization programmes.
2. Improving community participation by organizing Public awareness
campaigns and Training of Tax Inspectors, to improve the �willingness to pay�
of the users. The aid of SHGs, fan clubs, media could be utilized for the
purpose. The following are the various avenues of revenue, the collection of
which could be privatized.
1. Property tax
2. Profession tax
3. Water - Deposits and tariff
4. UGSS- Deposits and tariff
5. Advertisement spaces /rights as a single contract
6. Parking areas
7. Solid waste conservancy fees(Domestic and non-domestic)
3. Privatisation of Operation and Maintenance of the entire Water Supply and
Distribution System.
4. Privatisation of operation and maintenance of the UGSS.
5. Privatisation of Solid waste management (Discussed indetail under Improving
revenue from user charges)
6. Privatisation of O&M of street lights & pumping machinery(detailed out in
Action plan for energy & resource efficiency)

Chapter � 12 Final Report: Madhavaram Municipality
- 108 -
Voyants Solutions Private Limited
7. Repair and maintenance of major Municipal roads for 3 years from the period
of laying.
8. Option of BOT, BOOT for parks & play grounds by implementing user charges
for areas more than 5000 sft .
9. Option of converting public toilets to pay & use type and privatization of
O&M.
10. Private participation in medical infrastructure like RCHP, maternity homes and
adoption of premium and free facility programme in return for improved
medical facility.
Table 12-4: Road Map for Privatization initiatives
Sl.No Reforms
Year of Implementation
Year
1
Year
2
Year
3
Year
4
Year
5
1 Privatization of Operation and Maintenance
i water supply and Distributionsystem √
ii Sewer network & STP √
iii street lights √
iv AMC of Public and pay % use toilet
facilities √
v Parks and parking lots Maintenance
and user charges collections
2 Privatisation options in Solid Waste
Management
Privatization of Door to door collection of
solid waste √
Compost yard management & sale of
compost & scrap √
3 Privatization of Collection mechanism
Spot billing and tax collection using mobile
van √
4 Formation and sensitisation of youth &
women SHGs √
5 Public awareness campaign for improving
tax collection (IEC) √
12.3.6 Action Plan: Energy & resource efficiency
Strategy options
Conducting energy audits for water pumping machinery and street lights.
Conducting leak detection studies, if transmission losses are more than 15%.
All Head works and service reservoirs may be fitted with bulk water meter to
assess the loss due to non revenue water and unaccounted water.
Enforce regulations on illegal tapping of water.
Fixing flow control valves and meters for all water service connections.
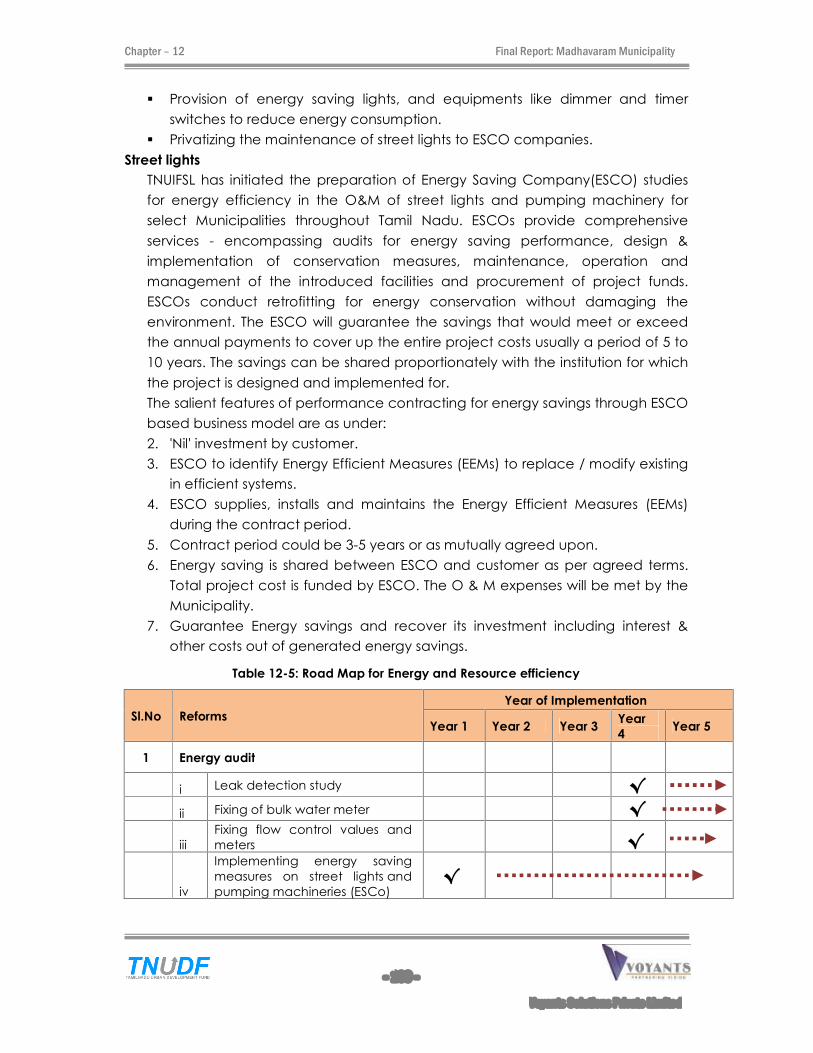
Chapter � 12 Final Report: Madhavaram Municipality
- 109 -
Voyants Solutions Private Limited
Provision of energy saving lights, and equipments like dimmer and timer
switches to reduce energy consumption.
Privatizing the maintenance of street lights to ESCO companies.
Street lights
TNUIFSL has initiated the preparation of Energy Saving Company(ESCO) studies
for energy efficiency in the O&M of street lights and pumping machinery for
select Municipalities throughout Tamil Nadu. ESCOs provide comprehensive
services - encompassing audits for energy saving performance, design &
implementation of conservation measures, maintenance, operation and
management of the introduced facilities and procurement of project funds.
ESCOs conduct retrofitting for energy conservation without damaging the
environment. The ESCO will guarantee the savings that would meet or exceed
the annual payments to cover up the entire project costs usually a period of 5 to
10 years. The savings can be shared proportionately with the institution for which
the project is designed and implemented for.
The salient features of performance contracting for energy savings through ESCO
based business model are as under:
2. 'Nil' investment by customer.
3. ESCO to identify Energy Efficient Measures (EEMs) to replace / modify existing
in efficient systems.
4. ESCO supplies, installs and maintains the Energy Efficient Measures (EEMs)
during the contract period.
5. Contract period could be 3-5 years or as mutually agreed upon.
6. Energy saving is shared between ESCO and customer as per agreed terms.
Total project cost is funded by ESCO. The O & M expenses will be met by the
Municipality.
7. Guarantee Energy savings and recover its investment including interest &
other costs out of generated energy savings.
Table 12-5: Road Map for Energy and Resource efficiency
Sl.No Reforms
Year of Implementation
Year 1 Year 2 Year 3 Year
4 Year 5
1 Energy audit
i Leak detection study √
ii Fixing of bulk water meter √
iii
Fixing flow control values and
meters √
iv
Implementing energy saving
measures on street lights and
pumping machineries (ESCo) √
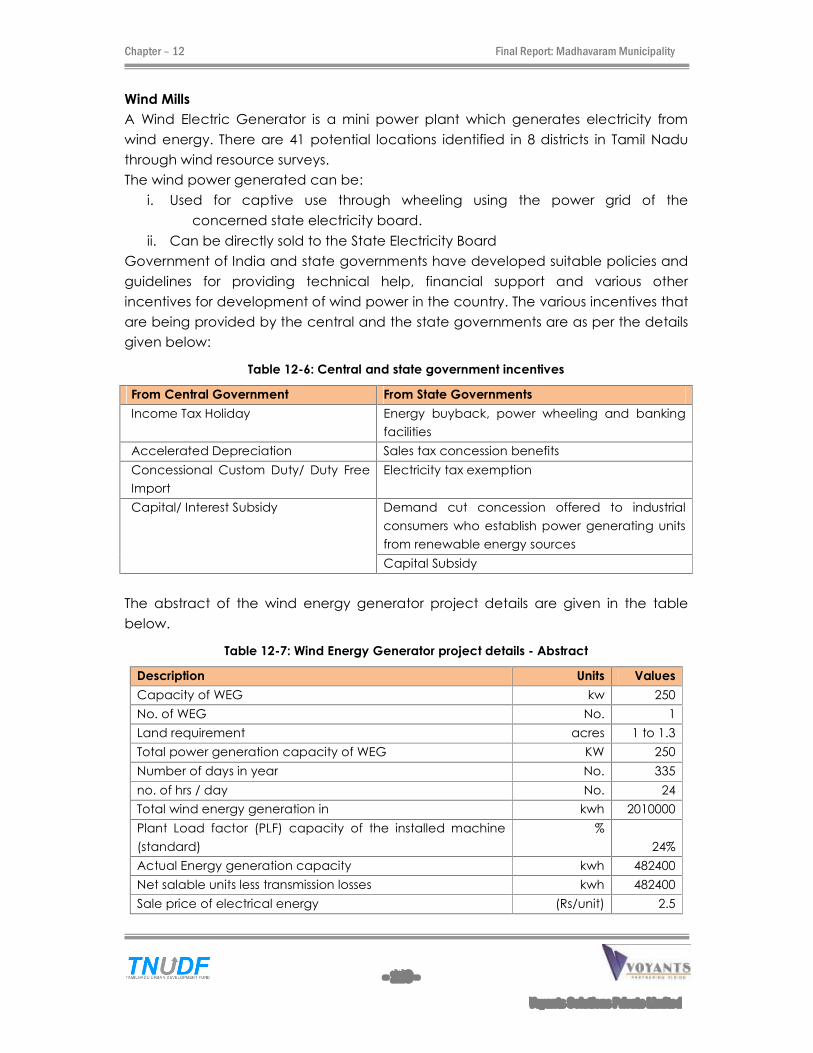
Chapter � 12 Final Report: Madhavaram Municipality
- 110 -
Voyants Solutions Private Limited
Wind Mills
A Wind Electric Generator is a mini power plant which generates electricity from
wind energy. There are 41 potential locations identified in 8 districts in Tamil Nadu
through wind resource surveys.
The wind power generated can be:
i. Used for captive use through wheeling using the power grid of the
concerned state electricity board.
ii. Can be directly sold to the State Electricity Board
Government of India and state governments have developed suitable policies and
guidelines for providing technical help, financial support and various other
incentives for development of wind power in the country. The various incentives that
are being provided by the central and the state governments are as per the details
given below:
Table 12-6: Central and state government incentives
From Central Government From State Governments
Income Tax Holiday Energy buyback, power wheeling and banking
facilities
Accelerated Depreciation Sales tax concession benefits
Concessional Custom Duty/ Duty Free
Import
Electricity tax exemption
Capital/ Interest Subsidy Demand cut concession offered to industrial
consumers who establish power generating units
from renewable energy sources
Capital Subsidy
The abstract of the wind energy generator project details are given in the table
below.
Table 12-7: Wind Energy Generator project details - Abstract
Description Units Values
Capacity of WEG kw 250
No. of WEG No. 1
Land requirement acres 1 to 1.3
Total power generation capacity of WEG KW 250
Number of days in year No. 335
no. of hrs / day No. 24
Total wind energy generation in kwh 2010000
Plant Load factor (PLF) capacity of the installed machine
(standard)
%
24%
Actual Energy generation capacity kwh 482400
Net salable units less transmission losses kwh 482400
Sale price of electrical energy (Rs/unit) 2.5
Chapter � 12 Final Report: Madhavaram Municipality
- 111 -
Voyants Solutions Private Limited
Total sales of wind energy generated (Rs in lakhs) 12.06
Total Expenditure assumed (insurance/Admin/O&M) (Rs in lakhs) 2.5
The cost�benefit analysis for the investment on installation of Wind Energy
Generators for generation of wind power at 250 KW capacity have been analyzed (
given in annexure XII-b) and considering the financial capabilities of the
Municipality a 250 KW WEG is proposed at an estimated cost of Rs.200.00 lakhs
including the land cost.
The land requirement for a 250 kW windmill varies from 1 to 1.3 acres. The wind
potential sites at Coimbatore belt or Thenkasi belt or Theni have been considered for
the case.
The projected net saleable units less transmission losses works out to 4.82 lakh units
(KW), at the rate of Rs.2.50 per unit. The revenue generated per annum would be
Rs.12.00 lakhs and the O&M expenditure would be Rs.2.50 lakhs. This would be an
additional source of sustainable revenue base for the Municipality.
12.3.7 Action plan: Computerization and E-governance
Strategy options
1. Launch data warehousing on a large scale, which would avoid cross-
reference to paper record, which are time consuming and also preservation
of paper media, which occupies space, could be avoided.
2. Computerization of bill payment and facilitation of on line payments
3. Computerisation of registration of land records within Municipal limit
4. Digitisation of Birth and death certificates for the past 30 years
5. Property Mapping to be computerised and details on area, year of
construction, type of assessment to be computerized to facilitate calculation
of property tax.
6. Administration and issue of trade licenses to be on line, including payment
and reconciliation of license fee.
7. Computerization of birth and death certificates and on line issue of
certificates.
8. Computerization of public grievances and Redressal mechanism
9. Introduction of asset management system for all available land and building
assets of the Municipality
10. On-line submission of building plans and approval.
11. Track O&M of assets and their replacement
12. E-tendering processes.
The above proposal can be taken up after giving sufficient training to Municipal
staff in hard ware and software.

Chapter � 12 Final Report: Madhavaram Municipality
- 112 -
Voyants Solutions Private Limited
Table 12-8: Road Map for Computerization and E-Governance
Sl.No Reforms
Year of Implementation
Year
1
Year
2
Year
3
Year
4
Year
5
1 Computerization and E-governance
i
Digitizing municipal records (past 30
years) √
ii On-line bill payment √
iii Registration of Land records √
iv
Digitization of old Birth and death
certificates √
v
On-line issue of Birth and Death
certificates
vi Property Mapping √
vii on-line Issue of trade license √
viii Online submission of building plans √
ix E-tendering √
12.3.8 Action Plan: Accounts and Auditing
A Consultant committee of chartered accountants having experience in
municipal accounting should be constituted to provide training to the Municipal
employees.
Timely Auditing should be performed with the use of private Chartered
Accountants for routine audit and local audit to carry out proprietary audit.
Closing all Auditing before September 30 of the next financial year and
publishing the audited statement on the website.
12.3.9 Action Plan: Institutional Management
The constant change in urban sector in the context of reforms results in the need for
continuous upgradation of the skills and knowledge of the ULB staff. TNUDP III has
initiated the process of providing the required training to the staff during the current
planning period. It is essential that the training process becomes a sustainable one
with the introduction of an institutional framework which would ensure that the
training is provided in a continuous manner.
Training programmes need to be evolved depending upon whether they are
Elected Representatives, Senior level officers, Middle level officers and staff in
various sections of the ULBs. Training of public representatives and staff of ULBs will
not only improve their skills but also exposes modern/scientific technological
advancement in engineering, management and inter personal communication.
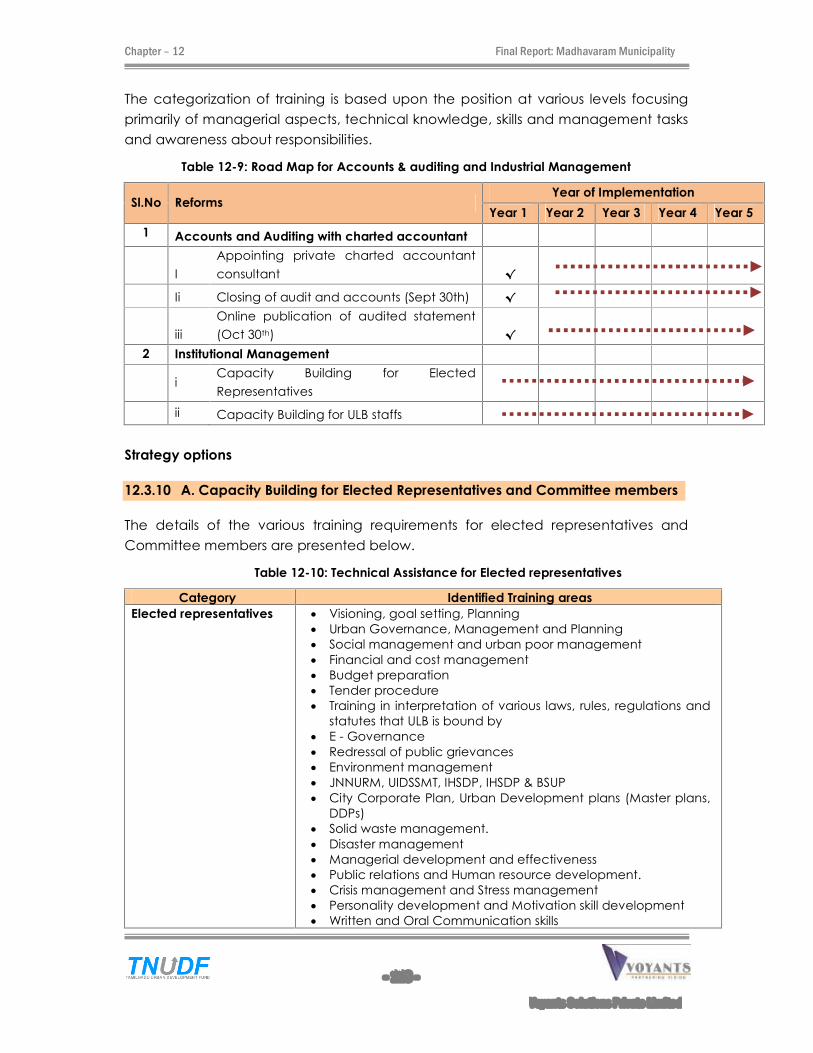
Chapter � 12 Final Report: Madhavaram Municipality
- 113 -
Voyants Solutions Private Limited
The categorization of training is based upon the position at various levels focusing
primarily of managerial aspects, technical knowledge, skills and management tasks
and awareness about responsibilities.
Table 12-9: Road Map for Accounts & auditing and Industrial Management
Sl.No Reforms Year of Implementation
Year 1 Year 2 Year 3 Year 4 Year 5
1 Accounts and Auditing with charted accountant
I
Appointing private charted accountant
consultant √
Ii Closing of audit and accounts (Sept 30th) √
iii
Online publication of audited statement
(Oct 30th) √
2 Institutional Management
i
Capacity Building for Elected
Representatives
ii Capacity Building for ULB staffs
Strategy options
12.3.10 A. Capacity Building for Elected Representatives and Committee members
The details of the various training requirements for elected representatives and
Committee members are presented below.
Table 12-10: Technical Assistance for Elected representatives
Category Identified Training areas
Elected representatives Visioning, goal setting, Planning
Urban Governance, Management and Planning
Social management and urban poor management
Financial and cost management
Budget preparation
Tender procedure
Training in interpretation of various laws, rules, regulations and
statutes that ULB is bound by
E - Governance
Redressal of public grievances
Environment management
JNNURM, UIDSSMT, IHSDP, IHSDP & BSUP
City Corporate Plan, Urban Development plans (Master plans,
DDPs)
Solid waste management.
Disaster management
Managerial development and effectiveness
Public relations and Human resource development.
Crisis management and Stress management
Personality development and Motivation skill development
Written and Oral Communication skills

Chapter � 12 Final Report: Madhavaram Municipality
- 114 -
Voyants Solutions Private Limited
Category Identified Training areas
Committee members Tax appeal committee: tax assessment methods; interpretation
of various laws, rules, regulations and statutes
Contracts committee: procurement procedures; interpretation
of various laws, rules, regulations and statutes
Appointment committee: Interviewing skill and techniques
12.3.11 B. Capacity Building for ULB staff
The training areas identified for ULB staff in all position is classified as functional,
managerial & behavior and attitude in short, medium and long term training. The
details of the various training requirements for ULB staff are presented below.
Table 12-11: Technical Assistance for ULB staff
Category Identified Training areas
Senior Management Staff People management skills
Motivation and Interpersonal skills
Leadership and Public relations
Attitudes � both personal and organizational
Team Building, Human resource development
Goal setting, Budgeting
Written and Oral Communication skills
Effective use of computers especially for managerial decision
making
Proper interpretation and effective use of MIS reports
Decision support systems
Training in interpretation of various laws, rules, regulations and
statutes
Time management, Stress management
Change management
Effective urban management
Management principles, Managerial development and
effectiveness
Interviewing skills
Social management and urban poor management
Citizen grievance handling
Project appraisal, Project Management and project financing
Contract management, Bid management, Costing
Procurement procedures
Pricing and tariffs/taxation methodologies
Operations research
Quality control
Public private partnerships and opportunities for ULB in the
same
Reforms at the ULB level
Financial and cost management
Environment management
Disaster management
Solid waste management
Systems management (improving citizen service and ULB
efficiency)
Strategic urban planning
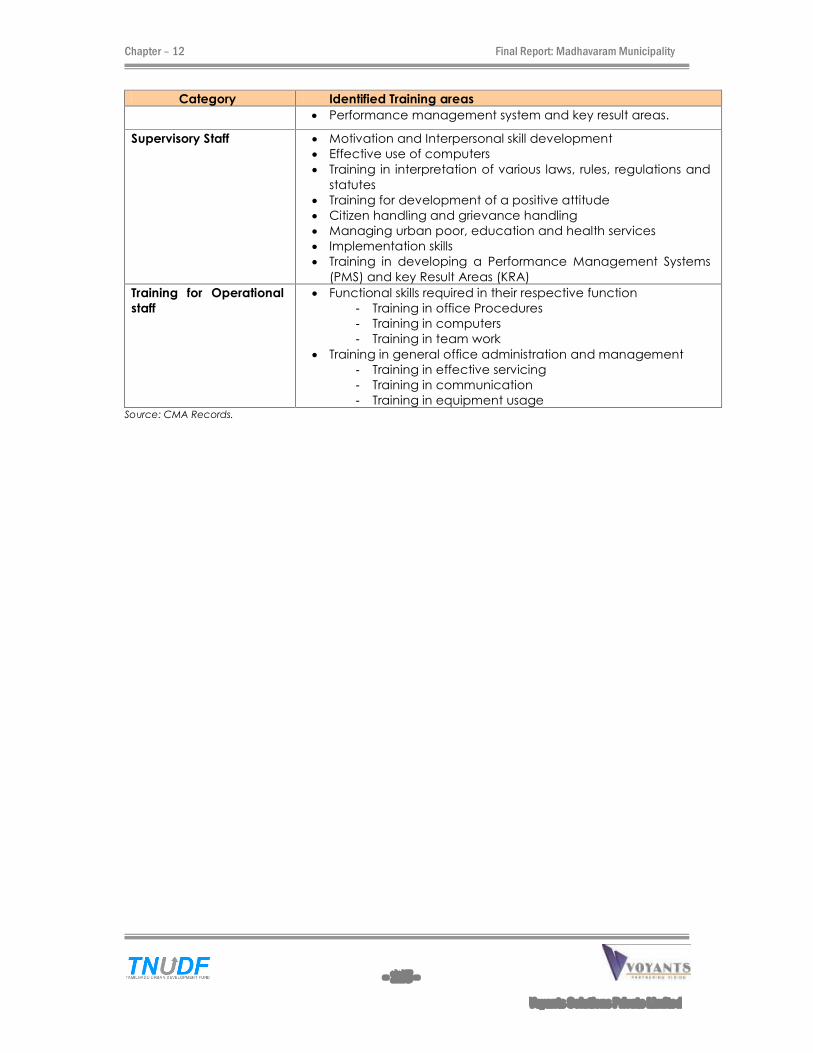
Chapter � 12 Final Report: Madhavaram Municipality
- 115 -
Voyants Solutions Private Limited
Category Identified Training areas
Performance management system and key result areas.
Supervisory Staff Motivation and Interpersonal skill development
Effective use of computers
Training in interpretation of various laws, rules, regulations and
statutes
Training for development of a positive attitude
Citizen handling and grievance handling
Managing urban poor, education and health services
Implementation skills
Training in developing a Performance Management Systems
(PMS) and key Result Areas (KRA)
Training for Operational
staff
Functional skills required in their respective function
- Training in office Procedures
- Training in computers
- Training in team work
Training in general office administration and management
- Training in effective servicing
- Training in communication
- Training in equipment usage Source: CMA Records.
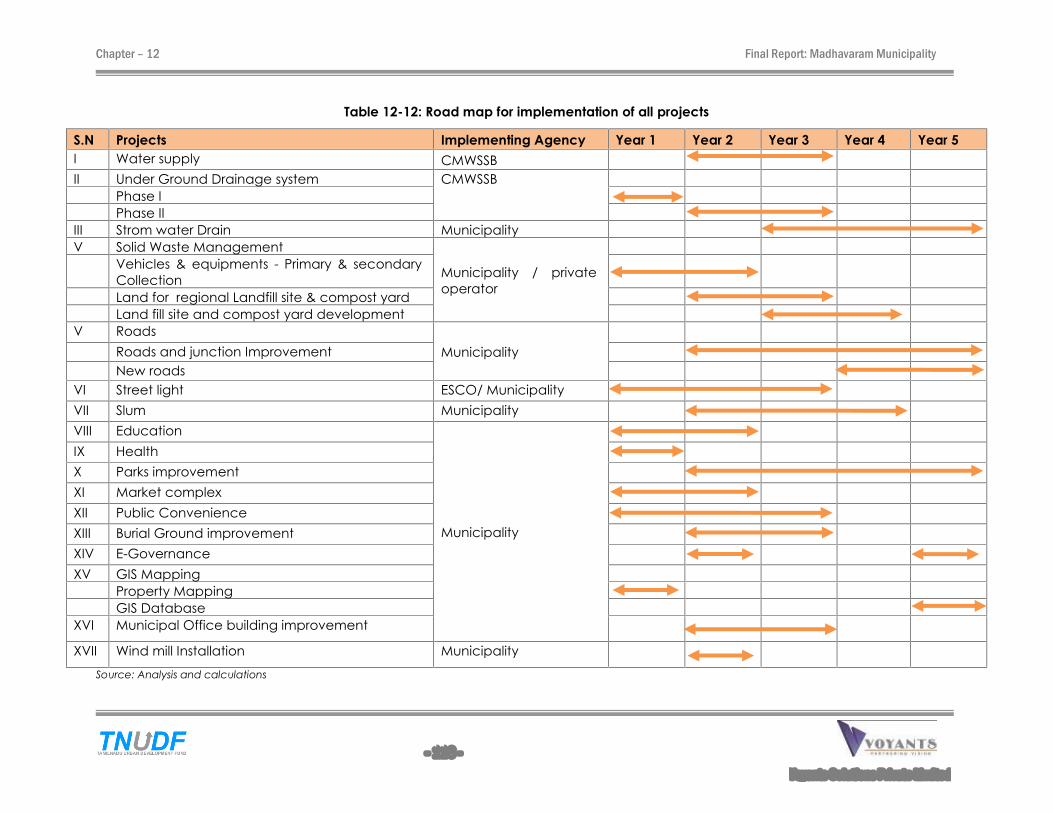
Chapter � 12 Final Report: Madhavaram Municipality
- 116 -
Voyants Solutions Private Limited
Table 12-12: Road map for implementation of all projects
S.N Projects Implementing Agency Year 1 Year 2 Year 3 Year 4 Year 5
I Water supply CMWSSB
II Under Ground Drainage system CMWSSB
Phase I
Phase II
III Strom water Drain Municipality
V Solid Waste Management
Municipality / private
operator
Vehicles & equipments - Primary & secondary
Collection
Land for regional Landfill site & compost yard
Land fill site and compost yard development
V Roads
Municipality
Roads and junction Improvement
New roads
VI Street light ESCO/ Municipality
VII Slum Municipality
VIII Education
Municipality
IX Health
X Parks improvement
XI Market complex
XII Public Convenience
XIII Burial Ground improvement
XIV E-Governance
XV GIS Mapping
Property Mapping
GIS Database
XVI Municipal Office building improvement
XVII Wind mill Installation Municipality
Source: Analysis and calculations
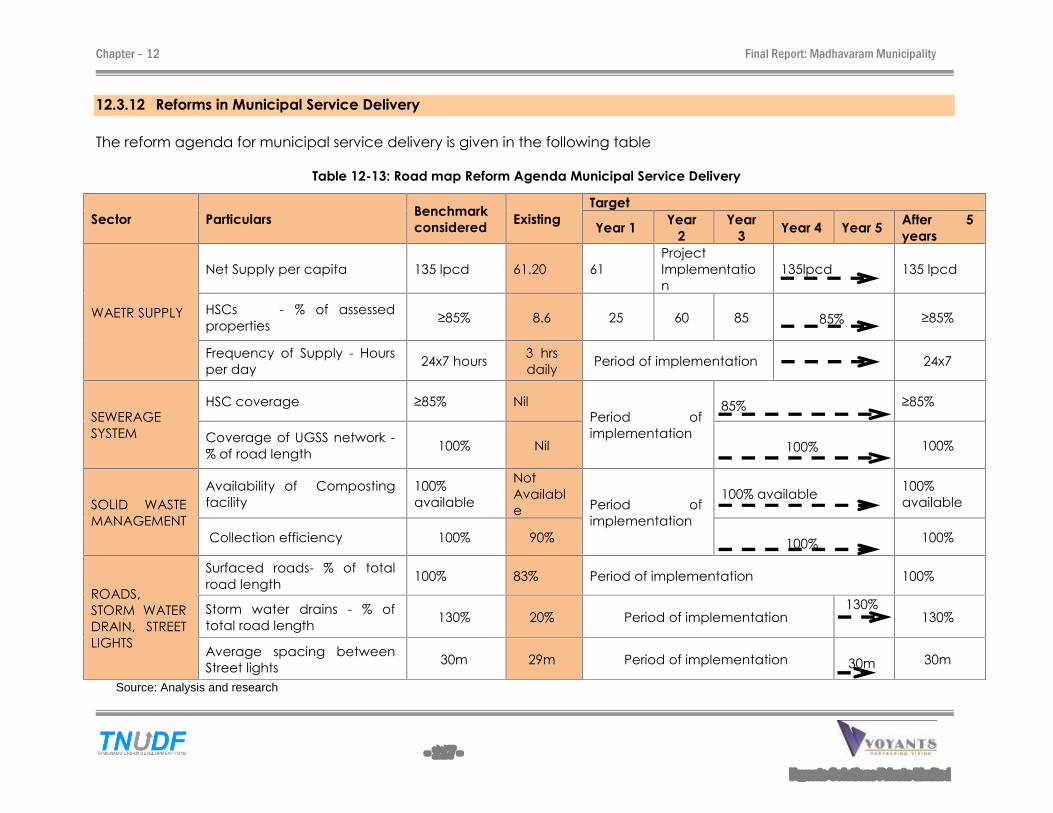
Chapter � 12 Final Report: Madhavaram Municipality
- 117 -
Voyants Solutions Private Limited
12.3.12 Reforms in Municipal Service Delivery
The reform agenda for municipal service delivery is given in the following table
Table 12-13: Road map Reform Agenda Municipal Service Delivery
Sector Particulars Benchmark
considered Existing
Target
Year 1 Year
2
Year
3 Year 4 Year 5
After 5
years
WAETR SUPPLY
Net Supply per capita 135 lpcd 61.20 61
Project
Implementatio
n
135lpcd 135 lpcd
HSCs - % of assessed
properties ≥85% 8.6 25 60 85
85% ≥85%
Frequency of Supply - Hours
per day 24x7 hours
3 hrs
daily Period of implementation
24x7
SEWERAGE
SYSTEM
HSC coverage ≥85% Nil
Period of
implementation
85% ≥85%
Coverage of UGSS network -
% of road length 100% Nil
100% 100%
SOLID WASTE
MANAGEMENT
Availability of Composting
facility
100%
available
Not
Availabl
e Period of
implementation
100% available 100%
available
Collection efficiency 100% 90%
100% 100%
ROADS,
STORM WATER
DRAIN, STREET
LIGHTS
Surfaced roads- % of total
road length 100% 83% Period of implementation 100%
Storm water drains - % of
total road length 130% 20% Period of implementation
130% 130%
Average spacing between
Street lights 30m 29m Period of implementation
30m 30m
Source: Analysis and research
Chapter � 1 3 Final Report: Madhavaram Municipality
- 118 -
Voyants Solutions Private Limited
111333 AAASSSSSSEEETTT MMMAAANNNAAAGGGEEEMMMEEENNNTTT PPPLLLAAANNN All the assets developed, operated and maintained by the Municipality are termed
as municipal assets and comprise roads, bridges, culvert, water supply & distribution
system, UGSS network, STPs, drains, and street lights. Municipal Assets also includes
social infrastructure assets such as municipal owned schools, hospitals, parks and
playgrounds, community halls, shopping complexes, stadium, and vacant lands.
Municipal assets are normally classified into movable and immovable assets.
Immovable assets attain importance as indicators for the financial worth which
would help in its borrowing capacity and credit worthiness of Madhavaram
Municipality.
The management of assets in the local bodies is at the initial stage where, only the
assets are listed and status is described. Invariably, in all the cases, the management
component is missing as to the techniques and methods of managing the assets
either in improving their state and value or in sustaining them with a growth motive.
There is hardly any case where a local body has made use of its immovable assets
for raising loans or improving its borrowing capacity. It requires an overall approach
outlining the alternative options of maintaining and managing the assets in a
worthwhile mode.
13.1 ACTIVITIES OF ASSET MANAGEMENT PLAN (AMP)
The Asset Management Plan for Madhavaram Municipality would comprise the
following 5 steps as explained below:
1. Asset identification
All movable and immovable equipments, immovable municipal properties, assets of
Municipality that have been developed, handed over or acquired over time from
various sources and departments have to be identified and traced. This would
include the detection of unrecorded infrastructure facilities and properties; scrutiny
of records, land registers and land surveys, etc.
2. Audit and reconciliation of records
The Municipality should record all movable and immovable municipal properties
and assets and infrastructure facilities. Maps and master plans should be
crosschecked and an infrastructure facilities audit should be prepared or updated (if
already existing). Current asset values should be assigned based on a �condition-
survey� of the infrastructure facilities.
Land and property records should be crosschecked and municipal registers to be
updated to include previously undetected land, properties and development. A
comprehensive list of municipal land, properties and development should be
compiled with approximate assigned.
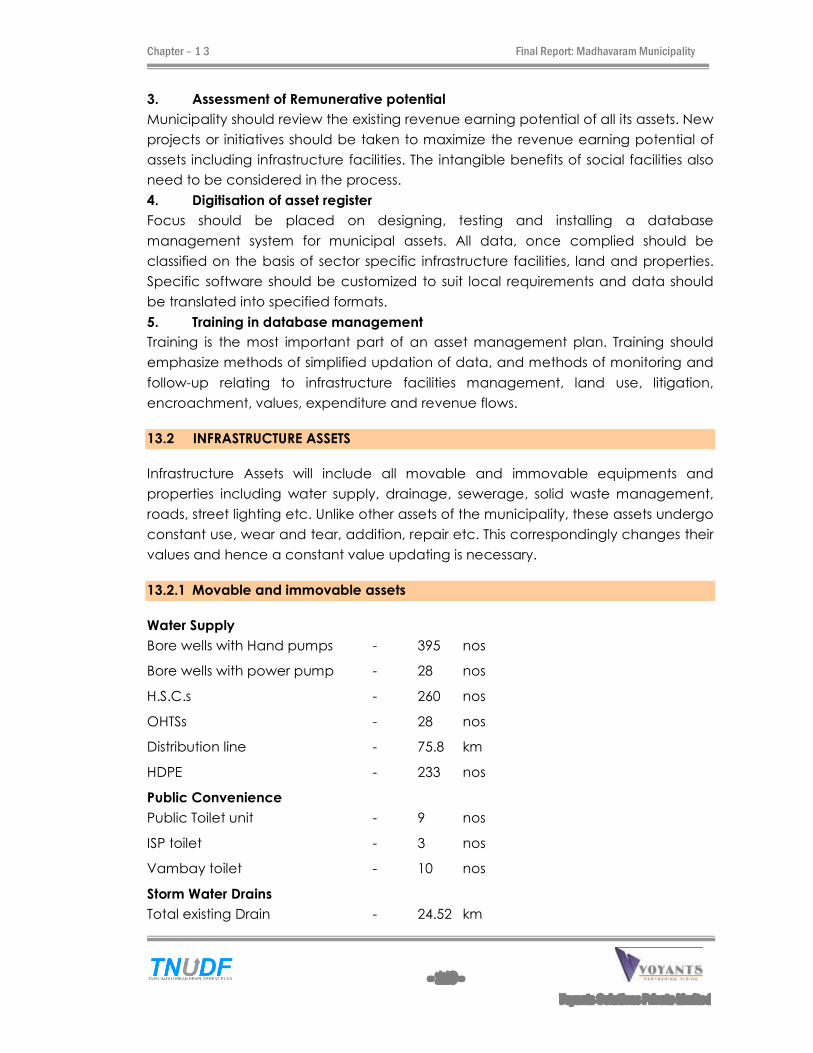
Chapter � 1 3 Final Report: Madhavaram Municipality
- 119 -
Voyants Solutions Private Limited
3. Assessment of Remunerative potential
Municipality should review the existing revenue earning potential of all its assets. New
projects or initiatives should be taken to maximize the revenue earning potential of
assets including infrastructure facilities. The intangible benefits of social facilities also
need to be considered in the process.
4. Digitisation of asset register
Focus should be placed on designing, testing and installing a database
management system for municipal assets. All data, once complied should be
classified on the basis of sector specific infrastructure facilities, land and properties.
Specific software should be customized to suit local requirements and data should
be translated into specified formats.
5. Training in database management
Training is the most important part of an asset management plan. Training should
emphasize methods of simplified updation of data, and methods of monitoring and
follow-up relating to infrastructure facilities management, land use, litigation,
encroachment, values, expenditure and revenue flows.
13.2 INFRASTRUCTURE ASSETS
Infrastructure Assets will include all movable and immovable equipments and
properties including water supply, drainage, sewerage, solid waste management,
roads, street lighting etc. Unlike other assets of the municipality, these assets undergo
constant use, wear and tear, addition, repair etc. This correspondingly changes their
values and hence a constant value updating is necessary.
13.2.1 Movable and immovable assets
Water Supply
Bore wells with Hand pumps - 395 nos
Bore wells with power pump - 28 nos
H.S.C.s - 260 nos
OHTSs - 28 nos
Distribution line - 75.8 km
HDPE - 233 nos
Public Convenience
Public Toilet unit - 9 nos
ISP toilet - 3 nos
Vambay toilet - 10 nos
Storm Water Drains
Total existing Drain - 24.52 km
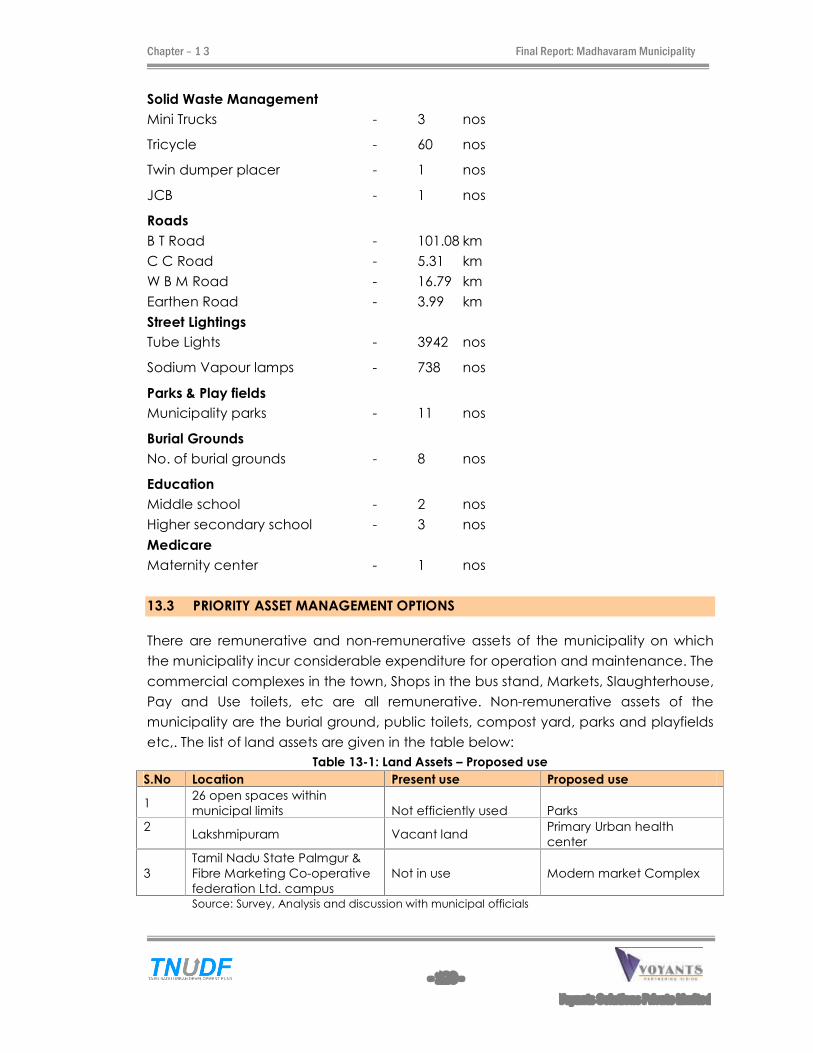
Chapter � 1 3 Final Report: Madhavaram Municipality
- 120 -
Voyants Solutions Private Limited
Solid Waste Management
Mini Trucks - 3 nos
Tricycle - 60 nos
Twin dumper placer - 1 nos
JCB - 1 nos
Roads
B T Road - 101.08 km
C C Road - 5.31 km
W B M Road - 16.79 km
Earthen Road - 3.99 km
Street Lightings
Tube Lights - 3942 nos
Sodium Vapour lamps - 738 nos
Parks & Play fields
Municipality parks - 11 nos
Burial Grounds
No. of burial grounds - 8 nos
Education
Middle school - 2 nos
Higher secondary school - 3 nos
Medicare
Maternity center - 1 nos
13.3 PRIORITY ASSET MANAGEMENT OPTIONS
There are remunerative and non-remunerative assets of the municipality on which
the municipality incur considerable expenditure for operation and maintenance. The
commercial complexes in the town, Shops in the bus stand, Markets, Slaughterhouse,
Pay and Use toilets, etc are all remunerative. Non-remunerative assets of the
municipality are the burial ground, public toilets, compost yard, parks and playfields
etc,. The list of land assets are given in the table below:
Table 13-1: Land Assets � Proposed use
S.No Location Present use Proposed use
1 26 open spaces within
municipal limits
Not efficiently used
Parks
2
Lakshmipuram Vacant land
Primary Urban health
center
3
Tamil Nadu State Palmgur &
Fibre Marketing Co-operative
federation Ltd. campus
Not in use Modern market Complex
Source: Survey, Analysis and discussion with municipal officials
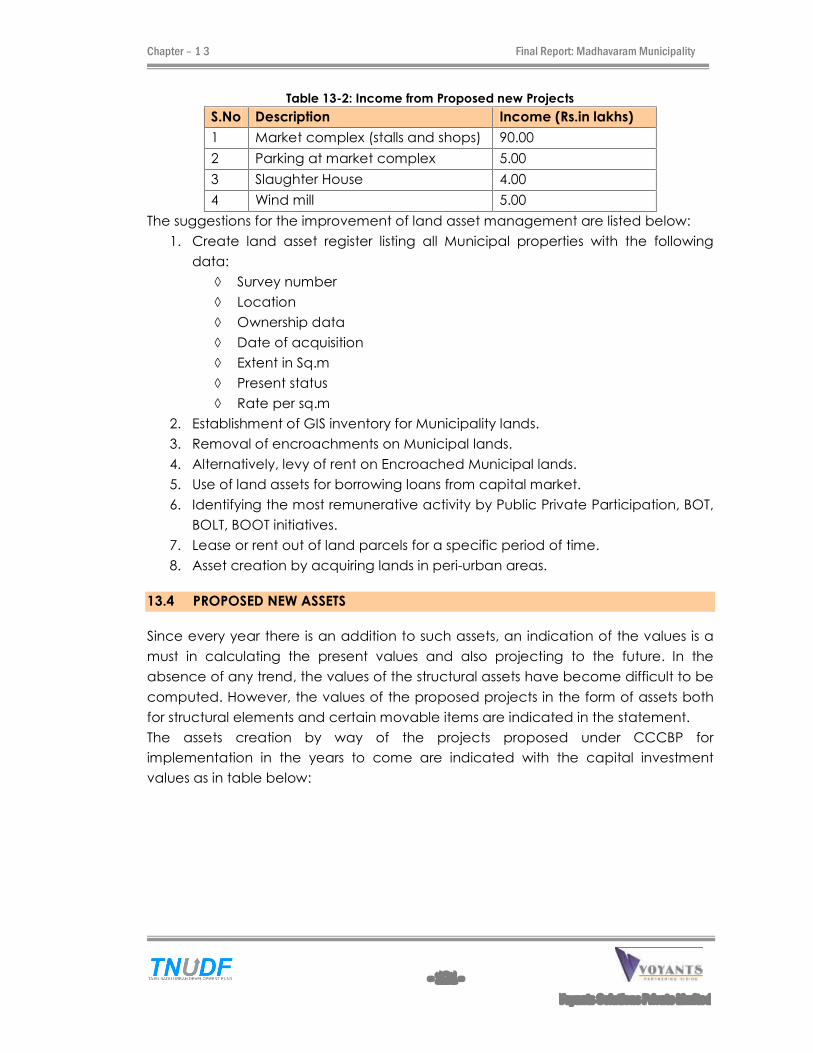
Chapter � 1 3 Final Report: Madhavaram Municipality
- 121 -
Voyants Solutions Private Limited
Table 13-2: Income from Proposed new Projects
S.No Description Income (Rs.in lakhs)
1 Market complex (stalls and shops) 90.00
2 Parking at market complex 5.00
3 Slaughter House 4.00
4 Wind mill 5.00
The suggestions for the improvement of land asset management are listed below:
1. Create land asset register listing all Municipal properties with the following
data:
Survey number
Location
Ownership data
Date of acquisition
Extent in Sq.m
Present status
Rate per sq.m
2. Establishment of GIS inventory for Municipality lands.
3. Removal of encroachments on Municipal lands.
4. Alternatively, levy of rent on Encroached Municipal lands.
5. Use of land assets for borrowing loans from capital market.
6. Identifying the most remunerative activity by Public Private Participation, BOT,
BOLT, BOOT initiatives.
7. Lease or rent out of land parcels for a specific period of time.
8. Asset creation by acquiring lands in peri-urban areas.
13.4 PROPOSED NEW ASSETS
Since every year there is an addition to such assets, an indication of the values is a
must in calculating the present values and also projecting to the future. In the
absence of any trend, the values of the structural assets have become difficult to be
computed. However, the values of the proposed projects in the form of assets both
for structural elements and certain movable items are indicated in the statement.
The assets creation by way of the projects proposed under CCCBP for
implementation in the years to come are indicated with the capital investment
values as in table below:
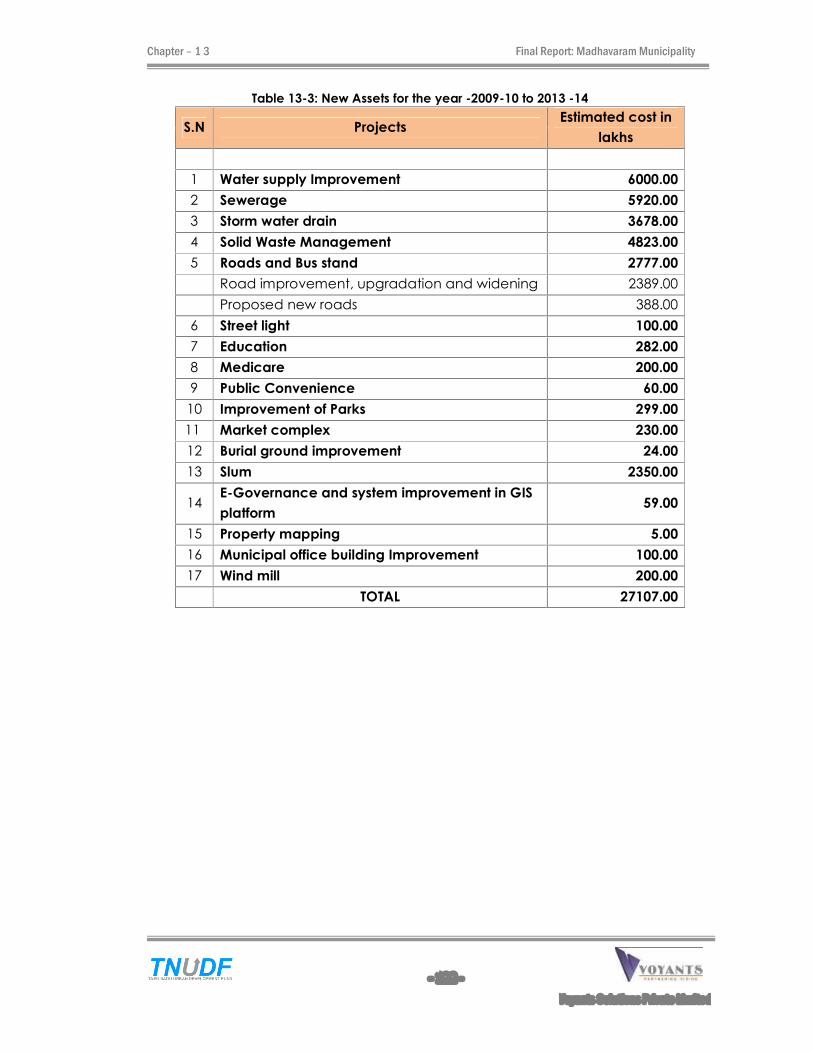
Chapter � 1 3 Final Report: Madhavaram Municipality
- 122 -
Voyants Solutions Private Limited
Table 13-3: New Assets for the year -2009-10 to 2013 -14
S.N Projects Estimated cost in
lakhs
1 Water supply Improvement 6000.00
2 Sewerage 5920.00
3 Storm water drain 3678.00
4 Solid Waste Management 4823.00
5 Roads and Bus stand 2777.00
Road improvement, upgradation and widening 2389.00
Proposed new roads 388.00
6 Street light 100.00
7 Education 282.00
8 Medicare 200.00
9 Public Convenience 60.00
10 Improvement of Parks 299.00
11 Market complex 230.00
12 Burial ground improvement 24.00
13 Slum 2350.00
14 E-Governance and system improvement in GIS
platform 59.00
15 Property mapping 5.00
16 Municipal office building Improvement 100.00
17 Wind mill 200.00
TOTAL 27107.00
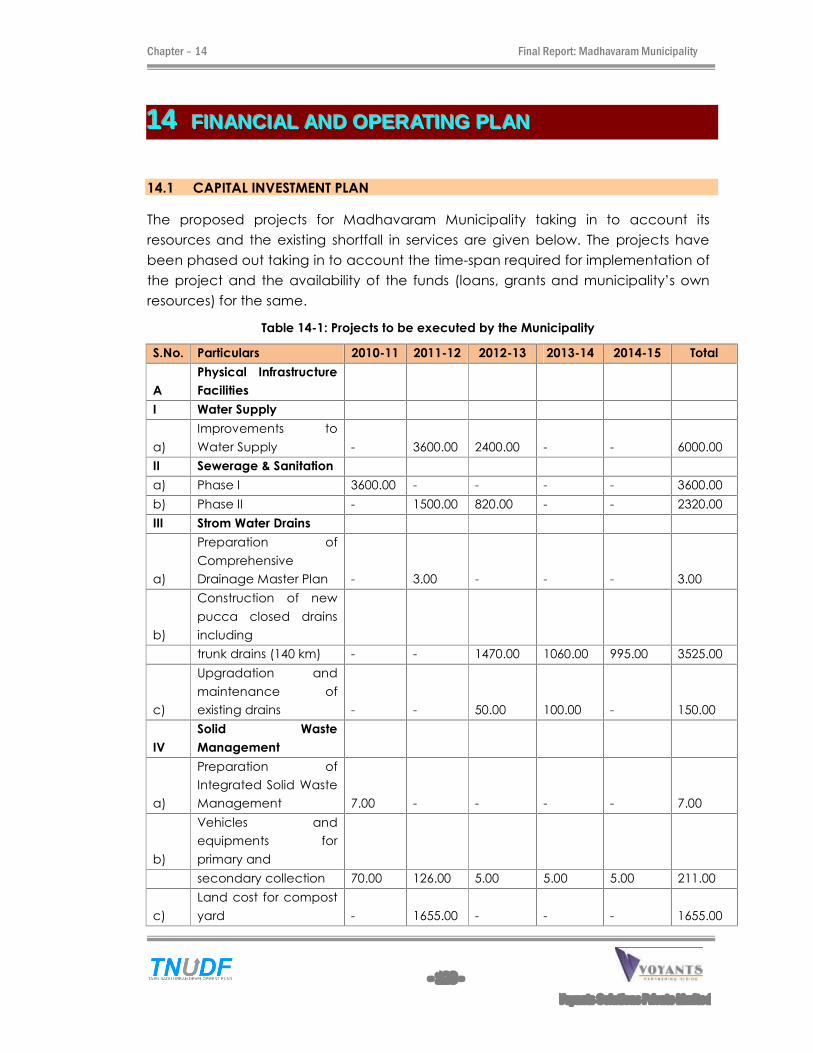
Chapter � 14 Final Report: Madhavaram Municipality
- 123 -
Voyants Solutions Private Limited
111444 FFFIIINNNAAANNNCCCIIIAAALLL AAANNNDDD OOOPPPEEERRRAAATTTIIINNNGGG PPPLLLAAANNN
14.1 CAPITAL INVESTMENT PLAN
The proposed projects for Madhavaram Municipality taking in to account its
resources and the existing shortfall in services are given below. The projects have
been phased out taking in to account the time-span required for implementation of
the project and the availability of the funds (loans, grants and municipality�s own
resources) for the same.
Table 14-1: Projects to be executed by the Municipality
S.No. Particulars 2010-11 2011-12 2012-13 2013-14 2014-15 Total
A
Physical Infrastructure
Facilities
I Water Supply
a)
Improvements to
Water Supply - 3600.00 2400.00 - - 6000.00
II Sewerage & Sanitation
a) Phase I 3600.00 - - - - 3600.00
b) Phase II - 1500.00 820.00 - - 2320.00
III Strom Water Drains
a)
Preparation of
Comprehensive
Drainage Master Plan - 3.00 - - - 3.00
b)
Construction of new
pucca closed drains
including
trunk drains (140 km) - - 1470.00 1060.00 995.00 3525.00
c)
Upgradation and
maintenance of
existing drains - - 50.00 100.00 - 150.00
IV
Solid Waste
Management
a)
Preparation of
Integrated Solid Waste
Management 7.00 - - - - 7.00
b)
Vehicles and
equipments for
primary and
secondary collection 70.00 126.00 5.00 5.00 5.00 211.00
c)
Land cost for compost
yard - 1655.00 - - - 1655.00
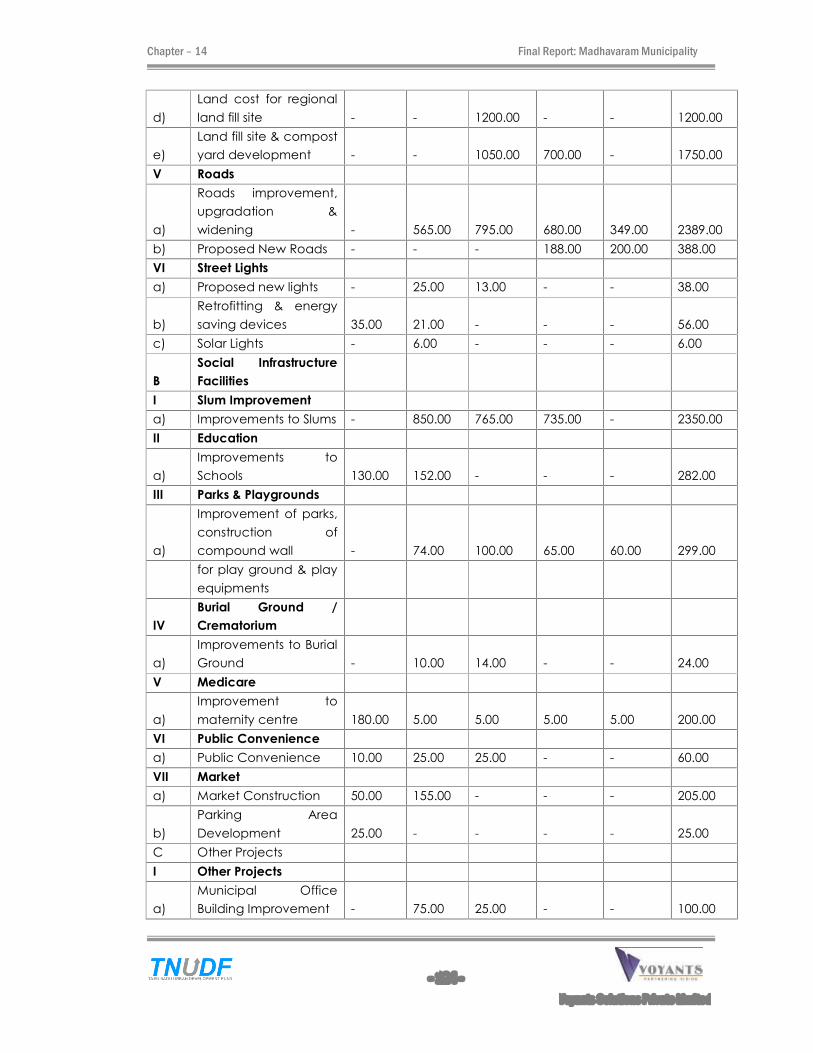
Chapter � 14 Final Report: Madhavaram Municipality
- 124 -
Voyants Solutions Private Limited
d)
Land cost for regional
land fill site - - 1200.00 - - 1200.00
e)
Land fill site & compost
yard development - - 1050.00 700.00 - 1750.00
V Roads
a)
Roads improvement,
upgradation &
widening - 565.00 795.00 680.00 349.00 2389.00
b) Proposed New Roads - - - 188.00 200.00 388.00
VI Street Lights
a) Proposed new lights - 25.00 13.00 - - 38.00
b)
Retrofitting & energy
saving devices 35.00 21.00 - - - 56.00
c) Solar Lights - 6.00 - - - 6.00
B
Social Infrastructure
Facilities
I Slum Improvement
a) Improvements to Slums - 850.00 765.00 735.00 - 2350.00
II Education
a)
Improvements to
Schools 130.00 152.00 - - - 282.00
III Parks & Playgrounds
a)
Improvement of parks,
construction of
compound wall - 74.00 100.00 65.00 60.00 299.00
for play ground & play
equipments
IV
Burial Ground /
Crematorium
a)
Improvements to Burial
Ground - 10.00 14.00 - - 24.00
V Medicare
a)
Improvement to
maternity centre 180.00 5.00 5.00 5.00 5.00 200.00
VI Public Convenience
a) Public Convenience 10.00 25.00 25.00 - - 60.00
VII Market
a) Market Construction 50.00 155.00 - - - 205.00
b)
Parking Area
Development 25.00 - - - - 25.00
C Other Projects
I Other Projects
a)
Municipal Office
Building Improvement - 75.00 25.00 - - 100.00
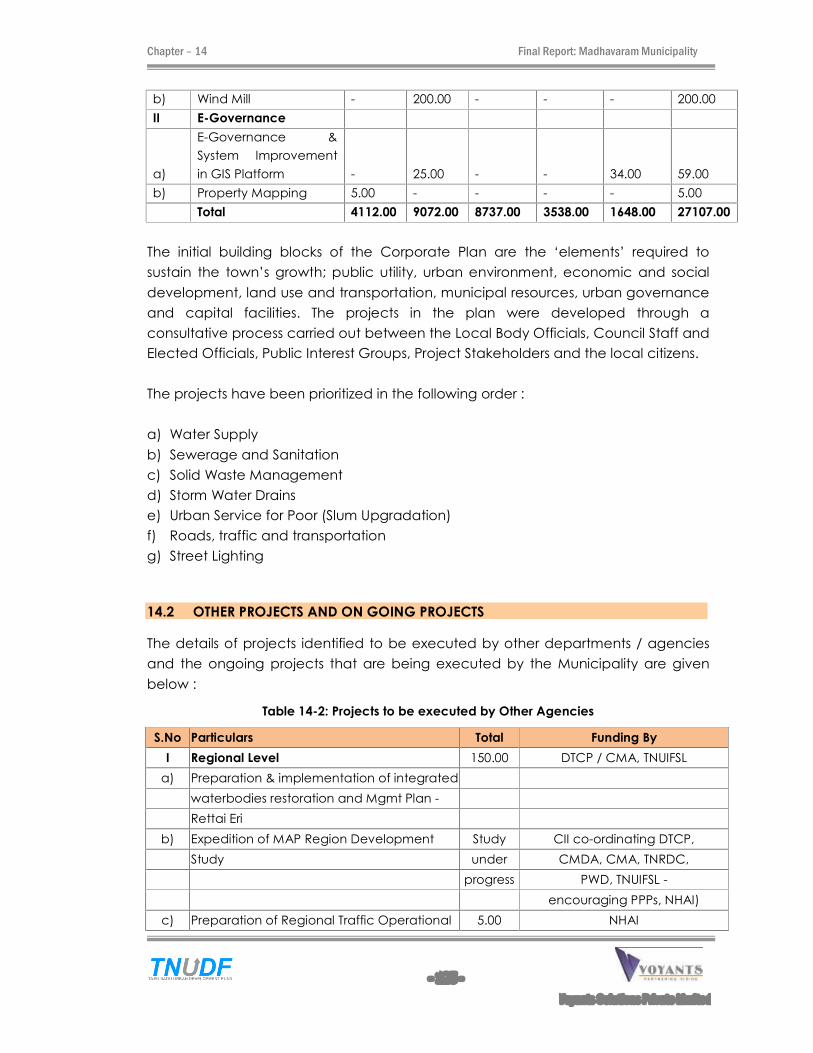
Chapter � 14 Final Report: Madhavaram Municipality
- 125 -
Voyants Solutions Private Limited
b) Wind Mill - 200.00 - - - 200.00
II E-Governance
a)
E-Governance &
System Improvement
in GIS Platform - 25.00 - - 34.00 59.00
b) Property Mapping 5.00 - - - - 5.00
Total 4112.00 9072.00 8737.00 3538.00 1648.00 27107.00
The initial building blocks of the Corporate Plan are the �elements� required to
sustain the town�s growth; public utility, urban environment, economic and social
development, land use and transportation, municipal resources, urban governance
and capital facilities. The projects in the plan were developed through a
consultative process carried out between the Local Body Officials, Council Staff and
Elected Officials, Public Interest Groups, Project Stakeholders and the local citizens.
The projects have been prioritized in the following order :
a) Water Supply
b) Sewerage and Sanitation
c) Solid Waste Management
d) Storm Water Drains
e) Urban Service for Poor (Slum Upgradation)
f) Roads, traffic and transportation
g) Street Lighting
14.2 OTHER PROJECTS AND ON GOING PROJECTS
The details of projects identified to be executed by other departments / agencies
and the ongoing projects that are being executed by the Municipality are given
below :
Table 14-2: Projects to be executed by Other Agencies
S.No Particulars Total Funding By
I Regional Level 150.00 DTCP / CMA, TNUIFSL
a) Preparation & implementation of integrated
waterbodies restoration and Mgmt Plan -
Rettai Eri
b) Expedition of MAP Region Development Study CII co-ordinating DTCP,
Study under CMDA, CMA, TNRDC,
progress PWD, TNUIFSL -
encouraging PPPs, NHAI)
c) Preparation of Regional Traffic Operational 5.00 NHAI
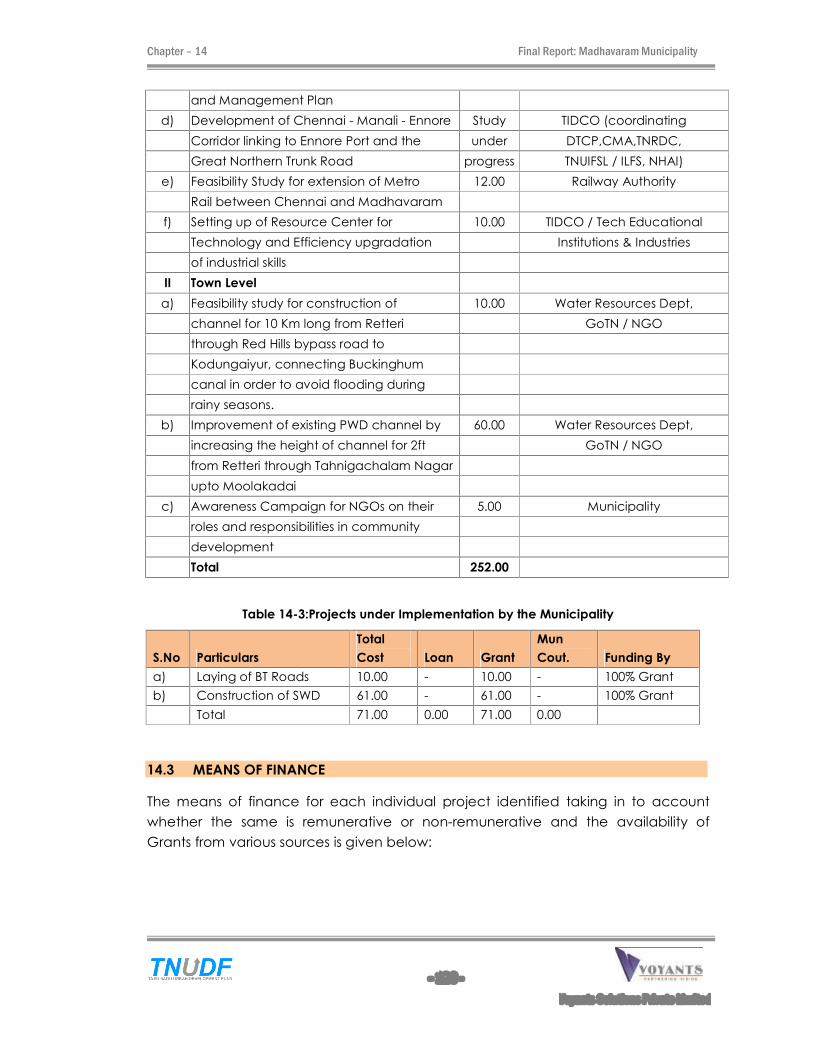
Chapter � 14 Final Report: Madhavaram Municipality
- 126 -
Voyants Solutions Private Limited
and Management Plan
d) Development of Chennai - Manali - Ennore Study TIDCO (coordinating
Corridor linking to Ennore Port and the under DTCP,CMA,TNRDC,
Great Northern Trunk Road progress TNUIFSL / ILFS, NHAI)
e) Feasibility Study for extension of Metro 12.00 Railway Authority
Rail between Chennai and Madhavaram
f) Setting up of Resource Center for 10.00 TIDCO / Tech Educational
Technology and Efficiency upgradation Institutions & Industries
of industrial skills
II Town Level
a) Feasibility study for construction of 10.00 Water Resources Dept,
channel for 10 Km long from Retteri GoTN / NGO
through Red Hills bypass road to
Kodungaiyur, connecting Buckinghum
canal in order to avoid flooding during
rainy seasons.
b) Improvement of existing PWD channel by 60.00 Water Resources Dept,
increasing the height of channel for 2ft GoTN / NGO
from Retteri through Tahnigachalam Nagar
upto Moolakadai
c) Awareness Campaign for NGOs on their 5.00 Municipality
roles and responsibilities in community
development
Total 252.00
Table 14-3:Projects under Implementation by the Municipality
S.No Particulars
Total
Cost Loan Grant
Mun
Cout. Funding By
a) Laying of BT Roads 10.00 - 10.00 - 100% Grant
b) Construction of SWD 61.00 - 61.00 - 100% Grant
Total 71.00 0.00 71.00 0.00
14.3 MEANS OF FINANCE
The means of finance for each individual project identified taking in to account
whether the same is remunerative or non-remunerative and the availability of
Grants from various sources is given below:
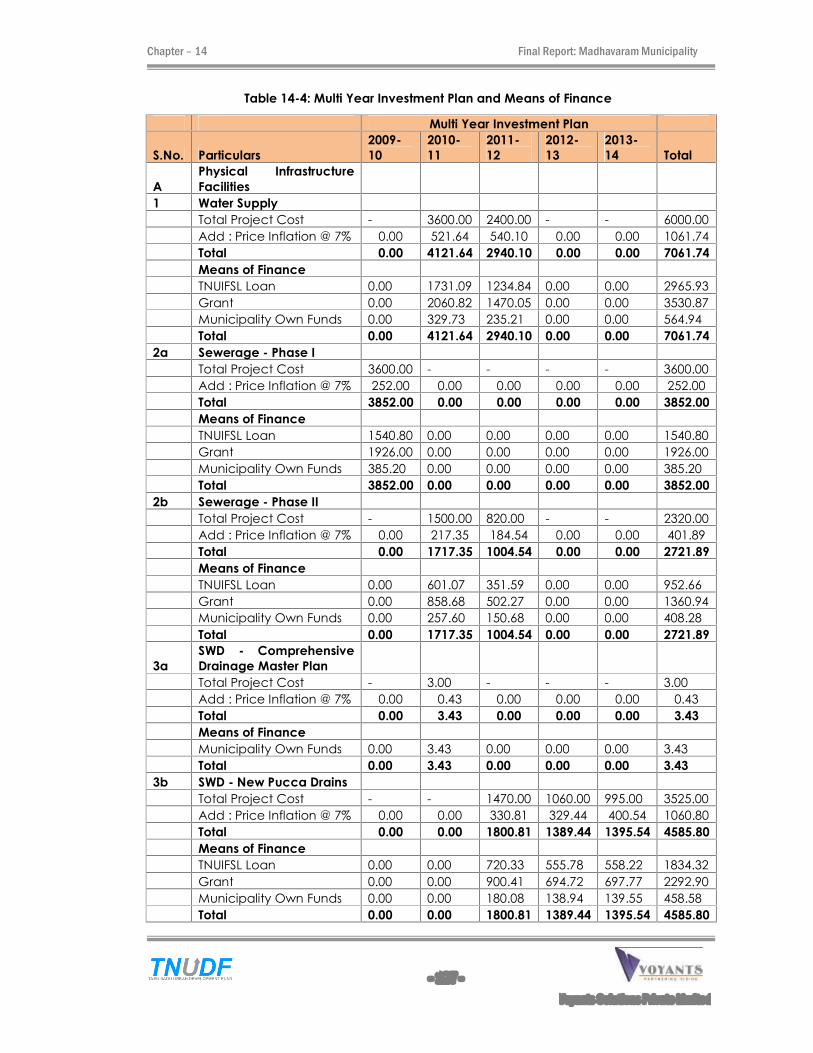
Chapter � 14 Final Report: Madhavaram Municipality
- 127 -
Voyants Solutions Private Limited
Table 14-4: Multi Year Investment Plan and Means of Finance
Multi Year Investment Plan
S.No. Particulars
2009-
10
2010-
11
2011-
12
2012-
13
2013-
14 Total
A
Physical Infrastructure
Facilities
1 Water Supply
Total Project Cost - 3600.00 2400.00 - - 6000.00
Add : Price Inflation @ 7% 0.00 521.64 540.10 0.00 0.00 1061.74
Total 0.00 4121.64 2940.10 0.00 0.00 7061.74
Means of Finance
TNUIFSL Loan 0.00 1731.09 1234.84 0.00 0.00 2965.93
Grant 0.00 2060.82 1470.05 0.00 0.00 3530.87
Municipality Own Funds 0.00 329.73 235.21 0.00 0.00 564.94
Total 0.00 4121.64 2940.10 0.00 0.00 7061.74
2a Sewerage - Phase I
Total Project Cost 3600.00 - - - - 3600.00
Add : Price Inflation @ 7% 252.00 0.00 0.00 0.00 0.00 252.00
Total 3852.00 0.00 0.00 0.00 0.00 3852.00
Means of Finance
TNUIFSL Loan 1540.80 0.00 0.00 0.00 0.00 1540.80
Grant 1926.00 0.00 0.00 0.00 0.00 1926.00
Municipality Own Funds 385.20 0.00 0.00 0.00 0.00 385.20
Total 3852.00 0.00 0.00 0.00 0.00 3852.00
2b Sewerage - Phase II
Total Project Cost - 1500.00 820.00 - - 2320.00
Add : Price Inflation @ 7% 0.00 217.35 184.54 0.00 0.00 401.89
Total 0.00 1717.35 1004.54 0.00 0.00 2721.89
Means of Finance
TNUIFSL Loan 0.00 601.07 351.59 0.00 0.00 952.66
Grant 0.00 858.68 502.27 0.00 0.00 1360.94
Municipality Own Funds 0.00 257.60 150.68 0.00 0.00 408.28
Total 0.00 1717.35 1004.54 0.00 0.00 2721.89
3a
SWD - Comprehensive
Drainage Master Plan
Total Project Cost - 3.00 - - - 3.00
Add : Price Inflation @ 7% 0.00 0.43 0.00 0.00 0.00 0.43
Total 0.00 3.43 0.00 0.00 0.00 3.43
Means of Finance
Municipality Own Funds 0.00 3.43 0.00 0.00 0.00 3.43
Total 0.00 3.43 0.00 0.00 0.00 3.43
3b SWD - New Pucca Drains
Total Project Cost - - 1470.00 1060.00 995.00 3525.00
Add : Price Inflation @ 7% 0.00 0.00 330.81 329.44 400.54 1060.80
Total 0.00 0.00 1800.81 1389.44 1395.54 4585.80
Means of Finance
TNUIFSL Loan 0.00 0.00 720.33 555.78 558.22 1834.32
Grant 0.00 0.00 900.41 694.72 697.77 2292.90
Municipality Own Funds 0.00 0.00 180.08 138.94 139.55 458.58
Total 0.00 0.00 1800.81 1389.44 1395.54 4585.80
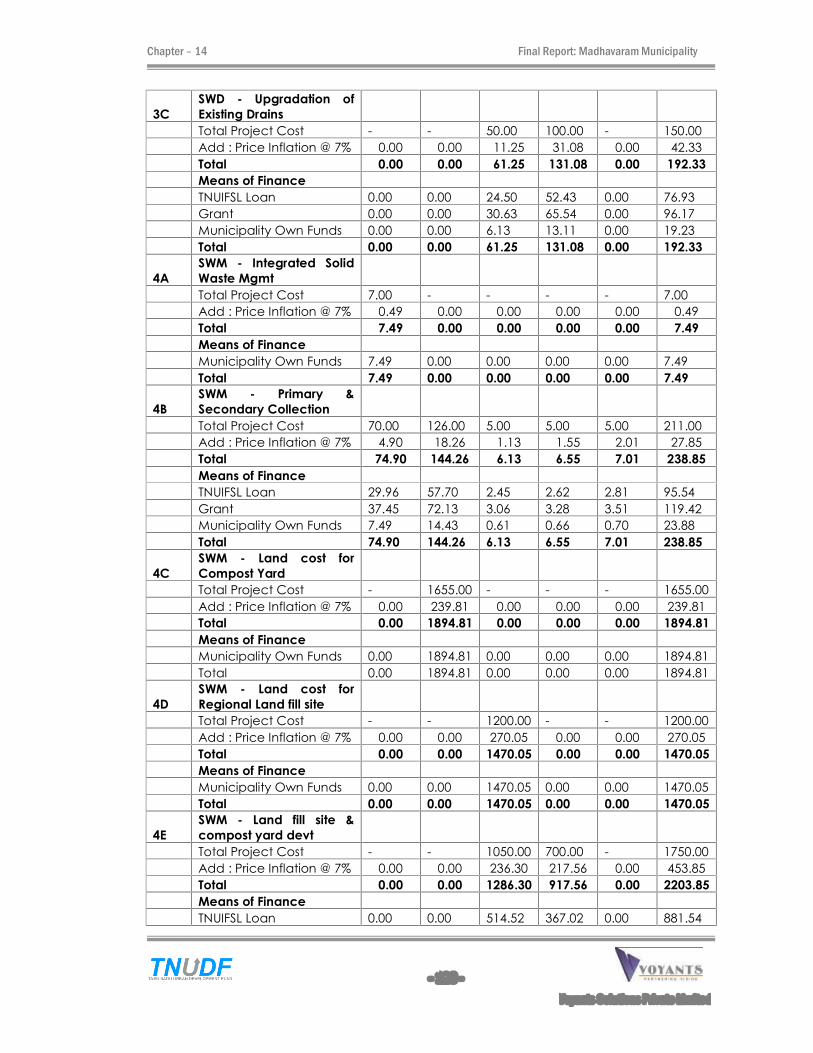
Chapter � 14 Final Report: Madhavaram Municipality
- 128 -
Voyants Solutions Private Limited
3C
SWD - Upgradation of
Existing Drains
Total Project Cost - - 50.00 100.00 - 150.00
Add : Price Inflation @ 7% 0.00 0.00 11.25 31.08 0.00 42.33
Total 0.00 0.00 61.25 131.08 0.00 192.33
Means of Finance
TNUIFSL Loan 0.00 0.00 24.50 52.43 0.00 76.93
Grant 0.00 0.00 30.63 65.54 0.00 96.17
Municipality Own Funds 0.00 0.00 6.13 13.11 0.00 19.23
Total 0.00 0.00 61.25 131.08 0.00 192.33
4A
SWM - Integrated Solid
Waste Mgmt
Total Project Cost 7.00 - - - - 7.00
Add : Price Inflation @ 7% 0.49 0.00 0.00 0.00 0.00 0.49
Total 7.49 0.00 0.00 0.00 0.00 7.49
Means of Finance
Municipality Own Funds 7.49 0.00 0.00 0.00 0.00 7.49
Total 7.49 0.00 0.00 0.00 0.00 7.49
4B
SWM - Primary &
Secondary Collection
Total Project Cost 70.00 126.00 5.00 5.00 5.00 211.00
Add : Price Inflation @ 7% 4.90 18.26 1.13 1.55 2.01 27.85
Total 74.90 144.26 6.13 6.55 7.01 238.85
Means of Finance
TNUIFSL Loan 29.96 57.70 2.45 2.62 2.81 95.54
Grant 37.45 72.13 3.06 3.28 3.51 119.42
Municipality Own Funds 7.49 14.43 0.61 0.66 0.70 23.88
Total 74.90 144.26 6.13 6.55 7.01 238.85
4C
SWM - Land cost for
Compost Yard
Total Project Cost - 1655.00 - - - 1655.00
Add : Price Inflation @ 7% 0.00 239.81 0.00 0.00 0.00 239.81
Total 0.00 1894.81 0.00 0.00 0.00 1894.81
Means of Finance
Municipality Own Funds 0.00 1894.81 0.00 0.00 0.00 1894.81
Total 0.00 1894.81 0.00 0.00 0.00 1894.81
4D
SWM - Land cost for
Regional Land fill site
Total Project Cost - - 1200.00 - - 1200.00
Add : Price Inflation @ 7% 0.00 0.00 270.05 0.00 0.00 270.05
Total 0.00 0.00 1470.05 0.00 0.00 1470.05
Means of Finance
Municipality Own Funds 0.00 0.00 1470.05 0.00 0.00 1470.05
Total 0.00 0.00 1470.05 0.00 0.00 1470.05
4E
SWM - Land fill site &
compost yard devt
Total Project Cost - - 1050.00 700.00 - 1750.00
Add : Price Inflation @ 7% 0.00 0.00 236.30 217.56 0.00 453.85
Total 0.00 0.00 1286.30 917.56 0.00 2203.85
Means of Finance
TNUIFSL Loan 0.00 0.00 514.52 367.02 0.00 881.54
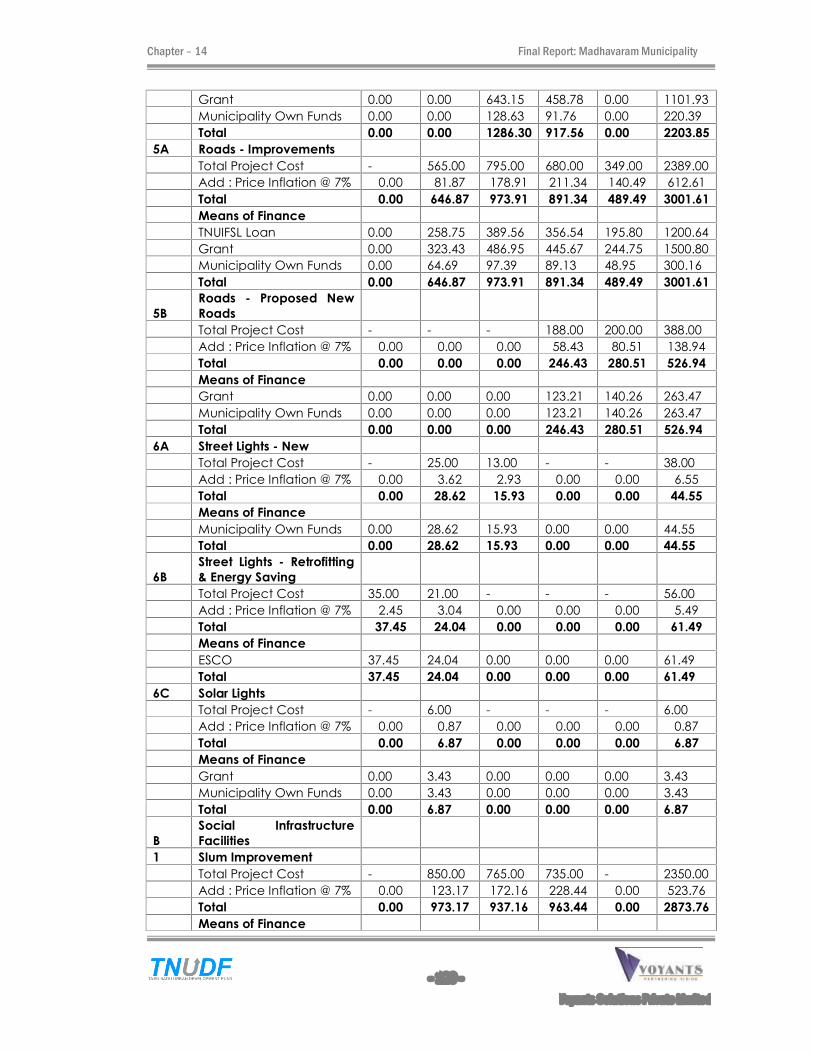
Chapter � 14 Final Report: Madhavaram Municipality
- 129 -
Voyants Solutions Private Limited
Grant 0.00 0.00 643.15 458.78 0.00 1101.93
Municipality Own Funds 0.00 0.00 128.63 91.76 0.00 220.39
Total 0.00 0.00 1286.30 917.56 0.00 2203.85
5A Roads - Improvements
Total Project Cost - 565.00 795.00 680.00 349.00 2389.00
Add : Price Inflation @ 7% 0.00 81.87 178.91 211.34 140.49 612.61
Total 0.00 646.87 973.91 891.34 489.49 3001.61
Means of Finance
TNUIFSL Loan 0.00 258.75 389.56 356.54 195.80 1200.64
Grant 0.00 323.43 486.95 445.67 244.75 1500.80
Municipality Own Funds 0.00 64.69 97.39 89.13 48.95 300.16
Total 0.00 646.87 973.91 891.34 489.49 3001.61
5B
Roads - Proposed New
Roads
Total Project Cost - - - 188.00 200.00 388.00
Add : Price Inflation @ 7% 0.00 0.00 0.00 58.43 80.51 138.94
Total 0.00 0.00 0.00 246.43 280.51 526.94
Means of Finance
Grant 0.00 0.00 0.00 123.21 140.26 263.47
Municipality Own Funds 0.00 0.00 0.00 123.21 140.26 263.47
Total 0.00 0.00 0.00 246.43 280.51 526.94
6A Street Lights - New
Total Project Cost - 25.00 13.00 - - 38.00
Add : Price Inflation @ 7% 0.00 3.62 2.93 0.00 0.00 6.55
Total 0.00 28.62 15.93 0.00 0.00 44.55
Means of Finance
Municipality Own Funds 0.00 28.62 15.93 0.00 0.00 44.55
Total 0.00 28.62 15.93 0.00 0.00 44.55
6B
Street Lights - Retrofitting
& Energy Saving
Total Project Cost 35.00 21.00 - - - 56.00
Add : Price Inflation @ 7% 2.45 3.04 0.00 0.00 0.00 5.49
Total 37.45 24.04 0.00 0.00 0.00 61.49
Means of Finance
ESCO 37.45 24.04 0.00 0.00 0.00 61.49
Total 37.45 24.04 0.00 0.00 0.00 61.49
6C Solar Lights
Total Project Cost - 6.00 - - - 6.00
Add : Price Inflation @ 7% 0.00 0.87 0.00 0.00 0.00 0.87
Total 0.00 6.87 0.00 0.00 0.00 6.87
Means of Finance
Grant 0.00 3.43 0.00 0.00 0.00 3.43
Municipality Own Funds 0.00 3.43 0.00 0.00 0.00 3.43
Total 0.00 6.87 0.00 0.00 0.00 6.87
B
Social Infrastructure
Facilities
1 Slum Improvement
Total Project Cost - 850.00 765.00 735.00 - 2350.00
Add : Price Inflation @ 7% 0.00 123.17 172.16 228.44 0.00 523.76
Total 0.00 973.17 937.16 963.44 0.00 2873.76
Means of Finance
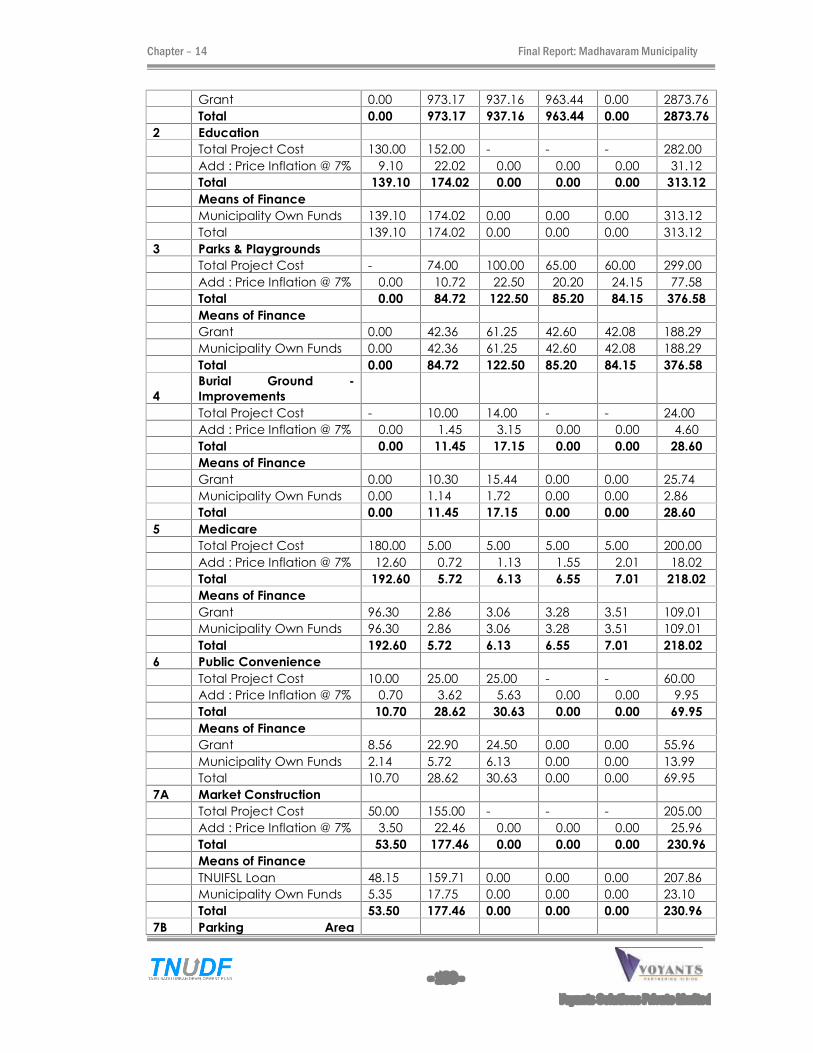
Chapter � 14 Final Report: Madhavaram Municipality
- 130 -
Voyants Solutions Private Limited
Grant 0.00 973.17 937.16 963.44 0.00 2873.76
Total 0.00 973.17 937.16 963.44 0.00 2873.76
2 Education
Total Project Cost 130.00 152.00 - - - 282.00
Add : Price Inflation @ 7% 9.10 22.02 0.00 0.00 0.00 31.12
Total 139.10 174.02 0.00 0.00 0.00 313.12
Means of Finance
Municipality Own Funds 139.10 174.02 0.00 0.00 0.00 313.12
Total 139.10 174.02 0.00 0.00 0.00 313.12
3 Parks & Playgrounds
Total Project Cost - 74.00 100.00 65.00 60.00 299.00
Add : Price Inflation @ 7% 0.00 10.72 22.50 20.20 24.15 77.58
Total 0.00 84.72 122.50 85.20 84.15 376.58
Means of Finance
Grant 0.00 42.36 61.25 42.60 42.08 188.29
Municipality Own Funds 0.00 42.36 61.25 42.60 42.08 188.29
Total 0.00 84.72 122.50 85.20 84.15 376.58
4
Burial Ground -
Improvements
Total Project Cost - 10.00 14.00 - - 24.00
Add : Price Inflation @ 7% 0.00 1.45 3.15 0.00 0.00 4.60
Total 0.00 11.45 17.15 0.00 0.00 28.60
Means of Finance
Grant 0.00 10.30 15.44 0.00 0.00 25.74
Municipality Own Funds 0.00 1.14 1.72 0.00 0.00 2.86
Total 0.00 11.45 17.15 0.00 0.00 28.60
5 Medicare
Total Project Cost 180.00 5.00 5.00 5.00 5.00 200.00
Add : Price Inflation @ 7% 12.60 0.72 1.13 1.55 2.01 18.02
Total 192.60 5.72 6.13 6.55 7.01 218.02
Means of Finance
Grant 96.30 2.86 3.06 3.28 3.51 109.01
Municipality Own Funds 96.30 2.86 3.06 3.28 3.51 109.01
Total 192.60 5.72 6.13 6.55 7.01 218.02
6 Public Convenience
Total Project Cost 10.00 25.00 25.00 - - 60.00
Add : Price Inflation @ 7% 0.70 3.62 5.63 0.00 0.00 9.95
Total 10.70 28.62 30.63 0.00 0.00 69.95
Means of Finance
Grant 8.56 22.90 24.50 0.00 0.00 55.96
Municipality Own Funds 2.14 5.72 6.13 0.00 0.00 13.99
Total 10.70 28.62 30.63 0.00 0.00 69.95
7A Market Construction
Total Project Cost 50.00 155.00 - - - 205.00
Add : Price Inflation @ 7% 3.50 22.46 0.00 0.00 0.00 25.96
Total 53.50 177.46 0.00 0.00 0.00 230.96
Means of Finance
TNUIFSL Loan 48.15 159.71 0.00 0.00 0.00 207.86
Municipality Own Funds 5.35 17.75 0.00 0.00 0.00 23.10
Total 53.50 177.46 0.00 0.00 0.00 230.96
7B Parking Area
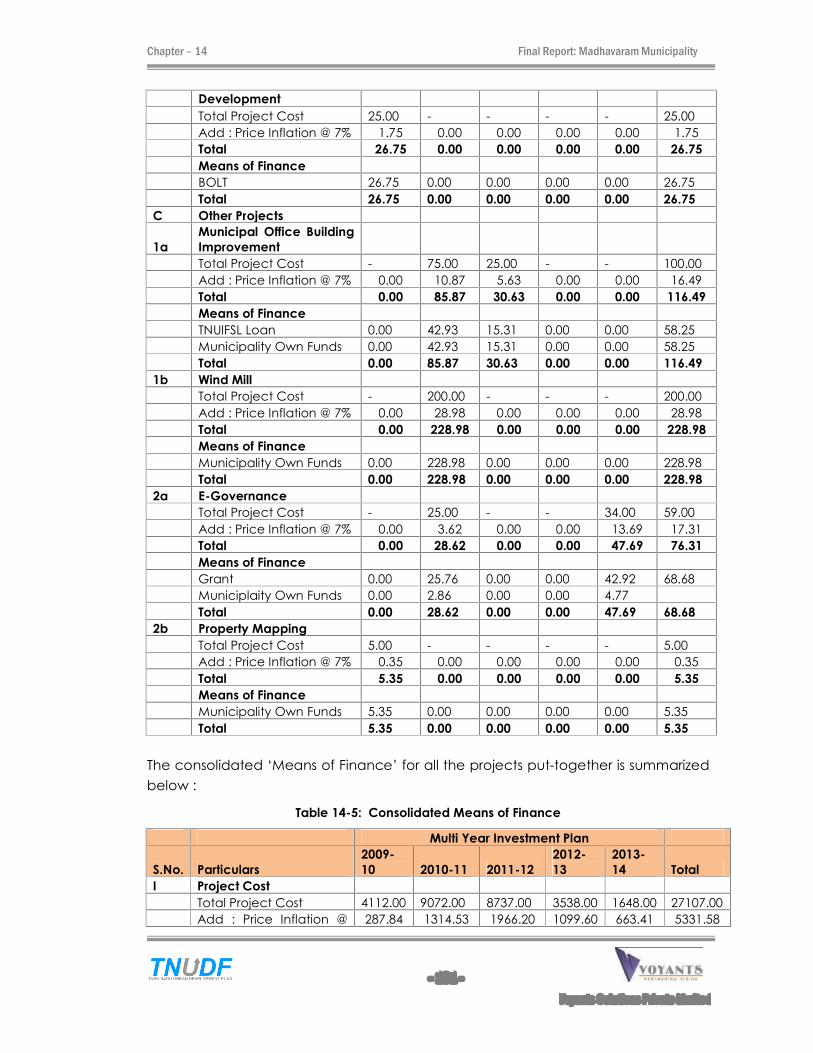
Chapter � 14 Final Report: Madhavaram Municipality
- 131 -
Voyants Solutions Private Limited
Development
Total Project Cost 25.00 - - - - 25.00
Add : Price Inflation @ 7% 1.75 0.00 0.00 0.00 0.00 1.75
Total 26.75 0.00 0.00 0.00 0.00 26.75
Means of Finance
BOLT 26.75 0.00 0.00 0.00 0.00 26.75
Total 26.75 0.00 0.00 0.00 0.00 26.75
C Other Projects
1a
Municipal Office Building
Improvement
Total Project Cost - 75.00 25.00 - - 100.00
Add : Price Inflation @ 7% 0.00 10.87 5.63 0.00 0.00 16.49
Total 0.00 85.87 30.63 0.00 0.00 116.49
Means of Finance
TNUIFSL Loan 0.00 42.93 15.31 0.00 0.00 58.25
Municipality Own Funds 0.00 42.93 15.31 0.00 0.00 58.25
Total 0.00 85.87 30.63 0.00 0.00 116.49
1b Wind Mill
Total Project Cost - 200.00 - - - 200.00
Add : Price Inflation @ 7% 0.00 28.98 0.00 0.00 0.00 28.98
Total 0.00 228.98 0.00 0.00 0.00 228.98
Means of Finance
Municipality Own Funds 0.00 228.98 0.00 0.00 0.00 228.98
Total 0.00 228.98 0.00 0.00 0.00 228.98
2a E-Governance
Total Project Cost - 25.00 - - 34.00 59.00
Add : Price Inflation @ 7% 0.00 3.62 0.00 0.00 13.69 17.31
Total 0.00 28.62 0.00 0.00 47.69 76.31
Means of Finance
Grant 0.00 25.76 0.00 0.00 42.92 68.68
Municiplaity Own Funds 0.00 2.86 0.00 0.00 4.77
Total 0.00 28.62 0.00 0.00 47.69 68.68
2b Property Mapping
Total Project Cost 5.00 - - - - 5.00
Add : Price Inflation @ 7% 0.35 0.00 0.00 0.00 0.00 0.35
Total 5.35 0.00 0.00 0.00 0.00 5.35
Means of Finance
Municipality Own Funds 5.35 0.00 0.00 0.00 0.00 5.35
Total 5.35 0.00 0.00 0.00 0.00 5.35
The consolidated �Means of Finance� for all the projects put-together is summarized
below :
Table 14-5: Consolidated Means of Finance
Multi Year Investment Plan
S.No. Particulars
2009-
10 2010-11 2011-12
2012-
13
2013-
14 Total
I Project Cost
Total Project Cost 4112.00 9072.00 8737.00 3538.00 1648.00 27107.00
Add : Price Inflation @ 287.84 1314.53 1966.20 1099.60 663.41 5331.58
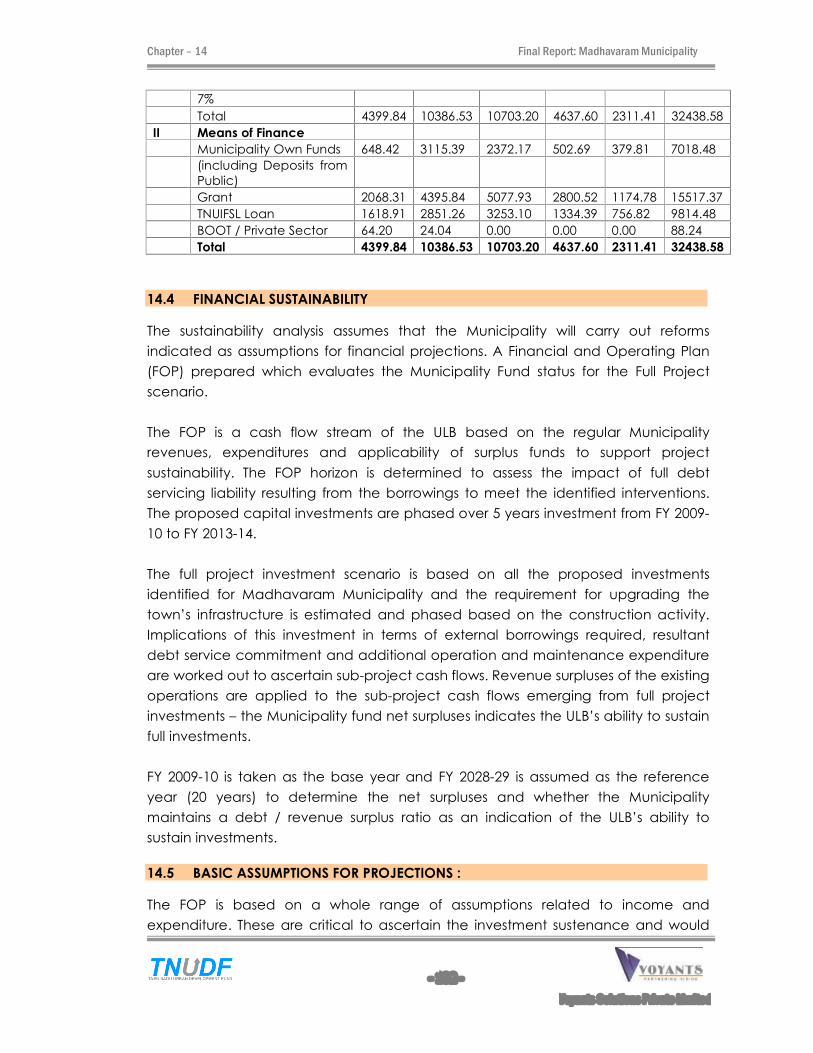
Chapter � 14 Final Report: Madhavaram Municipality
- 132 -
Voyants Solutions Private Limited
7%
Total 4399.84 10386.53 10703.20 4637.60 2311.41 32438.58
II Means of Finance
Municipality Own Funds 648.42 3115.39 2372.17 502.69 379.81 7018.48
(including Deposits from
Public)
Grant 2068.31 4395.84 5077.93 2800.52 1174.78 15517.37
TNUIFSL Loan 1618.91 2851.26 3253.10 1334.39 756.82 9814.48
BOOT / Private Sector 64.20 24.04 0.00 0.00 0.00 88.24
Total 4399.84 10386.53 10703.20 4637.60 2311.41 32438.58
14.4 FINANCIAL SUSTAINABILITY
The sustainability analysis assumes that the Municipality will carry out reforms
indicated as assumptions for financial projections. A Financial and Operating Plan
(FOP) prepared which evaluates the Municipality Fund status for the Full Project
scenario.
The FOP is a cash flow stream of the ULB based on the regular Municipality
revenues, expenditures and applicability of surplus funds to support project
sustainability. The FOP horizon is determined to assess the impact of full debt
servicing liability resulting from the borrowings to meet the identified interventions.
The proposed capital investments are phased over 5 years investment from FY 2009-
10 to FY 2013-14.
The full project investment scenario is based on all the proposed investments
identified for Madhavaram Municipality and the requirement for upgrading the
town�s infrastructure is estimated and phased based on the construction activity.
Implications of this investment in terms of external borrowings required, resultant
debt service commitment and additional operation and maintenance expenditure
are worked out to ascertain sub-project cash flows. Revenue surpluses of the existing
operations are applied to the sub-project cash flows emerging from full project
investments � the Municipality fund net surpluses indicates the ULB�s ability to sustain
full investments.
FY 2009-10 is taken as the base year and FY 2028-29 is assumed as the reference
year (20 years) to determine the net surpluses and whether the Municipality
maintains a debt / revenue surplus ratio as an indication of the ULB�s ability to
sustain investments.
14.5 BASIC ASSUMPTIONS FOR PROJECTIONS :
The FOP is based on a whole range of assumptions related to income and
expenditure. These are critical to ascertain the investment sustenance and would
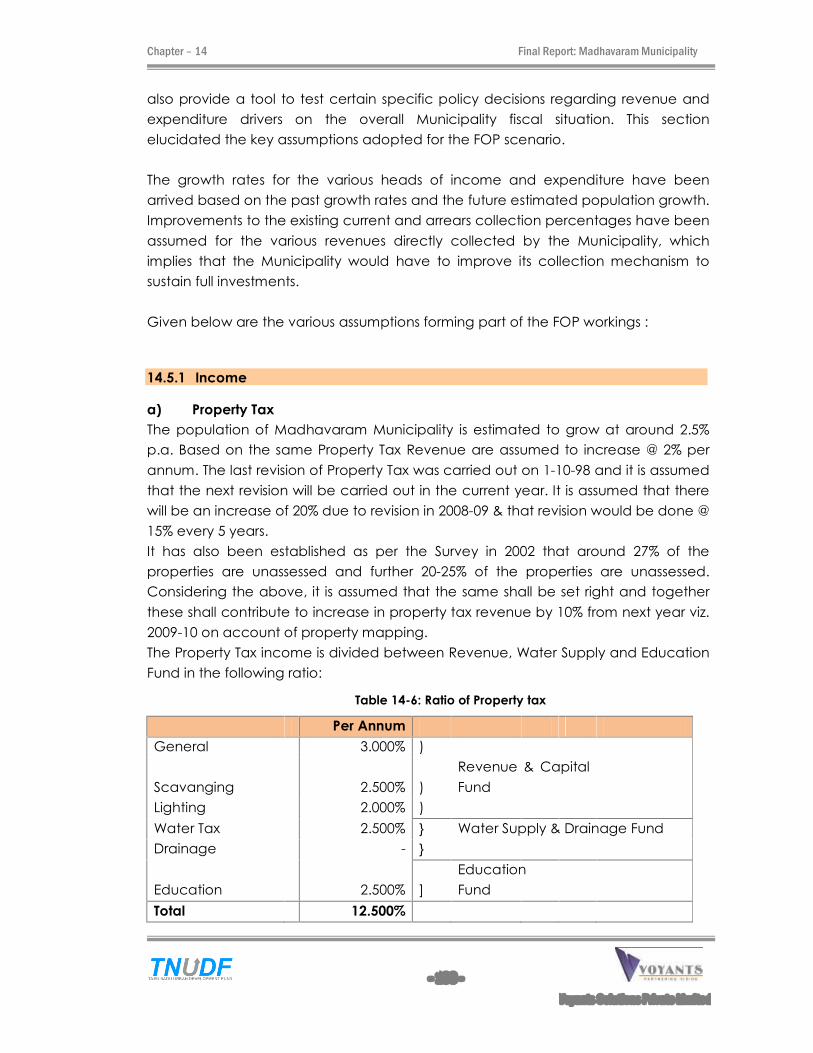
Chapter � 14 Final Report: Madhavaram Municipality
- 133 -
Voyants Solutions Private Limited
also provide a tool to test certain specific policy decisions regarding revenue and
expenditure drivers on the overall Municipality fiscal situation. This section
elucidated the key assumptions adopted for the FOP scenario.
The growth rates for the various heads of income and expenditure have been
arrived based on the past growth rates and the future estimated population growth.
Improvements to the existing current and arrears collection percentages have been
assumed for the various revenues directly collected by the Municipality, which
implies that the Municipality would have to improve its collection mechanism to
sustain full investments.
Given below are the various assumptions forming part of the FOP workings :
14.5.1 Income
a) Property Tax
The population of Madhavaram Municipality is estimated to grow at around 2.5%
p.a. Based on the same Property Tax Revenue are assumed to increase @ 2% per
annum. The last revision of Property Tax was carried out on 1-10-98 and it is assumed
that the next revision will be carried out in the current year. It is assumed that there
will be an increase of 20% due to revision in 2008-09 & that revision would be done @
15% every 5 years.
It has also been established as per the Survey in 2002 that around 27% of the
properties are unassessed and further 20-25% of the properties are unassessed.
Considering the above, it is assumed that the same shall be set right and together
these shall contribute to increase in property tax revenue by 10% from next year viz.
2009-10 on account of property mapping.
The Property Tax income is divided between Revenue, Water Supply and Education
Fund in the following ratio:
Table 14-6: Ratio of Property tax
Per Annum
General 3.000% )
Scavanging 2.500% )
Revenue & Capital
Fund
Lighting 2.000% )
Water Tax 2.500% } Water Supply & Drainage Fund
Drainage - }
Education 2.500% ]
Education
Fund
Total 12.500%
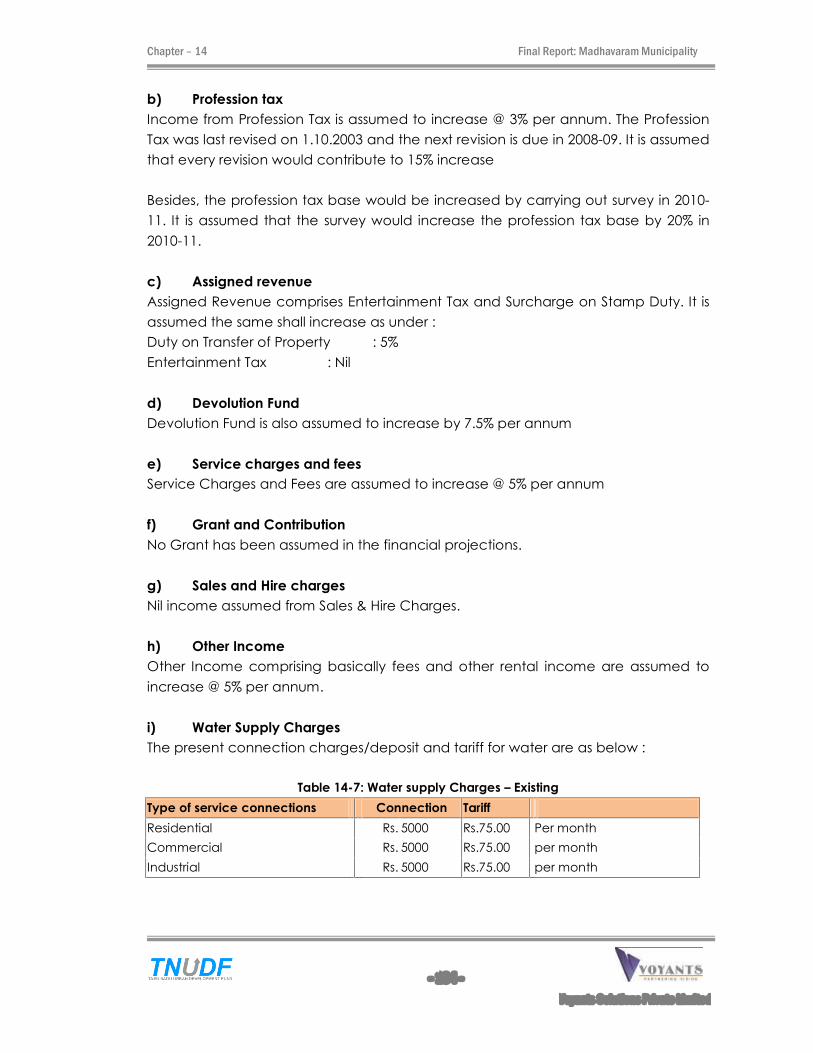
Chapter � 14 Final Report: Madhavaram Municipality
- 134 -
Voyants Solutions Private Limited
b) Profession tax
Income from Profession Tax is assumed to increase @ 3% per annum. The Profession
Tax was last revised on 1.10.2003 and the next revision is due in 2008-09. It is assumed
that every revision would contribute to 15% increase
Besides, the profession tax base would be increased by carrying out survey in 2010-
11. It is assumed that the survey would increase the profession tax base by 20% in
2010-11.
c) Assigned revenue
Assigned Revenue comprises Entertainment Tax and Surcharge on Stamp Duty. It is
assumed the same shall increase as under :
Duty on Transfer of Property : 5%
Entertainment Tax : Nil
d) Devolution Fund
Devolution Fund is also assumed to increase by 7.5% per annum
e) Service charges and fees
Service Charges and Fees are assumed to increase @ 5% per annum
f) Grant and Contribution
No Grant has been assumed in the financial projections.
g) Sales and Hire charges
Nil income assumed from Sales & Hire Charges.
h) Other Income
Other Income comprising basically fees and other rental income are assumed to
increase @ 5% per annum.
i) Water Supply Charges
The present connection charges/deposit and tariff for water are as below :
Table 14-7: Water supply Charges � Existing
Type of service connections Connection Tariff
Residential Rs. 5000 Rs.75.00 Per month
Commercial Rs. 5000 Rs.75.00 per month
Industrial Rs. 5000 Rs.75.00 per month
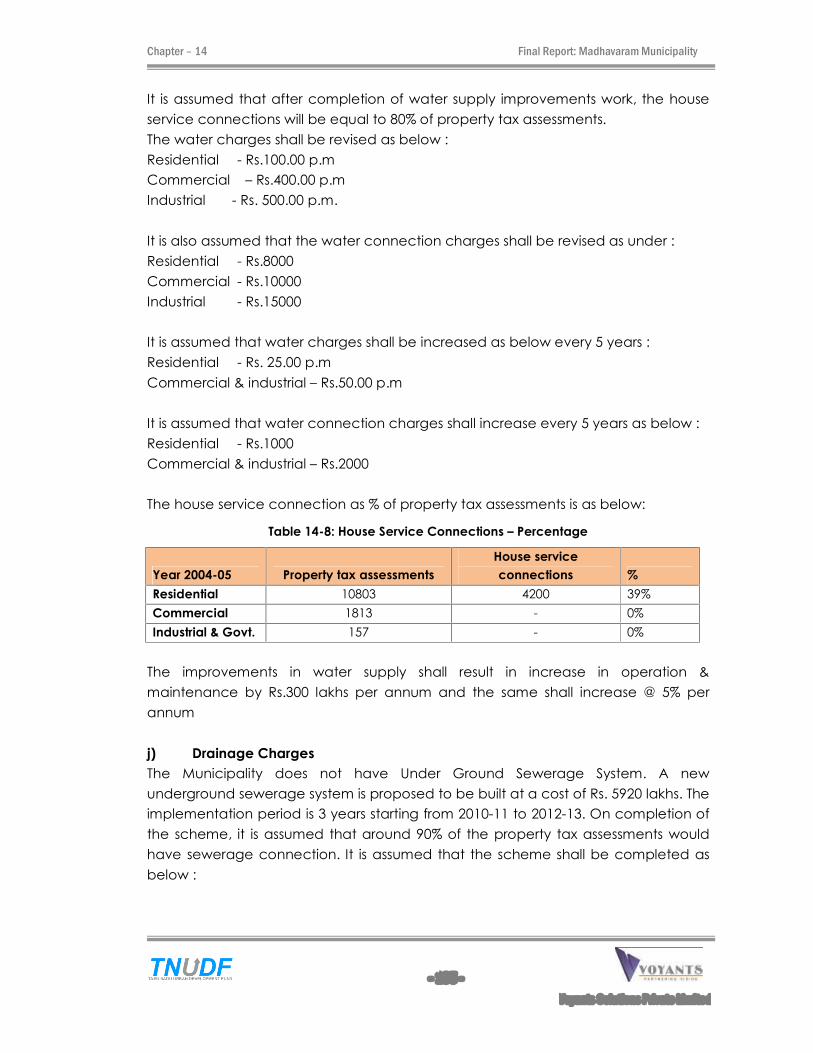
Chapter � 14 Final Report: Madhavaram Municipality
- 135 -
Voyants Solutions Private Limited
It is assumed that after completion of water supply improvements work, the house
service connections will be equal to 80% of property tax assessments.
The water charges shall be revised as below :
Residential - Rs.100.00 p.m
Commercial � Rs.400.00 p.m
Industrial - Rs. 500.00 p.m.
It is also assumed that the water connection charges shall be revised as under :
Residential - Rs.8000
Commercial - Rs.10000
Industrial - Rs.15000
It is assumed that water charges shall be increased as below every 5 years :
Residential - Rs. 25.00 p.m
Commercial & industrial � Rs.50.00 p.m
It is assumed that water connection charges shall increase every 5 years as below :
Residential - Rs.1000
Commercial & industrial � Rs.2000
The house service connection as % of property tax assessments is as below:
Table 14-8: House Service Connections � Percentage
Year 2004-05 Property tax assessments
House service
connections %
Residential 10803 4200 39%
Commercial 1813 - 0%
Industrial & Govt. 157 - 0%
The improvements in water supply shall result in increase in operation &
maintenance by Rs.300 lakhs per annum and the same shall increase @ 5% per
annum
j) Drainage Charges
The Municipality does not have Under Ground Sewerage System. A new
underground sewerage system is proposed to be built at a cost of Rs. 5920 lakhs. The
implementation period is 3 years starting from 2010-11 to 2012-13. On completion of
the scheme, it is assumed that around 90% of the property tax assessments would
have sewerage connection. It is assumed that the scheme shall be completed as
below :
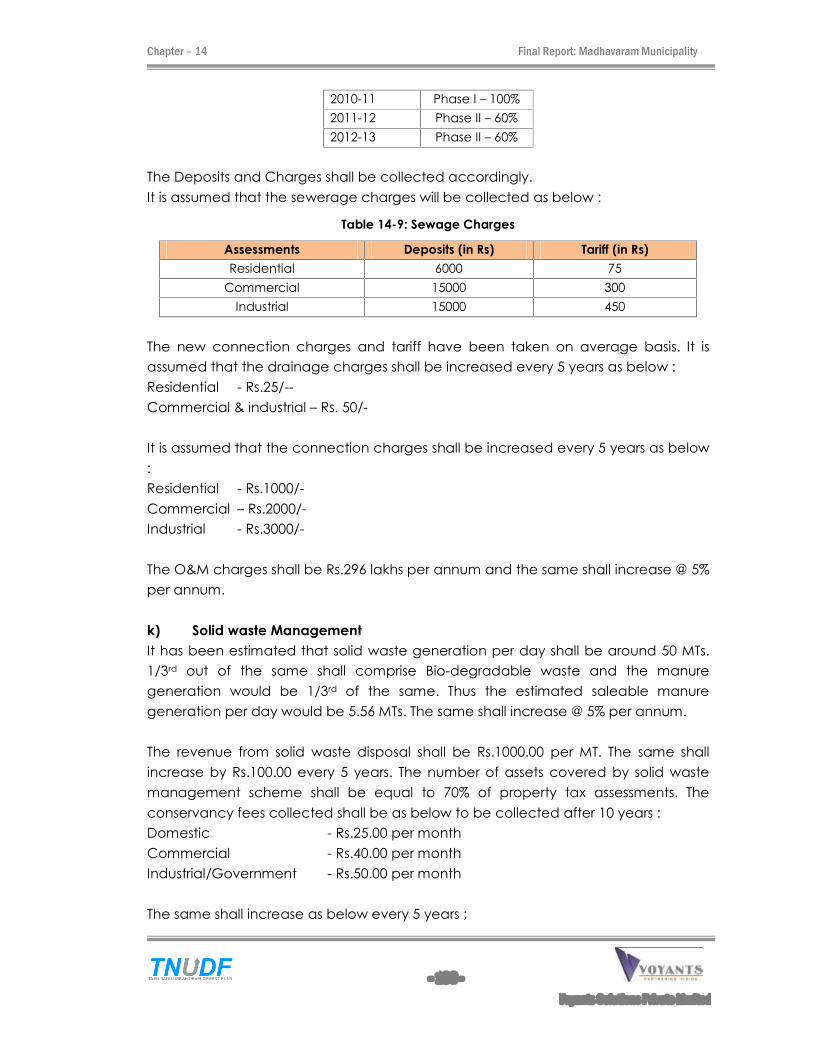
Chapter � 14 Final Report: Madhavaram Municipality
- 136 -
Voyants Solutions Private Limited
2010-11 Phase I � 100%
2011-12 Phase II � 60%
2012-13 Phase II � 60%
The Deposits and Charges shall be collected accordingly.
It is assumed that the sewerage charges will be collected as below :
Table 14-9: Sewage Charges
Assessments Deposits (in Rs) Tariff (in Rs)
Residential 6000 75
Commercial 15000 300
Industrial 15000 450
The new connection charges and tariff have been taken on average basis. It is
assumed that the drainage charges shall be increased every 5 years as below :
Residential - Rs.25/--
Commercial & industrial � Rs. 50/-
It is assumed that the connection charges shall be increased every 5 years as below
:
Residential - Rs.1000/-
Commercial � Rs.2000/-
Industrial - Rs.3000/-
The O&M charges shall be Rs.296 lakhs per annum and the same shall increase @ 5%
per annum.
k) Solid waste Management
It has been estimated that solid waste generation per day shall be around 50 MTs.
1/3rd out of the same shall comprise Bio-degradable waste and the manure
generation would be 1/3rd of the same. Thus the estimated saleable manure
generation per day would be 5.56 MTs. The same shall increase @ 5% per annum.
The revenue from solid waste disposal shall be Rs.1000.00 per MT. The same shall
increase by Rs.100.00 every 5 years. The number of assets covered by solid waste
management scheme shall be equal to 70% of property tax assessments. The
conservancy fees collected shall be as below to be collected after 10 years :
Domestic - Rs.25.00 per month
Commercial - Rs.40.00 per month
Industrial/Government - Rs.50.00 per month
The same shall increase as below every 5 years ;
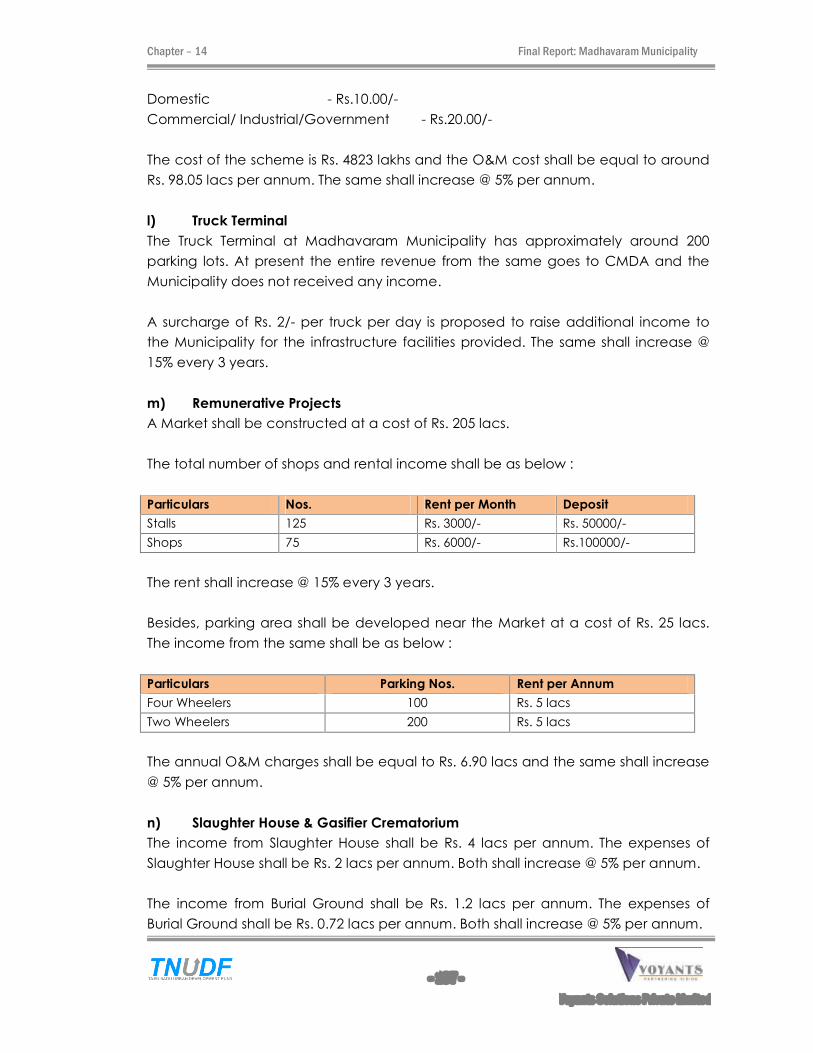
Chapter � 14 Final Report: Madhavaram Municipality
- 137 -
Voyants Solutions Private Limited
Domestic - Rs.10.00/-
Commercial/ Industrial/Government - Rs.20.00/-
The cost of the scheme is Rs. 4823 lakhs and the O&M cost shall be equal to around
Rs. 98.05 lacs per annum. The same shall increase @ 5% per annum.
l) Truck Terminal
The Truck Terminal at Madhavaram Municipality has approximately around 200
parking lots. At present the entire revenue from the same goes to CMDA and the
Municipality does not received any income.
A surcharge of Rs. 2/- per truck per day is proposed to raise additional income to
the Municipality for the infrastructure facilities provided. The same shall increase @
15% every 3 years.
m) Remunerative Projects
A Market shall be constructed at a cost of Rs. 205 lacs.
The total number of shops and rental income shall be as below :
Particulars Nos. Rent per Month Deposit
Stalls 125 Rs. 3000/- Rs. 50000/-
Shops 75 Rs. 6000/- Rs.100000/-
The rent shall increase @ 15% every 3 years.
Besides, parking area shall be developed near the Market at a cost of Rs. 25 lacs.
The income from the same shall be as below :
Particulars Parking Nos. Rent per Annum
Four Wheelers 100 Rs. 5 lacs
Two Wheelers 200 Rs. 5 lacs
The annual O&M charges shall be equal to Rs. 6.90 lacs and the same shall increase
@ 5% per annum.
n) Slaughter House & Gasifier Crematorium
The income from Slaughter House shall be Rs. 4 lacs per annum. The expenses of
Slaughter House shall be Rs. 2 lacs per annum. Both shall increase @ 5% per annum.
The income from Burial Ground shall be Rs. 1.2 lacs per annum. The expenses of
Burial Ground shall be Rs. 0.72 lacs per annum. Both shall increase @ 5% per annum.
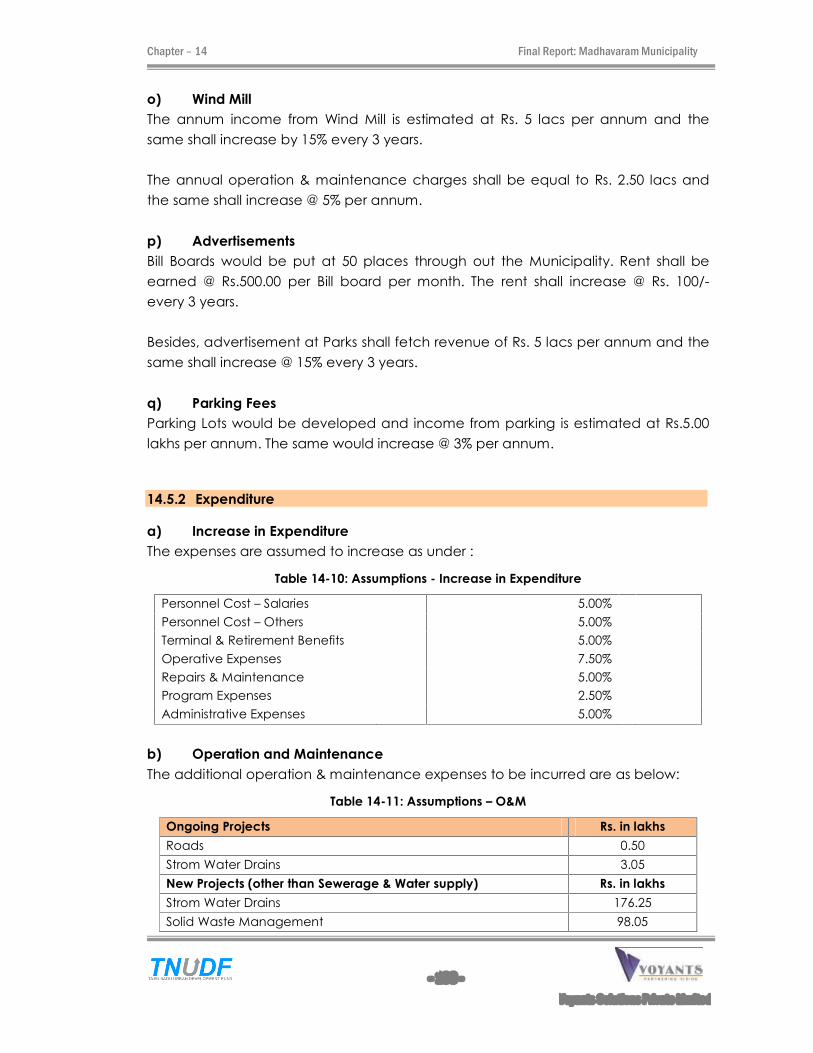
Chapter � 14 Final Report: Madhavaram Municipality
- 138 -
Voyants Solutions Private Limited
o) Wind Mill
The annum income from Wind Mill is estimated at Rs. 5 lacs per annum and the
same shall increase by 15% every 3 years.
The annual operation & maintenance charges shall be equal to Rs. 2.50 lacs and
the same shall increase @ 5% per annum.
p) Advertisements
Bill Boards would be put at 50 places through out the Municipality. Rent shall be
earned @ Rs.500.00 per Bill board per month. The rent shall increase @ Rs. 100/-
every 3 years.
Besides, advertisement at Parks shall fetch revenue of Rs. 5 lacs per annum and the
same shall increase @ 15% every 3 years.
q) Parking Fees
Parking Lots would be developed and income from parking is estimated at Rs.5.00
lakhs per annum. The same would increase @ 3% per annum.
14.5.2 Expenditure
a) Increase in Expenditure
The expenses are assumed to increase as under :
Table 14-10: Assumptions - Increase in Expenditure
Personnel Cost � Salaries 5.00%
Personnel Cost � Others 5.00%
Terminal & Retirement Benefits 5.00%
Operative Expenses 7.50%
Repairs & Maintenance 5.00%
Program Expenses 2.50%
Administrative Expenses 5.00%
b) Operation and Maintenance
The additional operation & maintenance expenses to be incurred are as below:
Table 14-11: Assumptions � O&M
Ongoing Projects Rs. in lakhs
Roads 0.50
Strom Water Drains 3.05
New Projects (other than Sewerage & Water supply) Rs. in lakhs
Strom Water Drains 176.25
Solid Waste Management 98.05
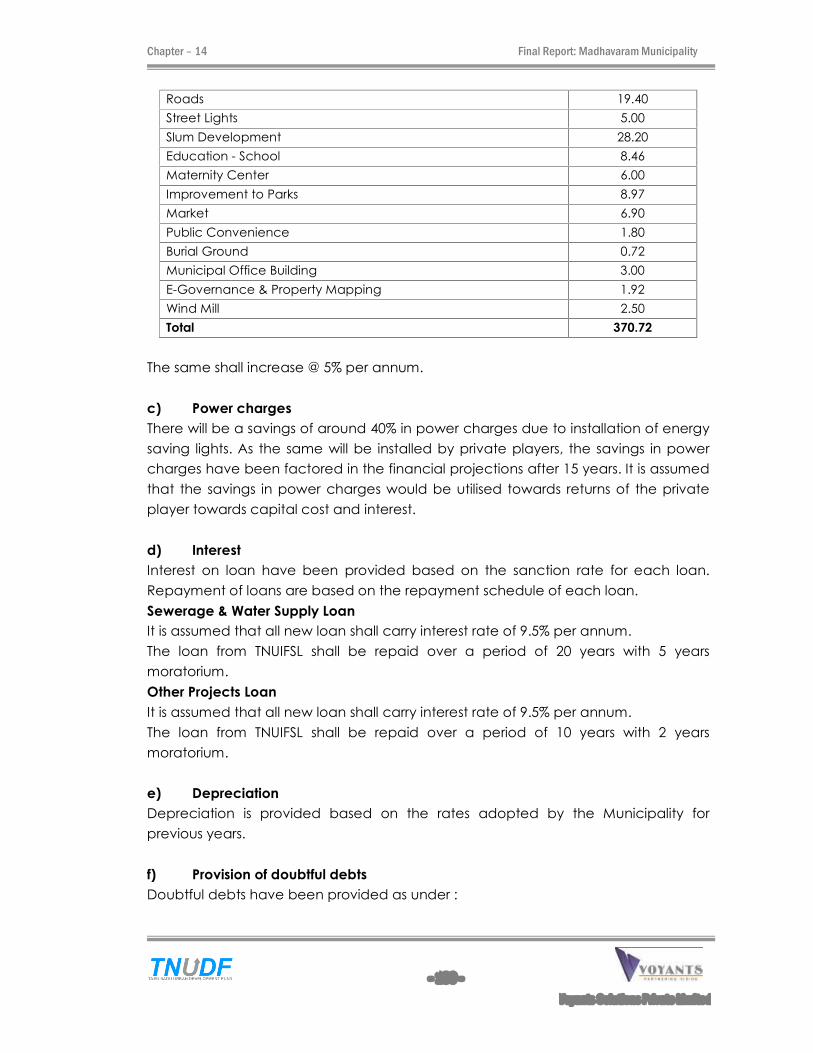
Chapter � 14 Final Report: Madhavaram Municipality
- 139 -
Voyants Solutions Private Limited
Roads 19.40
Street Lights 5.00
Slum Development 28.20
Education - School 8.46
Maternity Center 6.00
Improvement to Parks 8.97
Market 6.90
Public Convenience 1.80
Burial Ground 0.72
Municipal Office Building 3.00
E-Governance & Property Mapping 1.92
Wind Mill 2.50
Total 370.72
The same shall increase @ 5% per annum.
c) Power charges
There will be a savings of around 40% in power charges due to installation of energy
saving lights. As the same will be installed by private players, the savings in power
charges have been factored in the financial projections after 15 years. It is assumed
that the savings in power charges would be utilised towards returns of the private
player towards capital cost and interest.
d) Interest
Interest on loan have been provided based on the sanction rate for each loan.
Repayment of loans are based on the repayment schedule of each loan.
Sewerage & Water Supply Loan
It is assumed that all new loan shall carry interest rate of 9.5% per annum.
The loan from TNUIFSL shall be repaid over a period of 20 years with 5 years
moratorium.
Other Projects Loan
It is assumed that all new loan shall carry interest rate of 9.5% per annum.
The loan from TNUIFSL shall be repaid over a period of 10 years with 2 years
moratorium.
e) Depreciation
Depreciation is provided based on the rates adopted by the Municipality for
previous years.
f) Provision of doubtful debts
Doubtful debts have been provided as under :
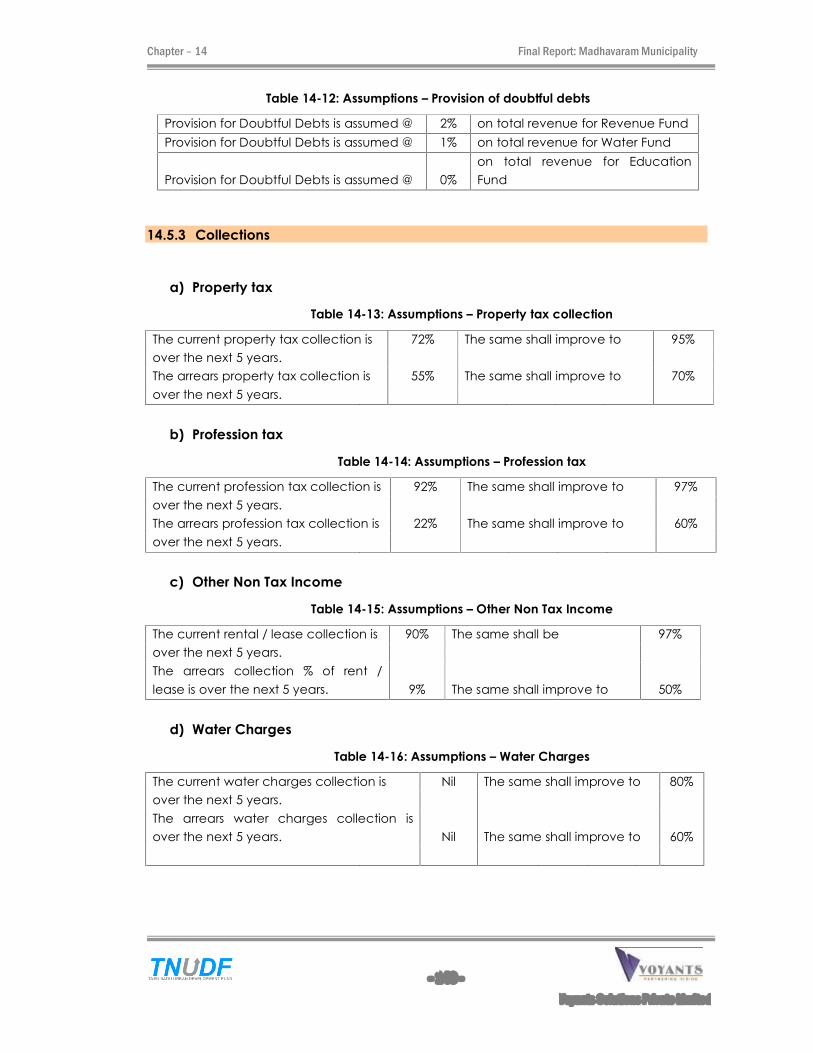
Chapter � 14 Final Report: Madhavaram Municipality
- 140 -
Voyants Solutions Private Limited
Table 14-12: Assumptions � Provision of doubtful debts
Provision for Doubtful Debts is assumed @ 2% on total revenue for Revenue Fund
Provision for Doubtful Debts is assumed @ 1% on total revenue for Water Fund
Provision for Doubtful Debts is assumed @ 0%
on total revenue for Education
Fund
14.5.3 Collections
a) Property tax
Table 14-13: Assumptions � Property tax collection
The current property tax collection is 72% The same shall improve to 95%
over the next 5 years.
The arrears property tax collection is 55% The same shall improve to 70%
over the next 5 years.
b) Profession tax
Table 14-14: Assumptions � Profession tax
The current profession tax collection is 92% The same shall improve to 97%
over the next 5 years.
The arrears profession tax collection is 22% The same shall improve to 60%
over the next 5 years.
c) Other Non Tax Income
Table 14-15: Assumptions � Other Non Tax Income
The current rental / lease collection is 90% The same shall be 97%
over the next 5 years.
The arrears collection % of rent /
lease is over the next 5 years. 9% The same shall improve to 50%
d) Water Charges
Table 14-16: Assumptions � Water Charges
The current water charges collection is Nil The same shall improve to 80%
over the next 5 years.
The arrears water charges collection is
over the next 5 years. Nil The same shall improve to 60%
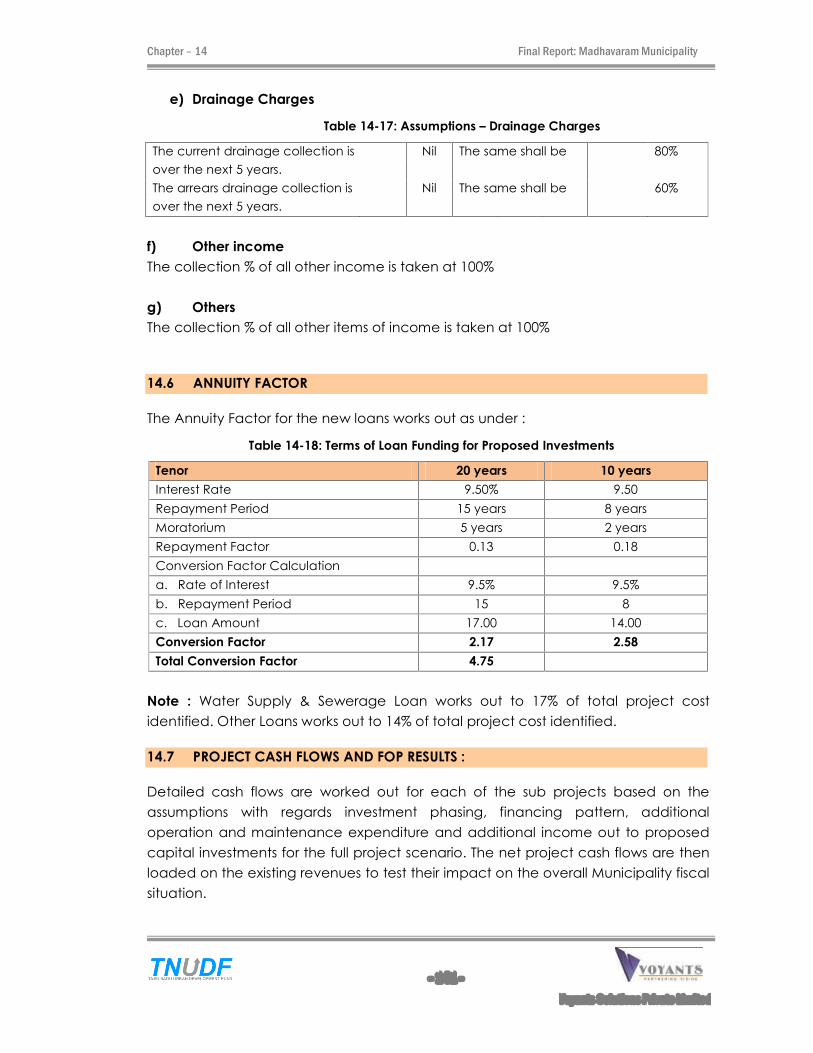
Chapter � 14 Final Report: Madhavaram Municipality
- 141 -
Voyants Solutions Private Limited
e) Drainage Charges
Table 14-17: Assumptions � Drainage Charges
The current drainage collection is Nil The same shall be 80%
over the next 5 years.
The arrears drainage collection is Nil The same shall be 60%
over the next 5 years.
f) Other income
The collection % of all other income is taken at 100%
g) Others
The collection % of all other items of income is taken at 100%
14.6 ANNUITY FACTOR
The Annuity Factor for the new loans works out as under :
Table 14-18: Terms of Loan Funding for Proposed Investments
Tenor 20 years 10 years
Interest Rate 9.50% 9.50
Repayment Period 15 years 8 years
Moratorium 5 years 2 years
Repayment Factor 0.13 0.18
Conversion Factor Calculation
a. Rate of Interest 9.5% 9.5%
b. Repayment Period 15 8
c. Loan Amount 17.00 14.00
Conversion Factor 2.17 2.58
Total Conversion Factor 4.75
Note : Water Supply & Sewerage Loan works out to 17% of total project cost
identified. Other Loans works out to 14% of total project cost identified.
14.7 PROJECT CASH FLOWS AND FOP RESULTS :
Detailed cash flows are worked out for each of the sub projects based on the
assumptions with regards investment phasing, financing pattern, additional
operation and maintenance expenditure and additional income out to proposed
capital investments for the full project scenario. The net project cash flows are then
loaded on the existing revenues to test their impact on the overall Municipality fiscal
situation.

Chapter � 14 Final Report: Madhavaram Municipality
- 142 -
Voyants Solutions Private Limited
a) Income and Expenditure projections
Table 14.19 captures the Income and Expenditure projections for the next 20 years
with potential improvements and borrowings :
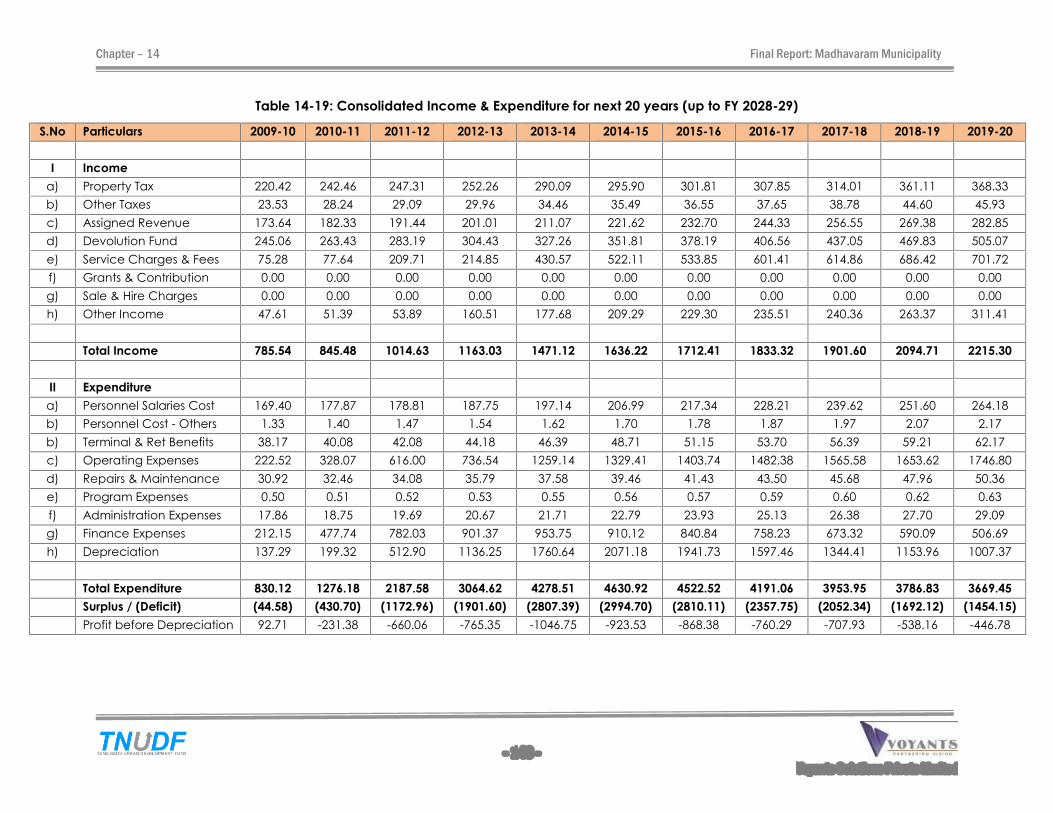
Chapter � 14 Final Report: Madhavaram Municipality
- 143 - Voyants Solutions Private Limited
Table 14-19: Consolidated Income & Expenditure for next 20 years (up to FY 2028-29)
S.No Particulars 2009-10 2010-11 2011-12 2012-13 2013-14 2014-15 2015-16 2016-17 2017-18 2018-19 2019-20
I Income
a) Property Tax 220.42 242.46 247.31 252.26 290.09 295.90 301.81 307.85 314.01 361.11 368.33
b) Other Taxes 23.53 28.24 29.09 29.96 34.46 35.49 36.55 37.65 38.78 44.60 45.93
c) Assigned Revenue 173.64 182.33 191.44 201.01 211.07 221.62 232.70 244.33 256.55 269.38 282.85
d) Devolution Fund 245.06 263.43 283.19 304.43 327.26 351.81 378.19 406.56 437.05 469.83 505.07
e) Service Charges & Fees 75.28 77.64 209.71 214.85 430.57 522.11 533.85 601.41 614.86 686.42 701.72
f) Grants & Contribution 0.00 0.00 0.00 0.00 0.00 0.00 0.00 0.00 0.00 0.00 0.00
g) Sale & Hire Charges 0.00 0.00 0.00 0.00 0.00 0.00 0.00 0.00 0.00 0.00 0.00
h) Other Income 47.61 51.39 53.89 160.51 177.68 209.29 229.30 235.51 240.36 263.37 311.41
Total Income 785.54 845.48 1014.63 1163.03 1471.12 1636.22 1712.41 1833.32 1901.60 2094.71 2215.30
II Expenditure
a) Personnel Salaries Cost 169.40 177.87 178.81 187.75 197.14 206.99 217.34 228.21 239.62 251.60 264.18
b) Personnel Cost - Others 1.33 1.40 1.47 1.54 1.62 1.70 1.78 1.87 1.97 2.07 2.17
b) Terminal & Ret Benefits 38.17 40.08 42.08 44.18 46.39 48.71 51.15 53.70 56.39 59.21 62.17
c) Operating Expenses 222.52 328.07 616.00 736.54 1259.14 1329.41 1403.74 1482.38 1565.58 1653.62 1746.80
d) Repairs & Maintenance 30.92 32.46 34.08 35.79 37.58 39.46 41.43 43.50 45.68 47.96 50.36
e) Program Expenses 0.50 0.51 0.52 0.53 0.55 0.56 0.57 0.59 0.60 0.62 0.63
f) Administration Expenses 17.86 18.75 19.69 20.67 21.71 22.79 23.93 25.13 26.38 27.70 29.09
g) Finance Expenses 212.15 477.74 782.03 901.37 953.75 910.12 840.84 758.23 673.32 590.09 506.69
h) Depreciation 137.29 199.32 512.90 1136.25 1760.64 2071.18 1941.73 1597.46 1344.41 1153.96 1007.37
Total Expenditure 830.12 1276.18 2187.58 3064.62 4278.51 4630.92 4522.52 4191.06 3953.95 3786.83 3669.45
Surplus / (Deficit) (44.58) (430.70) (1172.96) (1901.60) (2807.39) (2994.70) (2810.11) (2357.75) (2052.34) (1692.12) (1454.15)
Profit before Depreciation 92.71 -231.38 -660.06 -765.35 -1046.75 -923.53 -868.38 -760.29 -707.93 -538.16 -446.78
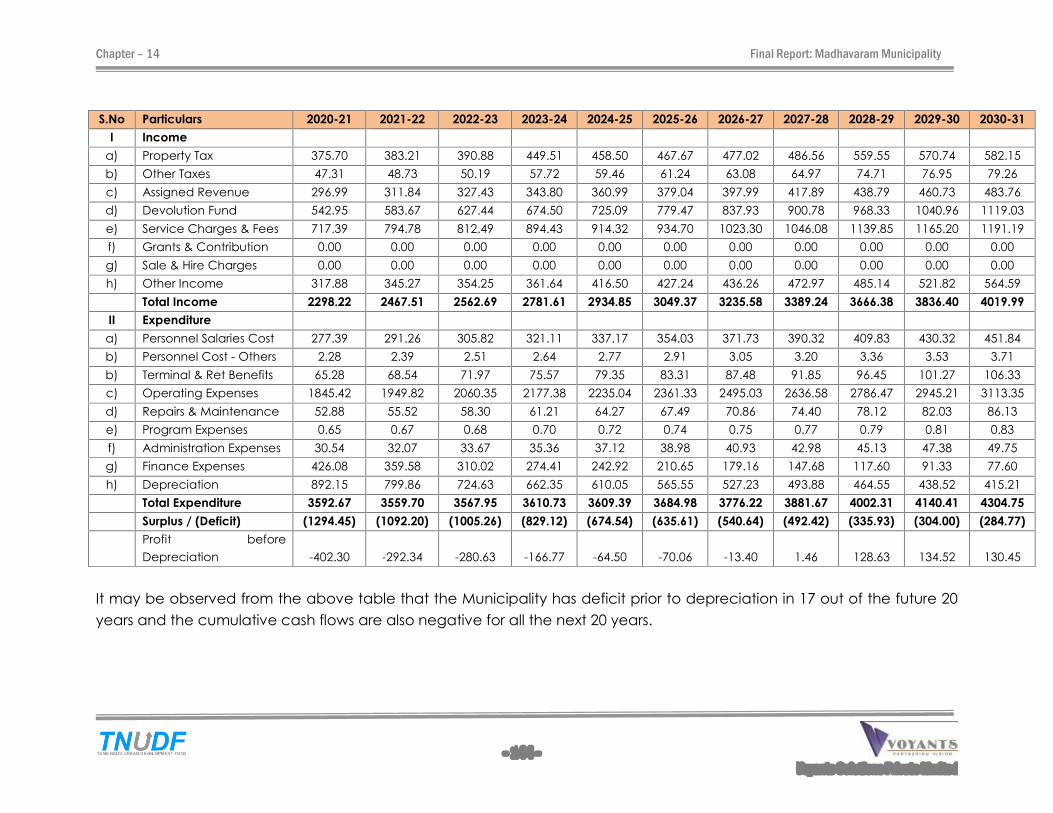
Chapter � 14 Final Report: Madhavaram Municipality
- 144 - Voyants Solutions Private Limited
S.No Particulars 2020-21 2021-22 2022-23 2023-24 2024-25 2025-26 2026-27 2027-28 2028-29 2029-30 2030-31
I Income
a) Property Tax 375.70 383.21 390.88 449.51 458.50 467.67 477.02 486.56 559.55 570.74 582.15
b) Other Taxes 47.31 48.73 50.19 57.72 59.46 61.24 63.08 64.97 74.71 76.95 79.26
c) Assigned Revenue 296.99 311.84 327.43 343.80 360.99 379.04 397.99 417.89 438.79 460.73 483.76
d) Devolution Fund 542.95 583.67 627.44 674.50 725.09 779.47 837.93 900.78 968.33 1040.96 1119.03
e) Service Charges & Fees 717.39 794.78 812.49 894.43 914.32 934.70 1023.30 1046.08 1139.85 1165.20 1191.19
f) Grants & Contribution 0.00 0.00 0.00 0.00 0.00 0.00 0.00 0.00 0.00 0.00 0.00
g) Sale & Hire Charges 0.00 0.00 0.00 0.00 0.00 0.00 0.00 0.00 0.00 0.00 0.00
h) Other Income 317.88 345.27 354.25 361.64 416.50 427.24 436.26 472.97 485.14 521.82 564.59
Total Income 2298.22 2467.51 2562.69 2781.61 2934.85 3049.37 3235.58 3389.24 3666.38 3836.40 4019.99
II Expenditure
a) Personnel Salaries Cost 277.39 291.26 305.82 321.11 337.17 354.03 371.73 390.32 409.83 430.32 451.84
b) Personnel Cost - Others 2.28 2.39 2.51 2.64 2.77 2.91 3.05 3.20 3.36 3.53 3.71
b) Terminal & Ret Benefits 65.28 68.54 71.97 75.57 79.35 83.31 87.48 91.85 96.45 101.27 106.33
c) Operating Expenses 1845.42 1949.82 2060.35 2177.38 2235.04 2361.33 2495.03 2636.58 2786.47 2945.21 3113.35
d) Repairs & Maintenance 52.88 55.52 58.30 61.21 64.27 67.49 70.86 74.40 78.12 82.03 86.13
e) Program Expenses 0.65 0.67 0.68 0.70 0.72 0.74 0.75 0.77 0.79 0.81 0.83
f) Administration Expenses 30.54 32.07 33.67 35.36 37.12 38.98 40.93 42.98 45.13 47.38 49.75
g) Finance Expenses 426.08 359.58 310.02 274.41 242.92 210.65 179.16 147.68 117.60 91.33 77.60
h) Depreciation 892.15 799.86 724.63 662.35 610.05 565.55 527.23 493.88 464.55 438.52 415.21
Total Expenditure 3592.67 3559.70 3567.95 3610.73 3609.39 3684.98 3776.22 3881.67 4002.31 4140.41 4304.75
Surplus / (Deficit) (1294.45) (1092.20) (1005.26) (829.12) (674.54) (635.61) (540.64) (492.42) (335.93) (304.00) (284.77)
Profit before
Depreciation -402.30 -292.34 -280.63 -166.77 -64.50 -70.06 -13.40 1.46 128.63 134.52 130.45
It may be observed from the above table that the Municipality has deficit prior to depreciation in 17 out of the future 20
years and the cumulative cash flows are also negative for all the next 20 years.
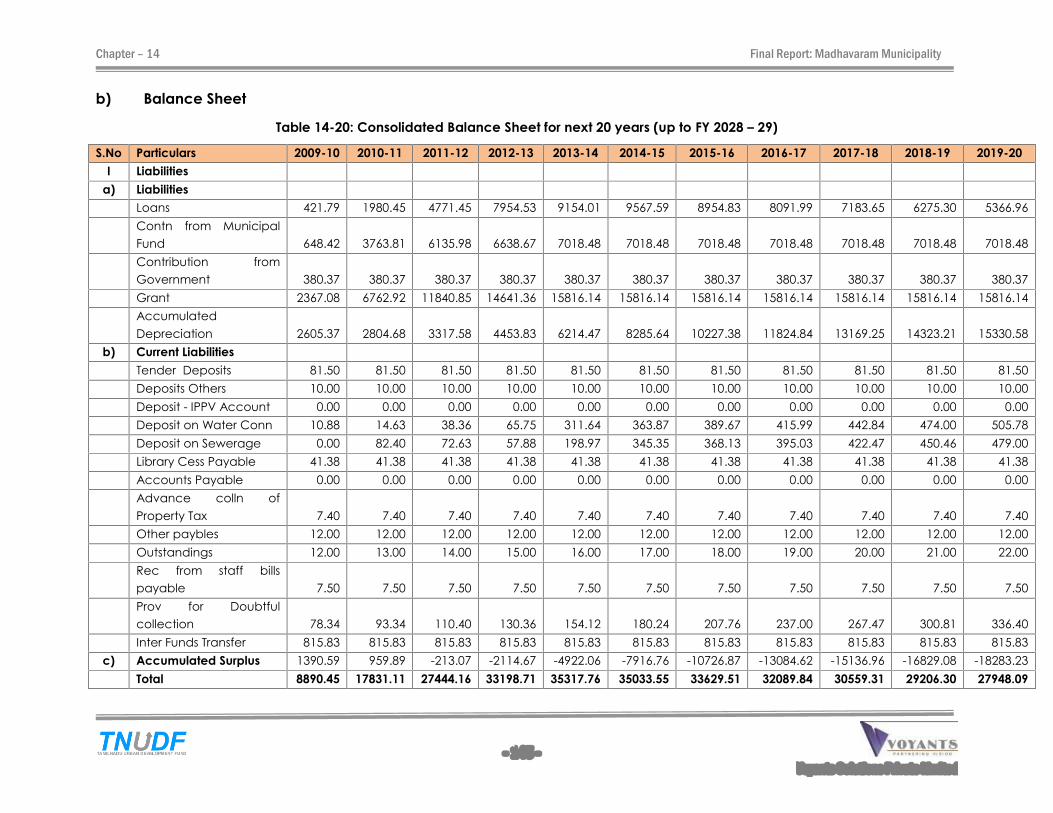
Chapter � 14 Final Report: Madhavaram Municipality
- 145 - Voyants Solutions Private Limited
b) Balance Sheet
Table 14-20: Consolidated Balance Sheet for next 20 years (up to FY 2028 � 29)
S.No Particulars 2009-10 2010-11 2011-12 2012-13 2013-14 2014-15 2015-16 2016-17 2017-18 2018-19 2019-20
I Liabilities
a) Liabilities
Loans 421.79 1980.45 4771.45 7954.53 9154.01 9567.59 8954.83 8091.99 7183.65 6275.30 5366.96
Contn from Municipal
Fund 648.42 3763.81 6135.98 6638.67 7018.48 7018.48 7018.48 7018.48 7018.48 7018.48 7018.48
Contribution from
Government 380.37 380.37 380.37 380.37 380.37 380.37 380.37 380.37 380.37 380.37 380.37
Grant 2367.08 6762.92 11840.85 14641.36 15816.14 15816.14 15816.14 15816.14 15816.14 15816.14 15816.14
Accumulated
Depreciation 2605.37 2804.68 3317.58 4453.83 6214.47 8285.64 10227.38 11824.84 13169.25 14323.21 15330.58
b) Current Liabilities
Tender Deposits 81.50 81.50 81.50 81.50 81.50 81.50 81.50 81.50 81.50 81.50 81.50
Deposits Others 10.00 10.00 10.00 10.00 10.00 10.00 10.00 10.00 10.00 10.00 10.00
Deposit - IPPV Account 0.00 0.00 0.00 0.00 0.00 0.00 0.00 0.00 0.00 0.00 0.00
Deposit on Water Conn 10.88 14.63 38.36 65.75 311.64 363.87 389.67 415.99 442.84 474.00 505.78
Deposit on Sewerage 0.00 82.40 72.63 57.88 198.97 345.35 368.13 395.03 422.47 450.46 479.00
Library Cess Payable 41.38 41.38 41.38 41.38 41.38 41.38 41.38 41.38 41.38 41.38 41.38
Accounts Payable 0.00 0.00 0.00 0.00 0.00 0.00 0.00 0.00 0.00 0.00 0.00
Advance colln of
Property Tax 7.40 7.40 7.40 7.40 7.40 7.40 7.40 7.40 7.40 7.40 7.40
Other paybles 12.00 12.00 12.00 12.00 12.00 12.00 12.00 12.00 12.00 12.00 12.00
Outstandings 12.00 13.00 14.00 15.00 16.00 17.00 18.00 19.00 20.00 21.00 22.00
Rec from staff bills
payable 7.50 7.50 7.50 7.50 7.50 7.50 7.50 7.50 7.50 7.50 7.50
Prov for Doubtful
collection 78.34 93.34 110.40 130.36 154.12 180.24 207.76 237.00 267.47 300.81 336.40
Inter Funds Transfer 815.83 815.83 815.83 815.83 815.83 815.83 815.83 815.83 815.83 815.83 815.83
c) Accumulated Surplus 1390.59 959.89 -213.07 -2114.67 -4922.06 -7916.76 -10726.87 -13084.62 -15136.96 -16829.08 -18283.23
Total 8890.45 17831.11 27444.16 33198.71 35317.76 35033.55 33629.51 32089.84 30559.31 29206.30 27948.09
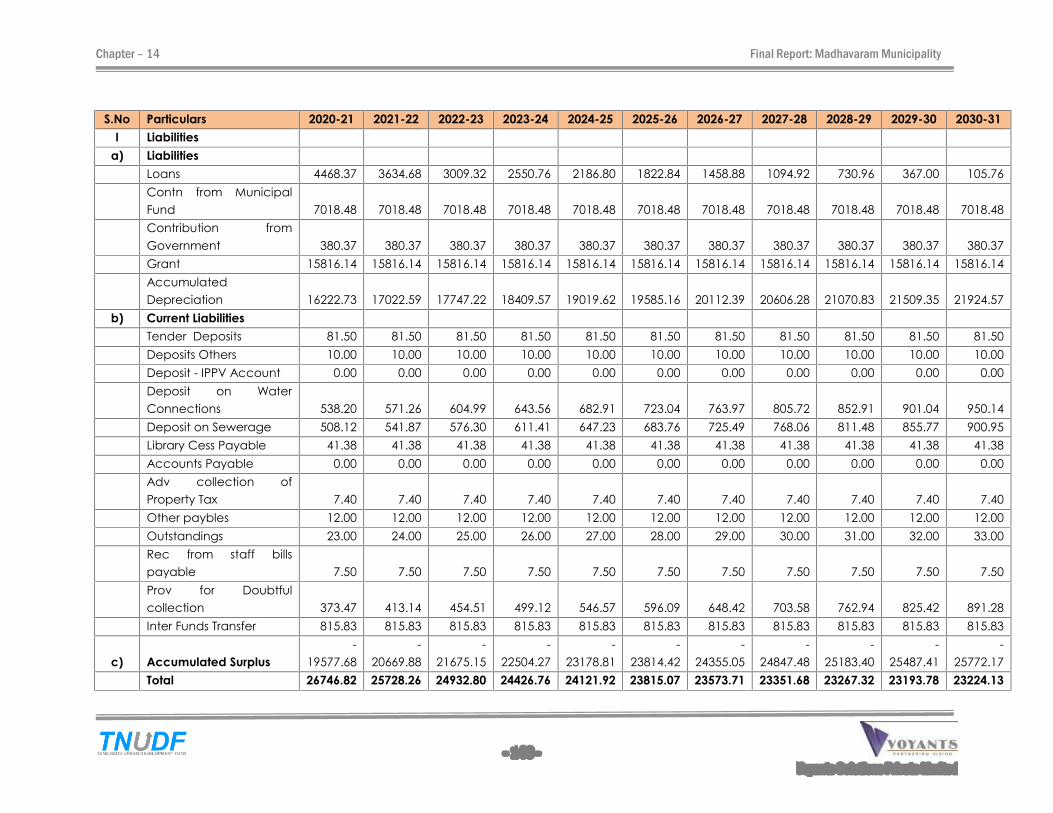
Chapter � 14 Final Report: Madhavaram Municipality
- 146 - Voyants Solutions Private Limited
S.No Particulars 2020-21 2021-22 2022-23 2023-24 2024-25 2025-26 2026-27 2027-28 2028-29 2029-30 2030-31
I Liabilities
a) Liabilities
Loans 4468.37 3634.68 3009.32 2550.76 2186.80 1822.84 1458.88 1094.92 730.96 367.00 105.76
Contn from Municipal
Fund 7018.48 7018.48 7018.48 7018.48 7018.48 7018.48 7018.48 7018.48 7018.48 7018.48 7018.48
Contribution from
Government 380.37 380.37 380.37 380.37 380.37 380.37 380.37 380.37 380.37 380.37 380.37
Grant 15816.14 15816.14 15816.14 15816.14 15816.14 15816.14 15816.14 15816.14 15816.14 15816.14 15816.14
Accumulated
Depreciation 16222.73 17022.59 17747.22 18409.57 19019.62 19585.16 20112.39 20606.28 21070.83 21509.35 21924.57
b) Current Liabilities
Tender Deposits 81.50 81.50 81.50 81.50 81.50 81.50 81.50 81.50 81.50 81.50 81.50
Deposits Others 10.00 10.00 10.00 10.00 10.00 10.00 10.00 10.00 10.00 10.00 10.00
Deposit - IPPV Account 0.00 0.00 0.00 0.00 0.00 0.00 0.00 0.00 0.00 0.00 0.00
Deposit on Water
Connections 538.20 571.26 604.99 643.56 682.91 723.04 763.97 805.72 852.91 901.04 950.14
Deposit on Sewerage 508.12 541.87 576.30 611.41 647.23 683.76 725.49 768.06 811.48 855.77 900.95
Library Cess Payable 41.38 41.38 41.38 41.38 41.38 41.38 41.38 41.38 41.38 41.38 41.38
Accounts Payable 0.00 0.00 0.00 0.00 0.00 0.00 0.00 0.00 0.00 0.00 0.00
Adv collection of
Property Tax 7.40 7.40 7.40 7.40 7.40 7.40 7.40 7.40 7.40 7.40 7.40
Other paybles 12.00 12.00 12.00 12.00 12.00 12.00 12.00 12.00 12.00 12.00 12.00
Outstandings 23.00 24.00 25.00 26.00 27.00 28.00 29.00 30.00 31.00 32.00 33.00
Rec from staff bills
payable 7.50 7.50 7.50 7.50 7.50 7.50 7.50 7.50 7.50 7.50 7.50
Prov for Doubtful
collection 373.47 413.14 454.51 499.12 546.57 596.09 648.42 703.58 762.94 825.42 891.28
Inter Funds Transfer 815.83 815.83 815.83 815.83 815.83 815.83 815.83 815.83 815.83 815.83 815.83
c) Accumulated Surplus
-
19577.68
-
20669.88
-
21675.15
-
22504.27
-
23178.81
-
23814.42
-
24355.05
-
24847.48
-
25183.40
-
25487.41
-
25772.17
Total 26746.82 25728.26 24932.80 24426.76 24121.92 23815.07 23573.71 23351.68 23267.32 23193.78 23224.13
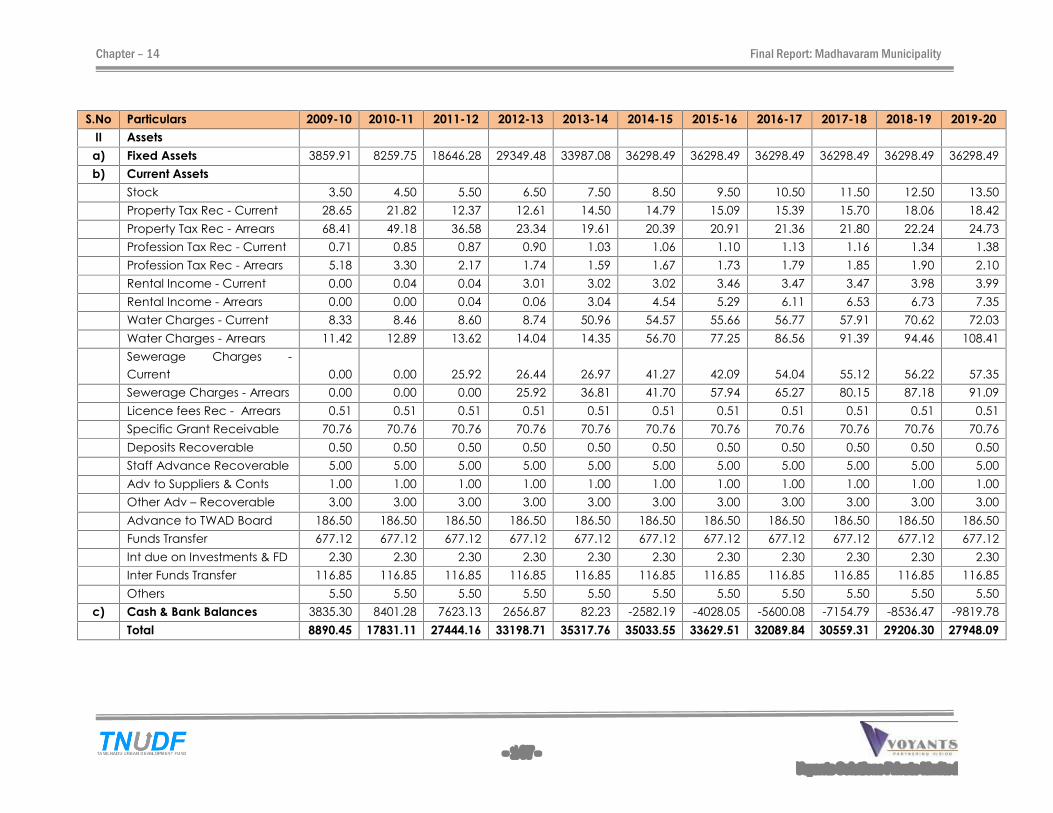
Chapter � 14 Final Report: Madhavaram Municipality
- 147 - Voyants Solutions Private Limited
S.No Particulars 2009-10 2010-11 2011-12 2012-13 2013-14 2014-15 2015-16 2016-17 2017-18 2018-19 2019-20
II Assets
a) Fixed Assets 3859.91 8259.75 18646.28 29349.48 33987.08 36298.49 36298.49 36298.49 36298.49 36298.49 36298.49
b) Current Assets
Stock 3.50 4.50 5.50 6.50 7.50 8.50 9.50 10.50 11.50 12.50 13.50
Property Tax Rec - Current 28.65 21.82 12.37 12.61 14.50 14.79 15.09 15.39 15.70 18.06 18.42
Property Tax Rec - Arrears 68.41 49.18 36.58 23.34 19.61 20.39 20.91 21.36 21.80 22.24 24.73
Profession Tax Rec - Current 0.71 0.85 0.87 0.90 1.03 1.06 1.10 1.13 1.16 1.34 1.38
Profession Tax Rec - Arrears 5.18 3.30 2.17 1.74 1.59 1.67 1.73 1.79 1.85 1.90 2.10
Rental Income - Current 0.00 0.04 0.04 3.01 3.02 3.02 3.46 3.47 3.47 3.98 3.99
Rental Income - Arrears 0.00 0.00 0.04 0.06 3.04 4.54 5.29 6.11 6.53 6.73 7.35
Water Charges - Current 8.33 8.46 8.60 8.74 50.96 54.57 55.66 56.77 57.91 70.62 72.03
Water Charges - Arrears 11.42 12.89 13.62 14.04 14.35 56.70 77.25 86.56 91.39 94.46 108.41
Sewerage Charges -
Current 0.00 0.00 25.92 26.44 26.97 41.27 42.09 54.04 55.12 56.22 57.35
Sewerage Charges - Arrears 0.00 0.00 0.00 25.92 36.81 41.70 57.94 65.27 80.15 87.18 91.09
Licence fees Rec - Arrears 0.51 0.51 0.51 0.51 0.51 0.51 0.51 0.51 0.51 0.51 0.51
Specific Grant Receivable 70.76 70.76 70.76 70.76 70.76 70.76 70.76 70.76 70.76 70.76 70.76
Deposits Recoverable 0.50 0.50 0.50 0.50 0.50 0.50 0.50 0.50 0.50 0.50 0.50
Staff Advance Recoverable 5.00 5.00 5.00 5.00 5.00 5.00 5.00 5.00 5.00 5.00 5.00
Adv to Suppliers & Conts 1.00 1.00 1.00 1.00 1.00 1.00 1.00 1.00 1.00 1.00 1.00
Other Adv � Recoverable 3.00 3.00 3.00 3.00 3.00 3.00 3.00 3.00 3.00 3.00 3.00
Advance to TWAD Board 186.50 186.50 186.50 186.50 186.50 186.50 186.50 186.50 186.50 186.50 186.50
Funds Transfer 677.12 677.12 677.12 677.12 677.12 677.12 677.12 677.12 677.12 677.12 677.12
Int due on Investments & FD 2.30 2.30 2.30 2.30 2.30 2.30 2.30 2.30 2.30 2.30 2.30
Inter Funds Transfer 116.85 116.85 116.85 116.85 116.85 116.85 116.85 116.85 116.85 116.85 116.85
Others 5.50 5.50 5.50 5.50 5.50 5.50 5.50 5.50 5.50 5.50 5.50
c) Cash & Bank Balances 3835.30 8401.28 7623.13 2656.87 82.23 -2582.19 -4028.05 -5600.08 -7154.79 -8536.47 -9819.78
Total 8890.45 17831.11 27444.16 33198.71 35317.76 35033.55 33629.51 32089.84 30559.31 29206.30 27948.09
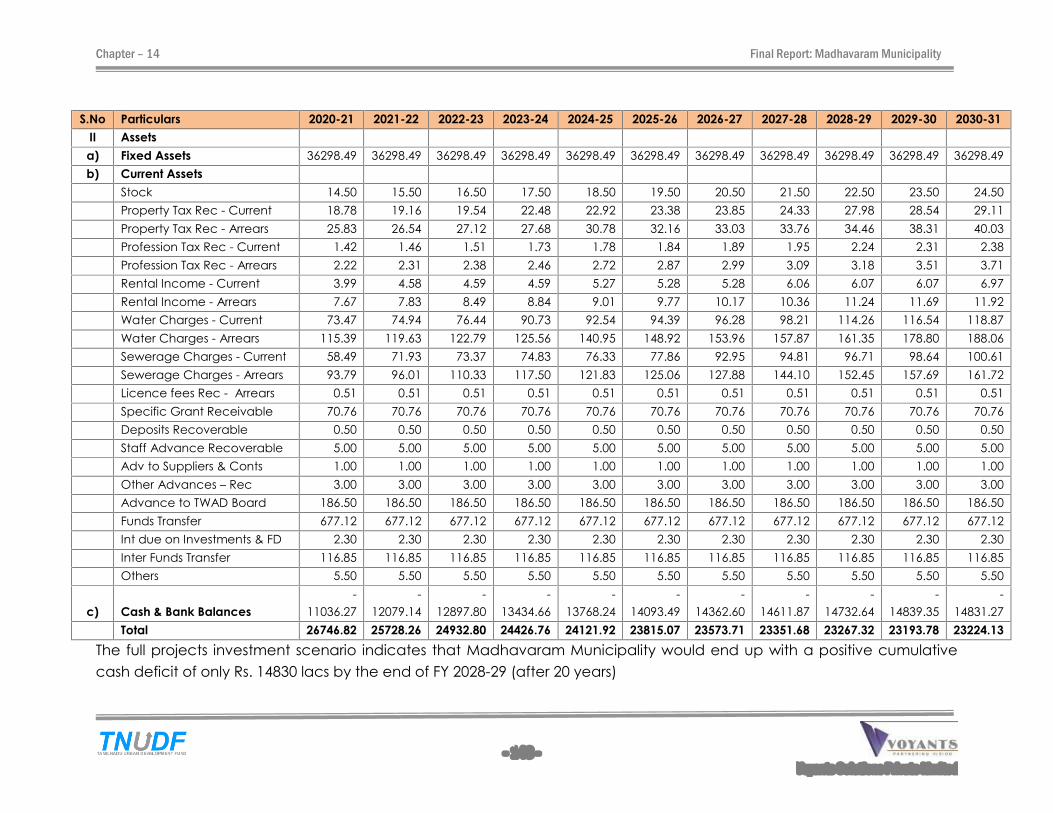
Chapter � 14 Final Report: Madhavaram Municipality
- 148 - Voyants Solutions Private Limited
S.No Particulars 2020-21 2021-22 2022-23 2023-24 2024-25 2025-26 2026-27 2027-28 2028-29 2029-30 2030-31
II Assets
a) Fixed Assets 36298.49 36298.49 36298.49 36298.49 36298.49 36298.49 36298.49 36298.49 36298.49 36298.49 36298.49
b) Current Assets
Stock 14.50 15.50 16.50 17.50 18.50 19.50 20.50 21.50 22.50 23.50 24.50
Property Tax Rec - Current 18.78 19.16 19.54 22.48 22.92 23.38 23.85 24.33 27.98 28.54 29.11
Property Tax Rec - Arrears 25.83 26.54 27.12 27.68 30.78 32.16 33.03 33.76 34.46 38.31 40.03
Profession Tax Rec - Current 1.42 1.46 1.51 1.73 1.78 1.84 1.89 1.95 2.24 2.31 2.38
Profession Tax Rec - Arrears 2.22 2.31 2.38 2.46 2.72 2.87 2.99 3.09 3.18 3.51 3.71
Rental Income - Current 3.99 4.58 4.59 4.59 5.27 5.28 5.28 6.06 6.07 6.07 6.97
Rental Income - Arrears 7.67 7.83 8.49 8.84 9.01 9.77 10.17 10.36 11.24 11.69 11.92
Water Charges - Current 73.47 74.94 76.44 90.73 92.54 94.39 96.28 98.21 114.26 116.54 118.87
Water Charges - Arrears 115.39 119.63 122.79 125.56 140.95 148.92 153.96 157.87 161.35 178.80 188.06
Sewerage Charges - Current 58.49 71.93 73.37 74.83 76.33 77.86 92.95 94.81 96.71 98.64 100.61
Sewerage Charges - Arrears 93.79 96.01 110.33 117.50 121.83 125.06 127.88 144.10 152.45 157.69 161.72
Licence fees Rec - Arrears 0.51 0.51 0.51 0.51 0.51 0.51 0.51 0.51 0.51 0.51 0.51
Specific Grant Receivable 70.76 70.76 70.76 70.76 70.76 70.76 70.76 70.76 70.76 70.76 70.76
Deposits Recoverable 0.50 0.50 0.50 0.50 0.50 0.50 0.50 0.50 0.50 0.50 0.50
Staff Advance Recoverable 5.00 5.00 5.00 5.00 5.00 5.00 5.00 5.00 5.00 5.00 5.00
Adv to Suppliers & Conts 1.00 1.00 1.00 1.00 1.00 1.00 1.00 1.00 1.00 1.00 1.00
Other Advances � Rec 3.00 3.00 3.00 3.00 3.00 3.00 3.00 3.00 3.00 3.00 3.00
Advance to TWAD Board 186.50 186.50 186.50 186.50 186.50 186.50 186.50 186.50 186.50 186.50 186.50
Funds Transfer 677.12 677.12 677.12 677.12 677.12 677.12 677.12 677.12 677.12 677.12 677.12
Int due on Investments & FD 2.30 2.30 2.30 2.30 2.30 2.30 2.30 2.30 2.30 2.30 2.30
Inter Funds Transfer 116.85 116.85 116.85 116.85 116.85 116.85 116.85 116.85 116.85 116.85 116.85
Others 5.50 5.50 5.50 5.50 5.50 5.50 5.50 5.50 5.50 5.50 5.50
c) Cash & Bank Balances
-
11036.27
-
12079.14
-
12897.80
-
13434.66
-
13768.24
-
14093.49
-
14362.60
-
14611.87
-
14732.64
-
14839.35
-
14831.27
Total 26746.82 25728.26 24932.80 24426.76 24121.92 23815.07 23573.71 23351.68 23267.32 23193.78 23224.13
The full projects investment scenario indicates that Madhavaram Municipality would end up with a positive cumulative
cash deficit of only Rs. 14830 lacs by the end of FY 2028-29 (after 20 years)
Chapter � 14 Final Report: Madhavaram Municipality
- 149 -
Voyants Solutions Private Limited
14.8 IMPACT OF POTENTIAL IMPROVEMENTS
Madhavaram�s ability to improve on its financial performance hinges primarily on its
ability to sustain and improve on the revenue growth noticeable in recent years.
Specific interventions with respect to revenue realization and cost management are
detailed in Section � of the report. On �Full Project Investment Scenario� basis,
Madhavaram�s own revenues (comprising taxes, user charges and other income)
could grow from Rs. 385 lacs in FY 2006-07 to Rs. 1812 lacs by FY 2028-29, implying an
absolute growth of 19%. Madhavaram has vast potential for increasing its own
income given the growth achieved in the last few years. Areas for revenue
enhancement in own revenue include :
Property Tax � through an enhanced revision in ARV, widening assessee base
and closer scrutiny. Besides periodic increase (every 5 years) in property tax
rates.
Professional Tax � sustaining a higher assessment growth.
User Charges � periodic increases in user charges for water connections and
sewerage connections. The Municipality could generate additional Rs. 700 lacs
of income per annum by FY 2028-29 by providing water connections to 80% of
property tax assessments and sewerage connections to 70% of property tax
assessments.
Madhavaram also needs to explore scope for private sector participation for
development of remunerative projects and city beautification projects that have
been identified by Madhavaram.
While there is potential for expenditure control in certain areas (as in the case of
energy costs and leakage in water supply), the focus of cost management should
be to shift expenditure from administration to better asset management and service
levels. We have not factored in any cost reduction in the FOP and have assumed
that any savings generated from cost reduction would go into augmenting service
levels and better asset management.
A comprehensive energy audit is required, given that 70% of its operations and
maintenance expenditure is spent on electricity charges. Plugging leakage in the
water supply network and installation of timers and energy savers on the street light
network are important interventions needed in the context of Madhavaram�s high
power costs.
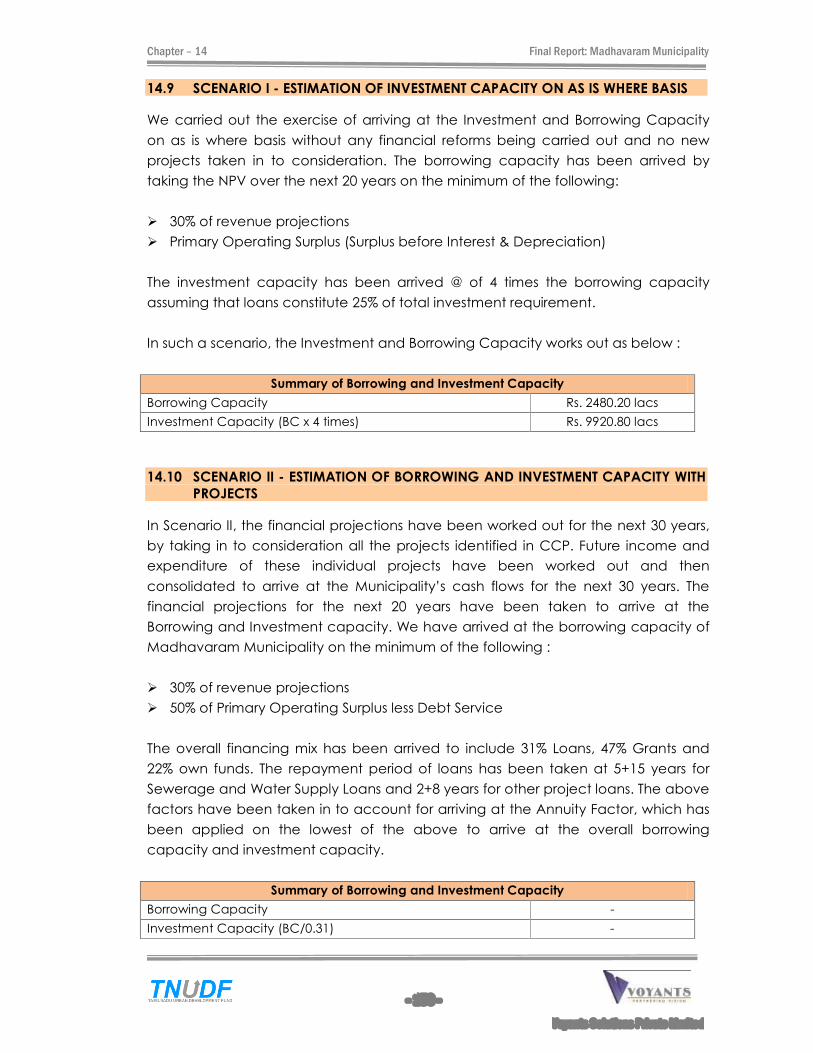
Chapter � 14 Final Report: Madhavaram Municipality
- 150 -
Voyants Solutions Private Limited
14.9 SCENARIO I - ESTIMATION OF INVESTMENT CAPACITY ON AS IS WHERE BASIS
We carried out the exercise of arriving at the Investment and Borrowing Capacity
on as is where basis without any financial reforms being carried out and no new
projects taken in to consideration. The borrowing capacity has been arrived by
taking the NPV over the next 20 years on the minimum of the following:
30% of revenue projections
Primary Operating Surplus (Surplus before Interest & Depreciation)
The investment capacity has been arrived @ of 4 times the borrowing capacity
assuming that loans constitute 25% of total investment requirement.
In such a scenario, the Investment and Borrowing Capacity works out as below :
Summary of Borrowing and Investment Capacity
Borrowing Capacity Rs. 2480.20 lacs
Investment Capacity (BC x 4 times) Rs. 9920.80 lacs
14.10 SCENARIO II - ESTIMATION OF BORROWING AND INVESTMENT CAPACITY WITH
PROJECTS
In Scenario II, the financial projections have been worked out for the next 30 years,
by taking in to consideration all the projects identified in CCP. Future income and
expenditure of these individual projects have been worked out and then
consolidated to arrive at the Municipality�s cash flows for the next 30 years. The
financial projections for the next 20 years have been taken to arrive at the
Borrowing and Investment capacity. We have arrived at the borrowing capacity of
Madhavaram Municipality on the minimum of the following :
30% of revenue projections
50% of Primary Operating Surplus less Debt Service
The overall financing mix has been arrived to include 31% Loans, 47% Grants and
22% own funds. The repayment period of loans has been taken at 5+15 years for
Sewerage and Water Supply Loans and 2+8 years for other project loans. The above
factors have been taken in to account for arriving at the Annuity Factor, which has
been applied on the lowest of the above to arrive at the overall borrowing
capacity and investment capacity.
Summary of Borrowing and Investment Capacity
Borrowing Capacity -
Investment Capacity (BC/0.31) -
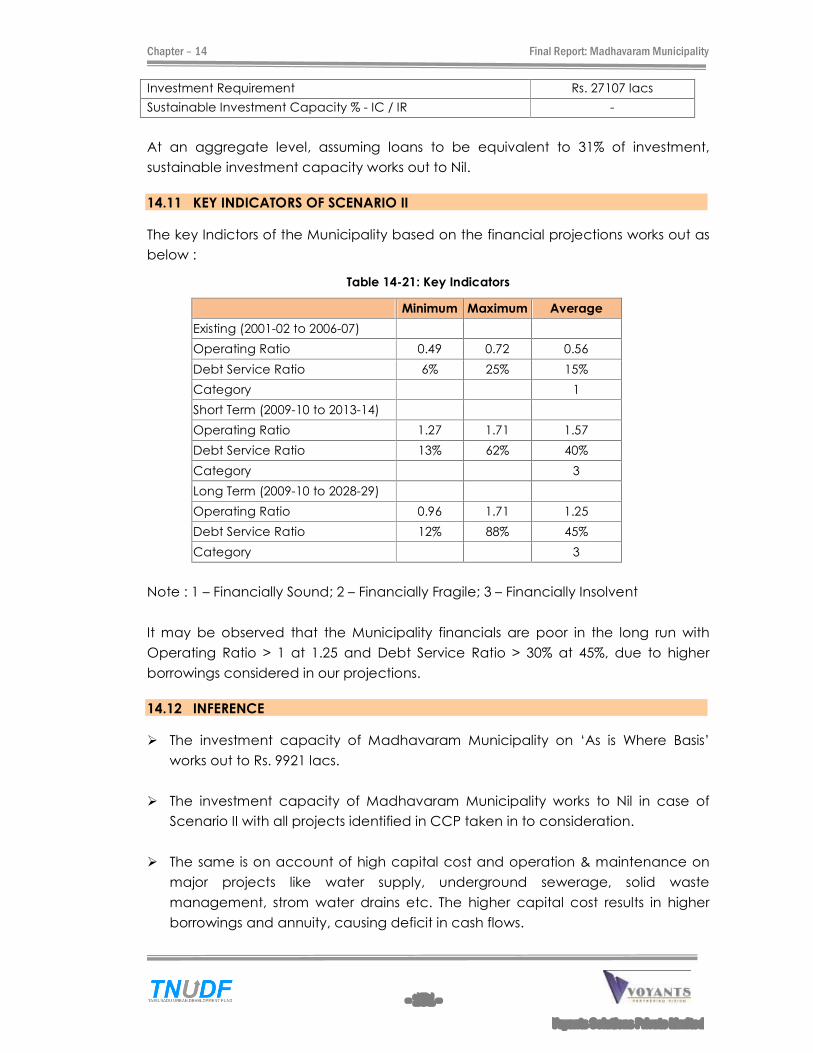
Chapter � 14 Final Report: Madhavaram Municipality
- 151 -
Voyants Solutions Private Limited
Investment Requirement Rs. 27107 lacs
Sustainable Investment Capacity % - IC / IR -
At an aggregate level, assuming loans to be equivalent to 31% of investment,
sustainable investment capacity works out to Nil.
14.11 KEY INDICATORS OF SCENARIO II
The key Indictors of the Municipality based on the financial projections works out as
below :
Table 14-21: Key Indicators
Minimum Maximum Average
Existing (2001-02 to 2006-07)
Operating Ratio 0.49 0.72 0.56
Debt Service Ratio 6% 25% 15%
Category 1
Short Term (2009-10 to 2013-14)
Operating Ratio 1.27 1.71 1.57
Debt Service Ratio 13% 62% 40%
Category 3
Long Term (2009-10 to 2028-29)
Operating Ratio 0.96 1.71 1.25
Debt Service Ratio 12% 88% 45%
Category 3
Note : 1 � Financially Sound; 2 � Financially Fragile; 3 � Financially Insolvent
It may be observed that the Municipality financials are poor in the long run with
Operating Ratio > 1 at 1.25 and Debt Service Ratio > 30% at 45%, due to higher
borrowings considered in our projections.
14.12 INFERENCE
The investment capacity of Madhavaram Municipality on �As is Where Basis�
works out to Rs. 9921 lacs.
The investment capacity of Madhavaram Municipality works to Nil in case of
Scenario II with all projects identified in CCP taken in to consideration.
The same is on account of high capital cost and operation & maintenance on
major projects like water supply, underground sewerage, solid waste
management, strom water drains etc. The higher capital cost results in higher
borrowings and annuity, causing deficit in cash flows.
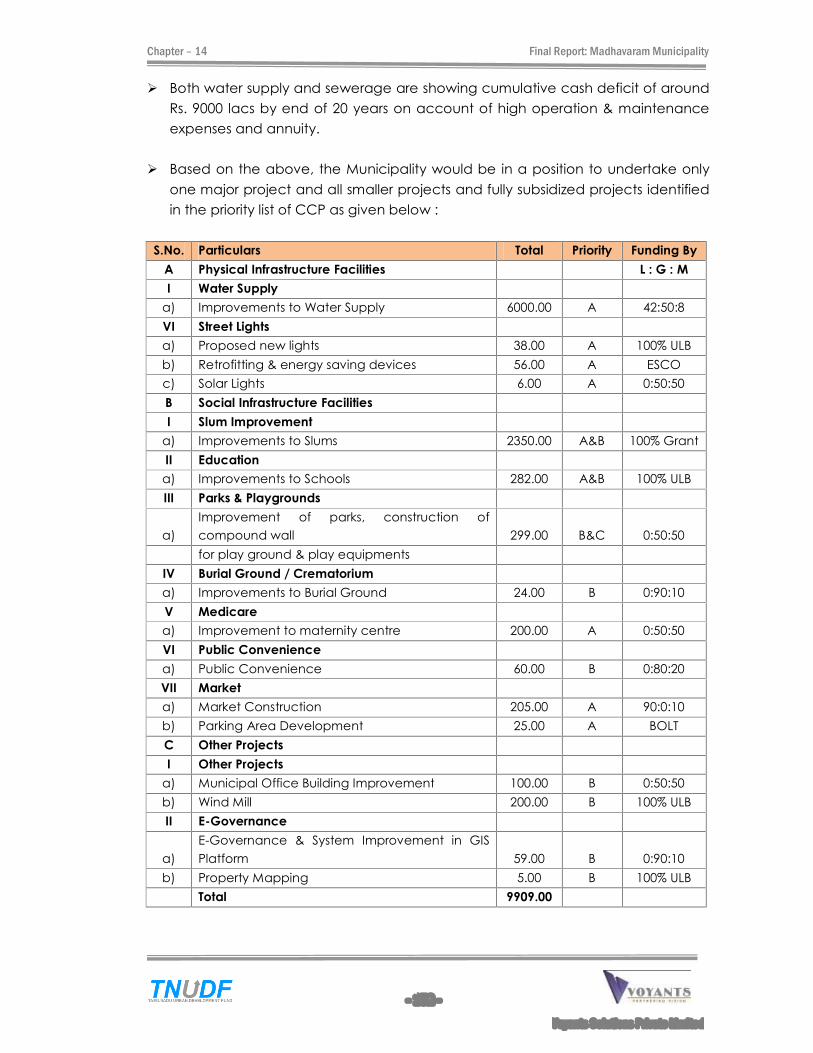
Chapter � 14 Final Report: Madhavaram Municipality
- 152 -
Voyants Solutions Private Limited
Both water supply and sewerage are showing cumulative cash deficit of around
Rs. 9000 lacs by end of 20 years on account of high operation & maintenance
expenses and annuity.
Based on the above, the Municipality would be in a position to undertake only
one major project and all smaller projects and fully subsidized projects identified
in the priority list of CCP as given below :
S.No. Particulars Total Priority Funding By
A Physical Infrastructure Facilities L : G : M
I Water Supply
a) Improvements to Water Supply 6000.00 A 42:50:8
VI Street Lights
a) Proposed new lights 38.00 A 100% ULB
b) Retrofitting & energy saving devices 56.00 A ESCO
c) Solar Lights 6.00 A 0:50:50
B Social Infrastructure Facilities
I Slum Improvement
a) Improvements to Slums 2350.00 A&B 100% Grant
II Education
a) Improvements to Schools 282.00 A&B 100% ULB
III Parks & Playgrounds
a)
Improvement of parks, construction of
compound wall 299.00 B&C 0:50:50
for play ground & play equipments
IV Burial Ground / Crematorium
a) Improvements to Burial Ground 24.00 B 0:90:10
V Medicare
a) Improvement to maternity centre 200.00 A 0:50:50
VI Public Convenience
a) Public Convenience 60.00 B 0:80:20
VII Market
a) Market Construction 205.00 A 90:0:10
b) Parking Area Development 25.00 A BOLT
C Other Projects
I Other Projects
a) Municipal Office Building Improvement 100.00 B 0:50:50
b) Wind Mill 200.00 B 100% ULB
II E-Governance
a)
E-Governance & System Improvement in GIS
Platform 59.00 B 0:90:10
b) Property Mapping 5.00 B 100% ULB
Total 9909.00
Chapter � 14 Final Report: Madhavaram Municipality
- 153 -
Voyants Solutions Private Limited
As regards other major projects like underground sewerage, storm water drains,
solid waste management and roads, more support would be required from the
Government towards major portion of capital cost.
Besides, the Municipality at present derives major source of income from
Assigned Revenue. The Municipality earns around Rs. 350 lacs per annum from
Assigned Revenue. Our financial projections are made on conservative basis by
considering only 50% of existing Assigned Revenue income for future years. But,
incase the Municipality continues to derive Assigned Revenue at the present
levels, more projects can be taken up.
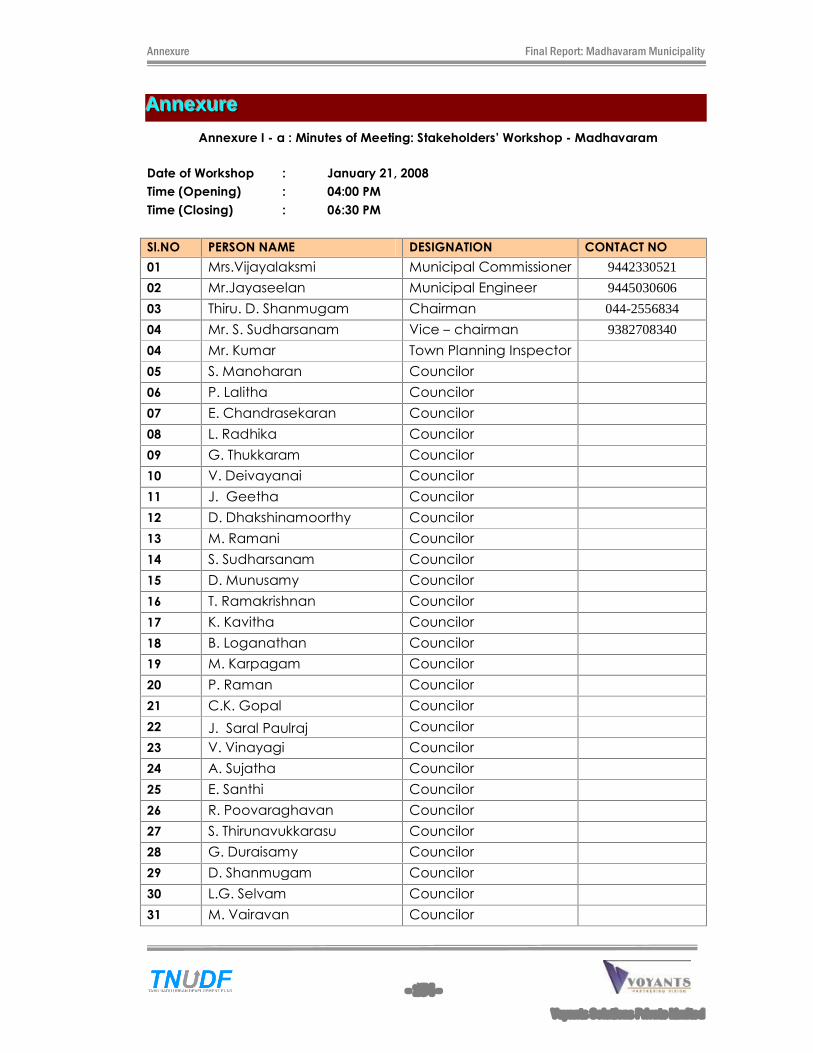
Annexure Final Report: Madhavaram Municipality
- 154 -
Voyants Solutions Private Limited
AAAnnnnnneeexxxuuurrreee
Annexure I - a : Minutes of Meeting: Stakeholders� Workshop - Madhavaram
Date of Workshop : January 21, 2008
Time (Opening) : 04:00 PM
Time (Closing) : 06:30 PM
Sl.NO PERSON NAME DESIGNATION CONTACT NO
01 Mrs.Vijayalaksmi Municipal Commissioner 9442330521
02 Mr.Jayaseelan Municipal Engineer 9445030606
03 Thiru. D. Shanmugam Chairman 044-2556834
04 Mr. S. Sudharsanam Vice � chairman 9382708340
04 Mr. Kumar Town Planning Inspector
05 S. Manoharan Councilor
06 P. Lalitha Councilor
07 E. Chandrasekaran Councilor
08 L. Radhika Councilor
09 G. Thukkaram Councilor
10 V. Deivayanai Councilor
11 J. Geetha Councilor
12 D. Dhakshinamoorthy Councilor
13 M. Ramani Councilor
14 S. Sudharsanam Councilor
15 D. Munusamy Councilor
16 T. Ramakrishnan Councilor
17 K. Kavitha Councilor
18 B. Loganathan Councilor
19 M. Karpagam Councilor
20 P. Raman Councilor
21 C.K. Gopal Councilor
22 J. Saral Paulraj Councilor
23 V. Vinayagi Councilor
24 A. Sujatha Councilor
25 E. Santhi Councilor
26 R. Poovaraghavan Councilor
27 S. Thirunavukkarasu Councilor
28 G. Duraisamy Councilor
29 D. Shanmugam Councilor
30 L.G. Selvam Councilor
31 M. Vairavan Councilor
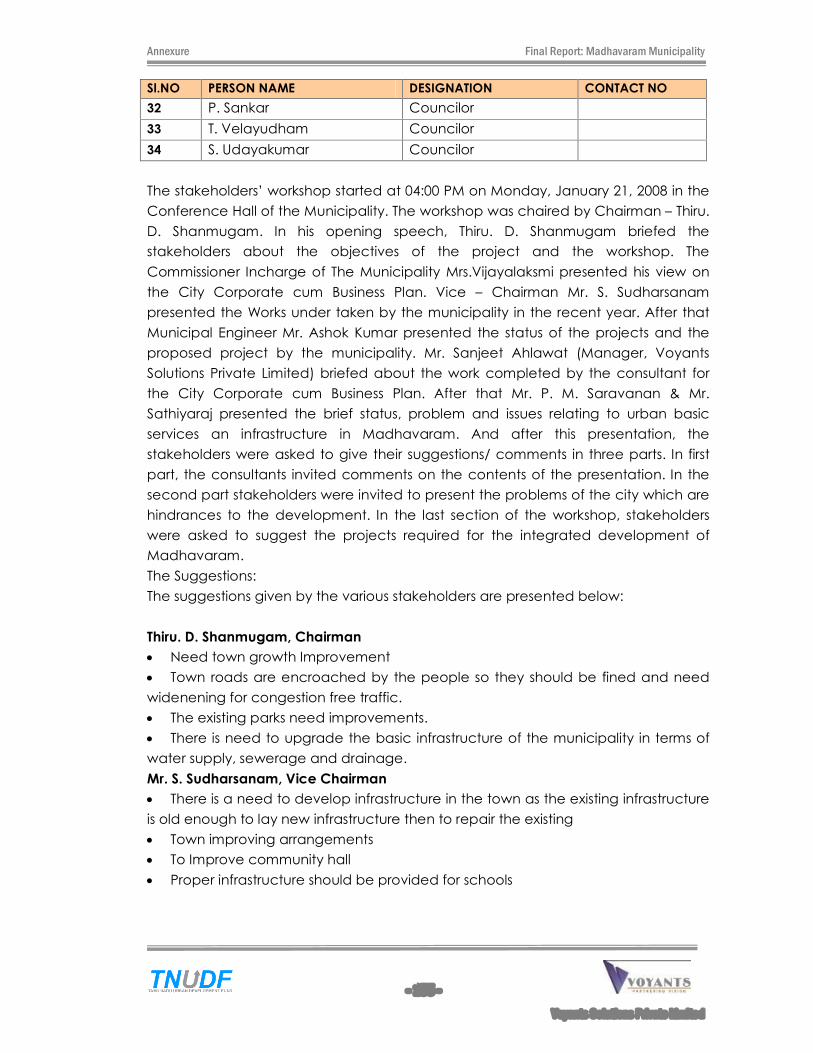
Annexure Final Report: Madhavaram Municipality
- 155 -
Voyants Solutions Private Limited
Sl.NO PERSON NAME DESIGNATION CONTACT NO
32 P. Sankar Councilor
33 T. Velayudham Councilor
34 S. Udayakumar Councilor
The stakeholders� workshop started at 04:00 PM on Monday, January 21, 2008 in the
Conference Hall of the Municipality. The workshop was chaired by Chairman � Thiru.
D. Shanmugam. In his opening speech, Thiru. D. Shanmugam briefed the
stakeholders about the objectives of the project and the workshop. The
Commissioner Incharge of The Municipality Mrs.Vijayalaksmi presented his view on
the City Corporate cum Business Plan. Vice � Chairman Mr. S. Sudharsanam
presented the Works under taken by the municipality in the recent year. After that
Municipal Engineer Mr. Ashok Kumar presented the status of the projects and the
proposed project by the municipality. Mr. Sanjeet Ahlawat (Manager, Voyants
Solutions Private Limited) briefed about the work completed by the consultant for
the City Corporate cum Business Plan. After that Mr. P. M. Saravanan & Mr.
Sathiyaraj presented the brief status, problem and issues relating to urban basic
services an infrastructure in Madhavaram. And after this presentation, the
stakeholders were asked to give their suggestions/ comments in three parts. In first
part, the consultants invited comments on the contents of the presentation. In the
second part stakeholders were invited to present the problems of the city which are
hindrances to the development. In the last section of the workshop, stakeholders
were asked to suggest the projects required for the integrated development of
Madhavaram.
The Suggestions:
The suggestions given by the various stakeholders are presented below:
Thiru. D. Shanmugam, Chairman
Need town growth Improvement
Town roads are encroached by the people so they should be fined and need
widenening for congestion free traffic.
The existing parks need improvements.
There is need to upgrade the basic infrastructure of the municipality in terms of
water supply, sewerage and drainage.
Mr. S. Sudharsanam, Vice Chairman
There is a need to develop infrastructure in the town as the existing infrastructure
is old enough to lay new infrastructure then to repair the existing
Town improving arrangements
To Improve community hall
Proper infrastructure should be provided for schools
Annexure Final Report: Madhavaram Municipality
- 156 -
Voyants Solutions Private Limited
Mrs.Vijayalaksmi, Commissioner Incharge
City needs delimitation of boundaries and need to merge the existing villages
and there is a need to prepare a master plan for the upcoming notified areas after
that to regularize the development
There is a need to replace the old infrastructure of the town.
Mr.Ashok Kumar, Municipal Engineer
Town need delimitation as there is no scope of development in the existing
municipal limits
Source of water supply are insufficient and there is a proposed scheme for water
supply from metro water
Town roads are encroached by the people so they should be fined and need
widening for congestion free traffic.
There is a need to develop the bus stand.
New parks and play grounds need to be developed.
Drainage services need to improve to make good use of Rain Water Harvesting.
Required CFE light to reduce the power consumption.
Mrs. V. Deivayanai Councillor, Ward No - 6
Required cement concrete road
Renovation of existing drainage at back of the government school
Improvement is required in all parks
Required desilting of open drains
Mrs. M. Ramani Councillor, Ward No �9
Toilet in bus stand is in poor condition
No seating arrangement in bus stand
Required bus bay and shelter in bus stand
Need water supply regularly
Mr. T. Ramakrishnan Councillor, Ward No - 12
Public toilet buildings need renovation
Required cement concrete road for all roads
Need Under ground drainage system
Need proper facilities to drain rain water
Mr. B. Loganathan Councillor, Ward No - 14
Need building and other facilities for municipal schools
Required regular water supply through house connection
Under ground sewage system
Mr. J. Saral Paulraj Councillor, Ward No - 18
Required drainage renovation
Street light poles are damaged
Improvement is required in all parks
Mrs. E. Santhi Councillor, Ward No - 21
Public toilets are required at some places
All the tube lights should be changed to sodium vapour light
Annexure Final Report: Madhavaram Municipality
- 157 -
Voyants Solutions Private Limited
No light and water supply arrangement in burial ground
Improvement in basic needs and infrastructure is required in bus stand
Required proper drainage for rain water
Mr. L.G. Selvam Councillor, Ward No � 26
Under ground drainage system is required
Pumping station is required at reserved area in teachers colony
Road improvement is required in all the wards
Required higher secondary and elementary school
Required noon-meals center
More street light facilities are required
Mr. M. Vairavan Councillor, Ward No - 27
Required under ground drainage
Required treated water from metro
Required storm water drainage system for all wards
Road widening is required
No road, burial shed and compound wall for burial ground in this ward
These are some of the suggestions provided by the key person of the municipality,
the major focus was to develop infrastructure in the town and it should be done is a
systematic way. The basic infrastructure should be provided to every people and
the nominal charges should be applied on the available so that the people can
pay it. After the discussion Chairman and municipal engineer thanked all the
councilors and key people who attend the discussion. The consultant distributed the
formats to each of the person present in the meeting to take individuals view and
priority of infrastructure development and to note down the suggestion and briefed
the survey format and after the stakeholders finished the filling of survey formats Mr.
Sathiyaraj thanked all the people attended the Stakeholders� Workshop
Annexure I - b: Minutes of Meeting: Stakeholders� Workshop - Madhavaram
Date of Workshop : November 20, 2008
Time (Opening) : 11:00 AM
Time (Closing) : 01:30 PM
Sl.NO PERSON NAME DESIGNATION CONTACT NO
01 Mrs.Vijayalaksmi Municipal Commissioner 9442330521
02 Mr.Jayaseelan Municipal Engineer 9445030606
03 Thiru. D. Shanmugam Chairman 044-2556834
04 Mr. S. Sudharsanam Vice � chairman 9382708340
05 Mr. Kumar Town Planning Inspector
06 S. Manoharan Councilor 9382811045
07 P. Lalitha Councilor 9940065329
08 E. Chandrasekaran Councilor
Annexure Final Report: Madhavaram Municipality
- 158 -
Voyants Solutions Private Limited
Sl.NO PERSON NAME DESIGNATION CONTACT NO
09 V. Deivayanai Councilor 9841912197
10 G. Thukkaram Councilor
11 J. Geetha Councilor 9940326282
12 D. Dhakshinamoorthy Councilor
13 D. Munusamy Councilor
14 T. Ramakrishnan Councilor
15 B. Loganathan Councilor
16 P. Raman Councilor 9840235538
17 C.K. Gopal Councilor
18 S. Ponraj President, Association
of Teachers colony 9444411198
18 Sp. Subananthan Treasurer, Association
of Teachers colony
19 A. Sujatha Councilor 9444120390
20 E. Santhi Councilor 9940363319
21 P. Gurumoorthy Civic Association
22 P. Ramaswamy Civic Association
23 G. Duraisamy Councilor
24 L.G. Selvam Councilor
25 M. Vairavan Councilor 25531414
26 P. Sankar Councilor 9841625253
27 T. Velayudham Councilor
28 S. Udayakumar Councilor
The stakeholders� workshop started at 11:00 AM on Thursday, November 20, 2008 in
the Conference Hall of the Municipality. The workshop was chaired by Chairman �
Thiru. D. Shanmugam. In his opening speech, Thiru. D. Shanmugam briefed the
stakeholders about the objectives of the project and the workshop. The Municipal
Engineer Mr. Jayseilan presented his view on the City Corporate cum Business Plan.
Vice � Chairman Mr. S. Sudharsanam presented the Works under taken by the
municipality in the recent year. Miss. G Gajalakshmi (Assist. Manager, Voyants
Solutions Private Limited) briefed about the work completed by the consultant for
the City Corporate cum Business Plan and the brief status, problem and issues
relating to urban basic services an infrastructure in Madhavaram. And after this
presentation, the stakeholders were asked to give their suggestions/ comments in
three parts. In first part, the consultants invited comments on the contents of the
presentation. In the second part stakeholders were invited to present the problems
of the city which are hindrances to the development. In the last section of the
workshop, stakeholders were asked to suggest the projects required for the
integrated development of Madhavaram. Other department Engineers and
Annexure Final Report: Madhavaram Municipality
- 159 -
Voyants Solutions Private Limited
managers have been called for giving any new and proposed projects required for
the development which are to be executed by other departments like PWD, TWAD
board and Traders.
The Suggestions:
The suggestions given by the various stakeholders are presented below:
Thiru. D. Shanmugam, Chairman
Need town growth Improvement
There is need to upgrade the basic infrastructure of the municipality in terms of
water supply, sewerage and drainage.
Mr. S. Sudharsanam, Vice Chairman
There is a need to develop infrastructure in the town as the existing infrastructure
is old enough to lay new infrastructure then to repair the existing
Town improving arrangements
To Improve bus stand
Proper infrastructure should be provided for schools
Mrs.Vijayalaksmi, Commissioner Incharge
City needs delimitation of boundaries and need to merge the existing villages
and there is a need to prepare a master plan for the upcoming notified areas after
that to regularize the development
Mr. Jayeseilan, Municipal Engineer
Source of water supply are insufficient and there is a proposed scheme for water
supply from metro water
Town roads are encroached by the people so they should be fined and need
widening for congestion free traffic.
Upgradation of bus stand is required.
New parks and play grounds need to be developed.
Kulam improvement is required for Rain Water Harvesting.
Required CFE light to reduce the power consumption.
Mrs.V. Deivayanai Councillor, Ward No - 6
Required cement concrete road
Renovation of existing drainage at back of the government school
Improvement is required in all parks
No seating arrangement in bus stand
Required bus bay and shelter in bus stand
Need water supply regularly
Mr.T. Ramakrishnan Councillor, Ward No - 12
Public toilet buildings need renovation
Required cement concrete road for all roads
Need Under ground drainage system
Need proper facilities to drain rain water
Mr.B. Loganathan Councillor, Ward No - 14
Need building and other facilities for municipal schools
Annexure Final Report: Madhavaram Municipality
- 160 -
Voyants Solutions Private Limited
Required regular water supply through house connection
Under ground sewage system
Mr.S. Ponraj, President, Teachers colony Association
Required drainage renovation
Street light poles are damaged
Improvement is required in all parks
Required Engineering college
Road divider is required
Mrs.E. Santhi Councillor, Ward No - 21
Public toilets are required at some places
All the tube lights should be changed to sodium vapour light
No light and water supply arrangement in burial ground
Improvement in basic needs and infrastructure is required in bus stand
Required proper drainage for rain water
Required polytechnic
Mrs.J. Geetha, Councillor, Ward No � 7
Under ground drainage system is required
Pumping station is required at reserved area in teachers colony
Road improvement is required in all the wards
Required higher secondary and elementary school
Required noon-meals center
More street light facilities are required
Mr.M. Vairavan Councillor, Ward No - 27
Required under ground drainage
Required treated water from metro
Required storm water drainage system for all wards
Road widening is required
No road, burial shed and compound wall for burial ground in this ward
Mrs.A. Sujatha Councillor, Ward No - 20
Medimix road widening
IT Industries are required at palpannai area where vacant land are available.
Road should be linked with railway lines.
Mr.S. Manoharan Councillor, Ward No � 1
Cable trench is required along the road sides.
Drinking water is having oil floating
Required National bank
Storm water drains should be desilted
Required treatment plant at Vattamani kulam
Kulam development is required for house constructions
These are some of the suggestions provided by the key person of the municipality,
the major focus was to develop infrastructure in the town and it should be done is a

Annexure Final Report: Madhavaram Municipality
- 161 -
Voyants Solutions Private Limited
systematic way. The basic infrastructure should be provided to every people and
the nominal charges should be applied on the available so that the people can
pay it. After the discussion with Chairman and municipal engineer thanked all the
councilors and key people who attend the discussion. The consultant distributed the
formats to each of the person present in the meeting to take individuals view/issues,
to know any required new or proposed projects for the development of
municipality, priority of infrastructure development and to note down the suggestion
and briefed the survey format and after the stakeholders finished the filling of survey
formats Miss. Gajalakshmi thanked all the peoples attended the Stakeholders�
Workshop.
Annexure I � c : Draft Memorandum Of Agreement
This Agreement is made on this ___________________ day of ____________
(Month), 2009 (year) between Tamil Nadu Urban Infrastructure Financial Services
Limited (referred to as TNUIFSL) and the Madhavaram Municipality (referred to as
ULB)
1. This agreement follows the completion of the City Corporate Plan cum
Business Plan (CCP-BP) prepared for the ULB with assistance from Grant Fund
managed by TNUIFSL. A Vision Plan exercise was conducted by the ULB to identify
specific projects required to be developed, and certain projects were identified in
the Vision Plan have been taken through the next steps in terms of preparation of
detailed project reports and implementation, there was a felt need among
stakeholders to draw a comprehensive CCP-BP, taking into account a holistic
perspective of the city/town�s current status and gaps. It was to address this need
that the CCP-BP exercise was conducted. The objectives of the CCP-BP exercise
were to:
Define the growth directions and service up-gradations in relation to the
activity mix / growth
Assess demand for projects specified by the ULBs and gap in services
Outline the infrastructure needs;
Define specific rehabilitation and capital improvement needs with regard to
priority city infrastructure in slums and other areas
Identify measures for revenue enhancement and cost reduction required to
sustain the proposed investments
Identify reforms required in local administration and service delivery and
policy interventions
List out changes required at the local level to improve O&M and better asset
management
Annexure Final Report: Madhavaram Municipality
- 162 -
Voyants Solutions Private Limited
2. The study will be completed in June 2009 and the municipal council
passed a resolution adopting the report for implementation on-------------- (Date).
3. This agreement is being entered into between TNUIFSL and the ULB for
TNUIFSL�s assistance in:
(a) Developing and financing projects identified as part of the Capital
Investment Program (CIP) of the CCP and
b) Monitoring the implementation of a reform agenda required to improve
municipal management and to carryout implementation of projects identified in a
sustainable manner.
4. The guide lines of this MOA are listed below:
i. The Madhavaram municipal council agrees to implement the reform
agenda as per the targets recommended in the CCP-BP report. A summary of the
reform agenda in terms of existing status and norms/targets is enclosed in Annexure
III. The reform agenda outlined focuses on those reforms are to be carried out at the
ULB level.
ii. The Madhavaram municipal council will provide a half-yearly update
report to TNUIFSL on the status of the implementation of the reform agenda. TNUIFSL
shall provide a standardised format for reporting this information.
iii. In case there is any delay in the implementation of the reforms agenda by
ULB due to circumstances beyond its control, the decision on the matter of
extension of time for the achievement of targets shall be fixed based on
consultations between TNUIFSL and the ULB
iv. TNUIFSL shall also assist the ULB in preparing DPRs for a set of projects jointly
identified by TNUIFSL and the ULB, based on the Capital Investment Plan (CIP),
prepared as part of the CCP-BP report.
vi. TNUIFSL would subsequently assist in structuring and financing projects
identified earlier through combination of Loan and Grants along with ULB own
funds. The sanction and disbursement of loans and grants from TNUIFSL shall be in
conformance with the lending policies and guidelines of Loan and Grant Funds
under its management and due appraisal of the ULB and the projects by TNUIFSL
5. The council agrees to the following points:
i. Issues presented in the project report and to agree to follow all directions of
CMA/GOTN/TNUIFSL towards execution of the project.
Annexure Final Report: Madhavaram Municipality
- 163 -
Voyants Solutions Private Limited
ii. Draw the loan part for the execution of the works and repay the loan with
the applicable interest
iii. Open a joint account with the Concerned Authority and agree to deposit
the ULB�s share every quarter (-- % of the cost of the tendered works), failing which
to abide by action of CMA/GOTN/ TNUIFSL
iv. Conform to the subsequent change, if any, in the loan-grant composition
made by GoTN
6. Undertake the following reforms during the financial year 2009-10 and to improve
during the loan period to achieve the target set for every year:
i. Listing of assets of the ULB and maximizing efficient use of the same,
revenue generation from municipal properties through improved collection of land
revenue /lease to at least of 90 per cent of demand.
ii. Listing of all trade activities and improving collection of trade license fee to
at least 90 per cent of demand.
iii. Revising water tariff as per the G.O------, identification/ regularization of un-
authorized water connections, improved collection of at least 80 per cent of water
tariff.
iv. Imposing solid waste management cess /fees
v. Increasing coverage with respect to property tax collection i.e. bringing
at least 90 per cent properties into the tax net, increasing collection efficiency
and ensuring arrear collection of at least 90 per cent of current demand for
property tax.
vi. Computerizing municipal systems and procedures
vii. Undertake public awareness through ward-level consultation meetings,
with NGO involvement, improving the image of the ULB and generating confidence
among citizens regarding the ability of the ULB to deliver quality services
ix. Acquire land, free from all encumbrances / encroachments, required for
all identified projects before project loan effectiveness
Annexure Final Report: Madhavaram Municipality
- 164 -
Voyants Solutions Private Limited
x. Solve all problems (like agitation) during construction activity and to ensure
timely completion of the work as per schedule
xi. Offer necessary co-operation/coordination with consultants, NGOs and
various other agencies involved in implementation of the project
xii. Undertake full responsibility, in respect of civil works, for quality assurance
and joint measurement of completed works and to assure full co-operation and co-
ordination and to agree to all pre-qualification requirements and bidding
procedures of World Bank and to impose penalty, if any, from the first bill itself;
xiii. Undertake that no variation order without citing reasons for variation as
well as working out the time and financial implications, will be issued subsequent to
tendering without prior approval of TNUIFSL
xiv. Carryout the all the directions of CMA/GoTN/TNUIFSL.
Finally, the Council agrees to bind itself to these terms, which would form part of
future agreement with GoTN/TNUIFSL, and further resolve to authorize the
Commissioner/Chief Executive Officer to take necessary action to get the above
mentioned infrastructure facilities to this town. The Council further agrees to
authorize the Commissioner and Chairman to sign the loan agreement with TNUIFSL.
SIGNATORIES:
Place:
Date:
Managing Director and CEO, TNUIFSL
Chairman, ULB Council
Commissioner, ULB
Annexure Final Report: Madhavaram Municipality
- 165 -
Voyants Solutions Private Limited
Annexure I � d : Minutes of Meeting
Minutes of Meeting on Revised Draft Final Report submitted by M/s Voyants Solution
Pvt. Ltd. for City Corporate Plan cum Business Plan study for Cluster V covering Arcot,
Gudiyatham, Ranipet, Tirupattur, Vaniyambadi and Walajapet, Municipalities held
on 23.6.2009 and for Ambur, Arakonam Arani, Thiruvathipuram and Madhavaram
Municipalities held on 24.06.2009 at the office of TNUIFSL.
Members Present � List enclosed
The consultants were requested to address the following:
1. To correct the grade of the ULBs as revised by the Government.
2. To highlight the requirement of capital / revenue grant to implement and
operate all the new schemes.
3. To indicate following in the executive summary of the report
c) List of projects under the sustainable scenario along with the year wise
phasing of the projects identified.
d) The assumption made on the means of finance.
Town specific comments
Ranipet
The consultants were requested to
Address the requirement of staff quarters and indicate the same as a project
in CIP in consultation with the ULB.
Update the details on the Bus Stand project at Muthukadai adjoining Pinji
Lake in consultation with the ULB.
Highlight the impact on discharge of polluted water in to Palar river.
Thiruvathipuram
The consultants were requested to
Update the details on the assets in consultation with the ULB.
Revise the Bus Stand improvement project in consultation with the ULB
Annexure Final Report: Madhavaram Municipality
- 166 -
Voyants Solutions Private Limited
Madhavaram
The consultants were requested to revise the assumptions on means of
finance in accordance with JNNURM norms and revise the FOP
accordingly.
The consultants were requested to address the above points and include in final
report. The revised draft final reports for CCCBP are approved.
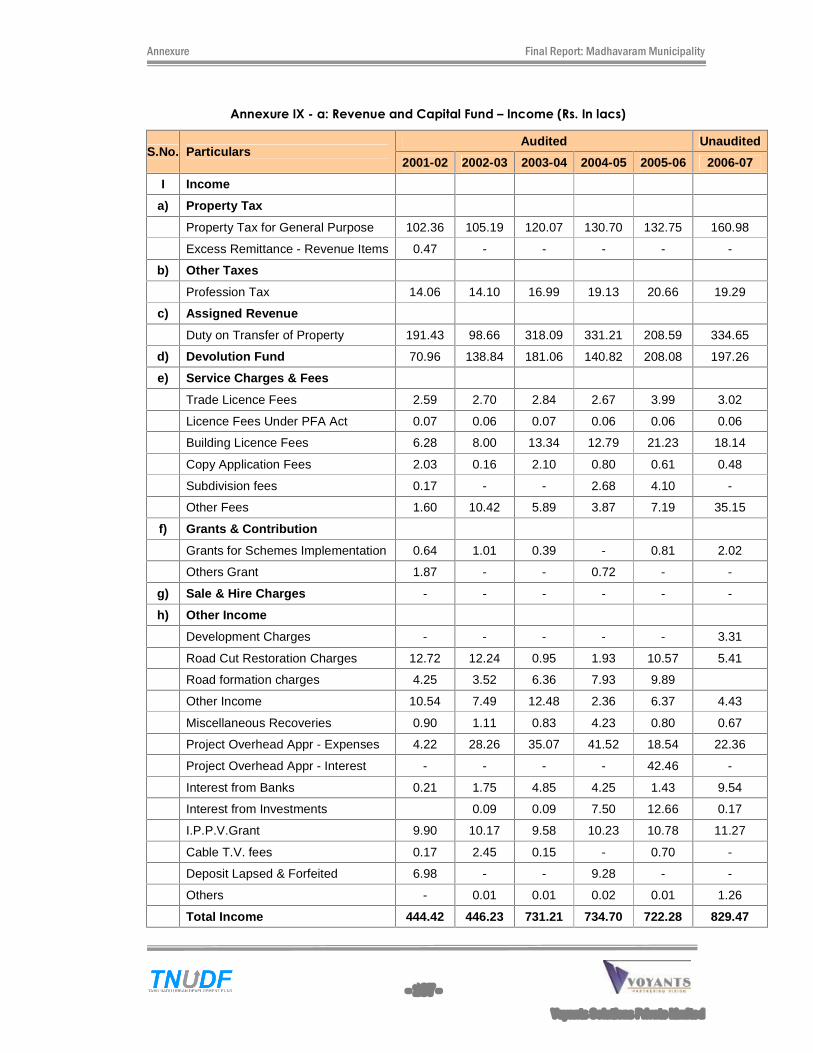
Annexure Final Report: Madhavaram Municipality
- 167 -
Voyants Solutions Private Limited
Annexure IX - a: Revenue and Capital Fund � Income (Rs. In lacs)
S.No. Particulars Audited Unaudited
2001-02 2002-03 2003-04 2004-05 2005-06 2006-07
I Income
a) Property Tax
Property Tax for General Purpose 102.36 105.19 120.07 130.70 132.75 160.98
Excess Remittance - Revenue Items 0.47 - - - - -
b) Other Taxes
Profession Tax 14.06 14.10 16.99 19.13 20.66 19.29
c) Assigned Revenue
Duty on Transfer of Property 191.43 98.66 318.09 331.21 208.59 334.65
d) Devolution Fund 70.96 138.84 181.06 140.82 208.08 197.26
e) Service Charges & Fees
Trade Licence Fees 2.59 2.70 2.84 2.67 3.99 3.02
Licence Fees Under PFA Act 0.07 0.06 0.07 0.06 0.06 0.06
Building Licence Fees 6.28 8.00 13.34 12.79 21.23 18.14
Copy Application Fees 2.03 0.16 2.10 0.80 0.61 0.48
Subdivision fees 0.17 - - 2.68 4.10 -
Other Fees 1.60 10.42 5.89 3.87 7.19 35.15
f) Grants & Contribution
Grants for Schemes Implementation 0.64 1.01 0.39 - 0.81 2.02
Others Grant 1.87 - - 0.72 - -
g) Sale & Hire Charges - - - - - -
h) Other Income
Development Charges - - - - - 3.31
Road Cut Restoration Charges 12.72 12.24 0.95 1.93 10.57 5.41
Road formation charges 4.25 3.52 6.36 7.93 9.89
Other Income 10.54 7.49 12.48 2.36 6.37 4.43
Miscellaneous Recoveries 0.90 1.11 0.83 4.23 0.80 0.67
Project Overhead Appr - Expenses 4.22 28.26 35.07 41.52 18.54 22.36
Project Overhead Appr - Interest - - - - 42.46 -
Interest from Banks 0.21 1.75 4.85 4.25 1.43 9.54
Interest from Investments 0.09 0.09 7.50 12.66 0.17
I.P.P.V.Grant 9.90 10.17 9.58 10.23 10.78 11.27
Cable T.V. fees 0.17 2.45 0.15 - 0.70 -
Deposit Lapsed & Forfeited 6.98 - - 9.28 - -
Others - 0.01 0.01 0.02 0.01 1.26
Total Income 444.42 446.23 731.21 734.70 722.28 829.47
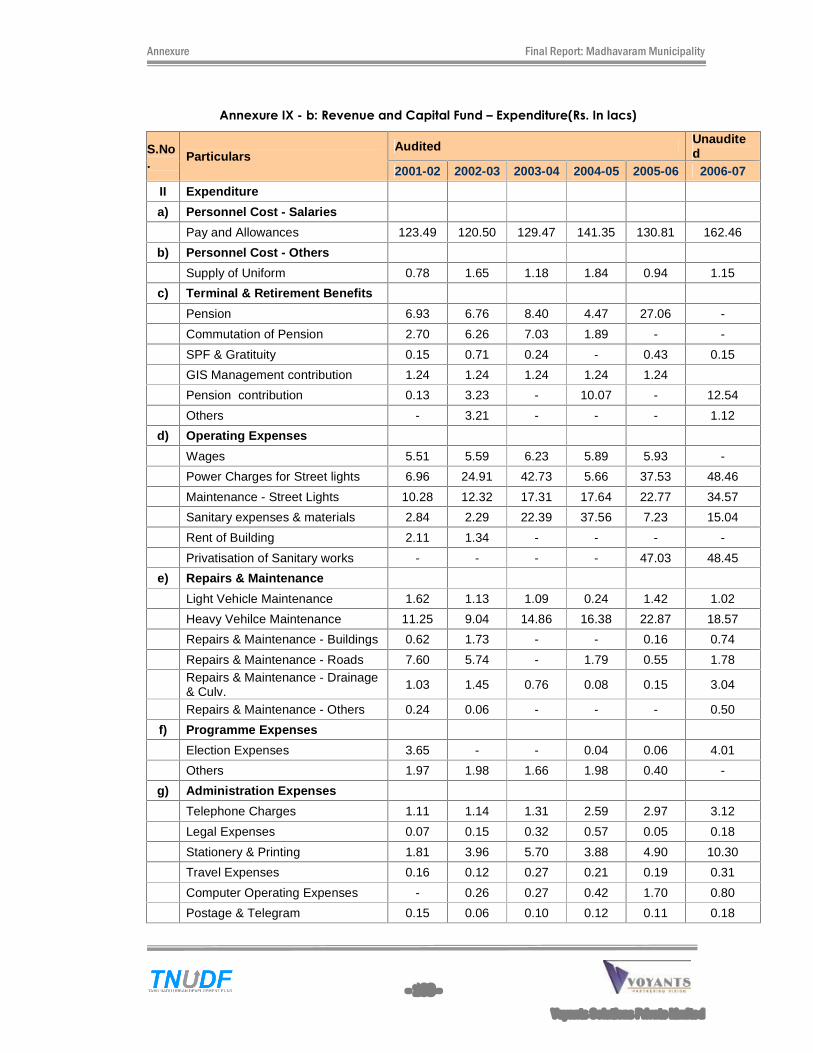
Annexure Final Report: Madhavaram Municipality
- 168 -
Voyants Solutions Private Limited
Annexure IX - b: Revenue and Capital Fund � Expenditure(Rs. In lacs)
S.No. Particulars
Audited Unaudited
2001-02 2002-03 2003-04 2004-05 2005-06 2006-07
II Expenditure
a) Personnel Cost - Salaries
Pay and Allowances 123.49 120.50 129.47 141.35 130.81 162.46
b) Personnel Cost - Others
Supply of Uniform 0.78 1.65 1.18 1.84 0.94 1.15
c) Terminal & Retirement Benefits
Pension 6.93 6.76 8.40 4.47 27.06 -
Commutation of Pension 2.70 6.26 7.03 1.89 - -
SPF & Gratituity 0.15 0.71 0.24 - 0.43 0.15
GIS Management contribution 1.24 1.24 1.24 1.24 1.24
Pension contribution 0.13 3.23 - 10.07 - 12.54
Others - 3.21 - - - 1.12
d) Operating Expenses
Wages 5.51 5.59 6.23 5.89 5.93 -
Power Charges for Street lights 6.96 24.91 42.73 5.66 37.53 48.46
Maintenance - Street Lights 10.28 12.32 17.31 17.64 22.77 34.57
Sanitary expenses & materials 2.84 2.29 22.39 37.56 7.23 15.04
Rent of Building 2.11 1.34 - - - -
Privatisation of Sanitary works - - - - 47.03 48.45
e) Repairs & Maintenance
Light Vehicle Maintenance 1.62 1.13 1.09 0.24 1.42 1.02
Heavy Vehilce Maintenance 11.25 9.04 14.86 16.38 22.87 18.57
Repairs & Maintenance - Buildings 0.62 1.73 - - 0.16 0.74
Repairs & Maintenance - Roads 7.60 5.74 - 1.79 0.55 1.78
Repairs & Maintenance - Drainage & Culv. 1.03 1.45 0.76 0.08 0.15 3.04
Repairs & Maintenance - Others 0.24 0.06 - - - 0.50
f) Programme Expenses
Election Expenses 3.65 - - 0.04 0.06 4.01
Others 1.97 1.98 1.66 1.98 0.40 -
g) Administration Expenses
Telephone Charges 1.11 1.14 1.31 2.59 2.97 3.12
Legal Expenses 0.07 0.15 0.32 0.57 0.05 0.18
Stationery & Printing 1.81 3.96 5.70 3.88 4.90 10.30
Travel Expenses 0.16 0.12 0.27 0.21 0.19 0.31
Computer Operating Expenses - 0.26 0.27 0.42 1.70 0.80
Postage & Telegram 0.15 0.06 0.10 0.12 0.11 0.18

Annexure Final Report: Madhavaram Municipality
- 169 -
Voyants Solutions Private Limited
S.No. Particulars
Audited Unaudited
2001-02 2002-03 2003-04 2004-05 2005-06 2006-07
Advertisement 0.09 0.50 0.80 0.93 2.63 0.55
Electricity - Office Building 1.15 - - 0.53 0.65 0.55
Contributions 3.66 0.75 1.16 7.48 0.96 0.90
Sitting Fees for Councillors 1.08 1.08 0.99 1.08 0.96 0.90
Others 0.52 1.85 0.90 0.89 1.24 2.22
h) Finance Expenses
Provision for Doubtfull collection 5.88 4.87 3.13 5.39 0.67 8.79
Interest on Loans / Ways Means Adv / OD 29.68 39.89 26.93 20.15 25.22 32.13
Irrecoverable Revenue Items - Written off - 32.50 16.87 5.10 - -
Audit Fees 0.32 0.31 0.65 0.62 0.65 0.65
Others 0.30 0.34 0.23 0.22 3.05 1.43
I) Depreciation 123.68 136.41 128.05 243.17 407.61 303.69
Total Expenses 360.76 435.33 442.27 541.47 760.14 720.30
Surplus / (Deficit) for the year 83.66 10.90 288.94 193.23 (37.86) 109.17
Annexure IX - c: Water Supply and Drainage Fund(Rs. In lacs)
S.No. Particulars Audited Unaudit
ed 2001-
02 2002-03 2003-04
2004-05 2005-06 2006-07
I Income
a) Property Tax
Water Supply & Drainage Tax 33.51 34.64 38.65 45.75 43.31 53.66
Excess Remittance 0.16 - - - - -
b) Service Charges & Fees
Initial amount for WSNSC 3.95 0.25 0.05 - 3.45 4.05
Income for giving new water connections - - - - - 1.18
c) Other Income
Other Income - - - - 0.06 0.19
Project Overhead Appr - Expenses 2.94 1.12 1.81 0.55 5.59 15.39
Interest from Banks & Investment - 0.10 0.15 3.29 0.06 0.23
Total Income 40.56 36.11 40.66 49.59 52.47 74.70
II Expenditure
a) Personnel Salaries Cost
Pay and Allowances 2.24 2.46 5.06 - 6.23 7.06
b) Operating Expenses
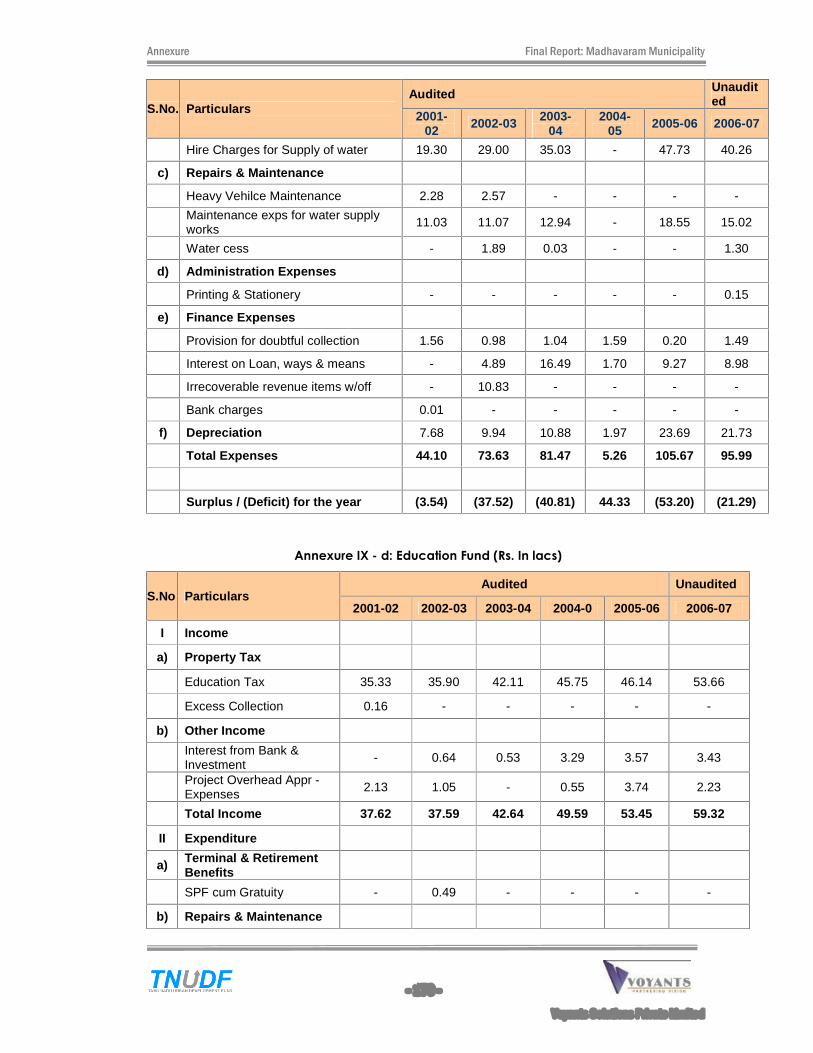
Annexure Final Report: Madhavaram Municipality
- 170 -
Voyants Solutions Private Limited
S.No. Particulars Audited Unaudit
ed 2001-
02 2002-03 2003-04
2004-05 2005-06 2006-07
Hire Charges for Supply of water 19.30 29.00 35.03 - 47.73 40.26
c) Repairs & Maintenance
Heavy Vehilce Maintenance 2.28 2.57 - - - -
Maintenance exps for water supply works 11.03 11.07 12.94 - 18.55 15.02
Water cess - 1.89 0.03 - - 1.30
d) Administration Expenses
Printing & Stationery - - - - - 0.15
e) Finance Expenses
Provision for doubtful collection 1.56 0.98 1.04 1.59 0.20 1.49
Interest on Loan, ways & means - 4.89 16.49 1.70 9.27 8.98
Irrecoverable revenue items w/off - 10.83 - - - -
Bank charges 0.01 - - - - -
f) Depreciation 7.68 9.94 10.88 1.97 23.69 21.73
Total Expenses 44.10 73.63 81.47 5.26 105.67 95.99
Surplus / (Deficit) for the year (3.54) (37.52) (40.81) 44.33 (53.20) (21.29)
Annexure IX - d: Education Fund (Rs. In lacs)
S.No Particulars Audited Unaudited
2001-02 2002-03 2003-04 2004-0 2005-06 2006-07
I Income
a) Property Tax
Education Tax 35.33 35.90 42.11 45.75 46.14 53.66
Excess Collection 0.16 - - - - -
b) Other Income
Interest from Bank & Investment - 0.64 0.53 3.29 3.57 3.43
Project Overhead Appr - Expenses 2.13 1.05 - 0.55 3.74 2.23
Total Income 37.62 37.59 42.64 49.59 53.45 59.32
II Expenditure
a) Terminal & Retirement Benefits
SPF cum Gratuity - 0.49 - - - -
b) Repairs & Maintenance
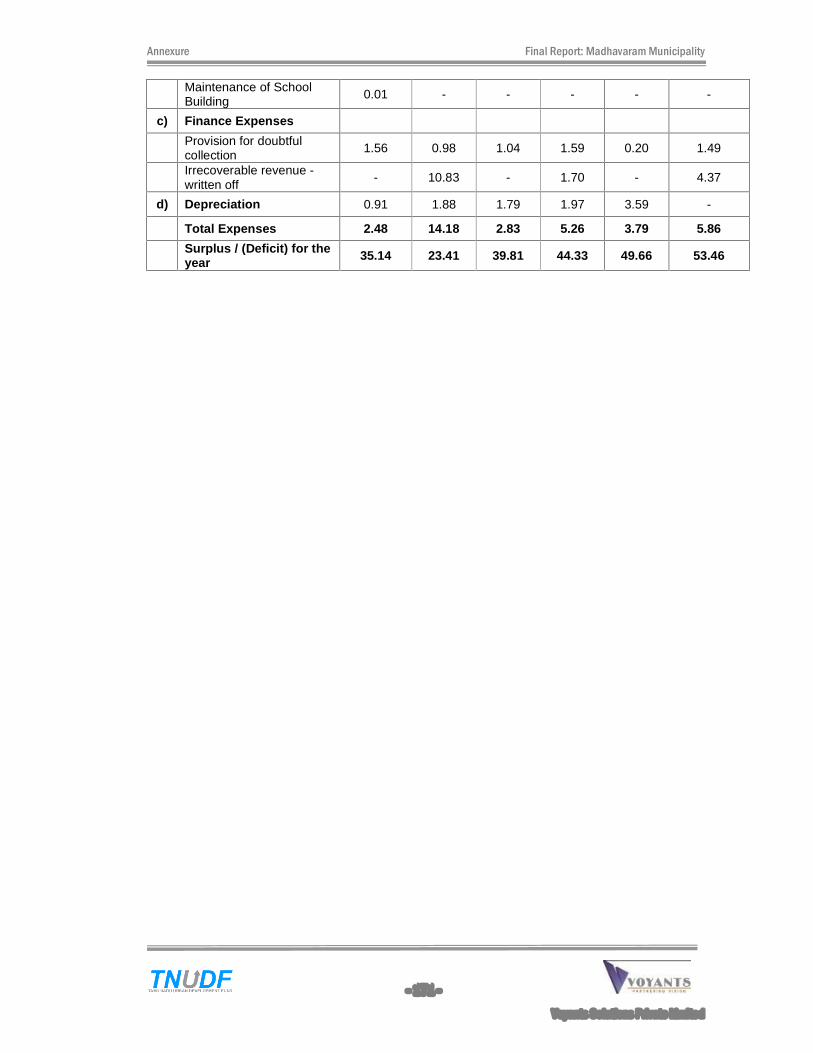
Annexure Final Report: Madhavaram Municipality
- 171 -
Voyants Solutions Private Limited
Maintenance of School Building 0.01 - - - - -
c) Finance Expenses
Provision for doubtful collection 1.56 0.98 1.04 1.59 0.20 1.49
Irrecoverable revenue - written off
- 10.83 - 1.70 - 4.37
d) Depreciation 0.91 1.88 1.79 1.97 3.59 -
Total Expenses 2.48 14.18 2.83 5.26 3.79 5.86
Surplus / (Deficit) for the year 35.14 23.41 39.81 44.33 49.66 53.46
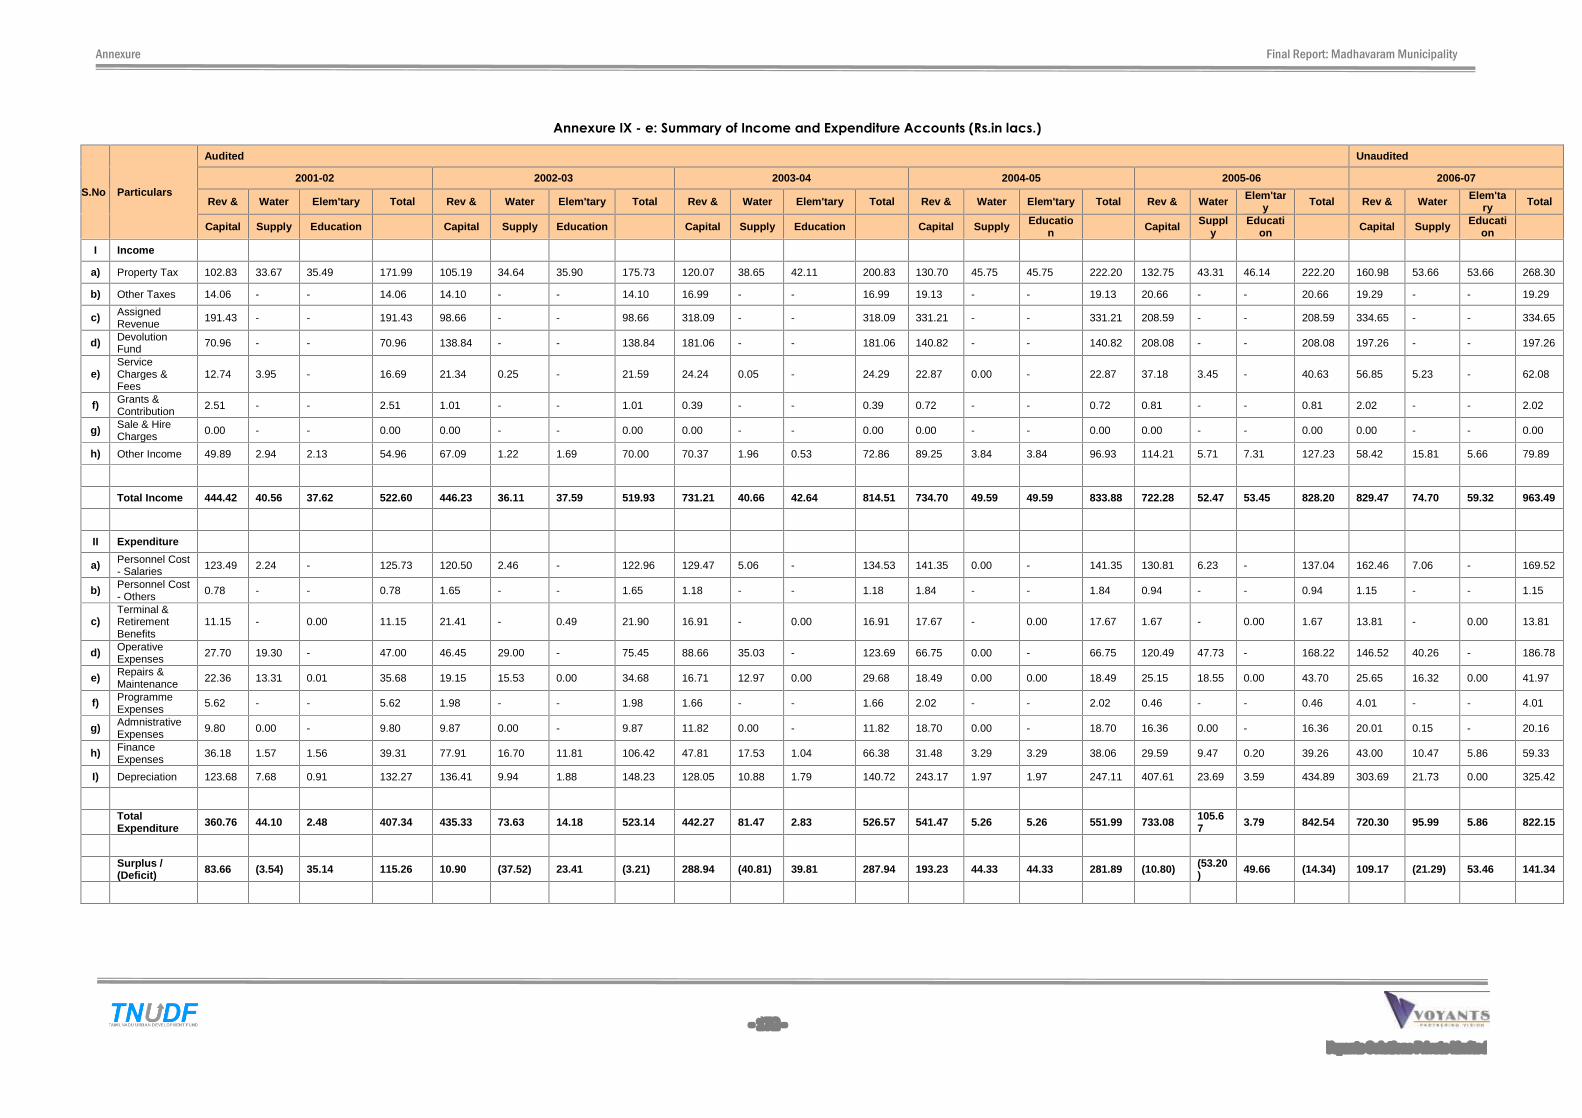
Annexure Final Report: Madhavaram Municipality
- 172 -
Voyants Solutions Private Limited
Annexure IX - e: Summary of Income and Expenditure Accounts (Rs.in lacs.)
S.No
Particulars
Audited Unaudited
2001-02 2002-03 2003-04 2004-05 2005-06 2006-07
Rev & Water Elem'tary Total Rev & Water Elem'tary Total Rev & Water Elem'tary Total Rev & Water Elem'tary Total Rev & Water Elem'tary Total Rev & Water Elem'ta
ry Total
Capital Supply Education Capital Supply Education Capital Supply Education Capital Supply Education Capital Suppl
y Educati
on Capital Supply Education
I Income
a) Property Tax 102.83 33.67 35.49 171.99 105.19 34.64 35.90 175.73 120.07 38.65 42.11 200.83 130.70 45.75 45.75 222.20 132.75 43.31 46.14 222.20 160.98 53.66 53.66 268.30
b) Other Taxes 14.06 - - 14.06 14.10 - - 14.10 16.99 - - 16.99 19.13 - - 19.13 20.66 - - 20.66 19.29 - - 19.29
c) Assigned Revenue
191.43 - - 191.43 98.66 - - 98.66 318.09 - - 318.09 331.21 - - 331.21 208.59 - - 208.59 334.65 - - 334.65
d) Devolution Fund 70.96 - - 70.96 138.84 - - 138.84 181.06 - - 181.06 140.82 - - 140.82 208.08 - - 208.08 197.26 - - 197.26
e) Service Charges & Fees
12.74 3.95 - 16.69 21.34 0.25 - 21.59 24.24 0.05 - 24.29 22.87 0.00 - 22.87 37.18 3.45 - 40.63 56.85 5.23 - 62.08
f) Grants & Contribution 2.51 - - 2.51 1.01 - - 1.01 0.39 - - 0.39 0.72 - - 0.72 0.81 - - 0.81 2.02 - - 2.02
g) Sale & Hire Charges 0.00 - - 0.00 0.00 - - 0.00 0.00 - - 0.00 0.00 - - 0.00 0.00 - - 0.00 0.00 - - 0.00
h) Other Income 49.89 2.94 2.13 54.96 67.09 1.22 1.69 70.00 70.37 1.96 0.53 72.86 89.25 3.84 3.84 96.93 114.21 5.71 7.31 127.23 58.42 15.81 5.66 79.89
Total Income 444.42 40.56 37.62 522.60 446.23 36.11 37.59 519.93 731.21 40.66 42.64 814.51 734.70 49.59 49.59 833.88 722.28 52.47 53.45 828.20 829.47 74.70 59.32 963.49
II Expenditure
a) Personnel Cost - Salaries 123.49 2.24 - 125.73 120.50 2.46 - 122.96 129.47 5.06 - 134.53 141.35 0.00 - 141.35 130.81 6.23 - 137.04 162.46 7.06 - 169.52
b) Personnel Cost - Others 0.78 - - 0.78 1.65 - - 1.65 1.18 - - 1.18 1.84 - - 1.84 0.94 - - 0.94 1.15 - - 1.15
c) Terminal & Retirement Benefits
11.15 - 0.00 11.15 21.41 - 0.49 21.90 16.91 - 0.00 16.91 17.67 - 0.00 17.67 1.67 - 0.00 1.67 13.81 - 0.00 13.81
d) Operative Expenses
27.70 19.30 - 47.00 46.45 29.00 - 75.45 88.66 35.03 - 123.69 66.75 0.00 - 66.75 120.49 47.73 - 168.22 146.52 40.26 - 186.78
e) Repairs & Maintenance 22.36 13.31 0.01 35.68 19.15 15.53 0.00 34.68 16.71 12.97 0.00 29.68 18.49 0.00 0.00 18.49 25.15 18.55 0.00 43.70 25.65 16.32 0.00 41.97
f) Programme Expenses
5.62 - - 5.62 1.98 - - 1.98 1.66 - - 1.66 2.02 - - 2.02 0.46 - - 0.46 4.01 - - 4.01
g) Admnistrative Expenses 9.80 0.00 - 9.80 9.87 0.00 - 9.87 11.82 0.00 - 11.82 18.70 0.00 - 18.70 16.36 0.00 - 16.36 20.01 0.15 - 20.16
h) Finance Expenses
36.18 1.57 1.56 39.31 77.91 16.70 11.81 106.42 47.81 17.53 1.04 66.38 31.48 3.29 3.29 38.06 29.59 9.47 0.20 39.26 43.00 10.47 5.86 59.33
I) Depreciation 123.68 7.68 0.91 132.27 136.41 9.94 1.88 148.23 128.05 10.88 1.79 140.72 243.17 1.97 1.97 247.11 407.61 23.69 3.59 434.89 303.69 21.73 0.00 325.42
Total Expenditure 360.76 44.10 2.48 407.34 435.33 73.63 14.18 523.14 442.27 81.47 2.83 526.57 541.47 5.26 5.26 551.99 733.08 105.6
7 3.79 842.54 720.30 95.99 5.86 822.15
Surplus / (Deficit) 83.66 (3.54) 35.14 115.26 10.90 (37.52) 23.41 (3.21) 288.94 (40.81) 39.81 287.94 193.23 44.33 44.33 281.89 (10.80) (53.20
) 49.66 (14.34) 109.17 (21.29) 53.46 141.34

Annexure Final Report: Madhavaram Municipality
- 173 -
Voyants Solutions Private Limited
Annexure IX - f: Summary of Income and Expenditure Accounts in Percentage (Rs. In lacs)
S.No
Particulars
Audited Unaudited
2001-02 2002-03 2003-04 2004-05 2005-06 2006-07
Rev & Capital
Water Supply
Elem'tary Education
Total
Rev & Capital
Water Supply
Elem'tary Education
Total
Rev & Capital
Water Supply
Elem'tary Education
Total
Rev & Capital
Water Supply
Elem'tary Education
Total
Rev & Capital
Water Supply
Elem'tary Education
Total
Rev & Capital
Water Supply
Elem'tary Education
Total
I Income (% of Total Income)
a) Property Tax 23% 83% 94% 33% 24% 96% 96% 34% 16% 95% 99% 25% 18% 92% 92% 27% 18% 83% 86% 27% 19% 72% 90% 28%
b) Other Taxes 3% - - 3% 3% - - 3% 2% - - 2% 3% - - 2% 3% - - 2% 2% - - 2%
c) Assigned Revenue 43% - - 37% 22% - - 19% 44% - - 39% 45% - - 40% 29% - - 25% 40% - - 35%
d) Devolution Fund 16% - - 14% 31% - - 27% 25% - - 22% 19% - - 17% 29% - - 25% 24% - - 20%
e) Service Charges & Fees 3% 10% - 3% 5% 1% - 4% 3% 0% - 3% 3% 0% - 3% 5% 7% - 5% 7% 7% - 6%
f) Grants & Contribution 1% - - 0% 0% - - 0% 0% - - 0% 0% - - 0% 0% - - 0% 0% - - 0%
g) Sale & Hire Charges 0% - - 0% 0% - - 0% 0% - - 0% 0% - - 0% 0% - - 0% 0% - - 0%
h) Other Income 11% 7% 6% 11% 15% 3% 4% 13% 10% 5% 1% 9% 12% 8% 8% 12% 16% 11% 14% 15% 7% 21% 10% 8%
Total Income 100% 100% 100% 100% 100% 100% 100% 100% 100% 100% 100% 100% 100% 100% 100% 100% 100% 100% 100% 100% 100% 100% 100% 100%
II Expenditure (% of Total Expt)
a) Personnel Cost � Salaries 34% 5% - 31% 28% 3% - 24% 29% 6% - 26% 26% 0% - 26% 18% 6% - 16% 23% 7% - 21%
b) Personnel Cost � Others 0% - - 0% 0% - - 0% 0% - - 0% 0% - - 0% 0% - - 0% 0% - - 0%
c) Terminal & Retirement Benefits 3% - 0% 3% 5% - 3% 4% 4% - 0% 3% 3% - 0% 3% 0% - 0% 0% 2% - 0% 2%
d) Operative Expenses 8% 44% - 12% 11% 39% - 14% 20% 43% - 23% 12% 0% - 12% 16% 45% - 20% 20% 42% - 23%
e) Repairs & Maintenance 6% 30% 0% 9% 4% 21% 0% 7% 4% 16% 0% 6% 3% 0% 0% 3% 3% 18% 0% 5% 4% 17% 0% 5%
f) Programme Expenses 2% - - 1% 0% - - 0% 0% - - 0% 0% - - 0% 0% - - 0% 1% - - 0%
g) Admnistrative Expenses 3% 0% - 2% 2% 0% - 2% 3% 0% - 2% 3% 0% - 3% 2% 0% - 2% 3% 0% - 2%
h) Finance Expenses 10% 4% 63% 10% 18% 23% 83% 20% 11% 22% 37% 13% 6% 63% 63% 7% 4% 9% 5% 5% 6% 11% 100% 7%
I) Depreciation 34% 17% 37% 32% 31% 13% 13% 28% 29% 13% 63% 27% 45% 37% 37% 45% 56% 22% 95% 52% 42% 23% 0% 40%
Total Expenditure 100% 100% 100% 100% 100% 100% 100% 100% 100% 100% 100% 100% 100% 100% 100% 100% 100% 100% 100% 100% 100% 100% 100% 100%
Surplus / (Deficit) (% of Total Income) 19% -9% 93% 22% 2% -104% 62% -1% 40% -100% 93% 35% 26% 89% 89% 34% -1% -101% 93% -2% 13% -29% 90% 15%
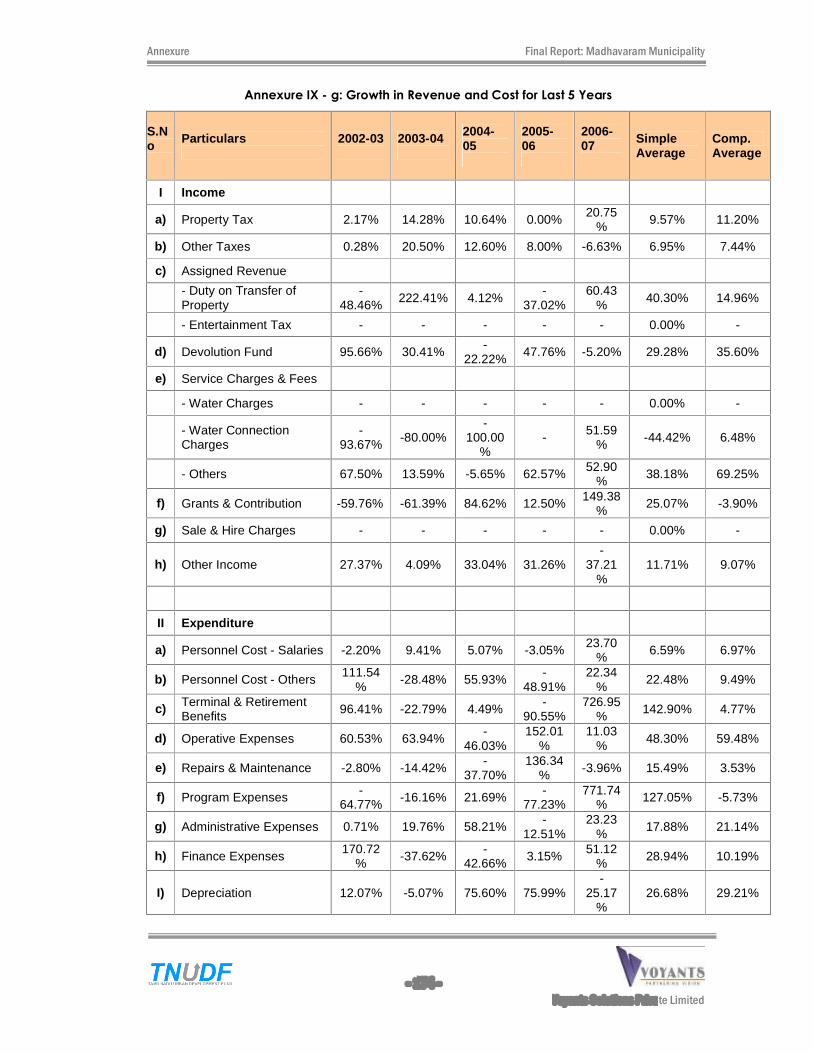
Annexure Final Report: Madhavaram Municipality
- 174 -
Voyants Solutions Private Limited
Annexure IX - g: Growth in Revenue and Cost for Last 5 Years
S.No
Particulars
2002-03
2003-04
2004-05
2005-06
2006-07
Simple Average
Comp. Average
I Income
a) Property Tax 2.17% 14.28% 10.64% 0.00% 20.75% 9.57% 11.20%
b) Other Taxes 0.28% 20.50% 12.60% 8.00% -6.63% 6.95% 7.44%
c) Assigned Revenue
- Duty on Transfer of Property
-48.46% 222.41% 4.12%
-37.02%
60.43% 40.30% 14.96%
- Entertainment Tax - - - - - 0.00% -
d) Devolution Fund 95.66% 30.41% -22.22% 47.76% -5.20% 29.28% 35.60%
e) Service Charges & Fees
- Water Charges - - - - - 0.00% -
- Water Connection Charges
-93.67% -80.00%
-100.00
% - 51.59
% -44.42% 6.48%
- Others 67.50% 13.59% -5.65% 62.57% 52.90% 38.18% 69.25%
f) Grants & Contribution -59.76% -61.39% 84.62% 12.50% 149.38% 25.07% -3.90%
g) Sale & Hire Charges - - - - - 0.00% -
h) Other Income 27.37% 4.09% 33.04% 31.26% -
37.21%
11.71% 9.07%
II Expenditure
a) Personnel Cost - Salaries -2.20% 9.41% 5.07% -3.05% 23.70% 6.59% 6.97%
b) Personnel Cost - Others 111.54%
-28.48% 55.93% -48.91%
22.34%
22.48% 9.49%
c) Terminal & Retirement Benefits 96.41% -22.79% 4.49% -
90.55% 726.95
% 142.90% 4.77%
d) Operative Expenses 60.53% 63.94% -
46.03% 152.01
% 11.03
% 48.30% 59.48%
e) Repairs & Maintenance -2.80% -14.42% -37.70%
136.34% -3.96% 15.49% 3.53%
f) Program Expenses -64.77% -16.16% 21.69% -
77.23% 771.74
% 127.05% -5.73%
g) Administrative Expenses 0.71% 19.76% 58.21% -12.51%
23.23%
17.88% 21.14%
h) Finance Expenses 170.72% -37.62% -
42.66% 3.15% 51.12% 28.94% 10.19%
I) Depreciation 12.07% -5.07% 75.60% 75.99% -
25.17%
26.68% 29.21%
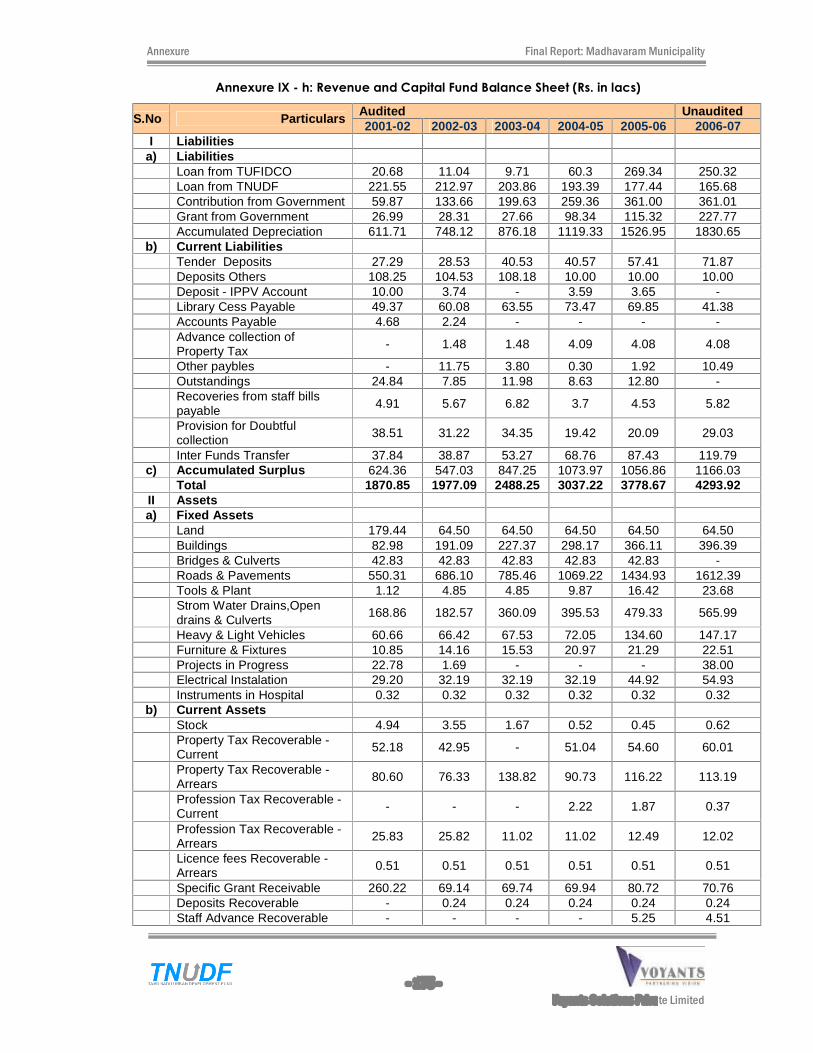
Annexure Final Report: Madhavaram Municipality
- 175 -
Voyants Solutions Private Limited
Annexure IX - h: Revenue and Capital Fund Balance Sheet (Rs. in lacs)
S.No Particulars Audited Unaudited 2001-02 2002-03 2003-04 2004-05 2005-06 2006-07
I Liabilities a) Liabilities Loan from TUFIDCO 20.68 11.04 9.71 60.3 269.34 250.32 Loan from TNUDF 221.55 212.97 203.86 193.39 177.44 165.68 Contribution from Government 59.87 133.66 199.63 259.36 361.00 361.01 Grant from Government 26.99 28.31 27.66 98.34 115.32 227.77 Accumulated Depreciation 611.71 748.12 876.18 1119.33 1526.95 1830.65
b) Current Liabilities Tender Deposits 27.29 28.53 40.53 40.57 57.41 71.87 Deposits Others 108.25 104.53 108.18 10.00 10.00 10.00 Deposit - IPPV Account 10.00 3.74 - 3.59 3.65 - Library Cess Payable 49.37 60.08 63.55 73.47 69.85 41.38 Accounts Payable 4.68 2.24 - - - -
Advance collection of Property Tax - 1.48 1.48 4.09 4.08 4.08
Other paybles - 11.75 3.80 0.30 1.92 10.49 Outstandings 24.84 7.85 11.98 8.63 12.80 -
Recoveries from staff bills payable 4.91 5.67 6.82 3.7 4.53 5.82
Provision for Doubtful collection 38.51 31.22 34.35 19.42 20.09 29.03
Inter Funds Transfer 37.84 38.87 53.27 68.76 87.43 119.79 c) Accumulated Surplus 624.36 547.03 847.25 1073.97 1056.86 1166.03 Total 1870.85 1977.09 2488.25 3037.22 3778.67 4293.92 II Assets a) Fixed Assets Land 179.44 64.50 64.50 64.50 64.50 64.50 Buildings 82.98 191.09 227.37 298.17 366.11 396.39 Bridges & Culverts 42.83 42.83 42.83 42.83 42.83 - Roads & Pavements 550.31 686.10 785.46 1069.22 1434.93 1612.39 Tools & Plant 1.12 4.85 4.85 9.87 16.42 23.68
Strom Water Drains,Open drains & Culverts
168.86 182.57 360.09 395.53 479.33 565.99
Heavy & Light Vehicles 60.66 66.42 67.53 72.05 134.60 147.17 Furniture & Fixtures 10.85 14.16 15.53 20.97 21.29 22.51 Projects in Progress 22.78 1.69 - - - 38.00 Electrical Instalation 29.20 32.19 32.19 32.19 44.92 54.93 Instruments in Hospital 0.32 0.32 0.32 0.32 0.32 0.32
b) Current Assets Stock 4.94 3.55 1.67 0.52 0.45 0.62
Property Tax Recoverable - Current 52.18 42.95 - 51.04 54.60 60.01
Property Tax Recoverable - Arrears 80.60 76.33 138.82 90.73 116.22 113.19
Profession Tax Recoverable - Current - - - 2.22 1.87 0.37
Profession Tax Recoverable - Arrears 25.83 25.82 11.02 11.02 12.49 12.02
Licence fees Recoverable - Arrears 0.51 0.51 0.51 0.51 0.51 0.51
Specific Grant Receivable 260.22 69.14 69.74 69.94 80.72 70.76 Deposits Recoverable - 0.24 0.24 0.24 0.24 0.24 Staff Advance Recoverable - - - - 5.25 4.51
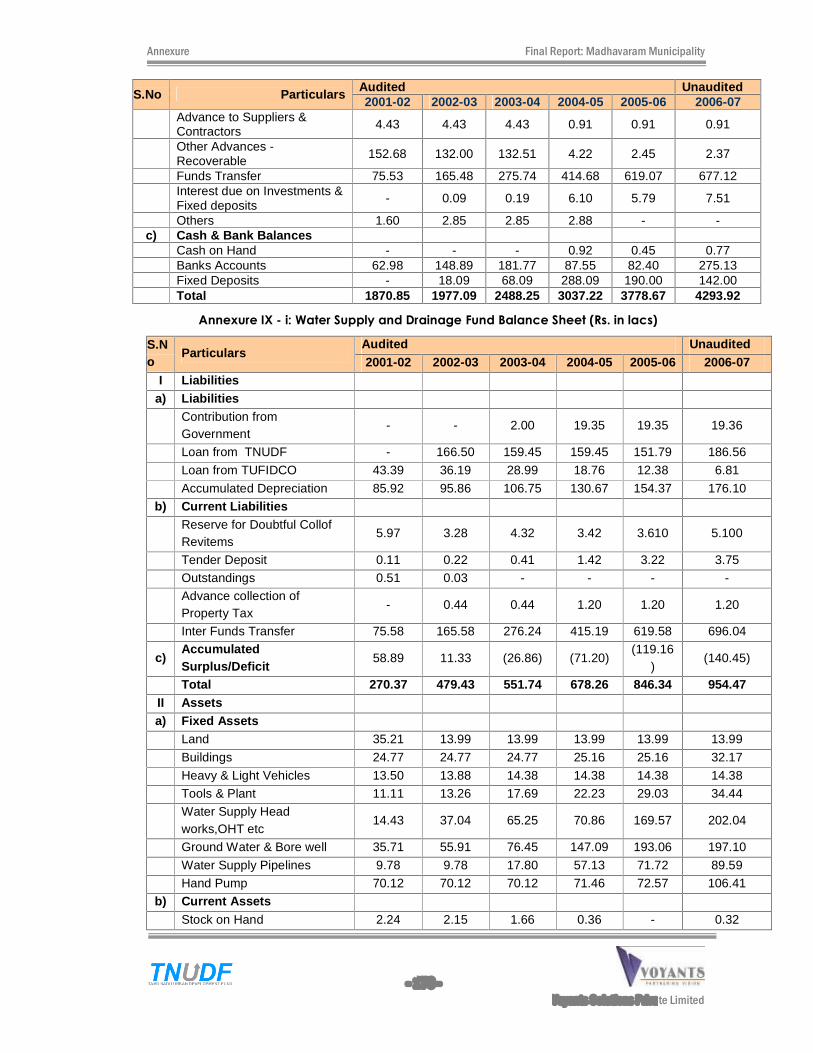
Annexure Final Report: Madhavaram Municipality
- 176 -
Voyants Solutions Private Limited
S.No Particulars Audited Unaudited 2001-02 2002-03 2003-04 2004-05 2005-06 2006-07
Advance to Suppliers & Contractors 4.43 4.43 4.43 0.91 0.91 0.91
Other Advances - Recoverable 152.68 132.00 132.51 4.22 2.45 2.37
Funds Transfer 75.53 165.48 275.74 414.68 619.07 677.12
Interest due on Investments & Fixed deposits
- 0.09 0.19 6.10 5.79 7.51
Others 1.60 2.85 2.85 2.88 - - c) Cash & Bank Balances Cash on Hand - - - 0.92 0.45 0.77 Banks Accounts 62.98 148.89 181.77 87.55 82.40 275.13 Fixed Deposits - 18.09 68.09 288.09 190.00 142.00 Total 1870.85 1977.09 2488.25 3037.22 3778.67 4293.92
Annexure IX - i: Water Supply and Drainage Fund Balance Sheet (Rs. in lacs)
S.No
Particulars Audited Unaudited 2001-02 2002-03 2003-04 2004-05 2005-06 2006-07
I Liabilities a) Liabilities
Contribution from Government
- - 2.00 19.35 19.35 19.36
Loan from TNUDF - 166.50 159.45 159.45 151.79 186.56
Loan from TUFIDCO 43.39 36.19 28.99 18.76 12.38 6.81
Accumulated Depreciation 85.92 95.86 106.75 130.67 154.37 176.10
b) Current Liabilities
Reserve for Doubtful Collof Revitems
5.97 3.28 4.32 3.42 3.610 5.100
Tender Deposit 0.11 0.22 0.41 1.42 3.22 3.75 Outstandings 0.51 0.03 - - - -
Advance collection of Property Tax
- 0.44 0.44 1.20 1.20 1.20
Inter Funds Transfer 75.58 165.58 276.24 415.19 619.58 696.04
c) Accumulated Surplus/Deficit
58.89 11.33 (26.86) (71.20) (119.16
) (140.45)
Total 270.37 479.43 551.74 678.26 846.34 954.47 II Assets a) Fixed Assets
Land 35.21 13.99 13.99 13.99 13.99 13.99
Buildings 24.77 24.77 24.77 25.16 25.16 32.17
Heavy & Light Vehicles 13.50 13.88 14.38 14.38 14.38 14.38 Tools & Plant 11.11 13.26 17.69 22.23 29.03 34.44
Water Supply Head works,OHT etc
14.43 37.04 65.25 70.86 169.57 202.04
Ground Water & Bore well 35.71 55.91 76.45 147.09 193.06 197.10
Water Supply Pipelines 9.78 9.78 17.80 57.13 71.72 89.59
Hand Pump 70.12 70.12 70.12 71.46 72.57 106.41
b) Current Assets
Stock on Hand 2.24 2.15 1.66 0.36 - 0.32
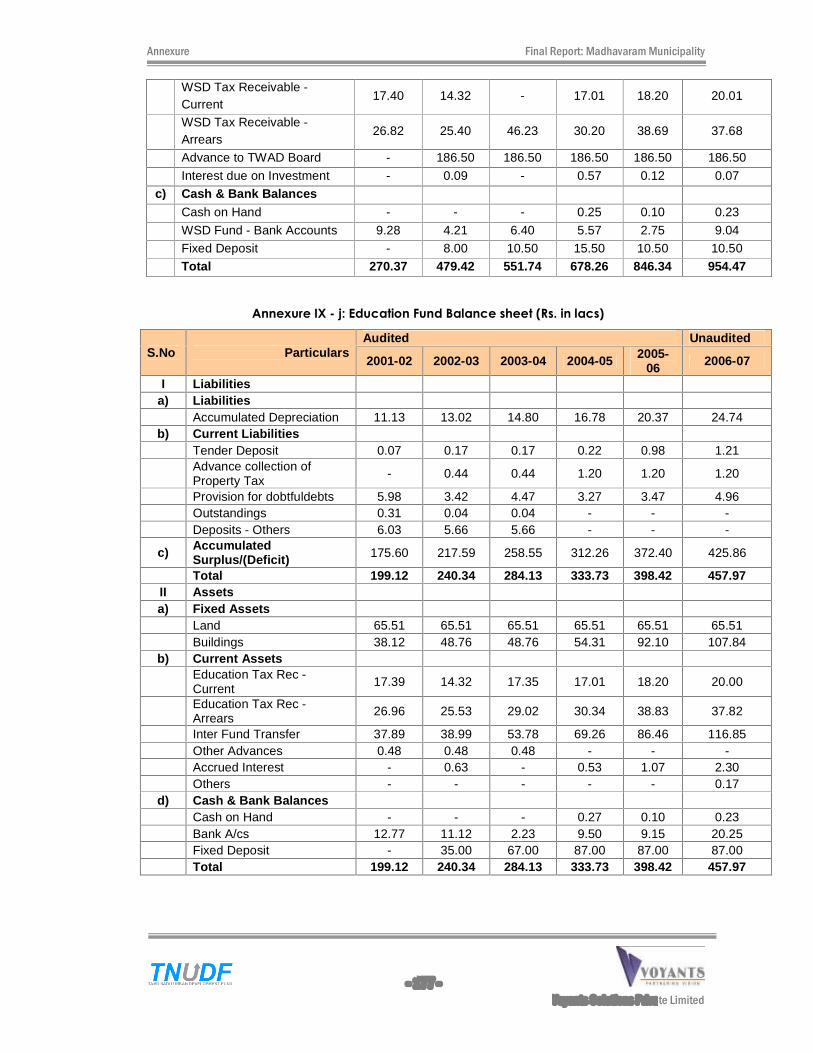
Annexure Final Report: Madhavaram Municipality
- 177 -
Voyants Solutions Private Limited
WSD Tax Receivable - Current
17.40 14.32 - 17.01 18.20 20.01
WSD Tax Receivable - Arrears
26.82 25.40 46.23 30.20 38.69 37.68
Advance to TWAD Board - 186.50 186.50 186.50 186.50 186.50
Interest due on Investment - 0.09 - 0.57 0.12 0.07
c) Cash & Bank Balances
Cash on Hand - - - 0.25 0.10 0.23
WSD Fund - Bank Accounts 9.28 4.21 6.40 5.57 2.75 9.04 Fixed Deposit - 8.00 10.50 15.50 10.50 10.50
Total 270.37 479.42 551.74 678.26 846.34 954.47
Annexure IX - j: Education Fund Balance sheet (Rs. in lacs)
S.No Particulars Audited Unaudited
2001-02 2002-03 2003-04 2004-05 2005-06 2006-07
I Liabilities a) Liabilities Accumulated Depreciation 11.13 13.02 14.80 16.78 20.37 24.74
b) Current Liabilities Tender Deposit 0.07 0.17 0.17 0.22 0.98 1.21
Advance collection of Property Tax
- 0.44 0.44 1.20 1.20 1.20
Provision for dobtfuldebts 5.98 3.42 4.47 3.27 3.47 4.96 Outstandings 0.31 0.04 0.04 - - - Deposits - Others 6.03 5.66 5.66 - - -
c) Accumulated Surplus/(Deficit) 175.60 217.59 258.55 312.26 372.40 425.86
Total 199.12 240.34 284.13 333.73 398.42 457.97 II Assets a) Fixed Assets Land 65.51 65.51 65.51 65.51 65.51 65.51 Buildings 38.12 48.76 48.76 54.31 92.10 107.84
b) Current Assets
Education Tax Rec - Current 17.39 14.32 17.35 17.01 18.20 20.00
Education Tax Rec - Arrears 26.96 25.53 29.02 30.34 38.83 37.82
Inter Fund Transfer 37.89 38.99 53.78 69.26 86.46 116.85 Other Advances 0.48 0.48 0.48 - - - Accrued Interest - 0.63 - 0.53 1.07 2.30 Others - - - - - 0.17
d) Cash & Bank Balances Cash on Hand - - - 0.27 0.10 0.23 Bank A/cs 12.77 11.12 2.23 9.50 9.15 20.25 Fixed Deposit - 35.00 67.00 87.00 87.00 87.00 Total 199.12 240.34 284.13 333.73 398.42 457.97
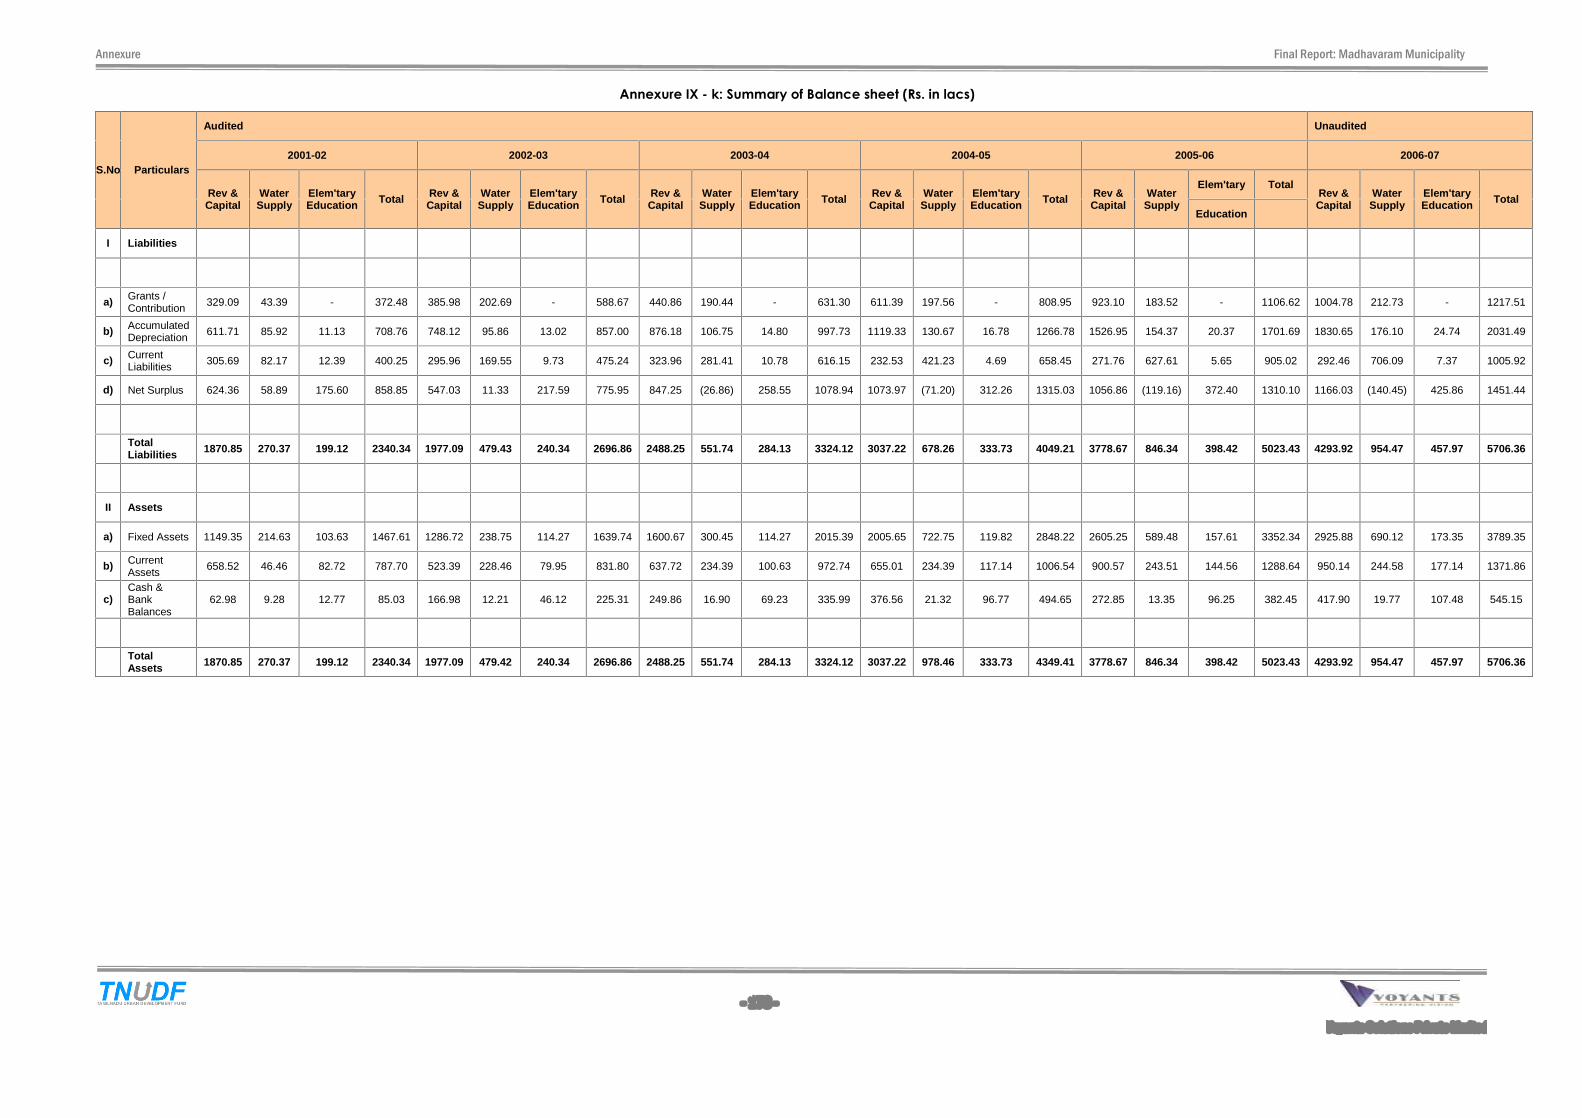
Annexure Final Report: Madhavaram Municipality
- 178 -
Voyants Solutions Private Limited
Annexure IX - k: Summary of Balance sheet (Rs. in lacs)
S.No Particulars
Audited Unaudited
2001-02 2002-03 2003-04 2004-05 2005-06 2006-07
Rev & Capital
Water Supply
Elem'tary Education Total Rev &
Capital Water Supply
Elem'tary Education Total Rev &
Capital Water Supply
Elem'tary Education Total Rev &
Capital Water Supply
Elem'tary Education Total Rev &
Capital Water Supply
Elem'tary Total Rev & Capital
Water Supply
Elem'tary Education Total
Education
I Liabilities
a) Grants / Contribution 329.09 43.39 - 372.48 385.98 202.69 - 588.67 440.86 190.44 - 631.30 611.39 197.56 - 808.95 923.10 183.52 - 1106.62 1004.78 212.73 - 1217.51
b) Accumulated Depreciation 611.71 85.92 11.13 708.76 748.12 95.86 13.02 857.00 876.18 106.75 14.80 997.73 1119.33 130.67 16.78 1266.78 1526.95 154.37 20.37 1701.69 1830.65 176.10 24.74 2031.49
c) Current Liabilities 305.69 82.17 12.39 400.25 295.96 169.55 9.73 475.24 323.96 281.41 10.78 616.15 232.53 421.23 4.69 658.45 271.76 627.61 5.65 905.02 292.46 706.09 7.37 1005.92
d) Net Surplus 624.36 58.89 175.60 858.85 547.03 11.33 217.59 775.95 847.25 (26.86) 258.55 1078.94 1073.97 (71.20) 312.26 1315.03 1056.86 (119.16) 372.40 1310.10 1166.03 (140.45) 425.86 1451.44
Total Liabilities 1870.85 270.37 199.12 2340.34 1977.09 479.43 240.34 2696.86 2488.25 551.74 284.13 3324.12 3037.22 678.26 333.73 4049.21 3778.67 846.34 398.42 5023.43 4293.92 954.47 457.97 5706.36
II Assets
a) Fixed Assets 1149.35 214.63 103.63 1467.61 1286.72 238.75 114.27 1639.74 1600.67 300.45 114.27 2015.39 2005.65 722.75 119.82 2848.22 2605.25 589.48 157.61 3352.34 2925.88 690.12 173.35 3789.35
b) Current Assets
658.52 46.46 82.72 787.70 523.39 228.46 79.95 831.80 637.72 234.39 100.63 972.74 655.01 234.39 117.14 1006.54 900.57 243.51 144.56 1288.64 950.14 244.58 177.14 1371.86
c) Cash & Bank Balances
62.98 9.28 12.77 85.03 166.98 12.21 46.12 225.31 249.86 16.90 69.23 335.99 376.56 21.32 96.77 494.65 272.85 13.35 96.25 382.45 417.90 19.77 107.48 545.15
Total Assets 1870.85 270.37 199.12 2340.34 1977.09 479.42 240.34 2696.86 2488.25 551.74 284.13 3324.12 3037.22 978.46 333.73 4349.41 3778.67 846.34 398.42 5023.43 4293.92 954.47 457.97 5706.36
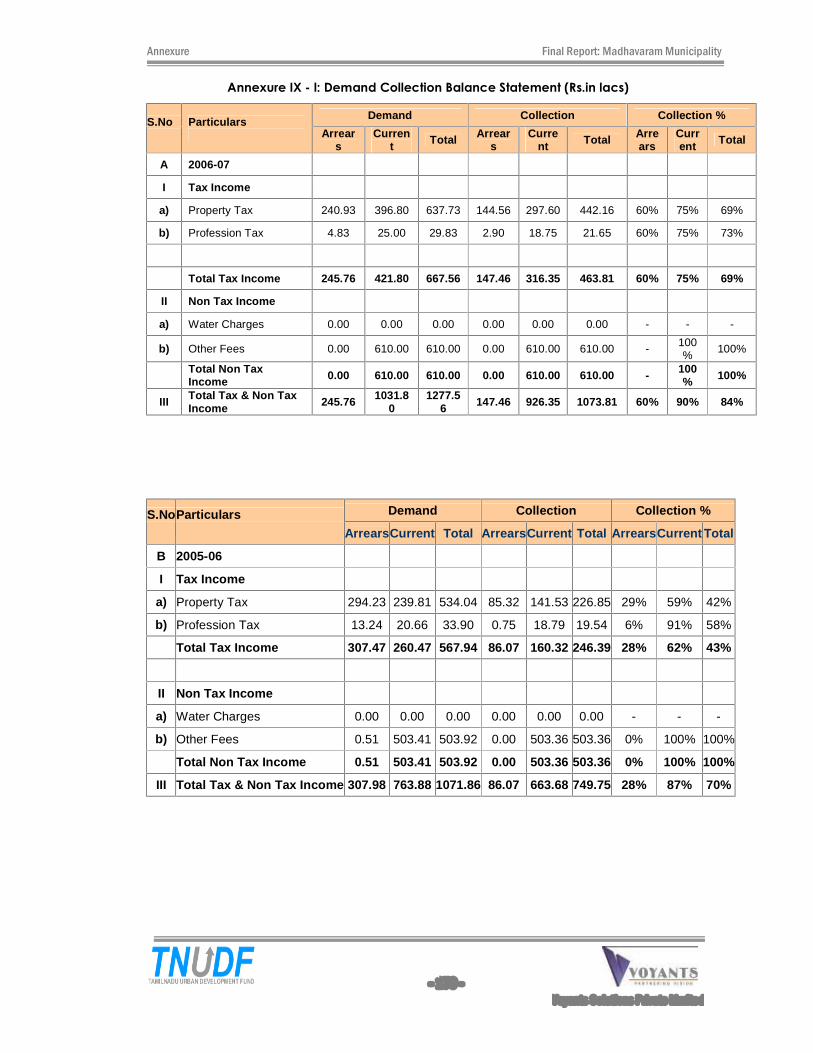
Annexure Final Report: Madhavaram Municipality
- 179 -
Voyants Solutions Private Limited
Annexure IX - l: Demand Collection Balance Statement (Rs.in lacs)
S.No
Particulars
Demand Collection Collection %
Arrears
Current Total Arrear
s Curre
nt Total Arrears
Current Total
A 2006-07
I Tax Income
a) Property Tax 240.93 396.80 637.73 144.56 297.60 442.16 60% 75% 69%
b) Profession Tax 4.83 25.00 29.83 2.90 18.75 21.65 60% 75% 73%
Total Tax Income 245.76 421.80 667.56 147.46 316.35 463.81 60% 75% 69%
II Non Tax Income
a) Water Charges 0.00 0.00 0.00 0.00 0.00 0.00 - - -
b) Other Fees 0.00 610.00 610.00 0.00 610.00 610.00 - 100%
100%
Total Non Tax Income 0.00 610.00 610.00 0.00 610.00 610.00 - 100
% 100%
III Total Tax & Non Tax Income 245.76 1031.8
0 1277.5
6 147.46 926.35 1073.81 60% 90% 84%
S.No
Particulars
Demand Collection Collection %
ArrearsCurrent Total ArrearsCurrent Total ArrearsCurrent Total
B 2005-06
I Tax Income
a) Property Tax 294.23 239.81 534.04 85.32 141.53 226.85 29% 59% 42%
b) Profession Tax 13.24 20.66 33.90 0.75 18.79 19.54 6% 91% 58%
Total Tax Income 307.47 260.47 567.94 86.07 160.32 246.39 28% 62% 43%
II Non Tax Income
a) Water Charges 0.00 0.00 0.00 0.00 0.00 0.00 - - -
b) Other Fees 0.51 503.41 503.92 0.00 503.36 503.36 0% 100% 100%
Total Non Tax Income 0.51 503.41 503.92 0.00 503.36 503.36 0% 100% 100%
III Total Tax & Non Tax Income 307.98 763.88 1071.86 86.07 663.68 749.75 28% 87% 70%
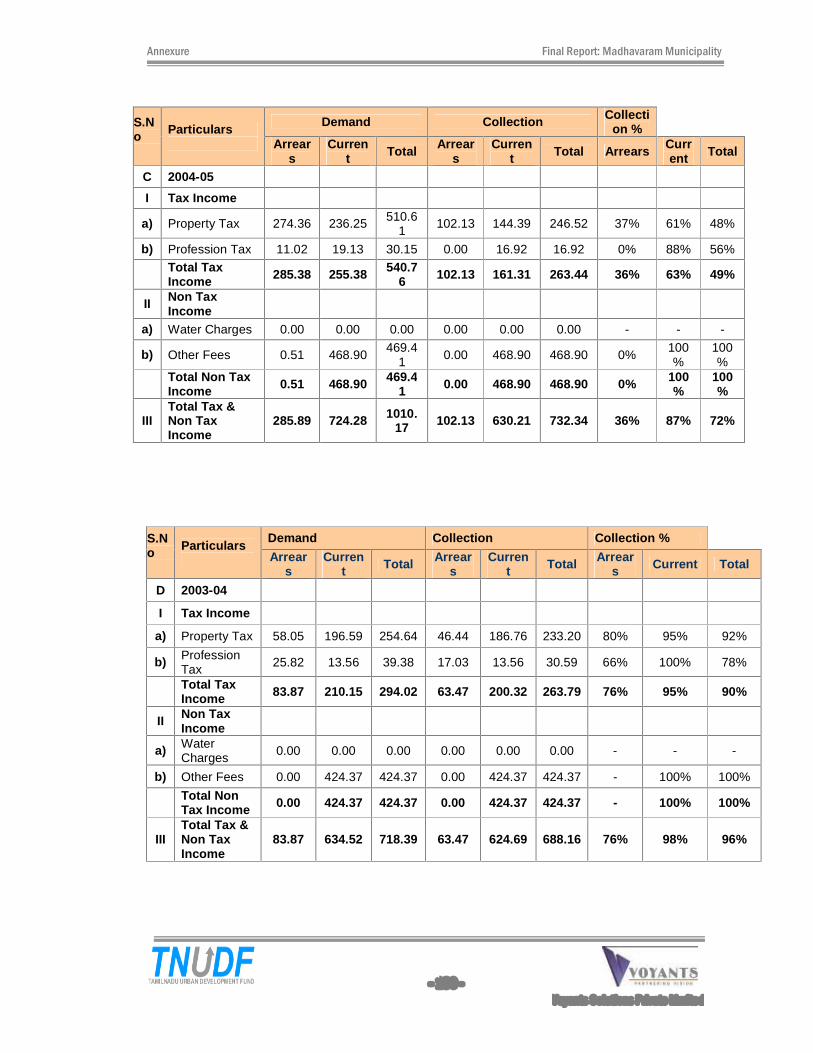
Annexure Final Report: Madhavaram Municipality
- 180 -
Voyants Solutions Private Limited
S.No
Particulars
Demand Collection Collection %
Arrears
Current Total Arrear
s Curren
t Total Arrears Current Total
C 2004-05
I Tax Income
a) Property Tax 274.36 236.25 510.61
102.13 144.39 246.52 37% 61% 48%
b) Profession Tax 11.02 19.13 30.15 0.00 16.92 16.92 0% 88% 56%
Total Tax Income 285.38 255.38 540.7
6 102.13 161.31 263.44 36% 63% 49%
II Non Tax Income
a) Water Charges 0.00 0.00 0.00 0.00 0.00 0.00 - - -
b) Other Fees 0.51 468.90 469.4
1 0.00 468.90 468.90 0% 100%
100%
Total Non Tax Income 0.51 468.90 469.4
1 0.00 468.90 468.90 0% 100%
100%
III Total Tax & Non Tax Income
285.89 724.28 1010.17 102.13 630.21 732.34 36% 87% 72%
S.No
Particulars
Demand Collection Collection %
Arrears
Current Total Arrear
s Curren
t Total Arrears Current Total
D 2003-04
I Tax Income
a) Property Tax 58.05 196.59 254.64 46.44 186.76 233.20 80% 95% 92%
b) Profession Tax 25.82 13.56 39.38 17.03 13.56 30.59 66% 100% 78%
Total Tax Income 83.87 210.15 294.02 63.47 200.32 263.79 76% 95% 90%
II Non Tax Income
a) Water Charges 0.00 0.00 0.00 0.00 0.00 0.00 - - -
b) Other Fees 0.00 424.37 424.37 0.00 424.37 424.37 - 100% 100%
Total Non Tax Income 0.00 424.37 424.37 0.00 424.37 424.37 - 100% 100%
III Total Tax & Non Tax Income
83.87 634.52 718.39 63.47 624.69 688.16 76% 98% 96%
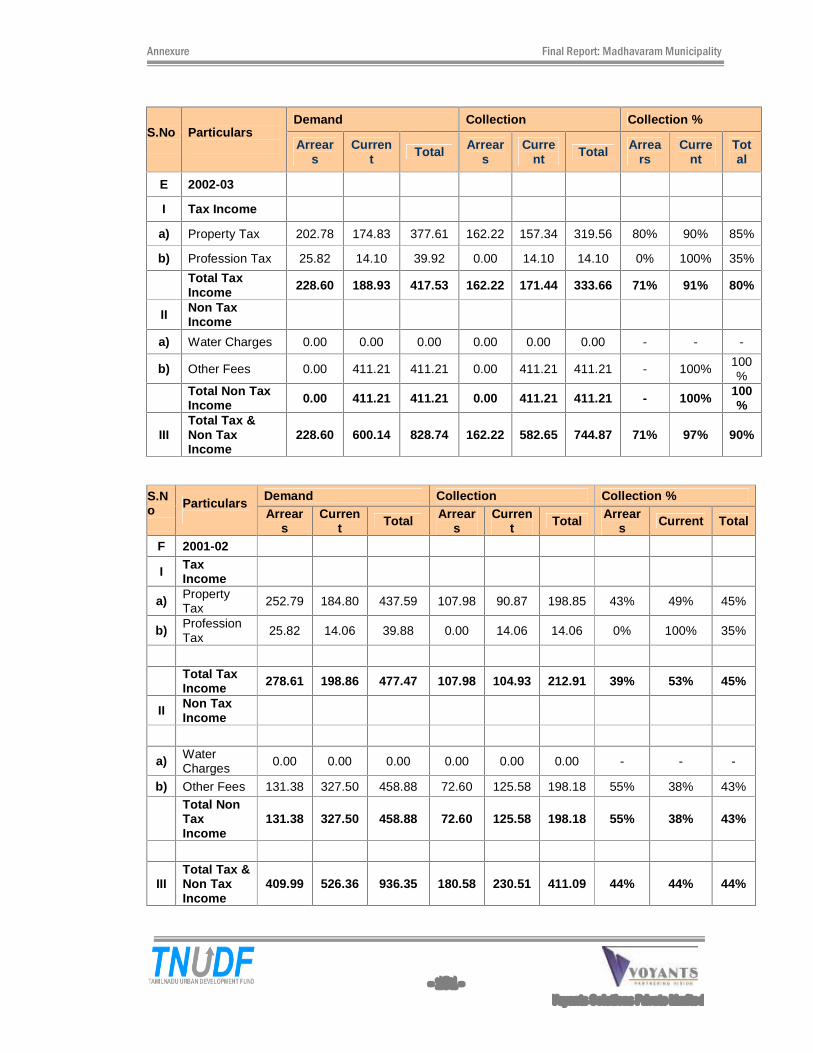
Annexure Final Report: Madhavaram Municipality
- 181 -
Voyants Solutions Private Limited
S.No
Particulars
Demand Collection Collection %
Arrears
Current Total Arrear
s Curre
nt Total Arrears
Current
Total
E 2002-03
I Tax Income
a) Property Tax 202.78 174.83 377.61 162.22 157.34 319.56 80% 90% 85%
b) Profession Tax 25.82 14.10 39.92 0.00 14.10 14.10 0% 100% 35%
Total Tax Income 228.60 188.93 417.53 162.22 171.44 333.66 71% 91% 80%
II Non Tax Income
a) Water Charges 0.00 0.00 0.00 0.00 0.00 0.00 - - -
b) Other Fees 0.00 411.21 411.21 0.00 411.21 411.21 - 100% 100%
Total Non Tax Income 0.00 411.21 411.21 0.00 411.21 411.21 - 100% 100
%
III Total Tax & Non Tax Income
228.60 600.14 828.74 162.22 582.65 744.87 71% 97% 90%
S.No
Particulars
Demand Collection Collection % Arrear
s Curren
t Total Arrears
Current Total Arrear
s Current Total
F 2001-02
I Tax Income
a) Property Tax 252.79 184.80 437.59 107.98 90.87 198.85 43% 49% 45%
b) Profession Tax 25.82 14.06 39.88 0.00 14.06 14.06 0% 100% 35%
Total Tax Income 278.61 198.86 477.47 107.98 104.93 212.91 39% 53% 45%
II Non Tax Income
a) Water Charges 0.00 0.00 0.00 0.00 0.00 0.00 - - -
b) Other Fees 131.38 327.50 458.88 72.60 125.58 198.18 55% 38% 43%
Total Non Tax Income
131.38 327.50 458.88 72.60 125.58 198.18 55% 38% 43%
III Total Tax & Non Tax Income
409.99 526.36 936.35 180.58 230.51 411.09 44% 44% 44%
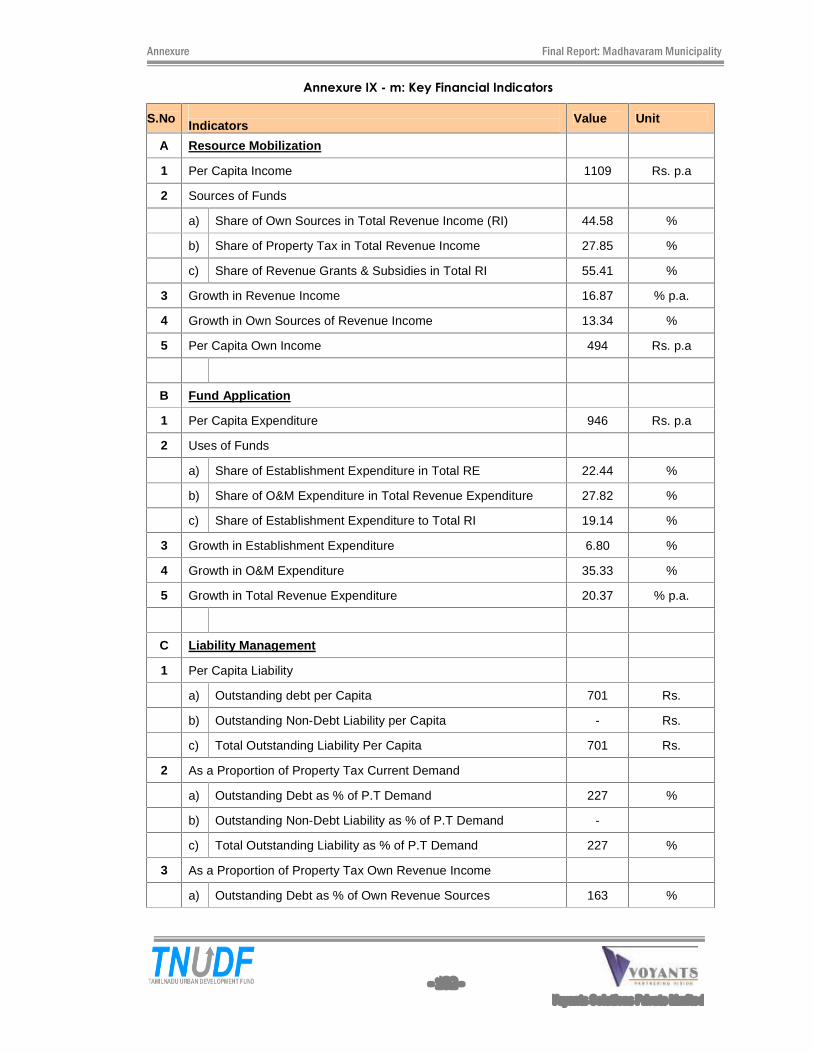
Annexure Final Report: Madhavaram Municipality
- 182 -
Voyants Solutions Private Limited
Annexure IX - m: Key Financial Indicators
S.No Indicators Value Unit
A Resource Mobilization
1 Per Capita Income 1109 Rs. p.a
2 Sources of Funds
a) Share of Own Sources in Total Revenue Income (RI) 44.58 %
b) Share of Property Tax in Total Revenue Income 27.85 %
c) Share of Revenue Grants & Subsidies in Total RI 55.41 %
3 Growth in Revenue Income 16.87 % p.a.
4 Growth in Own Sources of Revenue Income 13.34 %
5 Per Capita Own Income 494 Rs. p.a
B Fund Application
1 Per Capita Expenditure 946 Rs. p.a
2 Uses of Funds
a) Share of Establishment Expenditure in Total RE 22.44 %
b) Share of O&M Expenditure in Total Revenue Expenditure 27.82 %
c) Share of Establishment Expenditure to Total RI 19.14 %
3 Growth in Establishment Expenditure 6.80 %
4 Growth in O&M Expenditure 35.33 %
5 Growth in Total Revenue Expenditure 20.37 % p.a.
C Liability Management
1 Per Capita Liability
a) Outstanding debt per Capita 701 Rs.
b) Outstanding Non-Debt Liability per Capita - Rs.
c) Total Outstanding Liability Per Capita 701 Rs.
2 As a Proportion of Property Tax Current Demand
a) Outstanding Debt as % of P.T Demand 227 %
b) Outstanding Non-Debt Liability as % of P.T Demand -
c) Total Outstanding Liability as % of P.T Demand 227 %
3 As a Proportion of Property Tax Own Revenue Income
a) Outstanding Debt as % of Own Revenue Sources 163 %
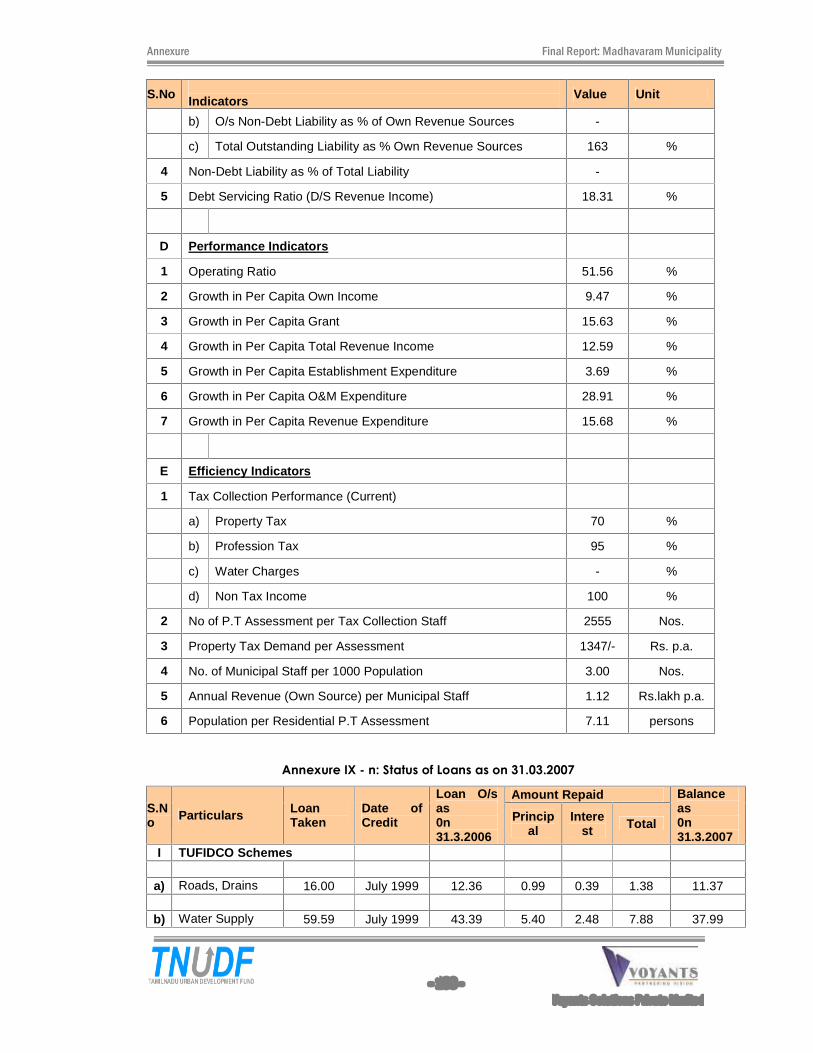
Annexure Final Report: Madhavaram Municipality
- 183 -
Voyants Solutions Private Limited
S.No Indicators Value Unit
b) O/s Non-Debt Liability as % of Own Revenue Sources -
c) Total Outstanding Liability as % Own Revenue Sources 163 %
4 Non-Debt Liability as % of Total Liability -
5 Debt Servicing Ratio (D/S Revenue Income) 18.31 %
D Performance Indicators
1 Operating Ratio 51.56 %
2 Growth in Per Capita Own Income 9.47 %
3 Growth in Per Capita Grant 15.63 %
4 Growth in Per Capita Total Revenue Income 12.59 %
5 Growth in Per Capita Establishment Expenditure 3.69 %
6 Growth in Per Capita O&M Expenditure 28.91 %
7 Growth in Per Capita Revenue Expenditure 15.68 %
E Efficiency Indicators
1 Tax Collection Performance (Current)
a) Property Tax 70 %
b) Profession Tax 95 %
c) Water Charges - %
d) Non Tax Income 100 %
2 No of P.T Assessment per Tax Collection Staff 2555 Nos.
3 Property Tax Demand per Assessment 1347/- Rs. p.a.
4 No. of Municipal Staff per 1000 Population 3.00 Nos.
5 Annual Revenue (Own Source) per Municipal Staff 1.12 Rs.lakh p.a.
6 Population per Residential P.T Assessment 7.11 persons
Annexure IX - n: Status of Loans as on 31.03.2007
S.No Particulars Loan
Taken Date of Credit
Loan O/s as 0n 31.3.2006
Amount Repaid Balance as 0n 31.3.2007
Principal
Interest Total
I TUFIDCO Schemes
a) Roads, Drains 16.00 July 1999 12.36 0.99 0.39 1.38 11.37
b) Water Supply 59.59 July 1999 43.39 5.40 2.48 7.88 37.99
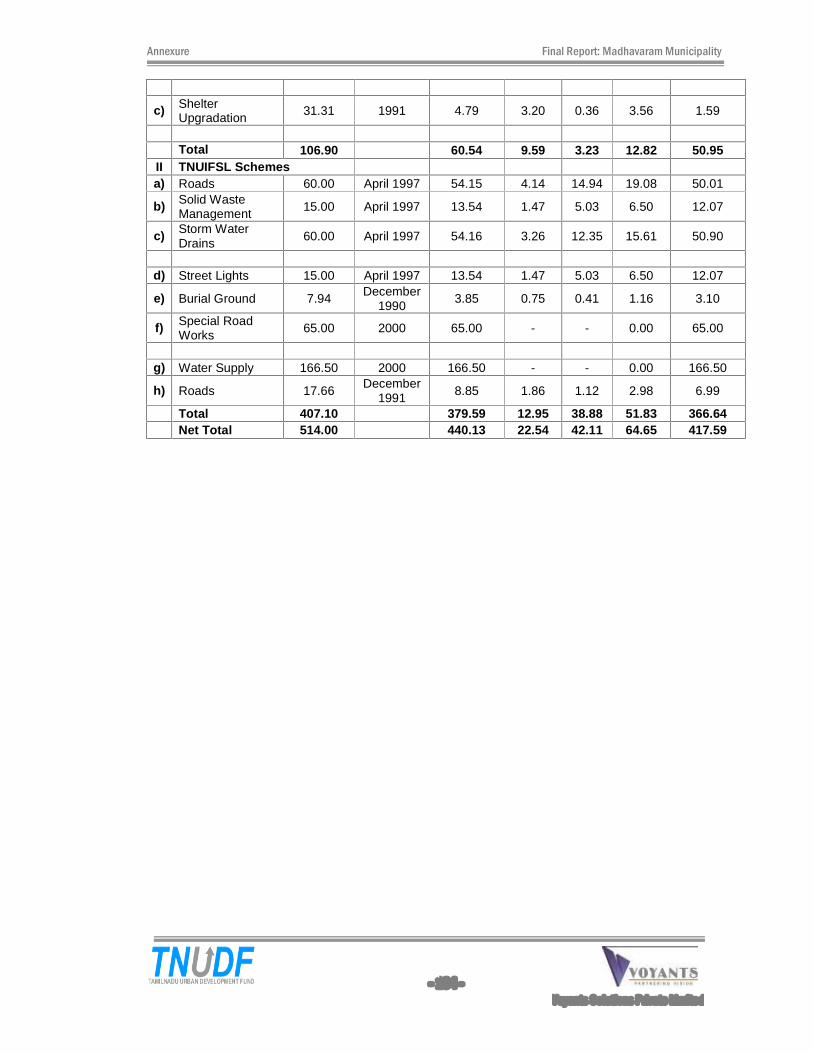
Annexure Final Report: Madhavaram Municipality
- 184 -
Voyants Solutions Private Limited
c) Shelter Upgradation 31.31 1991 4.79 3.20 0.36 3.56 1.59
Total 106.90 60.54 9.59 3.23 12.82 50.95
II TNUIFSL Schemes a) Roads 60.00 April 1997 54.15 4.14 14.94 19.08 50.01
b) Solid Waste Management 15.00 April 1997 13.54 1.47 5.03 6.50 12.07
c) Storm Water Drains 60.00 April 1997 54.16 3.26 12.35 15.61 50.90
d) Street Lights 15.00 April 1997 13.54 1.47 5.03 6.50 12.07
e) Burial Ground 7.94 December 1990
3.85 0.75 0.41 1.16 3.10
f) Special Road Works 65.00 2000 65.00 - - 0.00 65.00
g) Water Supply 166.50 2000 166.50 - - 0.00 166.50
h) Roads 17.66 December
1991 8.85 1.86 1.12 2.98 6.99
Total 407.10 379.59 12.95 38.88 51.83 366.64 Net Total 514.00 440.13 22.54 42.11 64.65 417.59
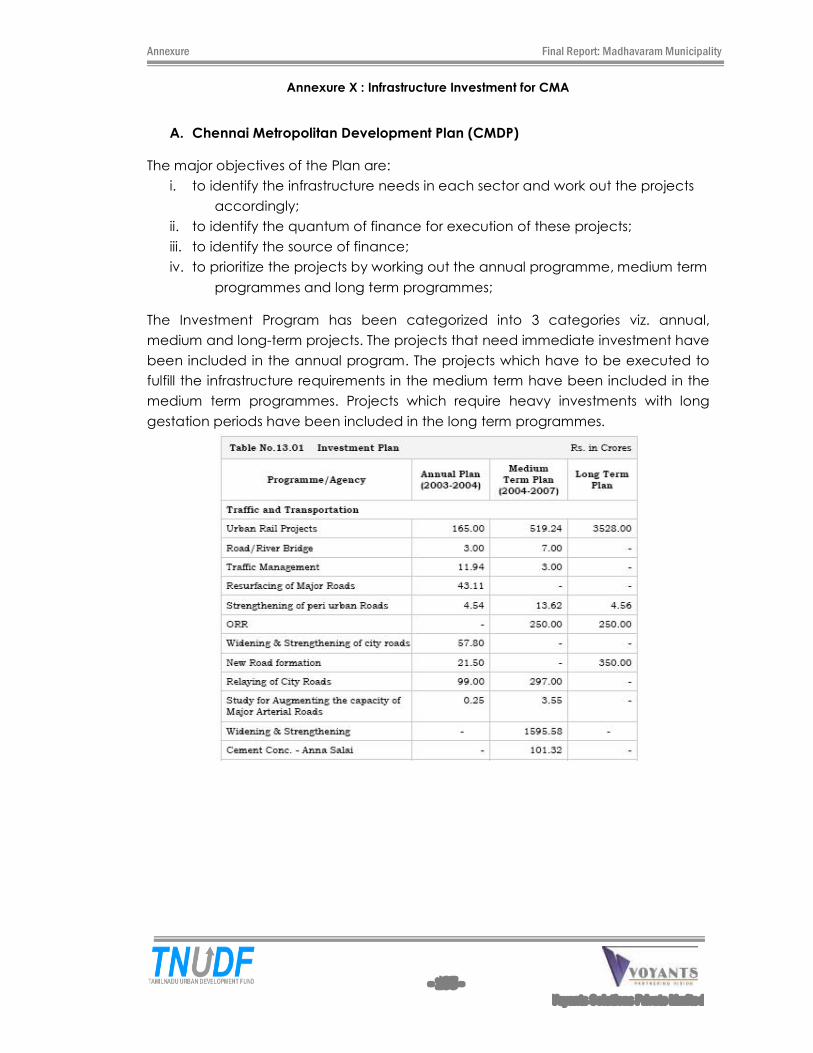
Annexure Final Report: Madhavaram Municipality
- 185 -
Voyants Solutions Private Limited
Annexure X : Infrastructure Investment for CMA
A. Chennai Metropolitan Development Plan (CMDP)
The major objectives of the Plan are:
i. to identify the infrastructure needs in each sector and work out the projects
accordingly;
ii. to identify the quantum of finance for execution of these projects;
iii. to identify the source of finance;
iv. to prioritize the projects by working out the annual programme, medium term
programmes and long term programmes;
The Investment Program has been categorized into 3 categories viz. annual,
medium and long-term projects. The projects that need immediate investment have
been included in the annual program. The projects which have to be executed to
fulfill the infrastructure requirements in the medium term have been included in the
medium term programmes. Projects which require heavy investments with long
gestation periods have been included in the long term programmes.
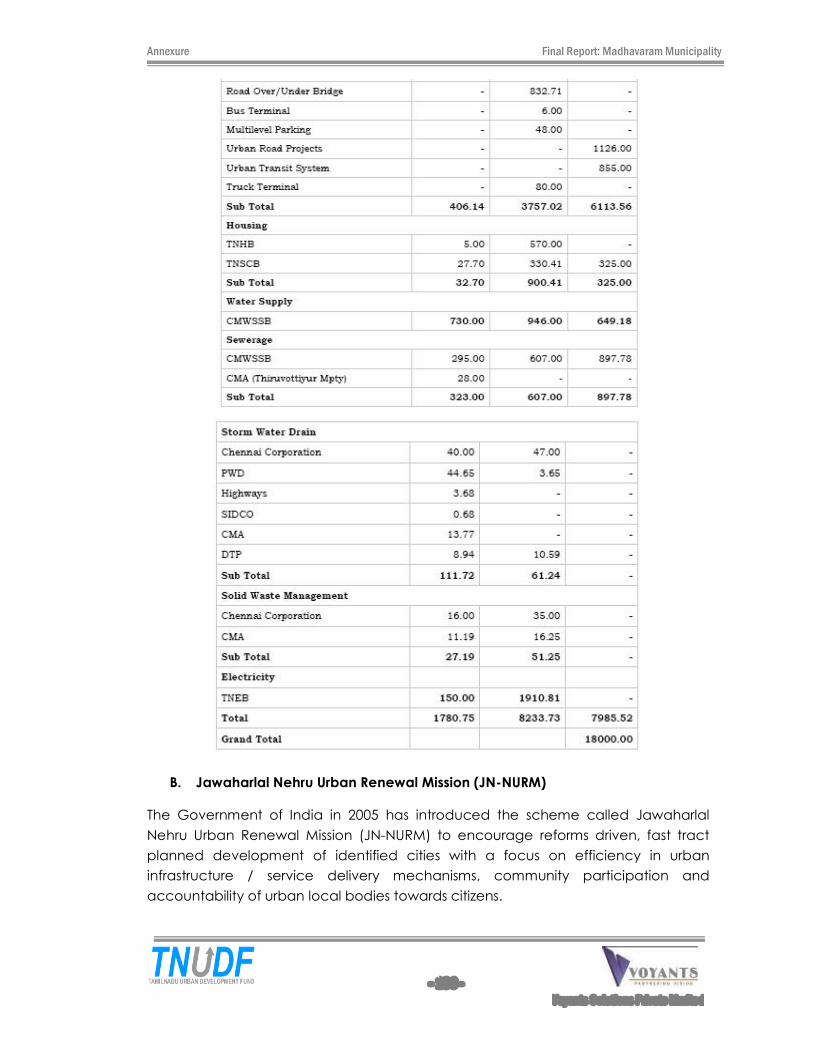
Annexure Final Report: Madhavaram Municipality
- 186 -
Voyants Solutions Private Limited
B. Jawaharlal Nehru Urban Renewal Mission (JN-NURM)
The Government of India in 2005 has introduced the scheme called Jawaharlal
Nehru Urban Renewal Mission (JN-NURM) to encourage reforms driven, fast tract
planned development of identified cities with a focus on efficiency in urban
infrastructure / service delivery mechanisms, community participation and
accountability of urban local bodies towards citizens.
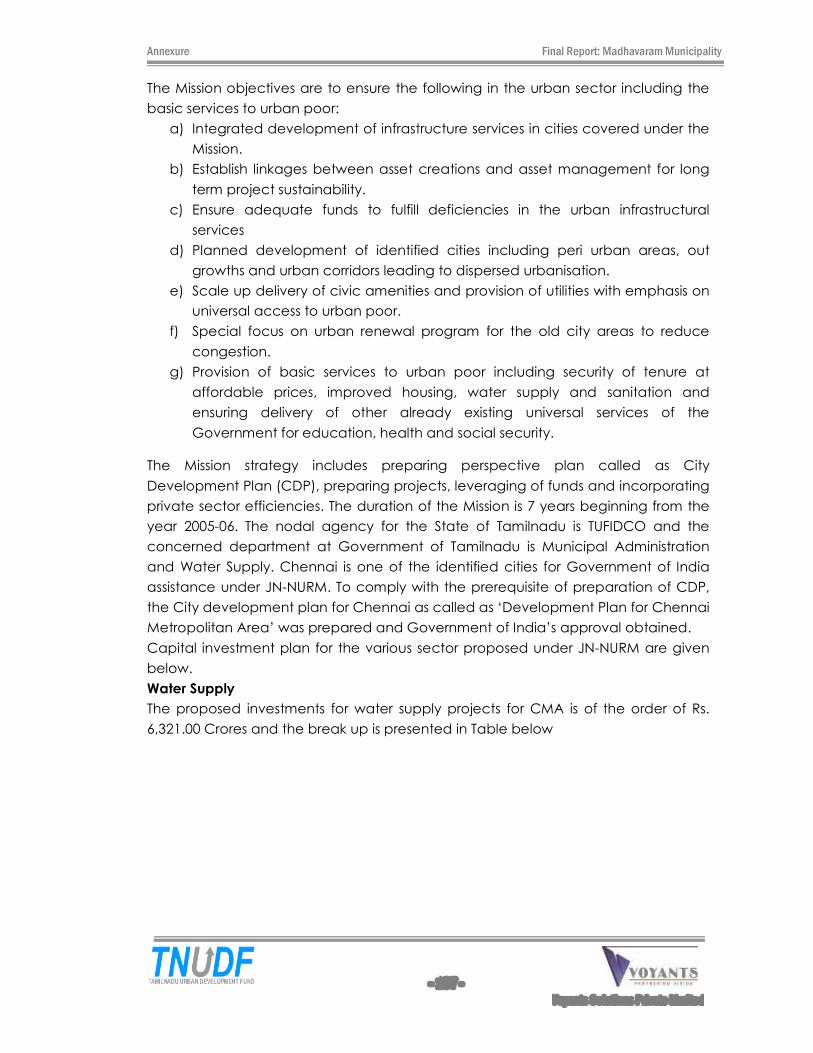
Annexure Final Report: Madhavaram Municipality
- 187 -
Voyants Solutions Private Limited
The Mission objectives are to ensure the following in the urban sector including the
basic services to urban poor:
a) Integrated development of infrastructure services in cities covered under the
Mission.
b) Establish linkages between asset creations and asset management for long
term project sustainability.
c) Ensure adequate funds to fulfill deficiencies in the urban infrastructural
services
d) Planned development of identified cities including peri urban areas, out
growths and urban corridors leading to dispersed urbanisation.
e) Scale up delivery of civic amenities and provision of utilities with emphasis on
universal access to urban poor.
f) Special focus on urban renewal program for the old city areas to reduce
congestion.
g) Provision of basic services to urban poor including security of tenure at
affordable prices, improved housing, water supply and sanitation and
ensuring delivery of other already existing universal services of the
Government for education, health and social security.
The Mission strategy includes preparing perspective plan called as City
Development Plan (CDP), preparing projects, leveraging of funds and incorporating
private sector efficiencies. The duration of the Mission is 7 years beginning from the
year 2005-06. The nodal agency for the State of Tamilnadu is TUFIDCO and the
concerned department at Government of Tamilnadu is Municipal Administration
and Water Supply. Chennai is one of the identified cities for Government of India
assistance under JN-NURM. To comply with the prerequisite of preparation of CDP,
the City development plan for Chennai as called as �Development Plan for Chennai
Metropolitan Area� was prepared and Government of India�s approval obtained.
Capital investment plan for the various sector proposed under JN-NURM are given
below.
Water Supply
The proposed investments for water supply projects for CMA is of the order of Rs.
6,321.00 Crores and the break up is presented in Table below
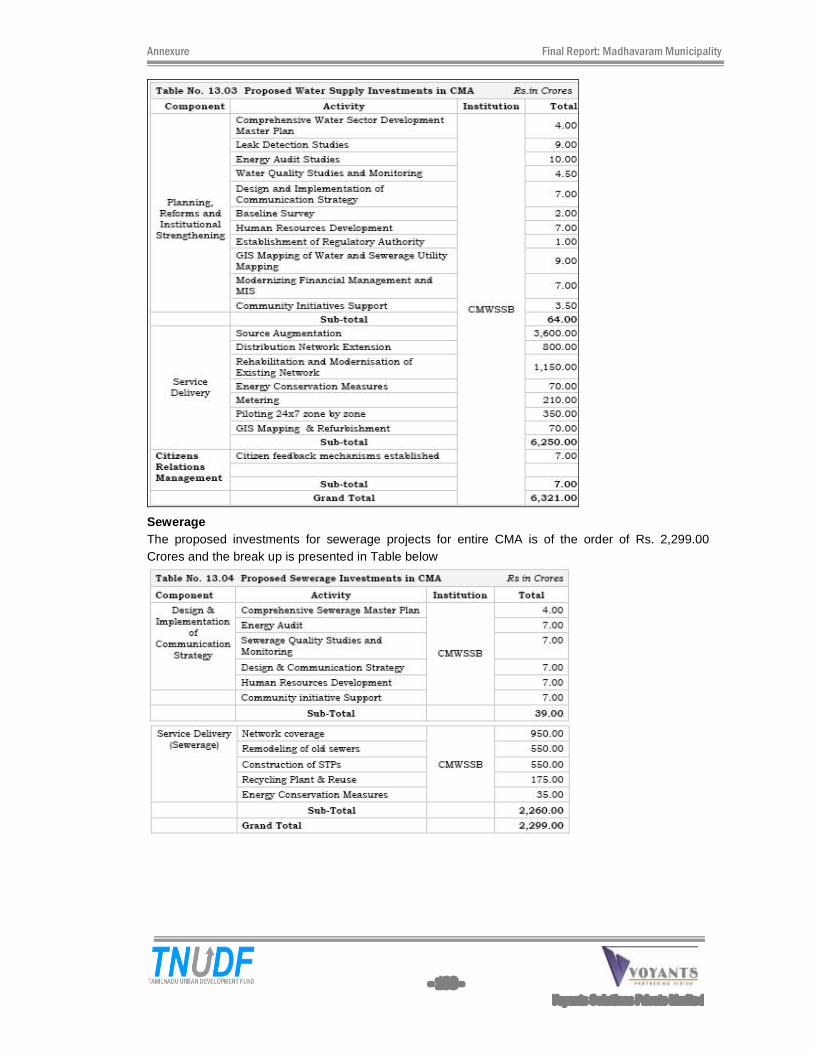
Annexure Final Report: Madhavaram Municipality
- 188 -
Voyants Solutions Private Limited
Sewerage The proposed investments for sewerage projects for entire CMA is of the order of Rs. 2,299.00 Crores and the break up is presented in Table below
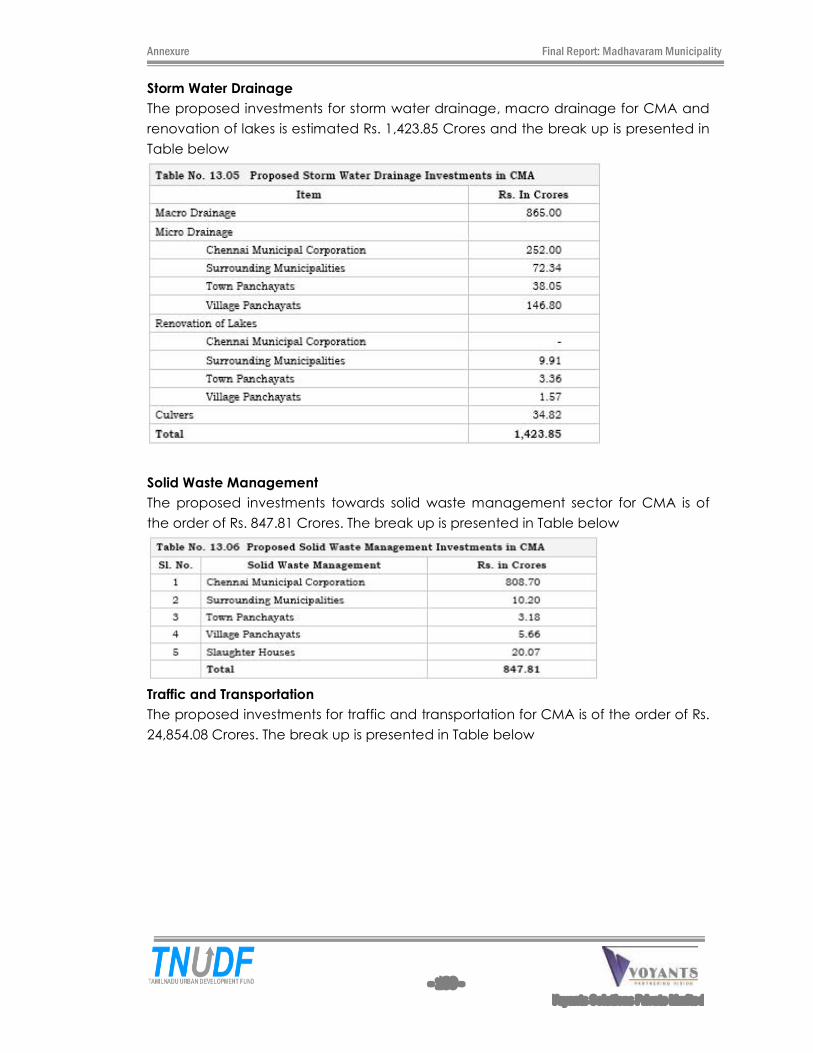
Annexure Final Report: Madhavaram Municipality
- 189 -
Voyants Solutions Private Limited
Storm Water Drainage
The proposed investments for storm water drainage, macro drainage for CMA and
renovation of lakes is estimated Rs. 1,423.85 Crores and the break up is presented in
Table below
Solid Waste Management
The proposed investments towards solid waste management sector for CMA is of
the order of Rs. 847.81 Crores. The break up is presented in Table below
Traffic and Transportation
The proposed investments for traffic and transportation for CMA is of the order of Rs.
24,854.08 Crores. The break up is presented in Table below
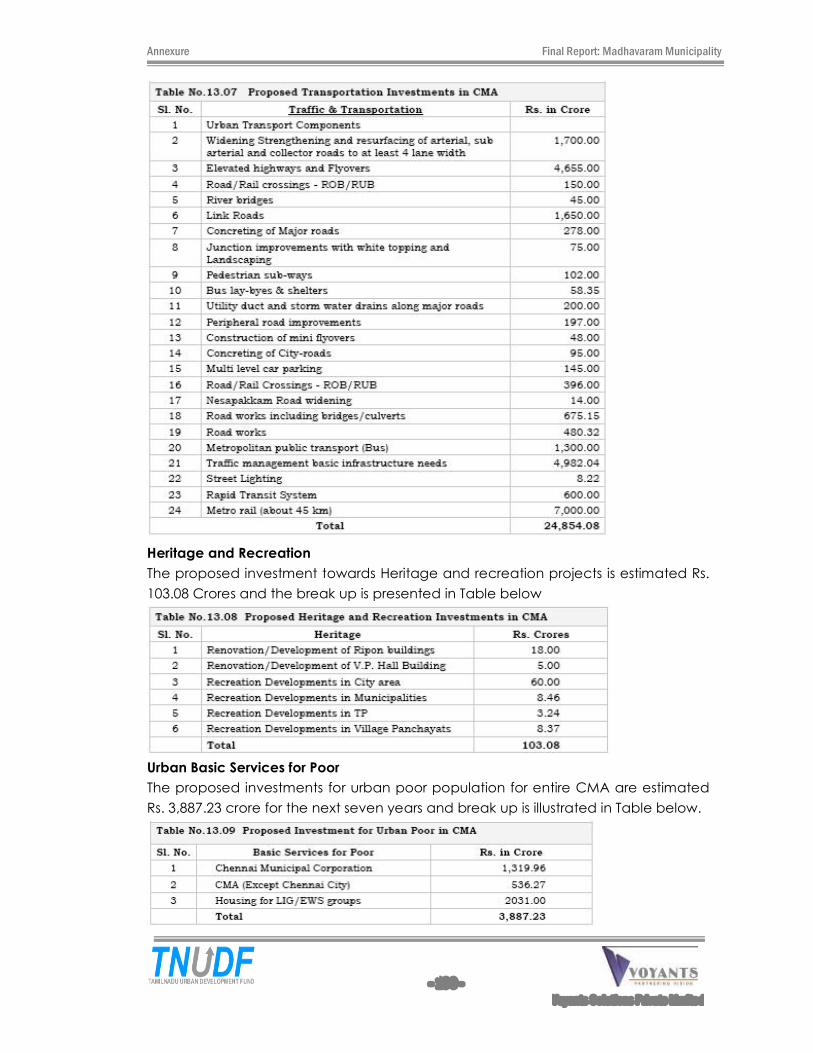
Annexure Final Report: Madhavaram Municipality
- 190 -
Voyants Solutions Private Limited
Heritage and Recreation
The proposed investment towards Heritage and recreation projects is estimated Rs.
103.08 Crores and the break up is presented in Table below
Urban Basic Services for Poor
The proposed investments for urban poor population for entire CMA are estimated
Rs. 3,887.23 crore for the next seven years and break up is illustrated in Table below.
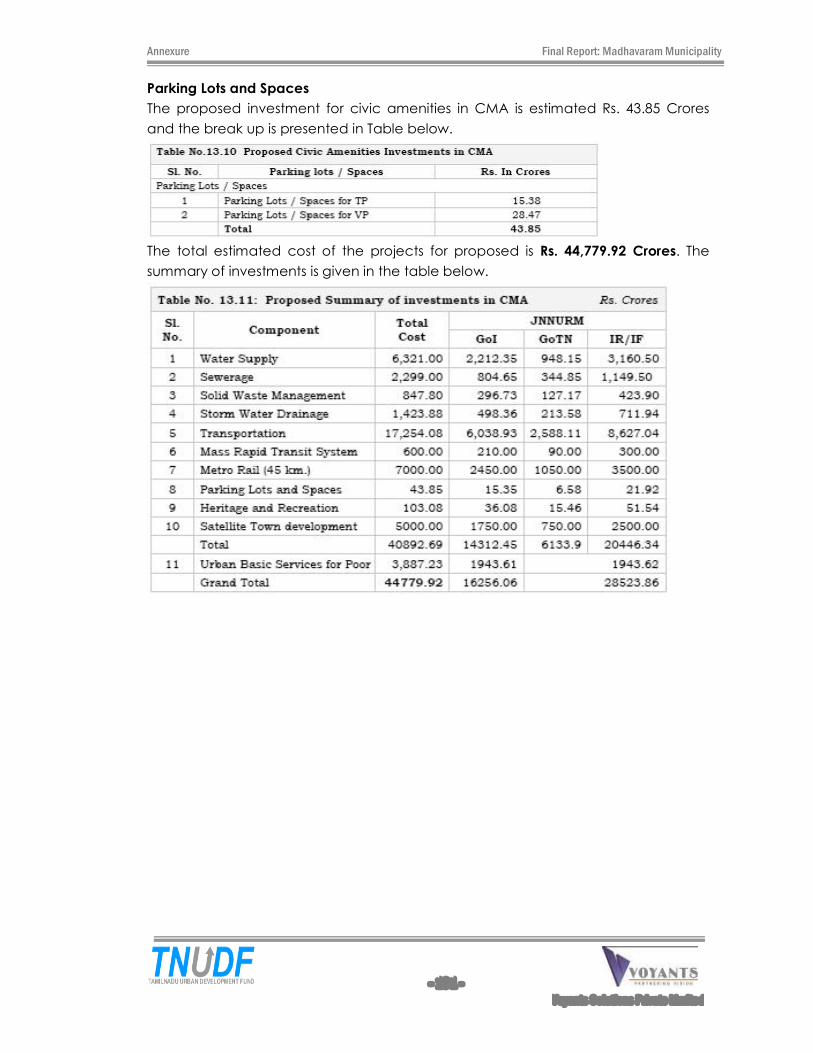
Annexure Final Report: Madhavaram Municipality
- 191 -
Voyants Solutions Private Limited
Parking Lots and Spaces
The proposed investment for civic amenities in CMA is estimated Rs. 43.85 Crores
and the break up is presented in Table below.
The total estimated cost of the projects for proposed is Rs. 44,779.92 Crores. The
summary of investments is given in the table below.
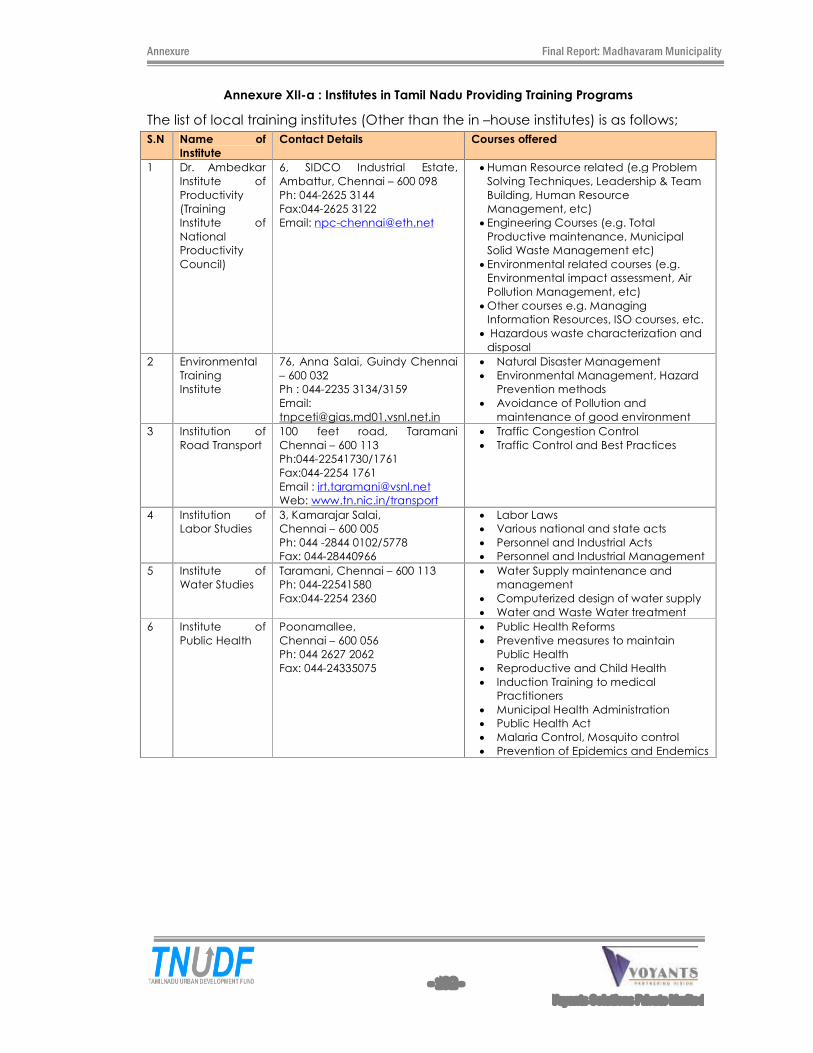
Annexure Final Report: Madhavaram Municipality
- 192 -
Voyants Solutions Private Limited
Annexure XII-a : Institutes in Tamil Nadu Providing Training Programs
The list of local training institutes (Other than the in �house institutes) is as follows;
S.N Name of
Institute
Contact Details Courses offered
1 Dr. Ambedkar
Institute of
Productivity
(Training
Institute of
National
Productivity
Council)
6, SIDCO Industrial Estate,
Ambattur, Chennai � 600 098
Ph: 044-2625 3144
Fax:044-2625 3122
Email: [email protected]
Human Resource related (e.g Problem
Solving Techniques, Leadership & Team
Building, Human Resource
Management, etc)
Engineering Courses (e.g. Total
Productive maintenance, Municipal
Solid Waste Management etc)
Environmental related courses (e.g.
Environmental impact assessment, Air
Pollution Management, etc)
Other courses e.g. Managing
Information Resources, ISO courses, etc.
Hazardous waste characterization and
disposal
2 Environmental
Training
Institute
76, Anna Salai, Guindy Chennai
� 600 032
Ph : 044-2235 3134/3159
Email:
Natural Disaster Management
Environmental Management, Hazard
Prevention methods
Avoidance of Pollution and
maintenance of good environment
3 Institution of
Road Transport
100 feet road, Taramani
Chennai � 600 113
Ph:044-22541730/1761
Fax:044-2254 1761
Email : [email protected]
Web: www.tn.nic.in/transport
Traffic Congestion Control
Traffic Control and Best Practices
4 Institution of
Labor Studies
3, Kamarajar Salai,
Chennai � 600 005
Ph: 044 -2844 0102/5778
Fax: 044-28440966
Labor Laws
Various national and state acts
Personnel and Industrial Acts
Personnel and Industrial Management
5 Institute of
Water Studies
Taramani, Chennai � 600 113
Ph: 044-22541580
Fax:044-2254 2360
Water Supply maintenance and
management
Computerized design of water supply
Water and Waste Water treatment
6 Institute of
Public Health
Poonamallee,
Chennai � 600 056
Ph: 044 2627 2062
Fax: 044-24335075
Public Health Reforms
Preventive measures to maintain
Public Health
Reproductive and Child Health
Induction Training to medical
Practitioners
Municipal Health Administration
Public Health Act
Malaria Control, Mosquito control
Prevention of Epidemics and Endemics
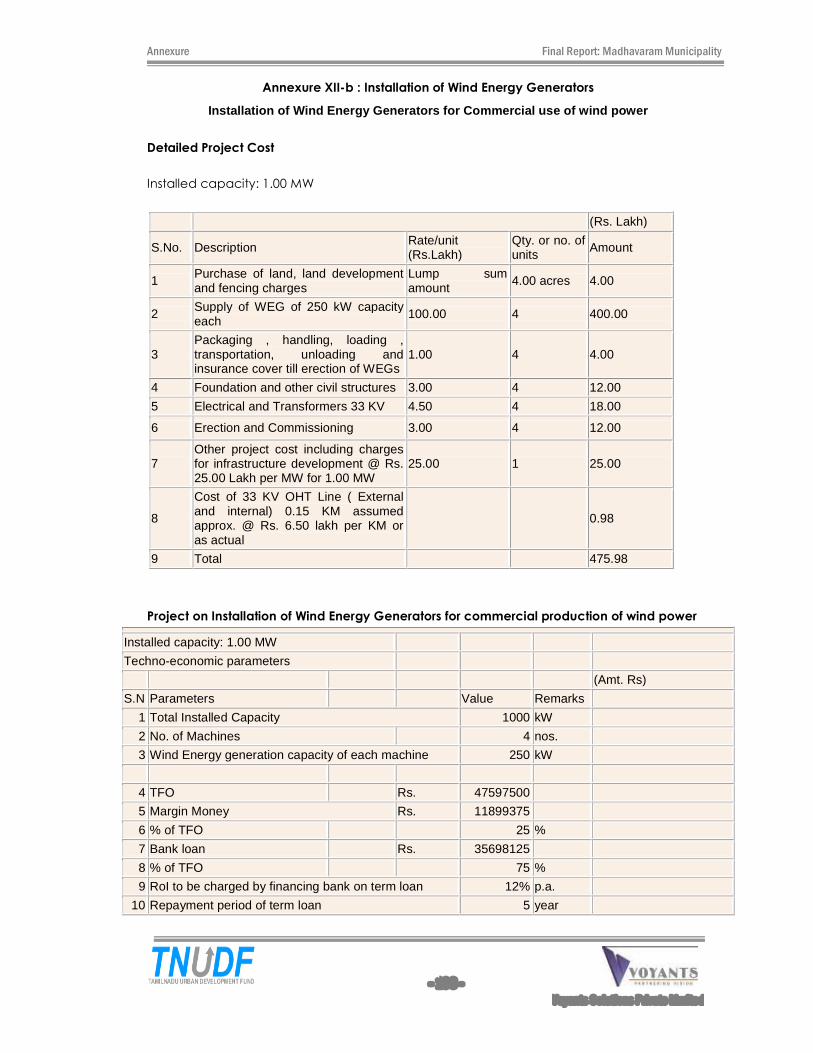
Annexure Final Report: Madhavaram Municipality
- 193 -
Voyants Solutions Private Limited
Annexure XII-b : Installation of Wind Energy Generators
Installation of Wind Energy Generators for Commercial use of wind power
Detailed Project Cost
Installed capacity: 1.00 MW
(Rs. Lakh)
S.No. Description Rate/unit (Rs.Lakh)
Qty. or no. of units Amount
1 Purchase of land, land development and fencing charges
Lump sum amount
4.00 acres 4.00
2 Supply of WEG of 250 kW capacity each
100.00 4 400.00
3 Packaging , handling, loading , transportation, unloading and insurance cover till erection of WEGs
1.00 4 4.00
4 Foundation and other civil structures 3.00 4 12.00
5 Electrical and Transformers 33 KV 4.50 4 18.00
6 Erection and Commissioning 3.00 4 12.00
7 Other project cost including charges for infrastructure development @ Rs. 25.00 Lakh per MW for 1.00 MW
25.00 1 25.00
8
Cost of 33 KV OHT Line ( External and internal) 0.15 KM assumed approx. @ Rs. 6.50 lakh per KM or as actual
0.98
9 Total 475.98
Project on Installation of Wind Energy Generators for commercial production of wind power
Installed capacity: 1.00 MW
Techno-economic parameters
(Amt. Rs)
S.N Parameters Value Remarks
1 Total Installed Capacity 1000 kW
2 No. of Machines 4 nos.
3 Wind Energy generation capacity of each machine 250 kW
4 TFO Rs. 47597500
5 Margin Money Rs. 11899375
6 % of TFO 25 %
7 Bank loan Rs. 35698125
8 % of TFO 75 %
9 RoI to be charged by financing bank on term loan 12% p.a.
10 Repayment period of term loan 5 year
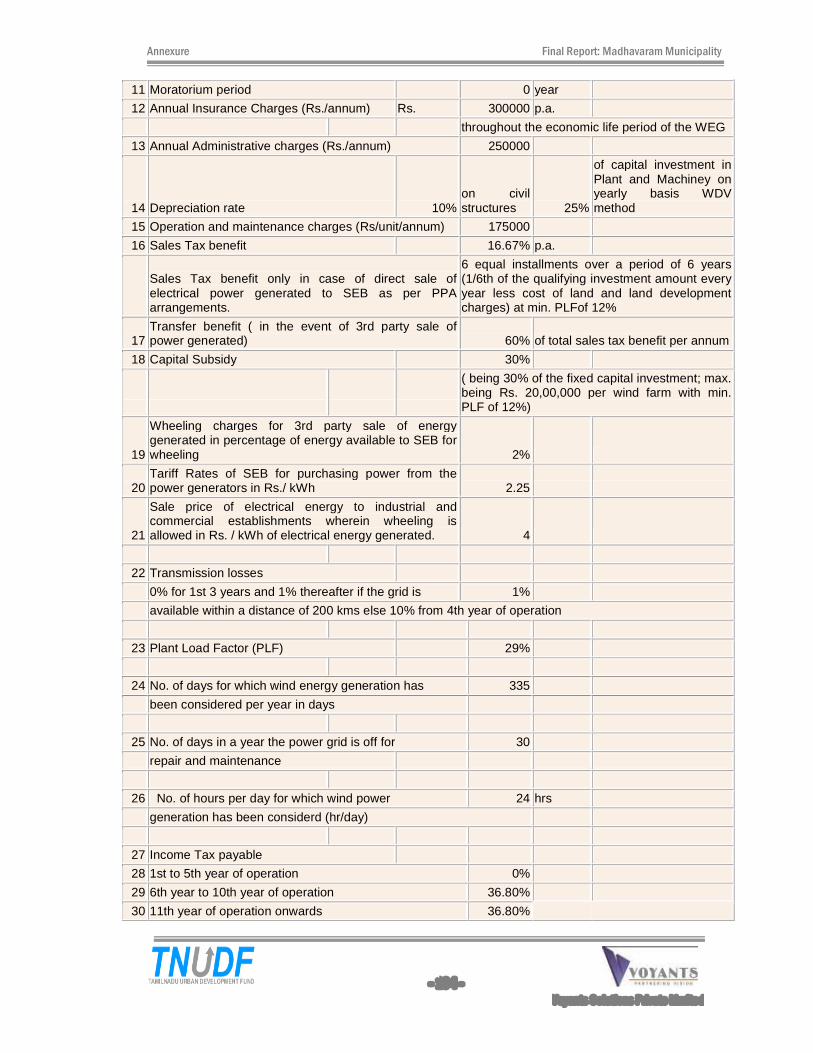
Annexure Final Report: Madhavaram Municipality
- 194 -
Voyants Solutions Private Limited
11 Moratorium period 0 year
12 Annual Insurance Charges (Rs./annum) Rs. 300000 p.a.
throughout the economic life period of the WEG
13 Annual Administrative charges (Rs./annum) 250000
14 Depreciation rate 10% on civil structures 25%
of capital investment in Plant and Machiney on yearly basis WDV method
15 Operation and maintenance charges (Rs/unit/annum) 175000
16 Sales Tax benefit 16.67% p.a.
Sales Tax benefit only in case of direct sale of electrical power generated to SEB as per PPA arrangements.
6 equal installments over a period of 6 years (1/6th of the qualifying investment amount every year less cost of land and land development charges) at min. PLFof 12%
17 Transfer benefit ( in the event of 3rd party sale of power generated) 60% of total sales tax benefit per annum
18 Capital Subsidy 30%
( being 30% of the fixed capital investment; max. being Rs. 20,00,000 per wind farm with min. PLF of 12%)
19
Wheeling charges for 3rd party sale of energy generated in percentage of energy available to SEB for wheeling 2%
20 Tariff Rates of SEB for purchasing power from the power generators in Rs./ kWh 2.25
21
Sale price of electrical energy to industrial and commercial establishments wherein wheeling is allowed in Rs. / kWh of electrical energy generated. 4
22 Transmission losses
0% for 1st 3 years and 1% thereafter if the grid is 1%
available within a distance of 200 kms else 10% from 4th year of operation
23 Plant Load Factor (PLF) 29%
24 No. of days for which wind energy generation has 335
been considered per year in days
25 No. of days in a year the power grid is off for 30
repair and maintenance
26 No. of hours per day for which wind power 24 hrs
generation has been considerd (hr/day)
27 Income Tax payable
28 1st to 5th year of operation 0%
29 6th year to 10th year of operation 36.80%
30 11th year of operation onwards 36.80%
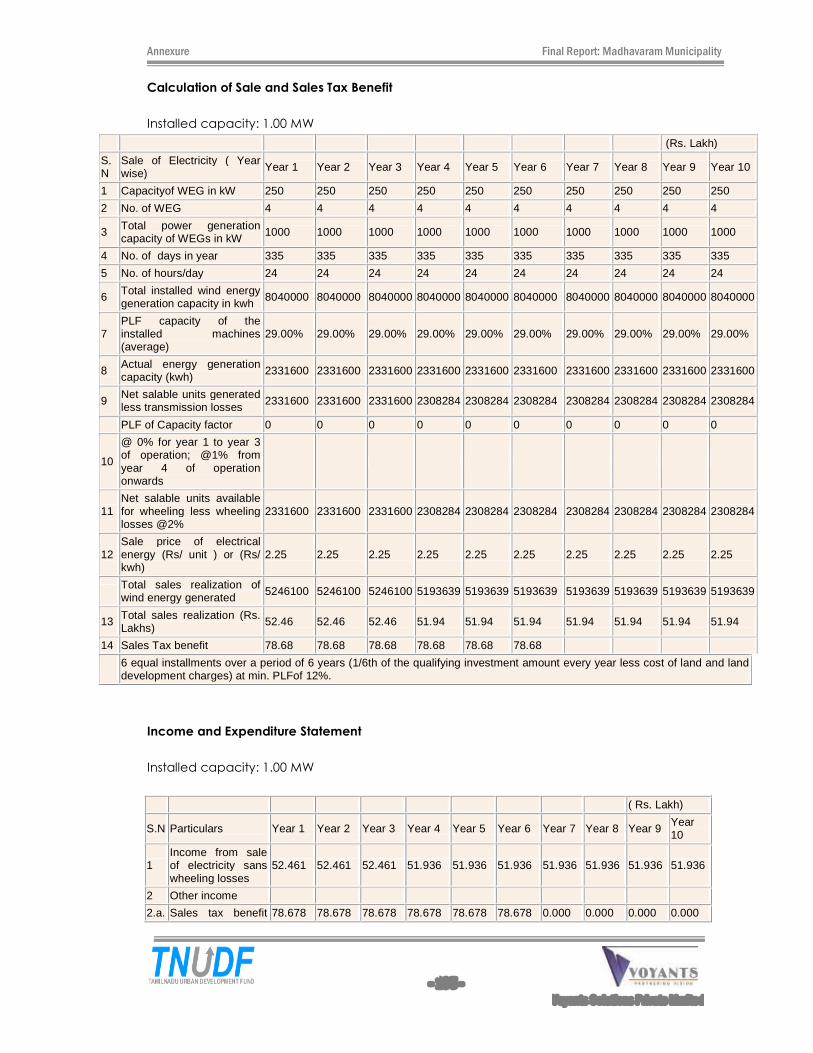
Annexure Final Report: Madhavaram Municipality
- 195 -
Voyants Solutions Private Limited
Calculation of Sale and Sales Tax Benefit
Installed capacity: 1.00 MW
(Rs. Lakh)
S.N
Sale of Electricity ( Year wise) Year 1 Year 2 Year 3 Year 4 Year 5 Year 6 Year 7 Year 8 Year 9 Year 10
1 Capacityof WEG in kW 250 250 250 250 250 250 250 250 250 250
2 No. of WEG 4 4 4 4 4 4 4 4 4 4
3 Total power generation capacity of WEGs in kW
1000 1000 1000 1000 1000 1000 1000 1000 1000 1000
4 No. of days in year 335 335 335 335 335 335 335 335 335 335
5 No. of hours/day 24 24 24 24 24 24 24 24 24 24
6 Total installed wind energy generation capacity in kwh
8040000 8040000 8040000 8040000 8040000 8040000 8040000 8040000 8040000 8040000
7 PLF capacity of the installed machines (average)
29.00% 29.00% 29.00% 29.00% 29.00% 29.00% 29.00% 29.00% 29.00% 29.00%
8 Actual energy generation capacity (kwh) 2331600 2331600 2331600 2331600 2331600 2331600 2331600 2331600 2331600 2331600
9 Net salable units generated less transmission losses 2331600 2331600 2331600 2308284 2308284 2308284 2308284 2308284 2308284 2308284
PLF of Capacity factor 0 0 0 0 0 0 0 0 0 0
10
@ 0% for year 1 to year 3 of operation; @1% from year 4 of operation onwards
11 Net salable units available for wheeling less wheeling losses @2%
2331600 2331600 2331600 2308284 2308284 2308284 2308284 2308284 2308284 2308284
12 Sale price of electrical energy (Rs/ unit ) or (Rs/ kwh)
2.25 2.25 2.25 2.25 2.25 2.25 2.25 2.25 2.25 2.25
Total sales realization of wind energy generated 5246100 5246100 5246100 5193639 5193639 5193639 5193639 5193639 5193639 5193639
13 Total sales realization (Rs. Lakhs)
52.46 52.46 52.46 51.94 51.94 51.94 51.94 51.94 51.94 51.94
14 Sales Tax benefit 78.68 78.68 78.68 78.68 78.68 78.68
6 equal installments over a period of 6 years (1/6th of the qualifying investment amount every year less cost of land and land development charges) at min. PLFof 12%.
Income and Expenditure Statement
Installed capacity: 1.00 MW
( Rs. Lakh)
S.N Particulars Year 1 Year 2 Year 3 Year 4 Year 5 Year 6 Year 7 Year 8 Year 9 Year 10
1 Income from sale of electricity sans wheeling losses
52.461 52.461 52.461 51.936 51.936 51.936 51.936 51.936 51.936 51.936
2 Other income
2.a. Sales tax benefit 78.678 78.678 78.678 78.678 78.678 78.678 0.000 0.000 0.000 0.000
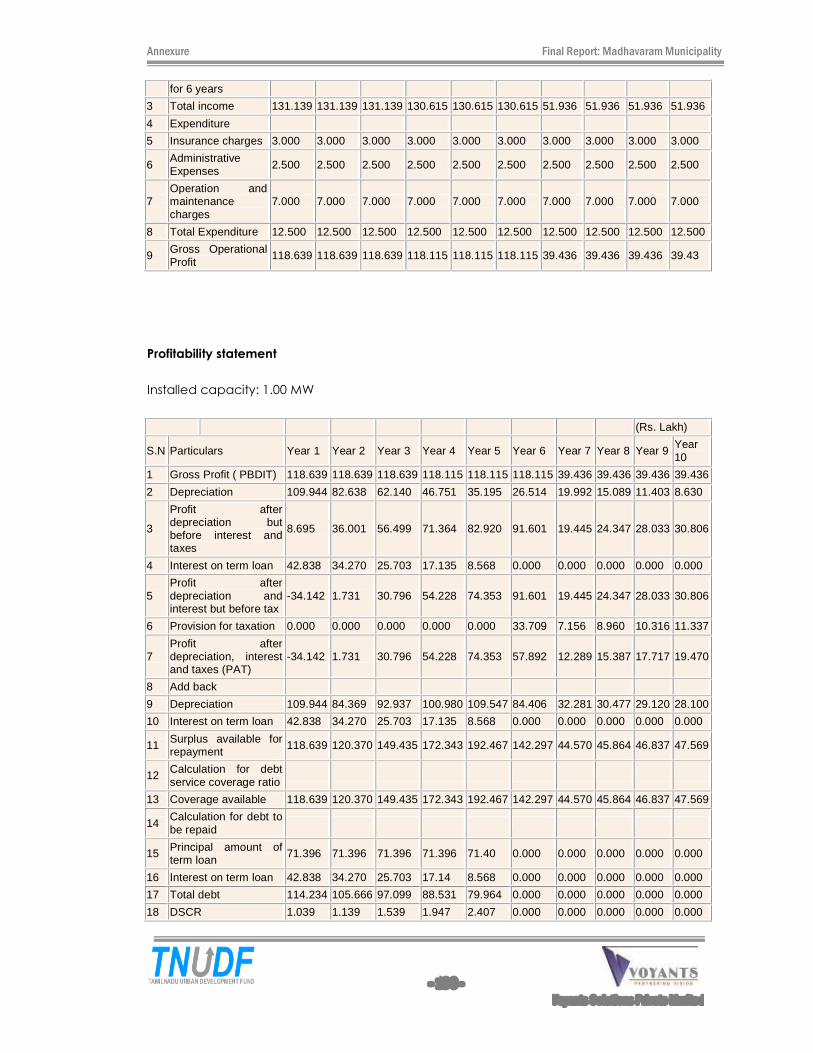
Annexure Final Report: Madhavaram Municipality
- 196 -
Voyants Solutions Private Limited
for 6 years
3 Total income 131.139 131.139 131.139 130.615 130.615 130.615 51.936 51.936 51.936 51.936
4 Expenditure
5 Insurance charges 3.000 3.000 3.000 3.000 3.000 3.000 3.000 3.000 3.000 3.000
6 Administrative Expenses 2.500 2.500 2.500 2.500 2.500 2.500 2.500 2.500 2.500 2.500
7 Operation and maintenance charges
7.000 7.000 7.000 7.000 7.000 7.000 7.000 7.000 7.000 7.000
8 Total Expenditure 12.500 12.500 12.500 12.500 12.500 12.500 12.500 12.500 12.500 12.500
9 Gross Operational Profit
118.639 118.639 118.639 118.115 118.115 118.115 39.436 39.436 39.436 39.43
Profitability statement
Installed capacity: 1.00 MW
(Rs. Lakh)
S.N Particulars Year 1 Year 2 Year 3 Year 4 Year 5 Year 6 Year 7 Year 8 Year 9 Year 10
1 Gross Profit ( PBDIT) 118.639 118.639 118.639 118.115 118.115 118.115 39.436 39.436 39.436 39.436
2 Depreciation 109.944 82.638 62.140 46.751 35.195 26.514 19.992 15.089 11.403 8.630
3
Profit after depreciation but before interest and taxes
8.695 36.001 56.499 71.364 82.920 91.601 19.445 24.347 28.033 30.806
4 Interest on term loan 42.838 34.270 25.703 17.135 8.568 0.000 0.000 0.000 0.000 0.000
5 Profit after depreciation and interest but before tax
-34.142 1.731 30.796 54.228 74.353 91.601 19.445 24.347 28.033 30.806
6 Provision for taxation 0.000 0.000 0.000 0.000 0.000 33.709 7.156 8.960 10.316 11.337
7 Profit after depreciation, interest and taxes (PAT)
-34.142 1.731 30.796 54.228 74.353 57.892 12.289 15.387 17.717 19.470
8 Add back
9 Depreciation 109.944 84.369 92.937 100.980 109.547 84.406 32.281 30.477 29.120 28.100
10 Interest on term loan 42.838 34.270 25.703 17.135 8.568 0.000 0.000 0.000 0.000 0.000
11 Surplus available for repayment
118.639 120.370 149.435 172.343 192.467 142.297 44.570 45.864 46.837 47.569
12 Calculation for debt service coverage ratio
13 Coverage available 118.639 120.370 149.435 172.343 192.467 142.297 44.570 45.864 46.837 47.569
14 Calculation for debt to be repaid
15 Principal amount of term loan
71.396 71.396 71.396 71.396 71.40 0.000 0.000 0.000 0.000 0.000
16 Interest on term loan 42.838 34.270 25.703 17.14 8.568 0.000 0.000 0.000 0.000 0.000
17 Total debt 114.234 105.666 97.099 88.531 79.964 0.000 0.000 0.000 0.000 0.000
18 DSCR 1.039 1.139 1.539 1.947 2.407 0.000 0.000 0.000 0.000 0.000
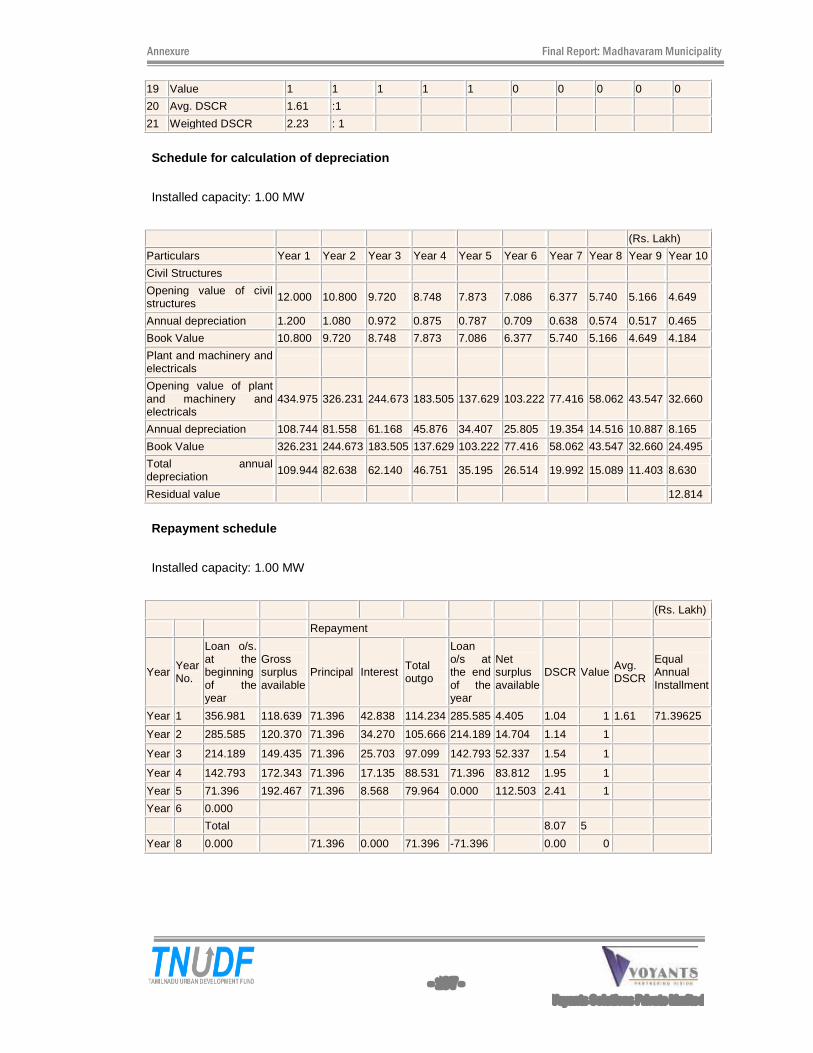
Annexure Final Report: Madhavaram Municipality
- 197 -
Voyants Solutions Private Limited
19 Value 1 1 1 1 1 0 0 0 0 0
20 Avg. DSCR 1.61 :1
21 Weighted DSCR 2.23 : 1
Schedule for calculation of depreciation
Installed capacity: 1.00 MW
(Rs. Lakh)
Particulars Year 1 Year 2 Year 3 Year 4 Year 5 Year 6 Year 7 Year 8 Year 9 Year 10
Civil Structures
Opening value of civil structures
12.000 10.800 9.720 8.748 7.873 7.086 6.377 5.740 5.166 4.649
Annual depreciation 1.200 1.080 0.972 0.875 0.787 0.709 0.638 0.574 0.517 0.465
Book Value 10.800 9.720 8.748 7.873 7.086 6.377 5.740 5.166 4.649 4.184
Plant and machinery and electricals
Opening value of plant and machinery and electricals
434.975 326.231 244.673 183.505 137.629 103.222 77.416 58.062 43.547 32.660
Annual depreciation 108.744 81.558 61.168 45.876 34.407 25.805 19.354 14.516 10.887 8.165
Book Value 326.231 244.673 183.505 137.629 103.222 77.416 58.062 43.547 32.660 24.495
Total annual depreciation 109.944 82.638 62.140 46.751 35.195 26.514 19.992 15.089 11.403 8.630
Residual value 12.814
Repayment schedule
Installed capacity: 1.00 MW
(Rs. Lakh)
Repayment
Year Year No.
Loan o/s. at the beginning of the year
Gross surplus available
Principal Interest Total outgo
Loan o/s at the end of the year
Net surplus available
DSCR Value Avg. DSCR
Equal Annual Installment
Year 1 356.981 118.639 71.396 42.838 114.234 285.585 4.405 1.04 1 1.61 71.39625
Year 2 285.585 120.370 71.396 34.270 105.666 214.189 14.704 1.14 1
Year 3 214.189 149.435 71.396 25.703 97.099 142.793 52.337 1.54 1
Year 4 142.793 172.343 71.396 17.135 88.531 71.396 83.812 1.95 1
Year 5 71.396 192.467 71.396 8.568 79.964 0.000 112.503 2.41 1
Year 6 0.000
Total 8.07 5
Year 8 0.000 71.396 0.000 71.396 -71.396 0.00 0
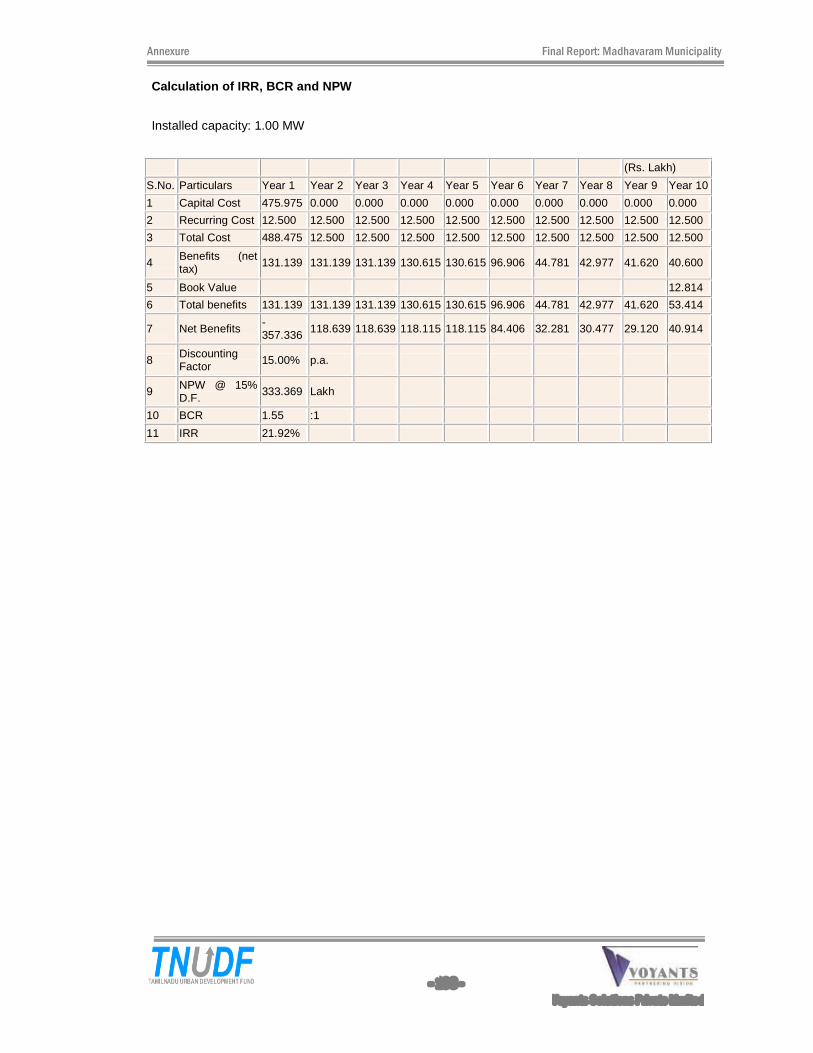
Annexure Final Report: Madhavaram Municipality
- 198 -
Voyants Solutions Private Limited
Calculation of IRR, BCR and NPW
Installed capacity: 1.00 MW
(Rs. Lakh)
S.No. Particulars Year 1 Year 2 Year 3 Year 4 Year 5 Year 6 Year 7 Year 8 Year 9 Year 10
1 Capital Cost 475.975 0.000 0.000 0.000 0.000 0.000 0.000 0.000 0.000 0.000
2 Recurring Cost 12.500 12.500 12.500 12.500 12.500 12.500 12.500 12.500 12.500 12.500
3 Total Cost 488.475 12.500 12.500 12.500 12.500 12.500 12.500 12.500 12.500 12.500
4 Benefits (net tax) 131.139 131.139 131.139 130.615 130.615 96.906 44.781 42.977 41.620 40.600
5 Book Value 12.814
6 Total benefits 131.139 131.139 131.139 130.615 130.615 96.906 44.781 42.977 41.620 53.414
7 Net Benefits -357.336 118.639 118.639 118.115 118.115 84.406 32.281 30.477 29.120 40.914
8 Discounting Factor 15.00% p.a.
9 NPW @ 15% D.F.
333.369 Lakh
10 BCR 1.55 :1
11 IRR 21.92%
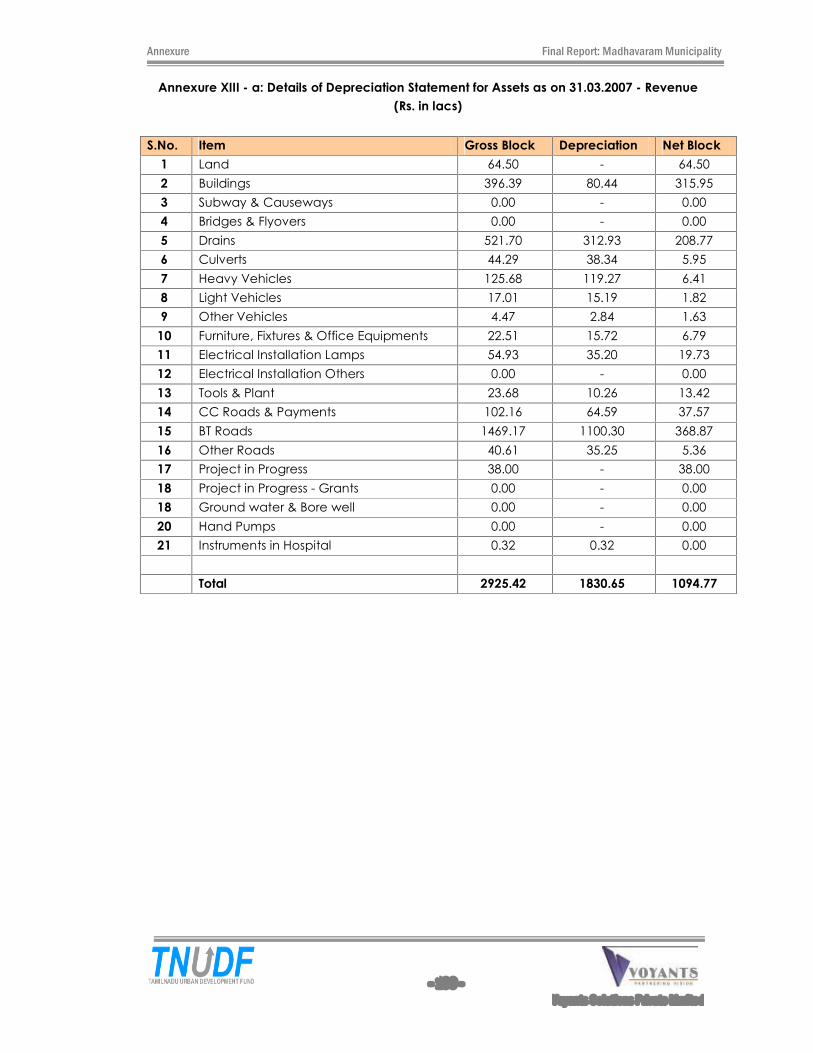
Annexure Final Report: Madhavaram Municipality
- 199 -
Voyants Solutions Private Limited
Annexure XIII - a: Details of Depreciation Statement for Assets as on 31.03.2007 - Revenue
(Rs. in lacs)
S.No. Item Gross Block Depreciation Net Block
1 Land 64.50 - 64.50
2 Buildings 396.39 80.44 315.95
3 Subway & Causeways 0.00 - 0.00
4 Bridges & Flyovers 0.00 - 0.00
5 Drains 521.70 312.93 208.77
6 Culverts 44.29 38.34 5.95
7 Heavy Vehicles 125.68 119.27 6.41
8 Light Vehicles 17.01 15.19 1.82
9 Other Vehicles 4.47 2.84 1.63
10 Furniture, Fixtures & Office Equipments 22.51 15.72 6.79
11 Electrical Installation Lamps 54.93 35.20 19.73
12 Electrical Installation Others 0.00 - 0.00
13 Tools & Plant 23.68 10.26 13.42
14 CC Roads & Payments 102.16 64.59 37.57
15 BT Roads 1469.17 1100.30 368.87
16 Other Roads 40.61 35.25 5.36
17 Project in Progress 38.00 - 38.00
18 Project in Progress - Grants 0.00 - 0.00
18 Ground water & Bore well 0.00 - 0.00
20 Hand Pumps 0.00 - 0.00
21 Instruments in Hospital 0.32 0.32 0.00
Total 2925.42 1830.65 1094.77
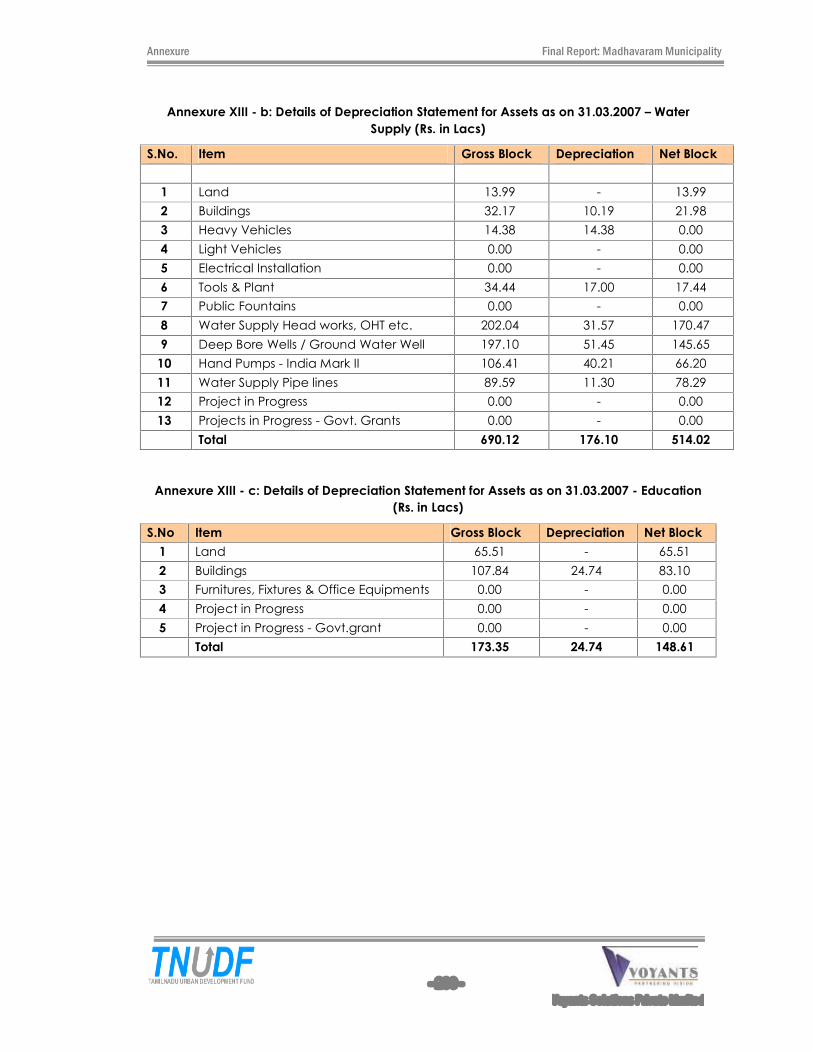
Annexure Final Report: Madhavaram Municipality
- 200 -
Voyants Solutions Private Limited
Annexure XIII - b: Details of Depreciation Statement for Assets as on 31.03.2007 � Water
Supply (Rs. in Lacs)
S.No. Item Gross Block Depreciation Net Block
1 Land 13.99 - 13.99
2 Buildings 32.17 10.19 21.98
3 Heavy Vehicles 14.38 14.38 0.00
4 Light Vehicles 0.00 - 0.00
5 Electrical Installation 0.00 - 0.00
6 Tools & Plant 34.44 17.00 17.44
7 Public Fountains 0.00 - 0.00
8 Water Supply Head works, OHT etc. 202.04 31.57 170.47
9 Deep Bore Wells / Ground Water Well 197.10 51.45 145.65
10 Hand Pumps - India Mark II 106.41 40.21 66.20
11 Water Supply Pipe lines 89.59 11.30 78.29
12 Project in Progress 0.00 - 0.00
13 Projects in Progress - Govt. Grants 0.00 - 0.00
Total 690.12 176.10 514.02
Annexure XIII - c: Details of Depreciation Statement for Assets as on 31.03.2007 - Education
(Rs. in Lacs)
S.No Item Gross Block Depreciation Net Block
1 Land 65.51 - 65.51
2 Buildings 107.84 24.74 83.10
3 Furnitures, Fixtures & Office Equipments 0.00 - 0.00
4 Project in Progress 0.00 - 0.00
5 Project in Progress - Govt.grant 0.00 - 0.00
Total 173.35 24.74 148.61