macrofaunal responses to pit–mound patch dynamics in an intertidal mudflat: local versus...
TRANSCRIPT

313 (2004) 297–315
www.elsevier.com/locate/jembe
Macrofaunal responses to pit–mound patch dynamics
in an intertidal mudflat: local versus
patch-type effects
Roman N. Zajac*
Department of Biology and Environmental Science, University of New Haven, 300 Orange Avenue,
West Haven, CT 06516, USA
Received 16 March 2004; received in revised form 22 July 2004; accepted 16 August 2004
Abstract
Biogenic structures created via feeding activities have varying effects on soft sediment
communities, altering population dynamics, creating a temporal mosaic of successional patches,
and ultimately increasing variation at different spatial scales. This study focused on assessing
population responses to pits (P) and mounds (M) in an intertidal mudflat (River Plym, England) in
order to determine (a) how these structures (max size 1400 cm2), and their formation, affected
infauna and (b) to what extent local variations in ambient communities may have affected infaunal
responses. Densities in 0- and 1-week-old pits were significantly lower than in ambient and mound
areas for most of the dominant infauna over the study period. Abundances were higher in mounds for
some species and responses to both structures differed among juveniles and adults. Recovery to
ambient levels in P–M systems took about 3 weeks, although their physical characteristics only
lasted about 2 weeks. Correlations among ambient densities and adjacent P–M systems were mixed,
but suggested decoupling between local ambient and P–M dynamics for some taxa either in relation
to age of the patch and/or size of the individuals. At the community level, local differences appeared
to be a significant source of variation in new pits, but differences were swamped out when
recruitment was high. Differences were more evident in older P–M systems. These results show that
sources of local variation in infaunal dynamics can be attributed to a combination of small-scale
disturbance/recovery processes and spatially and temporally changing ambient conditions.
0022-0981/$ -
doi:10.1016/j.
* Corresp
E-mail add
Journal of Experimental Marine Biology and Ecology
see front matter D 2004 Elsevier B.V. All rights reserved.
jembe.2004.08.011
onding author. Tel.: +1 203 932 7114; fax: +1 203 931 6097.
ress: [email protected].

R.N. Zajac / J. Exp. Mar. Biol. Ecol. 313 (2004) 297–315298
Identifying extant spatial and temporal small-scale variation can be a critical component of
understanding and interpreting larger-scale dynamics of soft-sediment systems.
D 2004 Elsevier B.V. All rights reserved.
Keywords: Colonization; Disturbance; Macrofauna; Mounds; Mudflat; Patch Dynamics; Pits
1. Introduction
Analyses of benthic populations and communities at multiple spatial scales have revealed
that, although significant amounts of variation can be associated with meso- and large scales
(~10’ s of m2 and greater), there often remains a relatively large amount of unexplained
variation that is potentially associated with smaller spatial scales (e.g. Hodda ,1990;
Morrisey et al., 1992; Zajac et al., 2003). Such observations may be due, in part, to inherent
limitations in analytical approaches such as analysis of variance, but other, perhaps more
robust, approaches such as geostatistics, regression and/or autocorrelation are also sensitive
to sampling density or processes that generate small-scale variability in habitat patch
structure across benthic landscapes (e.g. Ellis and Schneider, 1997; Hewitt et al., 1997;
Legendre et al. 1997; Cole et al., 2001). Understanding how the complex mix of biological,
physical and chemical factors that affect macrofauna interact to generate small-scale
variation may be critical in unraveling mechanisms controlling infaunal dynamics over
larger spatial scales. Additionally, such information can help in marine environmental
assessment by providing insights regarding how natural variation may interact with changes
due to perturbations and in extrapolating from small-scale experiments (Thrush et al., 2000).
Biogenic structures are common features of benthic landscapes (e.g. Hall et al., 1994)
that may be a significant source of small-scale spatial, and temporal, macrofaunal
variation. These include mounds created by burrowing and feeding, e.g. by callianassid
shrimp (Posey, 1986) and polychaetes (Weinberg, 1984), pits created by feeding activities
of a variety of animals including whales and walruses (Oliver and Slattery, 1985; Oliver et
al., 1985), rays (Thrush et al., 1991) and crabs (Hall et al., 1991), and a variety of other
surface features (e.g. Brenchley, 1981; Grant, 1983). These structures, and the activities
creating them, have been shown to have varied effects on infaunal communities. A review
of infaunal responses to biogenic disturbance patches created by organismal feeding
activities across a variety of habitats indicates large differences in response (Table 1). For
example, recovery times ranged from 10 to 70 days in patches b0.2 m2 in size and from 12
to 80 days in patches ~0.4 m2 in size, and there are no clear differences among intertidal
and subtidal habitats. Researchers who have investigated macrofaunal responses to other
types of biogenic structures have also noted varied responses (e.g. Posey, 1986; Dittmann,
1996; Widdicombe et al., 2000). Significant variation can also occur in meiofaunal
responses (e.g. Reidenauer and Thistle, 1981; Sherman et al., 1983, Cross and Curran,
2000). Differences in the effects biogenic patches have on macrofaunal communities are
likely related to patch characteristics and the response of species relative to their life
histories (Zajac and Whitlatch, 1991), and sizes and life styles (e.g. tubiculous or motile),
generating the temporal mosaic nature of soft-sediment systems as argued by Johnson
(1973).

Table 1
Summary of infaunal responses to non-human biogenic disturbance patches across a variety of habitats
Reference Hab Patch
dynamics
Method Recovery rate/
community responses
Van Blaricom,
1982
SS ?, 5% day�1,
~2 weeks
EP, NP,
~0.07 m2,
56 days
14–42 days, SDS, pits
attracted mobile epifauna
Levin, 1984 IM 8–50%,
N1 week
EP, 0.4 m2,
40 days
b40–76+ days, SDS, LHD
Oliver et al.,
1985
SS ?, b80 days EP, 0.07 m2,
80 days
N80 days, dominants lower
in pits, larger worms higher
Oliver and
Slattery, 1985
SS N30%,
2–8 months
EP, NP, 1 m2,
60 days
crustacean exploitation,
others 2–8 months
Thrush, 1986a SS c1%,
c2 weeks
EP, 0.07 m2,
48, 22 days
b48 days, abundances higher
in pits year 1, lower in year 2
Savidge and
Taghon, 1988
IS ? EP, 0.01 m2,
24 days
10–23 days, pits generallyN
ambient, (300 Am)
Hall et al., 1991 SS c3.6%,
1–22 days
EP, 0.20 m2,
24 days
24 days, abundances lower in
pits, particularly larvae.
Natural pits had reductions
but not dominants
Thrush et al.,
1991
IS 5.6–9.8%,
4–7 days
NP, 0.50 m2,
12 days
1–N12 days, bivalves more
rapidly than polychaetes,
no exploitation of pits
Netto and De
Cunha Lana,
1994
IS 50%,
b2 weeks,
EP, 0.008 m2,
18 days
10 days, pit abundances
lower than ambient (250 Am)
This study
(pits only)
IM 10%,
b3 weeks
NP, b0.04 m2,
42 days
21 days, SDS, LHD
Hab=habitat (IM=intertidal mudflat, IS=intertidal sandfalt, SS=subtidal sands). Patch dynamics column provides
estimates of % areal coverage and longevity of pits. Method column indicates whether experimental (EP) or
natural patches (NP) were used, the size of the experimental pit and the duration of observations. Recovery rate
column indicates days to population/community recovery and whether size differences among ambient and
disturbance patches were significant (SDS), and/or colonization modes were life history dependant (LHD). Unless
noted, all studies used a 500-um sieve and only pits were considered. Entries are arranged by year of publication.
R.N. Zajac / J. Exp. Mar. Biol. Ecol. 313 (2004) 297–315 299
Most studies of patches created by feeding activities by epifauna have focused on pits,
using experimental pits to assess differences in abundance among patch types and
recovery patterns (Table 1). This approach stemmed from hypotheses linking dispersal of
adults and juveniles as potential recolonizers of small-scale disturbances (e.g. Eckman,
1983; Gunther, 1992), and the potential of pits to trap organisms and food (Nowell and
Jumars, 1984; Yager et al. 1993) entrained in near-bottom flows. None of the studies
reviewed in Table 1 assessed infaunal responses to mounds that may have been created as
part of the disturbance created by pit digging. However, biogenic mounds created by
subsurface burrowers such as callianassid shrimp have been shown to influence
macrobenthic abundances and distributions (e.g. Posey, 1986). Some researchers have
noted the potential for local variations in response to these disturbances (Thrush, 1986a,b),
but this has not been studied to any great extent. Often, the patch dynamics of pits and
mounds as structural units in benthic landscapes (or benthoscapes) are not quantified. For
example, it is often not known how much of the benthoscape they occupy, how their sizes

R.N. Zajac / J. Exp. Mar. Biol. Ecol. 313 (2004) 297–315300
change over time, how long they last and at what rate new patches are created.
Concomitantly, these patch characteristics may affect infauna in somewhat less obvious,
but none-the-less ecologically significant ways.
Whilst the effects of biogenic disturbances appear to be variable, they perhaps are not
pathological. That is, there may be cause/effect components that we might be able to
ultimately elucidate, and in doing so account for greater amounts of small-scale variation
in our attempt to understand larger-scale dynamics. Here, I present a study of the dynamics
of pit and mound patches created by crabs on an intertidal mudflat. The objectives of the
study were to (a) quantify the structural dynamics of the patches as components of an
intertidal benthoscape, and (b) assess what effect patch structure and dynamics had on
infaunal populations, both with respect to the specific patch types created by the biogenic
disturbance and the contribution of local community differences. Specific questions
addressed were: (1) Are there differences in infaunal population abundances among pits,
mounds and ambient patches and how do these change over time? (2) How do
recolonization/recovery processes vary among pits and mounds? (3) Do responses differ
among juveniles and adults? (4) To what extent does local variation in pit/mound systems
contribute to population and community responses?
2. Materials and methods
2.1. Study area and pit mound patch characteristics
The study was conducted on a mudflat on the east side of the River Plym estuary in
southwestern England in Plymouth, near Saltram (50823VN; 4806VW) between April and
June 1994. Bait digging occurs in seaward portions of the river and along the west bank
(Cowie et al., 2000). No bait digging was ever observed at the site. Pits and associated
mounds were created by the shore crab, Carcinus maenas either via their feeding
activities, or during burial.
In this study, the biogenic structures created on the tidal flat were considered as pit–
mound (P–M) systems. That is, when crabs dig into the sediments a set of patch types
are created consisting of a pit, a mound of sediment displaced from the pit and the
adjacent ambient sediment that was not dug or covered by mounded sediments. To
assess the dynamics of P–M patches, several sets of data were collected. To determine
whether the number of P–M varied with tidal position, they were counted in 64 adjacent
0.16 m2 quadrats along three transects (~25 m long) located in the lower, middle and
upper intertidal zone. To assess changes in P–M density over time, the number of P–M
were counted in 30 to 45 quadrats in the mid-intertidal approximately every week over a
5-week period. Concurrently, the size of individual P–M systems found along the
transects were estimated. The quadrats were divided into 100 smaller sections (4�4 cm)
and the percent cover of pits and mounds relative to ambient sediments were estimated
by counting the number of blocks occupied by any portion of the mound and pit of the
individual P–M system.
P–M dynamics, i.e. changes in the area of pits and mounds, and pit depth, were
followed over the study period by taking measurements of marked natural P–M systems

R.N. Zajac / J. Exp. Mar. Biol. Ecol. 313 (2004) 297–315 301
and also artificially created P–M systems. On each field date, 10–15 natural, newly created
P–M systems were marked and photographed with a ruler for scale. Newly created pits
were identified by the presence of black sediments both in the pit and on the mound,
indicating recent excavation of reduced, subsurface sediments. Field observations indicate
that these P–M were 0 to 2 days old. In addition to natural pits, a series of 10 artificial P–M
systems were created, marked and photographed. Artificial P–M systems were created by
digging a pit ~3–4 cm deep using a trowel and depositing the sediments on the surface.
Both natural and artificial P–M components were measured in the field. The longest two
axes perpendicular to one another of the pits and mounds were measured as well as the
depth of the pit relative to the local ambient sediment surface. If the pit or mound were
particularly variable in shape several additional width measurements were made. The
marked pits were then re-measured on the following sampling date to track changes in P–
M size. New natural and artificial pits were marked/created on each of the first three
sampling dates. On the third sampling date, 10 additional sets of P–M were marked to
follow longer-term changes to the end of the study period. To minimize trampling of the
study area, set bpathwaysQ were used and all transects and P–M systems sampled were at
least 0.5 seaward of the pathways.
Quadrat data were used to calculate the area of pits and mounds relative to ambient
sediments over the study period. The sizes of pits and mounds based on field data were
calculated by averaging the major axes, taking their mean, dividing by two and then using
this number to calculate the area of a circle. P–M systems that were photographed were
analyzed using Sigma Scan image analysis software. Photographs were scanned and the
digital images were analyzed by tracing the boundaries of the pit and mound in each P–M
and calculating their area. For a number of P–M systems, both field and photograph-based
area estimates were made and comparisons indicated that area calculations based on field
measurements underestimated the actual pit and mound areas. Regression analysis
indicated that field (F) and photographic (P) estimates were related by the equation: P-
area=(2.3314) F-area (n=28, R2=0.7240), which was used to correct all field-based
estimates prior to subsequent analyses.
2.2. Macroinfaunal sampling
Macroinfauna were sampled by randomly selecting three P–M from the set of newly
created P–M identified in the study area, as well as three P–M from the set identified
from the previous sampling date that were 1 week old. On later sampling dates, 2- and
3-week-old P–M systems were sampled similarly. In each system, a core sample was
taken in the middle of the mound and the pit and in a random location in the adjacent
ambient sediment. All cores were identified as coming from specific P–M systems. The
cores were 3 cm in diameter by 5 cm deep. These were capped and returned to the
laboratory where they were transferred to containers and fixed using 4% formalin.
Subsequently the samples were washed on a 212-Am sieve and the residues preserved
in 70% ethanol. Prior to sorting, the samples were washed over nested 500 and 212 Amsieves to separate large and small infauna. For some of the species, this effectively
separated adults and juveniles (see below). Macrofauna were sorted and then identified
to the lowest possible taxon.

R.N. Zajac / J. Exp. Mar. Biol. Ecol. 313 (2004) 297–315302
2.3. Statistical analyses
Differences in P–M densities, sizes and area coverage among sites and sampling dates
were analyzed using nonparametric Kruskal–Wallis tests. Variance to mean ratios were
calculated to determine P–M dispersion patterns. To determine general differences in the
abundances of individual taxa among pits, mound and ambient sediments over the study
period, data from 0- and 1-week-old pits were combined and analyzed using two-way
analysis of variance (ANOVA), with separate analyses for large and small individuals (i.e.
the 500- and 212-Am size groups). To track changes in the abundance of macrofauna
relative to P–M age and patch type (i.e. pit, mound and ambient), P–M of specific ages
from the last four sampling dates were analyzed using two-way ANOVA. For all univariate
tests, data were tested for normality and homogeneity of variances assumptions, and
transformed (log(x+1)) as needed.
Analyses of macrofaunal responses to P–M dynamics focused on four taxa: three
polychaete species; the spionid Streblospio shrubsolii, the nereid Nereis diversicolor and
the sabellid Manayunkia aestuarina, and several oligochaete species (primarily
Tubificoides benedii and Paranais sp.) which were grouped for the analyses. These taxa
comprised N95% of all the individuals found on the tidal flat. Additional information on
the infaunal community in this portion of the River Plym estuary can be found in Cowie et
al. (2000).
Univariate and multivariate analyses were conducted to determine to what extent local
variation may have been causing differences in macrofaunal responses to the disturbances
and subsequent recovery patterns. One-way ANOVA was used to test differences among
individual P–M systems of specific ages. Only the ambient and mound portion of each P–
M was used in the analyses because large reductions in macrofaunal abundances in the pits
increased variation in overall abundance, masking potential local effects. Non-metric
multidimensional scaling (MDS) was used to assess local differences at the community
level using total abundances found in 0- and 1-week-old P–M systems (mound and
ambient patches only) over the study period. A Bray–Curtis similarity was calculated
using non-transformed data, and the resultant similarities used in the MDS analysis.
Multivariate analyses were performed using PRIMER software (Clarke and Gorley, 2001).
3. Results
3.1. Pit–mound patch dynamics
Large-scale benthoscape structure at the study site was relatively homogenous, being
comprised of large expanses of intertidal mudflat with scattered drainage channels. There
were no other evident large- and meso-scale benthoscape elements, and as such
benthoscape heterogeneity was primarily evident at small spatial scales, and specifically
related to the P–M patches found throughout the mudflat. The number of P–M was not
significantly different among tidal elevations (Kruskal–Wallis test, v24df =3.188,p=0.538), although there was a slight decrease at higher tidal elevations. Temporal
variation in the number of P–M was low over the study period (Fig. 1). The number of

Fig. 1. Variation in the density (F1 standard error (S.E.)) of pit–mound systems in the Plym River intertidal study
site per sampling quadrat and extrapolated to 1 m2. Also shown is the change in the variance to mean ration as a
measure of spatial dispersion.
R.N. Zajac / J. Exp. Mar. Biol. Ecol. 313 (2004) 297–315 303
patches increased slightly after the first week of the study and then remained at ~0.5 P–
M quadrat�1 (or ~3.5 m�2). Temporal changes in the number of P–M quadrat�1 were
marginally significant (Kruskal–Wallis test, v24df =8.49, p=0.075), with the only differ-
ence being between the June 2 and June 9 sampling dates, based on Kruskal–Wallace z-
tests among individual dates. Variance to mean ratios suggest that the P–M were evenly
dispersed across mudflat as most values were b1 (Fig. 1), however these were not
significantly different from random. On June 17, the variance to mean ratio was above
1, and marginally significant ( pc0.10), suggesting a somewhat clumped distribution at
this time. The mean area occupied by the P–M varied from 5% to 10% of the mudflat at
any one time, but ranged to as high as 40% cover in some areas. Temporal changes in
per cent cover were not statistically significant over the study period (Kruskal–Wallis
test, v24df =2.697, p=0.441).Artificial pits steadily decreased in total area over successive sampling dates and
appeared to last ~3 weeks (Fig. 2). In contrast, the total area of natural P–M systems
increased in size after 2 weeks, almost doubling from ~800 to 1400 cm2 and were found to
last b3 weeks. This difference is likely due to the way artificial P–M were created
compared to those naturally formed by crab bioturbation (see Discussion). The increase in
the area of natural pits after 1 week was primarily due to an increase of the mound portion
of the patch, although pit area also increased slightly. Increases in mound area were due to
significant slumping and spreading of the mound when P–M were between 0 and 1 week
old. Increases in pit area were likely due to slumping of the pit walls. Changes in the mean
total area of natural P–M were significant over their lifetime (Kruskal–Wallis test, v22df =
7.707, p=0.021), with total areas at 1 week being significantly larger than at 0 and 2 weeks
(Kruskal–Wallis z-tests among individual P–M ages). The depth of the natural pits
decreased rapidly from ~3 cm when created to several millimeters after 2 weeks.

Fig. 2. Changes in the area of pit and mound patches (top), and depth of pits (bottom) in natural and
experimentally created P–M systems during the study.
R.N. Zajac / J. Exp. Mar. Biol. Ecol. 313 (2004) 297–315304
The information collected on P–M densities, areal coverage and the dynamics of
individual P–M patches allows for a calculation of the amount of overall sediment
disturbance that occurs on the mudflat due to the creation and eventual erosion of the P–M
patches. Using a value of 10% cover at any one time, and a P–M life span of 2 weeks, then
100% of the mudflat would be disturbed via the creation of P–M patches every 20 weeks.
Assuming that the rate of patch creation and loss is constant over the year, this would
result in the entire mudflat being disturbed 2.6 times every year.
3.2. Macrofaunal responses to P–M dynamics
The spionid Streblospio shrubsolii was the most abundant species during the study
period, reaching densities of ~493,000 individuals m�2. Ambient abundances of
juveniles increased after the first week of the study and did not fluctuate to any great
extent thereafter (Fig. 3). Adult abundances were relatively constant over the study
period but increased by week 5. Abundances in pits were significantly below those

Fig. 3. Fluctuations in mean abundance (F1 standard error) of the numerically dominant taxa in 0- and 1-week-
old P–M systems over the study period. Filled symbols represent small individuals, open symbols represent large
individuals; both size-classes were combined for M. aestuarina. Lines connect means in ambient sediments. Core
size is 3.0 cm diameter.
R.N. Zajac / J. Exp. Mar. Biol. Ecol. 313 (2004) 297–315 305
found in ambient and mound patches for both adults and juveniles (Table 2, Fig. 3).
Although there were no overall statistical differences among ambient and mound
abundances, during the fourth week of the study abundances of adult and juvenile S.
shrubsolii were considerably higher in mounds than in ambient sediments. Oligochaetes
exhibited significant declines in abundance over the study period from ~56,340 to
~14,000 individuals m�2 (Fig. 3) and both large and small individuals were significantly
less abundant in pits. There were no differences in oligochaete abundance among
ambient and mound patches. Adult densities of N. diversicolor did not vary significantly
and remained at ~2800 individuals m�2 over the study period. In contrast, juvenile N.
diversicolor fluctuated considerably, and both juvenile and adult abundances were
significantly lower in pits. The abundance of M. aestuarina generally increased during
the study period from about 21,100 to 109,750 individuals m�2 (Fig. 3). Abundances of
M. aestuarina were significantly lower in pits, and mound and ambient densities did not
differ statistically on an overall basis (Table 2). However, mound abundances tended to
be higher on three of five sampling dates and pit abundances were well below ambient
levels only on two dates (Fig. 3).
Recolonization of P–M systems varied among the four taxa examined, but all sizes
and taxa eventually recovered to ambient levels by 4 weeks (Fig. 4). Over the portion
of the study period that recolonization was examined, juvenile Streblospio shrubsolli
declined and adults increased slightly in ambient sediments. A significant patch type/
age interaction (Table 3) indicates that P–M patches differed significantly from ambient
areas during the first two weeks of recovery. Juvenile abundances in pits were lower
than in ambient sediments at 0 and 2 weeks, and mound abundances were higher at 1

Table 2
Results of statistical analyses (two-way ANOVA) of changes in macrofaunal abundances over time in 0- and 1-
week-old P–M systems
Date Patch type Date/patch interaction
Total abundance 0.0011 b0.0000 0.4350
1b4,5 PbA/M
Streblospio shrubsolii
Juveniles 0.0002 b0.0000 0.6929
1b2,4,5 PbA/M
Adults 0.0088 b0.0000 0.9235
1b5, 3b5 PbA/M
Nereis diversicolor
Juveniles 0.0003 0.0003 0.8779
1b5,2 PbA/M
4b2
Adults 0.9527 0.0030 0.5795
PbA/M
Oligochaetes
Small b0.0000 b0.0000 0.9637
5b4,1,2 PbA/M
3b1,2
Large b0.0000 0.0009 0.257
5,4,3b1,2 PbA/M
Manayunkia aestuarina
All sizes 0.0007 b0.0000 0.5654
1b4,5 PbA/M
Shown are the p values calculated for each factor, and below that, results of Tukey–Kramer multiple-comparison
tests showing dates and patch types that were significantly different ( pb0.05). Dates 1, 2, 3, 4, 5 correspond to the
sequence given in Fig. 3; P=pit, M=mound, A=ambient; degrees of freedom: 4 for Date, 2 for Patch Type.
R.N. Zajac / J. Exp. Mar. Biol. Ecol. 313 (2004) 297–315306
week. For adult S. shrubsolli, pit abundances were lower at 0 and 1 week, and mound
abundances were higher at 1 week. Adult abundances recovered to ambient levels by 2
weeks and juveniles by 3 weeks. Both adult and juvenile N. diversicolor densities
changed significantly over time, but neither showed differences relative to pit and
mound patch types (Fig. 4, Table 3). However, densities of juveniles in pits were much
lower than ambient levels just after disturbance, and mound abundances were double
ambient levels at 1 week (Fig. 4). Densities of small oligochaetes differed significantly
over time and among patch types. Pit abundances were significantly lower from mound
and ambient sediments on all dates indicating no recovery of these organisms by the
end of the study period. Adult differences were marginally ( pb0.10) significant (Table
3). The significant interaction term indicates variation in response among patch types
over time. Lower abundances of large oligochaetes were found in pits at 0 and 2
weeks relative to ambient levels, but higher abundances at 1 week (Fig. 4). Mound
abundances of large oligochaetes were also higher at this time. Responses of M.
aestuarina were highly variable, particularly in pits (Fig. 4) and, as such, no
significant P–M age or patch type effects were detected during the recolonization study
(Table 3). However, abundances in mounds were higher than in ambient sediments
between 0 and 2 weeks.
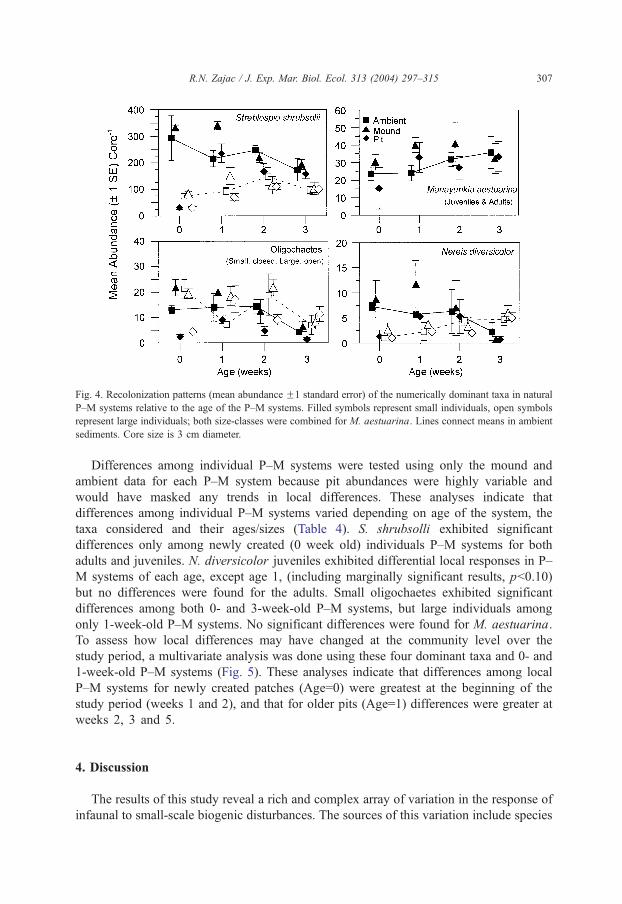
Fig. 4. Recolonization patterns (mean abundance F1 standard error) of the numerically dominant taxa in natural
P–M systems relative to the age of the P–M systems. Filled symbols represent small individuals, open symbols
represent large individuals; both size-classes were combined for M. aestuarina. Lines connect means in ambient
sediments. Core size is 3 cm diameter.
R.N. Zajac / J. Exp. Mar. Biol. Ecol. 313 (2004) 297–315 307
Differences among individual P–M systems were tested using only the mound and
ambient data for each P–M system because pit abundances were highly variable and
would have masked any trends in local differences. These analyses indicate that
differences among individual P–M systems varied depending on age of the system, the
taxa considered and their ages/sizes (Table 4). S. shrubsolli exhibited significant
differences only among newly created (0 week old) individuals P–M systems for both
adults and juveniles. N. diversicolor juveniles exhibited differential local responses in P–
M systems of each age, except age 1, (including marginally significant results, pb0.10)
but no differences were found for the adults. Small oligochaetes exhibited significant
differences among both 0- and 3-week-old P–M systems, but large individuals among
only 1-week-old P–M systems. No significant differences were found for M. aestuarina.
To assess how local differences may have changed at the community level over the
study period, a multivariate analysis was done using these four dominant taxa and 0- and
1-week-old P–M systems (Fig. 5). These analyses indicate that differences among local
P–M systems for newly created patches (Age=0) were greatest at the beginning of the
study period (weeks 1 and 2), and that for older pits (Age=1) differences were greater at
weeks 2, 3 and 5.
4. Discussion
The results of this study reveal a rich and complex array of variation in the response of
infaunal to small-scale biogenic disturbances. The sources of this variation include species

Table 3
Results of statistical analyses (two-way ANOVA) of changes in macrofaunal abundance relative to P–M system
and age
Age Patch type Age/patch interaction
Streblospio shrubsolii
Juveniles 0.0011 b0.0000 b0.0000
0b2,1 PbA/M
3b1
Adults 0.0003 0.0051 0.0330
0b1,3,2 PbA/M
Nereis diversicolor
Juveniles 0.0023 0.1417 0.3969
3b2,0,1
Adults 0.0104 0.5030 0.6911
0b3
Oligochaetes
Small 0.0003 b0.0000 0.2459
3b2,0,1 PbA/M
Large 0.0881 0.0938 0.0298
Manayunkia aestuarina
All sizes 0.1147 0.1265 0.4052
Shown are the p values calculated for each factor, and below that, results of Tukey–Kramer multiple-comparison
tests showing ages and patch types that were significantly different ( pb0.05). P–M ages are in weeks; P=pit, M=
mound, A=ambient; degrees of freedom: 3 for Age, 2 for Patch Type.
R.N. Zajac / J. Exp. Mar. Biol. Ecol. 313 (2004) 297–315308
responses to different patch types (i.e. pits vs. mounds), differences among species and
sizes of individuals, local variation at the level of individual P–M systems and temporal
changes in overall responses relative to recruitment periods.
The P–M systems are a somewhat unique, bcoupledQ patch system in the intertidal
benthoscape, consisting of two distinct co-occurring patch types, the pit and associated
mound. These are extremely dynamic, resulting in a collection of patches of different ages
ranging from newly created, distinct P–M systems to those whose physical characteristics
Table 4
Results of statistical analyses (one-way ANOVA) testing differences among P–M systems of specific ages
Species Age 0 (15) Age 1(15) Age 2 (3) Age 3 (3)
Streblospio shrubsolli
Juveniles 0.0400 0.1688 0.1120 0.6182
Adults 0.0215 0.1522 0.9108 0.3842
Nereis diversicolor
Juveniles 0.0232 0.8630 0.0010 0.0831
Adults 0.3323 0.2172 0.3682 0.9288
Oligochaetes
Small 0.0359 0.3462 0.4090 0.0925
Large 0.1370 0.0112 0.16779 0.3186
Manyunkia aestuarina
All 0.5408 0.5934 0.5000 0.9434
Only the ambient and mound portion of the P–M was used in the analyses because large reductions in
macrofaunal abundances in pits increased variation in overall abundance, thereby masking potential local effects.
Number of P–M systems tested for each age given in parentheses. Shown are the p-values calculated by the test.

Fig. 5. Results of non-metric multidimensional scaling analyses showing differences in community structure
among individual P–M systems of different ages. Top panel shows distances among 0-week-old (newly created)
P–M systems and highlights (enclosed points) systems sampled in weeks 1 and 2 of the study. Bottom panel
shows distances among 1-week-old P–M systems during the study and highlights systems sampled in weeks 2, 3
and 5.
R.N. Zajac / J. Exp. Mar. Biol. Ecol. 313 (2004) 297–315 309
have essentially been dissipated to ambient, non-disturbed sediments by erosion and in-
filling. During that process, the physical characteristics of the patches changed
considerably, including an ~100% increase in size just after they are created (Fig. 2).
The relatively rapid changes in the size of the patches and their short persistence likely
result from the process by which they are created. As crabs dig into the sediments and
create the pit, they break apart the relatively soft, yet cohesive sediments, depositing the
bioturbated sediment in a mound next to the pit. The sediment is then eroded by tidal
action and wind generated water movements, resulting in an increase in the mound area.
Slumping of the sides of the pit resulted in an increase in pit area also. Artificial P–M
systems, which were created by digging a pit using a trowel and depositing the sediments
on the surface, did not exhibit these changing patch attributes, indicating the importance of
the crabs’ feeding behavior on subsequent P–M dynamics. Although individual P–M
systems only lasted about 3 weeks, it is estimated that at any one time there were ~3–4 P–
M systems m�2, ranging from 5% to 40% cover depending on P–M area, and that the
study site was turned over about 2.6 times year�1. These results suggest that the creation
of P–M systems throughout the intertidal represented a dynamic and potentially significant
physical disturbance.

R.N. Zajac / J. Exp. Mar. Biol. Ecol. 313 (2004) 297–315310
Creation of the P–M systems resulted in pits in which the infauna were disturbed not
only by the physical mixing and removal of the sediment, but also potentially removed
via predation by the crabs. The ejection of sediment out of the pit onto the sediment
surface creating a mound potentially disturbed adjacent infauna via burial and the influx
of infauna which were not eaten and displaced with the sediments. There was no
indication that the creation of P–M systems attracted mobile epifauna such as amphipods
in large numbers, which has been observed in several (Van Blaricom 1982; Oliver and
Slattery, 1985), but not all (e.g. Thrush et al., 1991) studies of biogenic disturbances
which create pits.
The pit portion of P–M systems always had significantly lower abundances of
infauna than mounds and adjacent ambient sediments (Fig. 3, Table 2) for both adults
and juvenile (large and small) individuals. There were no indications of exploitation of
pits, nor increased recolonization via passive transport. In no cases were pit abundances
significantly higher than ambient or mound abundances during the recolonization
process (Fig. 4). That just the opposite was the case for newly created and up to 2-
week-old pits indicates that infauna in the pits were significantly reduced via predation
and/or displacement by the pit digging behavior. Furthermore, conditions in the pit
were not conducive for supporting an opportunistic response following the disturbance,
although the community is dominated by organisms that have been shown to be able to
respond opportunistically to disturbances (e.g. Grassle and Grassle, 1974, Zajac and
Whitlatch, 1982). Recovery of pits to ambient conditions occurred within 3 weeks (Fig.
4), with a steady in-filling of the pits by sediment and gradual increases in abundance
likely due to passive dispersal of adults and juveniles. Recolonization patterns varied
considerably among the taxa analyzed. Although there were significant patch/age
effects for each species, except M. aestuarina, patch type effects were only significant
for adult and juvenile S. shrubsolii and small oligochaetes. Patch type effects were
marginally significant for large oligochaetes and no differences were found for adult
and juvenile nereids. Adult N. diversicolor exhibited no differences in recolonization
among patch types and their mobility may result in local abundances equilibrating
fairly rapidly.
Infaunal abundances in mounds were generally not significantly different from
ambient sediments near the disturbance patch, or, in some cases, were higher than in
ambient sediments (Fig. 3). During recolonization, higher mean abundances in mounds
were found for all four dominant taxa at 1 week (Fig. 4). This suggests that deposition
of disturbed sediments onto the sediment surface, creating the mounds, did not have
negative effects on infauna that were buried. Infauna are resistant to moderate amounts
of burial (e.g. Maurer et al., 1986). Higher densities in the mounds may have been due
to the addition of any infauna that were deposited with the sediments from the pit and/or
increased recolonization of the mounds. Observations in the field suggest that errant
polychaetes, such as N. diversicolor, were very active on the mounds as indicated by
numerous tracks that were often visible on mound surfaces. In addition, it is interesting
to note that M. aestuarina exhibited the most positive mound beffectQ with higher
abundances in mounds on most sampling dates. Flow characteristics over and around
mounds (e.g. Dade et al., 2001) may create beneficial habitat conditions for this small
filter feeding polychaete.

R.N. Zajac / J. Exp. Mar. Biol. Ecol. 313 (2004) 297–315 311
Local spatial differences among the individual P–M systems also appear to have
contributed to the overall levels of variation found in this infaunal community.
Differences among individual P–M systems were temporally variable and also varied
with the age of the systems (Fig. 5). Community structure in newly created P–M
systems was more variable during the first two weeks of the study, whilst in the latter
portion of the study individual P–M systems were more similar . This may have
occurred because of increased recruitment during the latter portion of the study,
particularly by S. shrubsolii and M. aestuarina (Fig. 3). In contrast, older P–M
systems were more variable during the latter portion of the study. This may have been
due to differences in the rate at which the topography of individual P–M systems
reverted back to ambient conditions and local variations in recruitment and other
population processes.
These results provide insights as to the nature of the temporal mosaic characterization
first suggested for soft sediment systems by Johnson (1973), in which benthic habitats are
a collection of patches at different successional stages due to regularly occurring
disturbances to the sea floor from a variety of agents. The disturbances caused by
organisms feeding on infauna (Table 1) result in the formation of patch systems comprised
of several patch types, i.e. pits and mounds, adding to variation in community structure
and population dynamics across benthic habitats. The results of this study show that
disturbance effects and subsequent recovery dynamics in individual P–M systems vary
spatially, likely due to local differences in physical processes and population character-
istics. This further contributes to overall community variation, in addition to that attributed
to individual patch components, i.e. reduced abundances in pits and no differences or
elevated abundances in mounds. Additional variation results from differences in response
by different size-classes (and for some species, potential age-classes) of infauna. Given
these dynamics, are disturbances that form P–M systems important in structuring soft-
sediment communities? The answer to this question is difficult to ascertain. Cowie et al.
(2000) working in the same study area, found that disturbance (raking of the sediment
surface) frequencies of 1 week or more (two to three times a week) caused differences in
community structure relative to undisturbed sediments, but lower frequencies (once every
2 months, once a month, and every 2 weeks) did not. These changes comprised reductions
in the abundances of the same suite of dominant species as reported here (Cowie et al.,
2000). Although the experimental disturbance created by Cowie et al. (2000) was different
from that creating the P–M systems, their results suggest that intertidal communities such
as that studied in the Plym River, are resilient to low levels of disturbance, but that higher
frequencies act to reduce abundances of all the dominant species. Although the rate of new
patch formation was not assessed directly in my study, the estimated turnover of the
sediments in the study area 2.6 times year�1 suggests that the formation of new pits can be
considered a frequent local disturbance. This, and the significant declines in local
abundances of the dominant species in pits, suggests that the creation of P–M systems play
an important role in structuring the intertidal community, particularly in generating
variation across the intertidal landscape and creating the temporal mosaic. This local
variation can have implications for the population dynamics of species in the community,
causing spatial and temporal differences in the population trajectories across the habitat
(Zajac and Whitlatch, 1991). Reversion to ambient conditions occurred by 28 days in the

R.N. Zajac / J. Exp. Mar. Biol. Ecol. 313 (2004) 297–315312
P–M system, and usually faster in mounds than in pits. This approaches the reproductive
timing of the dominant species at the site, and as such, disturbance patches such as pits
may reduce overall reproductive effort in the population. For example, the densities of
juvenile and adult S. shrubsolii were significantly lower in 1- and 2-week-old pits
throughout the study.
Experimental manipulations of epifauna that generate pits and mounds, and feed on
the infauna, have provided mixed information as to the overall importance of pit–
mound dynamics to community structure. Working in a similar and nearby study site,
Gee et al. (1985) found that crabs, C. maenas, had significant effects on infaunal
populations but that these differed depending on crab size. M. aestuarina and S.
shrubsolii increased in small crab exclosures, whilst abundances were significantly
lower in crab enclosures. Large crabs appeared to cause an increase in the number of
small annelids and this was suggested to be the result of opportunistic responses to
sediment disturbances caused by their burrowing activity (Gee et al., 1985). However,
it does not appear that Gee et al. (1985) sampled pits and mounds specifically. Scherer
and Reise (1981) showed significant declines in infaunal abundance in enclosures with
large (N2 cm carapace width) crabs. Thrush (1986b) found mixed responses using
predator enclosures and exclosures in a deep water site, where only one of three
epifaunal species had a significant impact on the dominant infaunal species via
sediment disturbance and feeding. Hall et al. (1993), showed that exclusion of pit
digging crabs from a subtidal sandy habitat for a period of 1 year did not significantly
alter infaunal community structure, suggesting that the absence of this type of
disturbance has no effect on infaunal communities. Thrush et al. (1994) found that
exclusion of rays caused a significant increase in the abundance of certain infauna at
times when rays were present. The differences we find among these studies may be
due to whether the expectation is a change in community-level properties or
differences are mainly manifest at the population level. For example, a decrease in
disturbance may reduce species richness, as predicted by the intermediate disturbance
hypothesis (Connell, 1978; Huston, 1979; Widdicombe et al., 2000). The experimental
work by Gee et al. (1985) and Cowie et al. (2000) in the Plym and this study, suggest
that this may not be the case for estuarine intertidal habitats with a limited pool of
species that are highly adapted, although along different lines, to maintain populations
under dynamic estuarine and intertidal conditions. Thus, community-level difference
may not be apparent until there are large, frequent and/or relatively severe
disturbances. However at the population level, frequent small-scale disturbances may
contribute to generating spatial and temporal differences in population structure and
dynamics which ultimately lead to different overall trajectories over longer time spans.
What is clear is that disturbances caused by pit digging behaviors lead to significant
amounts of variation in infaunal populations over associated spatial scales and temporal
scales. The result of this study suggest that this variation can be due to the type of
patch created by the disturbance, i.e. a pit or mound, by the size (age) of the infauna,
and also by local differences among individual P–M systems across the intertidal
landscape. These types of small-scale disturbances provide a potentially good model to
explore sources of small-scale variation in soft-sediment systems in order to assess
how this variation may influence larger-scale dynamics.

R.N. Zajac / J. Exp. Mar. Biol. Ecol. 313 (2004) 297–315 313
Acknowledgments
This work was conducted while the author was a visiting scientist at the Plymouth
Marine Laboratory. I would like to express my deepest thanks to Richard Warwick for
providing this opportunity and for the brilliant, multifaceted support that he, John
Davey, Mike Kendall and Steve Widdicombe gave to me and my family during this
time. This work is dedicated to their scientific collegiality and friendship. I also thank
Darryl Allen and Chastity Jock for their assistance in the lab, and Simon Thrush and
an anonymous reviewer for comments and suggestions that helped to improve the
manuscript. As always, thanks to Fran, Julia and Katya. [RW]
References
Brenchley, G.A., 1981. Disturbance and community structure: An experimental study of bioturbation in marine
soft-bottom environments. J. Mar. Res. 39, 767–790.
Clarke, K.R., Gorley, R.N., 2001. PRIMER v5: User manual/Tutorial. PRIMER-E, Plymouth.
Cole, R.G., Healy, T.R., Wood, M.L., Foster, D.M., 2001. Statistical analysis of spatial pattern: A comparison of
grid and hierarchical sampling approaches. Environ. Monit. Assess. 69, 85–99.
Connell, J.H., 1978. Diversity in tropical rainforests and coral reefs. Science 199, 1302–1309.
Cowie, P.R., Widdicombe, S., Austen, M.C., 2000. Effects of physical disturbance on an estuarine intertidal
community: Field and mesocosm results compared. Mar. Biol. 136, 485–495.
Cross, R.E., Curran, M.C., 2000. Effects of feeding pit formation by rays on an intertidal meiobenthic community.
Estuar. Coast. Shelf Sci. 51, 293–298.
Dade, W.B., Hogg, A.J., Boudreau, B.P., 2001. Physics of flow above the sediment–water interface. In:
Boudreau, B.P., Jorgensen, B.B. (Eds.), The Benthic Boundary Layer. Oxford University Press, New York,
pp. 4–43.
Dittmann, S., 1996. Effects of macrobenthic burrows on infaunal communities in tropical tidal flats. Mar. Ecol.,
Prog. Ser. 134, 119–130.
Eckman, J.E., 1983. Hydrodynamic processes affecting benthic recruitment. Limnol. Oceanogr. 28, 241–257.
Ellis, J.I., Schneider, D.C., 1997. Evaluation of a gradient sampling design for environmental impact assessment.
Environ. Monit. Assess. 48, 157–172.
Grant, J., 1983. The relative magnitude of biological and physical sediment reworking in an intertidal community.
J. Mar. Res. 41, 673–689.
Gee, J.M., Warwick, R.M., Davey, J.T., George, C.L., 1985. Field experiments on the role of epibenthic predators
in determining prey densities in an estuarine mudflat. Estuar. Coast. Shelf Sci. 21, 429–448.
Grassle, J.F., Grassle, J.P., 1974. Opportunistic life histories and genetic systems in marine benthic polychaetes.
J. Mar. Res. 32, 253–284.
Gunther, C.P., 1992. Dispersal of intertidal invertebrates: A strategy to react to disturbances of different scales?
Neth. J. Sea Res. 30, 45–56.
Hall, S.J., Basford, D.J., Robertson, M.R., Raffaelli, D.G., Tuck, I., 1991. Patterns of recolonisation and the
importance of pit-digging by the crab Cancer pagurus in a subtidal sand habitat. Mar. Ecol., Prog. Ser. 72,
93–102.
Hall, S.J., Robertson, M.R., Basford, D.J., Fryer, R., 1993. Pit-digging by the crab Cancer pagurus: a test for
long-term, large-scale effects on infaunal community structure. J. Anim. Ecol. 62, 59–66.
Hall, S.J., Raffaelli, D., Thrush, S.F., 1994. Patchiness and disturbance in shallow water benthic assemblages. In:
Hildrew, A.G., Giller, P.S., Raffaelli, D. (Eds.), Aquatic ecology: scale, pattern and processes. Blackwell
Scientific, Oxford, pp. 333–375.
Hewitt, J.E., Legendre, P., McArdle, B.H., Thrush, S.F., Bellehumeur, C., Lawrie, S.M., 1997. Identifying
relationships between adult and juvenile bivalves at different spatial scales. J. Exp. Mar. Biol. Ecol. 216,
77–98.

R.N. Zajac / J. Exp. Mar. Biol. Ecol. 313 (2004) 297–315314
Hodda, M., 1990. Variation in estuarine littoral nematode populations over three spatial scales. Estuar. Coast.
Shelf Sci. 30, 325–340.
Huston, M.A., 1979. A general hypothesis of species diversity. Am. Nat. 113, 81–101.
Johnson, R.G., 1973. Conceptual models of benthic communities. In: Schopf, T.J.M. (Ed.), Models in
Paleobiology. Freeman Cooper, San Francisco, pp. 148–159.
Legendre, P., Thrush, S.F., Cummings, V.J., Dayton, P.K., Grant, J., Hewitt, J.E., Hines, A.H., McArdle, B.H.,
Pridmore, R.D., Schneider, D.C., Turner, S.J., Whitlatch, R.B., Wilkinson, M.R., 1997. Spatial structure of
bivalves in a sandflat: scale and generating processes. J. Exp. Mar. Biol. Ecol. 216, 99–128.
Levin, L.A., 1984. Life history and dispersal patterns in a dense infaunal polychaete assemblage: Community
structure and response to disturbance. Ecology 65, 1185–1200.
Maurer, D., Keck, R.T., Tinsman, J.C., Leatham, W.A., Wethe, C., Lord, C., Church, T.M., 1986. Vertical
migration and mortality of marine benthos in dredged material: a synthesis. Int. Rev. Gesamten Hydrobiol. 71,
49–63.
Morrisey, D.J., Howitt, L., Underwood, A.J., Stark, J.S., 1992. Spatial variation in soft-sediment benthos. Mar.
Ecol., Prog. Ser. 81, 197–204.
Netto, S.A., Da Cunha Lana, P., 1994. Effects of sediment disturbance on the structure of benthic fauna in a
subtropical tidal creek of southeastern Brazil. Mar. Ecol., Prog. Ser. 106, 239–247.
Nowell, A.R.M., Jumars, P.A., 1984. Flow environments of aquatic benthos. Ann. Rev. Ecolog. Syst. 15,
303–328.
Oliver, J.S., Slattery, P.N., 1985. Destruction and opportunity on the sea floor: Effects of gray whale feeding.
Ecology 66, 1965–1975.
Oliver, J.S., Kvitek, R.G., Slattery, P.N., 1985. Walrus feeding disturbance: Scavenging habits and recolonization
of the Bering Sea benthos. J. Exp. Mar. Biol. Ecol. 91, 233–246.
Posey, M.H., 1986. Changes in a benthic community associated with dense beds of a burrowing deposit feeder,
Callianassa californiensis. Mar. Ecol., Prog. Ser. 31, 15–22.
Reidenauer, J.A., Thistle, D., 1981. Response of a soft-bottom harpacticoid community to stingray (Dasyatis
sabina) disturbance. Mar. Biol. 65, 261–267.
Savidge, W.B., Taghon, G.L., 1988. Passive and active components of colonization following two types of
disturbance on intertidal sandflat. J. Exp. Mar. Biol. Ecol. 115, 137–155.
Scherer, B., Reise, K., 1981. Significant predation on micro- and macrobenthos by the crab Carcinus maenas L.
in the Wadden Sea. Kiel. Meeresforsch., Sonderh. 5, 490–500.
Sherman, K.M., Reidenauer, J.A., Thistle, D., Meeter, D., 1983. Role of a natural disturbance in an assemblage of
marine free-living nematodes. Mar. Ecol., Prog. Ser. 11, 23–30.
Thrush, S.F., 1986a. Spatial heterogeneity in subtidal gravel generated by the pit-digging activities of Cancer
pagurus. Mar. Ecol. Prog. Ser. 30, 221–227.
Thrush, S.F., 1986b. Community structure on the floor of a sea-lough: are large epibenthic predators important?
J. Exp. Mar. Biol. Ecol. 104, 171–183.
Thrush, S.F., Pridmore, R.D., Hewitt, J.E., Cummings, V.J., 1991. Impact of ray feeding disturbances on sandflat
macrobenthos: Do communities dominated by polychaetes or shellfish respond differently? Mar. Ecol., Prog.
Ser. 69, 245–252.
Thrush, S.F., Pridmore, R.D., Hewitt, J.E., Cummings, V.J., 1994. The importance of predators on a sandflat:
interplay between seasonal changes in prey densities and predator effects. Mar. Ecol., Prog. Ser. 107,
211–222.
Thrush, S.F., Hewitt, J.E., Cummings, V.J., Green, M.O., Funnell, G.A., Wilkinson, M.R., 2000. The generality of
field experiments: Interactions between local and broad-scale processes. Ecology 81, 399–415.
Van Blaricom, G.R., 1982. Experimental analysis of structural regulation in a marine sand community exposed to
oceanic swell. Ecol. Monogr. 52, 283–285.
Weinberg, J.R., 1984. Interactions between functional groups in soft-substrata: Do species differences matter?
J. Exp. Mar. Biol. Ecol. 80, 11–28.
Widdicombe, S., Austen, M., Kendall, M., Warwick, R., Jones, M., 2000. Bioturbation as a mechanism for
setting and maintaining levels of diversity in subtidal macrobenthic communities. Hydrobiologia 440,
369–377.

R.N. Zajac / J. Exp. Mar. Biol. Ecol. 313 (2004) 297–315 315
Yager, P.L., Nowell, A.R.M., Jumars, P.A., 1993. Enhanced deposition to pits: A local food source for benthos.
J. Mar. Res. 51, 209–236.
Zajac, R.N., Whitlatch, R.B., 1982. Responses of estuarine infauna to disturbance: I. Spatial and temporal
variation of initial recolonization. Mar. Ecol., Prog. Ser. 10, 1–14.
Zajac, R.N., Whitlatch, R.B., 1991. Demographic aspects of marine, soft sediment patch dynamics. Am. Zool. 31,
808–820.
Zajac, R.N., Lewis, R.S., Poppe, L.J., Twichell, D.C., Vozarik, J., DiGiacomo-Cohen, M.L., 2003. Responses of
infaunal populations to benthoscape patch structure in eastern Long Island Sound, and the potential
importance of transition zones. Limnol. Oceanogr. 48, 829–842.