macro evaluation of dfid’s policy frame for … for empowerment and accountability ... d. and...
TRANSCRIPT

e-Pact, is a consortium led by Oxford Policy Management and co-managed with Itad
Macro Evaluation of DFID’s Policy Frame for Empowerment and Accountability
Empowerment and Accountability Annual Technical Report 2016: What Works for Social Accountability Annexes Volume 1 Final version December 2016

E&A Macro Evaluation: Annual Technical Report 2016 – Annexes
2
Table of Contents
Table of Contents .................................................................................................................. 2
Abbreviations and acronyms ................................................................................................. 3
Annex A Framing the social accountability macro evaluation ............................................. 4
The global evidence base: what do we know? ................................................................... 4
Social accountability within DFID’s E&A framework ........................................................... 6
Annex B Methodology for the Macro Evaluation .............................................................. 10
Annex C Qualitative Comparative Analysis Findings ........................................................ 30
Annex D Terms of Reference ........................................................................................... 51
Macro Evaluations of DFID’s Strategic Vision for Girls and Women and DFID’s Policy
Frame for Empowerment and Accountability ................................................................... 51
Annex E Achieving robustness in the E&A macro evaluation: A Technical Note .............. 68

E&A Macro Evaluation: Annual Technical Report 2016 – Annexes
3
Abbreviations and acronyms
CMO Context-Mechanism-Outcome
CMC Consistent Modal Case
COC Consistent Outlier Case
DFID Department for International Development (UK)
E&A Empowerment and Accountability
EQ Evaluation Questions
ESID (Manchester) Effective States and Inclusive Development Research Centre
FCO Foreign and Commonwealth Office (UK)
GNI Gross National Income
GPAF Global Policy Action Fund
IMC Inconsistent Modal Case
KPI Key Performance Indicators
ODA Official Development Assistance
QCA Qualitative Comparative Analysis
ToC Theories of change
ToR Terms of Reference
UNIFEM United Nations Development Fund for Women

E&A Macro Evaluation: Annual Technical Report 2016 – Annexes
4
Annex A Framing the social accountability macro evaluation
Social accountability (SAcc) comprises the range of mechanisms that informed citizens (and
their organisations) use to engage in a constructive process of holding government to account
for its actions and helping government become more effective.1 Proponents believe that when
citizens participate in social accountability processes – whether through participatory planning
or through oversight and advocacy – their views and perspectives are more likely to be heard
and to influence government policies and service delivery, leading to better quality services.2
Critical observers of support to SAcc have, however, flagged the dangers of an absence of
strategic, higher-level support. Jonathan Fox, notably, draws on a review of case study
evidence to describe an ‘accountability trap’ in which SAcc’s contribution to improved services
remains localised and short-lived in the absence of strategic intervention.3
In this annex we frame the SAcc macro evaluation. We first summarise the key theoretical
influences on DFID’s approach to empowerment and accountability (E&A), consider how
these influences are reflected in DFID’s meta narrative of contribution to changes in E&A in
general and SAcc in particular, and show how a set of social accountability hypotheses
emerges from this discussion.
The global evidence base: what do we know?
This section summarises a selection of key studies cited in our background literature review.4
Received wisdom on social accountability describes a ‘short route’ relationship of social
accountability between service providers and service users.5 Current interest in evaluating this
relationship is illustrated by three recently published studies that analyse large bodies of
evidence.
The first is a study of over 500 examples of interventions (government and donor-supported)
that have sought to induce participation, including the World Bank’s effort to support
participatory development.6 The findings from their review of evidence are generally modestly
positive about the results of participatory approaches, but emphasise that the main
beneficiaries tend to be the most literate, least geographically isolated, and most politically
well-connected communities. They found ‘little evidence that induced participation builds long-
lasting cohesion, even at the community level’ and that ‘group formation tends to be both
parochial and unequal.’7
1Malena, C. et al. (2004), ‘Social accountability: An introduction to the concept and emerging practice’, Social Development Papers No. 76, Washington, DC: World Bank, December. 2 World Bank (2003) World Development Report 2004: Making Services Work for Poor People. Washington, DC: World Bank and Oxford University Press. 3 Fox, J. (2014), Social Accountability: What does the evidence really say? GPSA Global Forum PowerPoint Presentation, 14 May. Available at http://issuu.com/thegpsa/docs/social-accountability-04-13 4Shutt, C. (2014), op. cit. 5 World Bank (2003), op. cit. 6Mansuri, G. and Rao, V. (2012), Localizing Development: Does Participation Work? A World Bank Policy Research Report. Washington DC, World Bank. 7 Ibid, p.9.

E&A Macro Evaluation: Annual Technical Report 2016 – Annexes
5
Second, in a review of the experience of participatory governance mechanisms as a strategy
for increasing government responsiveness and improving public services, Speer8 assesses
the evidence on the impact of such mechanisms as positive, but limited:
Overall, the reviewed literature suggests that the public policy benefits of participatory
governance on government accountability and responsiveness remain to be proven and
that implementing participatory governance effectively is likely to be a challenging
enterprise in many places.9
Third, a meta-analysis of a sample of 100 case studies of citizen engagement10identified
citizen engagement through local associations as having the highest proportion of positive
outcomes, with both local associations and social movements scoring more highly than
participation through formal governance structures.
Social accountability in service delivery has also been shown to work with women and for
women. UNIFEM’s landmark State of the World’s Women Report11 (Goetz 2009) is a rich
source of good practice in strengthening accountability for gender-responsive service delivery.
Recent case study search in Cambodia, Indonesia and Nepal, for instance, confirmed the
empowering impact of women’s collective action in accountability relationships.12
Nonetheless, the UNIFEM report, while describing access to services as ‘a rallying point for
women’s collective action’, cautions on the importance of understanding context, including
those contexts where women’s relative powerlessness and lack of mobility results in women’s
relationship to the public sphere being mediated by men so that they effectively seek
accountability ‘at one remove from states and markets’.13
Based on our literature review, a number of consensus issues emerge from the academic and
practitioner literature relevant to SAcc interventions:
Service delivery failures stemming from weak public sector accountability are, at root,
a political economy challenge as much as a technical one.
Activating ‘political voice’ is more likely to emerge when citizens organise collectively
around issues that immediately affect their lives, and often the barrier to citizen action
is the capacity for collective action itself.14
Support for accountability processes can have an empowering effect on women’s
political voice and capacity for collective action, but this effect is mediated by gendered
social norms and the gendered division of labour.
Transparency and access to information is necessary but insufficient to stimulate
action (voice), and thereby accountability, although it often has an inherent value.
Working on both voice and accountability more consistently and systematically, is more
effective than assuming that one leads to the other.
8 Speer, J. (2012), ‘Participatory governance reform: a good strategy for increasing government responsiveness and improving public services?’ World Development 40(12): 2379, December 2012. 9 Ibid, 2385. 10Gaventa, J. and Barrett, C. (2012), ‘Mapping the outcomes of citizen engagement’, World Development 40(12): 2399–410. 11 Goetz, A. (2009), Who Answers to Women? Gender and Accountability, Progress of the World’s Women 2008/2009, New York: UNIFEM. 12 Holland J., and Rued, L. (2012), in P. Scott-Villiers and H. Sheppard, (eds) “Tackling the Governance of Socially Inclusive Service Delivery”, Public Management Review 14(2): 181–96. 13 Goetz, A. (op. cit. p.6). 14 See Joshi, A. (2013: 8), Empowerment and Accountability Research: A Framing and Rapid Scoping Paper, unpublished paper. University of Sussex: IDS, May.

E&A Macro Evaluation: Annual Technical Report 2016 – Annexes
6
Donors need to be more realistic about what can be achieved in the shorter term, and
extend funding horizons as much as possible.
Finally, a review of approaches to social accountability globally conducted by the Institute of
Development Studies (IDS)15 also concluded: that the evidence base was thin and uneven,
often being based on speculative and even anecdotal information, and sometimes reflecting
institutional biases; that theories of change (ToC) were weak and incomplete, with gaps or
missing links; that many evaluations assessed effectiveness (largely focused on output
measures) rather than impact; and some claiming attribution where it was not plausible in a
complex environment with multiple interventions.
Social accountability within DFID’s E&A framework16
The above ‘what do we know?’ review of the global evidence base iterates closely with DFID’s
conceptualisation of E&A (see Figure 1) which has been shaped by a number of key
(empirically supported) theoretical influences. In particular, there is within DFID a renewed
emphasis on the political nature of E&A interventions and DFID’s role. The narrative is of
pursuing inclusive ‘political settlements’ with ‘an opportunity set … and set of political
outcomes that are better for the poor’.17 To this end, DFID is strongly influenced by the ‘golden
thread’ narrative of inclusive development, in which nations are built sustainably and
successfully on inclusion, participation and collective action.18
The operational implication of this narrative is that DFID must think and intervene in state-
society relations in a way that goes beyond, for example, citizen participation as the
empowerment of subordinate outside groups.19 Hence, DFID is aware of the need to shift from
‘demand-side’ programming to a multi-pronged approach. This policy discussion reflects
Jonathan Fox’s20 coining of the distinction between ‘tactical’ (bounded, society-side and
information-focused) and ‘strategic’ (multiple tactics, encouraging enabling environments for
collective action and coordinating citizen voice with governmental reforms that bolster
institutional responsiveness) approaches to accountability. It also takes note of Fox’s
conclusion that a narrow focus on ‘tactical’ approaches results in localised and short-term
SAcc impacts.
Significantly, too, for this macro evaluation, DFID thinking on accountability and the pursuit of
political outcomes has embraced economic empowerment. This expansion of empowerment
in accountability terms to include a focus on economic empowerment at first viewing sits
somewhat uncomfortably in the E&A framework. Our interviews with DFID staff, however,
elicited a narrative around ‘market accountability’ and economic entitlements that achieves
some coherence with the framework as a whole. While an important part of this area concerns
transferring economic assets and skills, particularly to the poorest, DFID is also keen to focus
on the ‘enabling environment’ for economic empowerment. The thinking is influenced in part
15 McGee, R. and Kelbert, A. (2013), Review of Approaches to Social Accountability for Citizens’ Engagement Programme, Mozambique, draft unpublished report. University of Sussex: IDS, 18 June. 16 This section has been discussed with DFID staff, and largely represents an accepted view. 17Dercon, S. and Lea, N. (2012), The Golden Thread: Towards a Coherent Narrative. London: DFID. 18Acemoglu, D. and Robinson, J. (2012), Why Nations Fail: The Origins of Power, Prosperity and Poverty. London: Crown Business. 19 Hickey, S. (2012), Thinking about the Politics of Inclusive Development: Towards a Relational Approach, ESID Working Paper No. 1, October. University of Manchester: ESID. 20 Fox (2014), op. cit.
E&A Macro Evaluation: Annual Technical Report 2016 – Annexes
7
by the ongoing work of the Manchester Effective States and Inclusive Development Research
Centre (ESID) team on shifts in ‘growth regimes’ via ‘critical junctures’ from closed, rentier
capitalist economies to ‘open access orders’ that are predictable and transparent economies
with fuller participation of economic actors and entrepreneurs.21
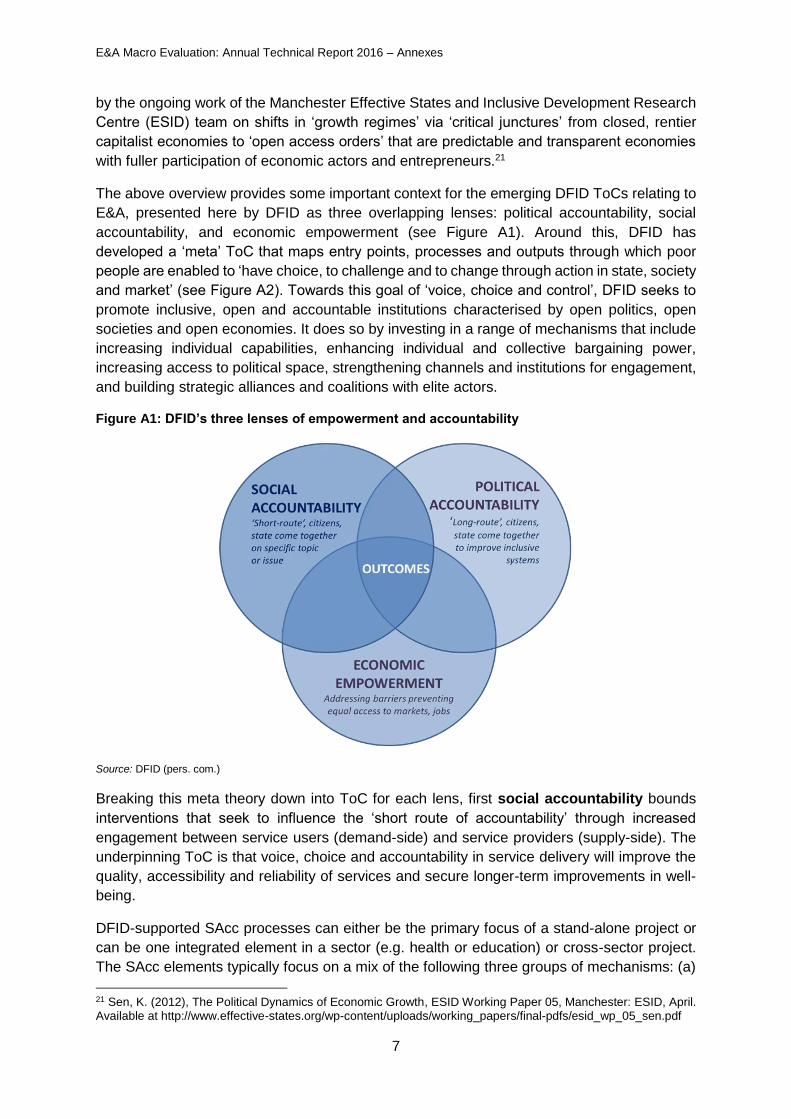
The above overview provides some important context for the emerging DFID ToCs relating to
E&A, presented here by DFID as three overlapping lenses: political accountability, social
accountability, and economic empowerment (see Figure A1). Around this, DFID has
developed a ‘meta’ ToC that maps entry points, processes and outputs through which poor
people are enabled to ‘have choice, to challenge and to change through action in state, society
and market’ (see Figure A2). Towards this goal of ‘voice, choice and control’, DFID seeks to
promote inclusive, open and accountable institutions characterised by open politics, open
societies and open economies. It does so by investing in a range of mechanisms that include
increasing individual capabilities, enhancing individual and collective bargaining power,
increasing access to political space, strengthening channels and institutions for engagement,
and building strategic alliances and coalitions with elite actors.
Figure A1: DFID’s three lenses of empowerment and accountability
Source: DFID (pers. com.)
Breaking this meta theory down into ToC for each lens, first social accountability bounds
interventions that seek to influence the ‘short route of accountability’ through increased
engagement between service users (demand-side) and service providers (supply-side). The
underpinning ToC is that voice, choice and accountability in service delivery will improve the
quality, accessibility and reliability of services and secure longer-term improvements in well-
being.
DFID-supported SAcc processes can either be the primary focus of a stand-alone project or
can be one integrated element in a sector (e.g. health or education) or cross-sector project.
The SAcc elements typically focus on a mix of the following three groups of mechanisms: (a)
21 Sen, K. (2012), The Political Dynamics of Economic Growth, ESID Working Paper 05, Manchester: ESID, April. Available at http://www.effective-states.org/wp-content/uploads/working_papers/final-pdfs/esid_wp_05_sen.pdf

E&A Macro Evaluation: Annual Technical Report 2016 – Annexes
8
demand-side awareness raising around rights and entitlements/construction of citizenship,
social mobilisation, local feedback and oversight; (b) supply-demand deliberative discussions
and spaces/platforms; and (c) building supply-side capacity and incentive structures to
respond effectively.
These SAcc interventions support processes of change that often start at the point-of-service
delivery, but which are intended either to feed up through the system or to integrate with
higher-level sector reform processes in order to improve service delivery design and delivery
more comprehensively. Furthermore, during inception phase discussions with DFID’s E&A
steering group, colleagues expressed their awareness that accountability interventions that
are limited to demand-side ‘bolt-ons’ (such as scorecards) are unlikely to bring institutional
change and improved delivery unless they effectively bridge supply and demand and tackle
the hierarchy of levels of governance of service delivery.
Political accountability bounds interventions that seek to influence the ‘long route’ of
accountability, through citizen voice and engagement in political processes and policy cycles.
This cluster of interventions is bound by the ToC that more inclusive and accountable political
systems result in more progressive and better sustained policy impacts. DFID projects with
political accountability elements support and strengthen inclusive and democratic electoral
systems, public policy consultation mechanisms, transparent and responsive policy processes
and budget/financial mechanisms, independent oversight of policy, and policy advocacy by
issue-based coalitions of interest. As with social accountability, DFID is aware that political
accountability is best strengthened by promoting change in both supply and demand. To
bridge supply and demand, DFID political accountability projects support mechanisms of both
external/vertical oversight by non-state actors and internal/horizontal mutual oversight by state
institutions, or mixes of the two.
Drawing on evidence of what works, DFID privileges collective action and pro-accountability
networks across state and society in influencing social and political accountability.22 Evidence
also suggests that effectiveness is increased when this action is ‘organic’ rather than ‘induced’
and where accountability mechanisms are locally legitimate.23 Furthermore, issue-based,
rather than generic support for accountability relationships is likely to be more effective and
sustained, particularly where these issues are locally perceived to be important.
Economic empowerment bounds interventions that seek to lower barriers to accessing
markets and jobs. The ToC here is that sustained growth and poverty reduction must link
accountability in public policy delivery with market accountability that delivers greater choice
and opportunity in private wealth creation. In this sphere, DFID-supported economic
empowerment projects or project elements include: (a) mechanisms that tackle the enabling
environment for ‘market accountability’ economic empowerment; or (b) mechanisms that
support individuals and groups to pursue their economic entitlements and related
opportunities.
This enabling environment can be influenced via mechanisms that tackle policies and laws
governing the distribution of economic entitlements and which provide contract enforcement
on economic transactions. Enabling environment mechanisms may also directly tackle the
conditions that enable or disable foreign and private investment and for regional/international
22 See for example, Gaventa and Barrett (2012), op. cit. 23 Mansuri and Rao (2012), op. cit.

E&A Macro Evaluation: Annual Technical Report 2016 – Annexes
9
trade, as well as in economic infrastructure for market integration. Projects that directly support
economic empowerment will support economic actors or groups to take up opportunities and
access resources through mechanisms – in the form of awareness raising and economic
literacy, for instance – that in some cases mirror the support to citizenship and citizen
engagement in the pursuit of social and political accountability.
Figure A2: DFID’s E&A Theory of Change
Reducing risks/barriers & increasing opportunities through support to:Political and institutional accountability• Fair and inclusive electoral systems / party systems• Effective parliamentary watchdogs• Women’s political participation, voice and leadership• Improved legal frameworks for open, inclusive
government (eg OGP)
Social accountability• Civil society coalitions• Media and social media • Context relevant transparency/info initiatives• Social accountability mechanisms• Action to address discriminatory social norms • Partnerships for sector transparency (eg budget and
extractives transparency initiatives) including through
new tech (eg MAVC)
Economic accountability• Open, transparent and accessible labour markets• Interventions in sectors of economy that are most likely
to support more inclusive political processes• Transparency of corporates• Open transparent land and property markets• Fair and accountable taxation systems
• Increased individual capabilities
• Access to political space,• Influence in decision-
making• Change in gender/social
relations change in status
• Increased agency in private and public life
• Enhanced bargaining power and capabilities at individual and collective levels
• Increased channels for engagement between state and society
• Strengthened institutions for negotiation and adjudication
• Strategic alliances/coalition building with elite actors
Poor people
have voice in household,
community and political decision making,
choice through access to services,
economic opportunities
and information
control over their own lives in more stable,
transparent and
accountable environments
Mo
vin
g aw
ay f
rom
tac
tica
l tec
hn
ical
inp
uts
, su
ch a
s o
ne
-off
rep
ort
car
ds,
to
war
ds
stra
tegi
c ap
pro
ach
es t
hat
bu
ild c
oal
itio
ns
for
chan
ge, w
ork
acr
oss
so
ciet
y, s
tate
an
d t
he
eco
no
my,
an
d c
hal
len
ge in
form
al p
olit
ical
an
d s
oci
al
no
rms
that
ben
efit
elit
es a
nd
un
der
min
e in
clu
sive
, su
stai
nab
le g
row
th.
Strategic approaches that link interventions across sectors and state-society
• Social and political transformation rarely linear or straightforward• Specific political economy conditions - open/closed deal nature of economy, inclusivity of
political settlement, political space - shape design and impact of interventions• International geo-politics and ‘backlash’ against donors increasingly shape impact
Open politics
Inclusive, transparent
political processes
+Open societies
Inclusive policies,
accessibleServices,
improvements in equality
+Open
economiesCompetition
Inclusive access to
opportunitiesAccountable corporates
Enhanced agency, voice, political space and citizen-state engagement
Inclusive, open, accountable institutions
Increased opportunities & empowerment
Source: Kate Bishop (pers. comm.)

E&A Macro Evaluation: Annual Technical Report 2016 – Annexes
10
Annex B Methodology for the macro evaluation
The methodology for the macro evaluation applied a mixed-method design to generate
evidence of what works, for whom, in what contexts and why. In 2015, we completed the
portfolio synopsis24 which presented background descriptive level statistics on the total
‘population’ of DFID empowerment and accountability (E&A) projects based on a screening
and tabulated mapping of the DFID universe of projects. Thereafter, we focused on
synthesising and analysing a set of projects relevant specifically to social accountability (for
a discussion of the positioning of social accountability within DFID’s E&A project portfolio, see
Annex A above). The social accountability project set analysis, presented in this report, was
the core of the macro evaluation and synthesised a wide range of evidence to identify and
interpret underlying causal mechanisms.
Our approach sequenced a pattern-finding qualitative comparative analysis (QCA) method
that identified significant ‘causal configurations’ of factors25 (or conditions) that were
associated with a given project outcome. The approach also included an interpretive narrative
analysis method that examined these causal configurations in greater depth and explored how
they worked in different contexts and under what conditions. Figure B1 below illustrates the
approach visually. More details on both methods applied can be found below and in the
inception report for the macro evaluations.26
Figure B1: Macro evaluation methodology
Developing testable hypotheses
To facilitate our mixed-method approach, we focused on hypothesis testing. Developing
testable hypotheses was a key element of the process and was completed through
collaborative consultation with DFID stakeholders. This involved a review of relevant applied
24 Portfolio Synopsis in Empowerment and Accountability Annual Technical Report 2015, May 2015, ePact. 25 Called ‘conditions’ in QCA language. 26 Macro Evaluations of DFID’s Strategic Vision for Girls and Women and Policy Frame for Empowerment and Accountability: Inception Report Final Version, 18 March 2015, ePact.

E&A Macro Evaluation: Annual Technical Report 2016 – Annexes
11
research literature and discussions with the DFID macro evaluation Reference Group as well
as individual key informants. This insight complemented our understanding of change
processes gleaned through the screening of projects for evaluative data quality (described
below). Once an initial set of hypotheses for the social accountability project set was
developed, this was further reviewed by DFID colleagues to ensure a sufficient level of buy-in
and ownership of the macro evaluation.
For QCA analytical purposes, we developed hypotheses linked to our categorisation, coding
and scoring of all ‘conditions’ in DFID interventions in the form of context-mechanism-
outcome (CMO) strings. Hence each hypothesis was expressed as a combination of different
contextual factors, project mechanisms and anticipated outcomes. The approach is
particularly suited to the objectives of this evaluation because it sets out to test a ‘middle-range
theory’, analysing what mixes of project ‘mechanisms’ lead to outcome changes and under
what contextual conditions these changes happen.
For the purpose of the macro evaluation we defined outcome, context and mechanism as
follows:
Outcome refers to longer-term development results to which the project aspires and
contributes, but which are not entirely within the control of the project, linked particularly to
changes in behaviours, relations, authority, laws, policies, procedures and norms. The
outcome for this social accountability project set analysis, and shared by all sampled projects,
is that of improved quality, accessibility and relevance of services. We distinguished in our
analysis, however, between improved service delivery at local/project level, and improved
higher-level/at-scale service delivery as well as improved service delivery for marginalised
groups. This distinction becomes important as we begin to ‘interrogate’ the hypotheses
introduced below. Under the general outcome of improving service delivery, we identified the
following three outcomes:
Outcome 1: Improved local-level (project area) service delivery. The quality,
accessibility and/or relevance of local service delivery in the project area has improved.
Outcome 2: Improved higher-level (at-scale) service delivery. The quality, accessibility
and/or relevance of service delivery at levels of provision higher than the project
area(s) (e.g. district, provincial, regional and/or national) has improved.
Outcome 3: Services improved for marginalised social groups. An observable
increase in the quality, accessibility and relevance of services to marginalised social
groups, including women and girls.
We also identified a number of intermediate outcomes that feature commonly in DFID project
theories of change (ToC). These intermediate outcomes typically represent changes in social
accountability-related processes, relations or behaviours en route to improved service
delivery. These include elements of changes in ‘demand-side’ and ‘supply-side’ behaviour in
the social accountability relationship. A key reason for including intermediate outcomes in our
analysis was the outcome homogeneity observed in the pilot phase of the macro evaluation.
We found that the outcome of improved services at the local level was almost always
achieved, leaving us with insufficient diversity to generate interesting findings using QCA. By
identifying these intermediate outcomes, we created more diversity of outcomes within a
shortened ‘causal chain’, thus strengthening the utility of the QCA analysis. We identified the
following intermediate outcomes:

E&A Macro Evaluation: Annual Technical Report 2016 – Annexes
12
Intermediate Outcome 1: Enhanced openness/ responsiveness among local service
providers/ discretionary budget holders. Local service providers/ discretionary budget
holders invite engagement, listen and respond to the voices of users.
Intermediate Outcome 2: Increased formal citizen engagement in local platforms.
Increase in sustained and effective citizen engagement through invited formal
channels/ platforms.
Intermediate Outcome 3: Increased participation in local platforms by marginalised
social groups. Socially marginalised groups, including women, excluded castes, ethnic
minorities, participate meaningfully (rather than tokenistically) in local
channels/platforms and have their voices heard.
Intermediate Outcome 4: Increased informal/independent citizen action. Civil society
individuals and/or groups independently increase strategies and actions to hold local
service providers/grant holders accountable and/or challenge public policy and
governance of service delivery.
Intermediate Outcome 5: Public policy and/or budgets progressively revised and/or
increased in the relevant sectors. Progressive policy revision and/or, or increase, in
budget investment in service provision (policy content).
Intermediate Outcome 6: Governance of service delivery improved at higher levels
(above the facility or local discretionary budget level). Improvement in higher-level
organisational arrangements and procedures to deliver services, including greater
openness to citizen engagement.
Context refers to aspects of the environment that affect the achievement of project outcomes,
often in complex and unpredictable ways. We identified a set of contextual conditions that are
particularly significant to social accountability, adapted from O’Meally’s (2013) categorisation
of context domains.27 For instance, social accountability interventions will vary according to
political society context, including state fragility and the nature of the ‘social contract’
underpinning state-society relations. We would also expect social accountability to be affected
by civil society capacity, by the nature of pro-poor policy provision and by how equal society
is. To measure context conditions, we used proxy indicators from nationally comparable
indices such as the CIVICUS Civil Society Index (see Table B1). Based on our information
gathering process, we identified the following significant contextual conditions:
Context 1: Civil society capacity. The capacity of civil society actors and groups to
engage in social accountability relations with the service providers and other duty
bearers. Dimensions of civil society capacity include: organisational performance;
technical capacity; financial sustainability; mobilisation skills; political literacy; and
connectivity.
Context 2: State fragility. The levels of conflict in political society between actors or
groups with competing interests. Dimensions of state fragility include: capacity to
maintain political stability; capacity to reach agreements across conflicting groups; and
levels of documented conflict.
Context 3: Pro-poor policies. The benefits from policy decision making accruing to
the poor and marginalised in society. Dimensions of pro-poor policies include: levels
27 O’Meally describes five overlapping contextual domains that sit within a sixth, global domain. See O’Meally, S.C. (2013), Mapping Context for Social Accountability. Washington, DC: World Bank.

E&A Macro Evaluation: Annual Technical Report 2016 – Annexes
13
of investment in delivering public goods and services; time horizons for using public
resources; tendencies towards redistribution; and safety net provision for the most
vulnerable.
Context 4: State-society relations. The relationship between state service providers
and citizen service users in respect of a shared understanding of obligations and
entitlements. Dimensions of state-society relations include: levels of clientelistic or
patronage-based allocation of goods and resources; levels of rent seeking behaviour
by public officials; and incidences of participatory spaces or channels for state-citizen
communication and monitoring.
Context 5: Equality. The equality of social relations between societal groups in terms
of social, economic and political well-being and inclusion. Dimensions of equality
include: income equality; gender equality; and social equality.
Context 6: Donor influence. The reliance of the state on international donor funding
to deliver public goods and services.
Mechanisms comprise interacting project elements that collectively contribute to the project
outcome according to the project’s ToC. There are a number of intervention mechanisms that
are employed by projects in different mixes. These mechanisms encompass local-level
demand and supply-side support to promote short route accountability but in some projects
extend to supporting change in higher-level ‘governance of service delivery’ and policy
dialogue processes. We identified the following significant mechanisms in social accountability
interventions:
Mechanism 1: Supporting inclusive forms of collective action among service users.
Creating and or strengthening collective action taken by service users, including
socially differentiated groups.
Mechanism 2: Supporting local-level evidence gathering and oversight by service
users, service providers or by partnerships. Supporting gathering of activity, output,
outcome or impact data (including perception data) in the form of surveys, scorecards
or opinion gathering.
Mechanism 3: Involving local and national media in information dissemination,
oversight and discussion. Supporting the invitation (including possibly capacity
strengthening) of local or national media (such as newspapers, radio or TV) in
providing coverage and airing discussion of aspects of service delivery.
Mechanism 4: Constructing citizenship through information access, rights awareness
and critical reflection. Raising consciousness and awareness of rights and entitlements
among individuals and socially differentiated groups that would typically lack these
attributes.
Mechanism 5: Building/strengthening local policy deliberative platforms and
facilitating dialogue. Supporting the development of local spaces or platforms that bring
service providers and service users together to discuss aspects of service delivery.
Mechanism 6: Building/strengthening national policy deliberative platforms and
facilitating dialogue. Supporting the development of national spaces or platforms that
bring policymakers and citizens together to discuss aspects of policy.
E&A Macro Evaluation: Annual Technical Report 2016 – Annexes
14
Mechanism 7: Strengthening provider capacity/ responsiveness. Strengthening the
technical and organisational capacity of service providers and enhancing their ability
and willingness to respond to the voices of service users in different forums.
Mechanism 8: Engaging multi-stakeholders including elites/vested interests.
Encouraging people with different positions in society that have a shared interest in
specific policy or service delivery issues to talk to each other, including the poor, civil
society groups, private sector actors, journalists, government officials, retired
government officials and academics.
Mechanism 9: Integrating/ linking to state horizontal accountability functions. Making
explicit links between social accountability relationships and accountability
relationships that exist between different (executive, legislative and judicial) arms of
the state.
Mechanism 10: Supporting constitutional and/or legislative reform. Supporting
research, advocacy and dialogue that promotes pro-poor constitutional and/or
legislative reform.
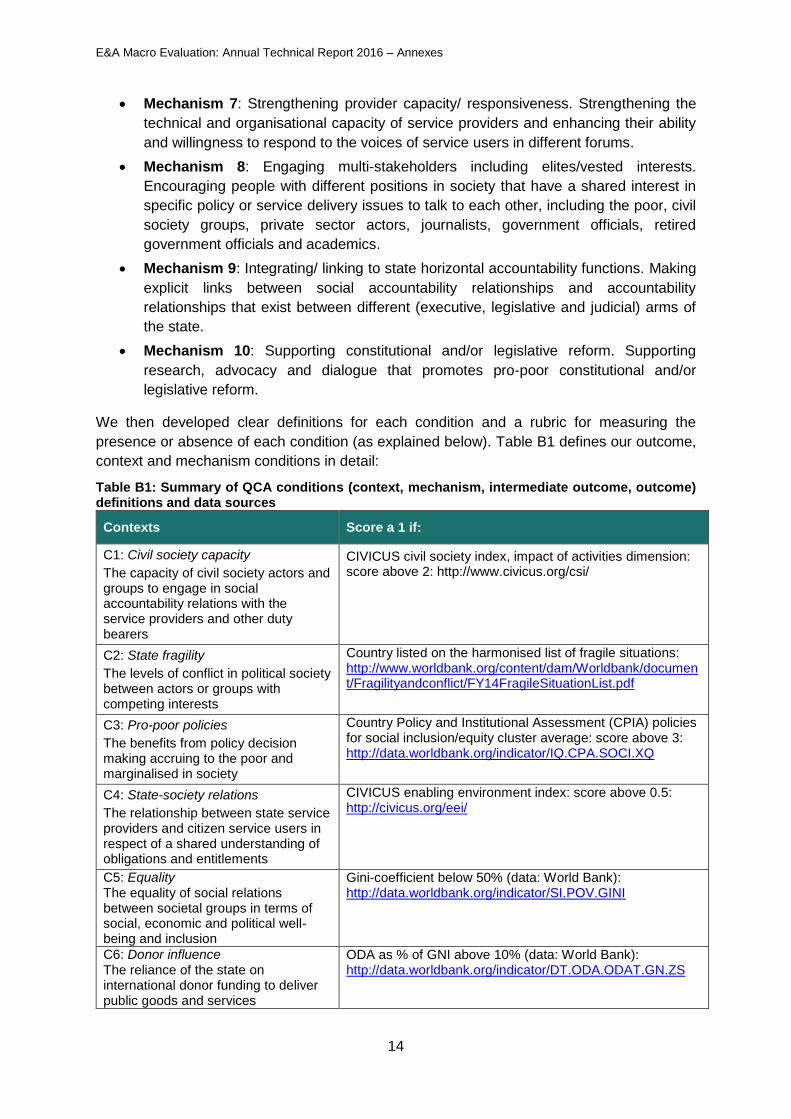
We then developed clear definitions for each condition and a rubric for measuring the
presence or absence of each condition (as explained below). Table B1 defines our outcome,
context and mechanism conditions in detail:
Table B1: Summary of QCA conditions (context, mechanism, intermediate outcome, outcome) definitions and data sources
Contexts Score a 1 if:
C1: Civil society capacity
The capacity of civil society actors and groups to engage in social accountability relations with the service providers and other duty bearers
CIVICUS civil society index, impact of activities dimension: score above 2: http://www.civicus.org/csi/
C2: State fragility
The levels of conflict in political society between actors or groups with competing interests
Country listed on the harmonised list of fragile situations: http://www.worldbank.org/content/dam/Worldbank/document/Fragilityandconflict/FY14FragileSituationList.pdf
C3: Pro-poor policies
The benefits from policy decision making accruing to the poor and marginalised in society
Country Policy and Institutional Assessment (CPIA) policies for social inclusion/equity cluster average: score above 3: http://data.worldbank.org/indicator/IQ.CPA.SOCI.XQ
C4: State-society relations
The relationship between state service providers and citizen service users in respect of a shared understanding of obligations and entitlements
CIVICUS enabling environment index: score above 0.5: http://civicus.org/eei/
C5: Equality The equality of social relations between societal groups in terms of social, economic and political well-being and inclusion
Gini-coefficient below 50% (data: World Bank): http://data.worldbank.org/indicator/SI.POV.GINI
C6: Donor influence The reliance of the state on international donor funding to deliver public goods and services
ODA as % of GNI above 10% (data: World Bank): http://data.worldbank.org/indicator/DT.ODA.ODAT.GN.ZS

E&A Macro Evaluation: Annual Technical Report 2016 – Annexes
15
Mechanisms Score a 1 if, on the balance of reported evidence available, we assess that the mechanism is characterised by:
M1: Directly supporting higher-level policy change and governance of service delivery
Supporting the higher-level policy and governance changes that create an ‘enabling environment’ for citizens to hold service providers accountable for the delivery of goods and services to which they are entitled
M2: Supporting citizen evidence gathering, monitoring and feedback
Supporting gathering of evidence by groups of service users or their representatives: in the form of surveys, scorecards or opinion gathering
M3: Supporting media oversight Supporting the invitation (including possibly capacity strengthening) of local or national media (such as newspapers, radio or TV) in providing coverage and airing discussion of aspects of service delivery
M4: Citizen awareness raising and mobilisation
Raising consciousness and awareness of rights and entitlements among individuals and socially differentiated groups that would typically lack these attributes as the basis for mobilisation
M5: Building local deliberative platforms
Supporting the development of local spaces or platforms that bring service providers and service users together to discuss aspects of service delivery
M6: Social inclusion targeted in design of local platforms
Local deliberative platforms have social inclusion conditionalities such as gender quotas
M7: Feeding evidence and learning into higher-level discussions
Supporting higher-level deliberations (above facility level) on governance of service delivery based on evidence, including from what works in project areas
M8: Strengthening provider capacity/ responsiveness
Strengthening the technical and organisational capacity of service providers and enhancing their ability and willingness to respond to the voices of service users in different forums
M9. Supporting long-term initiatives Supporting multiple programme phases and/or supporting an embedded initiative
Intermediate outcomes Score a 1 if, on the balance of reported evidence available, we assess that the intervention has contributed to significant progress in the following intermediate outcomes:
IO1. Enhanced openness/ responsiveness among local service providers/discretionary budget holders
Local service providers/ discretionary budget holders invite engagement, listen and respond to the voices of users
IO2. Increased formal citizen engagement in local platforms
Increase in sustained and effective citizen engagement through invited formal channels/ platforms
IO3. Increased participation in local platforms by marginalised social groups
Socially marginalised groups, including women, excluded castes, ethnic minorities, participate meaningfully (rather than tokenistically) in local channels/platforms and have their voices heard
IO4. Increased informal/independent citizen action
Civil society individuals and/or groups independently increase strategies and actions to hold local service providers/grant holders accountable and/or challenge public policy and governance of service delivery
IO5. Public policy and/or budgets progressively revised and/or increased in the relevant sectors
Progressive policy revision and/or, or increase, in budget investment in service provision (policy content)
IO6: Governance of service delivery improved at higher levels (above the facility or local discretionary budget level)
Improvement in higher-level organisational arrangements and procedures to deliver services, including greater openness to citizen engagement
Outcomes Score a 1 if, on the balance of reported evidence
available, we assess that the intervention has contributed to the following outcomes:

E&A Macro Evaluation: Annual Technical Report 2016 – Annexes
16
O1. Improved local-level (project area) service delivery
The quality, accessibility and/or relevance of local service delivery in the project area has improved
O2. Improved higher-level (at-scale) service delivery
The quality, accessibility and/or relevance of service delivery at levels of provision higher than the project area(s) (e.g. district, provincial, regional and/or national) has improved
O3. Services improved for marginalised social groups
An observable increase in the quality, accessibility and relevance of services to marginalised social groups, including women and girls
We combined and presented these conditions in a framework, as shown in Figure B2.
Figure B2: Context-mechanism-outcome configuration for social accountability project set
Context Mechanism Outcome
C1: Civil society capacity
C2: State fragility
C3: Pro-poor policies
C4: State-society relations
C5: Equality
C6: Donor influence
M1: Directly supporting higher-level policy change and governance of service delivery
M2: Supporting citizen evidence gathering, monitoring and feedback
M3: Supporting media oversight
M4: Citizen awareness raising and mobilisation
M5: Building local deliberative platforms
M6: Social inclusion targeted in design of local platforms
M7: Feeding evidence and learning into higher-level discussions
M8: Strengthening provider capacity/ responsiveness
M9. Supporting long-term initiatives
O1. Improved local-level (project area) service delivery
O2. Improved higher-level (at-scale) service delivery
O3. Services improved for marginalised social groups
Via Intermediate outcomes:
IO1. Enhanced openness/ responsiveness among local service providers/ discretionary budget holders
IO2. Increased formal citizen engagement in local platforms
IO3. Increased participation in local platforms by marginalised social groups
IO4. Increased informal/independent citizen action
IO5. Public policy and/or budgets progressively revised and/or increased in the relevant sectors
IO6: Governance of service delivery improved at higher levels (above the facility or local discretionary budget level)
Using Figure B2 as a menu, we then combined strings of conditions to develop a set of
hypotheses that reflected our initial review process and discussions with DFID (explained
above). Hence using the CMO framework, we developed the following list of 17 hypotheses
to be tested using QCA:
1. Improved higher-level (at-scale) service delivery (O2), results from evidence gathering
(M2) and improved upward information flows (M7).

E&A Macro Evaluation: Annual Technical Report 2016 – Annexes
17
2. Higher-level (at-scale) service delivery (O2) is achieved only when social accountability
mechanisms include support for feeding evidence and learning into higher-level
discussions (M7) and higher-level legislative and policy change (M1).
3. Mechanisms supporting a mix of formal (invited) citizen engagement (IO2) and informal
(uninvited) citizen engagement (IO4) are more likely to contribute to improved project-
level service delivery (O1, O2).
4. Without improved governance of service delivery (IO6), social accountability
mechanisms will not improve local service delivery (O1).
5. Social accountability mechanisms in any combination (M1–M9) do not result in improved
services for marginalised social groups (O3).
6. Combining social inclusion conditionalities in design of local platforms (M6) with
Increased participation in local platforms by marginalised social groups (IO3) results in
improved services for marginalised social groups (O3).
7. Social accountability mechanisms in any combination (M1–M8) will improve service
delivery (O1, O2) when they are supported through multiple phases or via embedded
initiatives (M9).
8. Supporting long-term initiatives (M9) is more important for achieving improved higher-
level (at-scale) service delivery (O2) than for achieving Improved local-level (project
area) service delivery (O1) or Services improved for marginalised social groups (O3).
9. When state-society relations indicate a weak social contract (C4) greater local-level
responsiveness (IO1) is best achieved via informal citizen action (IO4) and media
oversight (M3).
10. In a state-society context with strong social contract (C4) improving citizens’ knowledge
of their entitlements (M4) and/or improving their capacity to monitor services (M2) will
increase formal (IO2) and informal (IO4) citizen engagement with service providers.
11. An environment of pro-poor policies and openness (C3) is essential to increase citizen
engagement for better service delivery (IO2, IO4).
12. In fragile state contexts (C2) local deliberative platforms (M5) are necessary but not
sufficient to increase citizen engagement (IO2).
13. Building local deliberative platforms (M5) will increase and sustain the participation of
marginalised social groups (IO3) in contexts of high social inequality (C5).
14. In contexts of high social inequality (C5), support to formal citizen engagement in local
platforms (IO2, IO3) will not be achieved through any mix of mechanisms (M1-M9).
15. Where civil society capacity is weak (C1), media engagement (M3) is important to
increase responsiveness (IO1) and increase citizen action (IO2, IO4).
16. In pro-poor policy making contexts (C3), feeding project-level evidence and learning into
higher-level discussions (M7) drives more progressive policy/increased budgets (IO5).
17. In pro-poor policy making contexts (C3), feeding project-level evidence and learning into
higher-level discussions (M7) drives improved higher-level governance of service
delivery (IO6) without the need for direct support to governance (M1).

E&A Macro Evaluation: Annual Technical Report 2016 – Annexes
18
Selecting a project set for QCA
During the inception phase, we had identified 180 projects relevant to social accountability,
and uploaded associated documentation onto the macro evaluation database. The
methodology for this process can be found in the Annual Technical Report 2015.28
The next step was to select those projects which had sufficient evaluative data quality to be
included in the QCA phase of the project set analysis. To do so, we undertook two steps:
We selected those 84 projects which were initially coded as having sufficient evaluative
data quality when the macro evaluation database was constructed; and
We subjected these 84 projects to another round of data quality assessment, this time
focusing more specifically on the extent to which there was evaluative data on the
achievement of our main outcome of improved service delivery. This data quality
screening process resulted in a reduced number of 50 cases which were included in
the project set analysis.
Given that our sample included all projects with sufficient data quality and was not subject to
any purposeful sampling which might introduce bias, we believe that the project selection is
as close to a probability-based sample as it was possible. A probability-based sample would
have required detailed coding of the whole DFID E&A portfolio which was far beyond the scope
of this macro evaluation.
To further minimise external validity concerns, we considered possible biases that might arise
through a geographically prioritised or politically driven selection of projects for additional
evaluation or extra oversight by DFID. To explore possible biases, we analysed whether the
project set was a good reflection of the portfolio by mapping the project set profile onto the
total project population using the portfolio synopsis descriptive data.
We first compared the distribution of DFID outcome scores where available, which provided
us with a preliminary indicator of possible positive or negative bias. We then compared our
initial project set of 84 projects to the overall population of 180 social accountability (SAcc)
projects on a number of descriptive criteria. Our comparative analysis confirmed that the
sample was represented a good reflection of the portfolio against these criteria, which is
important to consider when thinking about the external validity of our findings.
When comparing the two populations with project outcome scores, we found that the project
set almost perfectly matchedthe project population in terms of outcome scores for the projects
where such data was available. While outcome scores are not available for the large majority
of projects, this provides nevertheless a strong indication that positive or negative bias is a
minor risk when analysing this project set.
28 Annex B Methodology for the Macro Evaluation in Empowerment and Accountability Annual Technical Report 2015, May 2015, ePact.

E&A Macro Evaluation: Annual Technical Report 2016 – Annexes
19
Table B2. Outcome Scores for SAcc population and SAcc project set
Outcome score
Population %
Project set %
A++ 1 0
A+ 6 7
A 14 13
B 7 7
C 1 1
No information 71 71
When comparing projects by length of project, we found that the project set was composed of slightly older projects that tended to have ended already. This is expected, given that such projects are likely to have produced more evaluative material for the time being. However, the difference was not substantial. The duration of projects was comparable across the project set and the project population.
Table B3. Time data for SAcc population and SAcc project set
Start date Duration
Population %
Project set %
Population %
Project set %
2014 5 2 1 year 1 0
2013 20 12 2 years 4 4
2012 25 27 3 years 23 23
2011 12 13 4 years 25 24
2010 13 16 5 years 31 33
2009 or before 25 30 6 years 7 6
End date 7 years 4 4
2012 4 6 8 years 3 2
2013 15 16 9 years 1 4
2014 11 9
10 years or more
2 1
2015 29 43
2016 20 12
2017 or later 21 15
The project set almost perfectly matched the project population in terms of its geographical
distribution (see Table B4).
Table B4. Geographical distribution of SAcc population and SAcc project set
Region
Population %
Project set %
East and Central Africa 30 31
Asia and the Caribbean 17 16
Middle East and North Africa 3 3
West and Southern Africa 35 30
Western Asia 10 14

E&A Macro Evaluation: Annual Technical Report 2016 – Annexes
20
Global or other 5 5
Income
Low-income country 60 62
Middle-income country 40 38
Fragility
Fragile/conflict-affected country 34 38
Non-fragile/conflict-affected country 66 62
In terms of budget, the project set was composed of projects with slightly larger budgets than
the project population (see Table B5). This is expected, given that larger projects are more
likely to be subject to evaluation. However, the differences were not substantial.
Table B5. Budget size of SAcc population and SAcc project set
Project budget
Population %
Project set %
£500,000 – £1 million 2 0
£1 – £2 million 5 3
£2 – 5 million 15 8
£5 – £10 million 13 11
£10 – £20 million 14 17
£20 – £50 million 28 32
£50 – £100 million 10 8
£100 million or more 14 21
DFID contribution
Population %
Project set %
£500,000 – £1 million 5 3
£1 – £2 million 3 4
£2 – 5 million 19 9
£5 – £10 million 14 15
£10 – £20 million 18 20
£20 – £50 million 26 31
£50 – £100 million 9 10
£100 million or more 6 9
Finally, we found that the project set was composed of projects with slightly more overlaps
with other E&A areas, which was likely to be related to the somewhat larger budgets of these
projects. Again, the differences were not substantial.
Table B6. E&A lens overlaps of SAcc population and SAcc project set
Overlaps
Population %
Project set %
Overlaps with political accountability 34 41
Overlaps with economic empowerment 6 13
Overlaps with both 3 5

E&A Macro Evaluation: Annual Technical Report 2016 – Annexes
21
Applying QCA to the project set
Having established a project set of 50 SAcc projects with sufficient outcome level evaluative
data, we were then able to start QCA. In a first step, we subjected the 17 hypotheses listed
above to QCA testing, with results presented in Annex C. This allowed us in the first instance
to find, for each hypothesis, if there was any plausible underlying causal mechanism behind a
given outcome, and then to elaborate on how that worked.
We first systematised the range of CMO conditions, introduced above, that emerged from our
review of the project set reporting and evaluative data, and applied a binary score (1=largely
present; 0=largely absent) to each condition for each project in the project set. When there
was insufficient evidence to judge a condition, it was rated as missing and a blank cell was left
in the QCA dataset.
This binary score emerged from a process of qualitative data extraction from the project
documentation to provide evidence against each condition up on which to justify a score of 1
or 0. Hence when coding each condition as either ‘present’ or ‘absent’ for all 50 projects, we
went through all available project documentation and extracted qualitative data on all 23
conditions using the macro evaluation database on EPPI Reviewer. This provided a clear
evidence trail from the data to our coding and helped the team cross-check and quality assure
each researcher’s work. We also developed a comprehensive spreadsheet with summary
justifications for each binary score applied.
To increase reliability further, the QCA scoring was systematically applied and triangulated by
a group of researchers with shared conceptual understandings of the conditions involved. We
also undertook a normalisation process among researchers through blind double-coding and
follow-up discussions, to reach a shared understanding of our conditions and rubrics. We
identified and coded our conditions in a transparent manner that could be replicated by any
researcher. Each score was cross-checked by another member of the evaluation team,
looking at the primary evidence extracted from project documentation as well as the summary
justifications provided.
We note that mechanisms were easier to assess as present or absent than outcomes. We
were also not able to specify conditions and thresholds more precisely without losing coverage
(specificity vs generalisability)29. Given the complex concepts we were dealing with, a certain
degree of subjective judgement was unavoidable but this was based transparently on the
evaluative evidence available. This was further strengthened by rigorous cross-checking
between researchers and a clear evidence trail linking coding judgements to the available
evidence extracted into EPPI Reviewer as described above,
We then applied QCA to subsets of cases that shared the specified conditions (or causal
configurations) in each hypothesis. For example, for hypothesis 1, above, we tested the
strength of association with a positive outcome [improved higher-level (at-scale) service
delivery (O2)] of a subset of projects that all had the following conditions present: results from
evidence gathering (M2) and improved upward information flows (M7). We summarised the
results of our QCA analysis in a series of truth tables (presented in Annex C) that allowed us
to identify plausible patterns of conditions that would give rise to the given outcome. This
29 According to the QCA literature, when using crisp set QCA it is not always necessary to provide a detailed definition of thresholds as long as absence and presence of a condition are clearly defined (see, for instance, Ragin and Rihoux 2008).

E&A Macro Evaluation: Annual Technical Report 2016 – Annexes
22
hypothesis-testing approach was agreed with DFID in a series of engagements prior to the
analysis.
For a hypothesis to be confirmed, the following criteria had to be met:
If the wording of a hypothesis implies a necessity relationship, a necessity consistency threshold of 0.930;
If the wording of a hypothesis implies a sufficiency relationship, a sufficiency consistency threshold of 0.9;
If the wording of a hypothesis relates to the likelihood of sufficiency or necessity, a stronger31 association than in competing models as measured by consistency and coverage; and
Additionally, findings were characterised as ambivalent if the following was the case:
For necessity statements, if the ratio of cases presenting the condition (or configuration) to cases not presenting the condition (or configuration) is over 0.9 or under 0.1; and
For sufficiency statements, if the ratio of cases presenting the outcome to the total number of cases in the model is over 0.9 or under 0.1.
The wording of the hypotheses implies the following types of relationships:
Hypothesis Type of relationship implied
Hypothesis 1: Higher-level (at-scale) service delivery (O2) is achieved only when SAcc mechanisms include support for feeding evidence and learning into higher-level discussions (M7) and higher-level legislative and policy change (M1).
Necessity
Hypothesis 2a: Mechanisms supporting a mix of formal (invited) citizen engagement (IO2) and informal (uninvited) citizen engagement (IO4) are more likely to contribute to improved local-level (project area) service delivery (O1).
Likelihood of sufficiency or necessity
Hypothesis 2b: Mechanisms supporting a mix of formal (invited) citizen engagement (IO2) and informal (uninvited) citizen engagement (IO4) are more likely to contribute to improved higher-level service delivery (O2)
Likelihood of sufficiency or necessity
Hypothesis 3: Awareness raising (M4) and supporting socially inclusive platforms (M6) result in improved services for marginalised social groups (O3)
Sufficiency
Hypothesis 4: Combining support to socially inclusive local platforms (M6) with increased participation by marginalised social groups (IO3) results in improved services for marginalised social groups (O3)
Sufficiency
Hypothesis 5: When state-society relations indicate a weak social contract (C4), greater local-level responsiveness (IO1) is best achieved via informal citizen action (IO4) and media oversight (M3)
Likelihood of sufficiency or necessity
Hypothesis 6: In a state-society context with a strong social contract (C4), improving citizens’ knowledge of their entitlements
Sufficiency
30 A threshold of 0.9 is good practice (see, for instance, Schneider & Wagemann 2010) and was judged as reasonable given the size of the dataset. 31 Where differences are small significance tests were conducted using binomial tables as suggested in Befani , B. (2016): Pathways to Change: Evaluating development interventions with Qualitative Comparative Analysis (QCA). EBA Report 05/16.

E&A Macro Evaluation: Annual Technical Report 2016 – Annexes
23
(M4) and/or improving their capacity to monitor services (M2) will increase formal citizen engagement with service providers (IO2)
Given the focus on hypothesis-testing, equifinality was assessed within the existing set of
hypotheses. We tested multiple configurations within our hypotheses and often identified
multiple pathways to achieving the outcome. More inductive analysis through the Quine
McCluskey algorithm was not feasible given the large number of gaps in the database.
Inconsistencies were systematically interrogated during the narrative analysis as discussed
below.
Finally, we tested the robustness of our findings through ‘sensitivity analysis’ of our QCA
results. Instead of randomly adding and removing conditions and cases, we were presented
with a ‘natural experiment’ in that the original dataset was modified after new or improved data
was obtained. This changed the content of some cells and added content to previously blank
cells, which in turn affected the selection of cases included in the models (for all hypotheses
except one). In spite of these changes, the vast majority of our findings did not change
substantially, which is an argument supporting their robustness. The biggest change was
observed for hypothesis 15, for which we only had 11 cases in the first place, which confirms
that when findings are observed over a medium or large number of cases they are likely to be
more robust (see QCA in Annex C).
Sensitivity analysis is approached in terms of a number of suggested operations.32 Below we
report these and explain how and why our “natural experiment” did or did not make these
possible.
1. Removal of conditions: we could not remove conditions because in each hypothesis
we already had a small number of conditions.
2. Change of calibration criteria: this would have been an extremely complex and
cumbersome change for this dataset. This strategy is usually recommended when the
calibration process is automatic or semi-automatic.
3. Change of frequency thresholds: we did not use frequency thresholds in the first place
(all combinations were included in the analysis, irrespective of their frequency) so we
could not change those as part of the sensitivity analysis.
4. Change of consistency criteria for inclusion in the truth table: we did not use Boolean
minimisations in most cases so did not have to decide what to do with ‘contradictory
cases’. Most of our synthesis procedures are of a superset and subset nature so we
do not need to select cases for inclusion in a truth table. We just simply measured
consistency scores.
5. Removal and addition of cases: this is what the second round of analysis ‘naturally’
did, filling in data gaps and replacing data in a way that can be largely considered
random. Note that no sensitivity analysis specifies how many cells in the matrix need
to change. The only general idea is that the changes need to be marginal and simulate
32 See Schneider C and C Wagemann (2012), Set-Theoretic Methods for the Social Sciences: A Guide to Qualitative Comparative Analysis, Cambridge University Press.

E&A Macro Evaluation: Annual Technical Report 2016 – Annexes
24
measurement and random error: a total of 24 changes (which can be considered to
some extent ‘random’) have been made out of 1200 cells.
For further detail on the application of QCA in this macro evaluation, please see the inception
report.33
Selecting cases for narrative analysis
Following the application of QCA, we consulted DFID on which of the 17 hypotheses we would
take forward for narrative analysis. As part of this discussion we flagged which hypothesis had
yielded particularly strong associations between a given mix of contexts-mechanisms and a
given intermediate outcome or outcome. This consultation process resulted in a final list of
seven hypotheses where patterns emerged for a significant number of cases in that causal
configuration and/or where interesting associations had emerged. We renumbered these
seven hypotheses as follows:
Hypothesis 1 (Outcome 2): Higher-level (at-scale) service delivery (O2) is achieved
only when SAcc mechanisms include support for feeding evidence and learning into
higher-level discussions (M7) and higher-level legislative and policy change (M1).
Hypothesis 2a (Outcome 1): Mechanisms supporting a mix of formal (invited) citizen
engagement (IO2) and informal (uninvited) citizen engagement (IO4) are more likely
to contribute to improved project-level service delivery (O1).
Hypothesis 2b (Outcome 2) Mechanisms supporting a mix of formal (invited) citizen
engagement (IO2) and informal (uninvited) citizen engagement (IO4) are more likely
to contribute to improved higher-level service delivery (O2).
Hypothesis 3 (Outcome 3): SAcc mechanisms M4 (awareness raising) + M6 (socially
inclusive platforms) result in improved services for marginalised social groups (O3).
Hypothesis 4 (Outcome 3): Combining social inclusion in the design of local platforms
(M6) with achieving increased participation in local platforms by marginalised social
groups (IO3) results in improved services for marginalised social groups (O3).
Hypothesis 5 (Intermediate Outcome 1): When state-society relations indicate a
weak social contract (C4,) greater local-level responsiveness (IO1) is best achieved
via informal citizen action (IO4) and media oversight (M3).
Hypothesis 6 (Intermediate Outcome 2): In a state-society context with a strong
social contract (C4), improving citizens’ knowledge of their entitlements (M4) and/or
improving their capacity to monitor services (M2) will increase formal (IO2) citizen
engagement with service providers.
For each hypothesis we ensured that the selection of cases for in-depth, narrative analysis
was transparent. For each hypothesis, we focused on the dominant configuration and we
identified two clusters of cases to subject to in-depth analysis:
1. Cases that exemplified the configuration of conditions associated with a given outcome
of interest (consistent cases).
33 Macro Evaluations of DFID’s Strategic Vision for Girls and Women and Policy Frame for Empowerment and Accountability: Inception Report Final Version, 18 March 2015, ePact.
E&A Macro Evaluation: Annual Technical Report 2016 – Annexes
25
2. Cases that were inconsistent, having the same configuration of conditions but with
outcome absent (inconsistent cases).
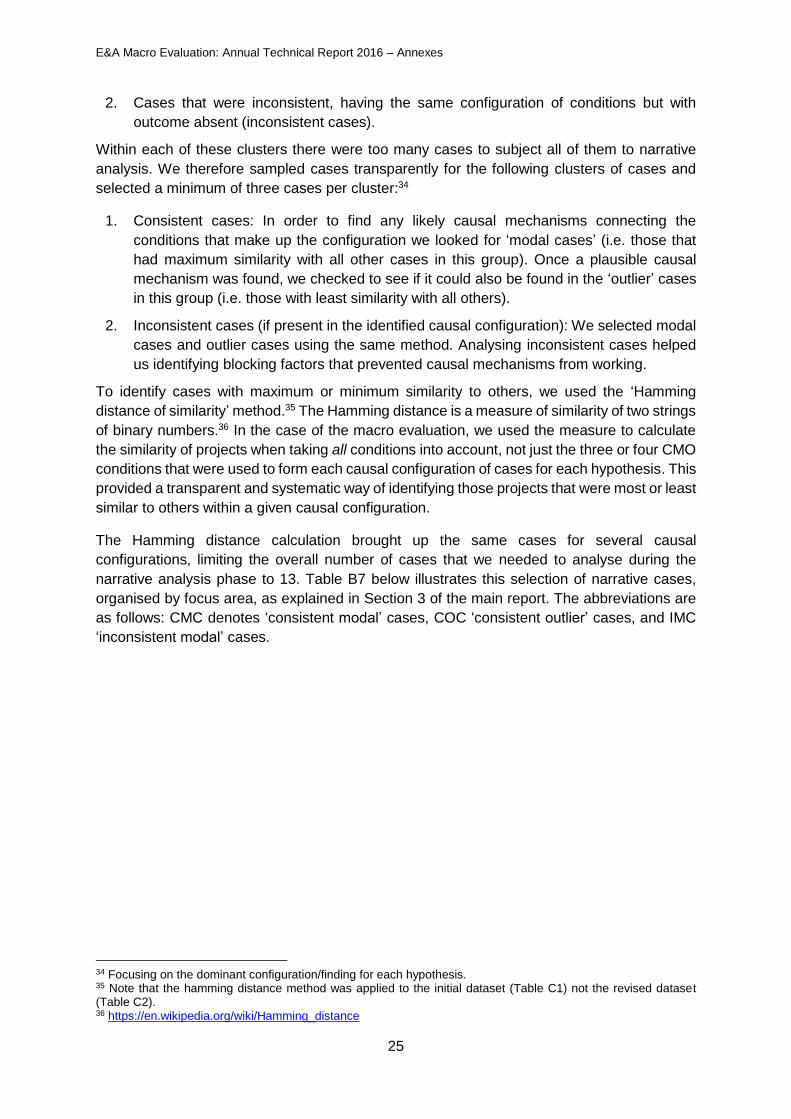
Within each of these clusters there were too many cases to subject all of them to narrative
analysis. We therefore sampled cases transparently for the following clusters of cases and
selected a minimum of three cases per cluster:34
1. Consistent cases: In order to find any likely causal mechanisms connecting the
conditions that make up the configuration we looked for ‘modal cases’ (i.e. those that
had maximum similarity with all other cases in this group). Once a plausible causal
mechanism was found, we checked to see if it could also be found in the ‘outlier’ cases
in this group (i.e. those with least similarity with all others).
2. Inconsistent cases (if present in the identified causal configuration): We selected modal
cases and outlier cases using the same method. Analysing inconsistent cases helped
us identifying blocking factors that prevented causal mechanisms from working.
To identify cases with maximum or minimum similarity to others, we used the ‘Hamming
distance of similarity’ method.35 The Hamming distance is a measure of similarity of two strings
of binary numbers.36 In the case of the macro evaluation, we used the measure to calculate
the similarity of projects when taking all conditions into account, not just the three or four CMO
conditions that were used to form each causal configuration of cases for each hypothesis. This
provided a transparent and systematic way of identifying those projects that were most or least
similar to others within a given causal configuration.
The Hamming distance calculation brought up the same cases for several causal
configurations, limiting the overall number of cases that we needed to analyse during the
narrative analysis phase to 13. Table B7 below illustrates this selection of narrative cases,
organised by focus area, as explained in Section 3 of the main report. The abbreviations are
as follows: CMC denotes ‘consistent modal’ cases, COC ‘consistent outlier’ cases, and IMC
‘inconsistent modal’ cases.
34 Focusing on the dominant configuration/finding for each hypothesis. 35 Note that the hamming distance method was applied to the initial dataset (Table C1) not the revised dataset (Table C2). 36 https://en.wikipedia.org/wiki/Hamming_distance

E&A Macro Evaluation: Annual Technical Report 2016 – Annexes
26
Table B7: Case selection for narrative analysis
Focus area 1 Focus area 2 Focus area 3
H1 H2a H2b H3 H4 H5* H6b H6a*
1. Rights and Governance Challenge Fund Bangladesh succeeded by the Creating Opportunities for the Poor and Excluded programme (2004–16)
CMC
CMC
2. Rural Water Supply Programme in Tanzania (2012–15)
COC
3. Kenya Accountable Devolution Programme (2012–15)
IMC
4. Supporting the implementation of the Free Health Care Initiative, Sierra Leone (2010–16)
COC
COC
5. Partnership for Transforming Health Systems 2 Nigeria (2008–14)
CMC
CMC
CMC
6. Foundation for Civil Society Programme, Tanzania (2008–15)
IMC
CMC
CMC
7. Community Land Use Fund Mozambique (2006–14)
COC
8. Reducing Maternal and Neonatal Deaths in Rural South Africa Through the Revitalisation of Primary Health Care (2011–16)
COC
COC
9. Drivers of Accountability Programme Kenya (2010–16)
IMC
IMC
10. Public Policy Information Monitoring and Advocacy, Rwanda (2009–13)
COC
11. Twaweza, Tanzania (2009–15)
IMC
12. Madhya Pradesh Rural Livelihoods Project – Phase 2 (2007–14)
CMC
13. Strengthening Monitoring and Performance Management for the Poor in South Africa (2012–16)
COC
* There were no inconsistent cases for these hypotheses
Narrative analysis
Using these QCA findings of the causal configurations linked to each of the seven hypotheses,
we then sought to interpret and illustrate these patterns based on narrative analysis. Narrative
analysis involves a deeper comparative qualitative analysis of the evaluative material
available. It also involved additional key informant interviews conducted by phone/skype with
individuals who were deeply involved in the project and/or who had been linked to the project

E&A Macro Evaluation: Annual Technical Report 2016 – Annexes
27
in an evaluative capacity. The narrative analysis case studies are collected together in the
accompanying Volume 2 to this report.
The narrative analysis sought to illustrate the QCA findings through the construction of simple
readable narratives which connected the conditions in the dominant configuration of each
CMO hypothesis in a way that was both plausible and respectful of the facts. It also aimed at
excavating to establish if there was a ‘real-life’ causal mechanism or explanatory model that
connected the events described by the configuration of conditions found via QCA. We
systematically interrogated inconsistencies by selecting inconsistent cases for narrative
analysis and investigating in detail why these inconsistent cases have failed to display the
outcome. Contrasting consistent cases and inconsistent cases to achieve a deeper level of
understanding was a key element of the narrative analysis.
We increased the trustworthiness of the causal inference in our narrative analysis through
demonstrating ‘rigorous thinking’.37 For each case study this involved (a) coding, summarising
and tabulating causal explanations and accompanying evidence for each outcome; and (b)
translating this table into a causal flow diagram that showed our interpretative analysis of
change and contribution to change. Once we completed this within-case analysis, we then
compared the tables and flow diagrams for all sampled cases in the cluster in order to consider
alternative explanations for change.
We further strengthened our confidence in the verifiability of these emerging explanatory
models by subjecting them to cross-checking and interrogation by at least one other
researcher, who reviewed the evidence cited and its interpretation. This internal challenge
function – the basis of achieving trustworthiness in qualitative research38 – enabled us to
increase our confidence in the internal validity of our interpretations.
Methodology limitations
Throughout the application of this methodology discussed above we have explained our use
of robustness principles to increase the reliability, internal validity and external validity of our
findings. These three robustness principles, along with a fourth cross-cutting principle of
transparency, are discussed in more detail in a Robustness Note,39 included as Annex F and
submitted to DFID during the methodology design phase of this SAcc macro evaluation.
Despite this purposeful application of robustness principles, the methodology remained
subject to a number of limitations, including:
The use of nationally comparable indices for context conditions, such as the CIVICUS
enabling environment index (all indexes listed in Annex B, Table B1), allowed us to
standardise and increase the reliability of the QCA scoring for context. These context
conditions were agreed with DFID staff as part of the hypothesis development process
in 2015 after a careful reading of some relevant case study documentation. However,
37 On the distinction between rigour as statistically verifiable attribution and rigour as ‘quality of thought, see Stern, E., Stame, N., Mayne, J., Forss, K., Davies, R. and Befani, B. (2012), Broadening the Range of Designs and Methods for Impact Evaluations. (Working Paper No. 38), London, Department for International Development; White, H. and Phillips, D. (2012), Addressing Attribution of Cause and Effect in Small n Impact Evaluations: Towards an Integrated Framework (Working Paper No. 15), International Initiative for Impact Evaluation (3ie). 38 Lincoln, Y. S. and E. G. Guba (1985), Naturalistic Inquiry, London: Sage. 39 ePact (2015), ‘Achieving robustness in the E&A macro evaluation: A Technical Note’, Brighton: Itad.

E&A Macro Evaluation: Annual Technical Report 2016 – Annexes
28
this decision to use existing indices created data gaps in cases where specific
countries were not covered by any given index.
The subsequent application of a binary score to these project context conditions
proved for the most part to be too crude to be of utility. We were measuring the
complexity of national context and its variation over project areas and over project
lifetime. This rendered the binary scoring approach to be too insensitive to be useful
as a pattern-finding tool for the influence of context. To create a more ‘granular’ set of
contextual categories on the other hand, would have reduced our ability to score a
sufficient number of projects against each context criterion for this to be useful for QCA
analysis of clusters of conditions. This is because QCA requires a minimum number of
scored conditions for significance to be established. However, it may be useful to
explore this option through re-analysing existing case studies to determine whether it
would be possible to identify mid-level context conditions that are more specific but still
broad enough to be usefully coded across all cases.
The QCA dataset had data gaps, with 104 out of 1200 data points missing. The
majority (67) of these 104 missing data points related to project contexts and gaps in
index coverage (discussed in the first bullet point above). Out of the remaining 37
missing data points, the majority (29) related to project intermediate outcome or
outcome conditions for which we had insufficient evidence to score a ‘1’ or a ‘0’. This
meant that there were data gaps for each hypothesis tested, requiring the manual
construction of 17 different sub-datasets. Most significantly, the data gaps limited our
ability to perform more inductive analysis using QCA software and Boolean
minimisation procedures. Hypothesis-testing40 as agreed with DFID hence remained
our primary approach.
Our ability to iterate was limited due to time and resource constraints linked to the
sequencing of the methods. Combining QCA with narrative analysis required
sequencing each evaluation step carefully, which resulted in a long timeline. For
instance, hypotheses had to be finalised before data extraction and coding could begin.
Similarly, QCA had to be finalised before the cases studies for our narrative analysis
were selected using the ‘Hamming distance of similarity’. At the same time, both data
extraction/coding and narrative analysis threw up additional factors and hypotheses to
be tested which would have benefitted from another round of data extraction/coding.
The resulting modifications to the dataset might also have affected the case study
selection (through changes to the ‘Hamming distance of similarity’), possibly
generating another set of additional factors and hypotheses, and so on. Finally, it might
also have been interesting to check the refined theory against the overall portfolio of
180 SAcc project. In short, iteration could have been useful but would have required a
large amount of additional time and resources that were not available. This was not
budgeted for and not agreed with DFID either.
We did not complete the sensitivity analysis of the QCA data set as detailed in the
Robustness Note. Instead, we relied on the ‘natural experiment’ of a second-round,
modified QCA data set, which provided us with a proxy sensitivity test (see discussion
on page 23 of this Annex). This was a fit-for-purpose alternative and affected the
dataset as a whole, with most hypotheses being tested on different sub-datasets.
However, there was one exception: the dataset relevant to hypothesis 6 was left
40 Hypothesis-testing is a valid approach to using QCA as specific in the relevant literature.

E&A Macro Evaluation: Annual Technical Report 2016 – Annexes
29
unaffected and the ‘natural experiment’ did not work for this hypothesis specifically
(and as a consequence we cannot claim to have performed a sensitivity test for this
hypothesis in particular).
While limited generalisation41 is possible for our QCA findings, findings from the
narrative analysis are only illustrative. The cases are used to illustrate what the
hypotheses look like in practice and provide a more in-depth understanding of how
change comes about. However, this means that insights from the narrative analysis
are not necessarily applicable to other cases and that they could not provide the
foundation for our recommendations. Through the initial review of project reporting in
the SAcc project portfolio, we were able to confirm a minimum level of evaluative data
quality in the selection of the 50 projects included in the final project set. Nonetheless,
the evaluative quality of data for these projects still varied considerably in terms of
coverage and analytical depth. This affected the depth of narrative analysis that could
be achieved for any given project. The approach taken attempted to extract evidence
on how causality was operating from existing reviews and evaluation, which in most
cases had not used a theory/causality driven approach. Consequently, in most cases,
evidence was insufficient to explain causal mechanisms in much depth. The presence
of actual evaluations (as opposed to evaluative content in project reporting) was rare.
Following on from the above, collecting primary data through key informant interviews
proved effective in deepening our understanding of project contribution to change but
was time-limited. We were able to engage with 20 key informants relating to 13 projects
but the tight timeline prevented us from a reaching out more broadly.
41 In the sense discussed in Befani, B. (2016). Pathways to change: Evaluating development interventions with qualitative comparative analysis (QCA). Stockholm, p. 145 onwards.

E&A Macro Evaluation: Annual Technical Report 2016 – Annexes
30
Annex C Qualitative comparative analysis findings
This annex provides information about the QCA models tested. For each hypothesis, we
tabulate the main QCA findings. Venn diagrams and further measures can be supplied upon
request. Where we modified models and tested different versions, this is made clear. Both
necessity and sufficiency analysis were conducted using QCA software.
Importantly, we tested all hypotheses with two slightly different datasets:
The initial dataset before undertaking the narrative analysis;
A revised dataset with a few modifications that resulted from verifying our initial QCA
coding during the narrative analysis.
This represented a ‘natural experiment’ and allowed us to test the sensitivity of our QCA
findings (see Annex B for further detail on the sensitivity analysis). Throughout the document,
findings from the initial dataset are stated in brackets where they differed from the revised
dataset. This allows the reader to compare findings from both datasets.
H1: Improved higher-level (at-scale) service delivery (O2), results from evidence
gathering (M2) and improved upward information flows (M7)
Table H1 (O2): Presence of evidence gathering (M2) and improved upward information flows (M7); Absence of evidence gathering (m2) and improved upward information flows (m7)
Outcome O2
Co
nfi
gura
tio
n M2*M7 Present Absent Cases
Present 8 20 (19) 28 (27)
Absent 4 13 17
Cases 12 33 (32) 45 (44)
Outcome O2
Co
nfi
gura
tio
n
M2*m7 Present Absent Cases
Present 2 6 (7) 8 (9)
Absent 10 27 (25) 37 (35)
Cases 12 33 (32) 45 (44)

E&A Macro Evaluation: Annual Technical Report 2016 – Annexes
31
Outcome O2
Co
nfi
gura
tio
n m2*M7 Present Absent Cases
Present 1 4 (3) 5 (4)
Absent 11 29 40
Cases 12 33 (32) 45 (44)
Outcome O2
Co
nfi
gura
tio
n m2*m7 Present Absent Cases
Present 1 3 4
Absent 11 30 (29) 41 (40)
Cases 12 33 (32) 45 (44)
H2: Higher-level (at-scale) service delivery (O2) is achieved only when SAcc
mechanisms include support for feeding evidence and learning into higher-level
discussions (M7) and higher-level legislative and policy change (M1)
Table H2 (O2): Presence of learning into higher-level discussions (M7) and higher-level legislative and policy change (M1); Absence of learning into higher-level discussions (m7) and higher-level legislative and policy change (m1)
Outcome
Configura
tio
n
M1*M7 Present Absent Cases
Present 7 17 (15) 24 (22)
Absent 5 16 (17) 21 (22)
Cases 12 33 (32) 45 (44)
Outcome
Configura
tio
n M1*m7 Present Absent Cases
Present 3 4 7
Absent 9 29 (28) 38 (37)
Cases 12 33 (33) 45 (44)

E&A Macro Evaluation: Annual Technical Report 2016 – Annexes
32
Outcome
Configura
tio
n
m1*M7 Present Absent Cases
Present 2 7 9
Absent 10 26 (25) 36 (35)
Cases 12 33 (32) 45 (44)
Outcome
Configura
tio
n m1*m7 Present Absent Cases
Present 0 5 (6) 5 (6)
Absent 12 28 (26) 40 (38)
Cases 12 33 (32) 45 (44)
H3: Mechanisms supporting formal social accountability initiatives (IO2) are more
effective than those resulting in informal citizen action (IO4) in improving service
delivery (O1, O2)
Table H3 (O1): Presence of formal social accountability initiatives (IO2) + informal citizen action (IO4); Absence of formal social accountability initiatives (io2) + informal citizen action (io4)
Outcome
Configura
tio
n
IO2*IO4 Present Absent Cases
Present 22 0 21 (22)
Absent 18 (16) 2 (3) 20 (19)
Cases 39 (38) 2 (3) 41
Outcome
Configura
tio
n IO2*io4 Present Absent Cases
Present 15 (13) 0 (1) 15 (14)
Absent 24 (25) 2 26 (27)
Cases 39 (38) 2 (3) 41

E&A Macro Evaluation: Annual Technical Report 2016 – Annexes
33
Outcome
Configura
tio
n io2*IO4 Present Absent Cases
Present 1 0 1
Absent 38 (37) 2 (3) 40
Cases 39 (38) 2 (3) 41
Outcome
Configura
tio
n io2*io4 Present Absent Cases
Present 2 2 4
Absent 37 (36) 0 (1) 37
Cases 39 (38) 2 (3) 41
Table H3 (O2): Presence of formal social accountability initiatives (IO2) + informal citizen action (IO4); Absence of formal social accountability initiatives (io2) + informal citizen action (io4)
Outcome
Configura
tio
n
IO2*IO4 Present Absent Cases
Present 8 13 (14) 21 (22)
Absent 3 15 (14) 18 (17)
Cases 11 28 39
Outcome
Configura
tio
n
IO2*io4 Present Absent Cases
Present 3 11 (10) 14 (13)
Absent 8 17 (18) 25 (26)
Cases 11 28 39
Outcome
Configura
tio
n
io2*IO4 Present Absent Cases
Present 0 0 0
Absent 11 28 39
Cases 11 28 39

E&A Macro Evaluation: Annual Technical Report 2016 – Annexes
34
Outcome
Configura
tio
n io2*io4 Present Absent Cases
Present 0 4 4
Absent 11 24 35
Cases 11 28 39
H4: Without improved governance of service delivery (IO6), social accountability
mechanisms will not improve local service delivery (O1)
Table H4 (O1): Presence of improved governance of service delivery (IO6); Absence of improved governance of service delivery (io6)
Outcome O1
Co
nfi
gura
tio
n
IO6 Present Absent Cases
Present 27 (24) 2 29 (26)
Absent 15 (17) 1 (2) 16 (19)
Cases 42 (41) 3 (4) 45
H5: Awareness raising (M4) and supporting socially inclusive platforms (M6) result in
improved services for marginalised social groups (O3)
Table H5 (O3): Presence of citizen awareness raising and mobilisation (M4) + socially inclusive local platform design (M6); Presence of citizen awareness raising and mobilisation (M4) + absence of socially inclusive local platform design (m6)
Outcome O3
Co
nfi
gura
tio
n M4*M6 Present Absent Cases
Present 19 1 20
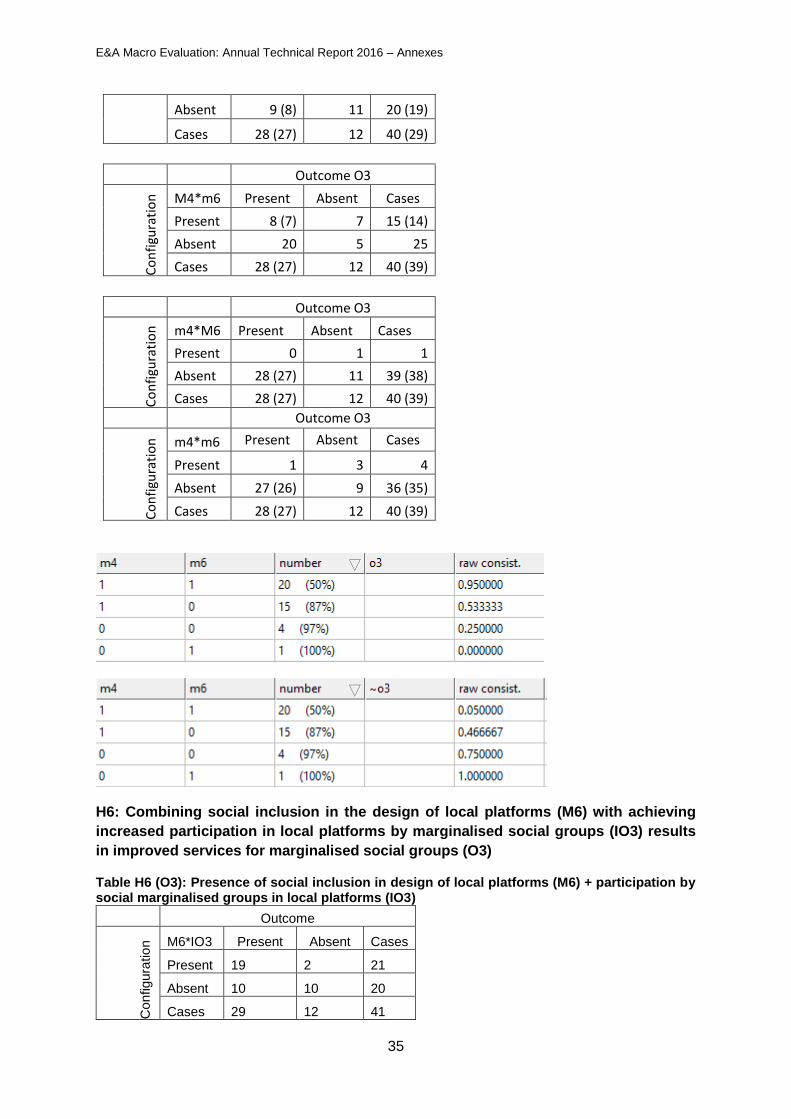
E&A Macro Evaluation: Annual Technical Report 2016 – Annexes
35
Absent 9 (8) 11 20 (19)
Cases 28 (27) 12 40 (29)
Outcome O3
Co
nfi
gura
tio
n
M4*m6 Present Absent Cases
Present 8 (7) 7 15 (14)
Absent 20 5 25
Cases 28 (27) 12 40 (39)
Outcome O3
Co
nfi
gura
tio
n
m4*M6 Present Absent Cases
Present 0 1 1
Absent 28 (27) 11 39 (38)
Cases 28 (27) 12 40 (39)
Outcome O3
Co
nfi
gura
tio
n
m4*m6 Present Absent Cases
Present 1 3 4
Absent 27 (26) 9 36 (35)
Cases 28 (27) 12 40 (39)
H6: Combining social inclusion in the design of local platforms (M6) with achieving
increased participation in local platforms by marginalised social groups (IO3) results
in improved services for marginalised social groups (O3)
Table H6 (O3): Presence of social inclusion in design of local platforms (M6) + participation by social marginalised groups in local platforms (IO3)
Outcome
Configura
tio
n M6*IO3 Present Absent Cases
Present 19 2 21
Absent 10 10 20
Cases 29 12 41

E&A Macro Evaluation: Annual Technical Report 2016 – Annexes
36
Outcome
Configura
tio
n
M6*io3 Present Absent Cases
Present 2 0 2
Absent 27 12 39
Cases 29 12 41
Outcome
Configura
tio
n
m6*IO3 Present Absent Cases
Present 3 2 5
Absent 26 10 36
Cases 29 12 41
Outcome
Configura
tio
n
m6*io3 Present Absent Cases
Present 5 8 13
Absent 24 4 28
Cases 29 12 41
H7: SAcc mechanisms in any combination (M1-M8) will improve service delivery (O1,
O2) when they are supported through multiple phases or via embedded initiatives (M9)
Table H7 (O1): Presence of long-term initiative (M9); Absence of long-term initiative (m9)
Outcome O1
Co
nfi
gura
tio
n M9 Present Absent Cases
Present 24 1 (2) 25 (26)
Absent 10 (9) 1 11 (10)
Cases 34 (33) 2 (3) 36

E&A Macro Evaluation: Annual Technical Report 2016 – Annexes
37
Table H7 (O2): Presence of long-term initiative (M9); Absence of long-term initiative (m9)
Outcome O2
Co
nfi
gura
tio
n M9 Present Absent Cases
Present 9 16 (17) 25 (26)
Absent 1 10 (9) 11 (10)
Cases 10 26 36
Outcome O2 when M9 is positive
Co
nfi
gura
tio
n M5*M8 Present Absent Cases
Present 9 6 (7) 15 (16)
Absent 0 10 10
Cases 9 16 (17) 25 (26)
Outcome O2 when M9 is positive
Co
nfi
gura
tio
n
M5*m8 Present Absent Cases
Present 0 7 7
Absent 9 9 (10) 18 (19)
Cases 9 16 (17) 25 (26)
Outcome O2 when M9 is positive
Co
nfi
gura
tio
n m5*M8 Present Absent Cases
Present 0 3 3
Absent 9 13 (14) 22 (23)
Cases 9 16 (17) 25 (26)
Outcome O2 when M9 is positive
Co
nfi
gura
tio
n m5*m8 Present Absent Cases
Present 0 0 0
Absent 9 16 (17) 25 (16)
Cases 9 16 (17) 25 (26)
H8: Supporting long-term initiatives (M9) is more important for achieving improved
higher-level (at-scale) service delivery (O2) than for achieving improved local-level
(project area) service delivery (O1) or services improved for marginalised social groups
(O3)
Table H8 (O1): Presence of long-term initiative (M9); Absence of long-term initiative (m9)
Outcome O1
Co
nfi
gu
rati
on
M9 Present Absent Cases
Present 26 1 (2) 27 (28)

E&A Macro Evaluation: Annual Technical Report 2016 – Annexes
38
Absent 12 (11) 2 14 (13)
Cases 38 (37) 3 (4) 41
Outcome O2
Co
nfi
gura
tio
n
M9 Present Absent Cases
Present 9 18 (19) 27 (28)
Absent 2 12 (11) 14 (13)
Cases 11 30 41
Outcome O3
Co
nfi
gura
tio
n
M9 Present Absent Cases
Present 22 (23) 5 27 (28)
Absent 9 (8) 5 14 (13)
Cases 31 10 41
H9: When state-society relations indicate a weak social contract (C4,) greater local-level
responsiveness (IO1) is best achieved via informal citizen action (IO4) and media
oversight (M3)
Table H9 (IO1): Different combinations of media oversight (M3) and greater local-level responsiveness (IO1) when social contract is weak (c4) and when social contract is strong (C4)
Absence of C4
Outcome IO1 when C4 is absent
Co
nfi
gura
tio
n
M3*IO4 Present Absent Cases
Present 8 (9) 0 (1) 8 (10)
Absent 7 (6) 4 (3) 11 (9)
Cases 15 4 19
Outcome IO1 when C4 is absent
Co
nfi
gura
tio
n
M3*io4 Present Absent Cases
Present 0 2 2
Absent 15 2 17
Cases 15 4 19
Outcome IO1 when C4 is absent
Co
nfi
gura
tio
n
m3*IO4 Present Absent Cases
Present 3 2 (1) 5 (4)
Absent 12 2 (3) 14 (15)
Cases 15 4 19
Outcome IO1 when C4 is absent
Co
nfi
gu
rati
on
m3*io4 Present Absent Cases

E&A Macro Evaluation: Annual Technical Report 2016 – Annexes
39
Present 4 (3) 0 4 (3)
Absent 11 (12) 4 15 (16)
Cases 15 4 19
Presence of C4
Outcome IO1 when C4 is present
Co
nfi
gura
tio
n
M3*IO4 Present Absent Cases
Present 1 0 1
Absent 7 1 8
Cases 8 1 9
Outcome IO1 when C4 is present
Co
nfi
gura
tio
n
M3*io4 Present Absent Cases
Present 1 0 1
Absent 7 1 8
Cases 8 1 9
Outcome IO1 when C4 is present
Co
nfi
gura
tio
n m3*IO4 Present Absent Cases
Present 3 0 3
Absent 5 1 6
Cases 8 1 9
Outcome IO1 when C4 is present
Co
nfi
gura
tio
n
m3*io4 Present Absent Cases
Present 3 1 4
Absent 5 0 5
Cases 8 1 9
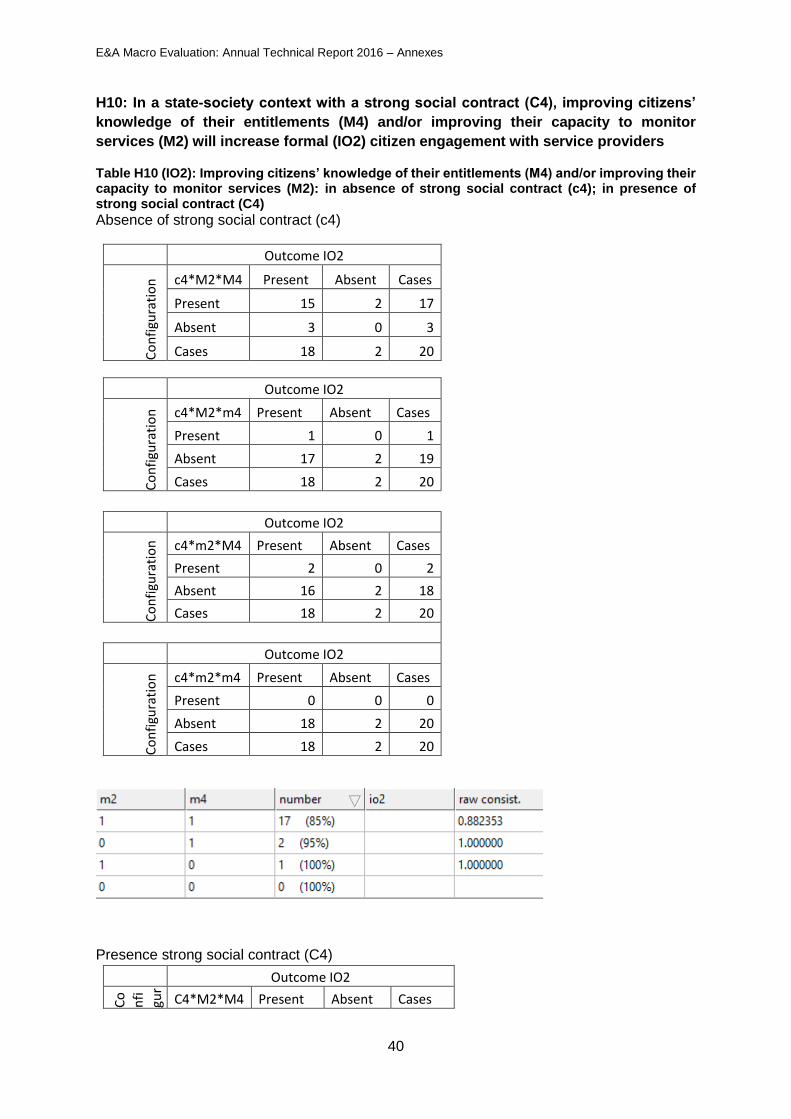
E&A Macro Evaluation: Annual Technical Report 2016 – Annexes
40
H10: In a state-society context with a strong social contract (C4), improving citizens’
knowledge of their entitlements (M4) and/or improving their capacity to monitor
services (M2) will increase formal (IO2) citizen engagement with service providers
Table H10 (IO2): Improving citizens’ knowledge of their entitlements (M4) and/or improving their capacity to monitor services (M2): in absence of strong social contract (c4); in presence of strong social contract (C4)
Absence of strong social contract (c4)
Outcome IO2
Co
nfi
gura
tio
n c4*M2*M4 Present Absent Cases
Present 15 2 17
Absent 3 0 3
Cases 18 2 20
Outcome IO2
Co
nfi
gura
tio
n
c4*M2*m4 Present Absent Cases
Present 1 0 1
Absent 17 2 19
Cases 18 2 20
Outcome IO2
Co
nfi
gura
tio
n
c4*m2*M4 Present Absent Cases
Present 2 0 2
Absent 16 2 18
Cases 18 2 20
Outcome IO2
Co
nfi
gura
tio
n
c4*m2*m4 Present Absent Cases
Present 0 0 0
Absent 18 2 20
Cases 18 2 20
Presence strong social contract (C4)
Outcome IO2
Co
nfi
gur
ati
on
C4*M2*M4 Present Absent Cases

E&A Macro Evaluation: Annual Technical Report 2016 – Annexes
41
Present 6 0 6
Absent 2 (1) 0 2 (1)
Cases 8 (7) 0 8 (7)
Outcome IO2
Co
nfi
gura
tio
n
C4*M2*m4 Present Absent Cases
Present 0 0 0
Absent 8 (7) 0 8 (7)
Cases 8 (7) 0 8 (7)
Outcome IO2
Co
nfi
gura
tio
n
C4*m2*M4 Present Absent Cases
Present 2 (1) 0 2 (1)
Absent 6 0 6
Cases 8 (7) 0 8 (7)
Outcome IO2
Co
nfi
gura
tio
n
C4*m2*m4 Present Absent Cases
Present 0 0 0
Absent 8 (7) 0 8 (7)
Cases 8 (7) 0 8 (7)
H11: An environment of pro-poor policies and openness (C3) is essential to increase citizen engagement for better service delivery (IO2, IO4)
Table H11 (IO2): Presence of pro-poor environment (C3)
Outcome IO2
Co
nfig
ura
tion C3 Present Absent Cases
Present 28 (27) 3 31 (30)
Absent 6 (7) 2 8 (9)
Cases 34 5 39
Table H11 (IO4): Presence of pro-poor environment (C3)
Outcome IO4
Co
nfi
gu
rati
on
C3 Present Absent Cases
Present 21 10 (9) 31 (30)

E&A Macro Evaluation: Annual Technical Report 2016 – Annexes
42
Absent 2 (3) 6 8 (9)
Cases 23 (24) 16 (15) 39
H12: In fragile state contexts (c2) local deliberative platforms (M5) are necessary but
not sufficient to increase formal citizen engagement (IO2)
Table H12 (IO2): Building local deliberative platforms (M5) in presence of: non-fragile state (C2); fragile state (c2)
Outcome IO2
Co
nfi
gura
tio
n C2*M5 Present Absent Cases
Present 25 1 (0) 26 (25)
Absent 16 (15) 4 (5) 20
Cases 41 (40) 5 46 (45)
Outcome IO2
Co
nfi
gura
tio
n C2*m5 Present Absent Cases
Present 2 3 (4) 5 (6)
Absent 39 (38) 2 (1) 41 (39)
Cases 41 (40) 5 46 (45)
Outcome IO2
Co
nfi
gura
tio
n
c2*M5 Present Absent Cases
Present 13 0 13
Absent 28 (17) 5 33 (32)
Cases 41 (40) 5 46 (45)
Outcome IO2
Co
nfi
gura
tio
n
c2*m5 Present Absent Cases
Present 1 (0) 1 2 (1)
Absent 40 4 44
Cases 41 (40) 5 46 (45)
H13: Building local deliberative platforms (M5) will increase and sustain the
participation of marginalised social groups (IO3) in contexts of high social inequality
(c5)

E&A Macro Evaluation: Annual Technical Report 2016 – Annexes
43
Table H13 (IO3): Building local deliberative platforms (M5) in presence of: low social inequality (C5); high social inequality (c5)
Outcome IO3 C
on
figu
rati
on
C5*M5 Present Absent Cases
Present 13 5 (4) 18 (17)
Absent 12 12 (13) 24 (25)
Cases 25 17 42
Outcome IO3
Co
nfi
gura
tio
n
C5*m5 Present Absent Cases
Present 1 2 (3) 3 (4)
Absent 24 15 (14) 39 (38)
Cases 25 17 42
Outcome IO3
Co
nfi
gura
tio
n
c5*M5 Present Absent Cases
Present 11 7 18
Absent 14 10 24
Cases 25 17 42
Outcome IO3
Co
nfi
gura
tio
n c5*m5 Present Absent Cases
Present 0 3 3
Absent 25 14 39
Cases 25 17 42
H14: In contexts of high social inequality (c5), support to socially inclusive formal
citizen engagement in local platforms (IO3) will not be achieved through any mix of
mechanisms (M1–M9)

E&A Macro Evaluation: Annual Technical Report 2016 – Annexes
44
Table H14 (IO3): Presence of low social inequality (C5) + local deliberative platforms (M5) + socially inclusive platform design (M6)
Outcome IO3
Co
nfi
gura
tio
n C5*M5*M6 Present Absent Cases
Present 12 0 12
Absent 2 7 (5) 9 (7)
Cases 14 7 (5) 21 (19)
Outcome IO3
Co
nfi
gura
tio
n C5*M5*m6 Present Absent Cases
Present 1 5 (2) 6 (3)
Absent 13 2 (3) 15 (16)
Cases 14 7 (5) 21 (19)
Outcome IO3
Co
nfi
gura
tio
n
C5*m5*M6 Present Absent Cases
Present 0 0 0
Absent 14 7 (5) 21 (19)
Cases 14 7 (5) 21 (19)
Outcome IO3
Co
nfi
gura
tio
n C5*m5*m6 Present Absent Cases
Present 1 2 (3) 3 (4)
Absent 13 5 (2) 18 (15)
Cases 14 7 (5) 21 (19)
H15: Where civil society capacity is weak (c1), media engagement (M3) is important to
increase responsiveness (IO1) and increase citizen action (IO2, IO4)
Table H15 (IO4): Media engagement present (M3); media engagement absent (m3); Civil society capacity weak (c1)
Outcome IO4 when c1 is negative
Co
nfi
gura
tio
n M3 Present Absent Cases
Present (M3) 3 (4) 0 3 (4)
Absent (m3) 6 (5) 2 8 (7)
Cases 9 2 11

E&A Macro Evaluation: Annual Technical Report 2016 – Annexes
45
Table H15 (IO1): Media engagement present (M3); media engagement absent (m3); Civil society capacity weak (c1)
Outcome IO1 when c1 is negative
Co
nfi
gura
tio
n M3 Present Absent Cases
Present (M3) 3 0 (1) 3 (4)
Absent (m3) 6 2 (1) 8 (7)
Cases 9 2 11
Table H15 (IO2): Media engagement present (M3); media engagement absent (m3); Civil society capacity weak (c1)
Outcome IO2 when c1 is negative
Co
nfi
gura
tio
n M3 Present Absent Cases
Present (M3) 3 (4) 0 3 (4)
Absent (m3) 8 (7) 0 8 (7)
Cases 11 0 11
H16: In pro-poor policy making contexts (C3), feeding project-level evidence and
learning into higher-level discussions (M7) drives more progressive policy/increased
budgets (IO5)
Table H16 (IO5): Feeding evidence upwards present (M7); Pro-poor policy making context present (C3); Pro-poor policy making context absent (c3)
Outcome IO5
Co
nfi
gura
tio
n C3*M7 Present Absent Cases
Present 22 (19) 6 (7) 28 (26)
Absent 8 9 (10) 17 (18)
Cases 30 (27) 15 (17) 45 (44)
Outcome IO5
Co
nfi
gura
tio
n C3*m7 Present Absent Cases
Present 3 5 8
Absent 27 (24) 10 (12) 37 (36)
Cases 30 (27) 15 (17) 45 (44)

E&A Macro Evaluation: Annual Technical Report 2016 – Annexes
46
Outcome IO5
Co
nfi
gura
tio
n c3*M7 Present Absent Cases
Present 3 1 4
Absent 27 (24) 14 (16) 41 (40)
Cases 30 (27) 15 (17) 45 (44)
Outcome IO5
Co
nfi
gura
tio
n c3*m7 Present Absent Cases
Present 2 3 (4) 5 (6)
Absent 28 (25) 12 (13) 40 (38)
Cases 30 (27) 15 (17) 45 (44)
H17: In pro-poor policy making contexts (C3), feeding project-level evidence and
learning into higher-level discussions (M7) drives improved higher-level governance of
service delivery (IO6) without the need for direct support to governance (m1)
Table H17 (IO6): Feeding evidence upwards (M7) + Direct support to governance (M1); Feeding evidence upwards (M7) + no direct support to governance (m1); No evidence feeding upwards (m7) + no direct support to governance (m1)
Pro-poor policy making context present (C3)
Outcome IO6 when C3 is positive
Co
nfi
gura
tio
n M1*M7 Present Absent Cases
Present 15 (13) 2 17 (15)
Absent 9 7 16
Cases 24 (22) 9 33 (31)
Outcome IO6 when C3 is positive
Co
nfi
gura
tio
n M1*m7 Present Absent Cases
Present 5 0 5
Absent 19 (17) 9 28 (26)
Cases 24 (22) 9 33 (31)
Outcome IO6 when C3 is positive
Co
nfi
gura
tio
n
m1*M7 Present Absent Cases
Present 3 5 8
Absent 21 (19) 4 25 (23)
Cases 24 (22) 9 33 (31)
Outcome IO6 when C3 is positive
Co
nfi
gura
tio
n
m1*m7 Present Absent Cases
Present 1 2 3
Absent 23 (21) 7 30 (28)

E&A Macro Evaluation: Annual Technical Report 2016 – Annexes
47
Cases 24 (22) 9 33 (31)
Pro-poor policy making context absent (c3)
Outcome IO6 when C3 is negative
Co
nfi
gura
tio
n M1*M7 Present Absent Cases
Present 2 2 4
Absent 2 3 (4) 5 (6)
Cases 4 5 (6) 9 (10)
Outcome IO6 when C3 is negative
Co
nfi
gura
tio
n
M1*m7 Present Absent Cases
Present 2 2 4
Absent 2 3 (4) 5 (6)
Cases 4 5 (6) 9 (10)
Outcome IO6 when C3 is negative
Co
nfi
gura
tio
n m1*M7 Present Absent Cases
Present 0 0 0
Absent 4 5 (6) 9 (10)
Cases 4 5 (6) 9 (10)
Outcome IO6 when C3 is negative
Co
nfi
gura
tio
n m1*m7 Present Absent Cases
Present 0 1 (2) 1 (2)
Absent 4 4 8
Cases 4 5 (6) 9 (10)

E&A Macro Evaluation: Annual Technical Report 2016 – Annexes
48
Table C1. Initial QCA Dataset (October 2015) Project C
1 C2
C3
C4
C5
C6
M1
M2
M3
M4
M5
M6
M7
M8
M9
IO1
IO2
IO3
IO4
IO5
IO6
O1
O2
O3
103993 0 1 1 0 1 1 0 0 1 1 0 0 1 1 1 0 1 1 1 0 0 1 0 1
200196
1 0 0 1 0 1 0 0 1 1 1 0 0 1
1 1 0 1 1 1
200304
1 1 0 1 0 1 1 1 1 0 0 1 0 0 0 0 0 0 1 1 0 0 0
200318
1 1 0 1 1 1 1 1 1 0 0 1 0 1 1 0 0 1 1
1
200696 0 0 1
0 0 1 1 0 1 1 1 0 1 0 1 1 1 1 1 1 1
1
202183 0 0 1 0 0 0 1 1 0 1 1 0 1 0 1 1 1 0 1 1
0 0
202367
1 1
0 0 1 1 0 0 0 0 1 1 1 1 0 0 0 1 1 1 0 0
202852
1 1 0 1 0 1 1 1 1 1 0 1 1 0
0 0 1
1 1 0
202886
0
1 0 1 1 1 1 0 1 0 0 1 1 1 1 1 0 1 0 0
203757
1 1 1 1 0 1 0 0 0 1 0 0 1 1 1
0 0 0 1 0 0 0
GPAF IMP-043
1 1 0 1 0 0 0 0 1 1 0 0 1 0 1 1 1
0 0 1 0
GPAF IMP-068
0 0
1 1 0 0 1 1 0 0 1 0 0 1 1
1 0 1 0 1
105862
1 0 0 1 0 0 1 1 1 1 1 0 1 1 1 1 1 1 0 0 1 0 1
201591
1 1
0 0 1 1
1 0 0
1
0
201616
1 0
0 0 1 1 0 1
0 0 1 0 0 0 0 0 0 0 0 0 0
201625 0 1 1 0 0 0 1 1 1 1 1
1 1 0 1 1 1
1 1 1 0 1
201853 0 0 1 0 0 0 1 1 0 1
0 0 0 1
1 1 0 1
1
202149
0 0
0 0 1 0 0
1 1 1 1 1 0 1 0 0 1 1 1 0 1
202190
0 0
1 1 1 1 0 1 0 0 1 1 1 0 0 0 0 1 0 1 0 1
202267
0 0
0 0 1 0 0
1 1 1 1 1 0 1 0 0 1 1 1 0 1
202295
1
1 0 0
0 1 1 1 0 1 0 0 1 1 0
0 1 0 1
202352 0 1 1 0 0 0 1 1 1 1 1
1 1 0 1 1 0 1 0 1 1 0 1
202378
1 1
0 0 0 1 0 0 0 0 1 1 0 0 0 0
0 0 1 0 0
202491
1 1
0 0 1 1 1 1 1 0 1 0 0 0 1 0 1 1 1
1 0
202542
1
1 0 0 1 1 1 1 0 0 1 1 0 1 1
0 1 1 1 0
202691
0 1 0 0 0 1 1 1 1 1
0 1 0 0 1
0 0 1 1 1 1
105862
1 0 0 1 0 0 1 1 1 1 1 0 1 1 1 1 1 1 0 0 1 0 1
104229 0 1 1 0 0 0 1 1 0 1 1 1 1 1 1 1 1 1 1 1 1 1 1 1
107460
1 1
0 0 1 0 0 1 1 0 1 1 1 1 1 0 1 1 1 1 1 1
108572 0 0 1
0 0 1 1 1 1 1 1 1 1 1 1 1 1 1 1 1 1 1 1
113961
1 0 0 1 0 1 1 1 1 1 1 1 1 0 1 1 1 1 0 0 1 0 1
114088 0 0 1
0 0 1 1 0 1 1 1 0 1 1 1 1 1 0 1 1 1 1 1
114532
1
1 0 0 0 1 0 1 1 0 0 1 0 1 1 1 0 0 0 1 0 1
104025 0 1 1 0 1 1 1 1 1 1 1 1 1 0 1 1 1 1 1 1 1 1 0 1
108027
1 1 1 1 0 1 0 0 1 1 1 0 1 1 1 1 1 1 0 1 1 1 1
113540
1 1 0 1 0 1 1 1 1 1 1 1 0 1 1 1 1 1 1 1 1 0 1
113617
1 1 1 1 0 0 1 0 1 1 1 1 1 1 1 1 1 0 0 0 1 0 1
113976 202958
1 1
0 0 1 1 1 1 1 1 1 1 1 1 1 1 1 1 1 1 1 1
114161 0 1 1 0 0 0 1 1 0 0 1 0 1 1 1 1 1 0 1 1 1 1 1 1
114433
1 1
0 0 1 1 0 1 1 1 1 0 1 1 1 1 1 1 1 1 0 1
200120
1 1 0 1 0 1 1 0 1 1 1 1 1 1 1 1 1 0 1 0 0 0 0
200498
1 1 0 1 0 0 1 1 1 1 0 1 0 1 1 1 0 1 1 0 1 0 1
201590 1 1 1 1 1 0 0 1 1 1 1 0 1 0 1 1 1 0 1 0 0 1 0 1
200628 0 0 1
0 0 0 1 0 1 1 1 1 1 1 1 1 1 0 0 1 1 1 1
201011
0 0
0 1 1 1 1 0 1 1 0 0 1 1 1 1 0 0 1 1 0 0
200469
0 1 0
1 0 1 0 1 1 1 1 0 1 1 1 1 0 1 1 1 0 1
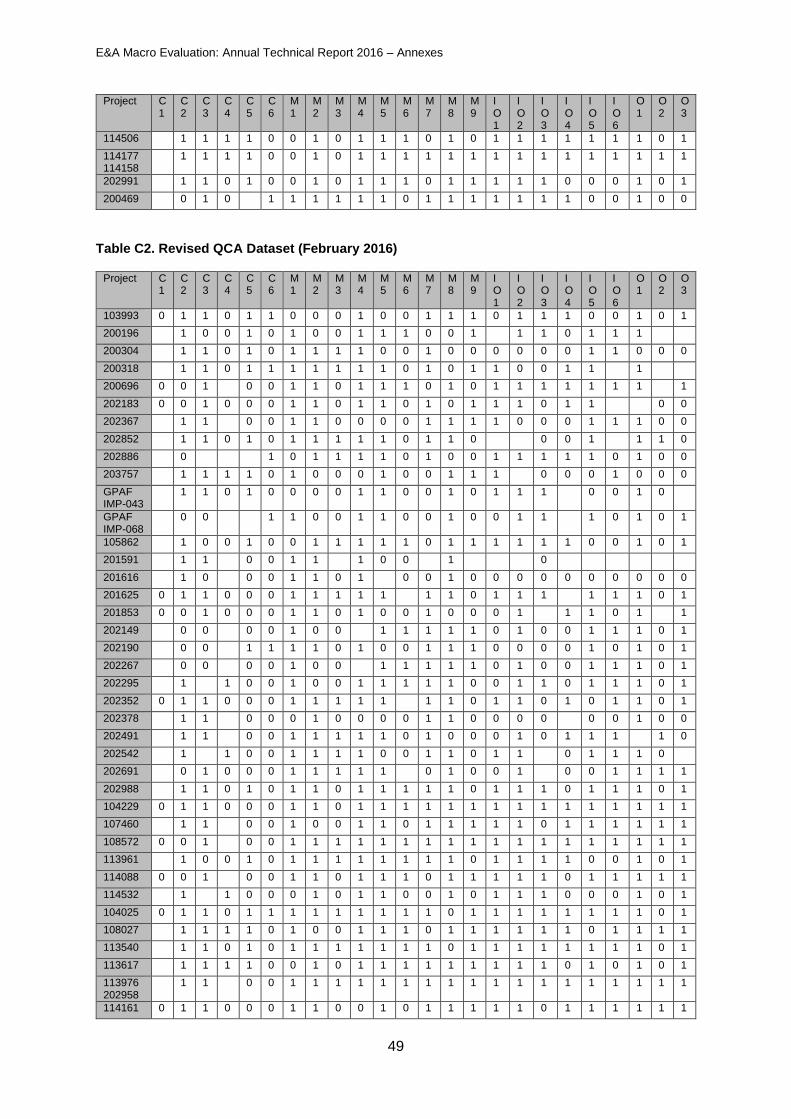
E&A Macro Evaluation: Annual Technical Report 2016 – Annexes
49
Project C1
C2
C3
C4
C5
C6
M1
M2
M3
M4
M5
M6
M7
M8
M9
IO1
IO2
IO3
IO4
IO5
IO6
O1
O2
O3
114506
1 1 1 1 0 0 1 0 1 1 1 0 1 0 1 1 1 1 1 1 1 0 1
114177 114158
1 1 1 1 0 0 1 0 1 1 1 1 1 1 1 1 1 1 1 1 1 1 1
202991
1 1 0 1 0 0 1 0 1 1 1 0 1 1 1 1 1 0 0 0 1 0 1
200469
0 1 0
1 1 1 1 1 1 0 1 1 1 1 1 1 1 0 0 1 0 0
Table C2. Revised QCA Dataset (February 2016)
Project C1
C2
C3
C4
C5
C6
M1
M2
M3
M4
M5
M6
M7
M8
M9
IO1
IO2
IO3
IO4
IO5
IO6
O1
O2
O3
103993 0 1 1 0 1 1 0 0 0 1 0 0 1 1 1 0 1 1 1 0 0 1 0 1
200196
1 0 0 1 0 1 0 0 1 1 1 0 0 1
1 1 0 1 1 1
200304
1 1 0 1 0 1 1 1 1 0 0 1 0 0 0 0 0 0 1 1 0 0 0
200318
1 1 0 1 1 1 1 1 1 1 0 1 0 1 1 0 0 1 1
1
200696 0 0 1
0 0 1 1 0 1 1 1 0 1 0 1 1 1 1 1 1 1
1
202183 0 0 1 0 0 0 1 1 0 1 1 0 1 0 1 1 1 0 1 1
0 0
202367
1 1
0 0 1 1 0 0 0 0 1 1 1 1 0 0 0 1 1 1 0 0
202852
1 1 0 1 0 1 1 1 1 1 0 1 1 0
0 0 1
1 1 0
202886
0
1 0 1 1 1 1 0 1 0 0 1 1 1 1 1 0 1 0 0
203757
1 1 1 1 0 1 0 0 0 1 0 0 1 1 1
0 0 0 1 0 0 0
GPAF IMP-043
1 1 0 1 0 0 0 0 1 1 0 0 1 0 1 1 1
0 0 1 0
GPAF IMP-068
0 0
1 1 0 0 1 1 0 0 1 0 0 1 1
1 0 1 0 1
105862
1 0 0 1 0 0 1 1 1 1 1 0 1 1 1 1 1 1 0 0 1 0 1
201591
1 1
0 0 1 1
1 0 0
1
0
201616
1 0
0 0 1 1 0 1
0 0 1 0 0 0 0 0 0 0 0 0 0
201625 0 1 1 0 0 0 1 1 1 1 1
1 1 0 1 1 1
1 1 1 0 1
201853 0 0 1 0 0 0 1 1 0 1 0 0 1 0 0 0 1
1 1 0 1
1
202149
0 0
0 0 1 0 0
1 1 1 1 1 0 1 0 0 1 1 1 0 1
202190
0 0
1 1 1 1 0 1 0 0 1 1 1 0 0 0 0 1 0 1 0 1
202267
0 0
0 0 1 0 0
1 1 1 1 1 0 1 0 0 1 1 1 0 1
202295
1
1 0 0 1 0 0 1 1 1 1 1 0 0 1 1 0 1 1 1 0 1
202352 0 1 1 0 0 0 1 1 1 1 1
1 1 0 1 1 0 1 0 1 1 0 1
202378
1 1
0 0 0 1 0 0 0 0 1 1 0 0 0 0
0 0 1 0 0
202491
1 1
0 0 1 1 1 1 1 0 1 0 0 0 1 0 1 1 1
1 0
202542
1
1 0 0 1 1 1 1 0 0 1 1 0 1 1
0 1 1 1 0
202691
0 1 0 0 0 1 1 1 1 1
0 1 0 0 1
0 0 1 1 1 1
202988
1 1 0 1 0 1 1 0 1 1 1 1 1 0 1 1 1 0 1 1 1 0 1
104229 0 1 1 0 0 0 1 1 0 1 1 1 1 1 1 1 1 1 1 1 1 1 1 1
107460
1 1
0 0 1 0 0 1 1 0 1 1 1 1 1 0 1 1 1 1 1 1
108572 0 0 1
0 0 1 1 1 1 1 1 1 1 1 1 1 1 1 1 1 1 1 1
113961
1 0 0 1 0 1 1 1 1 1 1 1 1 0 1 1 1 1 0 0 1 0 1
114088 0 0 1
0 0 1 1 0 1 1 1 0 1 1 1 1 1 0 1 1 1 1 1
114532
1
1 0 0 0 1 0 1 1 0 0 1 0 1 1 1 0 0 0 1 0 1
104025 0 1 1 0 1 1 1 1 1 1 1 1 1 0 1 1 1 1 1 1 1 1 0 1
108027
1 1 1 1 0 1 0 0 1 1 1 0 1 1 1 1 1 1 0 1 1 1 1
113540
1 1 0 1 0 1 1 1 1 1 1 1 0 1 1 1 1 1 1 1 1 0 1
113617
1 1 1 1 0 0 1 0 1 1 1 1 1 1 1 1 1 0 1 0 1 0 1
113976 202958
1 1
0 0 1 1 1 1 1 1 1 1 1 1 1 1 1 1 1 1 1 1
114161 0 1 1 0 0 0 1 1 0 0 1 0 1 1 1 1 1 0 1 1 1 1 1 1

E&A Macro Evaluation: Annual Technical Report 2016 – Annexes
50
Project C1
C2
C3
C4
C5
C6
M1
M2
M3
M4
M5
M6
M7
M8
M9
IO1
IO2
IO3
IO4
IO5
IO6
O1
O2
O3
114433
1 1
0 0 1 1 0 1 1 1 1 0 1 1 1 1 1 1 1 1 0 1
200120
1 1 0 1 0 1 1 0 1 1 1 1 1 1 1 1 1 0 1 1 1 0 0
200498
1 1 0 1 0 0 1 1 1 1 0 1 0 1 1 1 0 1 1 0 1 0 1
201590 1 1 1 1 1 0 0 1 1 1 1 0 1 0 1 1 1 0 1 0 0 1 0 1
200628 0 0 1
0 0 0 1 0 1 1 1 1 1 1 1 1 1 0 0 1 1 1 1
201011
0 0
0 1 1 1 1 0 1 1 0 0 1 1 1 1 0 0 1 1 0 0
200469 0 1 0
1 0 1 0 1 1 1 1 0 1 1 1 1 0 1 1 1 0 1
114506
1 1 1 1 0 0 1 0 1 1 1 0 1 0 1 1 1 1 1 1 1 0 1
114177 114158
1 1 1 1 0 0 1 0 1 1 1 1 1 1 1 1 1 1 1 1 1 1 1
202991 1 1 0 1 0 0 1 0 1 1 1 0 1 1 1 1 1 0 0 0 1 0 1
200469 0 1 0 1 1 1 1 1 1 0 1 1 1 1 1 1 1 0 0 1 0 0

E&A Macro Evaluation: Annual Technical Report 2016 – Annexes
51
Annex D Terms of Reference
Macro evaluations of DFID’s Strategic Vision for Girls and Women and DFID’s Policy Frame for Empowerment and Accountability
Introduction
Overview of these Terms of Reference
These Terms of Reference (ToRs) are for an independent service provider or consortium to conduct macro evaluations of DFID’s Strategic Vision for Girls and Women and DFID’s investments in empowerment and accountability (E&A). A maximum of £1 million is available for the work covered by these ToRs, including funds earmarked for additional data collection. Documents supplied with these ToRs are:
Business Case
Logical Framework for the macro evaluation
Spreadsheet of planned DFID evaluations
2012 Evaluability Assessment for Empowerment and Accountability and the Strategic
Vision
Empowerment and Accountability Conceptual Framework
DFID’s Strategic Vision for Girls and Women.
For the purposes of these ToRs, a ‘macro evaluation’ is defined ‘as an evaluation intended to
synthesise findings from a range of programme evaluations and other programme data, in
order to generate some generalisable findings (where possible).’
In this instance, the macro evaluation will support learning and evidence building; as well as
improved accountability for DFID’s spending in these two policy areas. The macro evaluations
will test hypotheses within the two ‘theories of change’ for each policy area, drawing on
evidence and data from clusters of projects with similar intended outputs and outcomes. In
addition, non-programme sources pertinent to the hypotheses in the theories of change could
be drawn upon, where there are too few DFID funded projects working on a particular area to
generate comparable data. This may include drawing on existing research; and
commissioning additional survey data or evaluative information as necessary.
Because there is much overlap between initiatives aimed at strengthening empowerment and
accountability, and those aimed at empowering women and girls, DFID is commissioning one
service provider to carry out the two macro evaluations, in order to ensure consistency, and
to build synergies across findings. Each macro evaluation will ask different evaluation
questions (EQs), relating to hypotheses within the theory of change for that policy area.
Empowerment and accountability
In February 2011, DFID’s Development Policy Committee endorsed a proposal that DFID
should do more to enable poor people to exercise greater choice and control over their own
development and to hold decision-makers to account. The theory of change for this area is
the Empowerment and Accountability Conceptual Framework. This includes a number of

E&A Macro Evaluation: Annual Technical Report 2016 – Annexes
52
linkages between donor-supported interventions that seek to enable different forms of
empowerment (economic, social, or political) and accountability, in the expectation that
improvements in empowerment and accountability will deliver better development and growth
outcomes for the poorest.
This focus on empowerment and accountability is implemented through a range of
programmes designed and implemented at country level, either as interventions with core
objectives on E&A, or as components of broader programmes in particular sectors. At present,
DFID has identified19 programmes specifically related to E&A, which will have evaluations
that will report some findings by 2016; with a number of other evaluations planned in other
areas that are also relevant to E&A, such as elections and anti-corruption also planned.
The Development Policy Committee requested that DFID undertake a ‘macro evaluation’ of
its investments in Empowerment and Accountability to deepen accountability and widen
learning and evidence building.
Strategic vision for girls and women
The UK has put the empowerment of girls and women at the heart of international
development. DFID’s ‘theory of change’ for this policy is the Strategic Vision for Girls and
Women. This was launched in March 2011 and identifies four priority pillars for action to deliver
real change for girls and women:
Pillar 1: Delay first pregnancy and support safe childbirth
Pillar 2: Get economic assets directly to girls and women
Pillar 3: Get girls through secondary school
Pillar 4: Prevent violence against girls and women
Achieving results across these four pillars also depends on improvements in the enabling
environment – i.e. the attitudes, behaviours, social norms, statutory and customary laws and
policies which constrain the lives of adolescent girls and women, and perpetuate their
exclusion and poverty.42
The Strategic Vision has wide ranging implications for DFID and is being implemented through
a large number of programmes developed across DFID – by country offices, Policy and
Research Division, Private Sector Department, Civil Society Department and International
Financial Institutions Department. A number of programmes specifically related to girls and
women have evaluations that will report some findings by 2016.
Evaluability assessment
DFID commissioned a joint evaluability assessment of the two policy areas in March 2012.
This concluded that neither the E&A policy area nor the Strategic Vision for Girls and Women
is ready for a macro evaluation because of major gaps in available documentation and
systemic difficulties with identifying investments in each policy area. A particular challenge for
each policy area is the lack of clearly defined boundaries: outcomes for women and girls, and
42 The Strategic Vision of Women and Girls is described in greater detail in the document found at: http://www.dfid.gov.uk/Documents/publications1/strategic-vision-girls-women.pdf

E&A Macro Evaluation: Annual Technical Report 2016 – Annexes
53
initiatives involving E&A, may be embedded within other sectoral programmes, and not
immediately picked up through DFID’s established data sources such as ARIES or QUEST.
The theories of change for both policy areas reflect this wider understanding of policy
engagement, and the testing across sectoral engagement is of particular interest.
The evaluability assessment also concluded that there is simply not the body of projects being
funded under each policy areas to generate generalisable findings across the whole theory of
change. It would thus not be possible to evaluate across the entire intervention logic, but it
would be possible to test certain hypotheses within the theories of change. The scope for this
would be limited by the number of projects with similar outputs and objectives, engaged in
activities that relate to the hypotheses. There is thus an additional clustering exercise required,
whereby similar sets of projects would be identified that appear to relate to specific
hypotheses, on the basis of their indicators.
The authors of the evaluability assessment recommended that steps be taken to address the
issues of the availability of documentation and identifying investments in each policy area as
a matter of priority in order to address concerns for accountability. They then recommended
further steps that could be taken in order to complete the macro evaluations, including the
clustering exercise, and that, given an apparently high level of overlap in projects that are of
relevance to both the these two policy areas, these tasks could be carried out by one
contractor.
The evaluability assessment also recommended that the approach to the macro evaluations:
be an iterative one between generating initial EQs that relate to the hypotheses within
the Theories of Change (i.e. the Conceptual Framework and the Strategic Vision) and
establishing what questions can be answered by DFID programmes through grouping
them into clusters of projects with similar anticipated outcomes;
draw not just on evaluation data, but other sources such as annual reviews and project
completion reports;
be a process of continuous learning rather than a ‘snapshot’ at the end.
This approach would produce:
(a) a tabulated mapping, of all relevant programmes relevant to each policy area and
links to supporting programme documentation – thus improving our transparency and
accountability for spend in these areas
(b) annual reports that detail evaluation findings against hypotheses; and generate emerging evidence on a more real-time basis
(c) a theory of change that is tested and re-tested on an annual basis
The above recommendations were accepted by DFID and provide the framework for the ToRs.
Objective
The purpose of this consultancy is to increase DFID’s accountability and learning in the areas
of gender, and empowerment and accountability through:
making it transparent what DFID has supported in response to two major policy
commitments, empowerment and accountability, and gender;

E&A Macro Evaluation: Annual Technical Report 2016 – Annexes
54
enhanced learning by systematically using evidence to test hypotheses within the
‘theories of change’ for each policy area and so helping to identify which of DFID’s
assumptions on what works and where are correct and evidence based.
The tasks involved in meeting this purpose are to:
establish two tabulated mappings with the detail required to undertake macro
evaluations of DFID’s Strategic Vision for Girls and Women and DFID’s policy frame
for Empowerment and Accountability;
undertake the macro evaluations in both these two areas;
maintain the tabulated mapping over the course of the contract: and
transfer the tabulated mappings to DFID at the end of the contract.
The evaluation will cover the full range of OECD DAC and DFID evaluation criteria, namely:
relevance
effectiveness
efficiency
impact
sustainability
coverage – includes equity, differential impacts, inclusion/exclusion
coherence: with other related policies and actions
coordination – includes alignment with country priorities and systems, and
harmonisation with others.
Note that these criteria should be considered in developing the EQs, although not all will be
included within each hypotheses tested. Questions of coverage and differential reach and
impacts should be tested in each case.
Scope of work
Purpose
The macro evaluations of both policy areas will have three components:
A. Results – establishing accountability for results from DFID’s investments. The macro evaluation process will: gather information about the range of programmes that address empowerment and accountability, and women and girls’ empowerment; and improve the internal and external availability of data generated through these programmes. The evaluation will aggregate findings from a number of DFID programmes in each policy area and establish what results (and, where possible, impact) if any, have been achieved from these investments. It is envisaged that this component will also include an assessment and comparison of value-for-money across different approaches.
B. Portfolio – expanding the evidence base. This component will address key questions about what works, what does not, why, for whom and under what circumstances; and about how certain interventions lead to changes in the lives of the

E&A Macro Evaluation: Annual Technical Report 2016 – Annexes
55
poor, including women and girls. It will test and retest the Theories of Change, as represented by the E&A Conceptual Framework and the Strategic Vision.
C. Process – the impact on DFID processes of the Strategic Vision. The evaluation
of the Strategic Vision will include a policy review that will examine the effectiveness
of institutional arrangements for supporting work on empowering women and girls.
The macro evaluations will need to take into account the fact that transformative change for
both policy areas happens slowly; and that results, and thus learning for the three years period,
may necessarily be somewhat limited.
General approach
The macro evaluations will involve an annual process of analysing programme-level data,
including evaluation data where available, to build knowledge about clusters of activity over a
three-year period. This will enable the testing of key hypotheses in the intervention logic,
building up a more relevant theory of change through an iterative process. DFID staff and
others will be able to incorporate learning into programmes throughout the lifespan of the
evaluation and beyond. However, the EQs will also need to realistically reflect what changes
can be expected within a three-year period. The changes that both policy areas seek to make
in the lives of the poor involve long-term processes of social, political and economic change.
Tasks
The ToR will cover the following steps to ensure a robust and credible evaluation.
Gathering data about relevant programmes
The consultants need to construct two tabulated mappings of projects that are relevant to the
policy objectives of the E&A policy areas and the Strategic Vision. The consultants will need
to decide which programmes are relevant to each pillar/programme, group them accordingly,
and provide a description of the portfolio of policy relevant projects, including links to
supporting project documentation. Because of weaknesses in DFID’s external listing of project
documents, the consultants would be given access to DFID’s internal data-storage systems
(on completion of security clearance) to undertake this exercise. The tabulated mapping would
be made publicly available.
The parameters for projects included in the tabulated mappings are:
relevant to the E&A policy areas and the Strategic Vision;
commenced in 2011 or after;
in one of DFID’s 28 bilateral focus countries;
sourced from bilateral programmes only.
The year of 2011 has been determined as the starting date for any programmes to be covered,
as this was the year in which new policy commitments were made in respect to E&A and girls
and women. It is particularly relevant to the evaluation of the Strategic Vision as part of this
evaluation looks at the impact of the Strategic Vision itself on DFID’s interventions. That said,
as many of these projects are extensions or second phases of previous interventions, the

E&A Macro Evaluation: Annual Technical Report 2016 – Annexes
56
tabulated mapping will include data from before 2011, so some comparisons will be possible
between pre- and post-2011 projects.
The reason for sourcing data from bilateral programmes only is that most non-bilateral
programmes have their own management structures and evaluation processes, which operate
outside DFID. However, we envisage inclusion of data from DFID’s support to civil society
through our Programme Partnership Agreements and the Global Policy Action Fund (GPAF).
Establishing and testing hypotheses
The tabulated mappings will need to be constructed in such a way that enough information on
each project can be easily gathered to enable the evaluators to cluster programmes around
factors that they have in common. These common factors can then be matched to EQs, or
may form the basis for new EQs where these relate to the hypotheses. Initial EQs can be
found in Box 1 below. These are indicative questions that will be revised once the clustering
process has been completed. Final questions must relate to hypotheses in the policy theories
of change and be evaluable.
Engaging in evaluation activities
Portfolio and results evaluations
The tabulated mappings will need to be continuously updated. It will form the basis for an
annual assessment of EQs as part of a testing, revising and retesting of the Theories of
Change (i.e. the Strategic Vision and E&A Conceptual Framework) that makes up the Portfolio
Level evaluation (Component B) as well as the Results Level evaluation at the end
(Component A).
For both the Portfolio Level and Results Level evaluations it is expected that DFID project
review data will be supplemented by:
Box 1: Initial evaluation questions
o Why have some programmes worked and not others, and for some groups in certain contexts but not others?
o What doesn’t work in development programming for E&A and women and girls?
o Is it more effective to integrate ‘stand-alone’ E&A programmes, including for women and girls, or to mainstream E&A into other programmes?
o Is working on multiple areas (taking a more holistic approach) more effective and better value-for-money than working on individual elements within a policy frame?
o How do the aims and associated interventions of the strategic vision pillars link together? For example, what is the relationship between economic assets and tackling violence against women and girls? How does tackling violence help delay first pregnancy and support safe childbirth?
o Does the effectiveness of programmes for women and girls depend on progress in the enabling environment?

E&A Macro Evaluation: Annual Technical Report 2016 – Annexes
57
Data from scheduled evaluations of DFID bilateral projects (supplied with these ToRs)
Other data sources (e.g. annual and project completion reviews, corporate
performance reviews, other project monitoring data e.g. from evaluation work,
evaluations of other programmes with potential E&A / Strategic Vision outcomes such
as civil society support funds, Programme Partnership Agreements)
Research and learning products commissioned within the programmes
RED evidence products (e.g. synthesis reviews, data from research programmes)
Evidence from non-DFID sources.
The assessments will be conducted annually over the three years to ensure continual learning
from new data that comes available. Each annual report will be written and structured with the
needs of busy practitioners and policymakers in mind with the aim of aiding the uptake of
findings and evidence within DFID and by external stakeholders.
Further supplementary information could come from comprehensive evaluations that are
being conducted of programme areas that fall under the remit of the Strategic Vision
(Reproductive, maternal and newborn health43 and violence against women and girls). The
consultants will need to link with these evaluations. These comprehensive evaluations may
obviate the need for the consultants to engage in data-gathering exercises in these areas and
will also make hypothesis-forming much easier. This will need to be examined by consultants
during the inception period.
Specially commissioned additional work
As well as identifying hypotheses that can be tested using DFID programme data, the
consultants are likely to identify hypotheses of interest to DFID, but which cannot be tested
owing either to a lack of DFID programmes that relate to them or to a lack of DFID evaluations
that focus on them. Firms responding to these ToRs should include in their proposal a sum
not exceeding £250,000 (and within the total maximum budget of £1 million) for the
commissioning of evaluations, surveys, interviews or other forms of additional data collection
if required to enable the testing of key hypotheses. Approval to draw down these funds to
commission evaluations or additional data collection must be secured from DFID in advance.
Approval will be granted where it has been agreed with DFID that the proposed work is in an
area of particular interest, and where it is clear that small additional evaluative work will
generate generalisable data of sufficient quality to demonstrate external validity. It is
anticipated that some possible uses of this fund will be identified during the inception phase.
Policy implementation review of the strategic vision
The Policy Implementation Review of the Strategic Vision on DFID’s internal processes will
be a separate exercise. This will look at the process connecting the original conception of the
Strategic Vision to the approval of projects which are seen to embody the new policy direction.
The policy review will address questions such as:
How has the Vision guided the work of DFID country offices?
43 A mid-term review (2013) and evaluation (2016) of Choices for women: Planned pregnancies, safe births and healthy newborns. The UK’s Framework for Results for improving reproductive, maternal and newborn health in the developing world, is currently being planned, with an inception phase for the evaluation scheduled to take place in early 2013.

E&A Macro Evaluation: Annual Technical Report 2016 – Annexes
58
How has implementation varied across the organisation?
Has the Vision led to increased allocation of financial resources to girls and women?
What effect did the Vision’s focus on girls have on DFID programmes?
Do the organisational structures for the Vision provide clear leadership, a strong
accountability structure and positive incentives for effective delivery?
Has DFID’s ability to track spending on girls and women changed as a result of the
vision?
How have reporting requirements in the Corporate Performance Framework affected
implementation of the Vision?
These questions could be answered via an analysis of documents available within DFID and
through surveys of DFID staff and external stakeholders.
Audience and communications
Audience
There is likely to be broad interest in these evaluations, both DFID and other organisations.
At a policy level, there is much discussion about approaches to empowerment and
accountability, and specifically empowerment of girls and women, but the evidence on what
works, and in which context, is limited.
The evaluations are likely to be of great interest to the evaluation community, both inside and
outside DFID. The use of an evaluation approach which incorporates continuous learning, and
looks at issues of complexity and context, is one that could be particularly appropriate to
complex, multi-faceted development interventions, but which has been little used in
development so far.
At a programme level, DFID staff and others will be able to incorporate learning into
programmes throughout the lifespan of the evaluation and beyond. Other donors and research
organisations and development practitioners and organisations will be interested in what
works, under what circumstances and why.
Project partners will be interested in the information gathered during the course of
implementation which will help them improve their project and increase the likelihood of
success.
Communication strategy
The interest, both external and internal, in this evaluation means that it is essential that the
organisation undertaking the evaluation has a well-formulated communications strategy. As
the evaluation will provide continuous learning in areas where there is limited evidence on
what works and how, the evaluation provides the opportunity to inform the design of
interventions during the lifetime of the evaluation. At the same time, there is a risk of partial
results being misused in the design of interventions. As a result, the evaluation methodology
needs to have a clear strategy for both the communication of research and evaluation findings,
and ensuring the appropriate uptake of such research and evaluation findings.

E&A Macro Evaluation: Annual Technical Report 2016 – Annexes
59
In order to understand whether and how the evidence generated by the macro evaluations
has been taken up by DFID staff and external stakeholders, DFID will conduct an assessment
of evidence uptake one year after the evaluation. It is envisaged that uptake will be increased
by the effective implementation of a high quality communication strategy.
Methodology, skills, and ways of working
Response expected from contract bidders
The bidders for this contract will need to submit a methodology to achieve these ToRs, bearing
in mind the need to evaluate at the three levels specified (process, portfolio and results) and
to ensure that the evaluation approach is one that will provide both continuous learning and
final impact evaluation (including lesson learning and recommendations). This methodology
should include:
Details of the approach and methods to be employed to undertake the results, portfolio
and process evaluations, including detailing the analytical frameworks, approach to
sampling, approach to ensuring internal and external validity, and mechanisms to
avoid bias;
For the portfolio evaluations, and strengthening of the ToCs: a) the design proposed
for analysis and identification of both the internal and external validity of findings and
conclusions; and b) how the evaluation will approach the identification of both key
context and mechanism conditions, and their interaction;
For the results evaluation, the proposed approach to assessment of VFM;
Assessment of the strengths and weaknesses of the proposed methods for collection,
extraction and analysis;
Details of the different expertise of the team members implementing the evaluation;
Detailed costings and staffing for the data-gathering exercise;
How the team will be structured to manage several overlapping evaluations at once,
ensuring that duplications are minimised and information sharing is maximised;
How they will manage the uncertainty over the time and staffing required to complete
the tabulated mapping;
How they will ensure that knowledge is transferred to DFID staff and to new consultants
employed by them should these change during the lifetime of the contract;
Their approach to ensuring that stakeholders listed in Section 4 above are involved in
the process of setting EQs;
Their approach to maximising value-for-money, particularly in the use of funds for
specially commissioned work;
Their approach to developing a communications strategy.
Working with DFID
During the contract the consultants will need to work closely with DFID staff, both in locating
documents and discussing possible hypotheses. DFID staff will:
provide lists (which are unlikely to be exhaustive) they already have of potentially
relevant projects;

E&A Macro Evaluation: Annual Technical Report 2016 – Annexes
60
help the consultants to contact staff in country offices to trace documents which cannot
be found on DFID’s internal systems and, interview staff if required;
discuss with the consultants their proposed clustering of projects and draft EQs, as
well as draft reports.
Both DFID’s Empowerment and Accountability team and its Gender team will provide a named
member of staff who will be the initial point of contact on the evaluations and who will help the
consultants in their dealings with DFID country offices.
Skills
The team leader should have:
extensive knowledge and experience of designing and managing evaluations in a
range of contexts in development settings;
experience of undertaking meta evaluations and synthesis evaluations (some
experience of systematic reviews preferable);
experience of undertaking complex and complicated evaluations using a range of
theory-based evaluation approaches;
track record of delivering quality outputs on time;
excellent verbal and written communication skills with a track record of good writing in
plain English;
proven ability to build good relationships with a number of different stakeholders.
The evaluation team should have competence, expertise and experience in the following
areas:
Significant experience of a range of evaluation approaches, particularly those which
can be applied where contexts and interventions vary
Experience in using analytical frameworks that use systematic objective procedures,
and enable generalisation through statistical and non-statistical representation; and
identification of key context and mechanism conditions
Experience of evaluations of policy implementation
Very strong technical and theoretical knowledge of E&A, and gender
Significant expertise in quantitative and qualitative data collection, data modelling,
statistical analysis, survey planning, and a range of evaluation and research methods
Demonstrated ability to assess VFM
Significant experience in knowledge management and communicating evaluation
results to a range of audiences and using varied approaches.
Risks
The consultants will be expected to report on risks identified and mitigation strategies in their
inception report. Initial risks of relevance to this contract have been identified as:

E&A Macro Evaluation: Annual Technical Report 2016 – Annexes
61
Construction of the tabulated mappings turns out to be a much bigger task than
envisaged, leading to delays, increased costs, or reduced funds for the other elements
of the evaluation
Inability to retain consultants for the whole three-year contract leads to loss of
knowledge during handovers, affecting the quality of the evaluation
DFID staff are unable to provide sufficient support to ensure the service provider is
able to implement the project effectively
Data shortages mean that key hypotheses cannot be tested.
Timeframe and deliverable requirements
Timeframe
The envisaged timeframe for this contract is provided below (subject to timely conclusion of
the procurement process):
February 2014 – contract signed
February 2014 – contract commences
February 2014 – work on tabulated mappings commences
March 2014 – submission of six weeks inception report. DFID will then agree with the
service provider a work plan with key performance indicators in line with the finalised
logical framework
Every three months subsequently – the service provider will submit a quarterly
progress report against results and deliverables and expenditure. These will be
reviewed by the Steering Committee, at its meetings
Annually – An annual synthesis (technical) report of evidence for each policy area,
using knowledge from recent evaluations, analysis of available project data, and
external evidence sources. In March 2015 the annual synthesis reports for each policy
area should also include an analysis of the policy portfolios. It should also contain:
Updated tabulated mappings
Updated clusters of policy relevant project sets
Updated testable hypotheses from the ToC which relate to clusters of comparable
projects
No later than March 2015 – Policy Implementation Review of the Strategic Vison for
Girls and Women should be completed in order to feed into the development of the
next gender policy in DFID
No later than April 2015 – submission of the ‘Options Paper’ for moving forward
Within three months of end of the programme and before expiry of the contract – final
report, detailing progress against the deliverables and expenditure of all programme
funds. Dependent on the decision at the mid-term review, this final report will be
produced either at the end of the first 18 months if the contract is not extended, or at
the end of the three years.

E&A Macro Evaluation: Annual Technical Report 2016 – Annexes
62
Reports in the first year of the contract
It is envisaged that the consultants will produce three reports in the first 12 months of the
contract. Suggestions on the content and timing of these are provided below, but firms
responding to the ITT are invited to suggest their own:
After six weeks – Inception report on initial observations and progress
After 11 months – A final inception report
After 9 months – report on progress of the tabulated mapping outlining the organising
framework, progress and any constraints
After 12 months – report on completion of the clustering of projects, justifying the final
clusters, updating the EQs and providing details of the proposed sample and sampling
methodology employed; and any additional data requirements.
The inception report will cover:
Progress in compiling the two tabulated mappings
Proposed revisions, if appropriate, to the timetable for completing the tabulated
mappings and undertaking the evaluations
Risks identified and mitigation strategy
Proposed revisions, if appropriate, to the evaluation approach
Proposals on any additional data collection work required
A draft communication strategy, covering purpose, audiences, channels, and timing of
communications
Based on the communications strategy, any other products (in addition to quarterly
and annual reports) that would need to be produced in order to meet the needs of the
identified audiences
Initial thoughts, if any, on revisions to the EQs.
Accountability
Governance
A Steering Committee will be established to meet at least half-yearly and at strategic points in
the evaluation cycle. The main responsibilities of the Steering Committee will be to oversee
progress in the programme, to review proposed approaches and methodologies and quality
of implementation and to coordinate involvement across DFID. Members will be drawn from
the E&A and gender vision pillar policy leads, DFID’s relevant chief professional officers and
advisory cadres and evaluation department. Additional external experts in the two policy areas
and evaluation will be invited to join the Steering Committee to provide additional knowledge.
DFID may also set up a small reference group, comprising sector specialists, to advise the
Steering Committee. A decision whether to establish such a group will be made once the
Steering Committee has been established.

E&A Macro Evaluation: Annual Technical Report 2016 – Annexes
63
Length of contract
The contract is for a period of 3 years and 6 weeks and is defined by three distinct phases:
Inception Phase (11 Months)
Implementation Phase 1 (7 Months)
Implementation Phase 2 (18 Months)
Contractual accountability
The consultants will be contractually accountable to DFID and will report to the Head of
Governance, Open Societies and Accountability Department and the Head of Inclusive
Societies Department in DFID’s Policy Division (or his/her designate) for all contractual issues
and administrative oversight of the contract. The contract will be issued for the full
implementation period, but will be subject to acceptance of deliverables, satisfactory
performance of the service provider and approval of the service provider’s inception report
and annual work plans. Periodic break points for review of the programme will be agreed
between the DFID Policy Division team (in consultation with the Steering Committee) and the
service provider. The consultants will be expected to deal with all logistical issues.
There will be an 11 month inception phase. If DFID (in consultation with the Steering
Committee) then decides not to proceed to the implementation phase, the contract will be
terminated at no cost to DFID.
In the event that DFID (in consultation with the Steering Committee) decides to proceed to the
implementation phase, the contract will be reviewed and amended as required. This will
include details of the services to be provided in the form of updated ToRs and detailed costs.
In addition, work plans and associated budgets will be discussed and amended annually.
Programme performance will be evaluated through an output-based contract with key
performance indicators (KPIs). Payments will be made against firm milestones during the
inception phase and on through implementation. KPIs and milestones for the implementation
phase will be agreed between the EM and DFID (in consultation with the Steering Committee)
during the inception phase. Delivery of the milestones will be continually reviewed through
quarterly and annual reports provided by the service provider.
Ownership and copyright of all outputs will lie with DFID. Arrangements for storage and
accessibility of any data generated through the work will be agreed in the inception phase
between DFID and the service provider.
Duty of care
It is likely that the evaluation will require field visits to certain countries – the decision on
country focus is expected to take place during the inception phase.
To ensure that the supplier selected has the capability to provide duty of care in countries
where field visits may be required, DFID will provide, as part of the ITT, risk assessments of a
sample high and medium risk countries that are likely to be visited. Bids will demonstrate,
backed up by prior evidence, that the team have the ability to assess and mitigate risk as part
of their work in both of these areas and also in any of the possible locations during the course
E&A Macro Evaluation: Annual Technical Report 2016 – Annexes
64
of this evaluation. This should reflect a clear, general approach to managing risk and duty of
care, in line with DFID duty of care guidance
The supplier is responsible for the safety and well-being of their personnel (as defined in
Section 2 of the Contract) and Third Parties affected by their activities under this contract,
including appropriate security arrangements. They will also be responsible for the provision of
suitable security arrangements for their domestic and business property. DFID will share
available information with the supplier on security status and developments in-country when
countries are identified and where appropriate. DFID will provide the following if available in
the selected countries:
All supplier personnel will be offered a security briefing by the British Embassy/DFID
on arrival. All such personnel must register with their respective embassies to ensure
that they are included in emergency procedures.
A copy of the DFID visitor notes (and a further copy each time these are updated),
which the supplier may use to brief their personnel on arrival.
The supplier is responsible for ensuring appropriate safety and security briefings for all of their
personnel working under this contract and ensuring that their personnel register and receive
briefing as outlined above. Travel advice is also available on the FCO website and the supplier
must ensure they (and their personnel) are up to date with the latest position.
Once the country or countries to be visited has been decided during the inception phase, DFID
will perform a risk assessment, and it will be a requirement that the service provider makes a
full assessment of their ability to adequately cover their responsibilities for duty of care for
direct and indirect staffing in support of delivery of this contract in those countries by
completing the six questions in the duty of care guidance. Should the operating environment
deteriorate during the lifecycle of this programme, a new duty of care assessment will need to
be completed before the contractor and its subcontractors will be permitted to visit the selected
locations.
Access to and external storage of DFID documents
10.1 The supplier may hold the following documents on an external server. These documents
are considered public documents. Itad will access QUEST using a DFID issued laptop. To
transfer DFID project documents from QUEST to the external server Itad will save the required
documents onto the DFID laptop and then upload them on the external server. Once the
documents have been uploaded onto the external server, Itad will delete them from the DFID
laptop. In the event that a DFID laptop is not made available for the relevant team members
in time for the work to proceed as planned, Itad will save the authorised documents onto a
secure portable hard drive and then upload them onto the external server. Once this has been
done, Itad will delete the documents from the portable hard drive. DFID believe these
documents will comprise:
1. Business case/project memorandum 2. Logframe 3. Annual reviews: both ARIES and narrative reports, where available 4. Mid-term review reports 5. Project completion reports 6. Evaluation reports (evaluation frameworks, evaluation findings)

E&A Macro Evaluation: Annual Technical Report 2016 – Annexes
65
7. Other project scoping or analytical documents (e.g. project design reports, political economy analyses)
8. Project progress reports (possibly, though may not be essential). Any documents not listed above and still required for the macro evaluation will need to be
cleared DFID staff and may not be authorised.
10.2 The Supplier is not allowed to make any amendments to any DFID documents held; the
supplier may electronically add comments to documents for the purposes of the evaluation.
10.3 The supplier must not make additional copies of the information without prior permission
from DFID.
10.4 Only team members with the correct security clearance are allowed to access the
external server.
10.5 Where the supplier wishes to hold other DFID documents on an external server it needs
to seek DFID approval. This will be provided by Daniel Lampen or David Campbell.
10.6 The supplier must delete the information once there is no requirement for it to be held,
unless otherwise specified, this will be at the point of termination or expiry of the contract.

E&A Macro Evaluation: Annual Technical Report 2016 – Annexes
66

E&A Macro Evaluation: Annual Technical Report 2016 – Annexes
67

E&A Macro Evaluation: Annual Technical Report 2016 – Annexes
68
Annex E Achieving robustness in the E&A macro evaluation: A Technical Note44
Introduction
In developing and piloting a methodology for the E&A macro evaluation, we have identified a
number of issues around achieving robustness in the evaluation research methodology. In this
Note we pull these issues together around the following three robustness principles and one
cross-cutting principle. The three robustness principles are:
The first principle of reliability ensures that a result achieved with the chosen research
method can be repeated by any given researcher. Reliability builds confidence in the
repeatability of a study’s given research method;
The second principle of internal validity is applied to studies that attempt to establish
a causal relationship. It allows us to be confident that a changing project outcome can
be attributed to a given intervention. Internal validity builds confidence in the cause
and effect relationship within a study;
The third principle of external validity increases our confidence that we can generalise
results beyond the immediate study population, thus building ‘confidence of inference’
from that study.
Cross-cutting these three principles is a fourth principle of transparency. This requires that
the application of these robustness principles through research protocols is open to external
scrutiny by third parties, enabling challenge and verification.
Applying these principles in practice is strongly influenced by the type of research
methodology employed. Standard experimental research brings with it a clear set of
procedures for increasing the reliability and (internal and external) validity of study. We have
adapted these robustness principles to the application of our chosen realist synthesis45
research approach for the macro evaluation (see Figure 1).46 Rather than seeking universal
truths based on experimental methods, a realist synthesis seeks to negotiate the complexities
of programme interventions by identifying underlying causal mechanisms and exploring how
they work in particular contexts and settings.47
Our approach sequences a pattern-finding QCA method that identifies significant ‘causal
configurations’ of factors (or conditions) that are associated with a given project outcome, with
an interpretive narrative analysis method that examines these causal configurations in
greater depth and explores how they work in different contexts and under what conditions. In
the first instance we will look to see (a) to find if there is any plausible underlying causal
mechanism, and then (b) to elaborate on how that works. We note that it is likely that with
44 The contents of this technical note were agreed with DFID to guide the application of the E&A macro evaluation methodology. 45See Pawson, R., Greenhalgh, T., Harvey, G. and Walshe, K. (2004), ‘Realist synthesis: an introduction’, RMP Methods Paper 2/2004. Manchester: ESRC Research Methods Programme, University of Manchester. 46 For a fuller discussion of the methodology, see Annex B of Itad and OPM (2015), ‘Empowerment and Accountability Annual Technical Report 2015: Final Draft Version’, Brighton: Itad, May 47 Pawson et al., op. cit.

E&A Macro Evaluation: Annual Technical Report 2016 – Annexes
69
some configurations there may be no plausible underlying causal mechanism that can be
found, at least with the evidence currently available.
Figure 1: Macro evaluation components and methods
Reliability: Ensuring the repeatability/ replicability of findings
The first robustness principle of reliability ensures that the findings generated through the
chosen research method are repeatable over time, across projects and across researchers.
Applying this principle to our realist evaluation method means ensuring that the QCA
‘conditions’ (comprising contextual factors, project mechanisms and project outcomes) are
identified and scored (using QCA binary scoring) in a replicable manner and that the emerging
patterns/ causal configurations are then interpreted through narrative analysis in a replicable
manner by any researcher using the same method.
In practical terms this means establishing a clear and replicable tabulated coding and rubric
system that can be systematically applied by a group of researchers with shared conceptual
understandings of the conditions involved. This is what gives the coding its transparency and
openness to external scrutiny and challenge.48 These rubrics use a mix of proxy indicators
and extracted qualitative data:
The proxy indicators for project contexts are selected from nationally comparable
governance indexes and are used for standard binary measurements of the presence
or absence of various contextual conditions (such as the strength of civil society or the
openness of political society). These scores are reductionist but unambiguous, dividing
the project set cases into two groups (1 or 0, with no case slipping between the two);
48 These raw data will be available for scrutiny by a peer review group established with DFID, and we are open to discussions about how much public access we will allow for wider scrutiny.

E&A Macro Evaluation: Annual Technical Report 2016 – Annexes
70
Extracted qualitative data are used for additional binary coding: to code for the
presence or absence of project mechanisms (such as support to local dialogue or
capacity building of media) and to code for evidence of achievement of project
outcomes (such as strengthened civil society or improved service delivery). The
extracted qualitative data are included in the relevant tabulated cell, accompanied by
a summary statement that justifies the binary score applied;
We will also test the replicability of our findings through sensitivity analysis of our QCA
results. We will randomly add and remove conditions and cases from our models, and
change calibration thresholds. The ease and extent to which this changes our results
will give us an indication of the sensitivity of our QCA results. We will identify what
constitutes acceptable versus excess sensitivity and will make this clear when we
report on the results of these tests.
In order to increase our confidence that we have applied replicable scorings to the conditions
and that the QCA analysis will therefore generate replicable sub-sets of projects with shared
‘causal configurations’ that can be subject to interpretive analysis of cause and effect using
narrative analysis (see internal validity discussion below), we will subject the coding and
tabulating process to triangulation. This involves as a first step ex ante work of normalisation
among researchers through piloting and spot-checking. Once work begins on the main
sample, the triangulation process involves random cross-checking between researchers of the
coding of conditions, including the extraction and summarising of relevant qualitative
evidence.
Internal validity: Increasing the confidence that we can place in identified cause and
effect relationships
Reliability alone is not sufficient for ensuring a robust research methodology. We may be very
confident that we will get the same result if we repeat the measurement but it does not tell us
whether and how a given intervention is contributing to changing outcomes. Internal validity
shows that the researcher has evidence to suggest that an intervention had some effect on
the observations and results.
Establishing internal validity within our combined methods approach will involve first being
confident about the causal configurations established by QCA and second being confident
about our deeper interpretation of those configurations using narrative analysis. Hence:
We will ensure first that the QCA analysis of the coded conditions (described under
‘Reliability’ above) is followed using a standardised and transparent protocol that is
open to general external scrutiny and to specific scrutiny through a peer review panel
established with DFID for this study.
We will further ensure that sample sub-sets, identified to explore shared causal
configurations, are established with clear criteria for their formation. We will express
our findings in terms of necessity, sufficiency or INUS relations – consistently with
multiple-conjunctural causal inference models.
For each causal configuration we will ensure that the selection of cases for in-depth,
interpretive (narrative) analysis is transparent. We will identify two clusters of cases to
subject to in-depth analysis:

E&A Macro Evaluation: Annual Technical Report 2016 – Annexes
71
1. Cases that exemplify the configuration of conditions associated with a given outcome of
interest. (‘Consistent cases’);
2. Cases that are inconsistent, having the same configuration of conditions but with outcome
absent (‘Inconsistent cases’);
Within each of these clusters there may be too many cases to subject all of them
to narrative analysis. We will therefore sample cases transparently for the following
clusters of cases and will select a minimum of three cases per cluster:49
1. Consistent cases: In order to find any likely causal mechanisms connecting the
conditions that make up the configuration we will look for ‘modal cases’, i.e. those
that have maximum similarity with all other cases in this group. We will use the
‘Hamming distance’ method of establishing similarity to find this type of case.50
Once a plausible causal mechanism is found, we will check to see if it can also be
found in the most ‘marginal’ cases in this group i.e. those with least similarity with
all others (identified again using the Hamming distance method);
2. Inconsistent cases (if present in the identified causal configuration): We will select
modal cases, and optionally marginal cases, using the same method. We would
expect to find the same causal mechanism to be present in these inconsistent
cases but to find some other factors that are blocking it from working delivering the
outcome;
It is important to flag here that we will be selective in our application of this method of within-
case analysis. We will prioritise within-case analysis based on our recognition of: (a) resource
limitations, (b) data limitations and (c) stakeholders’ views of which configurations are high
versus low priority for this kind of analysis.
We will then subject these causal configurations to within-case analysis with the
following objectives:51
1. Verification that the attributes of a project are actually those that are
ascribed to them in the data set used in the QCA analysis. Given the
procedure described above for coding, few errors should be expected, but
will be addressed if they occur;
2. Enlivening the QCA coding through the construction of simple readable
narrative which connects the conditions in the configuration in a way that is
both plausible and respectful of the facts;
3. Excavation to establish if there is a ‘real-life’ causal mechanism or
explanatory model that connects the events described by the configuration
of conditions found via QCA.
49 Assuming one dominant configuration per hypothesis. 50 We will retain the option to prioritise cases with higher quality evaluative evidence for narrative analysis if these cases are also close to the modal case profile. 51 Rick Davies (pers. comm.).

E&A Macro Evaluation: Annual Technical Report 2016 – Annexes
72
We will increase the trustworthiness of the causal inference in our narrative analysis
through demonstrating the ‘rigorous thinking’52 in our narrative analysis. We will apply
causal process observation (CPO) to the selected case studies. For each cluster this
will involve (i) coding, summarising and tabulating causal explanations and
accompanying evidence for each outcome; and (ii) translating this table into a causal
flow diagram that shows our interpretative analysis of change and contribution to
change. Once we have completed this within-case analysis, we will then compare the
CPO matrices and flow diagrams for all sampled cases in the cluster in order to
consider alternative explanations for change. This approach represents a simplified
adaptation of the empirical tests sometimes applied in the qualitative evaluative
method of ‘process tracing’53
We will further strengthen our confidence in the verifiability of these emerging
explanatory models by subjecting them to cross-checking and interrogation by at least
one other researcher, who will review the evidence cited and its interpretation. This
internal challenge function -- the basis of achieving trustworthiness in qualitative
research54 -- will enable us to increase our confidence in the internal validity of our
interpretations.
External validity: generalising results beyond the immediate study population
The third and final principle that we apply to the macro evaluation research process is that of
external validity. This increases our confidence that we can generalise our findings beyond
the sample group and apply them to a larger population of interest.
In conventional empirical research external validity is established with a probability-based
(random) sample that is sufficiently large to capture the variability of the ‘population universe’
(in this case the total Social Accountability project portfolio) under study.
The process of constructing project sets for the macro evaluation is described in the
methodology annex (Annex B) of the E&A Annual Technical Report 2015.55 This makes it clear
that we have not been able to construct a probability-based sample from the Social
Accountability project portfolio as we are limited to those projects whose evaluative content is
quality-assured (as of summer 2014, 77 out of a total of 180, although this may increase
slightly, with the addition of annual reviews and evaluation reports completed in the past
year).56 This in itself introduces an unavoidable bias towards those projects, which are well
documented and evidenced. However, for the next round of analysis, we will include as many
as possible of the 77 quality-assured projects to increase the coverage and breadth of our
knowledge relating to the project portfolio. We have started the process of conducting a final
data quality screening and are confident that the final number of quality-assured projects will
52 On the distinction between rigour as statistically verifiable attribution and rigour as ‘quality of thought, see Stern, E., Stame, N., Mayne, J., Forss, K., Davies, R. and Befani, B. (2012). Broadening the range of designs and methods for impact evaluations. (Working Paper No. 38), London, Department for International Development; White, H., & Phillips, D. (2012). Addressing attribution of cause and effect in small n impact evaluations: towards an integrated framework (Working Paper No. 15), International Initiative for Impact Evaluation (3ie). 53 Collier D (2011) ‘Understanding Process Tracing’, PS: Political Science and Politics, 44:4 pp 823–30, Berkley,
CA: University of California. http://polisci.berkeley.edu/sites/default/files/people/u3827/Understanding%20Process%20Tracing.pdf 54 Lincoln, Y. S. and Guba, E. G. (1985). Naturalistic Inquiry, London: Sage. 55 Itad and OPM (2015), op. cit. 56 The three quality assurance criteria of triangulation, transparency and contribution are described in Annex B.

E&A Macro Evaluation: Annual Technical Report 2016 – Annexes
73
be in the region of 50, and therefore within the budgetary ceiling of this analysis. This approach
will increase our confidence that we have captured the variability of ‘causal pathways’
identified by QCA and explored through narrative analysis across the Social Accountability
project portfolio. Moreover, since we are not sampling and using all projects with sufficient
data quality, other sources of bias are relatively limited. Other possible biases may arise from
geographically prioritised or politically driven selection of projects for additional evaluation or
extra scrutiny by DFID.
To explore possible biases, we analysed the extent of the representativeness of this project
set by mapping the project set profile onto the total project population using the portfolio
synopsis descriptive data. We compared our project set of 77 quality-assured projects to the
overall population of 180 Social Accountability projects on descriptive criteria such as
geography, duration, budgets, etc. We also compared the distribution of DFID outcome scores
where available, which provided us with a preliminary indicator of possible positive or negative
bias. Our comparative analysis confirms that the sample is highly representative against these
criteria. We will detail this comparative analysis in an annex of the next technical report.
When identifying and interpreting causal configurations of conditions that are associated with
a specific outcome, we will focus on those conditions that are consistently displayed by a large
number of cases. This will increase our confidence of interference and allow us to identify
relatively generalisable findings.57 To facilitate this, we will keep the ratio of conditions to cases
small.58 If findings are illustrated by a large number of cases with few inconsistencies, this will
provide an indication of generalisability.
Finally, our realist synthesis approach will allow us to explain the absence of external validity
in individual project causal mechanisms that we identify. We will be able to identify and
interpret those projects – particularly through our case selection method of identifying
inconsistent cases -- where causal mechanisms are too contextually specific to have external
validity in order to share lessons on what mediating aspects of project context ensure that
explanatory models are not generalisable to a wider population of projects.
57 However, we will also analyse outlier configurations where they offer interesting learning opportunities. 58 We will also look at some of the tables suggested by Marx and Dusa (2011), which intend to calculate probabilities of obtaining contradictory configurations for given numbers of cases and variables. However, we are aware of the limitations of this approach and will only use it where best applicable.