macquarie capital · macquariecapital page 1 this presentation has been prepared by macquarie...
TRANSCRIPT

STRICTLY CONFIDENTIALSTRICTLY CONFIDENTIAL
2016 capital markets insights and 2017 outlook
January 2017
Macquarie Capital

PAGE 1STRICTLY CONFIDENTIAL MacquarieCapital
This presentation has been prepared by Macquarie Capital (Australia) Limited ABN 79 123 199 548 (“Macquarie”) for the sole purpose of providing an overview of the Australian equity and debt markets in 2016, and an outlook for 2017. (“Purpose”). It is provided on a confidential basis, and may not be reproduced in whole or in part, nor may any of its contents be disclosed to any other person, without Macquarie’s prior written consent.
This presentation is provided by Macquarie for general information purposes only, without taking into account any potential investors’ personal objectives, financial situation or needs. It should not be relied upon by the recipient in considering the merits of any particular transaction. It is not an offer to buy or sell, or a solicitation to invest in or refrain from investing in, any securities or other investment product. Nothing in this presentation constitutes investment, legal, tax, accounting or other advice. The recipient should consider its own financial situation, objectives and needs, and conduct its own independent investigation and assessment of the contents of this presentation, including obtaining investment, legal, tax, accounting and such other advice as it considers necessary or appropriate.
This presentation has been prepared on the basis of publicly available information. Macquarie has relied upon and assumed, without independent verification, the accuracy and completeness of all such information. It contains selected information and does not purport to be all-inclusive or to contain all of the information that may be relevant to the Purpose. The recipient acknowledges that circumstances may change and that this presentation may become outdated as a result. Macquarie is under no obligation to update or correct this presentation.
Macquarie, its related bodies corporate and other affiliates, and their respective directors, employees, consultants and agents (“Macquarie Group”) make no representation or warranty as to the accuracy, completeness, timeliness or reliability of the contents of this presentation. To the maximum extent permitted by law, no member of the Macquarie Group accepts any liability (including, without limitation, any liability arising from fault or negligence on the part of any of them) for any loss whatsoever arising from the use of this presentation or its contents or otherwise arising in connection with it. This presentation may contain forward-looking statements, forecasts, estimates and projections (“Forward Statements”). No independent third party has reviewed the reasonableness of any such statements or assumptions. No member of the Macquarie Group represents or warrants that such Forward Statements will be achieved or will prove to be correct. Actual future results and operations could vary materially from the Forward Statements. Similarly, no representation or warranty is made that the assumptions on which the Forward Statements are based may be reasonable. No audit, review or verification has been undertaken by the Macquarie Group or an independent third party of the assumptions, data, results, calculations and forecasts presented or referred to in this presentation.
The recipient acknowledges that neither it nor Macquarie intends that Macquarie act or be responsible as a fiduciary to the recipient, its management, stockholders, creditors or any other person. Each of the recipient and Macquarie, by accepting and providing this presentation respectively, expressly disclaims any fiduciary relationship and agrees that the recipient is responsible for making its own independent judgments with respect to any transaction and any other matters regarding this presentation.
The Macquarie Group may have interests in the securities and other investment products referred to in the presentation, including being directors of, or may have or may in the future act in various roles including as underwriter, dealer, broker, lender or financial advisor to their issuers and may receive fees, brokerage or commission for acting in those capacities. A list of these roles is available on the Macquarie Group’s website at http://www.macquarie.com.au/macsec/equitiesresearch/InstitutionalHomeServlet?nav=disclosure_disc. Further, the Macquarie Group may act as a market maker or buy or sell those securities and other investment products as principal or agent and as such may effect transactions which are not consistent with this information.
None of the entities noted in this presentation are an authorised deposit-taking institutions for the purposes of the Banking Act 1959 (Commonwealth of Australia). The obligations of these entities do not represent deposits or other liabilities of Macquarie Bank Limited ABN 46 008 583 542. Macquarie Bank Limited does not guarantee or otherwise provide assurance in respect of the obligations of these entities.
© Macquarie Group 2017
Important notice and disclaimer

01 Insert divider title 3
A Insert divider title 7
Contents
STRICTLY CONFIDENTIALSTRICTLY CONFIDENTIAL
01 2016 equity and debt market performance 4
02 2016 equity and debt issuance review 8
03 2017 equity and debt market outlook 18
A Macquarie capabilities and contact details 21

PAGE 3STRICTLY CONFIDENTIAL MacquarieCapital
Markets pricing in stronger growth outlook
2016 equity and debt market performance
02 0301 Despite a series of tumultuous events, equity
markets closed 2016 at intra-year highsas volatility abated
A backdrop of renewed exuberance around equities emerged thanks to stronger US growth expectations, the prospect of a continuation of relatively low benchmark rates and higher than expectedcommodity prices
Historically low interest rates drove investors to search for yield in other asset classes. Over the course of 2016 credit spreads tightened
2016 equity and debt issuance
A total of $33 billion was raised in equity in 2016 (compared to $64 billion in 2015). Despite political events, the IPO market and secondary issuance market remained active. Secondary issuance was dominated byM&A funding
Debt market issuance was down over the course of 2016 in Australia as lower refinancing volumes and reduced M&A activity affected the market. The sources of funding continued to move away from Australian to Asian lenders and from bank loans to bond markets more generally
Looking ahead to 2017
The domestic economic outlook for 2017 is shaping up to be a tale of two halves with the second half expected to deliver better real growth, driven by stronger private and public investment, increasing export volumes and growth-conducive monetary policy
Macquarie Research forecasts a modest increase of 3.7% in the ASX 200 from December 2016 to December 2017 and expects the equity market to trade above‘fair value’ (~16-18x) as risk-taking behaviour remains supportive for equities over bonds against an outlook for positive earnings momentum (~10% EPS growth)and a broader economic recovery
2016 in retrospect and the outlook for 2017Macquarie Capital Markets team

STRICTLY CONFIDENTIALSTRICTLY CONFIDENTIAL
2016 equity and debt market performance
01

PAGE 5STRICTLY CONFIDENTIAL MacquarieCapital
Despite a series of tumultuous events, markets closed 2016 at year highs as volatility subsided
Source: IRESS and FactSet as at 31 December 2016.
…with volatility trending lower despite tumultuous events
The year was marked by a number of significant macro eventsASX 200 at yearly highs and S&P 500 at all time highs…
Australian market driven by macro events
— Weak growth and declining oil prices led to global volatility and weak share price performance at the start of 2016
— Market weakness saw the ASX 200 reach lows in early February 2016
— US expectations of a slower pace of rate hikes spurred a relief rally
— Brexit shocked the markets leading to a spike in volatility and flight to safety
— Fed rate uncertainty pushed volatility higher
— The US Presidential election caused volatility to spike once more, however dropped sharply following Trump’s victory
— Renewed optimism around equities has emerged against a backdrop of stronger US growth expectations, the expectation of a continuation of relatively low benchmark rates and higher than expected commodity prices
85
95
105
115
Jan 16 Mar 16 May 16 Jul 16 Sep 16 Nov 16 Jan 17
Per
form
ance
(reb
ased
to 1
00)
S&P ASX 200 S&P 500
6
14
22
30
Jan 16 Mar 16 May 16 Jul 16 Sep 16 Nov 16 Jan 17
VIX
CBOE Market Volatility Index
+7.0%+9.5%
(22.9)%
21
3
6
5
4
7
1 2
3 45 6
7
7
6
5
4
3
2
1

PAGE 6STRICTLY CONFIDENTIAL MacquarieCapital
(6%)
1%
4%
5%
6%
6%
13%
15%
15%
17%
21%
24%
Financials
Cons. Staples
Telcos
Media
S&P/ASX 200
Energy
Cons. Disc.
Healthcare
Industrials
Utilities
A-REITS
Materials
8%
(0%)
(16%)
(12%)
1%
7%
(4%)
(13%)
(7%)
(3%)
(10%)
12%
60
70
80
90
100
110
120
Jan 16 Mar 16 May 16 Jul 16 Sep 16 Nov 16 Jan 17
Per
form
ance
(reb
ased
to 1
00)
ASX 200 Real Estate ASX 200 Utilities ASX 200 Telcos Aus 10 yr bond yield
Source: IRESS and FactSet as at 31 December 2016.
Defensive sectors underperformed post August as investors rotated into commodity/growth correlated sectors
Rotation from defensives to cyclicals
January to July characterised by a continuation of the yield trade, but as bond yields rose investors rotated to growth stocks
Pre 1 Aug 16 Post 1 Aug 161 August
Marked shift from defensive exposures to cyclical stocks against a backdrop of rising bond yields
2.8%2.8%
- 94 bps + 96 bps
1.8%
A$ 10yr bond yields
PAGE 7STRICTLY CONFIDENTIAL MacquarieCapital
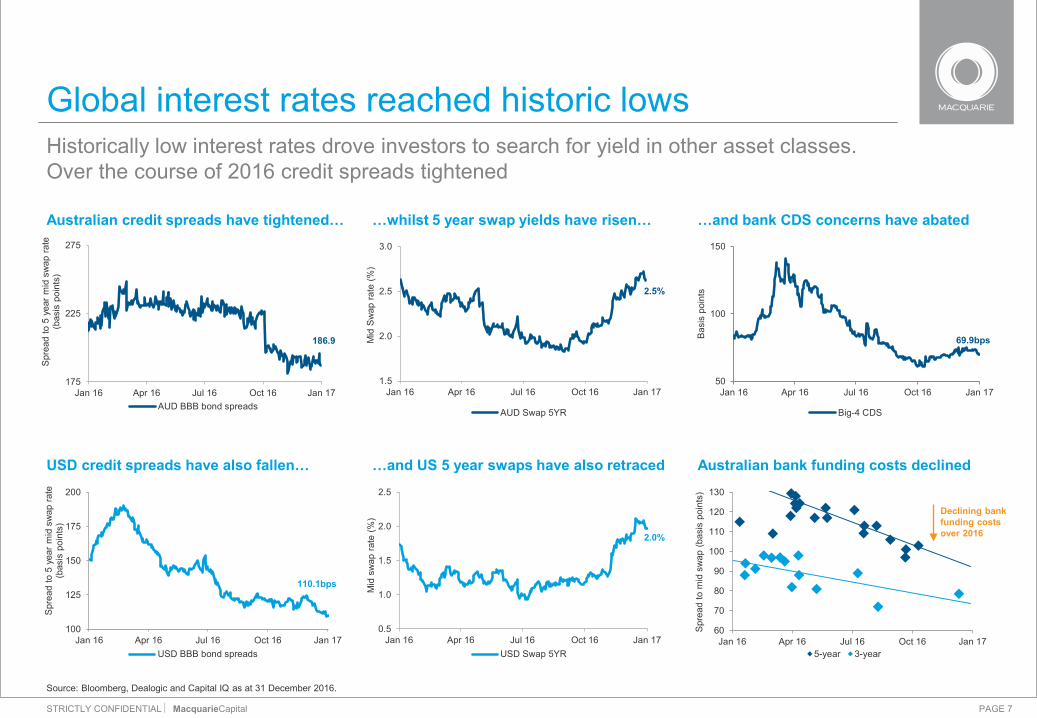
Historically low interest rates drove investors to search for yield in other asset classes.Over the course of 2016 credit spreads tightened
Source: Bloomberg, Dealogic and Capital IQ as at 31 December 2016.
186.9
175
225
275
Jan 16 Apr 16 Jul 16 Oct 16 Jan 17
Spr
ead
to 5
yea
r m
id s
wap
rate
(b
asis
poi
nts)
AUD BBB bond spreads
…whilst 5 year swap yields have risen… …and bank CDS concerns have abated
69.9bps
50
100
150
Jan 16 Apr 16 Jul 16 Oct 16 Jan 17
Bas
is p
oint
s
Big-4 CDS
USD credit spreads have also fallen…
110.1bps
100
125
150
175
200
Jan 16 Apr 16 Jul 16 Oct 16 Jan 17
Spr
ead
to 5
yea
r m
id s
wap
rate
(b
asis
poi
nts)
USD BBB bond spreads
…and US 5 year swaps have also retraced
2.0%
0.5
1.0
1.5
2.0
2.5
Jan 16 Apr 16 Jul 16 Oct 16 Jan 17
Mid
sw
ap ra
te (%
)
USD Swap 5YR
Australian credit spreads have tightened…
Australian bank funding costs declined
60
70
80
90
100
110
120
130
Jan 16 Apr 16 Jul 16 Oct 16 Jan 17
Spr
ead
to m
id s
wap
(bas
is p
oint
s)
5-year 3-year
Global interest rates reached historic lows
2.5%
1.5
2.0
2.5
3.0
Jan 16 Apr 16 Jul 16 Oct 16 Jan 17
Mid
Sw
ap ra
te (%
)
AUD Swap 5YR
Declining bank funding costs over 2016
STRICTLY CONFIDENTIALSTRICTLY CONFIDENTIAL
2016 equity and debt issuance review
02

PAGE 9STRICTLY CONFIDENTIAL MacquarieCapital
During 2016 there was a marked reduction in secondary issuance due to an absence of bank recapitalisations seen in 2015
Source: Dealogic as at 31 December 2016. Note 1: All ECM issuance. 2: Follow-on ECM transactions >A$50m.
…with secondary issuance in 2016 dominated by M&A funding2…
…and a marked reduction in large recapitalisations compared to 20152
A total of $33 billion was raised in equity in 20161…
2016 saw ECM volumes moderate
$19.7bn
$30.8bn
$48.0bn
$63.5bn
$33.0bn
-
10
20
30
40
50
60
70
2012 2013 2014 2015 2016
Equ
ity ra
ised
($A
bn)
IPO Block Secondary DRP/SPP Hybrid
$2.7bn$4.5bn
$8.5bn $7.4bn $8.1bn
$8.1bn $8.0bn
$12.6bn
$33.7bn
$13.2bn
-
5
10
15
20
25
30
35
40
2012 2013 2014 2015 2016
Equ
ity ra
ised
($A
bn)
M&A Balance sheet repair Growth
$8.1bn $8.0bn
$12.6bn
$33.7bn
$13.2bn
-
5
10
15
20
25
30
35
40
2012 2013 2014 2015 2016
Equ
ity ra
ised
($A
bn)
Resources Consumer InfrastructureIndustrials Real Estate TechnologyHealthcare Financials
IPO volumes remain robust

PAGE 10STRICTLY CONFIDENTIAL MacquarieCapital
(20)
(15)
(10)
(5)
(0)
0 10 20 30 40 50 60 70 80
Dis
coun
t (%
)
Offer size (% mkt cap)
2016 saw more companies raise capital to fund M&A with a clear trend observable between offer size and discount achieved
Source: Dealogic and company announcements as at 31 December 2016. Note 1: M&A raisings over A$50m. 2: Discount to TERP for rights issues, discount to close for placements. Placements includes Placement with SPP offer structures. Non-renounceable includes Placement with non-renounceable offer structures. Renounceable includes Placement with renounceable offer structures. Excludes deals with an offer size greater than market capitalisation. 3: M&A raisings over A$150m. 4: Entitlement offer. 5: Placement to CPPIB at 2.9% discount to TERP.
M&A raisings dominated activity in 20163
Discounts remained tight for M&A linked equity issuance1,2
Clear correlation between raising discount and offer size1,2
M&A funding featured strongly4.
4%
3.5% 5.
1%
2.1%
\
3.4%
15.5
%
5.9%
11.4
%
5.8%
9.4%
16.3
%
13.3
%
11.5
%
11.5
%
14.8
%
-
5
10
15
20
2012 2013 2014 2015 2016
Dis
coun
t (%
)
Placement average 3.7%
Non-renounceable average 9.6%
Renounceable average 13.5%
Issuer Target Date Size ($m) Structure Discount (%)2
Headwaters Nov-16 2,058 Placement & EO4 (15.1)
Harris CapRock Nov-16 294 Entitlement offer (13.8)
Adshel Oct-16 273 Placement & EO4 (20.1)
The Good Guys Sep-16 394 Entitlement offer (8.1)
Hellaby Sep-16 181 Placement & SPP (5.0)
Ernest Henry Aug-16 404 Entitlement offer (13.4)
Generic product portfolio
Jun-16 888 Placement & EO4 (9.2)
Nextgen Jun-16 652 Placement & EO4 (10.4)
Southern Cross portfolio
Jun-16 260 Placement & EO4 (6.0)
Asciano Mar-16 800 Placement & EO4 (7.0)5
DBP Mar-16 246 Placement & SPP (3.5)
Placement
Non-renounceable rights issues
Renounceable rights issues
APN
MaynePharma

PAGE 11STRICTLY CONFIDENTIAL MacquarieCapital
$5.3bn
$3.8bn $4.0bn
$6.6bn$7.1bn
$12.7bn
$6.4bn
-
1
2
3
4
5
6
-
3
6
9
12
15
18
2010 2011 2012 2013 2014 2015 2016
Ave
rage
dis
coun
t to
last
clo
se (%
)
Blo
ck v
olum
e ($
bn)
Block volume ($bn) (LHS) Average block discount (%) (RHS)
Block trades continue to account for a large portion of ECM activity, although investors experienced mixed returns post selldown
Source: Dealogic and IRESS as at 31 December 2016. Note 1: 2016 blocks above A$125m. 2: Return on offer price as at 31 December 2016.
Block activity was dominated by non-sponsor selldowns1Block trades continue to be executed at tight discounts
Block selldowns experienced mixed results
#
15
3233
39
39
16 23
Date Issuer VendorValue ($m)
Discount (%)
Return (%)2
PE vendor
Dec-16 Archer Daniels Midland 387 (2.1) 12.1
Nov-16 IPH Partners 150 (1.0) 2.4
Sep-16 Gandel Group 396 (7.1) (5.2)
Sep-16 PEP, ICG 872 0.0 (9.7)
Sep-16 Atlas Roads Macquarie Group 282 (4.1) (5.1)
Aug-16 The Carlyle Group 350 0.0 (4.3)
Aug-16 Consolidated Press 448 (5.3) (9.5)
Aug-16 ADIA 254 (1.3) (12.2)
Jun-16 Cheung Kong 252 (3.5) 6.7
Jun-16 NZ Super 292 (2.2) (9.4)
May-16 Spark Infrastructure 306 (5.1) 21.8
Apr-16 PEP, ICG, Macquarie 392 0.5 1.5
Mar-16 Macquarie 130 (8.5) 43.1
Mar-16 Newmont Mining 244 (4.2) 18.3

PAGE 12STRICTLY CONFIDENTIAL MacquarieCapital
4.6
1.5
3.1
8.6
9.7
16.0
8.4
9.8
1.8
2.8
8.2
1.3 1.1
6.7
17.1
8.5
6.8
10.0
2,000
2,500
3,000
3,500
4,000
4,500
5,000
5,500
6,000
6,500
7,000
-
2
4
6
8
10
12
14
16
18
20
'00 '01 '02 '03 '04 '05 '06 '07 '08 '09 '10 '11 '12 '13 '14 '15 '16 '17
AS
X 20
0
AS
X IP
O is
suan
ce ($
bn)
QR National
MedibankPrivate
Goodman FielderSpark Infrastructure
SP AusNet
Company Listed Size ($Am) %Δ since listing3 Main Vendor
BRAVURA Nov-16 148 (4.1%) Private Equity
AUTSPORT Nov-16 160 4.6% Founders
ELANOR Nov-16 109 -% Corporate
CHARTER HALL Nov-16 827 0.2% Corporate
INGAHMS Nov-16 596 1.3% Private Equity
ANTOPED Oct-16 313 -% LIC4
QANTM Aug-16 147 (4.1%) Corporate
PROERTYL Aug-16 504 (12.4%) Corporate
VIVA Aug-16 911 9.1% Corporate
SCOT PAC Jul-16 294 (17.2%) Private Equity
AUS UNIT Jun-16 152 0.5% Corporate
GTN Jun-16 188 43.2% Private Equity
May-16 394 4.5% LIC4
TEGEL May-16 NZ299 (6.5%) Private Equity
RWC Apr-16 919 28.0% Founders
WISTECH Apr-16 168 68.7% Founders
Source: Factset, Dealogic and press releases as at 31 December 2016. Note 1: IPOs > A$20m (excludes dual listings). 2: IPOs > $100m in 2016. 3: From listing date to 31 December 2016. 4: Listed investment company.
IPO window remains open for high quality companies1
IPO volumes remained robust Despite political events in 2016, demand for high quality IPOs remained strong, although several deals struggled towards year end resulting in repricing/restructuring or deferrals
IPO
pip
elin
e
IPO window open305 deals, $39bn raised
IPO window open848 deals, $53bn raised
Performance of IPOs during the year was mixed2

PAGE 13STRICTLY CONFIDENTIAL MacquarieCapital
Company Announced Capital returned ($m) Mechanism
AGL Sep-16 596 On-market buy-back
IAG Aug-16 314 Off-market buy-back
INTERP Aug-16 24 Capital return
QANTAS Aug-16 366 On-market buy-back
JAMES HAR Aug-16 1002 On-market buy-back
TELSRTA Aug-16 1,500 On and off-market buy-back
GENW Aug-16 67 Special dividend
SGH Mar-16 71 On-market buy-back
QANT Feb-16 500 On-market buy-back
CALTE Feb-16 270 Off-market buy-back
IAG Feb-16 243 Special dividend
NAVIT Feb-16 135 On-market buy-back
OZMINER Feb-16 60 On-market buy-back
Sources: Dealogic, ASX announcements, annual reports, IRESS, Bloomberg and company announcements as at 31 December 2016. Note 1: Announced capital management initiatives excluding $1.6bn RIO Plc buy-back announced Feb-2015. 2: USD.
Capital management remained strong in 20161 EPS accretion benefits of on-market buy-backs a feature in 2016
Capital management continues to feature
$4.0bn
$17.9bn
$11.1bn
$6.4bn$5.9bn
$7.0bn $7.3bn
-
4
8
12
16
20
2010 2011 2012 2013 2014 2015 2016
Vol
ume
(A$b
n)
Off-market buybacks On-market buybacks Special dividends Capital returns
Many large companies focused on capital management initiatives to enhance shareholder returns against the low growth backdrop

PAGE 14STRICTLY CONFIDENTIAL MacquarieCapital
Despite an increase in the average discount offered in 2H16, DRP participation rates have declined compared to prior years
Source: IRESS as at 31 December 2016 for ASX 200 companies. Note 1: When discount provided. 2: Excludes participation rates > 50% (GOZ). 3: DRP discounts in 2016.
23.2%24.1%
21.9%21.4%
18.8%19.3%
1.5
2.5
3.5
15
20
25
CY1H14 CY2H14 CY1H15 CY2H15 CY1H16 CY2H16
Ave
rage
dis
coun
t1(%
)
Ave
rage
par
ticip
atio
n (%
)
Average participation Average discount
…with 30% of companies neutralising DRPs to avoid dilution
-
2
4
6
8
-
20
40
60
80
CY1H14 CY2H14 CY1H15 CY2H15 CY1H16 CY2H16
Und
erw
ritte
n D
RP
s (#
)
Act
ive
and
neut
ralis
ed D
RP
s (#
)
Active DRPs (LHS) Neutralised DRPs (LHS) Underwritten DRPs (RHS)
Substantial participation observed at 1.5% and 2.0% discounts2… …however majority of DRPs offered with no discount3
69%
4%
10%
7%
7% 3%
0.0%
1.0%
1.5%
2.0%
2.5%
5.0%
Average participation consistent over 2016…
DRP participation rates have declined
-
10
20
30
40
50
- 0.5 1.0 1.5 2.0 2.5 3.0 3.5 4.0 4.5 5.0
DR
P p
artc
ipat
ion
rate
(%)
Discount (%)Participation rate at given discount Average participation rateAverage participation rate at given discount

PAGE 15STRICTLY CONFIDENTIAL MacquarieCapital
1.2%
1.4%
1.5%
3.4%
3.6%
3.8%
3.0%
2.2%
3.0%
4.3%
4.1%
2.3%
1.4%
1.7%
2.0%
2.8%
2.8%
2.9%
2.9%
3.0%
3.5%
3.7%
4.3%
4.7%
- 1 2 3 4 5
Real Estate
Utilities
Financials
Industrials
Energy
Materials
ASX 200
Health Care
Telcoms
Cons. Disc.
Cons. Staples
IT
Average short position (%)1
Shorting levels for resource and consumer correlated sectors fell in 2016, with investors instead increasing shorts on IT and healthcare names
Source: ASIC short positions as at 31 December 2016. Note 1: Reported as percentage of total product in issue reported as short positions.
…from resources and consumer to IT and health care2016 saw a significant shift in shorted sectors…
Shift in short positions
Short position at beginning of 2016 Short position at conclusion of 2016
2.4
0.2
(0.6)
0.5
0.8
(0.1)
(0.9)
(0.8)
(0.6)
0.5
0.3
0.2
Resource and consumer namesIT and health care names
Largest changes in shorting levels in key sectors
Shorting levels (%)1
Start of 2016 End of 2016 Change
IT0.9% 16.1% 15.2
0.1% 7.8% 7.7
Health care1.4% 8.3% 6.9
2.0% 8.3% 6.3
Consumer Discretionary
19.9% 4.1% (15.8)
12.9% 4.6% (8.3)
Materials13.2% 1.5% (11.7)
14.8% 5.5% (9.3)
Energy9.2% 2.3% (6.9)
9.7% 5.6% (4.1)

PAGE 16STRICTLY CONFIDENTIAL MacquarieCapital
Issuer Type Pricing date Rating Volume (A$m) Tenor (yrs) Margin to Mid-swapBank loan Nov-16 NR 1,725 5 – 7 200 – 225
Bank loan Oct-16 NR 13,000 Various 100 – 175
Bank loan Apr-16 BBB-/Baa3
4,000 3, 5 135, 165
Bank loan Mar-16 BBB/Baa2
1,200 3, 5.5 130, 160
AMTN1 Oct-16 A-/A3 200 10 167
AMTN1 Sep-16 BBB-/Baa3
425 7, 10 258, 280
EMTN2 Sep-16 BBB /Baa1
US550 10.5 227
EMTN2 Apr-16 A/A2 EUR750 10 76
EMTN2 Mar-16 A+/A1 EUR500 7 210
S144a Sep-16 BBB+/Baa1
US600 10 236
S144a Sep-16 A-/Baa1 US800 10 258
S144a Apr-16 BBB/Baa2
US900 10 215
USPP3Oct-16 BBB/NR ~774 US$:10/12/15
A$: 10/15/18 US$: 228/ 230/ 235A$: 223/ 242/ 252
USPP3 Jul-16 A- US500 US$: 10, 12 A$: 10, 15
US$: UST + 125, ~135 A$: Ms + 178,186
USPP3Jul-16 Baa2 756 10, 12.5, 15, 17 160, 170, 185,
ICUR+175
USPP3Mar-16 NR US300 10 ~260
Source: Dealogic and Loanconnector. Note 1: Australian medium term notes. 2: European medium term notes. 3: US private placement
2016 DCM transactions by Australian borrowersBond issuances in Australasia below historical averages
Debt volume affected by market conditionsReduced loan and bond volume has created competition for high quality assets
Loan issuances in Australasia declined for a second year
-
80
160
240
-
20
40
60
2012 2013 2014 2015 2016
Tota
l num
ber o
f iss
ues
Issu
es (U
S$b
n)
Australasia Total number of issues
-
100
200
300
400
-
50
100
150
200
2012 2013 2014 2015 2016
Tota
l num
ber o
f iss
ues
Issu
es (U
S$b
n)
Australasia Total number of issues
US$47bn US$34bn US$26bn US$38bn US$26bn
US$106bn US$136bn US$160bn US$110bn US$96bn

PAGE 17STRICTLY CONFIDENTIAL MacquarieCapital
Chinese banks and institutional investors are increasing lending to the Australian market
Source: Loanconnector and Thomson Reuters.
Chinese participation in the Australian market increased markedly in 2016
Funding landscape for borrowers is evolving
Chinese participation in the Australian market accounted for 10.8% in 2016 (compared to 1.4% in 2014)
The growth in Chinese lenders has been driven by
— Weight of capital in China looking to be deployed into investmentsother than equity
— Capital constraints of other banks including Basel 4 regulations, switching focus of domestic banks and European banks facing stagnant economic growth in home economies
Institutional lenders in Australian market are growing and competitive
1.4% 3.9% 10.8%
-
20%
40%
60%
80%
100%
2014 2015 2016Australian European Japanese Others Chinese

STRICTLY CONFIDENTIALSTRICTLY CONFIDENTIAL
2017 equity and debt market outlook
03

PAGE 19STRICTLY CONFIDENTIAL MacquarieCapital
2017 expected to see robust ECM activity
Large 2017 IPO pipeline02 0301
Since the IPO window reopened in 2013, issuance has remained strong despite the deferral of a number of IPOs in the last few months of 2016
Expect the IPO market to remain open in 2017 with the potential for several high profile floats to come to market including the floats of a number of companies who delayed their listing plans in late 2016
Estimated 2017 IPO pipeline of ~$10 billion
M&A activity to continue After a year dominated by M&A issuance,
expectations are for companies to continue to look for accretive M&A opportunities to enhance growth and for investors to support these initiatives
The need for large balance sheet recapitalisations remains subdued
Blocks a likely focus Block trades will continue to account for a
large proportion of ECM activity with several large stakes set to be released from escrow in 2017
Strong estimated 2017 pipeline with >$3.3 billion in blocks coming out of escrow in 2017
Expectations for equity raisings in 2017Macquarie Capital Markets team

PAGE 20STRICTLY CONFIDENTIAL MacquarieCapital
-
1
2
3
RB
A c
ash
rate
(%)
Macquarie Research expects equities to perform positively in 2017 against a steeper yield curve and a stronger growth outlook
Source: Macquarie research, IRESS, Bloomberg and FactSet as at 31 December 2016.
…market does not expect cash rate to fall… …A$ remains a focus…
…resource exports underpin GDP…
2014A 2015A 2016A 2017F 2018F
…the AUD yield curve steepness is…
ASX expected to strengthen in 2017…
… in line with global yields
2017 macro backdrop to improve
1.0%
0.65
0.70
0.75
0.80
0.85
0.90
0.95
2014A 2015A 2016A 2017F 2018F
AU
D /
US
D ($
)
3.1%
2.3%
1.6%
2.4%2.8% 2.9% 3.0% 3.1%
2.9%
-
1
2
3
4
1H16 2H16 1H17 2H17 1H18 2H18 1H19 2H19 1H20
GD
P g
row
th (%
)
Resources GDP growth Other GDP Growth
4700
5000
5300
5600
5900
Jan 16 May 16 Sep 16 Jan 17 May 17 Sep 17 Jan 18
AS
X 20
0
5875(Dec 2017)
Macquarie Research Forecast
0.74
0.75
Increase supported by small improvement in
global growth and broadening recovery in
corporate earnings
A$ will find support from firm commodity prices
but the economy requires it to remain in
the low 70s range
1
2
3
4
1M 6M 2Y 5Y 10Y 20Y
AU
D M
id S
wap
Rat
e (%
)
Jul 16 Dec 16
-
1
2
3
1M 6M 2Y 5Y 10Y 20Y
US
D M
id S
wap
Rat
e (%
)
Jul 16 Dec 16
…however Macquarie Research forecasts cash rate to bottom in Q2 2017 at 1.0%
Market has a ~91% probability of remaining at 1.5% in Q2 2017…
1.0%
1.5% 1.6%

STRICTLY CONFIDENTIALSTRICTLY CONFIDENTIAL
APPENDIXMacquarie capabilities and contact details
A
PAGE 22STRICTLY CONFIDENTIAL MacquarieCapital
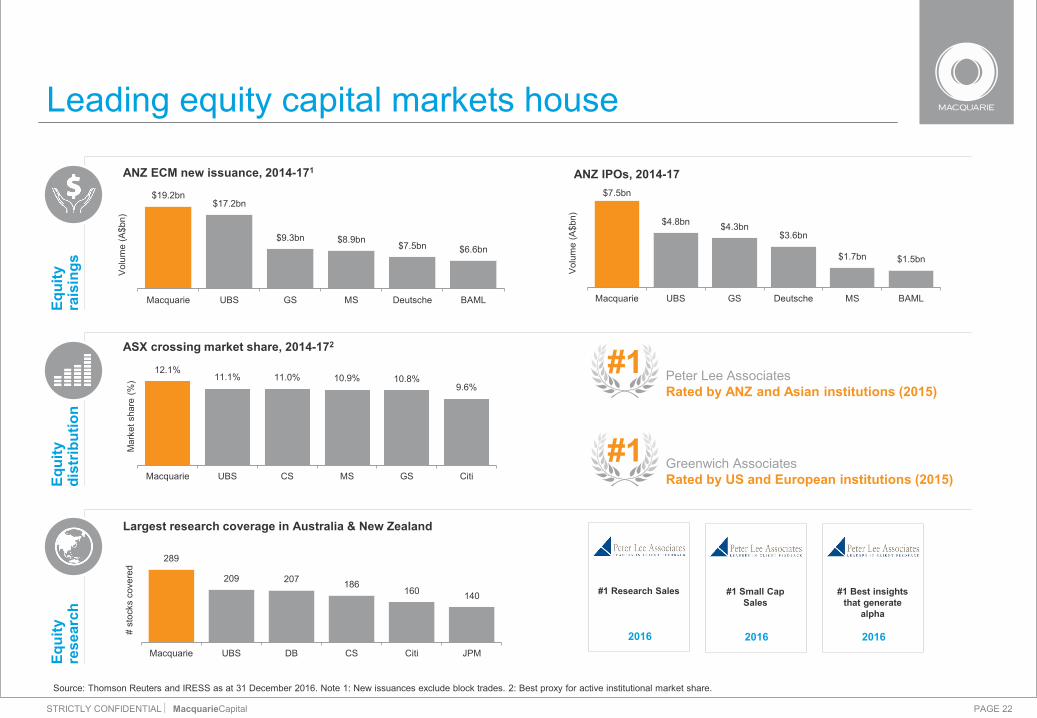
12.1%11.1% 11.0% 10.9% 10.8%
9.6%
Macquarie UBS CS MS GS Citi
Mar
ket s
hare
(%)
Source: Thomson Reuters and IRESS as at 31 December 2016. Note 1: New issuances exclude block trades. 2: Best proxy for active institutional market share.
Leading equity capital markets house
ANZ IPOs, 2014-17ANZ ECM new issuance, 2014-171
Equi
ty
rais
ings
ASX crossing market share, 2014-172
Largest research coverage in Australia & New Zealand
Equi
ty
dist
ribut
ion
Equi
ty
rese
arch
$7.5bn
$4.8bn $4.3bn$3.6bn
$1.7bn $1.5bn
Macquarie UBS GS Deutsche MS BAML
Vol
ume
(A$b
n)289
209 207 186160 140
Macquarie UBS DB CS Citi JPM
# st
ocks
cov
ered
#1 Research Sales
2016
#1 Small Cap Sales
2016
#1 Best insights that generate
alpha
2016
$19.2bn$17.2bn
$9.3bn $8.9bn$7.5bn $6.6bn
Macquarie UBS GS MS Deutsche BAML
Vol
ume
(A$b
n)
Peter Lee Associates Rated by ANZ and Asian institutions (2015)
#1
Greenwich AssociatesRated by US and European institutions (2015)
#1
PAGE 23STRICTLY CONFIDENTIAL MacquarieCapital
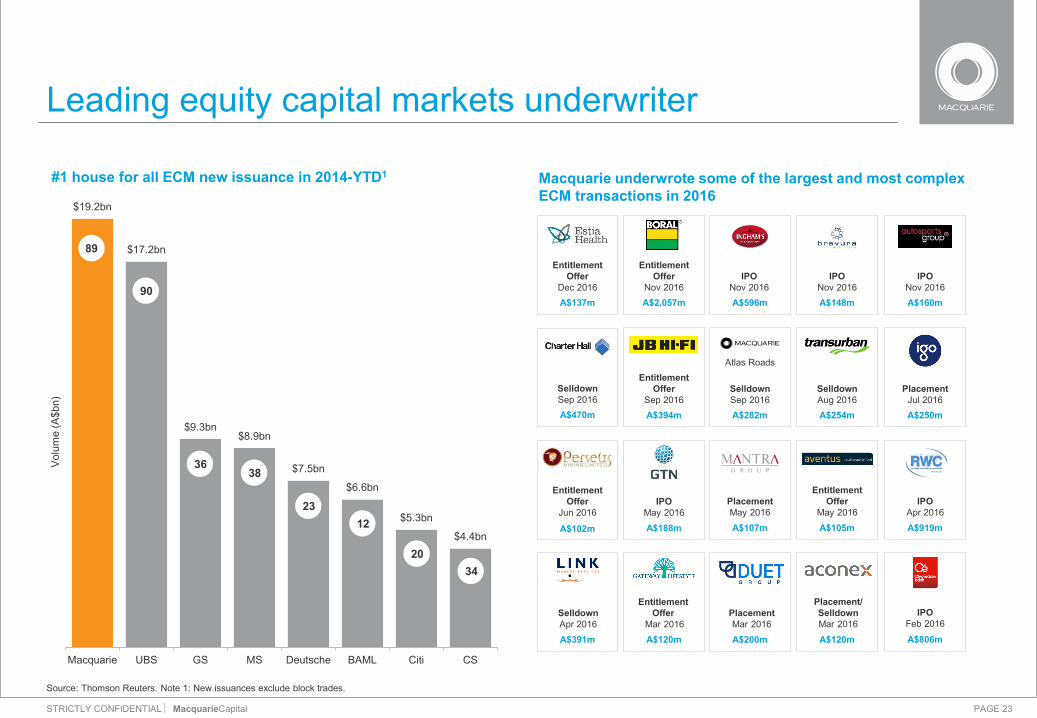
$19.2bn
$17.2bn
$9.3bn$8.9bn
$7.5bn
$6.6bn
$5.3bn
$4.4bn
Macquarie UBS GS MS Deutsche BAML Citi CS
Vol
ume
(A$b
n)
Source: Thomson Reuters. Note 1: New issuances exclude block trades.
#1 house for all ECM new issuance in 2014-YTD1 Macquarie underwrote some of the largest and most complex ECM transactions in 2016
Leading equity capital markets underwriter
89
90
3638
2312
2034
A$391m
SelldownApr 2016
A$919m
IPOApr 2016
A$107m
PlacementMay 2016
A$188m
IPOMay 2016
A$102m
Entitlement Offer
Jun 2016
A$250m
PlacementJul 2016
A$254m
SelldownAug 2016
A$282m
SelldownSep 2016
Atlas Roads
A$394m
Entitlement Offer
Sep 2016A$470m
SelldownSep 2016
A$596m
IPONov 2016
A$148m
IPONov 2016
A$160m
IPONov 2016
A$2,057m
Entitlement Offer
Nov 2016A$137m
Entitlement Offer
Dec 2016
A$806m
IPOFeb 2016
A$200m
PlacementMar 2016
A$120m
Placement/ SelldownMar 2016
A$120m
Entitlement Offer
Mar 2016
A$105m
Entitlement Offer
May 2016

PAGE 24STRICTLY CONFIDENTIAL MacquarieCapital
$13.6bn
$10.9bn
$8.6bn
$6.9bn
$5.2bn
$3.1bn $3.0bn$2.5bn
Macquarie UBS GS CS Deutsche MS Citi JPM
Vol
ume
(A$b
n)
Macquarie has led more ANZ IPOs over the last decade than any other bank1
Australia’s leading IPO underwriter
Source: Thomson Reuters. Note 1: IPOs since 2006.
74
15
27
12
58
34
21
22
Macquarie has lead managed 74 IPOs in the last decade
A$439m
IPOJune 2015
A$207m
IPOJune 2015
A$947m
IPOOct 2015
A$919m
IPOApr 2016
A$188m
IPOMay 2016
A$806m
A$148m
IPONov 2016
A$160m
IPONov 2016
A$145m
IPODec 2013
A$350m
IPOApr 2014
A$113m
IPOJuly 2014
A$439m
IPOOct 2013
A$334m
IPOJuly 2013
IPOFeb 2016
A$596m
IPONov 2016
A$583m
IPOMay 2014
A$2,255m
IPOJuly 2014
A$656m
IPOJune 2014
A$316m
IPOJune 2014
A$239m
IPOJune 2014
A$380m
IPOMay 2015
A$141m
IPODec 2014
A$5,921m
IPONov 2014
A$486m
IPOOct 2014
A$303m
IPOOct 2015
A$332m
IPODec 2015

PAGE 25STRICTLY CONFIDENTIAL MacquarieCapital
Market leading debt advisory and underwriting platform that delivers customised solutions for our clients
Leading experience in leveraged finance transactions…
A leading arranger of debt for clients
Originate, arrange, underwrite and syndicate bank loans and mezzanine financing for acquisition and leveraged finance, corporate bridge facilities and project finance
Advise, structure and arrange debt finance for clients across all industries
Adv
isor
y
Originate, structure, underwrite and execute bondmarket solutionsB
onds
Loan
s
DEB
T C
APIT
AL M
ARKE
TS
…advising on complex facilities…
…with infrastructure expertise
Note 1: Year ending 31 March 2016. Based on 100% of the deal value (and not the amount of the transaction attributed to Macquarie) where Macquarie acted as adviser, arranger, underwriter or participant to the transaction.
Financial adviser, Debt underwriter
Mezzanine facilities for the acquisition of
Cancer Partners UKc.$A170mJune 2015
Joint Bookrunner, Joint Lead Arranger
Senior Debt Facility for Platinum’s 70% acquisition
$US365February 2014
Joint Bookrunner, Joint Lead Arranger
Senior Secured refinancing credit facilities
$A1.4bnAugust 2013
Financial Adviser
Financial advisor to Healthscope on is
inaugural US Private Placement issuance
$US300mMarch 2016
Exclusive Financial Adviser
Refinancing of existing senior debt facilities
$A285mAugust 2015
Exclusive Financial Adviser
Refinancing of senior debt facilities of Worsley Multi-fuel Cogeneration Plant
$A870mDecember 2014
Exclusive Financial Adviser and Debt Arranger
Debt financing for acquisition of
majority stake in Ausgrid$A13,000m
October 2016
Financial adviser, debt co-underwriter
Debt financing for the acquisition of ANU’s
student accommodation ConfidentialAugust 2016
Sponsor, commercial and financial adviser, debt co-underwriter
Senior secured debt facilities for ACT Law
Courts PPP$A180m
December 2015

PAGE 26STRICTLY CONFIDENTIAL MacquarieCapital
Your Macquarie contacts
Hugh FalconCo-Head of ECM Australia and [email protected]: +61 3 9635 9478
Jacqui VanzellaExecutive [email protected]: +61 2 8232 4109
Peter AppleyardDivision [email protected]: +61 2 8232 8539
Stuart OwenAssociate [email protected]: +61 8 9224 0636
Angus FirthCo-Head of ECM and [email protected]: +61 2 8232 4039
Mark WarburtonHead of ECM [email protected]: +61 2 8237 4954
Aaron BlackDivision [email protected]: +61 2 8237 1157
Georgina LalorDivision [email protected]: +61 2 8232 6742
Michael DaleyAssociate [email protected]: +61 2 8237 7799
Equity Capital Markets Debt Capital Markets
Neil WatsonChairman of ECM [email protected]: +61 2 8232 3847
Andrew ScadeDivision [email protected]: + 61 2 8232 7593
Belinda LeeDivision [email protected]: +61 3 9635 8082
Tom FraczekAssociate [email protected]: +61 3 9635 8201
Equity Syndication
Greg Levy Head of DCM Australia and [email protected]: +61 2 8232 7941
Navodit NarainHead of [email protected]: +61 2 8232 3656
Iain MelhuishDivision [email protected]: +61 2 8232 6745
Paul StainesCo-Head of [email protected]: +61 2 8232 7781
Tiffany WardAssociate [email protected]: +61 2 8232 5151